Burkittsville, MD Map & Demographics
Burkittsville Map
Burkittsville Overview
$55,248
PER CAPITA INCOME
$144,375
AVG FAMILY INCOME
$90,000
AVG HOUSEHOLD INCOME
22.8%
WAGE / INCOME GAP [ % ]
77.2¢/ $1
WAGE / INCOME GAP [ $ ]
0.41
INEQUALITY / GINI INDEX
143
TOTAL POPULATION
66
MALE POPULATION
77
FEMALE POPULATION
85.71
MALES / 100 FEMALES
116.67
FEMALES / 100 MALES
54.7
MEDIAN AGE
2.6
AVG FAMILY SIZE
2.0
AVG HOUSEHOLD SIZE
82
LABOR FORCE [ PEOPLE ]
65.1%
PERCENT IN LABOR FORCE
13.4%
UNEMPLOYMENT RATE
Burkittsville Zip Codes
Burkittsville Area Codes
Income in Burkittsville
Income Overview in Burkittsville
Per Capita Income in Burkittsville is $55,248, while median incomes of families and households are $144,375 and $90,000 respectively.
| Characteristic | Number | Measure |
| Per Capita Income | 143 | $55,248 |
| Median Family Income | 41 | $144,375 |
| Mean Family Income | 41 | $154,424 |
| Median Household Income | 70 | $90,000 |
| Mean Household Income | 70 | $116,234 |
| Income Deficit | 41 | $0 |
| Wage / Income Gap (%) | 143 | 22.78% |
| Wage / Income Gap ($) | 143 | 77.22¢ per $1 |
| Gini / Inequality Index | 143 | 0.41 |
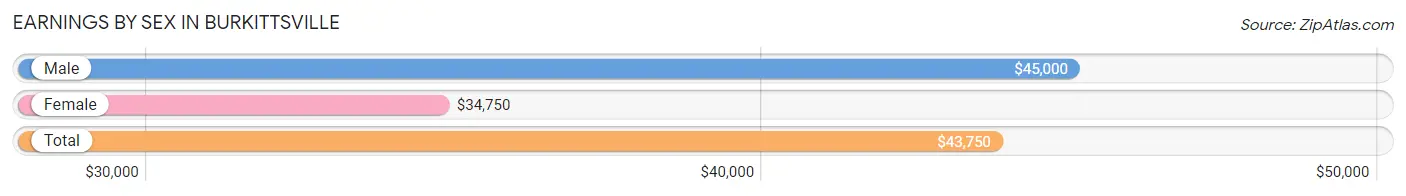
Earnings by Sex in Burkittsville
Average Earnings in Burkittsville are $43,750, $45,000 for men and $34,750 for women, a difference of 22.8%.
| Sex | Number | Average Earnings |
| Male | 36 (45.6%) | $45,000 |
| Female | 43 (54.4%) | $34,750 |
| Total | 79 (100.0%) | $43,750 |
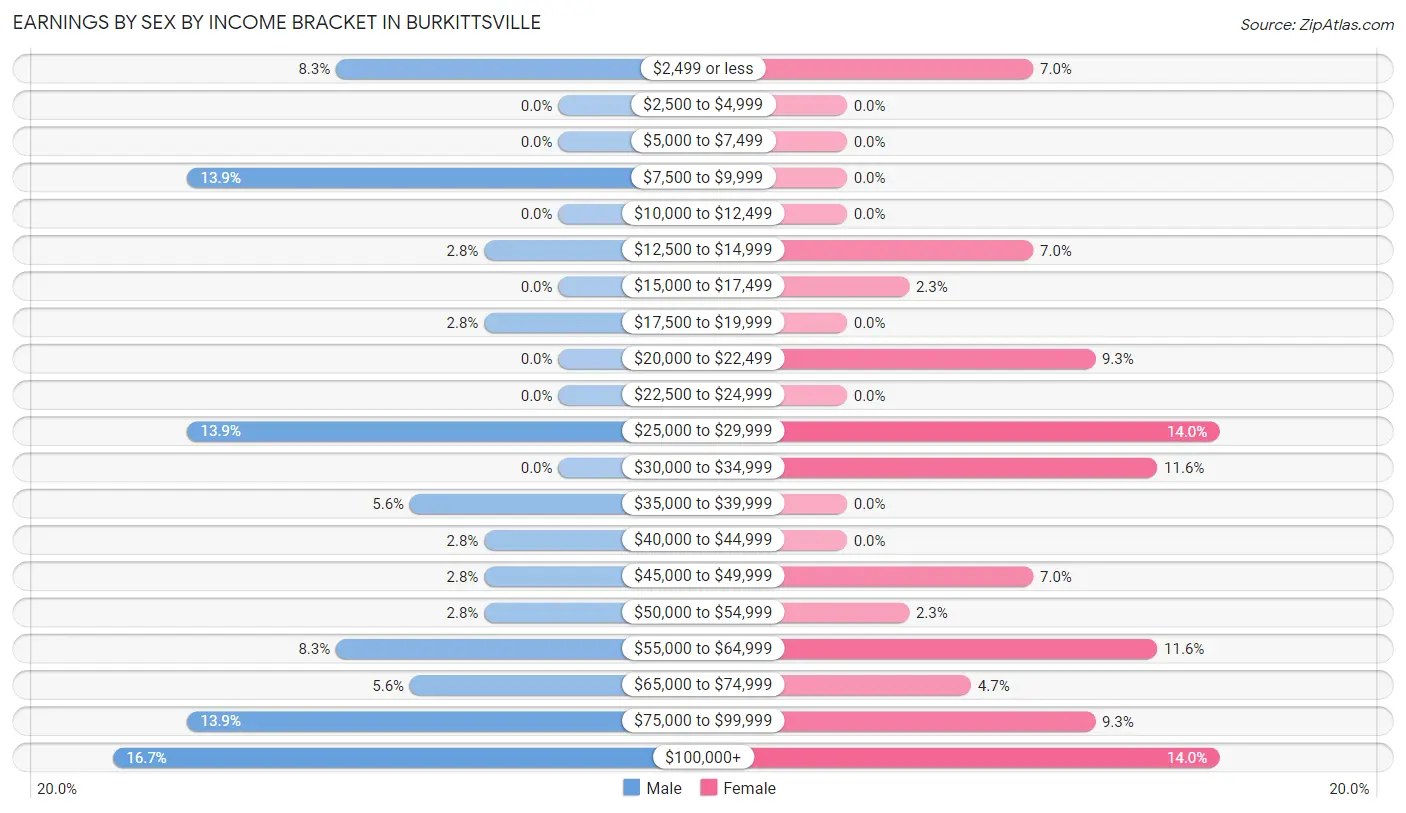
Earnings by Sex by Income Bracket in Burkittsville
The most common earnings brackets in Burkittsville are $100,000+ for men (6 | 16.7%) and $25,000 to $29,999 for women (6 | 14.0%).
| Income | Male | Female |
| $2,499 or less | 3 (8.3%) | 3 (7.0%) |
| $2,500 to $4,999 | 0 (0.0%) | 0 (0.0%) |
| $5,000 to $7,499 | 0 (0.0%) | 0 (0.0%) |
| $7,500 to $9,999 | 5 (13.9%) | 0 (0.0%) |
| $10,000 to $12,499 | 0 (0.0%) | 0 (0.0%) |
| $12,500 to $14,999 | 1 (2.8%) | 3 (7.0%) |
| $15,000 to $17,499 | 0 (0.0%) | 1 (2.3%) |
| $17,500 to $19,999 | 1 (2.8%) | 0 (0.0%) |
| $20,000 to $22,499 | 0 (0.0%) | 4 (9.3%) |
| $22,500 to $24,999 | 0 (0.0%) | 0 (0.0%) |
| $25,000 to $29,999 | 5 (13.9%) | 6 (14.0%) |
| $30,000 to $34,999 | 0 (0.0%) | 5 (11.6%) |
| $35,000 to $39,999 | 2 (5.6%) | 0 (0.0%) |
| $40,000 to $44,999 | 1 (2.8%) | 0 (0.0%) |
| $45,000 to $49,999 | 1 (2.8%) | 3 (7.0%) |
| $50,000 to $54,999 | 1 (2.8%) | 1 (2.3%) |
| $55,000 to $64,999 | 3 (8.3%) | 5 (11.6%) |
| $65,000 to $74,999 | 2 (5.6%) | 2 (4.6%) |
| $75,000 to $99,999 | 5 (13.9%) | 4 (9.3%) |
| $100,000+ | 6 (16.7%) | 6 (14.0%) |
| Total | 36 (100.0%) | 43 (100.0%) |
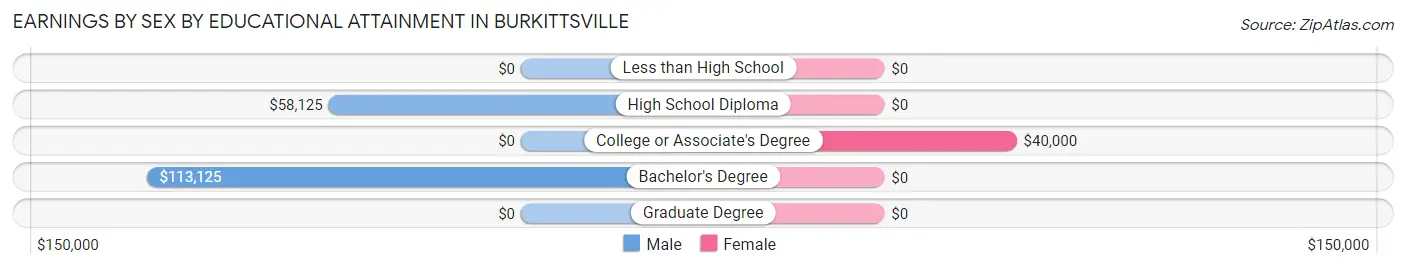
Earnings by Sex by Educational Attainment in Burkittsville
Average earnings in Burkittsville are $58,750 for men and $45,833 for women, a difference of 22.0%. Men with an educational attainment of bachelor's degree enjoy the highest average annual earnings of $113,125, while those with high school diploma education earn the least with $58,125. Women with an educational attainment of college or associate's degree earn the most with the average annual earnings of $40,000, while those with college or associate's degree education have the smallest earnings of $40,000.
| Educational Attainment | Male Income | Female Income |
| Less than High School | - | - |
| High School Diploma | $58,125 | $0 |
| College or Associate's Degree | - | - |
| Bachelor's Degree | $113,125 | $0 |
| Graduate Degree | - | - |
| Total | $58,750 | $45,833 |
Family Income in Burkittsville
Family Income Brackets in Burkittsville
According to the Burkittsville family income data, there are 12 families falling into the $150,000 to $199,999 income range, which is the most common income bracket and makes up 29.3% of all families.
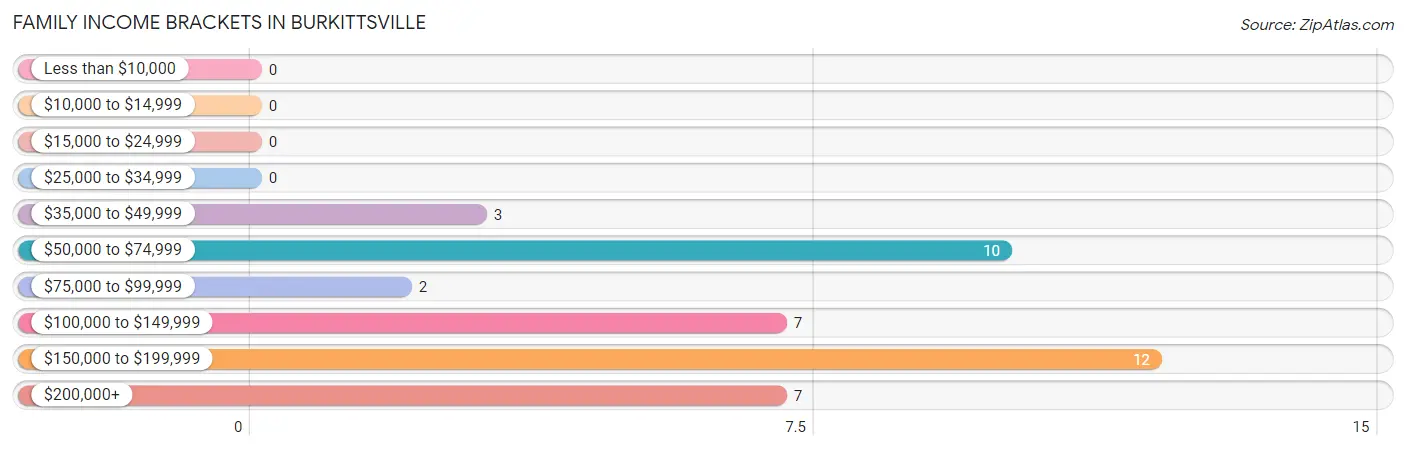
| Income Bracket | # Families | % Families |
| Less than $10,000 | 0 | 0.0% |
| $10,000 to $14,999 | 0 | 0.0% |
| $15,000 to $24,999 | 0 | 0.0% |
| $25,000 to $34,999 | 0 | 0.0% |
| $35,000 to $49,999 | 3 | 7.3% |
| $50,000 to $74,999 | 10 | 24.4% |
| $75,000 to $99,999 | 2 | 4.9% |
| $100,000 to $149,999 | 7 | 17.1% |
| $150,000 to $199,999 | 12 | 29.3% |
| $200,000+ | 7 | 17.1% |
Family Income by Famaliy Size in Burkittsville
4-person families (7 | 17.1%) account for the highest median family income in Burkittsville with $151,875 per family, while 3-person families (6 | 14.6%) have the highest median income of $47,083 per family member.
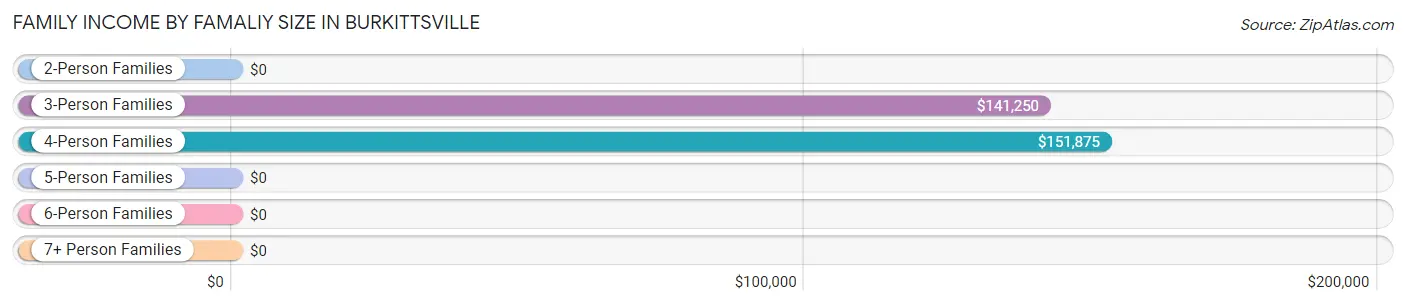
| Income Bracket | # Families | Median Income |
| 2-Person Families | 26 (63.4%) | $0 |
| 3-Person Families | 6 (14.6%) | $141,250 |
| 4-Person Families | 7 (17.1%) | $151,875 |
| 5-Person Families | 2 (4.9%) | $0 |
| 6-Person Families | 0 (0.0%) | $0 |
| 7+ Person Families | 0 (0.0%) | $0 |
| Total | 41 (100.0%) | $144,375 |
Family Income by Number of Earners in Burkittsville
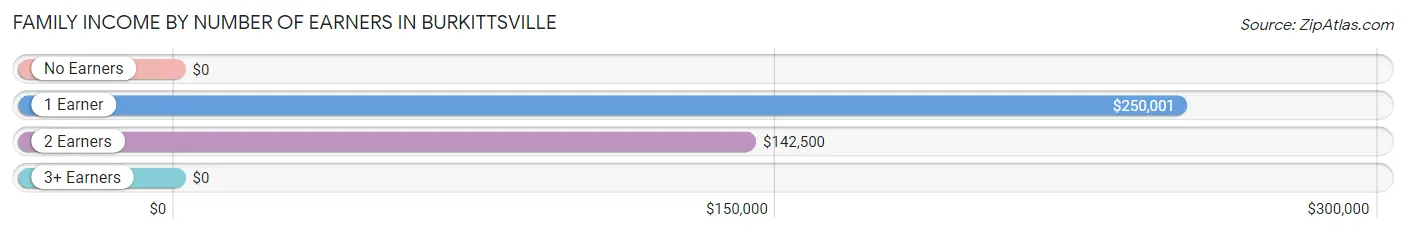
| Number of Earners | # Families | Median Income |
| No Earners | 8 (19.5%) | $0 |
| 1 Earner | 7 (17.1%) | $250,001 |
| 2 Earners | 24 (58.5%) | $142,500 |
| 3+ Earners | 2 (4.9%) | $0 |
| Total | 41 (100.0%) | $144,375 |
Household Income in Burkittsville
Household Income Brackets in Burkittsville
With 15 households falling in the category, the $50,000 to $74,999 income range is the most frequent in Burkittsville, accounting for 21.4% of all households.
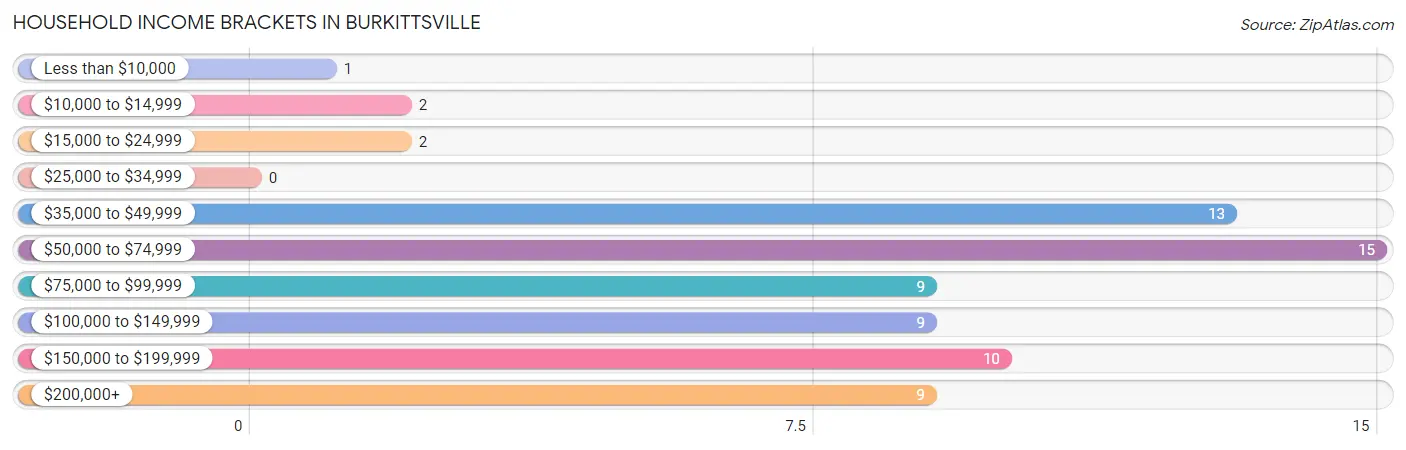
| Income Bracket | # Households | % Households |
| Less than $10,000 | 1 | 1.4% |
| $10,000 to $14,999 | 2 | 2.9% |
| $15,000 to $24,999 | 2 | 2.9% |
| $25,000 to $34,999 | 0 | 0.0% |
| $35,000 to $49,999 | 13 | 18.6% |
| $50,000 to $74,999 | 15 | 21.4% |
| $75,000 to $99,999 | 9 | 12.9% |
| $100,000 to $149,999 | 9 | 12.9% |
| $150,000 to $199,999 | 10 | 14.3% |
| $200,000+ | 9 | 12.9% |
Household Income by Householder Age in Burkittsville
The median household income in Burkittsville is $90,000, with the highest median household income of $85,625 found in the 65+ years age bracket for the primary householder. A total of 31 households (44.3%) fall into this category. Meanwhile, the 15 to 24 years age bracket for the primary householder has the lowest median household income of $0, with 2 households (2.9%) in this group.
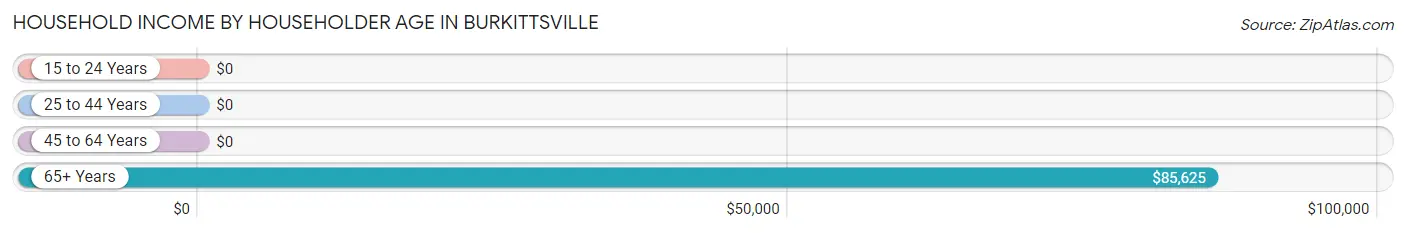
| Income Bracket | # Households | Median Income |
| 15 to 24 Years | 2 (2.9%) | $0 |
| 25 to 44 Years | 7 (10.0%) | $0 |
| 45 to 64 Years | 30 (42.9%) | $0 |
| 65+ Years | 31 (44.3%) | $85,625 |
| Total | 70 (100.0%) | $90,000 |
Poverty in Burkittsville
Income Below Poverty by Sex and Age in Burkittsville
With 9.1% poverty level for males and 1.3% for females among the residents of Burkittsville, 55 to 64 year old males and 25 to 34 year old females are the most vulnerable to poverty, with 6 males (50.0%) and 1 females (25.0%) in their respective age groups living below the poverty level.
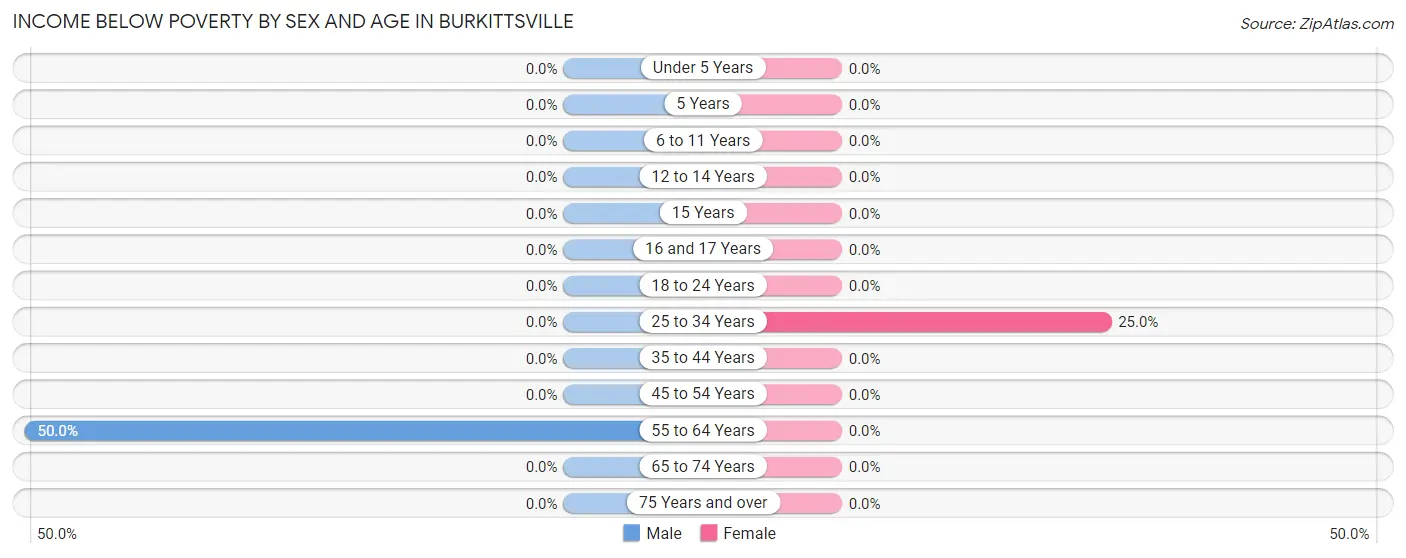
| Age Bracket | Male | Female |
| Under 5 Years | 0 (0.0%) | 0 (0.0%) |
| 5 Years | 0 (0.0%) | 0 (0.0%) |
| 6 to 11 Years | 0 (0.0%) | 0 (0.0%) |
| 12 to 14 Years | 0 (0.0%) | 0 (0.0%) |
| 15 Years | 0 (0.0%) | 0 (0.0%) |
| 16 and 17 Years | 0 (0.0%) | 0 (0.0%) |
| 18 to 24 Years | 0 (0.0%) | 0 (0.0%) |
| 25 to 34 Years | 0 (0.0%) | 1 (25.0%) |
| 35 to 44 Years | 0 (0.0%) | 0 (0.0%) |
| 45 to 54 Years | 0 (0.0%) | 0 (0.0%) |
| 55 to 64 Years | 6 (50.0%) | 0 (0.0%) |
| 65 to 74 Years | 0 (0.0%) | 0 (0.0%) |
| 75 Years and over | 0 (0.0%) | 0 (0.0%) |
| Total | 6 (9.1%) | 1 (1.3%) |
Income Above Poverty by Sex and Age in Burkittsville
According to the poverty statistics in Burkittsville, males aged 6 to 11 years and females aged under 5 years are the age groups that are most secure financially, with 100.0% of males and 100.0% of females in these age groups living above the poverty line.
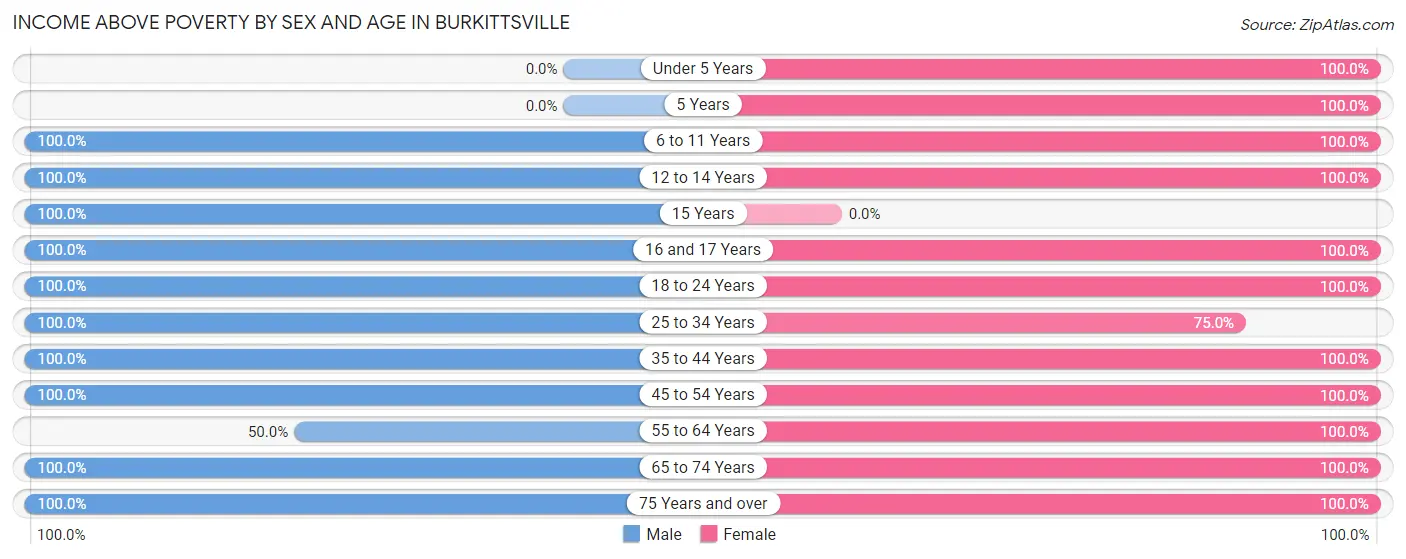
| Age Bracket | Male | Female |
| Under 5 Years | 0 (0.0%) | 4 (100.0%) |
| 5 Years | 0 (0.0%) | 1 (100.0%) |
| 6 to 11 Years | 2 (100.0%) | 3 (100.0%) |
| 12 to 14 Years | 2 (100.0%) | 3 (100.0%) |
| 15 Years | 2 (100.0%) | 0 (0.0%) |
| 16 and 17 Years | 4 (100.0%) | 1 (100.0%) |
| 18 to 24 Years | 4 (100.0%) | 3 (100.0%) |
| 25 to 34 Years | 6 (100.0%) | 3 (75.0%) |
| 35 to 44 Years | 3 (100.0%) | 4 (100.0%) |
| 45 to 54 Years | 12 (100.0%) | 17 (100.0%) |
| 55 to 64 Years | 6 (50.0%) | 12 (100.0%) |
| 65 to 74 Years | 18 (100.0%) | 20 (100.0%) |
| 75 Years and over | 1 (100.0%) | 5 (100.0%) |
| Total | 60 (90.9%) | 76 (98.7%) |
Income Below Poverty Among Married-Couple Families in Burkittsville
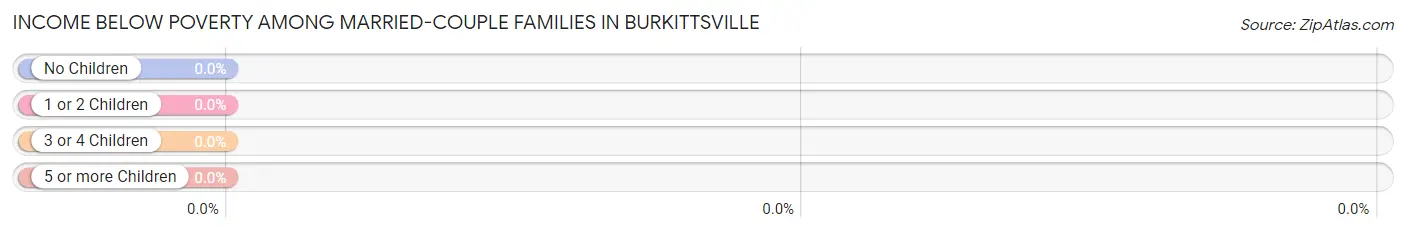
| Children | Above Poverty | Below Poverty |
| No Children | 27 (100.0%) | 0 (0.0%) |
| 1 or 2 Children | 8 (100.0%) | 0 (0.0%) |
| 3 or 4 Children | 2 (100.0%) | 0 (0.0%) |
| 5 or more Children | 0 (0.0%) | 0 (0.0%) |
| Total | 37 (100.0%) | 0 (0.0%) |
Income Below Poverty Among Single-Parent Households in Burkittsville
| Children | Single Father | Single Mother |
| No Children | 0 (0.0%) | 0 (0.0%) |
| 1 or 2 Children | 0 (0.0%) | 0 (0.0%) |
| 3 or 4 Children | 0 (0.0%) | 0 (0.0%) |
| 5 or more Children | 0 (0.0%) | 0 (0.0%) |
| Total | 0 (0.0%) | 0 (0.0%) |
Income Below Poverty Among Married-Couple vs Single-Parent Households in Burkittsville
| Children | Married-Couple Families | Single-Parent Households |
| No Children | 0 (0.0%) | 0 (0.0%) |
| 1 or 2 Children | 0 (0.0%) | 0 (0.0%) |
| 3 or 4 Children | 0 (0.0%) | 0 (0.0%) |
| 5 or more Children | 0 (0.0%) | 0 (0.0%) |
| Total | 0 (0.0%) | 0 (0.0%) |
Race in Burkittsville
The most populous races in Burkittsville are White / Caucasian (136 | 95.1%), Two or more Races (5 | 3.5%), and Hispanic or Latino (3 | 2.1%).
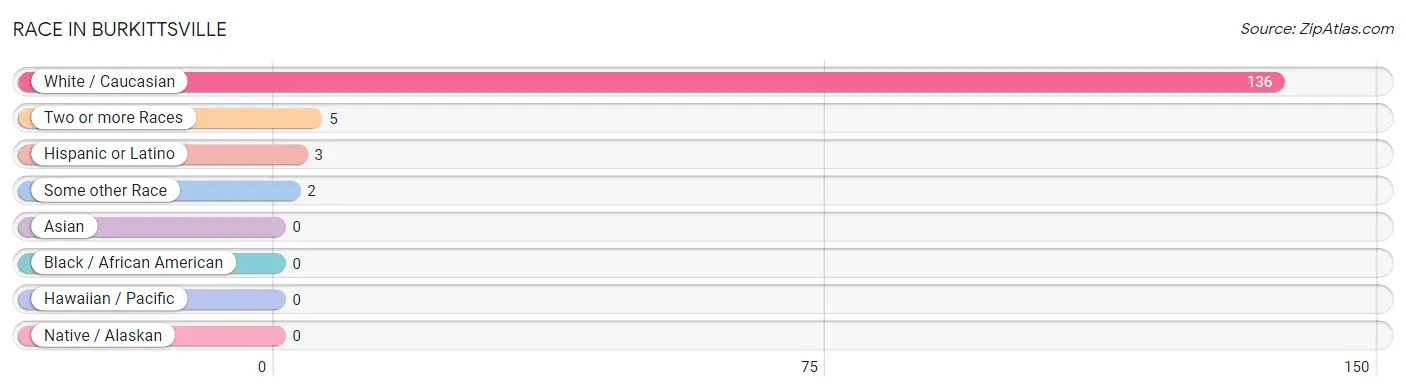
| Race | # Population | % Population |
| Asian | 0 | 0.0% |
| Black / African American | 0 | 0.0% |
| Hawaiian / Pacific | 0 | 0.0% |
| Hispanic or Latino | 3 | 2.1% |
| Native / Alaskan | 0 | 0.0% |
| White / Caucasian | 136 | 95.1% |
| Two or more Races | 5 | 3.5% |
| Some other Race | 2 | 1.4% |
| Total | 143 | 100.0% |
Ancestry in Burkittsville
The most populous ancestries reported in Burkittsville are German (36 | 25.2%), Irish (35 | 24.5%), English (24 | 16.8%), Scottish (8 | 5.6%), and Italian (7 | 4.9%), together accounting for 76.9% of all Burkittsville residents.
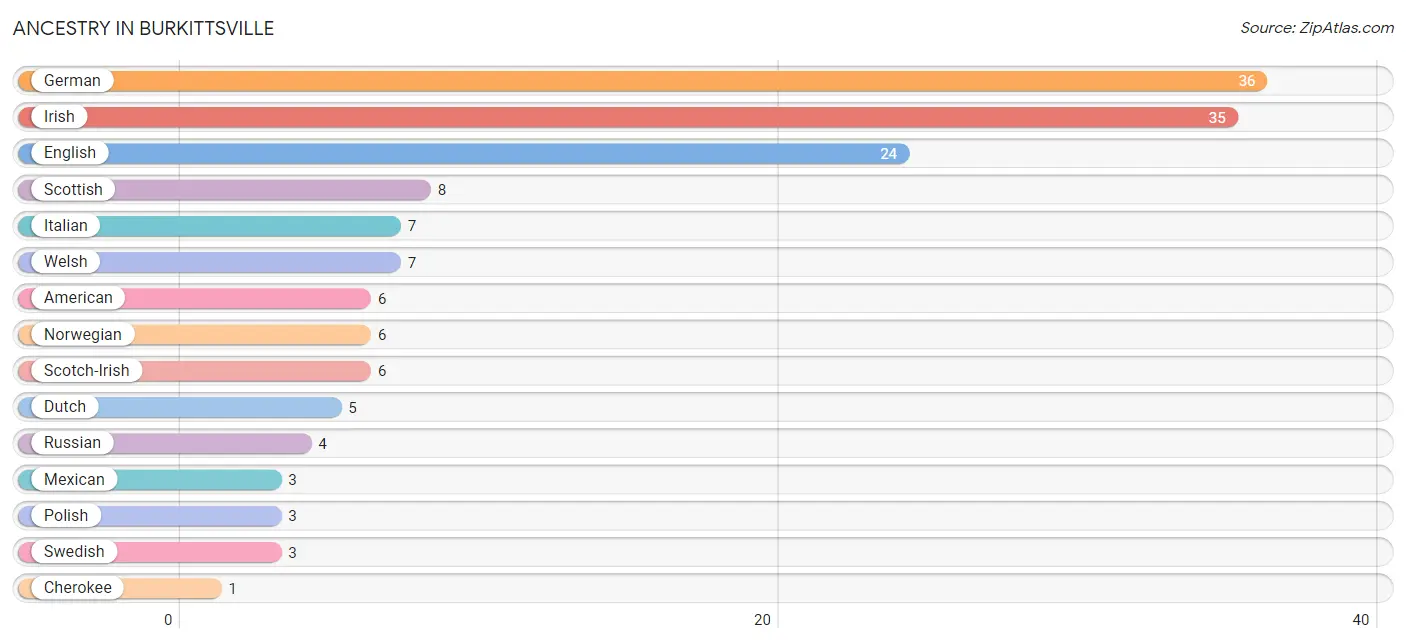
| Ancestry | # Population | % Population |
| American | 6 | 4.2% |
| Cherokee | 1 | 0.7% |
| Dutch | 5 | 3.5% |
| English | 24 | 16.8% |
| French Canadian | 1 | 0.7% |
| German | 36 | 25.2% |
| Irish | 35 | 24.5% |
| Italian | 7 | 4.9% |
| Mexican | 3 | 2.1% |
| Norwegian | 6 | 4.2% |
| Polish | 3 | 2.1% |
| Russian | 4 | 2.8% |
| Scotch-Irish | 6 | 4.2% |
| Scottish | 8 | 5.6% |
| Swedish | 3 | 2.1% |
| Swiss | 1 | 0.7% |
| Welsh | 7 | 4.9% | View All 17 Rows |
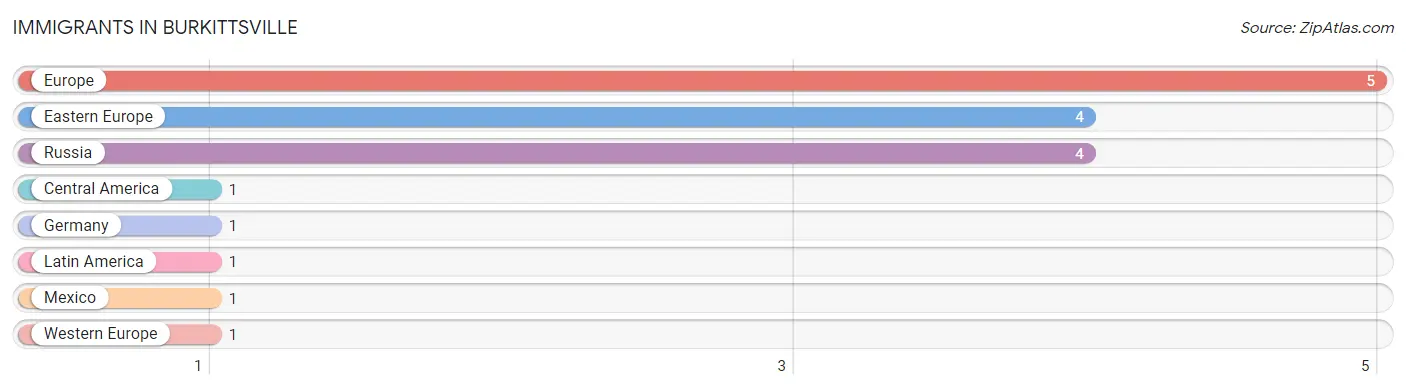
Immigrants in Burkittsville
The most numerous immigrant groups reported in Burkittsville came from Europe (5 | 3.5%), Eastern Europe (4 | 2.8%), Russia (4 | 2.8%), Central America (1 | 0.7%), and Germany (1 | 0.7%), together accounting for 10.5% of all Burkittsville residents.
| Immigration Origin | # Population | % Population |
| Central America | 1 | 0.7% |
| Eastern Europe | 4 | 2.8% |
| Europe | 5 | 3.5% |
| Germany | 1 | 0.7% |
| Latin America | 1 | 0.7% |
| Mexico | 1 | 0.7% |
| Russia | 4 | 2.8% |
| Western Europe | 1 | 0.7% | View All 8 Rows |
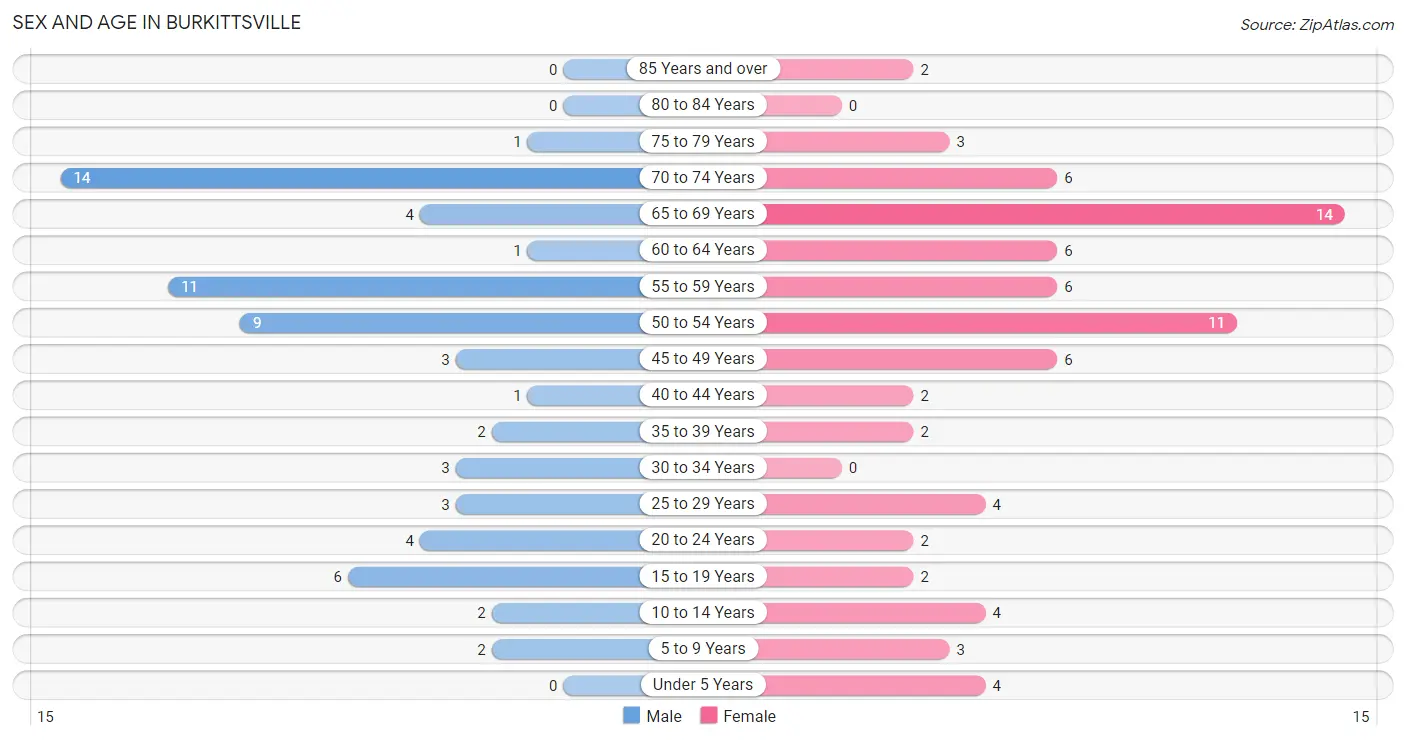
Sex and Age in Burkittsville
Sex and Age in Burkittsville
The most populous age groups in Burkittsville are 70 to 74 Years (14 | 21.2%) for men and 65 to 69 Years (14 | 18.2%) for women.
| Age Bracket | Male | Female |
| Under 5 Years | 0 (0.0%) | 4 (5.2%) |
| 5 to 9 Years | 2 (3.0%) | 3 (3.9%) |
| 10 to 14 Years | 2 (3.0%) | 4 (5.2%) |
| 15 to 19 Years | 6 (9.1%) | 2 (2.6%) |
| 20 to 24 Years | 4 (6.1%) | 2 (2.6%) |
| 25 to 29 Years | 3 (4.5%) | 4 (5.2%) |
| 30 to 34 Years | 3 (4.5%) | 0 (0.0%) |
| 35 to 39 Years | 2 (3.0%) | 2 (2.6%) |
| 40 to 44 Years | 1 (1.5%) | 2 (2.6%) |
| 45 to 49 Years | 3 (4.5%) | 6 (7.8%) |
| 50 to 54 Years | 9 (13.6%) | 11 (14.3%) |
| 55 to 59 Years | 11 (16.7%) | 6 (7.8%) |
| 60 to 64 Years | 1 (1.5%) | 6 (7.8%) |
| 65 to 69 Years | 4 (6.1%) | 14 (18.2%) |
| 70 to 74 Years | 14 (21.2%) | 6 (7.8%) |
| 75 to 79 Years | 1 (1.5%) | 3 (3.9%) |
| 80 to 84 Years | 0 (0.0%) | 0 (0.0%) |
| 85 Years and over | 0 (0.0%) | 2 (2.6%) |
| Total | 66 (100.0%) | 77 (100.0%) |
Families and Households in Burkittsville
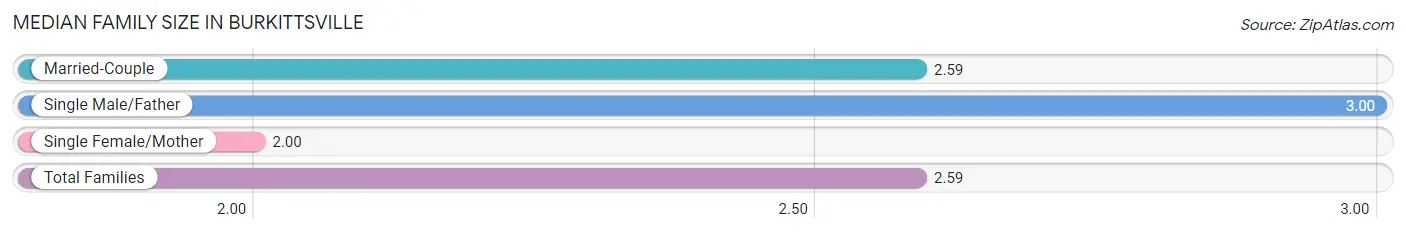
Median Family Size in Burkittsville
The median family size in Burkittsville is 2.59 persons per family, with single male/father families (2 | 4.9%) accounting for the largest median family size of 3 persons per family. On the other hand, single female/mother families (2 | 4.9%) represent the smallest median family size with 2.00 persons per family.
| Family Type | # Families | Family Size |
| Married-Couple | 37 (90.2%) | 2.59 |
| Single Male/Father | 2 (4.9%) | 3.00 |
| Single Female/Mother | 2 (4.9%) | 2.00 |
| Total Families | 41 (100.0%) | 2.59 |
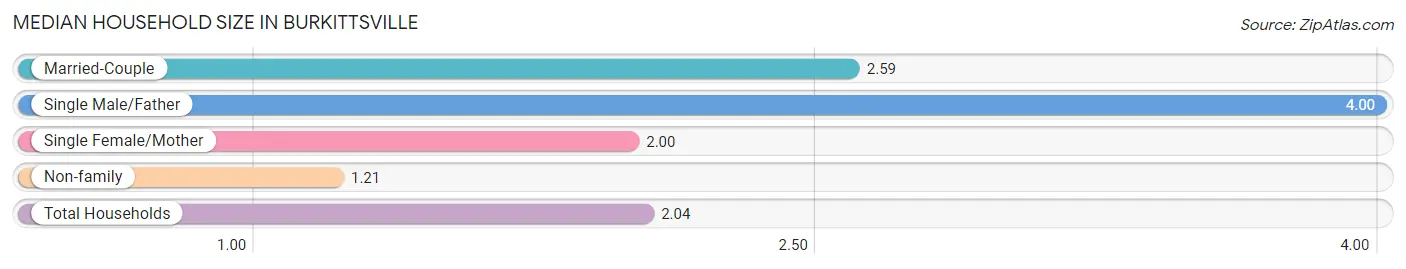
Median Household Size in Burkittsville
The median household size in Burkittsville is 2.04 persons per household, with single male/father households (2 | 2.9%) accounting for the largest median household size of 4 persons per household. non-family households (29 | 41.4%) represent the smallest median household size with 1.21 persons per household.
| Household Type | # Households | Household Size |
| Married-Couple | 37 (52.9%) | 2.59 |
| Single Male/Father | 2 (2.9%) | 4.00 |
| Single Female/Mother | 2 (2.9%) | 2.00 |
| Non-family | 29 (41.4%) | 1.21 |
| Total Households | 70 (100.0%) | 2.04 |
Household Size by Marriage Status in Burkittsville
Out of a total of 70 households in Burkittsville, 41 (58.6%) are family households, while 29 (41.4%) are nonfamily households. The most numerous type of family households are 2-person households, comprising 26, and the most common type of nonfamily households are 1-person households, comprising 21.
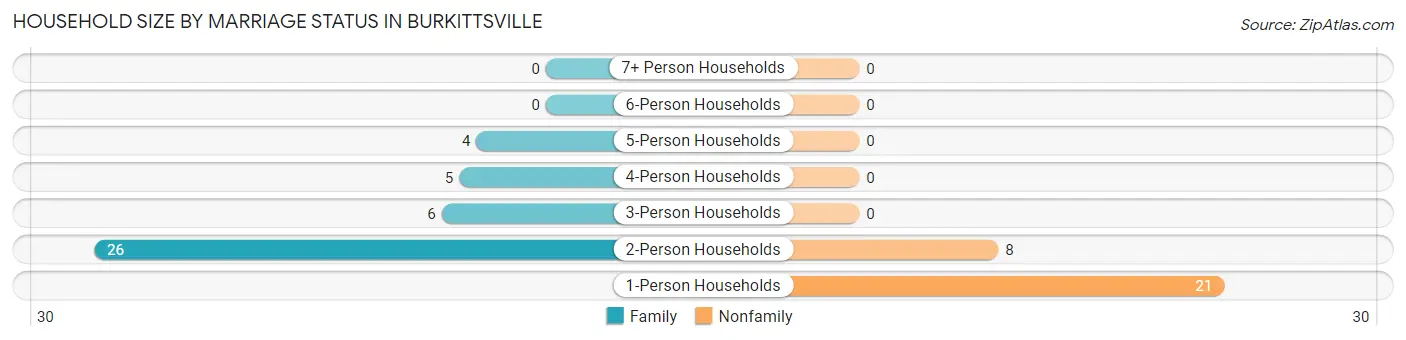
| Household Size | Family Households | Nonfamily Households |
| 1-Person Households | - | 21 (30.0%) |
| 2-Person Households | 26 (37.1%) | 8 (11.4%) |
| 3-Person Households | 6 (8.6%) | 0 (0.0%) |
| 4-Person Households | 5 (7.1%) | 0 (0.0%) |
| 5-Person Households | 4 (5.7%) | 0 (0.0%) |
| 6-Person Households | 0 (0.0%) | 0 (0.0%) |
| 7+ Person Households | 0 (0.0%) | 0 (0.0%) |
| Total | 41 (58.6%) | 29 (41.4%) |
Female Fertility in Burkittsville
Fertility by Age in Burkittsville
Average fertility rate in Burkittsville is 50.0 births per 1,000 women. Women in the age bracket of 20 to 34 years have the highest fertility rate with 167.0 births per 1,000 women. Women in the age bracket of 20 to 34 years acount for 100.0% of all women with births.

| Age Bracket | Women with Births | Births / 1,000 Women |
| 15 to 19 years | 0 (0.0%) | 0.0 |
| 20 to 34 years | 1 (100.0%) | 167.0 |
| 35 to 50 years | 0 (0.0%) | 0.0 |
| Total | 1 (100.0%) | 50.0 |
Fertility by Age by Marriage Status in Burkittsville
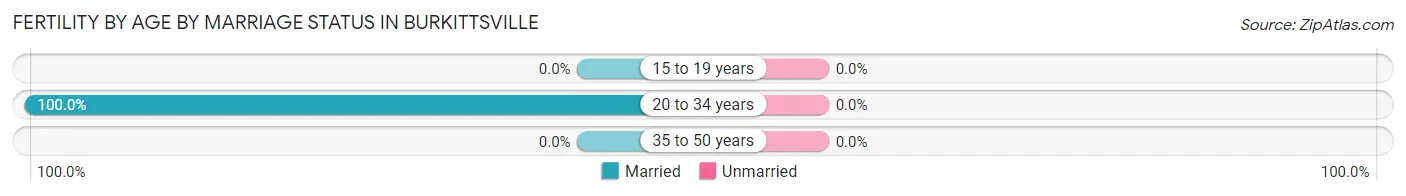
| Age Bracket | Married | Unmarried |
| 15 to 19 years | 0 (0.0%) | 0 (0.0%) |
| 20 to 34 years | 1 (100.0%) | 0 (0.0%) |
| 35 to 50 years | 0 (0.0%) | 0 (0.0%) |
| Total | 1 (100.0%) | 0 (0.0%) |
Fertility by Education in Burkittsville
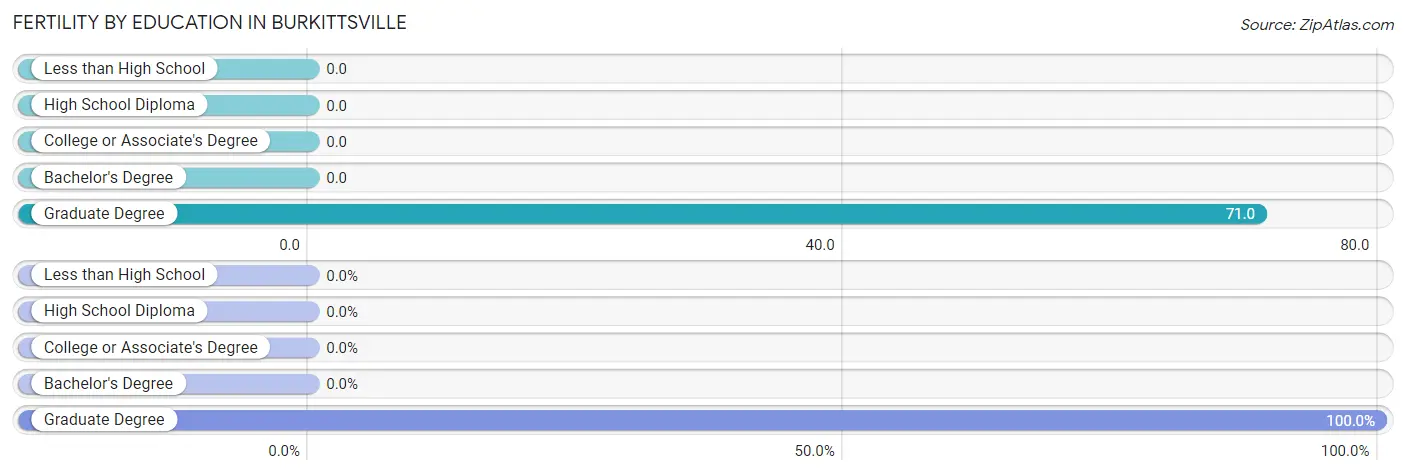
| Educational Attainment | Women with Births | Births / 1,000 Women |
| Less than High School | 0 (0.0%) | 0.0 |
| High School Diploma | 0 (0.0%) | 0.0 |
| College or Associate's Degree | 0 (0.0%) | 0.0 |
| Bachelor's Degree | 0 (0.0%) | 0.0 |
| Graduate Degree | 1 (100.0%) | 71.0 |
| Total | 1 (100.0%) | 50.0 |
Fertility by Education by Marriage Status in Burkittsville
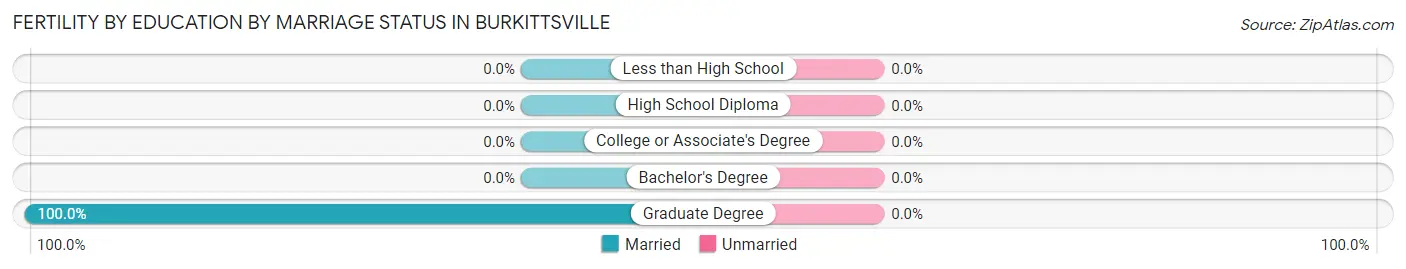
| Educational Attainment | Married | Unmarried |
| Less than High School | 0 (0.0%) | 0 (0.0%) |
| High School Diploma | 0 (0.0%) | 0 (0.0%) |
| College or Associate's Degree | 0 (0.0%) | 0 (0.0%) |
| Bachelor's Degree | 0 (0.0%) | 0 (0.0%) |
| Graduate Degree | 1 (100.0%) | 0 (0.0%) |
| Total | 1 (100.0%) | 0 (0.0%) |
Employment Characteristics in Burkittsville
Employment by Class of Employer in Burkittsville
Among the 70 employed individuals in Burkittsville, private company employees (32 | 45.7%), local government employees (12 | 17.1%), and not-for-profit organizations (10 | 14.3%) make up the most common classes of employment.
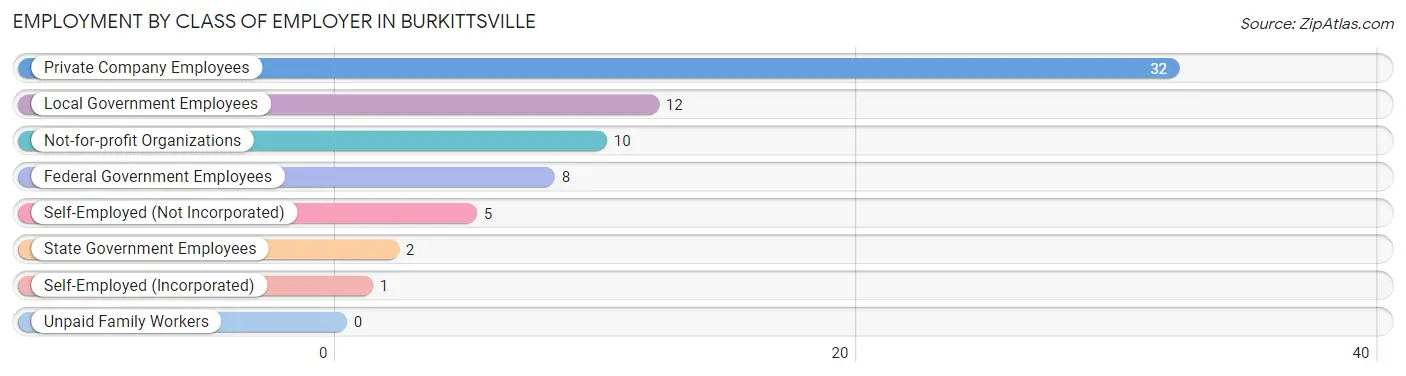
| Employer Class | # Employees | % Employees |
| Private Company Employees | 32 | 45.7% |
| Self-Employed (Incorporated) | 1 | 1.4% |
| Self-Employed (Not Incorporated) | 5 | 7.1% |
| Not-for-profit Organizations | 10 | 14.3% |
| Local Government Employees | 12 | 17.1% |
| State Government Employees | 2 | 2.9% |
| Federal Government Employees | 8 | 11.4% |
| Unpaid Family Workers | 0 | 0.0% |
| Total | 70 | 100.0% |
Employment Status by Age in Burkittsville
According to the labor force statistics for Burkittsville, out of the total population over 16 years of age (126), 65.1% or 82 individuals are in the labor force, with 13.4% or 11 of them unemployed. The age group with the highest labor force participation rate is 20 to 24 years, with 100.0% or 6 individuals in the labor force. Within the labor force, the 20 to 24 years age range has the highest percentage of unemployed individuals, with 50.0% or 3 of them being unemployed.
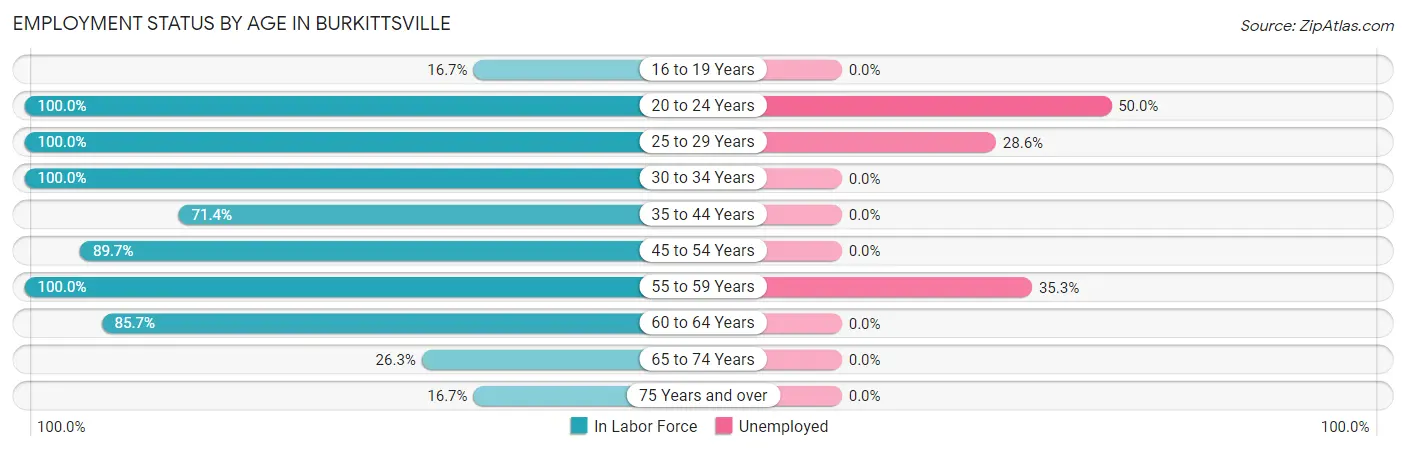
| Age Bracket | In Labor Force | Unemployed |
| 16 to 19 Years | 1 (16.7%) | 0 (0.0%) |
| 20 to 24 Years | 6 (100.0%) | 3 (50.0%) |
| 25 to 29 Years | 7 (100.0%) | 2 (28.6%) |
| 30 to 34 Years | 3 (100.0%) | 0 (0.0%) |
| 35 to 44 Years | 5 (71.4%) | 0 (0.0%) |
| 45 to 54 Years | 26 (89.7%) | 0 (0.0%) |
| 55 to 59 Years | 17 (100.0%) | 6 (35.3%) |
| 60 to 64 Years | 6 (85.7%) | 0 (0.0%) |
| 65 to 74 Years | 10 (26.3%) | 0 (0.0%) |
| 75 Years and over | 1 (16.7%) | 0 (0.0%) |
| Total | 82 (65.1%) | 11 (13.4%) |
Employment Status by Educational Attainment in Burkittsville
According to labor force statistics for Burkittsville, 91.4% of individuals (64) out of the total population between 25 and 64 years of age (70) are in the labor force, with 12.5% or 8 of them being unemployed. The group with the highest labor force participation rate are those with the educational attainment of less than high school, with 100.0% or 1 individuals in the labor force. Within the labor force, individuals with high school diploma education have the highest percentage of unemployment, with 38.9% or 7 of them being unemployed.
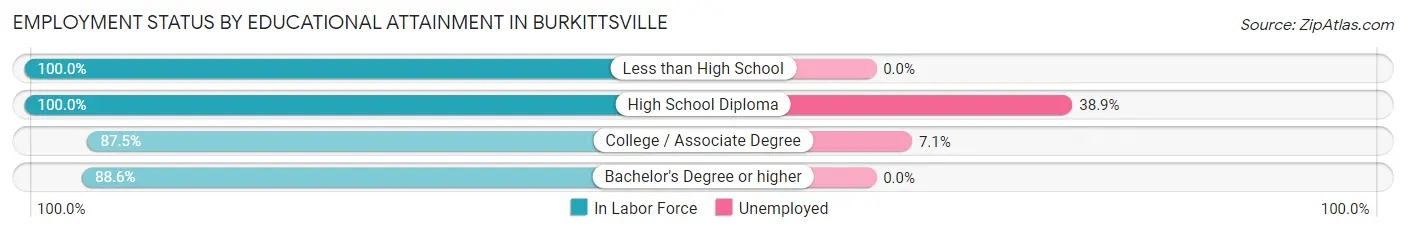
| Educational Attainment | In Labor Force | Unemployed |
| Less than High School | 1 (100.0%) | 0 (0.0%) |
| High School Diploma | 18 (100.0%) | 7 (38.9%) |
| College / Associate Degree | 14 (87.5%) | 1 (7.1%) |
| Bachelor's Degree or higher | 31 (88.6%) | 0 (0.0%) |
| Total | 64 (91.4%) | 9 (12.5%) |
Employment Occupations by Sex in Burkittsville
Management, Business, Science and Arts Occupations
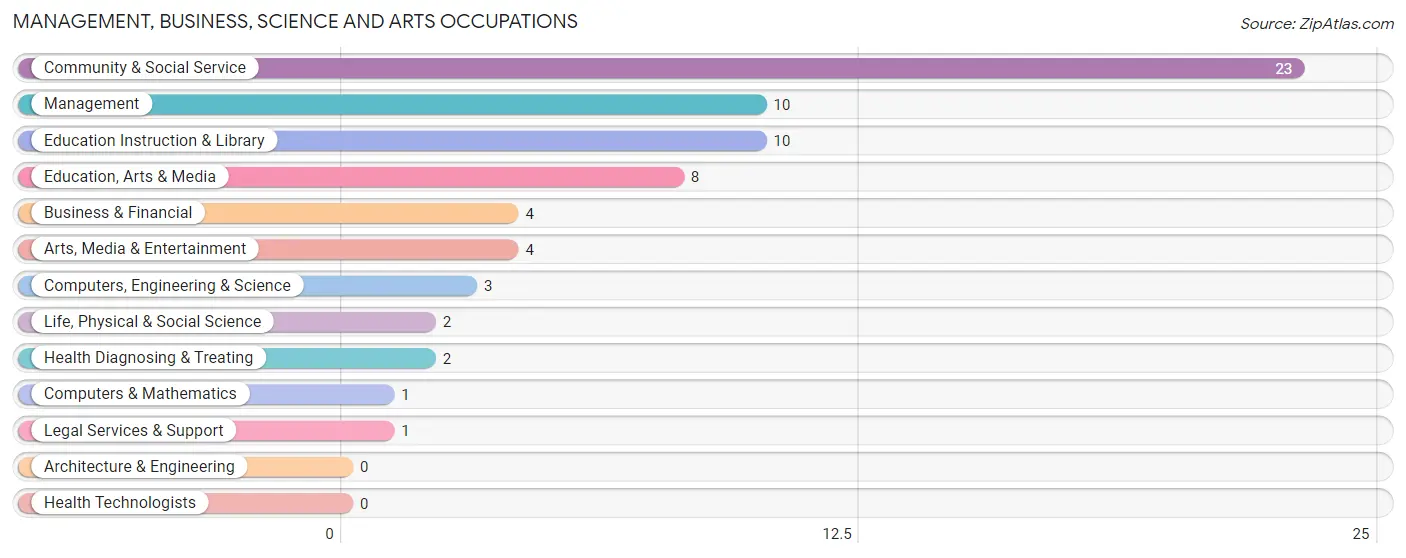
The most common Management, Business, Science and Arts occupations in Burkittsville are Community & Social Service (23 | 32.4%), Management (10 | 14.1%), Education Instruction & Library (10 | 14.1%), Education, Arts & Media (8 | 11.3%), and Business & Financial (4 | 5.6%).
Management, Business, Science and Arts Occupations by Sex
Within the Management, Business, Science and Arts occupations in Burkittsville, the most male-oriented occupations are Computers & Mathematics (100.0%), Arts, Media & Entertainment (100.0%), and Business & Financial (75.0%), while the most female-oriented occupations are Life, Physical & Social Science (100.0%), Legal Services & Support (100.0%), and Education Instruction & Library (90.0%).
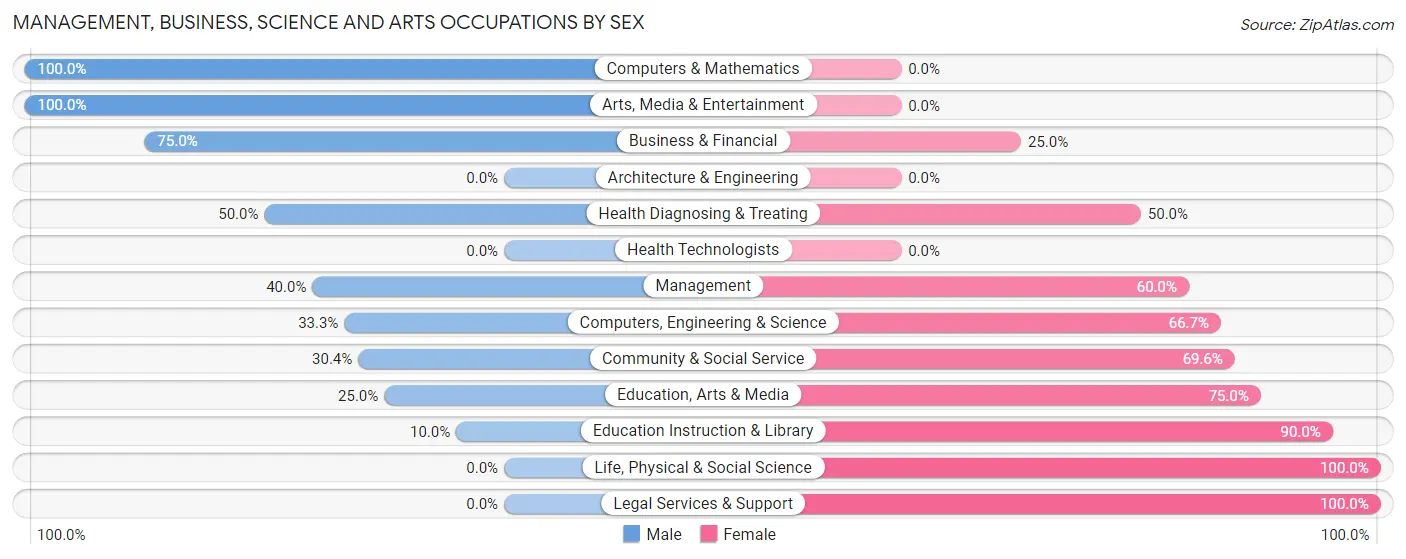
| Occupation | Male | Female |
| Management | 4 (40.0%) | 6 (60.0%) |
| Business & Financial | 3 (75.0%) | 1 (25.0%) |
| Computers, Engineering & Science | 1 (33.3%) | 2 (66.7%) |
| Computers & Mathematics | 1 (100.0%) | 0 (0.0%) |
| Architecture & Engineering | 0 (0.0%) | 0 (0.0%) |
| Life, Physical & Social Science | 0 (0.0%) | 2 (100.0%) |
| Community & Social Service | 7 (30.4%) | 16 (69.6%) |
| Education, Arts & Media | 2 (25.0%) | 6 (75.0%) |
| Legal Services & Support | 0 (0.0%) | 1 (100.0%) |
| Education Instruction & Library | 1 (10.0%) | 9 (90.0%) |
| Arts, Media & Entertainment | 4 (100.0%) | 0 (0.0%) |
| Health Diagnosing & Treating | 1 (50.0%) | 1 (50.0%) |
| Health Technologists | 0 (0.0%) | 0 (0.0%) |
| Total (Category) | 16 (38.1%) | 26 (61.9%) |
| Total (Overall) | 31 (43.7%) | 40 (56.3%) |
Services Occupations
The most common Services occupations in Burkittsville are Personal Care & Service (5 | 7.0%), Security & Protection (2 | 2.8%), Law Enforcement (2 | 2.8%), and Food Preparation & Serving (2 | 2.8%).
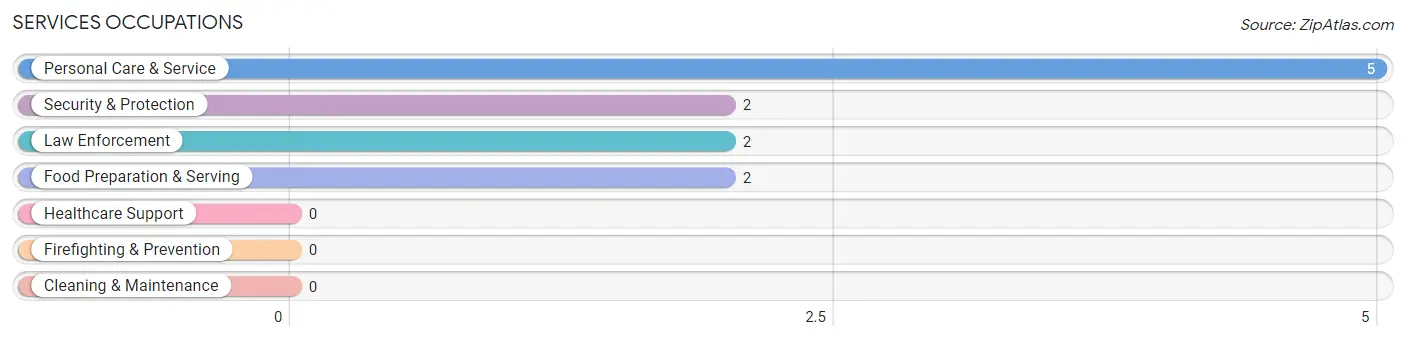
Services Occupations by Sex
Within the Services occupations in Burkittsville, the most male-oriented occupations are Security & Protection (100.0%), and Law Enforcement (100.0%), while the most female-oriented occupations are Food Preparation & Serving (100.0%), and Personal Care & Service (100.0%).
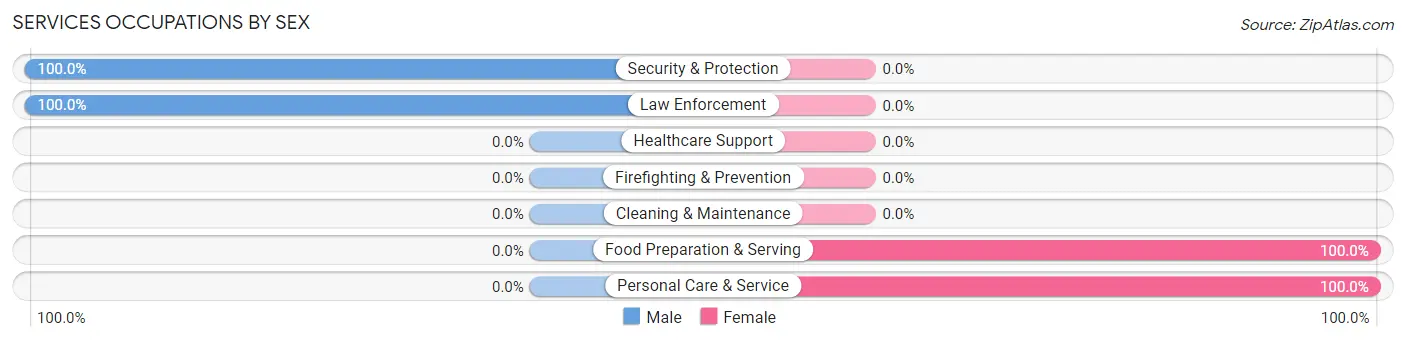
| Occupation | Male | Female |
| Healthcare Support | 0 (0.0%) | 0 (0.0%) |
| Security & Protection | 2 (100.0%) | 0 (0.0%) |
| Firefighting & Prevention | 0 (0.0%) | 0 (0.0%) |
| Law Enforcement | 2 (100.0%) | 0 (0.0%) |
| Food Preparation & Serving | 0 (0.0%) | 2 (100.0%) |
| Cleaning & Maintenance | 0 (0.0%) | 0 (0.0%) |
| Personal Care & Service | 0 (0.0%) | 5 (100.0%) |
| Total (Category) | 2 (22.2%) | 7 (77.8%) |
| Total (Overall) | 31 (43.7%) | 40 (56.3%) |
Sales and Office Occupations
The most common Sales and Office occupations in Burkittsville are Office & Administration (7 | 9.9%), and Sales & Related (1 | 1.4%).
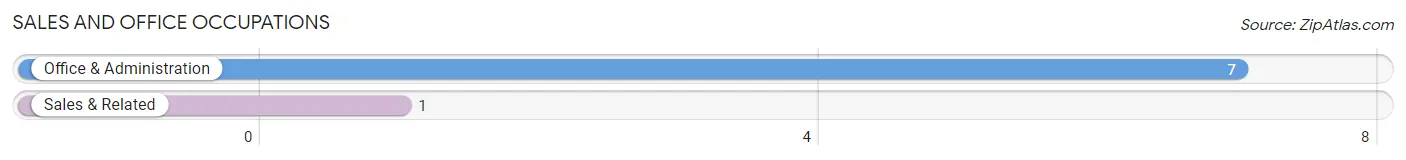
Sales and Office Occupations by Sex

| Occupation | Male | Female |
| Sales & Related | 1 (100.0%) | 0 (0.0%) |
| Office & Administration | 2 (28.6%) | 5 (71.4%) |
| Total (Category) | 3 (37.5%) | 5 (62.5%) |
| Total (Overall) | 31 (43.7%) | 40 (56.3%) |
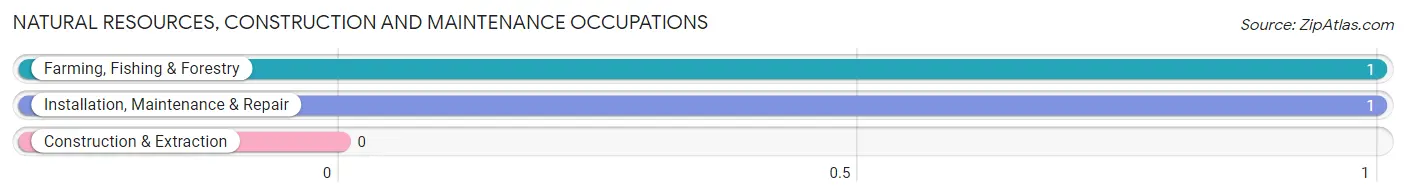
Natural Resources, Construction and Maintenance Occupations
The most common Natural Resources, Construction and Maintenance occupations in Burkittsville are Farming, Fishing & Forestry (1 | 1.4%), and Installation, Maintenance & Repair (1 | 1.4%).
Natural Resources, Construction and Maintenance Occupations by Sex
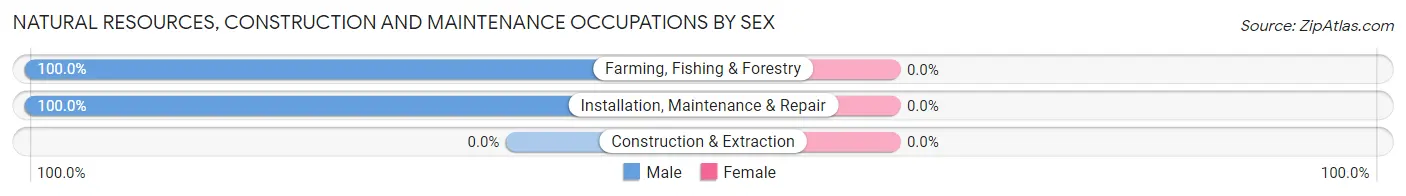
| Occupation | Male | Female |
| Farming, Fishing & Forestry | 1 (100.0%) | 0 (0.0%) |
| Construction & Extraction | 0 (0.0%) | 0 (0.0%) |
| Installation, Maintenance & Repair | 1 (100.0%) | 0 (0.0%) |
| Total (Category) | 2 (100.0%) | 0 (0.0%) |
| Total (Overall) | 31 (43.7%) | 40 (56.3%) |
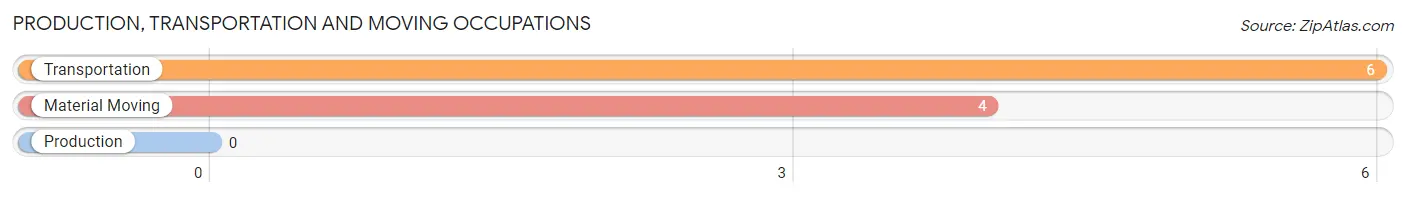
Production, Transportation and Moving Occupations
The most common Production, Transportation and Moving occupations in Burkittsville are Transportation (6 | 8.5%), and Material Moving (4 | 5.6%).
Production, Transportation and Moving Occupations by Sex
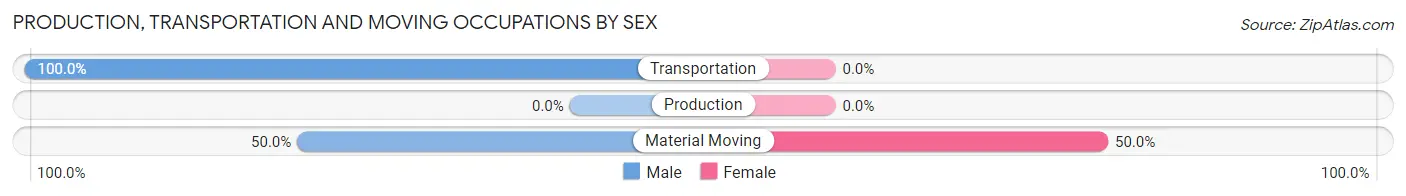
| Occupation | Male | Female |
| Production | 0 (0.0%) | 0 (0.0%) |
| Transportation | 6 (100.0%) | 0 (0.0%) |
| Material Moving | 2 (50.0%) | 2 (50.0%) |
| Total (Category) | 8 (80.0%) | 2 (20.0%) |
| Total (Overall) | 31 (43.7%) | 40 (56.3%) |
Employment Industries by Sex in Burkittsville
Employment Industries in Burkittsville
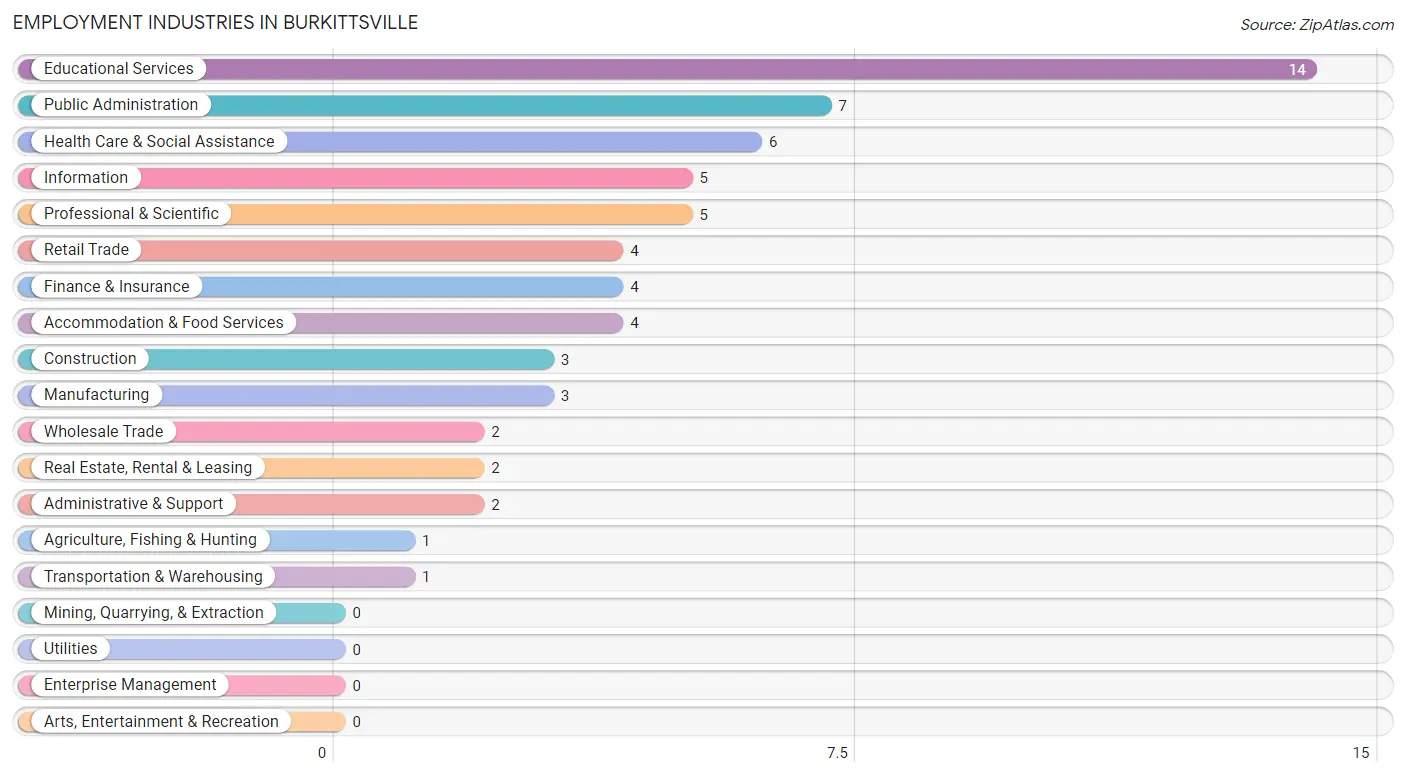
The major employment industries in Burkittsville include Educational Services (14 | 19.7%), Public Administration (7 | 9.9%), Health Care & Social Assistance (6 | 8.5%), Information (5 | 7.0%), and Professional & Scientific (5 | 7.0%).
Employment Industries by Sex in Burkittsville
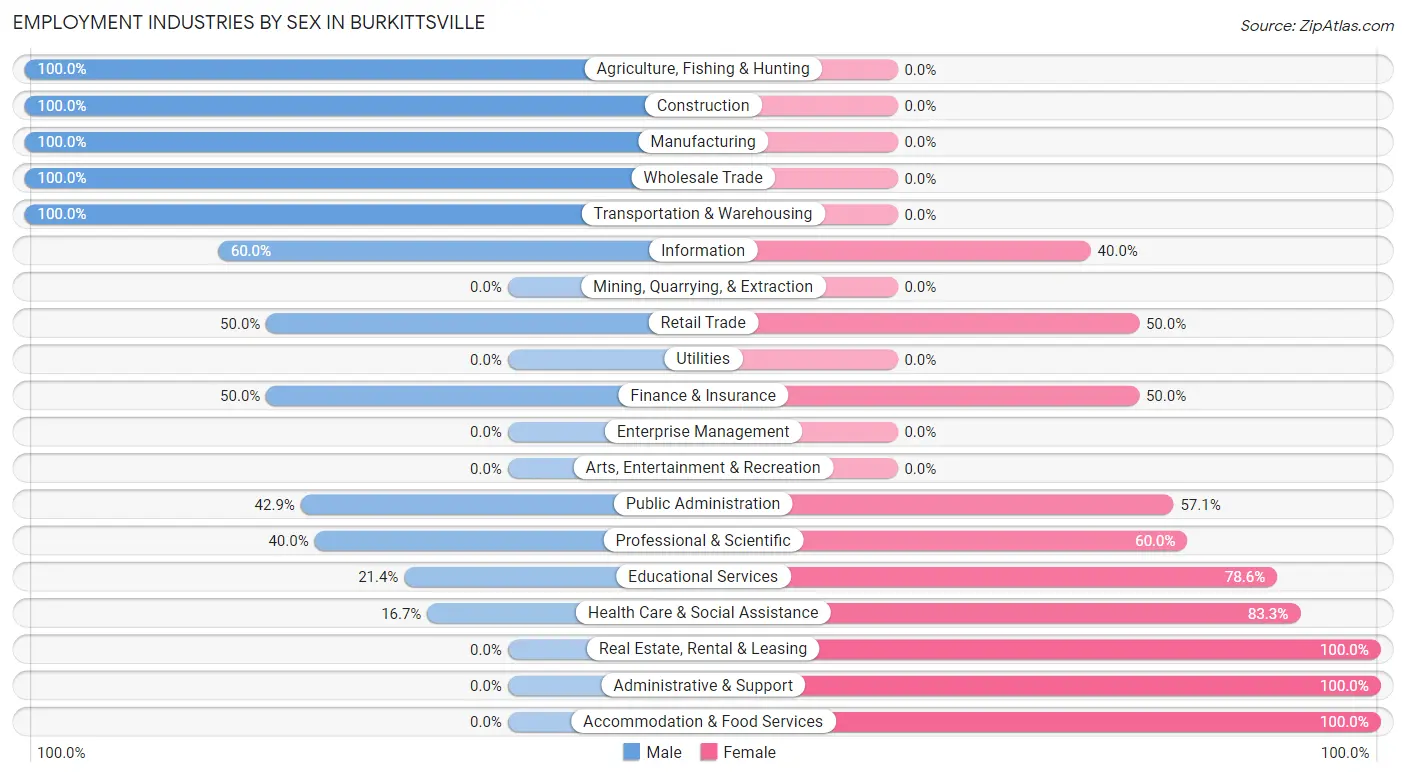
The Burkittsville industries that see more men than women are Agriculture, Fishing & Hunting (100.0%), Construction (100.0%), and Manufacturing (100.0%), whereas the industries that tend to have a higher number of women are Real Estate, Rental & Leasing (100.0%), Administrative & Support (100.0%), and Accommodation & Food Services (100.0%).
| Industry | Male | Female |
| Agriculture, Fishing & Hunting | 1 (100.0%) | 0 (0.0%) |
| Mining, Quarrying, & Extraction | 0 (0.0%) | 0 (0.0%) |
| Construction | 3 (100.0%) | 0 (0.0%) |
| Manufacturing | 3 (100.0%) | 0 (0.0%) |
| Wholesale Trade | 2 (100.0%) | 0 (0.0%) |
| Retail Trade | 2 (50.0%) | 2 (50.0%) |
| Transportation & Warehousing | 1 (100.0%) | 0 (0.0%) |
| Utilities | 0 (0.0%) | 0 (0.0%) |
| Information | 3 (60.0%) | 2 (40.0%) |
| Finance & Insurance | 2 (50.0%) | 2 (50.0%) |
| Real Estate, Rental & Leasing | 0 (0.0%) | 2 (100.0%) |
| Professional & Scientific | 2 (40.0%) | 3 (60.0%) |
| Enterprise Management | 0 (0.0%) | 0 (0.0%) |
| Administrative & Support | 0 (0.0%) | 2 (100.0%) |
| Educational Services | 3 (21.4%) | 11 (78.6%) |
| Health Care & Social Assistance | 1 (16.7%) | 5 (83.3%) |
| Arts, Entertainment & Recreation | 0 (0.0%) | 0 (0.0%) |
| Accommodation & Food Services | 0 (0.0%) | 4 (100.0%) |
| Public Administration | 3 (42.9%) | 4 (57.1%) |
| Total | 31 (43.7%) | 40 (56.3%) |
Education in Burkittsville
School Enrollment in Burkittsville
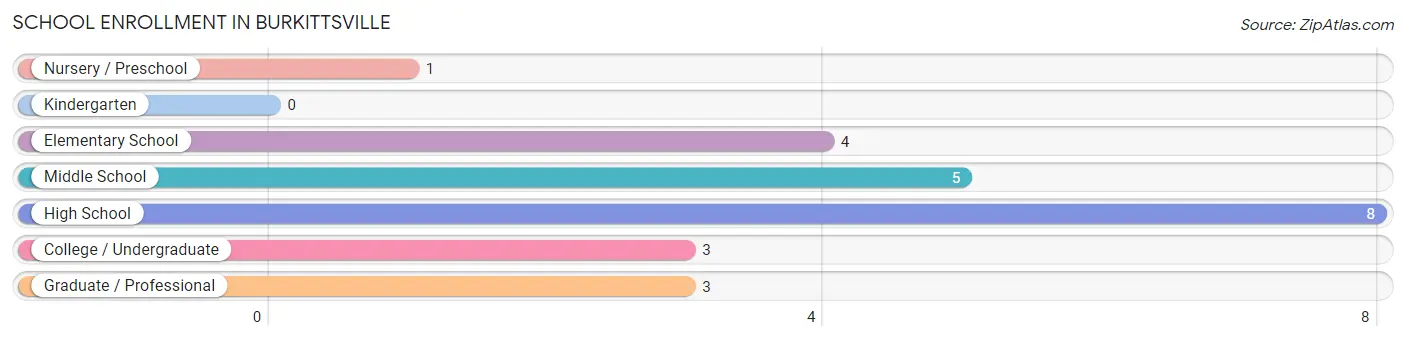
The most common levels of schooling among the 24 students in Burkittsville are high school (8 | 33.3%), middle school (5 | 20.8%), and elementary school (4 | 16.7%).
| School Level | # Students | % Students |
| Nursery / Preschool | 1 | 4.2% |
| Kindergarten | 0 | 0.0% |
| Elementary School | 4 | 16.7% |
| Middle School | 5 | 20.8% |
| High School | 8 | 33.3% |
| College / Undergraduate | 3 | 12.5% |
| Graduate / Professional | 3 | 12.5% |
| Total | 24 | 100.0% |
School Enrollment by Age by Funding Source in Burkittsville
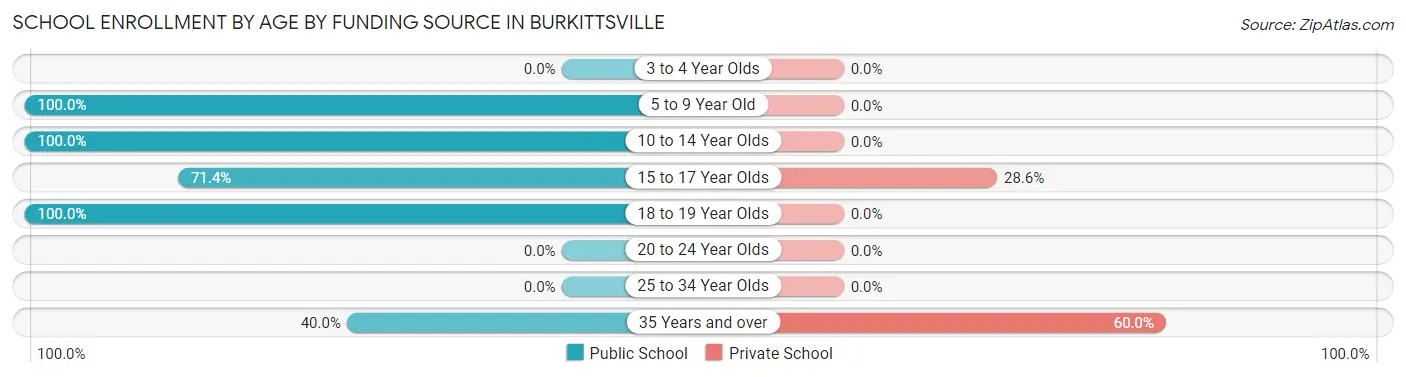
Out of a total of 24 students who are enrolled in schools in Burkittsville, 5 (20.8%) attend a private institution, while the remaining 19 (79.2%) are enrolled in public schools. The age group of 35 years and over has the highest likelihood of being enrolled in private schools, with 3 (60.0% in the age bracket) enrolled. Conversely, the age group of 5 to 9 year old has the lowest likelihood of being enrolled in a private school, with 5 (100.0% in the age bracket) attending a public institution.
| Age Bracket | Public School | Private School |
| 3 to 4 Year Olds | 0 (0.0%) | 0 (0.0%) |
| 5 to 9 Year Old | 5 (100.0%) | 0 (0.0%) |
| 10 to 14 Year Olds | 6 (100.0%) | 0 (0.0%) |
| 15 to 17 Year Olds | 5 (71.4%) | 2 (28.6%) |
| 18 to 19 Year Olds | 1 (100.0%) | 0 (0.0%) |
| 20 to 24 Year Olds | 0 (0.0%) | 0 (0.0%) |
| 25 to 34 Year Olds | 0 (0.0%) | 0 (0.0%) |
| 35 Years and over | 2 (40.0%) | 3 (60.0%) |
| Total | 19 (79.2%) | 5 (20.8%) |
Educational Attainment by Field of Study in Burkittsville
Education (12 | 21.8%), liberal arts & history (9 | 16.4%), psychology (5 | 9.1%), literature & languages (5 | 9.1%), and visual & performing arts (5 | 9.1%) are the most common fields of study among 55 individuals in Burkittsville who have obtained a bachelor's degree or higher.
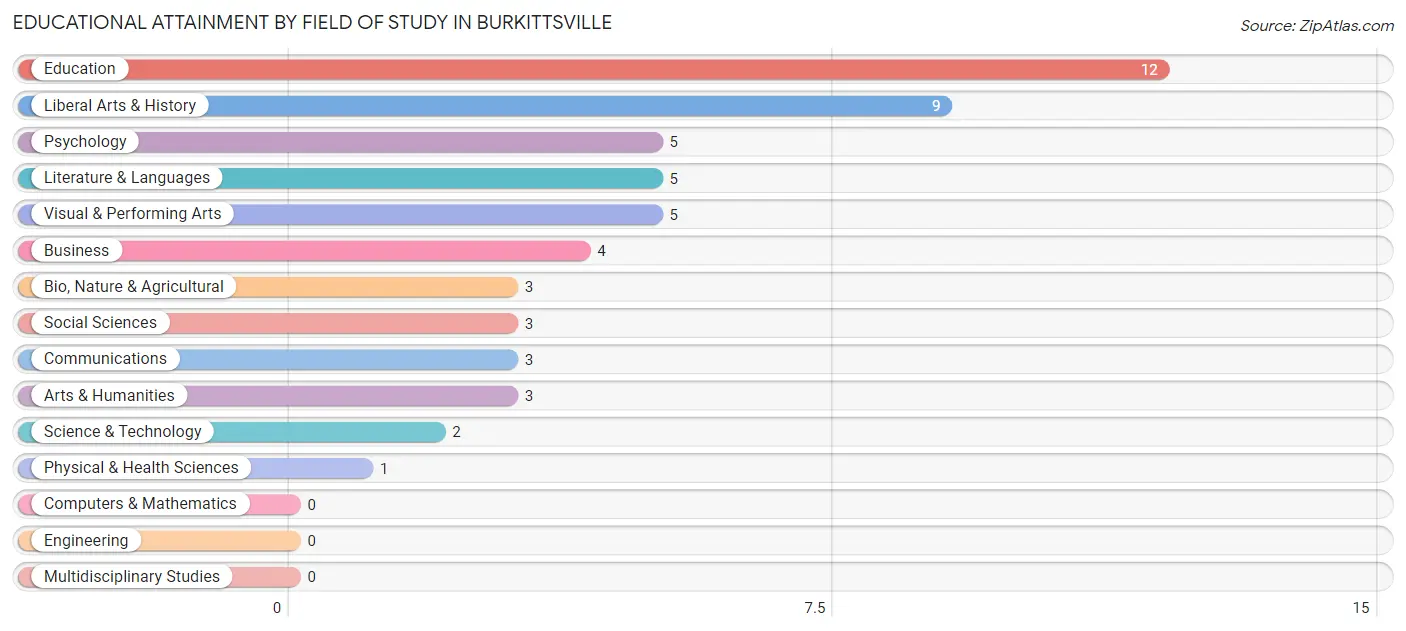
| Field of Study | # Graduates | % Graduates |
| Computers & Mathematics | 0 | 0.0% |
| Bio, Nature & Agricultural | 3 | 5.4% |
| Physical & Health Sciences | 1 | 1.8% |
| Psychology | 5 | 9.1% |
| Social Sciences | 3 | 5.4% |
| Engineering | 0 | 0.0% |
| Multidisciplinary Studies | 0 | 0.0% |
| Science & Technology | 2 | 3.6% |
| Business | 4 | 7.3% |
| Education | 12 | 21.8% |
| Literature & Languages | 5 | 9.1% |
| Liberal Arts & History | 9 | 16.4% |
| Visual & Performing Arts | 5 | 9.1% |
| Communications | 3 | 5.4% |
| Arts & Humanities | 3 | 5.4% |
| Total | 55 | 100.0% |
Transportation & Commute in Burkittsville
Vehicle Availability by Sex in Burkittsville
The most prevalent vehicle ownership categories in Burkittsville are males with 2 vehicles (15, accounting for 50.0%) and females with 2 vehicles (20, making up 37.5%).
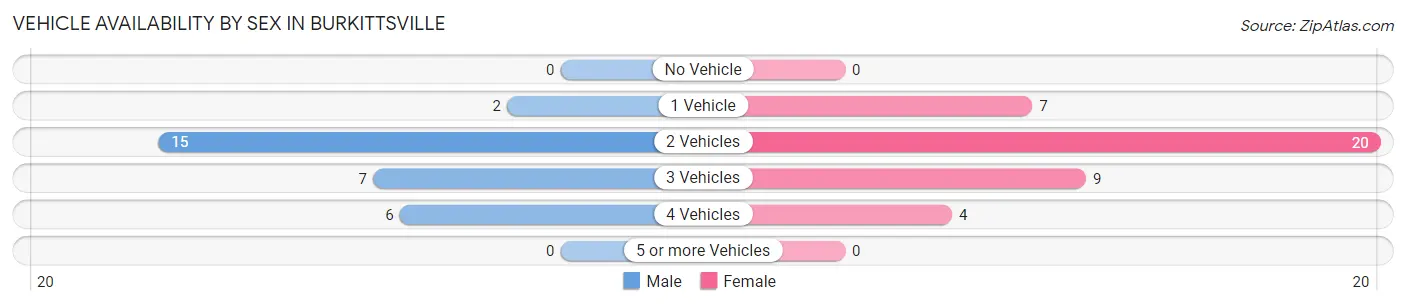
| Vehicles Available | Male | Female |
| No Vehicle | 0 (0.0%) | 0 (0.0%) |
| 1 Vehicle | 2 (6.7%) | 7 (17.5%) |
| 2 Vehicles | 15 (50.0%) | 20 (50.0%) |
| 3 Vehicles | 7 (23.3%) | 9 (22.5%) |
| 4 Vehicles | 6 (20.0%) | 4 (10.0%) |
| 5 or more Vehicles | 0 (0.0%) | 0 (0.0%) |
| Total | 30 (100.0%) | 40 (100.0%) |
Commute Time in Burkittsville
The most frequently occuring commute durations in Burkittsville are 25 to 29 minutes (11 commuters, 18.3%), 15 to 19 minutes (9 commuters, 15.0%), and 20 to 24 minutes (9 commuters, 15.0%).
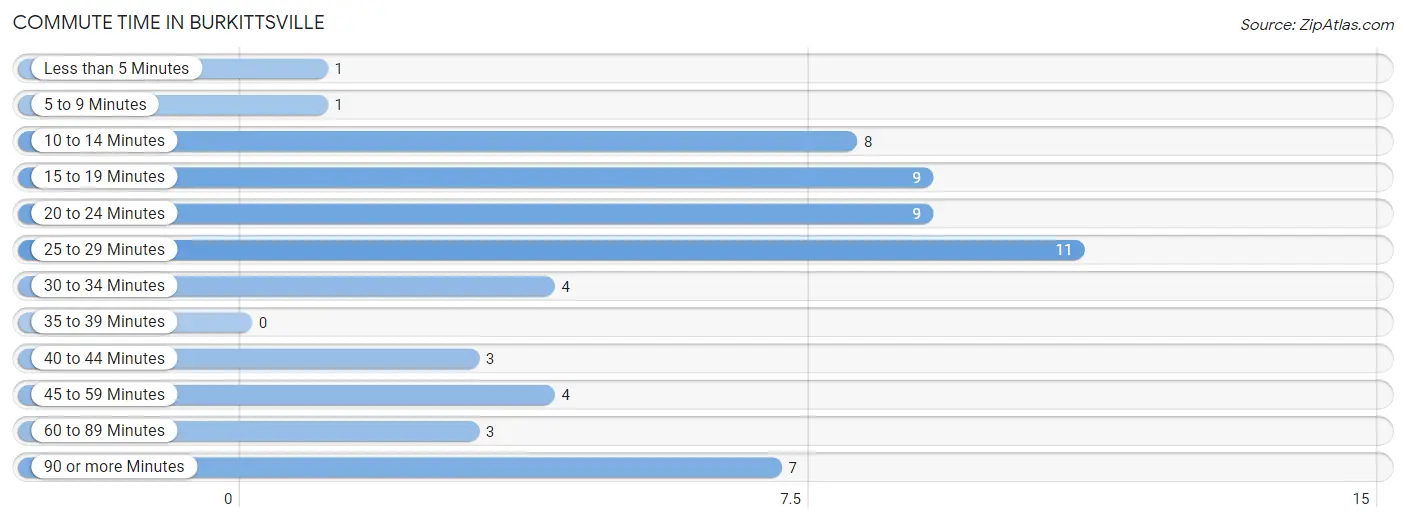
| Commute Time | # Commuters | % Commuters |
| Less than 5 Minutes | 1 | 1.7% |
| 5 to 9 Minutes | 1 | 1.7% |
| 10 to 14 Minutes | 8 | 13.3% |
| 15 to 19 Minutes | 9 | 15.0% |
| 20 to 24 Minutes | 9 | 15.0% |
| 25 to 29 Minutes | 11 | 18.3% |
| 30 to 34 Minutes | 4 | 6.7% |
| 35 to 39 Minutes | 0 | 0.0% |
| 40 to 44 Minutes | 3 | 5.0% |
| 45 to 59 Minutes | 4 | 6.7% |
| 60 to 89 Minutes | 3 | 5.0% |
| 90 or more Minutes | 7 | 11.7% |
Commute Time by Sex in Burkittsville
The most common commute times in Burkittsville are 15 to 19 minutes (7 commuters, 26.9%) for males and 25 to 29 minutes (9 commuters, 26.5%) for females.
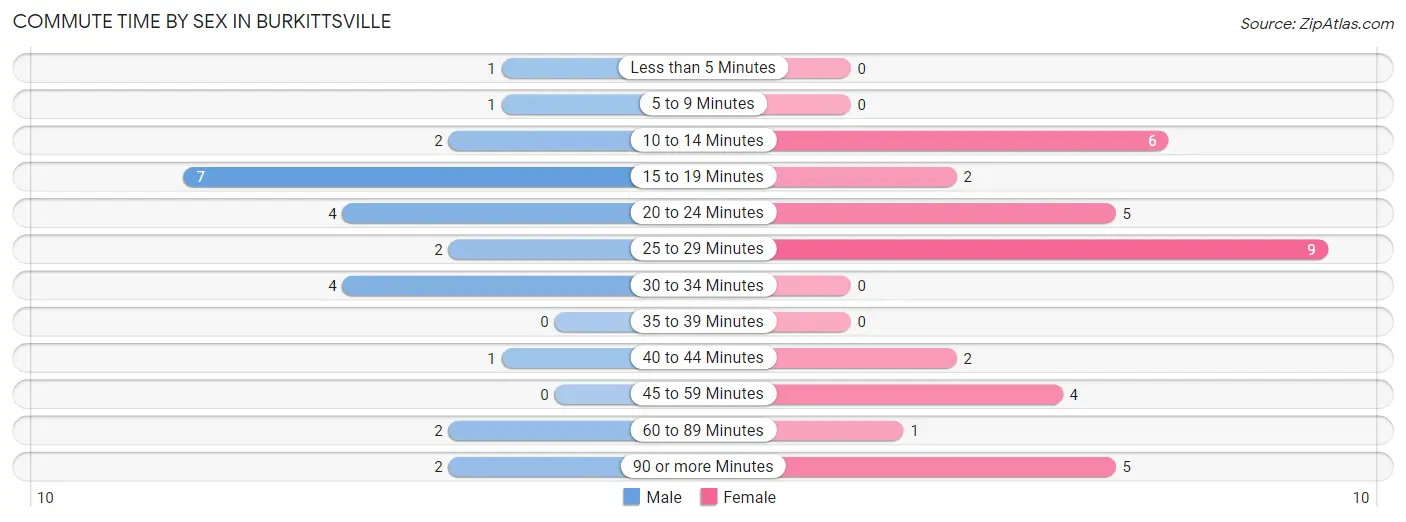
| Commute Time | Male | Female |
| Less than 5 Minutes | 1 (3.8%) | 0 (0.0%) |
| 5 to 9 Minutes | 1 (3.8%) | 0 (0.0%) |
| 10 to 14 Minutes | 2 (7.7%) | 6 (17.6%) |
| 15 to 19 Minutes | 7 (26.9%) | 2 (5.9%) |
| 20 to 24 Minutes | 4 (15.4%) | 5 (14.7%) |
| 25 to 29 Minutes | 2 (7.7%) | 9 (26.5%) |
| 30 to 34 Minutes | 4 (15.4%) | 0 (0.0%) |
| 35 to 39 Minutes | 0 (0.0%) | 0 (0.0%) |
| 40 to 44 Minutes | 1 (3.8%) | 2 (5.9%) |
| 45 to 59 Minutes | 0 (0.0%) | 4 (11.8%) |
| 60 to 89 Minutes | 2 (7.7%) | 1 (2.9%) |
| 90 or more Minutes | 2 (7.7%) | 5 (14.7%) |
Time of Departure to Work by Sex in Burkittsville
The most frequent times of departure to work in Burkittsville are 7:30 AM to 7:59 AM (8, 30.8%) for males and 7:00 AM to 7:29 AM (7, 20.6%) for females.
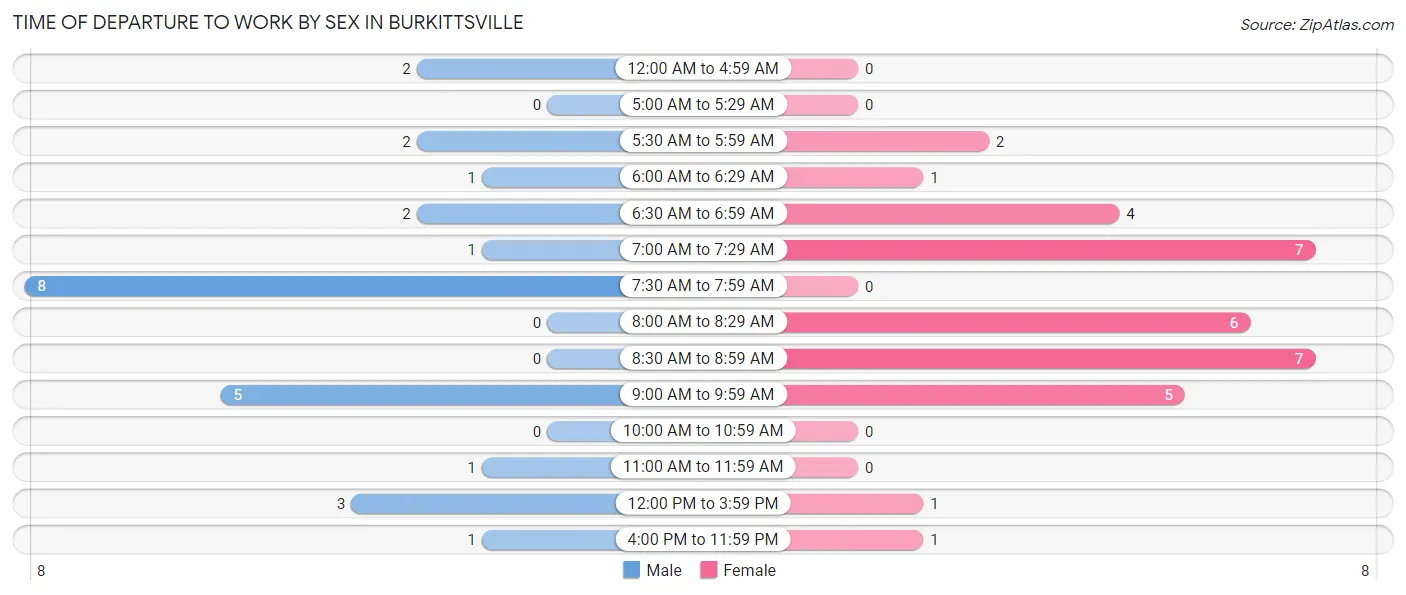
| Time of Departure | Male | Female |
| 12:00 AM to 4:59 AM | 2 (7.7%) | 0 (0.0%) |
| 5:00 AM to 5:29 AM | 0 (0.0%) | 0 (0.0%) |
| 5:30 AM to 5:59 AM | 2 (7.7%) | 2 (5.9%) |
| 6:00 AM to 6:29 AM | 1 (3.8%) | 1 (2.9%) |
| 6:30 AM to 6:59 AM | 2 (7.7%) | 4 (11.8%) |
| 7:00 AM to 7:29 AM | 1 (3.8%) | 7 (20.6%) |
| 7:30 AM to 7:59 AM | 8 (30.8%) | 0 (0.0%) |
| 8:00 AM to 8:29 AM | 0 (0.0%) | 6 (17.6%) |
| 8:30 AM to 8:59 AM | 0 (0.0%) | 7 (20.6%) |
| 9:00 AM to 9:59 AM | 5 (19.2%) | 5 (14.7%) |
| 10:00 AM to 10:59 AM | 0 (0.0%) | 0 (0.0%) |
| 11:00 AM to 11:59 AM | 1 (3.8%) | 0 (0.0%) |
| 12:00 PM to 3:59 PM | 3 (11.5%) | 1 (2.9%) |
| 4:00 PM to 11:59 PM | 1 (3.8%) | 1 (2.9%) |
| Total | 26 (100.0%) | 34 (100.0%) |
Housing Occupancy in Burkittsville
Occupancy by Ownership in Burkittsville
Of the total 70 dwellings in Burkittsville, owner-occupied units account for 50 (71.4%), while renter-occupied units make up 20 (28.6%).
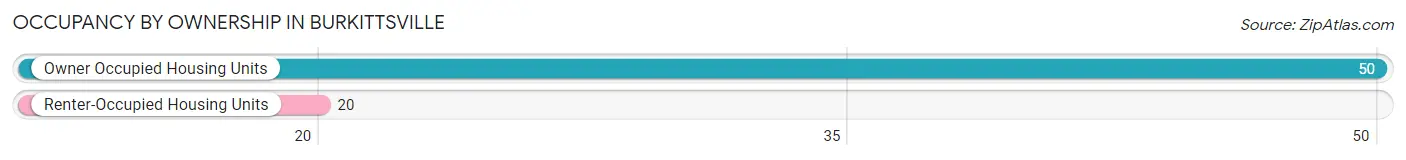
| Occupancy | # Housing Units | % Housing Units |
| Owner Occupied Housing Units | 50 | 71.4% |
| Renter-Occupied Housing Units | 20 | 28.6% |
| Total Occupied Housing Units | 70 | 100.0% |
Occupancy by Household Size in Burkittsville
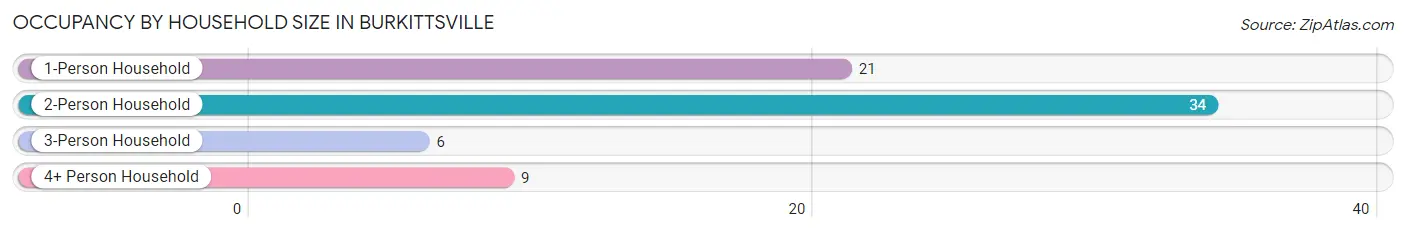
| Household Size | # Housing Units | % Housing Units |
| 1-Person Household | 21 | 30.0% |
| 2-Person Household | 34 | 48.6% |
| 3-Person Household | 6 | 8.6% |
| 4+ Person Household | 9 | 12.9% |
| Total Housing Units | 70 | 100.0% |
Occupancy by Ownership by Household Size in Burkittsville
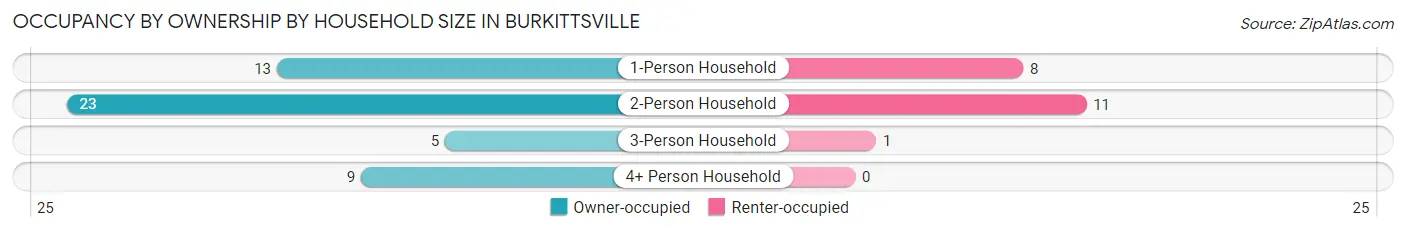
| Household Size | Owner-occupied | Renter-occupied |
| 1-Person Household | 13 (61.9%) | 8 (38.1%) |
| 2-Person Household | 23 (67.6%) | 11 (32.4%) |
| 3-Person Household | 5 (83.3%) | 1 (16.7%) |
| 4+ Person Household | 9 (100.0%) | 0 (0.0%) |
| Total Housing Units | 50 (71.4%) | 20 (28.6%) |
Occupancy by Educational Attainment in Burkittsville
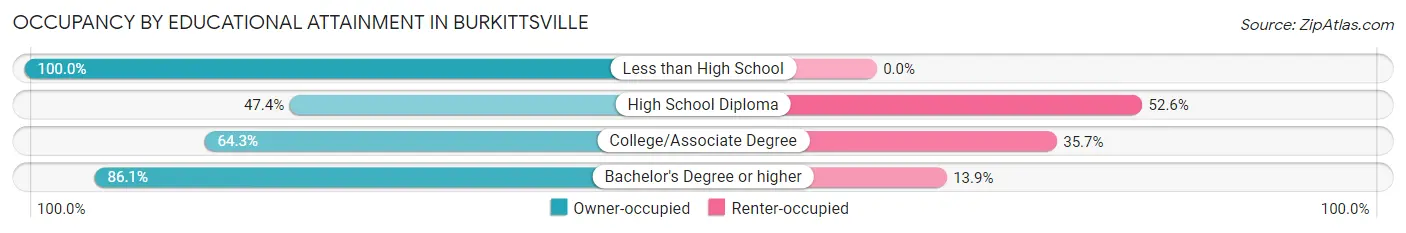
| Household Size | Owner-occupied | Renter-occupied |
| Less than High School | 1 (100.0%) | 0 (0.0%) |
| High School Diploma | 9 (47.4%) | 10 (52.6%) |
| College/Associate Degree | 9 (64.3%) | 5 (35.7%) |
| Bachelor's Degree or higher | 31 (86.1%) | 5 (13.9%) |
Occupancy by Age of Householder in Burkittsville
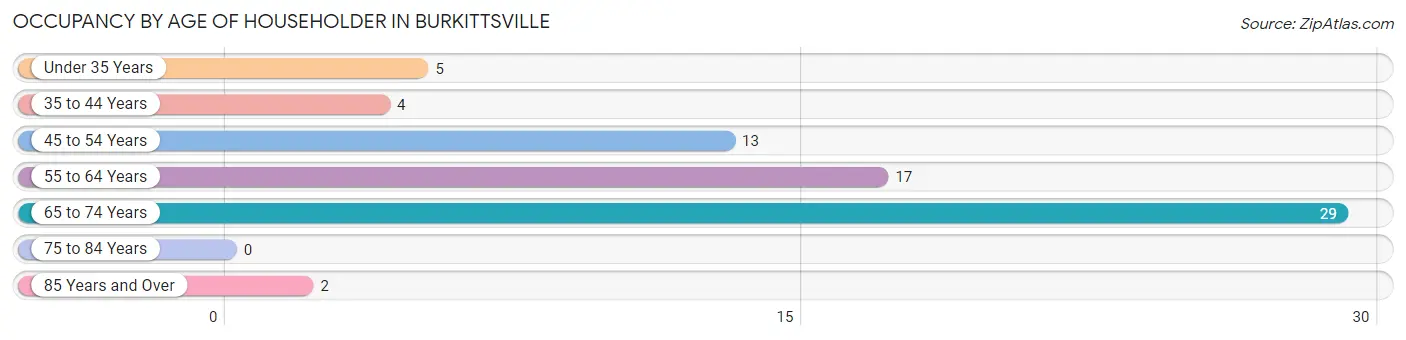
| Age Bracket | # Households | % Households |
| Under 35 Years | 5 | 7.1% |
| 35 to 44 Years | 4 | 5.7% |
| 45 to 54 Years | 13 | 18.6% |
| 55 to 64 Years | 17 | 24.3% |
| 65 to 74 Years | 29 | 41.4% |
| 75 to 84 Years | 0 | 0.0% |
| 85 Years and Over | 2 | 2.9% |
| Total | 70 | 100.0% |
Housing Finances in Burkittsville
Median Income by Occupancy in Burkittsville
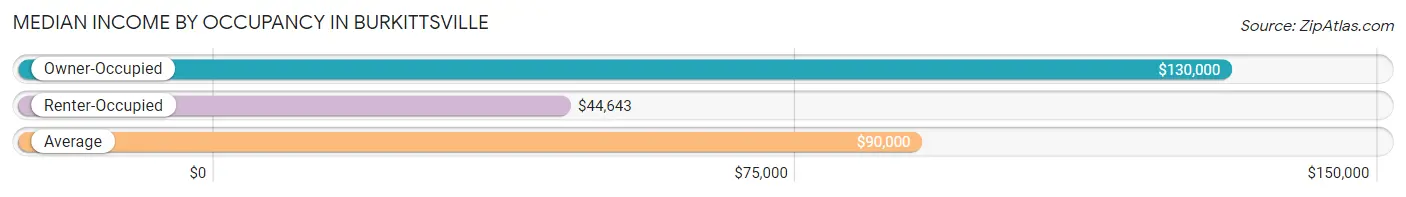
| Occupancy Type | # Households | Median Income |
| Owner-Occupied | 50 (71.4%) | $130,000 |
| Renter-Occupied | 20 (28.6%) | $44,643 |
| Average | 70 (100.0%) | $90,000 |
Occupancy by Householder Income Bracket in Burkittsville
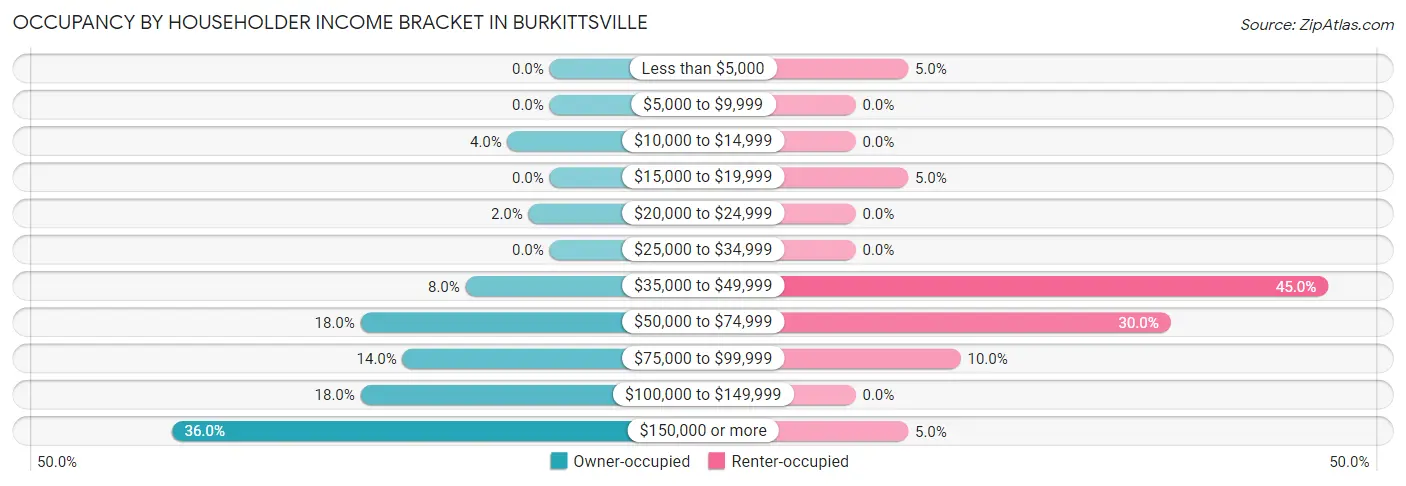
| Income Bracket | Owner-occupied | Renter-occupied |
| Less than $5,000 | 0 (0.0%) | 1 (5.0%) |
| $5,000 to $9,999 | 0 (0.0%) | 0 (0.0%) |
| $10,000 to $14,999 | 2 (4.0%) | 0 (0.0%) |
| $15,000 to $19,999 | 0 (0.0%) | 1 (5.0%) |
| $20,000 to $24,999 | 1 (2.0%) | 0 (0.0%) |
| $25,000 to $34,999 | 0 (0.0%) | 0 (0.0%) |
| $35,000 to $49,999 | 4 (8.0%) | 9 (45.0%) |
| $50,000 to $74,999 | 9 (18.0%) | 6 (30.0%) |
| $75,000 to $99,999 | 7 (14.0%) | 2 (10.0%) |
| $100,000 to $149,999 | 9 (18.0%) | 0 (0.0%) |
| $150,000 or more | 18 (36.0%) | 1 (5.0%) |
| Total | 50 (100.0%) | 20 (100.0%) |
Monthly Housing Cost Tiers in Burkittsville
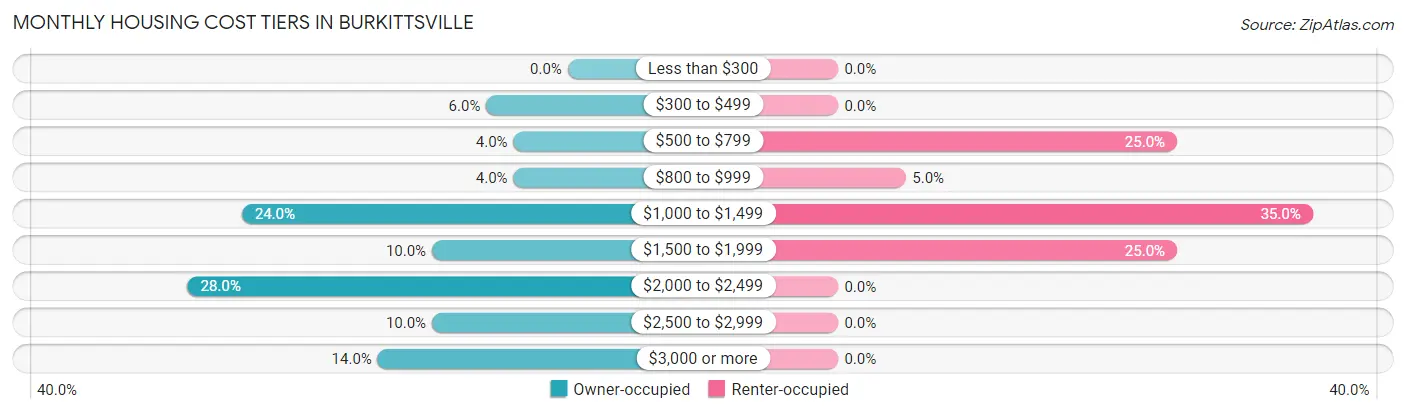
| Monthly Cost | Owner-occupied | Renter-occupied |
| Less than $300 | 0 (0.0%) | 0 (0.0%) |
| $300 to $499 | 3 (6.0%) | 0 (0.0%) |
| $500 to $799 | 2 (4.0%) | 5 (25.0%) |
| $800 to $999 | 2 (4.0%) | 1 (5.0%) |
| $1,000 to $1,499 | 12 (24.0%) | 7 (35.0%) |
| $1,500 to $1,999 | 5 (10.0%) | 5 (25.0%) |
| $2,000 to $2,499 | 14 (28.0%) | 0 (0.0%) |
| $2,500 to $2,999 | 5 (10.0%) | 0 (0.0%) |
| $3,000 or more | 7 (14.0%) | 0 (0.0%) |
| Total | 50 (100.0%) | 20 (100.0%) |
Physical Housing Characteristics in Burkittsville
Housing Structures in Burkittsville
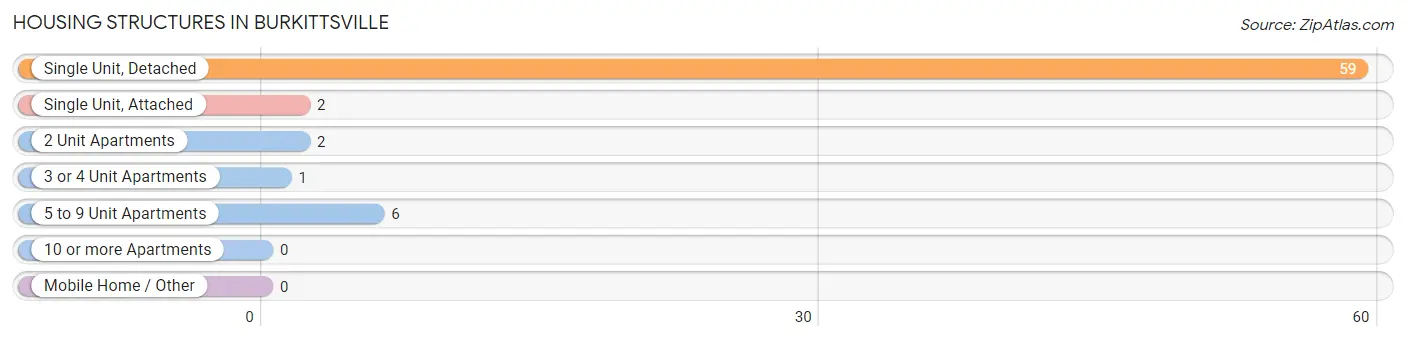
| Structure Type | # Housing Units | % Housing Units |
| Single Unit, Detached | 59 | 84.3% |
| Single Unit, Attached | 2 | 2.9% |
| 2 Unit Apartments | 2 | 2.9% |
| 3 or 4 Unit Apartments | 1 | 1.4% |
| 5 to 9 Unit Apartments | 6 | 8.6% |
| 10 or more Apartments | 0 | 0.0% |
| Mobile Home / Other | 0 | 0.0% |
| Total | 70 | 100.0% |
Housing Structures by Occupancy in Burkittsville
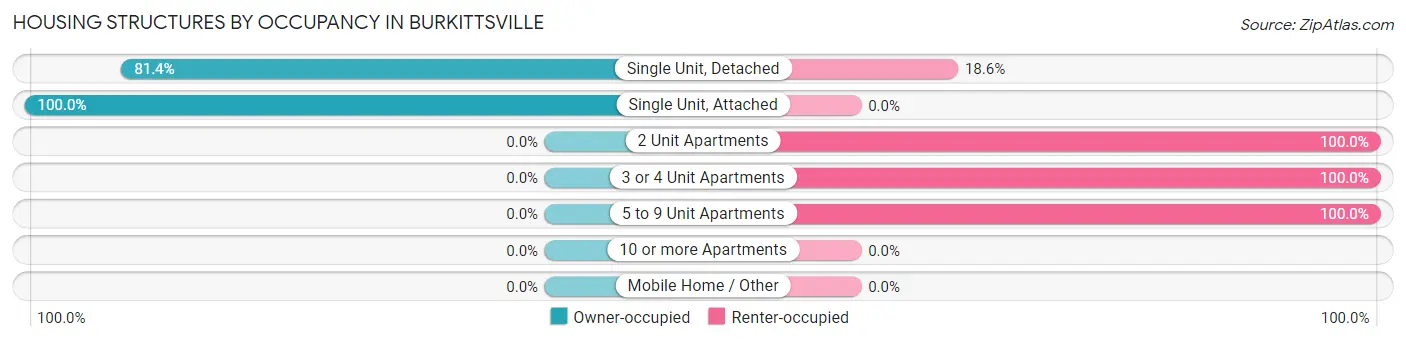
| Structure Type | Owner-occupied | Renter-occupied |
| Single Unit, Detached | 48 (81.4%) | 11 (18.6%) |
| Single Unit, Attached | 2 (100.0%) | 0 (0.0%) |
| 2 Unit Apartments | 0 (0.0%) | 2 (100.0%) |
| 3 or 4 Unit Apartments | 0 (0.0%) | 1 (100.0%) |
| 5 to 9 Unit Apartments | 0 (0.0%) | 6 (100.0%) |
| 10 or more Apartments | 0 (0.0%) | 0 (0.0%) |
| Mobile Home / Other | 0 (0.0%) | 0 (0.0%) |
| Total | 50 (71.4%) | 20 (28.6%) |
Housing Structures by Number of Rooms in Burkittsville
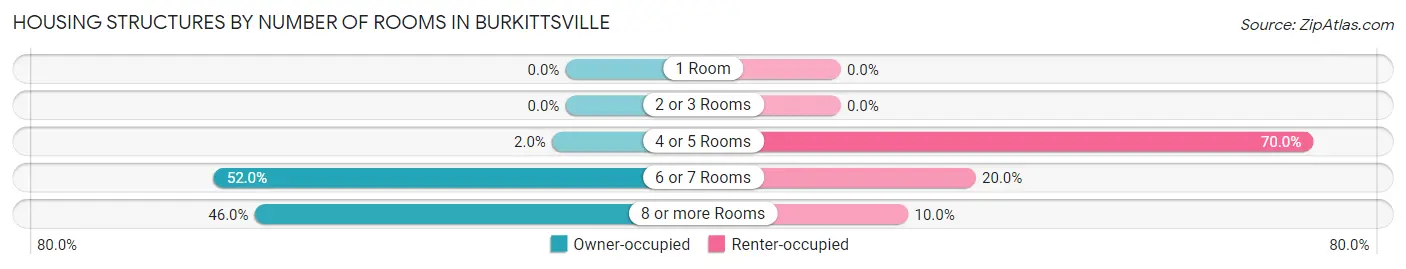
| Number of Rooms | Owner-occupied | Renter-occupied |
| 1 Room | 0 (0.0%) | 0 (0.0%) |
| 2 or 3 Rooms | 0 (0.0%) | 0 (0.0%) |
| 4 or 5 Rooms | 1 (2.0%) | 14 (70.0%) |
| 6 or 7 Rooms | 26 (52.0%) | 4 (20.0%) |
| 8 or more Rooms | 23 (46.0%) | 2 (10.0%) |
| Total | 50 (100.0%) | 20 (100.0%) |
Housing Structure by Heating Type in Burkittsville
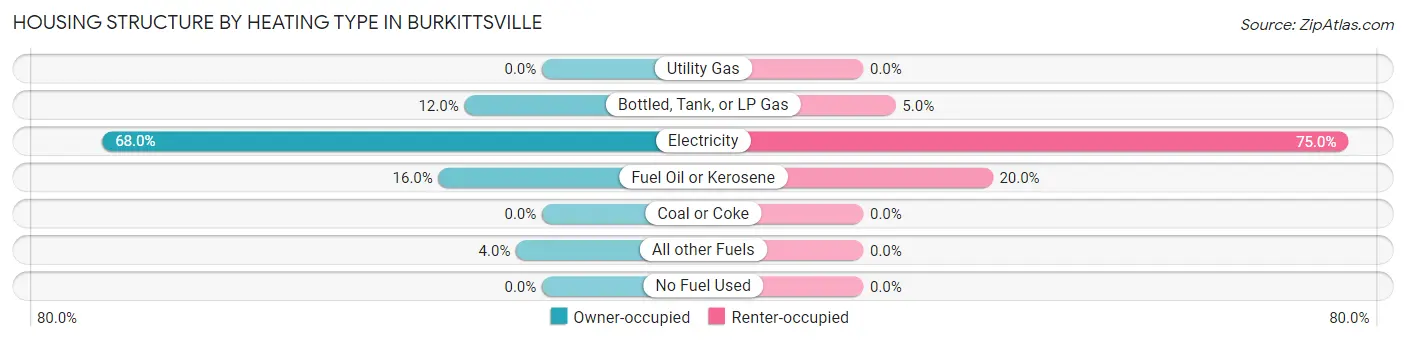
| Heating Type | Owner-occupied | Renter-occupied |
| Utility Gas | 0 (0.0%) | 0 (0.0%) |
| Bottled, Tank, or LP Gas | 6 (12.0%) | 1 (5.0%) |
| Electricity | 34 (68.0%) | 15 (75.0%) |
| Fuel Oil or Kerosene | 8 (16.0%) | 4 (20.0%) |
| Coal or Coke | 0 (0.0%) | 0 (0.0%) |
| All other Fuels | 2 (4.0%) | 0 (0.0%) |
| No Fuel Used | 0 (0.0%) | 0 (0.0%) |
| Total | 50 (100.0%) | 20 (100.0%) |
Household Vehicle Usage in Burkittsville
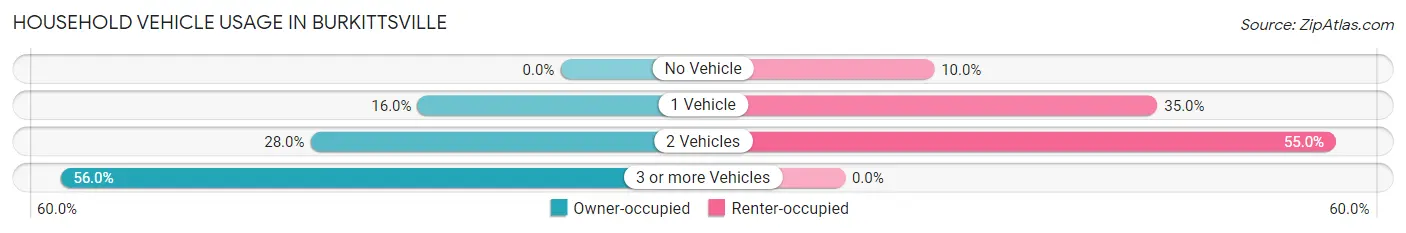
| Vehicles per Household | Owner-occupied | Renter-occupied |
| No Vehicle | 0 (0.0%) | 2 (10.0%) |
| 1 Vehicle | 8 (16.0%) | 7 (35.0%) |
| 2 Vehicles | 14 (28.0%) | 11 (55.0%) |
| 3 or more Vehicles | 28 (56.0%) | 0 (0.0%) |
| Total | 50 (100.0%) | 20 (100.0%) |
Real Estate & Mortgages in Burkittsville
Real Estate and Mortgage Overview in Burkittsville
| Characteristic | Without Mortgage | With Mortgage |
| Housing Units | 8 | 42 |
| Median Property Value | $466,700 | $433,300 |
| Median Household Income | - | - |
| Monthly Housing Costs | $750 | $5 |
| Real Estate Taxes | $3,500 | $0 |
Property Value by Mortgage Status in Burkittsville
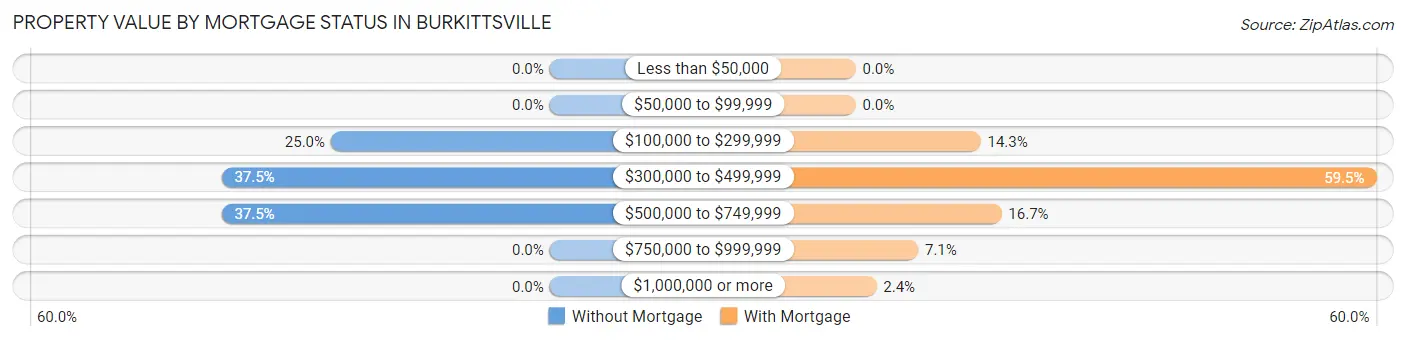
| Property Value | Without Mortgage | With Mortgage |
| Less than $50,000 | 0 (0.0%) | 0 (0.0%) |
| $50,000 to $99,999 | 0 (0.0%) | 0 (0.0%) |
| $100,000 to $299,999 | 2 (25.0%) | 6 (14.3%) |
| $300,000 to $499,999 | 3 (37.5%) | 25 (59.5%) |
| $500,000 to $749,999 | 3 (37.5%) | 7 (16.7%) |
| $750,000 to $999,999 | 0 (0.0%) | 3 (7.1%) |
| $1,000,000 or more | 0 (0.0%) | 1 (2.4%) |
| Total | 8 (100.0%) | 42 (100.0%) |
Household Income by Mortgage Status in Burkittsville
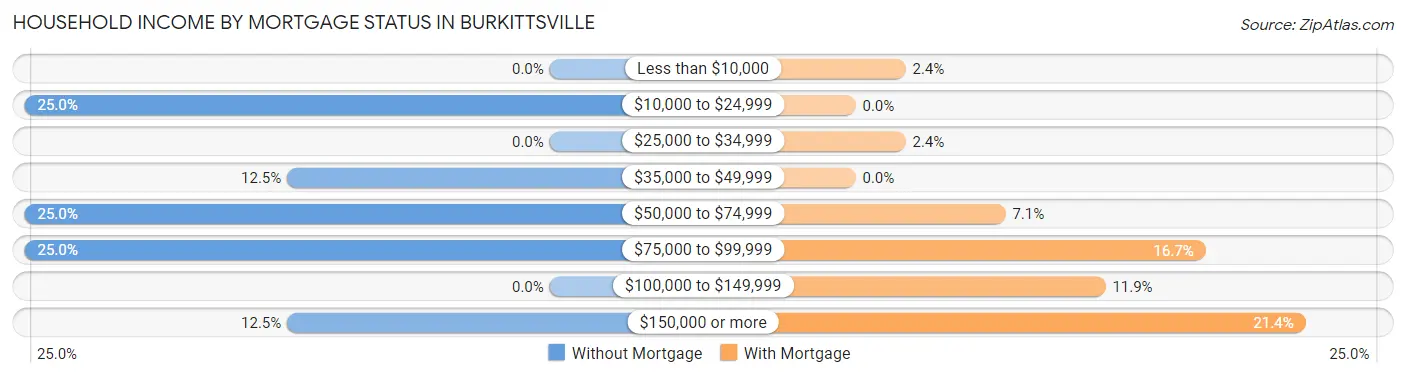
| Household Income | Without Mortgage | With Mortgage |
| Less than $10,000 | 0 (0.0%) | 1 (2.4%) |
| $10,000 to $24,999 | 2 (25.0%) | 0 (0.0%) |
| $25,000 to $34,999 | 0 (0.0%) | 1 (2.4%) |
| $35,000 to $49,999 | 1 (12.5%) | 0 (0.0%) |
| $50,000 to $74,999 | 2 (25.0%) | 3 (7.1%) |
| $75,000 to $99,999 | 2 (25.0%) | 7 (16.7%) |
| $100,000 to $149,999 | 0 (0.0%) | 5 (11.9%) |
| $150,000 or more | 1 (12.5%) | 9 (21.4%) |
| Total | 8 (100.0%) | 42 (100.0%) |
Property Value to Household Income Ratio in Burkittsville
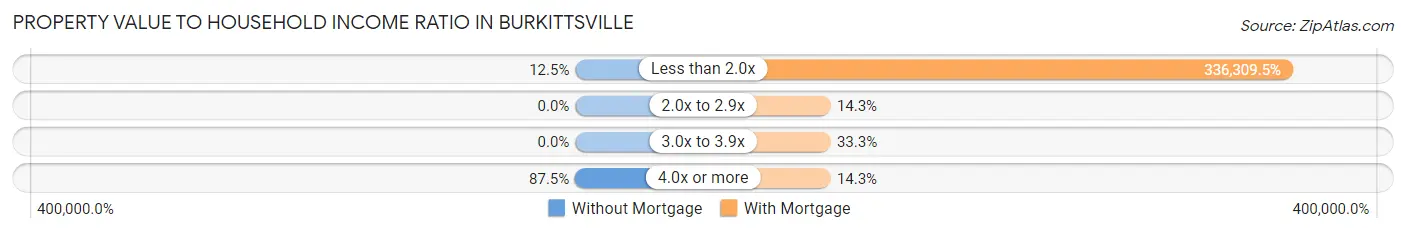
| Value-to-Income Ratio | Without Mortgage | With Mortgage |
| Less than 2.0x | 1 (12.5%) | 141,250 (336,309.5%) |
| 2.0x to 2.9x | 0 (0.0%) | 6 (14.3%) |
| 3.0x to 3.9x | 0 (0.0%) | 14 (33.3%) |
| 4.0x or more | 7 (87.5%) | 6 (14.3%) |
| Total | 8 (100.0%) | 42 (100.0%) |
Real Estate Taxes by Mortgage Status in Burkittsville
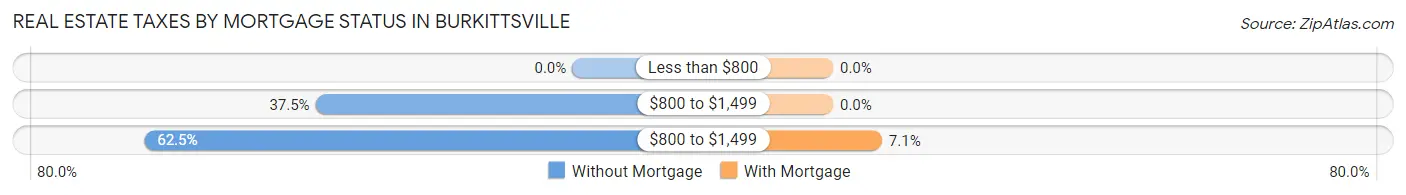
| Property Taxes | Without Mortgage | With Mortgage |
| Less than $800 | 0 (0.0%) | 0 (0.0%) |
| $800 to $1,499 | 3 (37.5%) | 0 (0.0%) |
| $800 to $1,499 | 5 (62.5%) | 3 (7.1%) |
| Total | 8 (100.0%) | 42 (100.0%) |
Health & Disability in Burkittsville
Health Insurance Coverage by Age in Burkittsville
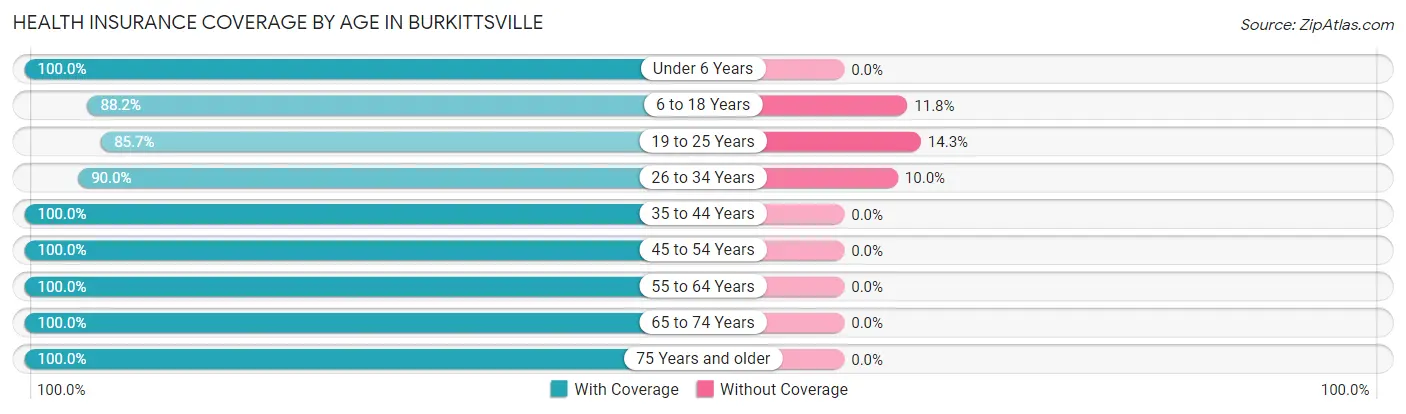
| Age Bracket | With Coverage | Without Coverage |
| Under 6 Years | 5 (100.0%) | 0 (0.0%) |
| 6 to 18 Years | 15 (88.2%) | 2 (11.8%) |
| 19 to 25 Years | 6 (85.7%) | 1 (14.3%) |
| 26 to 34 Years | 9 (90.0%) | 1 (10.0%) |
| 35 to 44 Years | 7 (100.0%) | 0 (0.0%) |
| 45 to 54 Years | 29 (100.0%) | 0 (0.0%) |
| 55 to 64 Years | 24 (100.0%) | 0 (0.0%) |
| 65 to 74 Years | 38 (100.0%) | 0 (0.0%) |
| 75 Years and older | 6 (100.0%) | 0 (0.0%) |
| Total | 139 (97.2%) | 4 (2.8%) |
Health Insurance Coverage by Citizenship Status in Burkittsville
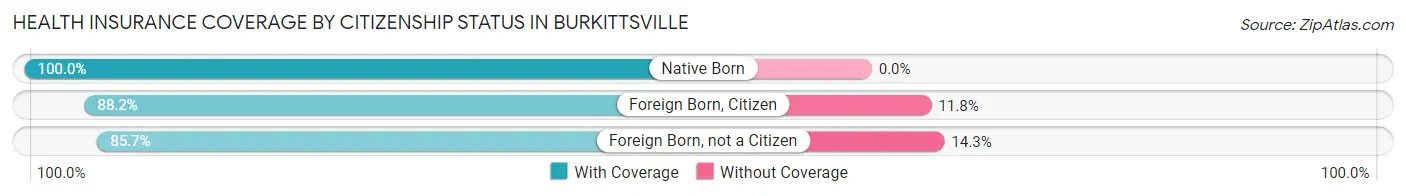
| Citizenship Status | With Coverage | Without Coverage |
| Native Born | 5 (100.0%) | 0 (0.0%) |
| Foreign Born, Citizen | 15 (88.2%) | 2 (11.8%) |
| Foreign Born, not a Citizen | 6 (85.7%) | 1 (14.3%) |
Health Insurance Coverage by Household Income in Burkittsville
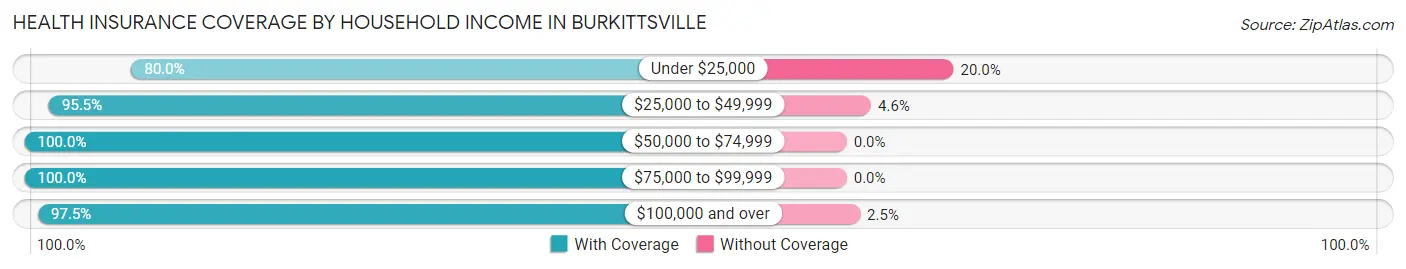
| Household Income | With Coverage | Without Coverage |
| Under $25,000 | 4 (80.0%) | 1 (20.0%) |
| $25,000 to $49,999 | 21 (95.5%) | 1 (4.5%) |
| $50,000 to $74,999 | 25 (100.0%) | 0 (0.0%) |
| $75,000 to $99,999 | 11 (100.0%) | 0 (0.0%) |
| $100,000 and over | 78 (97.5%) | 2 (2.5%) |
Public vs Private Health Insurance Coverage by Age in Burkittsville
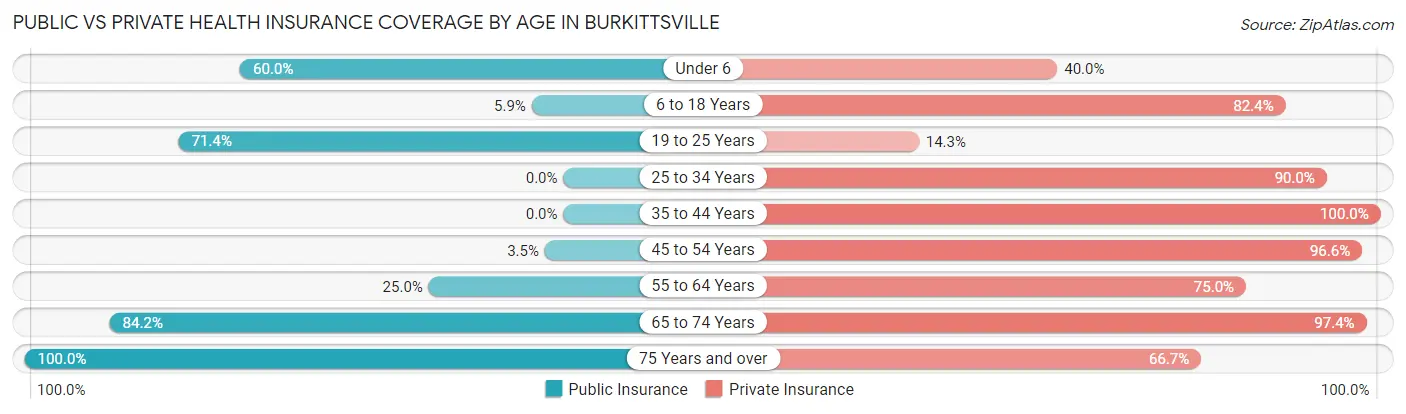
| Age Bracket | Public Insurance | Private Insurance |
| Under 6 | 3 (60.0%) | 2 (40.0%) |
| 6 to 18 Years | 1 (5.9%) | 14 (82.4%) |
| 19 to 25 Years | 5 (71.4%) | 1 (14.3%) |
| 25 to 34 Years | 0 (0.0%) | 9 (90.0%) |
| 35 to 44 Years | 0 (0.0%) | 7 (100.0%) |
| 45 to 54 Years | 1 (3.5%) | 28 (96.6%) |
| 55 to 64 Years | 6 (25.0%) | 18 (75.0%) |
| 65 to 74 Years | 32 (84.2%) | 37 (97.4%) |
| 75 Years and over | 6 (100.0%) | 4 (66.7%) |
| Total | 54 (37.8%) | 120 (83.9%) |
Disability Status by Sex by Age in Burkittsville
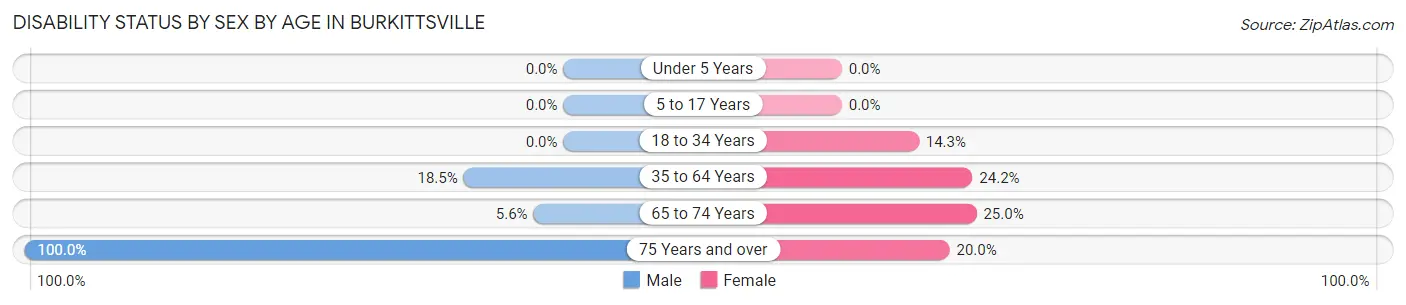
| Age Bracket | Male | Female |
| Under 5 Years | 0 (0.0%) | 0 (0.0%) |
| 5 to 17 Years | 0 (0.0%) | 0 (0.0%) |
| 18 to 34 Years | 0 (0.0%) | 1 (14.3%) |
| 35 to 64 Years | 5 (18.5%) | 8 (24.2%) |
| 65 to 74 Years | 1 (5.6%) | 5 (25.0%) |
| 75 Years and over | 1 (100.0%) | 1 (20.0%) |
Disability Class by Sex by Age in Burkittsville
Disability Class: Hearing Difficulty
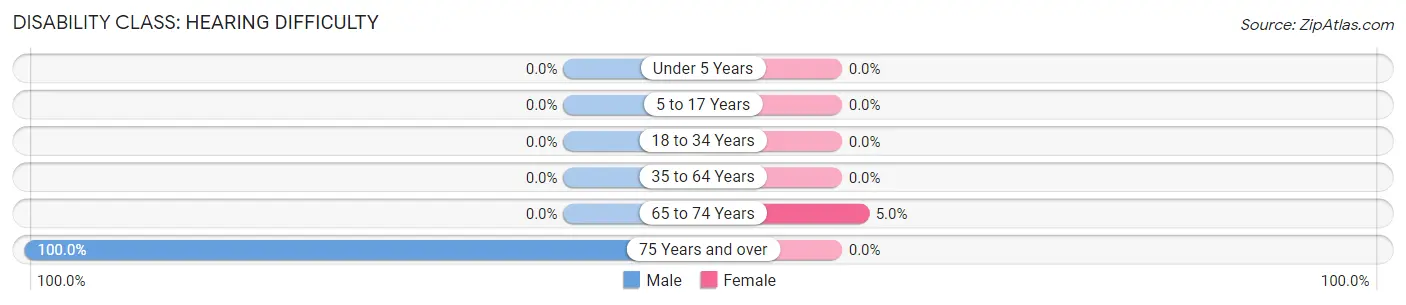
| Age Bracket | Male | Female |
| Under 5 Years | 0 (0.0%) | 0 (0.0%) |
| 5 to 17 Years | 0 (0.0%) | 0 (0.0%) |
| 18 to 34 Years | 0 (0.0%) | 0 (0.0%) |
| 35 to 64 Years | 0 (0.0%) | 0 (0.0%) |
| 65 to 74 Years | 0 (0.0%) | 1 (5.0%) |
| 75 Years and over | 1 (100.0%) | 0 (0.0%) |
Disability Class: Vision Difficulty
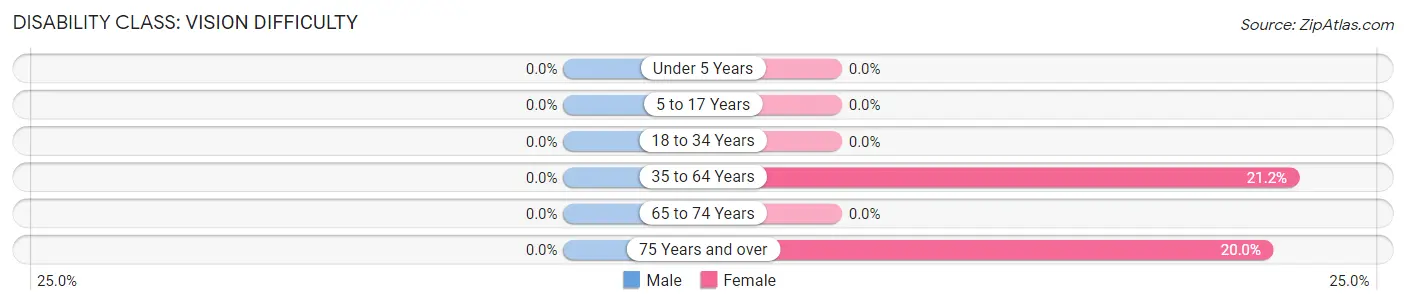
| Age Bracket | Male | Female |
| Under 5 Years | 0 (0.0%) | 0 (0.0%) |
| 5 to 17 Years | 0 (0.0%) | 0 (0.0%) |
| 18 to 34 Years | 0 (0.0%) | 0 (0.0%) |
| 35 to 64 Years | 0 (0.0%) | 7 (21.2%) |
| 65 to 74 Years | 0 (0.0%) | 0 (0.0%) |
| 75 Years and over | 0 (0.0%) | 1 (20.0%) |
Disability Class: Cognitive Difficulty
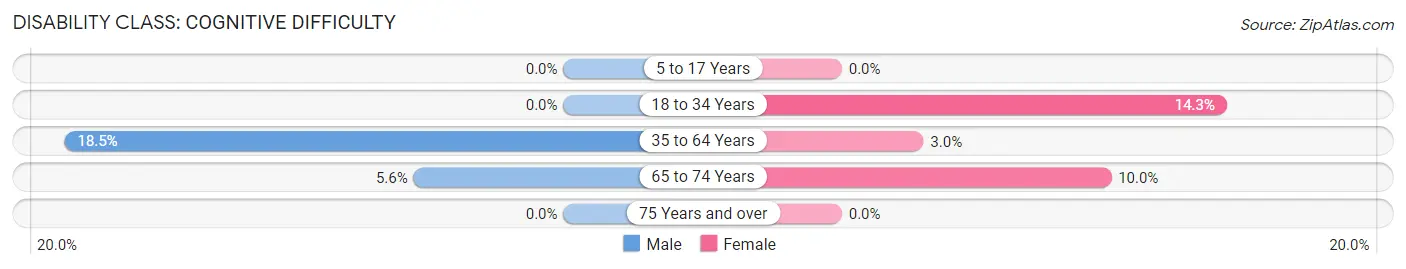
| Age Bracket | Male | Female |
| 5 to 17 Years | 0 (0.0%) | 0 (0.0%) |
| 18 to 34 Years | 0 (0.0%) | 1 (14.3%) |
| 35 to 64 Years | 5 (18.5%) | 1 (3.0%) |
| 65 to 74 Years | 1 (5.6%) | 2 (10.0%) |
| 75 Years and over | 0 (0.0%) | 0 (0.0%) |
Disability Class: Ambulatory Difficulty
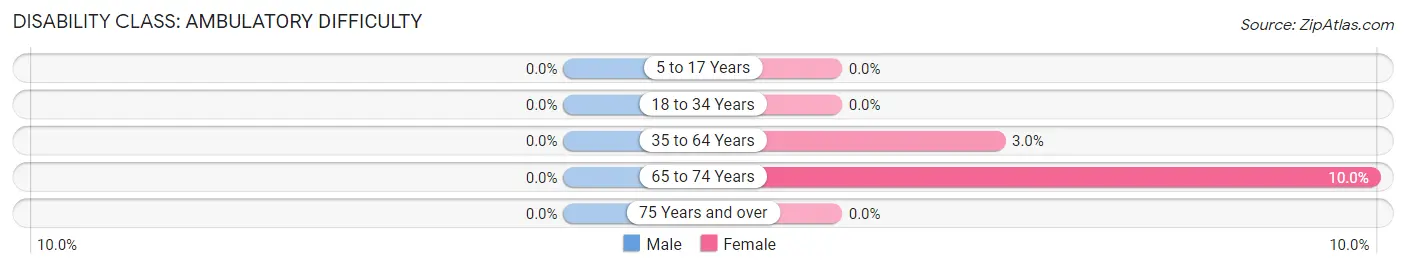
| Age Bracket | Male | Female |
| 5 to 17 Years | 0 (0.0%) | 0 (0.0%) |
| 18 to 34 Years | 0 (0.0%) | 0 (0.0%) |
| 35 to 64 Years | 0 (0.0%) | 1 (3.0%) |
| 65 to 74 Years | 0 (0.0%) | 2 (10.0%) |
| 75 Years and over | 0 (0.0%) | 0 (0.0%) |
Disability Class: Self-Care Difficulty
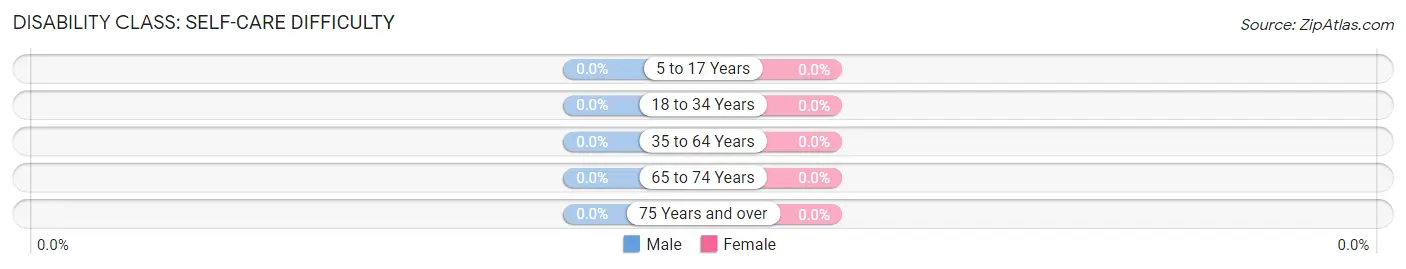
| Age Bracket | Male | Female |
| 5 to 17 Years | 0 (0.0%) | 0 (0.0%) |
| 18 to 34 Years | 0 (0.0%) | 0 (0.0%) |
| 35 to 64 Years | 0 (0.0%) | 0 (0.0%) |
| 65 to 74 Years | 0 (0.0%) | 0 (0.0%) |
| 75 Years and over | 0 (0.0%) | 0 (0.0%) |
Technology Access in Burkittsville
Computing Device Access in Burkittsville
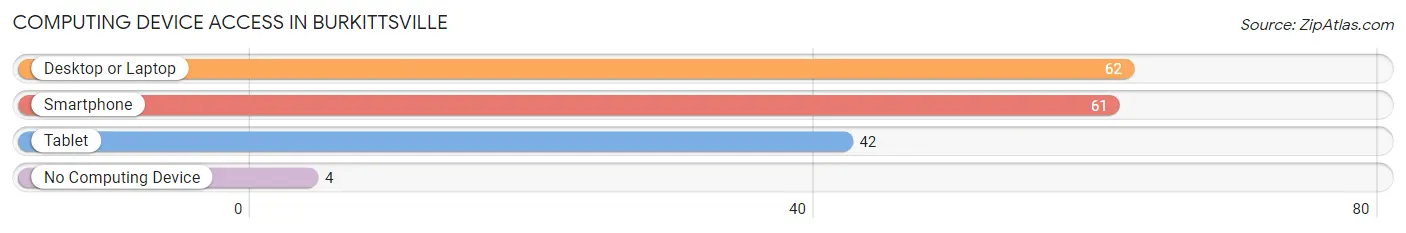
| Device Type | # Households | % Households |
| Desktop or Laptop | 62 | 88.6% |
| Smartphone | 61 | 87.1% |
| Tablet | 42 | 60.0% |
| No Computing Device | 4 | 5.7% |
| Total | 70 | 100.0% |
Internet Access in Burkittsville
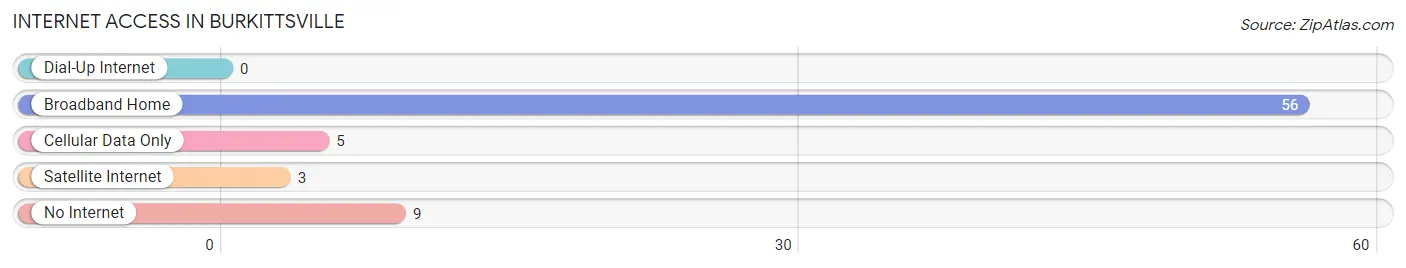
| Internet Type | # Households | % Households |
| Dial-Up Internet | 0 | 0.0% |
| Broadband Home | 56 | 80.0% |
| Cellular Data Only | 5 | 7.1% |
| Satellite Internet | 3 | 4.3% |
| No Internet | 9 | 12.9% |
| Total | 70 | 100.0% |
Burkittsville Summary
Burkittsville, Maryland is a small town located in Frederick County, Maryland, United States. It is situated in the foothills of the Blue Ridge Mountains, approximately 25 miles northwest of Washington, D.C. The town was founded in 1824 and is named after the Burkitt family, who were among the first settlers in the area.
History
The area that is now Burkittsville was originally inhabited by the Susquehannock Indians. The first European settlers arrived in the area in the late 1700s, and the town was officially founded in 1824. The town was named after the Burkitt family, who were among the first settlers in the area.
The town was a small farming community until the Civil War, when it became a strategic location for the Union Army. The Battle of Crampton’s Gap was fought in the area in 1862, and the town was occupied by Union troops for the duration of the war.
After the war, the town slowly began to grow. In 1872, the town was incorporated and the first post office was established. The town continued to grow throughout the late 19th and early 20th centuries, and by the 1950s it had become a popular tourist destination.
Geography
Burkittsville is located in the foothills of the Blue Ridge Mountains in Frederick County, Maryland. The town is situated at an elevation of 1,000 feet above sea level. The town is bordered by the Catoctin Mountains to the north and the Monocacy River to the south.
The town covers an area of 1.2 square miles and is home to a population of approximately 500 people. The town is located approximately 25 miles northwest of Washington, D.C. and is accessible via Interstate 270.
Economy
The economy of Burkittsville is largely based on tourism. The town is home to several historic sites, including the Burkittsville Historic District, which is listed on the National Register of Historic Places. The town is also home to several wineries and vineyards, as well as a number of antique shops and art galleries.
The town is also home to a number of small businesses, including a grocery store, a hardware store, and a few restaurants. The town is also home to a number of bed and breakfasts, as well as a few small hotels.
Demographics
As of the 2010 census, the population of Burkittsville was 498. The racial makeup of the town was 94.4% White, 2.2% African American, 0.2% Native American, 0.6% Asian, 0.2% from other races, and 2.4% from two or more races. Hispanic or Latino of any race were 1.2% of the population.
The median income for a household in the town was $50,000, and the median income for a family was $60,000. The per capita income for the town was $25,000. About 8.3% of families and 10.2% of the population were below the poverty line, including 14.3% of those under age 18 and none of those age 65 or over.
Common Questions
What is Per Capita Income in Burkittsville?
Per Capita income in Burkittsville is $55,248.
What is the Median Family Income in Burkittsville?
Median Family Income in Burkittsville is $144,375.
What is the Median Household income in Burkittsville?
Median Household Income in Burkittsville is $90,000.
What is Income or Wage Gap in Burkittsville?
Income or Wage Gap in Burkittsville is 22.8%.
Women in Burkittsville earn 77.2 cents for every dollar earned by a man.
What is Inequality or Gini Index in Burkittsville?
Inequality or Gini Index in Burkittsville is 0.41.
What is the Total Population of Burkittsville?
Total Population of Burkittsville is 143.
What is the Total Male Population of Burkittsville?
Total Male Population of Burkittsville is 66.
What is the Total Female Population of Burkittsville?
Total Female Population of Burkittsville is 77.
What is the Ratio of Males per 100 Females in Burkittsville?
There are 85.71 Males per 100 Females in Burkittsville.
What is the Ratio of Females per 100 Males in Burkittsville?
There are 116.67 Females per 100 Males in Burkittsville.
What is the Median Population Age in Burkittsville?
Median Population Age in Burkittsville is 54.7 Years.
What is the Average Family Size in Burkittsville
Average Family Size in Burkittsville is 2.6 People.
What is the Average Household Size in Burkittsville
Average Household Size in Burkittsville is 2.0 People.
How Large is the Labor Force in Burkittsville?
There are 82 People in the Labor Forcein in Burkittsville.
What is the Percentage of People in the Labor Force in Burkittsville?
65.1% of People are in the Labor Force in Burkittsville.
What is the Unemployment Rate in Burkittsville?
Unemployment Rate in Burkittsville is 13.4%.