University Park, MD Map & Demographics
University Park Map
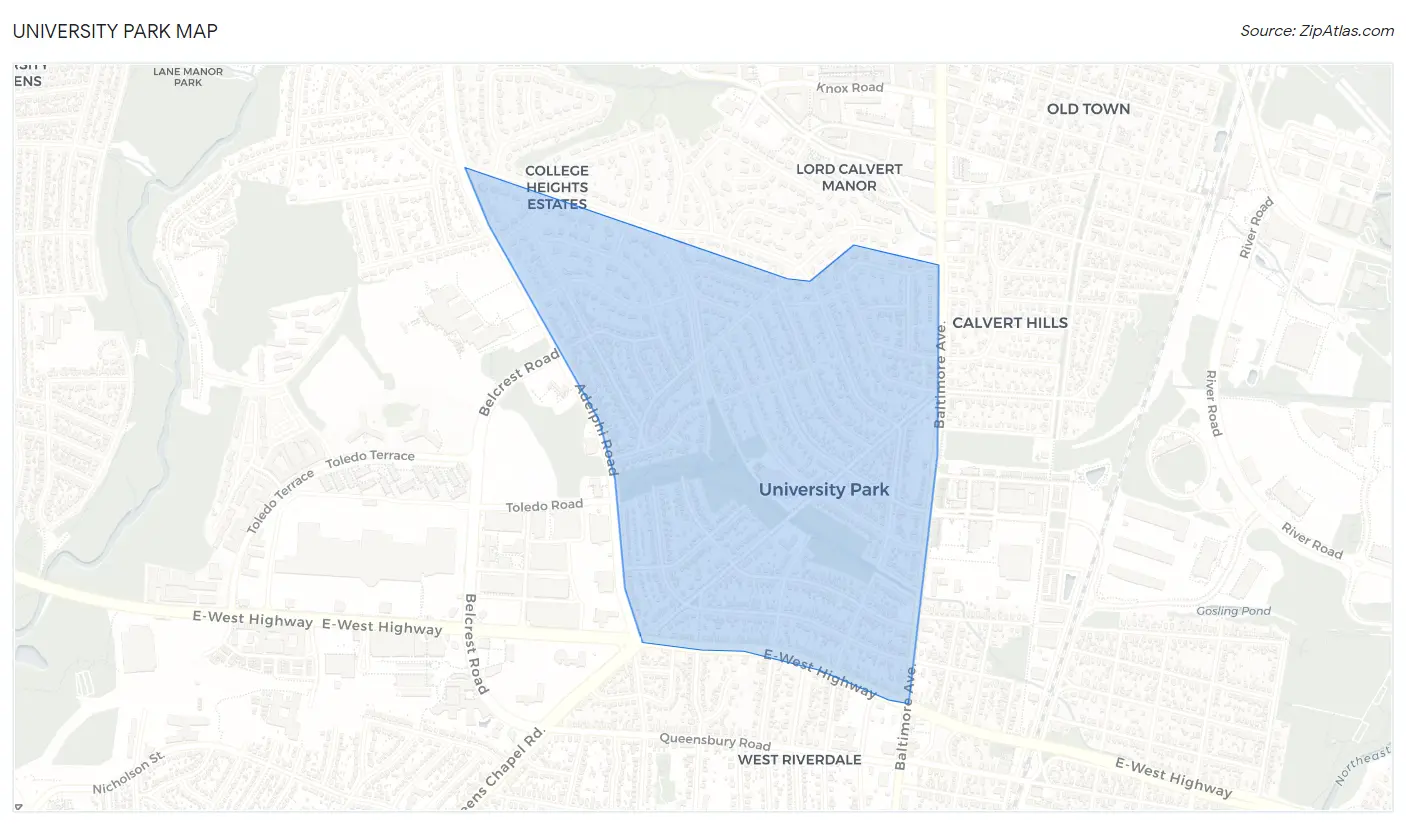
University Park Overview
$87,613
PER CAPITA INCOME
$213,750
AVG FAMILY INCOME
$191,205
AVG HOUSEHOLD INCOME
3.3%
WAGE / INCOME GAP [ % ]
96.7¢/ $1
WAGE / INCOME GAP [ $ ]
0.35
INEQUALITY / GINI INDEX
2,610
TOTAL POPULATION
1,339
MALE POPULATION
1,271
FEMALE POPULATION
105.35
MALES / 100 FEMALES
94.92
FEMALES / 100 MALES
47.0
MEDIAN AGE
2.9
AVG FAMILY SIZE
2.6
AVG HOUSEHOLD SIZE
1,337
LABOR FORCE [ PEOPLE ]
63.3%
PERCENT IN LABOR FORCE
0.7%
UNEMPLOYMENT RATE
Income in University Park
Income Overview in University Park
Per Capita Income in University Park is $87,613, while median incomes of families and households are $213,750 and $191,205 respectively.
| Characteristic | Number | Measure |
| Per Capita Income | 2,610 | $87,613 |
| Median Family Income | 784 | $213,750 |
| Mean Family Income | 784 | $246,974 |
| Median Household Income | 997 | $191,205 |
| Mean Household Income | 997 | $222,069 |
| Income Deficit | 784 | $0 |
| Wage / Income Gap (%) | 2,610 | 3.30% |
| Wage / Income Gap ($) | 2,610 | 96.70¢ per $1 |
| Gini / Inequality Index | 2,610 | 0.35 |
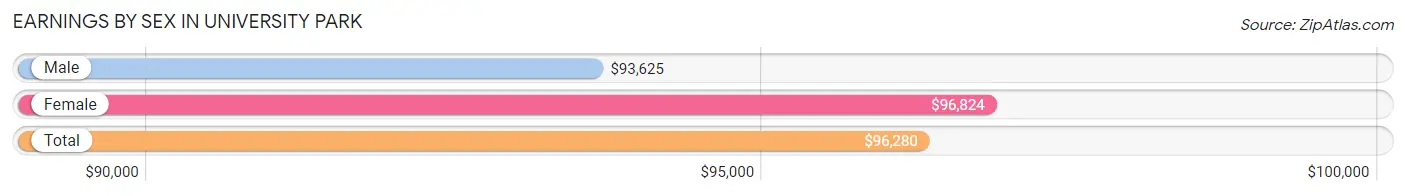
Earnings by Sex in University Park
Average Earnings in University Park are $96,280, $93,625 for men and $96,824 for women, a difference of 3.3%.
| Sex | Number | Average Earnings |
| Male | 847 (59.1%) | $93,625 |
| Female | 586 (40.9%) | $96,824 |
| Total | 1,433 (100.0%) | $96,280 |
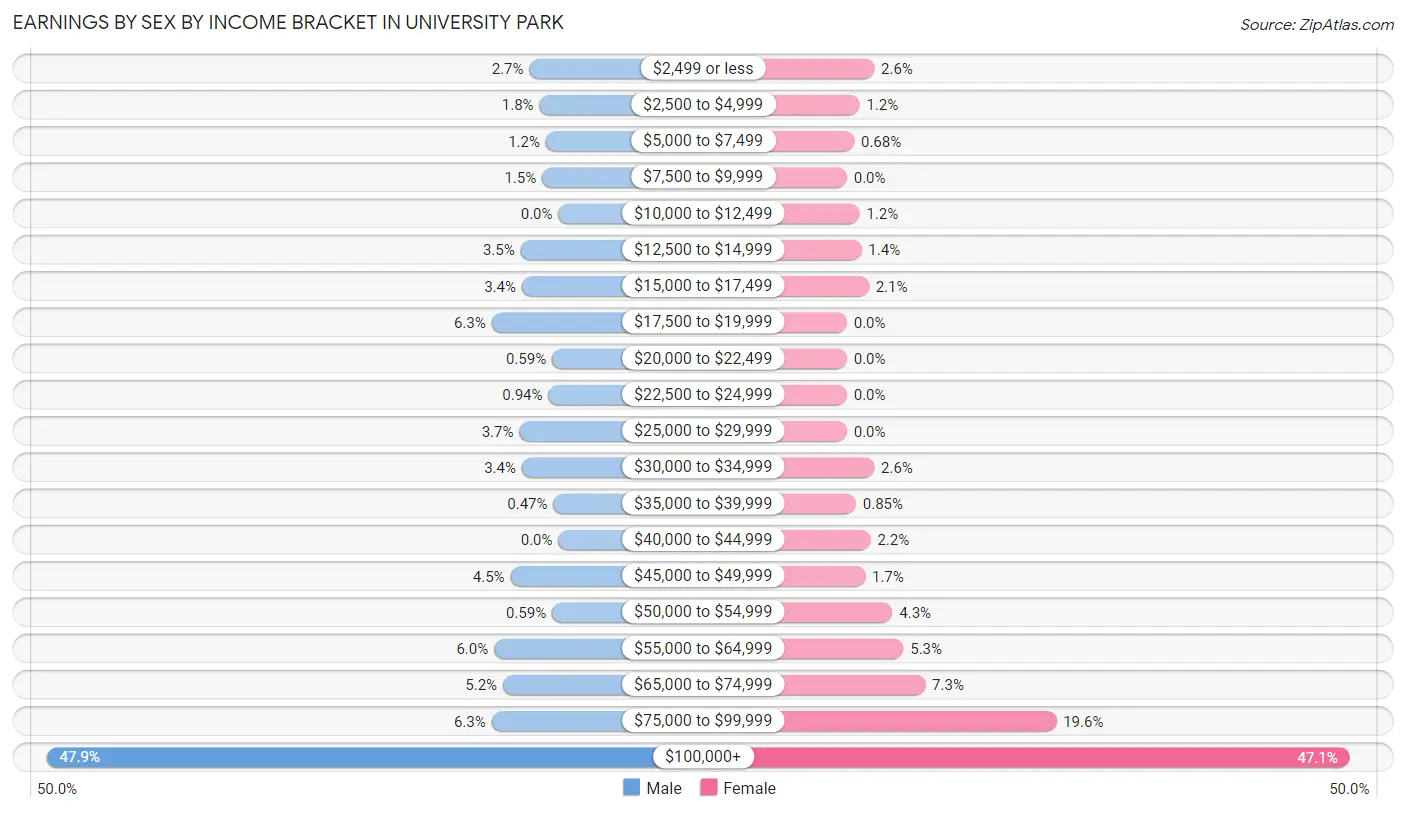
Earnings by Sex by Income Bracket in University Park
The most common earnings brackets in University Park are $100,000+ for men (406 | 47.9%) and $100,000+ for women (276 | 47.1%).
| Income | Male | Female |
| $2,499 or less | 23 (2.7%) | 15 (2.6%) |
| $2,500 to $4,999 | 15 (1.8%) | 7 (1.2%) |
| $5,000 to $7,499 | 10 (1.2%) | 4 (0.7%) |
| $7,500 to $9,999 | 13 (1.5%) | 0 (0.0%) |
| $10,000 to $12,499 | 0 (0.0%) | 7 (1.2%) |
| $12,500 to $14,999 | 30 (3.5%) | 8 (1.4%) |
| $15,000 to $17,499 | 29 (3.4%) | 12 (2.1%) |
| $17,500 to $19,999 | 53 (6.3%) | 0 (0.0%) |
| $20,000 to $22,499 | 5 (0.6%) | 0 (0.0%) |
| $22,500 to $24,999 | 8 (0.9%) | 0 (0.0%) |
| $25,000 to $29,999 | 31 (3.7%) | 0 (0.0%) |
| $30,000 to $34,999 | 29 (3.4%) | 15 (2.6%) |
| $35,000 to $39,999 | 4 (0.5%) | 5 (0.9%) |
| $40,000 to $44,999 | 0 (0.0%) | 13 (2.2%) |
| $45,000 to $49,999 | 38 (4.5%) | 10 (1.7%) |
| $50,000 to $54,999 | 5 (0.6%) | 25 (4.3%) |
| $55,000 to $64,999 | 51 (6.0%) | 31 (5.3%) |
| $65,000 to $74,999 | 44 (5.2%) | 43 (7.3%) |
| $75,000 to $99,999 | 53 (6.3%) | 115 (19.6%) |
| $100,000+ | 406 (47.9%) | 276 (47.1%) |
| Total | 847 (100.0%) | 586 (100.0%) |
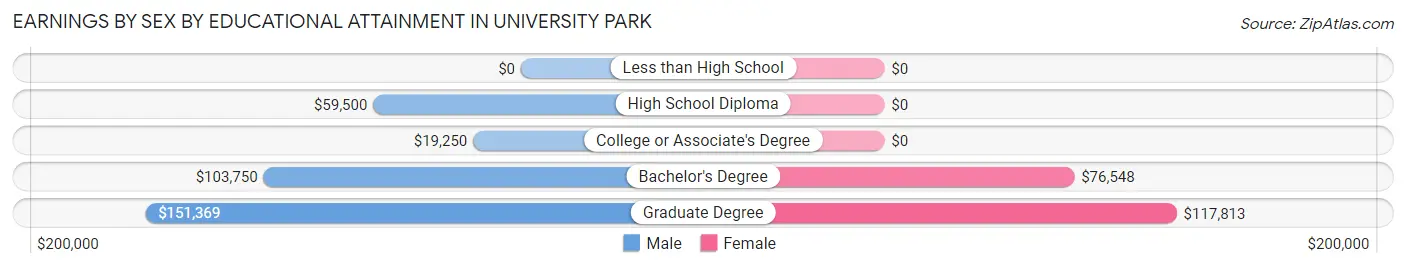
Earnings by Sex by Educational Attainment in University Park
Average earnings in University Park are $101,875 for men and $98,393 for women, a difference of 3.4%. Men with an educational attainment of graduate degree enjoy the highest average annual earnings of $151,369, while those with college or associate's degree education earn the least with $19,250. Women with an educational attainment of graduate degree earn the most with the average annual earnings of $117,813, while those with bachelor's degree education have the smallest earnings of $76,548.
| Educational Attainment | Male Income | Female Income |
| Less than High School | - | - |
| High School Diploma | $59,500 | $0 |
| College or Associate's Degree | $19,250 | $0 |
| Bachelor's Degree | $103,750 | $76,548 |
| Graduate Degree | $151,369 | $117,813 |
| Total | $101,875 | $98,393 |
Family Income in University Park
Family Income Brackets in University Park
According to the University Park family income data, there are 421 families falling into the $200,000+ income range, which is the most common income bracket and makes up 53.7% of all families.
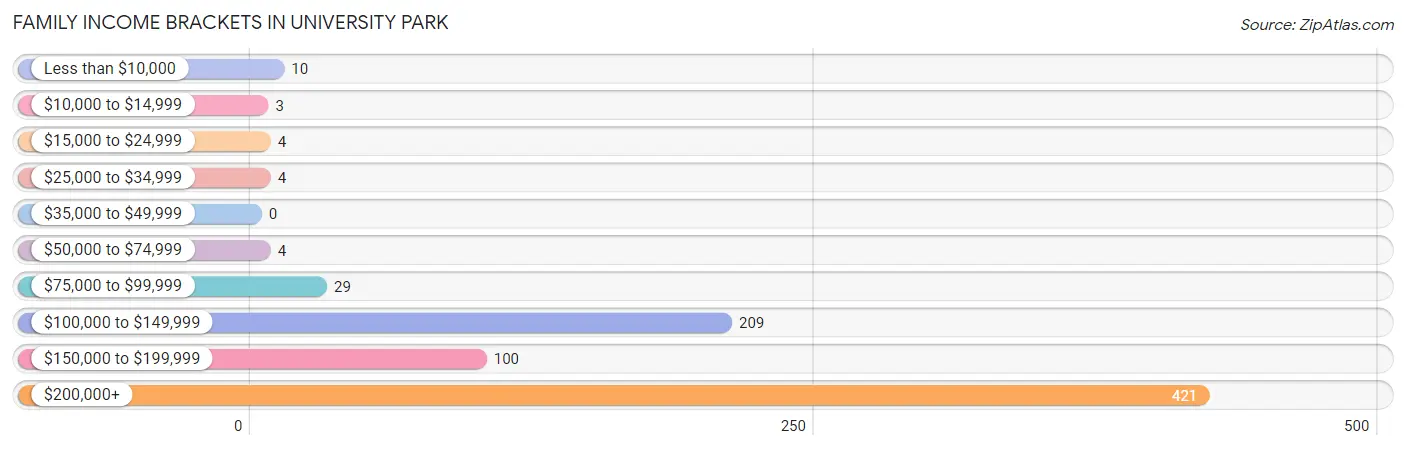
| Income Bracket | # Families | % Families |
| Less than $10,000 | 10 | 1.3% |
| $10,000 to $14,999 | 3 | 0.4% |
| $15,000 to $24,999 | 4 | 0.5% |
| $25,000 to $34,999 | 4 | 0.5% |
| $35,000 to $49,999 | 0 | 0.0% |
| $50,000 to $74,999 | 4 | 0.5% |
| $75,000 to $99,999 | 29 | 3.7% |
| $100,000 to $149,999 | 209 | 26.7% |
| $150,000 to $199,999 | 100 | 12.8% |
| $200,000+ | 421 | 53.7% |
Family Income by Famaliy Size in University Park
4-person families (120 | 15.3%) account for the highest median family income in University Park with $250,001 per family, while 2-person families (450 | 57.4%) have the highest median income of $96,500 per family member.
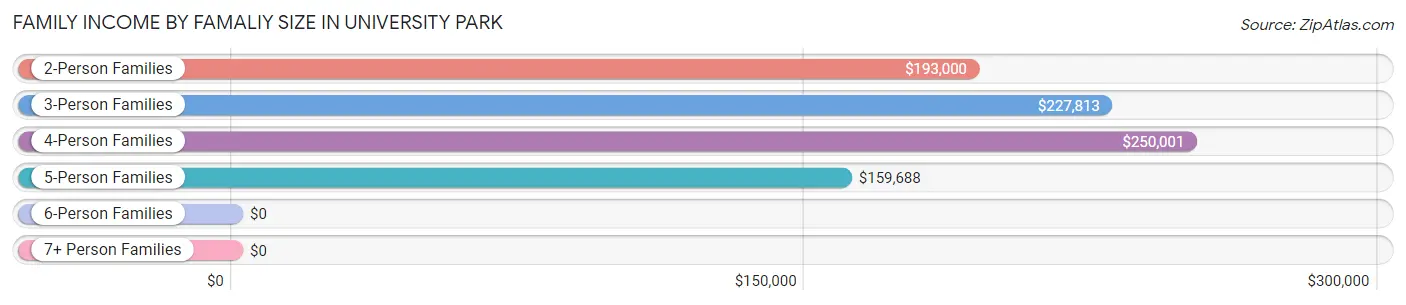
| Income Bracket | # Families | Median Income |
| 2-Person Families | 450 (57.4%) | $193,000 |
| 3-Person Families | 137 (17.5%) | $227,813 |
| 4-Person Families | 120 (15.3%) | $250,001 |
| 5-Person Families | 45 (5.7%) | $159,688 |
| 6-Person Families | 23 (2.9%) | $0 |
| 7+ Person Families | 9 (1.1%) | $0 |
| Total | 784 (100.0%) | $213,750 |
Family Income by Number of Earners in University Park
The median family income in University Park is $213,750, with families comprising 2 earners (391) having the highest median family income of $250,001, while families with no earners (180) have the lowest median family income of $131,596, accounting for 49.9% and 23.0% of families, respectively.
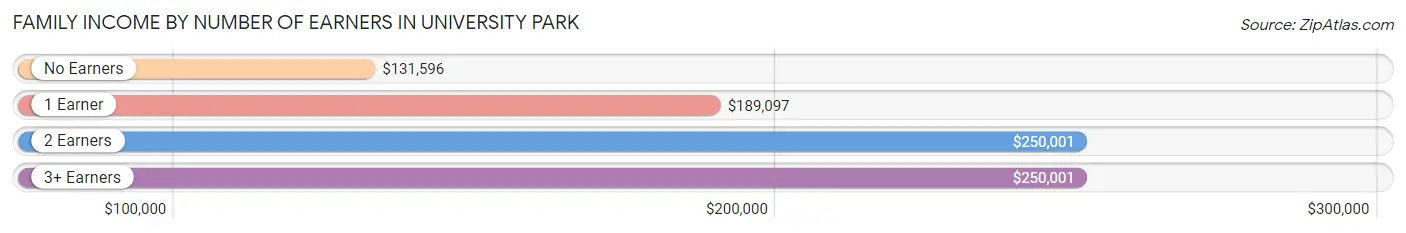
| Number of Earners | # Families | Median Income |
| No Earners | 180 (23.0%) | $131,596 |
| 1 Earner | 159 (20.3%) | $189,097 |
| 2 Earners | 391 (49.9%) | $250,001 |
| 3+ Earners | 54 (6.9%) | $250,001 |
| Total | 784 (100.0%) | $213,750 |
Household Income in University Park
Household Income Brackets in University Park
With 465 households falling in the category, the $200,000+ income range is the most frequent in University Park, accounting for 46.6% of all households.
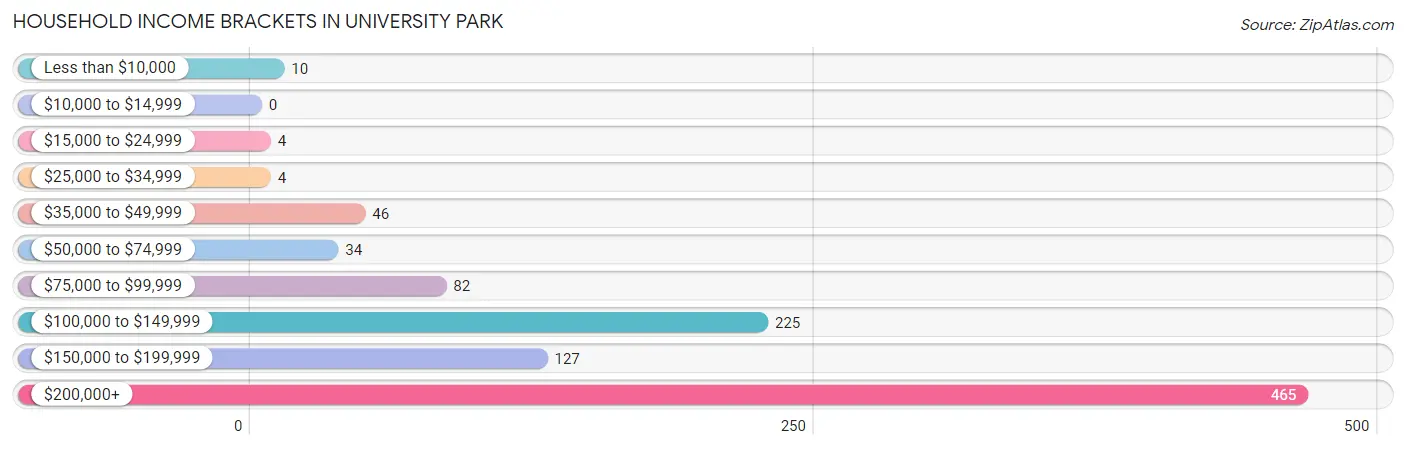
| Income Bracket | # Households | % Households |
| Less than $10,000 | 10 | 1.0% |
| $10,000 to $14,999 | 0 | 0.0% |
| $15,000 to $24,999 | 4 | 0.4% |
| $25,000 to $34,999 | 4 | 0.4% |
| $35,000 to $49,999 | 46 | 4.6% |
| $50,000 to $74,999 | 34 | 3.4% |
| $75,000 to $99,999 | 82 | 8.2% |
| $100,000 to $149,999 | 225 | 22.6% |
| $150,000 to $199,999 | 127 | 12.7% |
| $200,000+ | 465 | 46.6% |
Household Income by Householder Age in University Park
The median household income in University Park is $191,205, with the highest median household income of $228,977 found in the 25 to 44 years age bracket for the primary householder. A total of 239 households (24.0%) fall into this category.
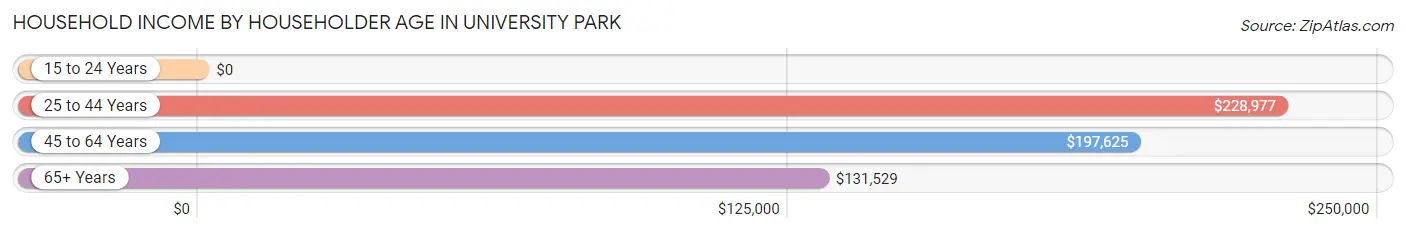
| Income Bracket | # Households | Median Income |
| 15 to 24 Years | 0 (0.0%) | $0 |
| 25 to 44 Years | 239 (24.0%) | $228,977 |
| 45 to 64 Years | 377 (37.8%) | $197,625 |
| 65+ Years | 381 (38.2%) | $131,529 |
| Total | 997 (100.0%) | $191,205 |
Poverty in University Park
Income Below Poverty by Sex and Age in University Park
With 1.6% poverty level for males and 2.3% for females among the residents of University Park, 18 to 24 year old males and 18 to 24 year old females are the most vulnerable to poverty, with 8 males (23.5%) and 6 females (17.1%) in their respective age groups living below the poverty level.
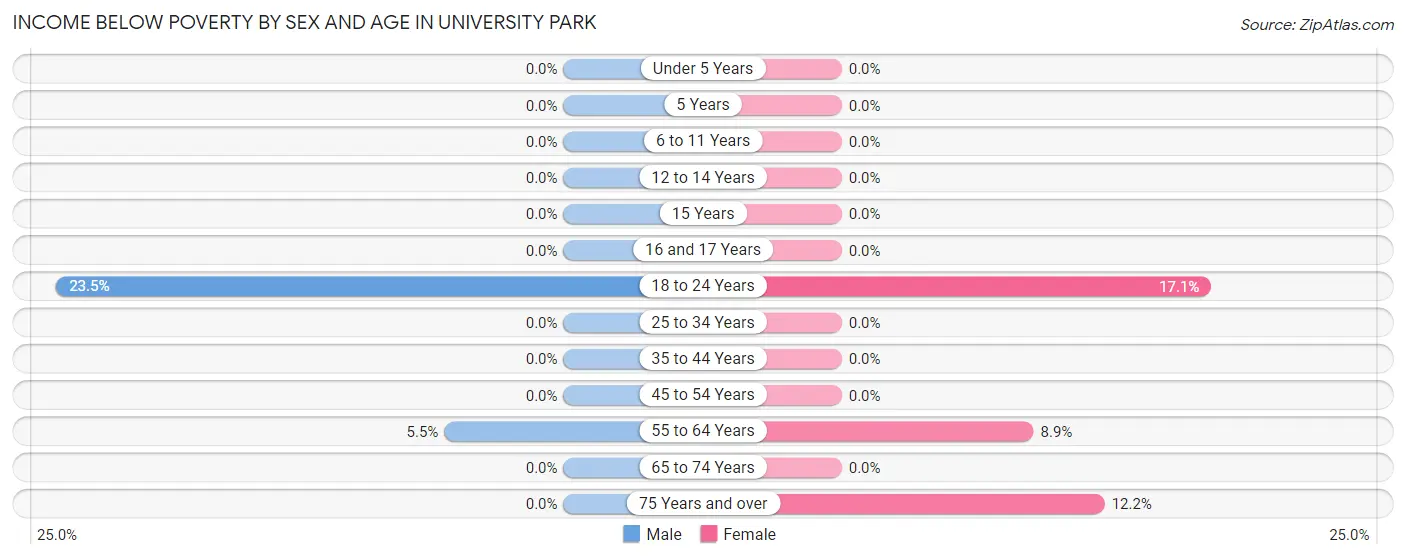
| Age Bracket | Male | Female |
| Under 5 Years | 0 (0.0%) | 0 (0.0%) |
| 5 Years | 0 (0.0%) | 0 (0.0%) |
| 6 to 11 Years | 0 (0.0%) | 0 (0.0%) |
| 12 to 14 Years | 0 (0.0%) | 0 (0.0%) |
| 15 Years | 0 (0.0%) | 0 (0.0%) |
| 16 and 17 Years | 0 (0.0%) | 0 (0.0%) |
| 18 to 24 Years | 8 (23.5%) | 6 (17.1%) |
| 25 to 34 Years | 0 (0.0%) | 0 (0.0%) |
| 35 to 44 Years | 0 (0.0%) | 0 (0.0%) |
| 45 to 54 Years | 0 (0.0%) | 0 (0.0%) |
| 55 to 64 Years | 14 (5.5%) | 13 (8.9%) |
| 65 to 74 Years | 0 (0.0%) | 0 (0.0%) |
| 75 Years and over | 0 (0.0%) | 10 (12.2%) |
| Total | 22 (1.6%) | 29 (2.3%) |
Income Above Poverty by Sex and Age in University Park
According to the poverty statistics in University Park, males aged under 5 years and females aged under 5 years are the age groups that are most secure financially, with 100.0% of males and 100.0% of females in these age groups living above the poverty line.
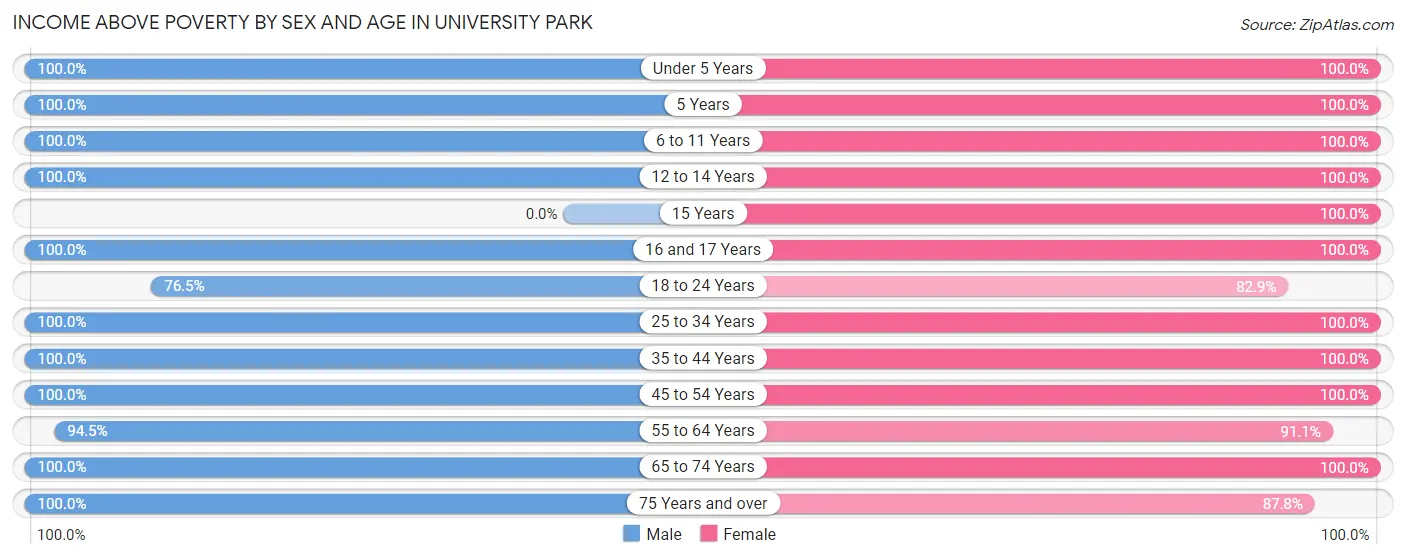
| Age Bracket | Male | Female |
| Under 5 Years | 82 (100.0%) | 59 (100.0%) |
| 5 Years | 24 (100.0%) | 19 (100.0%) |
| 6 to 11 Years | 82 (100.0%) | 126 (100.0%) |
| 12 to 14 Years | 53 (100.0%) | 40 (100.0%) |
| 15 Years | 0 (0.0%) | 13 (100.0%) |
| 16 and 17 Years | 17 (100.0%) | 13 (100.0%) |
| 18 to 24 Years | 26 (76.5%) | 29 (82.9%) |
| 25 to 34 Years | 115 (100.0%) | 110 (100.0%) |
| 35 to 44 Years | 245 (100.0%) | 187 (100.0%) |
| 45 to 54 Years | 184 (100.0%) | 199 (100.0%) |
| 55 to 64 Years | 239 (94.5%) | 133 (91.1%) |
| 65 to 74 Years | 172 (100.0%) | 242 (100.0%) |
| 75 Years and over | 78 (100.0%) | 72 (87.8%) |
| Total | 1,317 (98.4%) | 1,242 (97.7%) |
Income Below Poverty Among Married-Couple Families in University Park
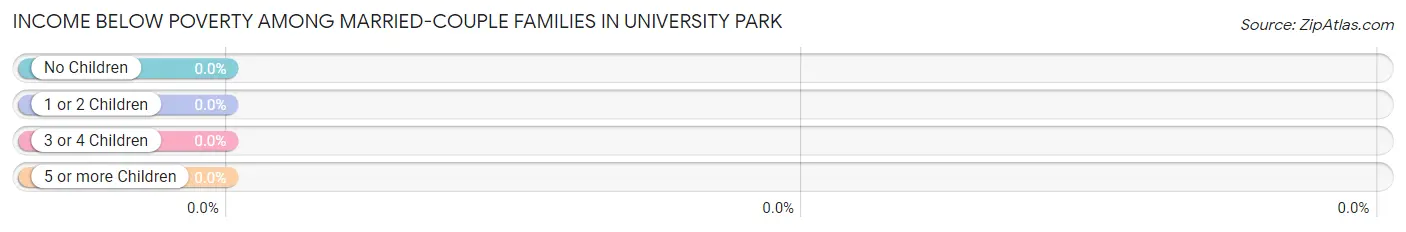
| Children | Above Poverty | Below Poverty |
| No Children | 488 (100.0%) | 0 (0.0%) |
| 1 or 2 Children | 204 (100.0%) | 0 (0.0%) |
| 3 or 4 Children | 50 (100.0%) | 0 (0.0%) |
| 5 or more Children | 0 (0.0%) | 0 (0.0%) |
| Total | 742 (100.0%) | 0 (0.0%) |
Income Below Poverty Among Single-Parent Households in University Park
According to the poverty data in University Park, 42.9% or 3 single-father households and 28.6% or 10 single-mother households are living below the poverty line. Among single-father households, those with no children have the highest poverty rate, with 3 households (100.0%) experiencing poverty. Likewise, among single-mother households, those with no children have the highest poverty rate, with 10 households (32.3%) falling below the poverty line.
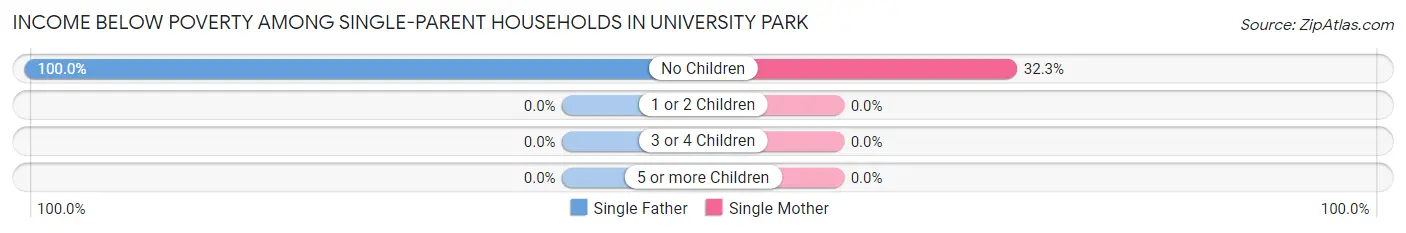
| Children | Single Father | Single Mother |
| No Children | 3 (100.0%) | 10 (32.3%) |
| 1 or 2 Children | 0 (0.0%) | 0 (0.0%) |
| 3 or 4 Children | 0 (0.0%) | 0 (0.0%) |
| 5 or more Children | 0 (0.0%) | 0 (0.0%) |
| Total | 3 (42.9%) | 10 (28.6%) |
Income Below Poverty Among Married-Couple vs Single-Parent Households in University Park
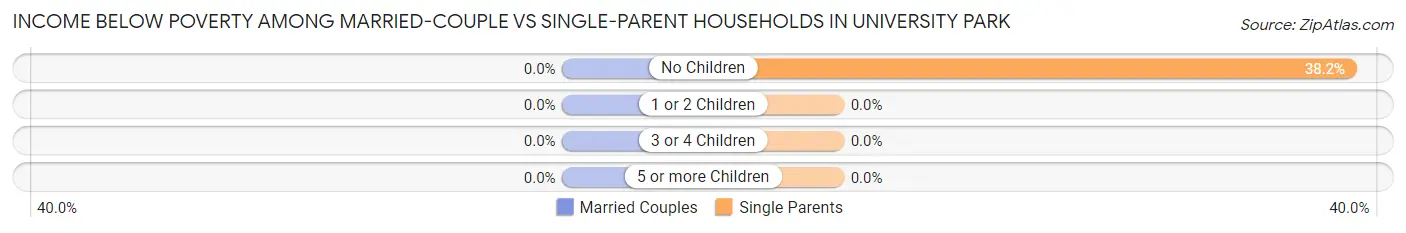
| Children | Married-Couple Families | Single-Parent Households |
| No Children | 0 (0.0%) | 13 (38.2%) |
| 1 or 2 Children | 0 (0.0%) | 0 (0.0%) |
| 3 or 4 Children | 0 (0.0%) | 0 (0.0%) |
| 5 or more Children | 0 (0.0%) | 0 (0.0%) |
| Total | 0 (0.0%) | 13 (30.9%) |
Race in University Park
The most populous races in University Park are White / Caucasian (1,845 | 70.7%), Black / African American (404 | 15.5%), and Hispanic or Latino (265 | 10.2%).
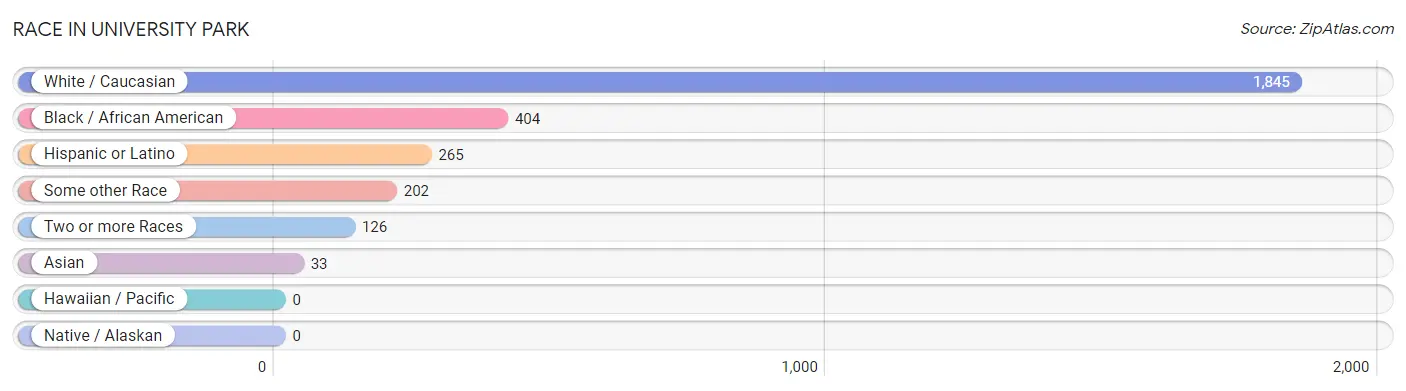
| Race | # Population | % Population |
| Asian | 33 | 1.3% |
| Black / African American | 404 | 15.5% |
| Hawaiian / Pacific | 0 | 0.0% |
| Hispanic or Latino | 265 | 10.2% |
| Native / Alaskan | 0 | 0.0% |
| White / Caucasian | 1,845 | 70.7% |
| Two or more Races | 126 | 4.8% |
| Some other Race | 202 | 7.7% |
| Total | 2,610 | 100.0% |
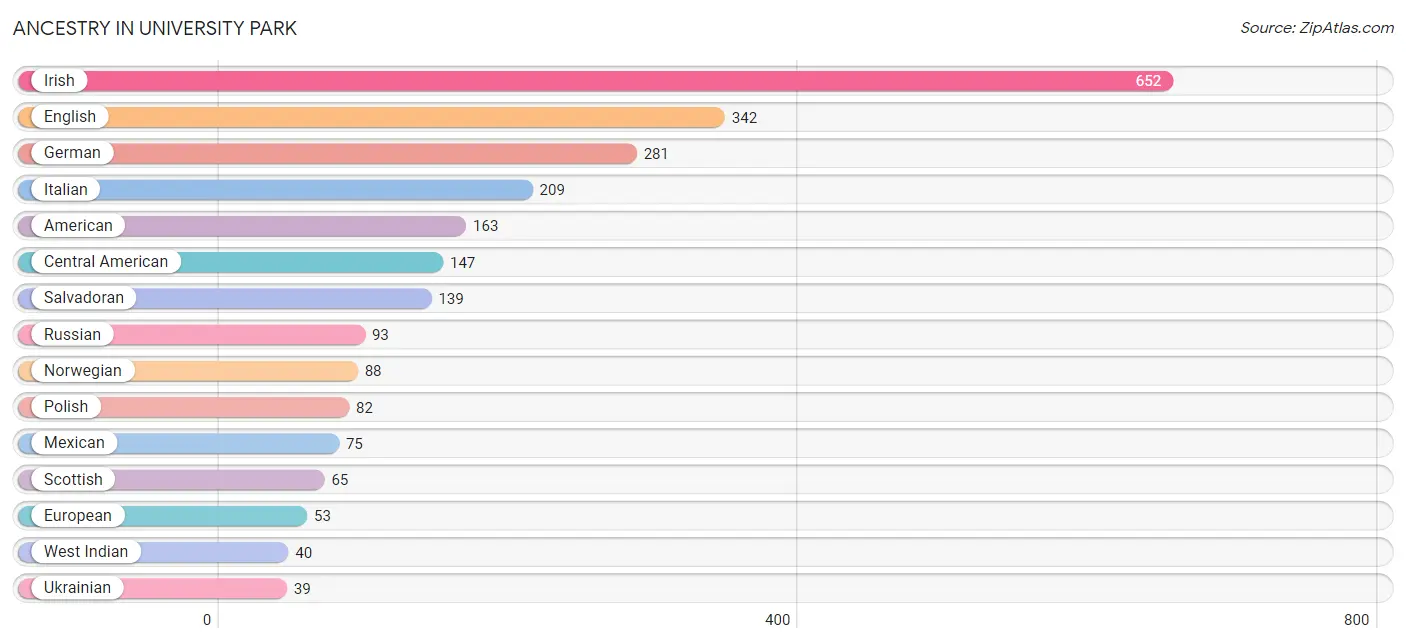
Ancestry in University Park
The most populous ancestries reported in University Park are Irish (652 | 25.0%), English (342 | 13.1%), German (281 | 10.8%), Italian (209 | 8.0%), and American (163 | 6.2%), together accounting for 63.1% of all University Park residents.
| Ancestry | # Population | % Population |
| Alsatian | 4 | 0.2% |
| American | 163 | 6.2% |
| Arab | 28 | 1.1% |
| Austrian | 8 | 0.3% |
| Belgian | 4 | 0.2% |
| Bhutanese | 4 | 0.2% |
| British | 26 | 1.0% |
| Burmese | 9 | 0.3% |
| Central American | 147 | 5.6% |
| Chilean | 27 | 1.0% |
| Croatian | 5 | 0.2% |
| Czech | 27 | 1.0% |
| Danish | 31 | 1.2% |
| Dutch | 8 | 0.3% |
| Eastern European | 13 | 0.5% |
| Egyptian | 4 | 0.2% |
| English | 342 | 13.1% |
| European | 53 | 2.0% |
| French | 32 | 1.2% |
| French Canadian | 20 | 0.8% |
| German | 281 | 10.8% |
| Greek | 17 | 0.6% |
| Honduran | 8 | 0.3% |
| Hungarian | 7 | 0.3% |
| Indian (Asian) | 34 | 1.3% |
| Irish | 652 | 25.0% |
| Italian | 209 | 8.0% |
| Lebanese | 4 | 0.2% |
| Macedonian | 29 | 1.1% |
| Maltese | 5 | 0.2% |
| Mexican | 75 | 2.9% |
| Norwegian | 88 | 3.4% |
| Pakistani | 22 | 0.8% |
| Polish | 82 | 3.1% |
| Portuguese | 4 | 0.2% |
| Romanian | 8 | 0.3% |
| Russian | 93 | 3.6% |
| Salvadoran | 139 | 5.3% |
| Scotch-Irish | 33 | 1.3% |
| Scottish | 65 | 2.5% |
| Slavic | 10 | 0.4% |
| South American | 27 | 1.0% |
| Spaniard | 1 | 0.0% |
| Spanish | 10 | 0.4% |
| Sri Lankan | 29 | 1.1% |
| Subsaharan African | 7 | 0.3% |
| Swedish | 11 | 0.4% |
| Swiss | 5 | 0.2% |
| Syrian | 20 | 0.8% |
| Thai | 7 | 0.3% |
| Ukrainian | 39 | 1.5% |
| Welsh | 32 | 1.2% |
| West Indian | 40 | 1.5% |
| Yugoslavian | 7 | 0.3% | View All 54 Rows |
Immigrants in University Park
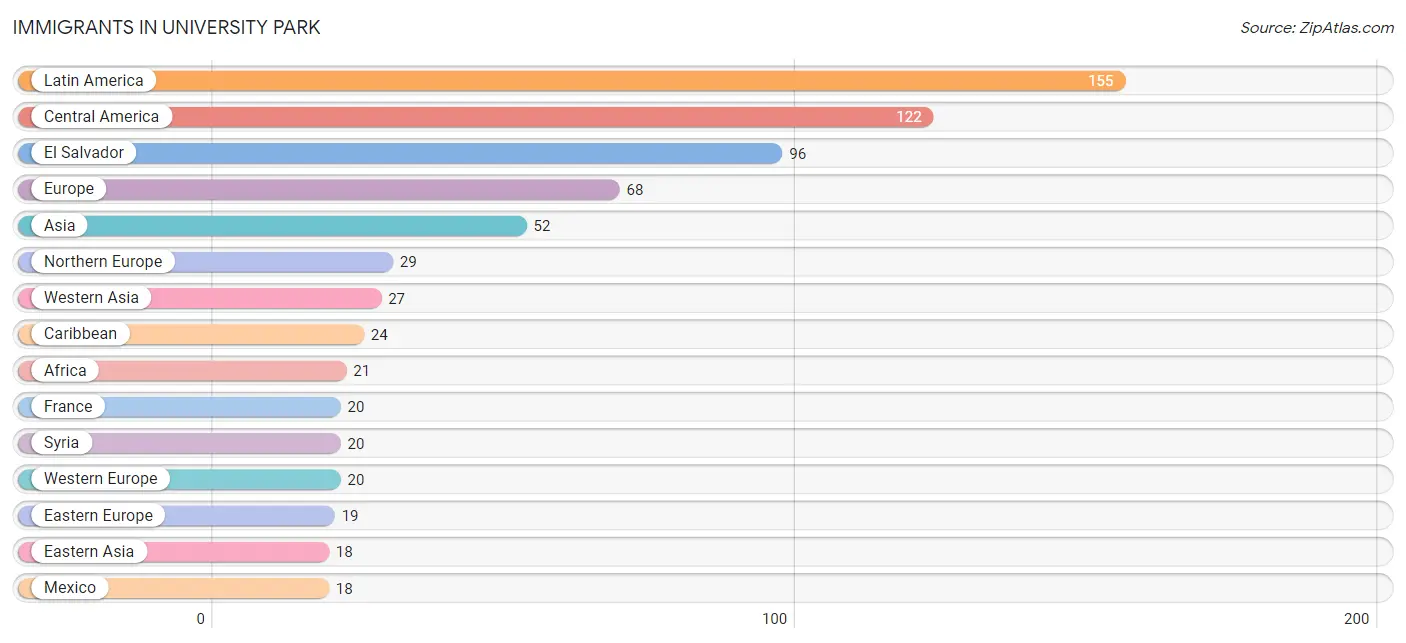
The most numerous immigrant groups reported in University Park came from Latin America (155 | 5.9%), Central America (122 | 4.7%), El Salvador (96 | 3.7%), Europe (68 | 2.6%), and Asia (52 | 2.0%), together accounting for 18.9% of all University Park residents.
| Immigration Origin | # Population | % Population |
| Africa | 21 | 0.8% |
| Asia | 52 | 2.0% |
| Bosnia and Herzegovina | 3 | 0.1% |
| Brazil | 4 | 0.2% |
| Caribbean | 24 | 0.9% |
| Central America | 122 | 4.7% |
| China | 9 | 0.3% |
| Eastern Africa | 7 | 0.3% |
| Eastern Asia | 18 | 0.7% |
| Eastern Europe | 19 | 0.7% |
| Egypt | 4 | 0.2% |
| El Salvador | 96 | 3.7% |
| Europe | 68 | 2.6% |
| France | 20 | 0.8% |
| Honduras | 8 | 0.3% |
| Hong Kong | 5 | 0.2% |
| India | 7 | 0.3% |
| Ireland | 10 | 0.4% |
| Korea | 9 | 0.3% |
| Latin America | 155 | 5.9% |
| Mexico | 18 | 0.7% |
| Nigeria | 1 | 0.0% |
| North Macedonia | 4 | 0.2% |
| Northern Africa | 4 | 0.2% |
| Northern Europe | 29 | 1.1% |
| Peru | 5 | 0.2% |
| South Africa | 9 | 0.3% |
| South America | 9 | 0.3% |
| South Central Asia | 7 | 0.3% |
| Syria | 20 | 0.8% |
| Trinidad and Tobago | 8 | 0.3% |
| Turkey | 7 | 0.3% |
| Western Africa | 1 | 0.0% |
| Western Asia | 27 | 1.0% |
| Western Europe | 20 | 0.8% | View All 35 Rows |
Sex and Age in University Park
Sex and Age in University Park
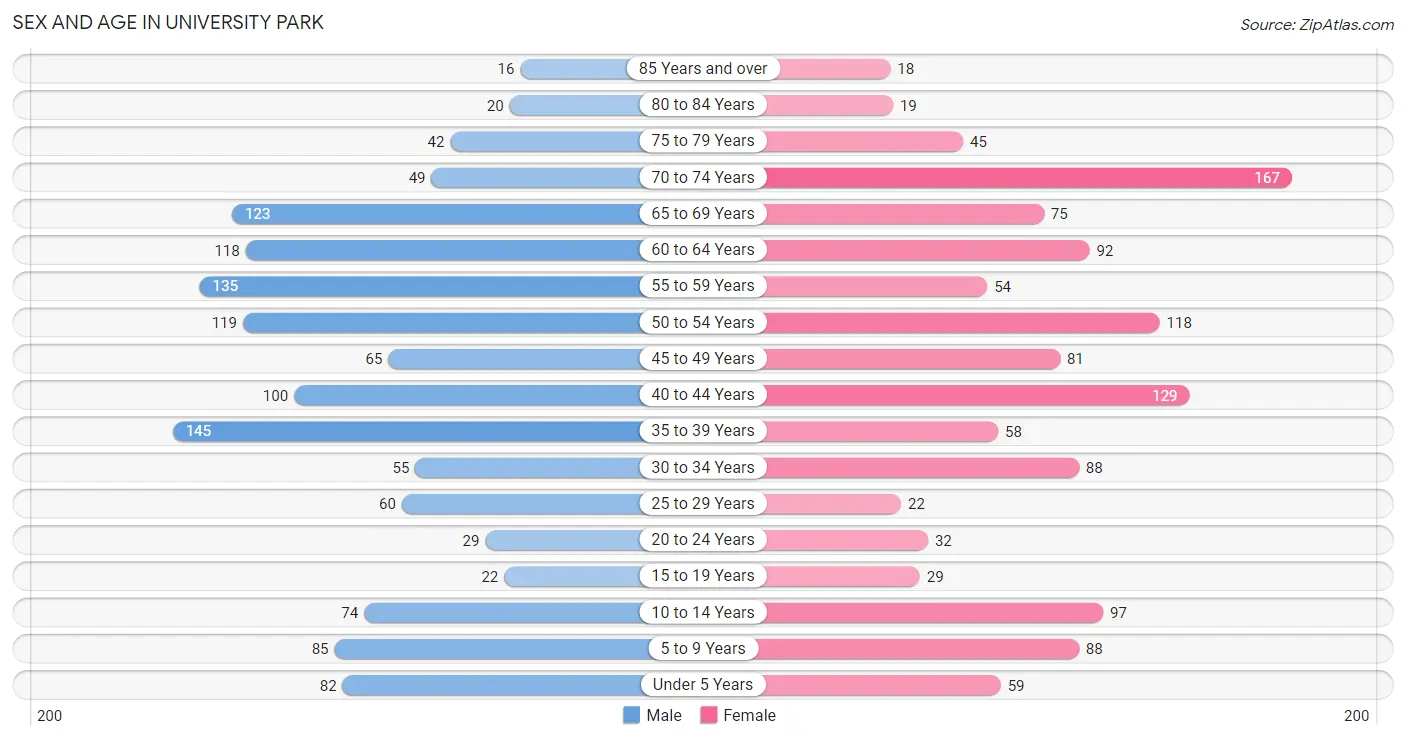
The most populous age groups in University Park are 35 to 39 Years (145 | 10.8%) for men and 70 to 74 Years (167 | 13.1%) for women.
| Age Bracket | Male | Female |
| Under 5 Years | 82 (6.1%) | 59 (4.6%) |
| 5 to 9 Years | 85 (6.4%) | 88 (6.9%) |
| 10 to 14 Years | 74 (5.5%) | 97 (7.6%) |
| 15 to 19 Years | 22 (1.6%) | 29 (2.3%) |
| 20 to 24 Years | 29 (2.2%) | 32 (2.5%) |
| 25 to 29 Years | 60 (4.5%) | 22 (1.7%) |
| 30 to 34 Years | 55 (4.1%) | 88 (6.9%) |
| 35 to 39 Years | 145 (10.8%) | 58 (4.6%) |
| 40 to 44 Years | 100 (7.5%) | 129 (10.2%) |
| 45 to 49 Years | 65 (4.9%) | 81 (6.4%) |
| 50 to 54 Years | 119 (8.9%) | 118 (9.3%) |
| 55 to 59 Years | 135 (10.1%) | 54 (4.3%) |
| 60 to 64 Years | 118 (8.8%) | 92 (7.2%) |
| 65 to 69 Years | 123 (9.2%) | 75 (5.9%) |
| 70 to 74 Years | 49 (3.7%) | 167 (13.1%) |
| 75 to 79 Years | 42 (3.1%) | 45 (3.5%) |
| 80 to 84 Years | 20 (1.5%) | 19 (1.5%) |
| 85 Years and over | 16 (1.2%) | 18 (1.4%) |
| Total | 1,339 (100.0%) | 1,271 (100.0%) |
Families and Households in University Park
Median Family Size in University Park
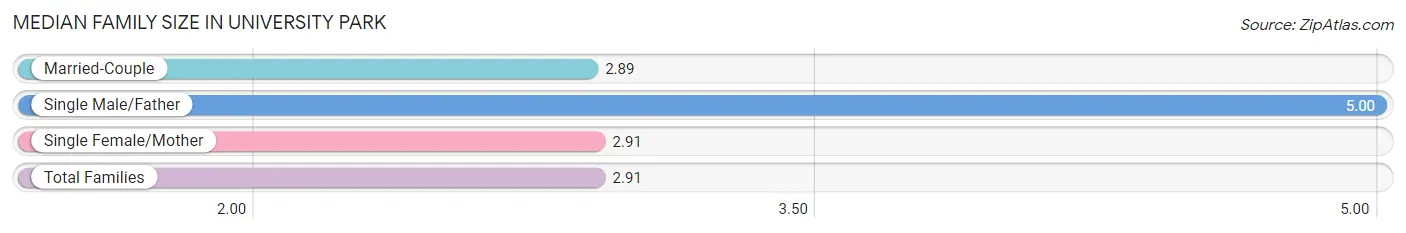
The median family size in University Park is 2.91 persons per family, with single male/father families (7 | 0.9%) accounting for the largest median family size of 5 persons per family. On the other hand, married-couple families (742 | 94.6%) represent the smallest median family size with 2.89 persons per family.
| Family Type | # Families | Family Size |
| Married-Couple | 742 (94.6%) | 2.89 |
| Single Male/Father | 7 (0.9%) | 5.00 |
| Single Female/Mother | 35 (4.5%) | 2.91 |
| Total Families | 784 (100.0%) | 2.91 |
Median Household Size in University Park
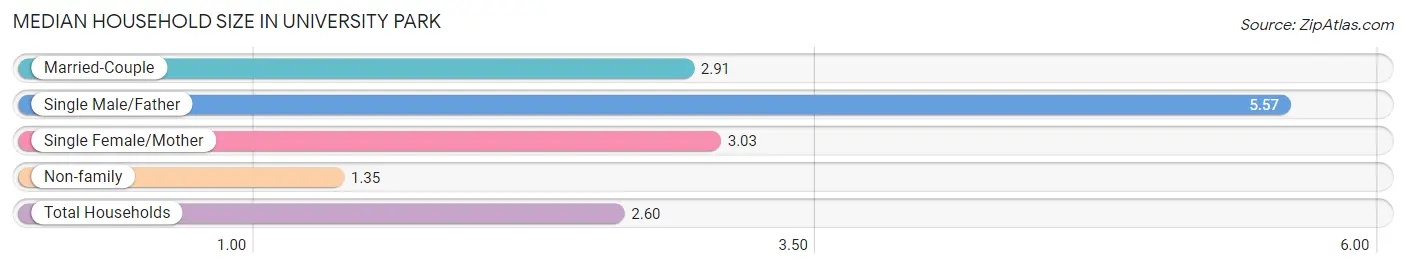
The median household size in University Park is 2.60 persons per household, with single male/father households (7 | 0.7%) accounting for the largest median household size of 5.57 persons per household. non-family households (213 | 21.4%) represent the smallest median household size with 1.35 persons per household.
| Household Type | # Households | Household Size |
| Married-Couple | 742 (74.4%) | 2.91 |
| Single Male/Father | 7 (0.7%) | 5.57 |
| Single Female/Mother | 35 (3.5%) | 3.03 |
| Non-family | 213 (21.4%) | 1.35 |
| Total Households | 997 (100.0%) | 2.60 |
Household Size by Marriage Status in University Park
Out of a total of 997 households in University Park, 784 (78.6%) are family households, while 213 (21.4%) are nonfamily households. The most numerous type of family households are 2-person households, comprising 447, and the most common type of nonfamily households are 1-person households, comprising 153.
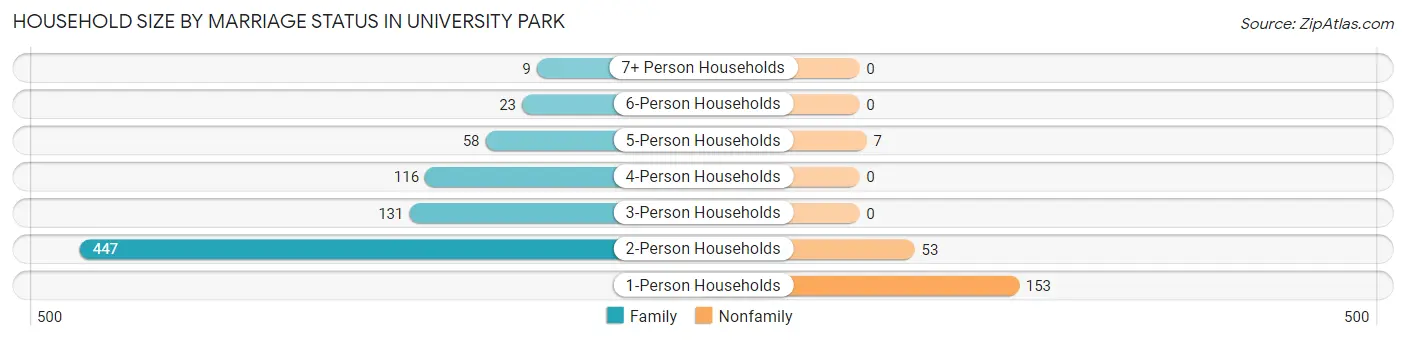
| Household Size | Family Households | Nonfamily Households |
| 1-Person Households | - | 153 (15.3%) |
| 2-Person Households | 447 (44.8%) | 53 (5.3%) |
| 3-Person Households | 131 (13.1%) | 0 (0.0%) |
| 4-Person Households | 116 (11.6%) | 0 (0.0%) |
| 5-Person Households | 58 (5.8%) | 7 (0.7%) |
| 6-Person Households | 23 (2.3%) | 0 (0.0%) |
| 7+ Person Households | 9 (0.9%) | 0 (0.0%) |
| Total | 784 (78.6%) | 213 (21.4%) |
Female Fertility in University Park
Fertility by Age in University Park
Average fertility rate in University Park is 32.0 births per 1,000 women. Women in the age bracket of 20 to 34 years have the highest fertility rate with 63.0 births per 1,000 women. Women in the age bracket of 20 to 34 years acount for 64.3% of all women with births.
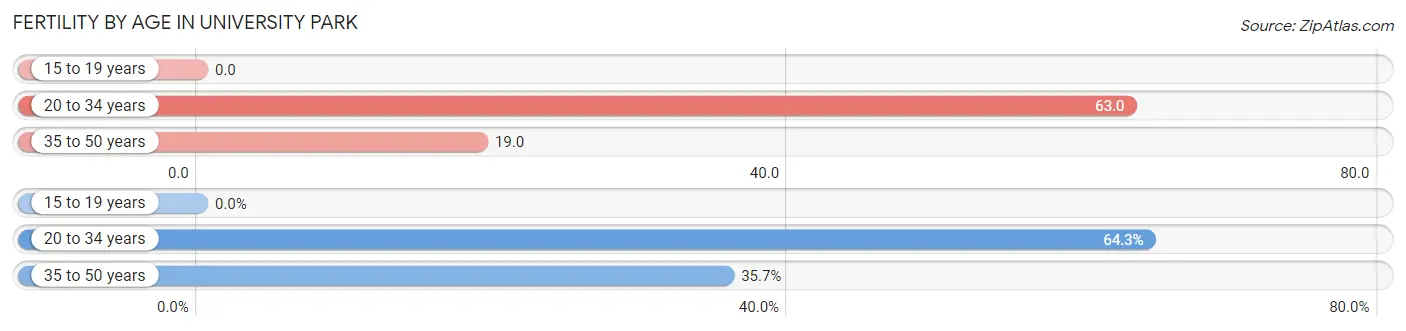
| Age Bracket | Women with Births | Births / 1,000 Women |
| 15 to 19 years | 0 (0.0%) | 0.0 |
| 20 to 34 years | 9 (64.3%) | 63.0 |
| 35 to 50 years | 5 (35.7%) | 19.0 |
| Total | 14 (100.0%) | 32.0 |
Fertility by Age by Marriage Status in University Park
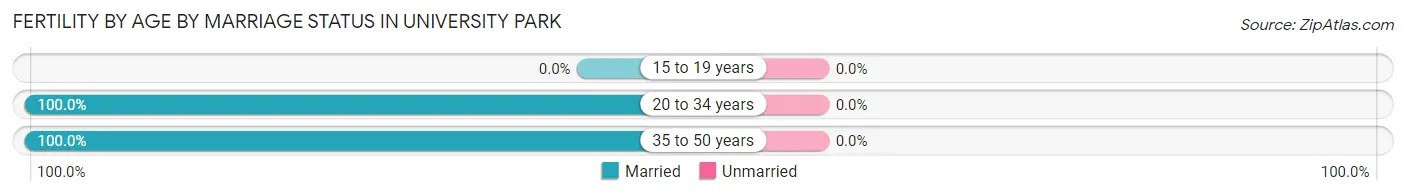
| Age Bracket | Married | Unmarried |
| 15 to 19 years | 0 (0.0%) | 0 (0.0%) |
| 20 to 34 years | 9 (100.0%) | 0 (0.0%) |
| 35 to 50 years | 5 (100.0%) | 0 (0.0%) |
| Total | 14 (100.0%) | 0 (0.0%) |
Fertility by Education in University Park
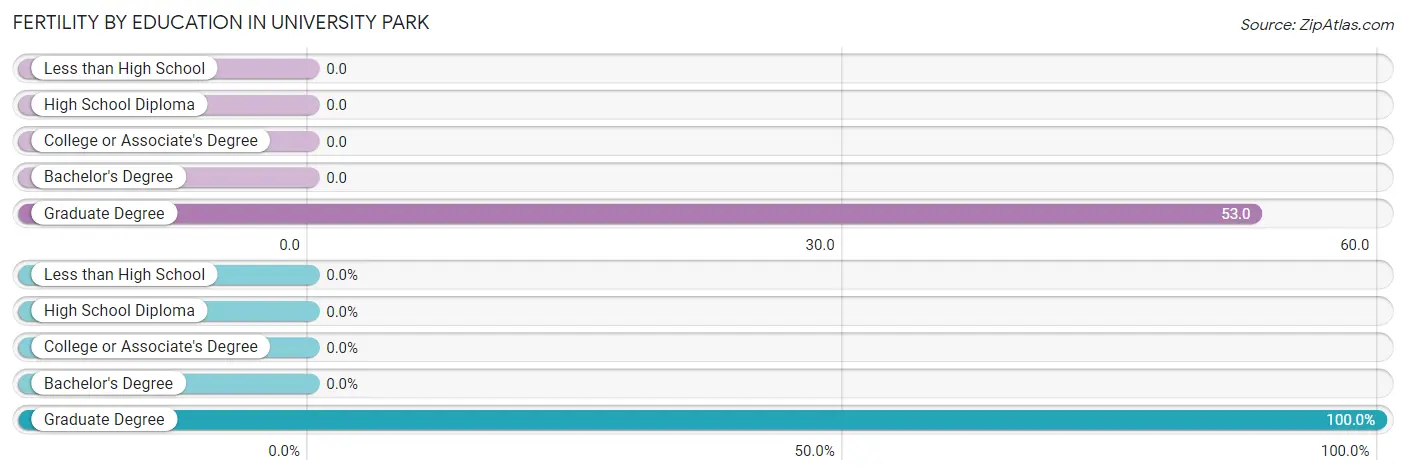
| Educational Attainment | Women with Births | Births / 1,000 Women |
| Less than High School | 0 (0.0%) | 0.0 |
| High School Diploma | 0 (0.0%) | 0.0 |
| College or Associate's Degree | 0 (0.0%) | 0.0 |
| Bachelor's Degree | 0 (0.0%) | 0.0 |
| Graduate Degree | 14 (100.0%) | 53.0 |
| Total | 14 (100.0%) | 32.0 |
Fertility by Education by Marriage Status in University Park
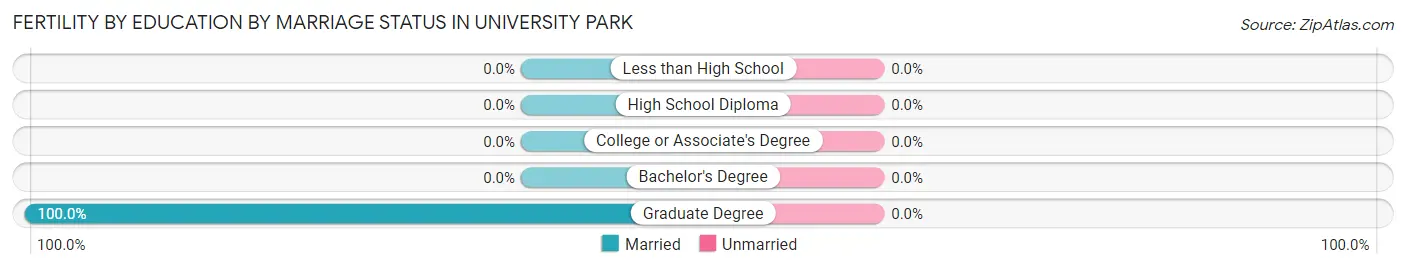
| Educational Attainment | Married | Unmarried |
| Less than High School | 0 (0.0%) | 0 (0.0%) |
| High School Diploma | 0 (0.0%) | 0 (0.0%) |
| College or Associate's Degree | 0 (0.0%) | 0 (0.0%) |
| Bachelor's Degree | 0 (0.0%) | 0 (0.0%) |
| Graduate Degree | 14 (100.0%) | 0 (0.0%) |
| Total | 14 (100.0%) | 0 (0.0%) |
Employment Characteristics in University Park
Employment by Class of Employer in University Park
Among the 1,320 employed individuals in University Park, private company employees (488 | 37.0%), federal government employees (273 | 20.7%), and not-for-profit organizations (224 | 17.0%) make up the most common classes of employment.
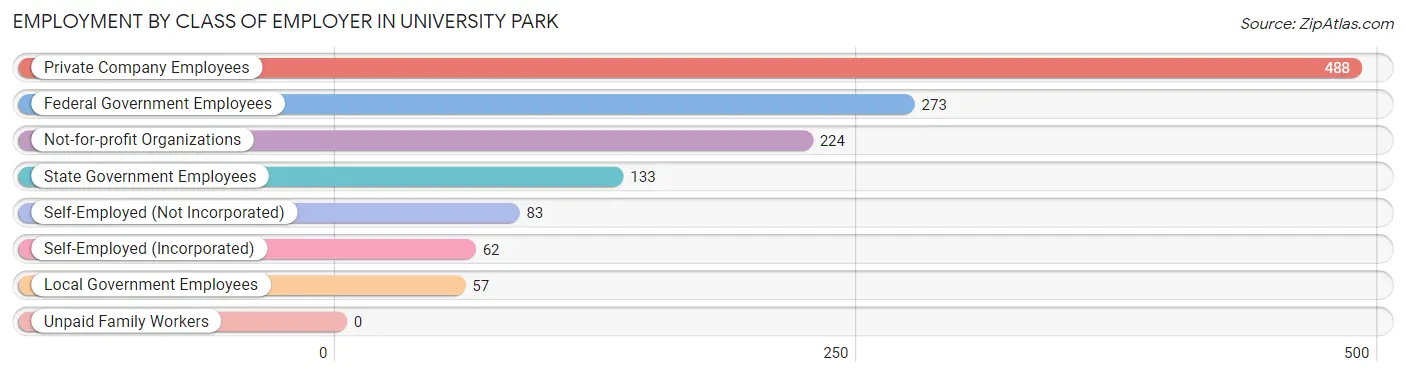
| Employer Class | # Employees | % Employees |
| Private Company Employees | 488 | 37.0% |
| Self-Employed (Incorporated) | 62 | 4.7% |
| Self-Employed (Not Incorporated) | 83 | 6.3% |
| Not-for-profit Organizations | 224 | 17.0% |
| Local Government Employees | 57 | 4.3% |
| State Government Employees | 133 | 10.1% |
| Federal Government Employees | 273 | 20.7% |
| Unpaid Family Workers | 0 | 0.0% |
| Total | 1,320 | 100.0% |
Employment Status by Age in University Park
According to the labor force statistics for University Park, out of the total population over 16 years of age (2,112), 63.3% or 1,337 individuals are in the labor force, with 0.7% or 9 of them unemployed. The age group with the highest labor force participation rate is 25 to 29 years, with 100.0% or 82 individuals in the labor force. Within the labor force, the 30 to 34 years age range has the highest percentage of unemployed individuals, with 6.5% or 9 of them being unemployed.
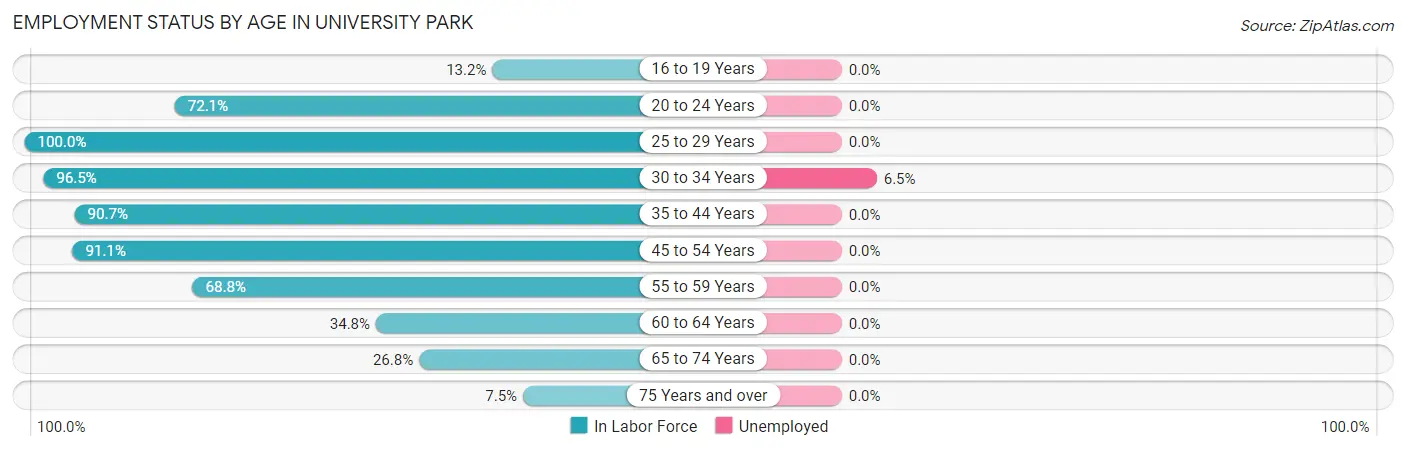
| Age Bracket | In Labor Force | Unemployed |
| 16 to 19 Years | 5 (13.2%) | 0 (0.0%) |
| 20 to 24 Years | 44 (72.1%) | 0 (0.0%) |
| 25 to 29 Years | 82 (100.0%) | 0 (0.0%) |
| 30 to 34 Years | 138 (96.5%) | 9 (6.5%) |
| 35 to 44 Years | 392 (90.7%) | 0 (0.0%) |
| 45 to 54 Years | 349 (91.1%) | 0 (0.0%) |
| 55 to 59 Years | 130 (68.8%) | 0 (0.0%) |
| 60 to 64 Years | 73 (34.8%) | 0 (0.0%) |
| 65 to 74 Years | 111 (26.8%) | 0 (0.0%) |
| 75 Years and over | 12 (7.5%) | 0 (0.0%) |
| Total | 1,337 (63.3%) | 9 (0.7%) |
Employment Status by Educational Attainment in University Park
According to labor force statistics for University Park, 80.9% of individuals (1,164) out of the total population between 25 and 64 years of age (1,439) are in the labor force, with 0.8% or 9 of them being unemployed. The group with the highest labor force participation rate are those with the educational attainment of high school diploma, with 87.5% or 56 individuals in the labor force. Within the labor force, individuals with college / associate degree education have the highest percentage of unemployment, with 10.0% or 9 of them being unemployed.
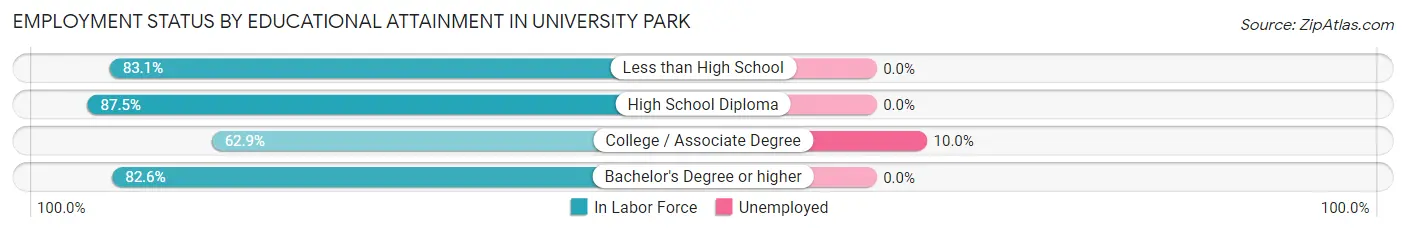
| Educational Attainment | In Labor Force | Unemployed |
| Less than High School | 74 (83.1%) | 0 (0.0%) |
| High School Diploma | 56 (87.5%) | 0 (0.0%) |
| College / Associate Degree | 90 (62.9%) | 14 (10.0%) |
| Bachelor's Degree or higher | 944 (82.6%) | 0 (0.0%) |
| Total | 1,164 (80.9%) | 12 (0.8%) |
Employment Occupations by Sex in University Park
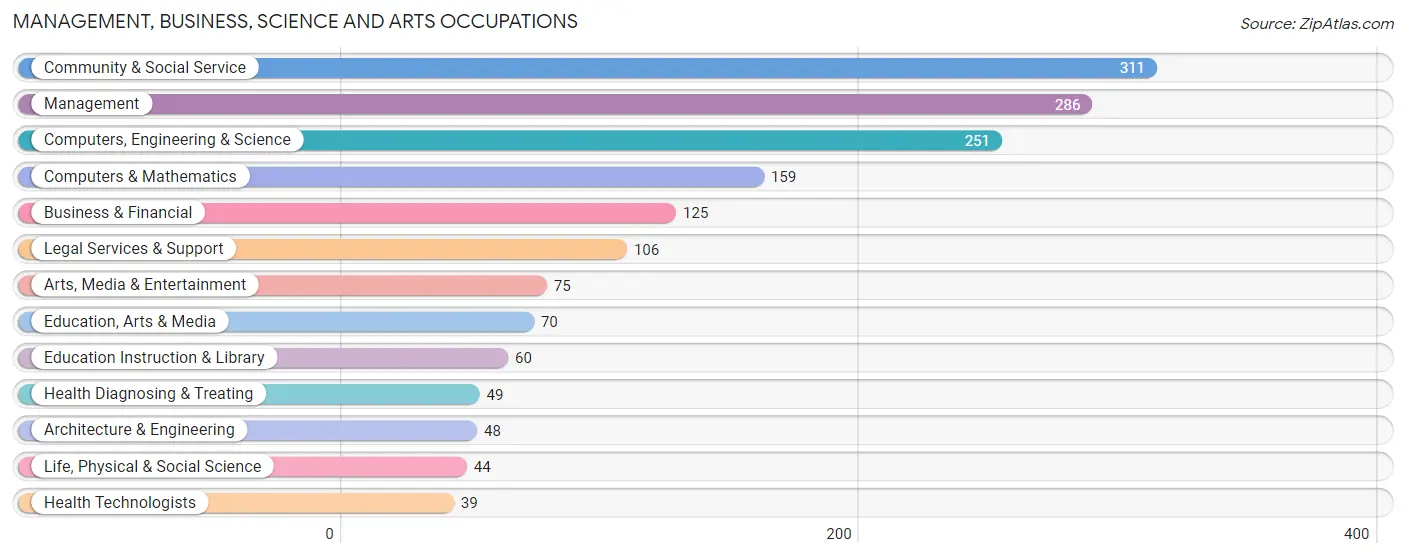
Management, Business, Science and Arts Occupations
The most common Management, Business, Science and Arts occupations in University Park are Community & Social Service (311 | 23.5%), Management (286 | 21.6%), Computers, Engineering & Science (251 | 19.0%), Computers & Mathematics (159 | 12.0%), and Business & Financial (125 | 9.5%).
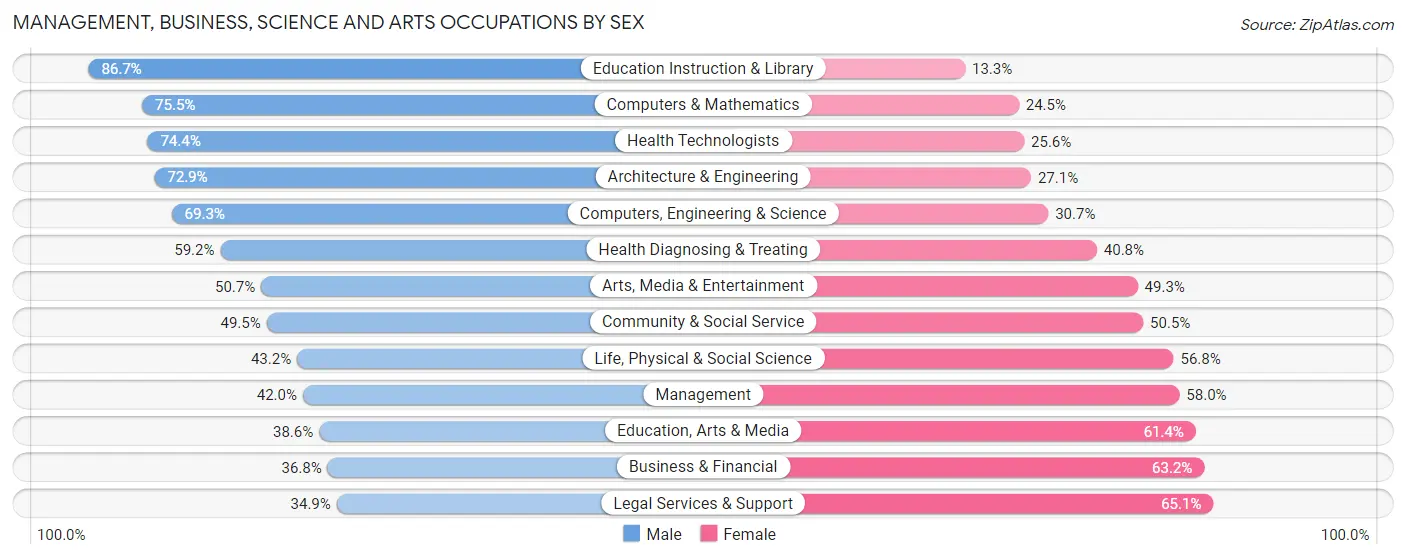
Management, Business, Science and Arts Occupations by Sex
Within the Management, Business, Science and Arts occupations in University Park, the most male-oriented occupations are Education Instruction & Library (86.7%), Computers & Mathematics (75.5%), and Health Technologists (74.4%), while the most female-oriented occupations are Legal Services & Support (65.1%), Business & Financial (63.2%), and Education, Arts & Media (61.4%).
| Occupation | Male | Female |
| Management | 120 (42.0%) | 166 (58.0%) |
| Business & Financial | 46 (36.8%) | 79 (63.2%) |
| Computers, Engineering & Science | 174 (69.3%) | 77 (30.7%) |
| Computers & Mathematics | 120 (75.5%) | 39 (24.5%) |
| Architecture & Engineering | 35 (72.9%) | 13 (27.1%) |
| Life, Physical & Social Science | 19 (43.2%) | 25 (56.8%) |
| Community & Social Service | 154 (49.5%) | 157 (50.5%) |
| Education, Arts & Media | 27 (38.6%) | 43 (61.4%) |
| Legal Services & Support | 37 (34.9%) | 69 (65.1%) |
| Education Instruction & Library | 52 (86.7%) | 8 (13.3%) |
| Arts, Media & Entertainment | 38 (50.7%) | 37 (49.3%) |
| Health Diagnosing & Treating | 29 (59.2%) | 20 (40.8%) |
| Health Technologists | 29 (74.4%) | 10 (25.6%) |
| Total (Category) | 523 (51.2%) | 499 (48.8%) |
| Total (Overall) | 746 (56.4%) | 577 (43.6%) |
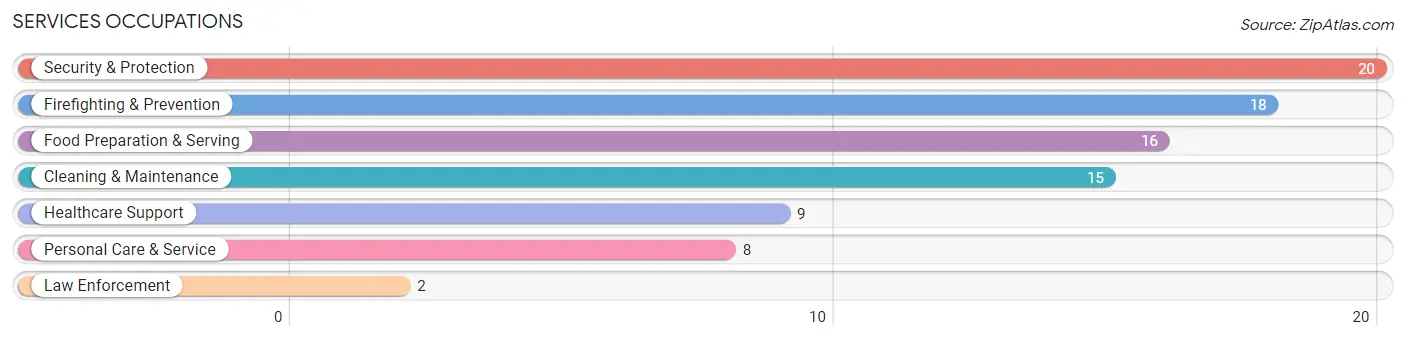
Services Occupations
The most common Services occupations in University Park are Security & Protection (20 | 1.5%), Firefighting & Prevention (18 | 1.4%), Food Preparation & Serving (16 | 1.2%), Cleaning & Maintenance (15 | 1.1%), and Healthcare Support (9 | 0.7%).
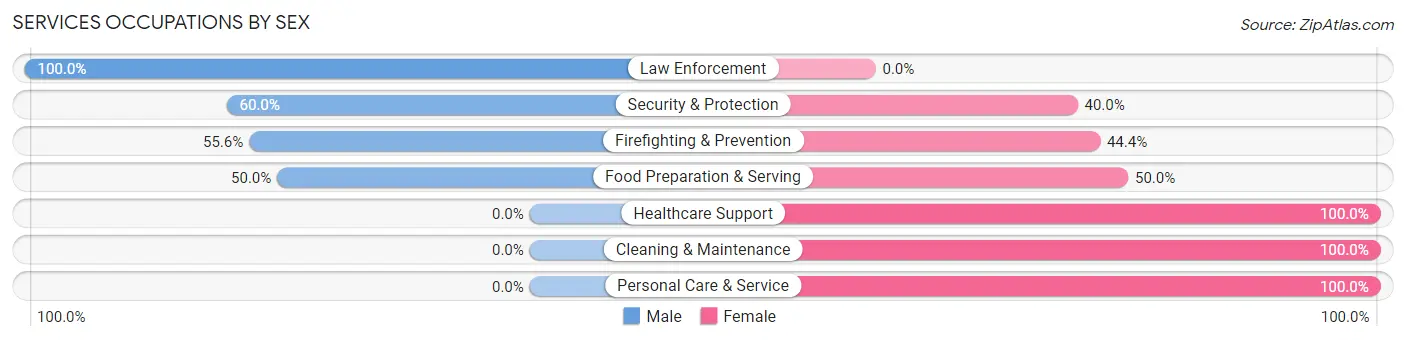
Services Occupations by Sex
Within the Services occupations in University Park, the most male-oriented occupations are Law Enforcement (100.0%), Security & Protection (60.0%), and Firefighting & Prevention (55.6%), while the most female-oriented occupations are Healthcare Support (100.0%), Cleaning & Maintenance (100.0%), and Personal Care & Service (100.0%).
| Occupation | Male | Female |
| Healthcare Support | 0 (0.0%) | 9 (100.0%) |
| Security & Protection | 12 (60.0%) | 8 (40.0%) |
| Firefighting & Prevention | 10 (55.6%) | 8 (44.4%) |
| Law Enforcement | 2 (100.0%) | 0 (0.0%) |
| Food Preparation & Serving | 8 (50.0%) | 8 (50.0%) |
| Cleaning & Maintenance | 0 (0.0%) | 15 (100.0%) |
| Personal Care & Service | 0 (0.0%) | 8 (100.0%) |
| Total (Category) | 20 (29.4%) | 48 (70.6%) |
| Total (Overall) | 746 (56.4%) | 577 (43.6%) |
Sales and Office Occupations
The most common Sales and Office occupations in University Park are Sales & Related (54 | 4.1%), and Office & Administration (45 | 3.4%).
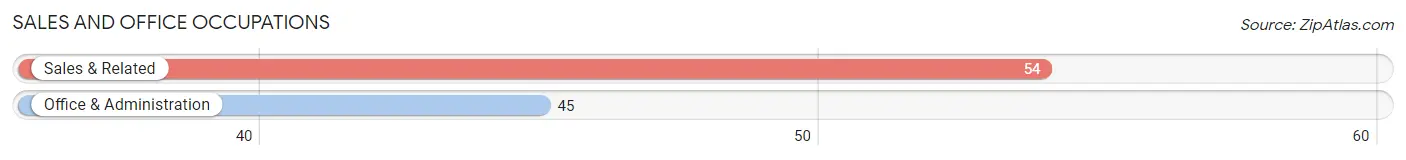
Sales and Office Occupations by Sex
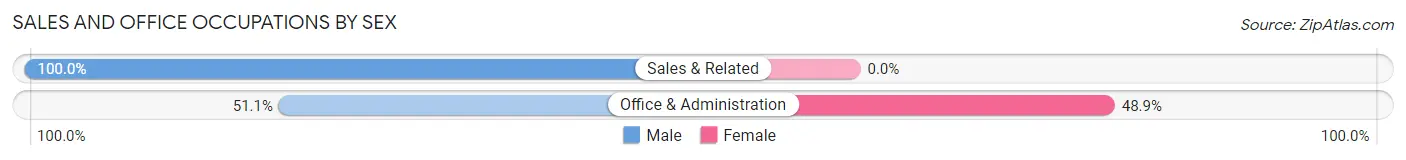
| Occupation | Male | Female |
| Sales & Related | 54 (100.0%) | 0 (0.0%) |
| Office & Administration | 23 (51.1%) | 22 (48.9%) |
| Total (Category) | 77 (77.8%) | 22 (22.2%) |
| Total (Overall) | 746 (56.4%) | 577 (43.6%) |
Natural Resources, Construction and Maintenance Occupations
The most common Natural Resources, Construction and Maintenance occupations in University Park are , and Construction & Extraction (67 | 5.1%).
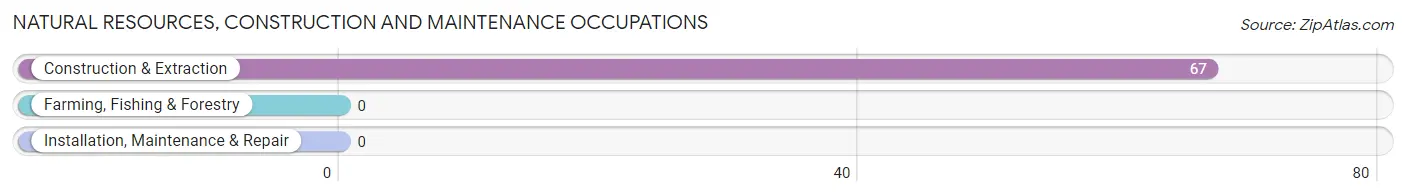
Natural Resources, Construction and Maintenance Occupations by Sex
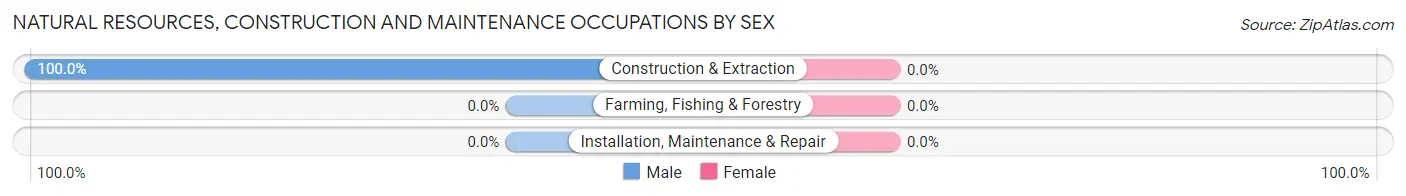
| Occupation | Male | Female |
| Farming, Fishing & Forestry | 0 (0.0%) | 0 (0.0%) |
| Construction & Extraction | 67 (100.0%) | 0 (0.0%) |
| Installation, Maintenance & Repair | 0 (0.0%) | 0 (0.0%) |
| Total (Category) | 67 (100.0%) | 0 (0.0%) |
| Total (Overall) | 746 (56.4%) | 577 (43.6%) |
Production, Transportation and Moving Occupations
The most common Production, Transportation and Moving occupations in University Park are Material Moving (55 | 4.2%), and Production (12 | 0.9%).
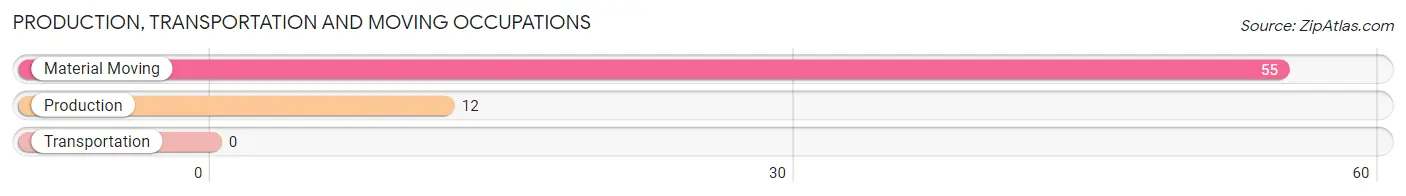
Production, Transportation and Moving Occupations by Sex
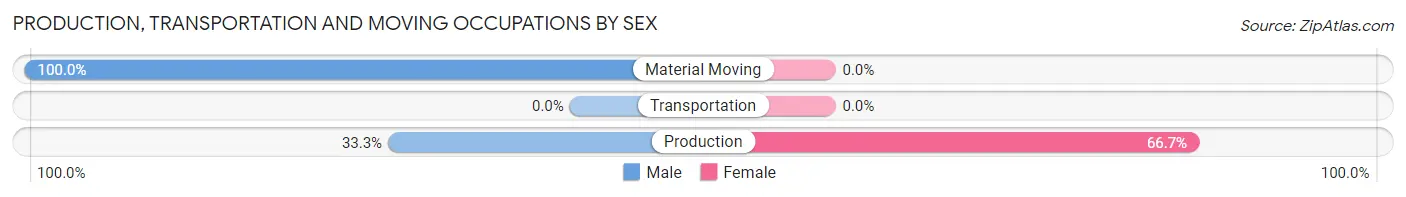
| Occupation | Male | Female |
| Production | 4 (33.3%) | 8 (66.7%) |
| Transportation | 0 (0.0%) | 0 (0.0%) |
| Material Moving | 55 (100.0%) | 0 (0.0%) |
| Total (Category) | 59 (88.1%) | 8 (11.9%) |
| Total (Overall) | 746 (56.4%) | 577 (43.6%) |
Employment Industries by Sex in University Park
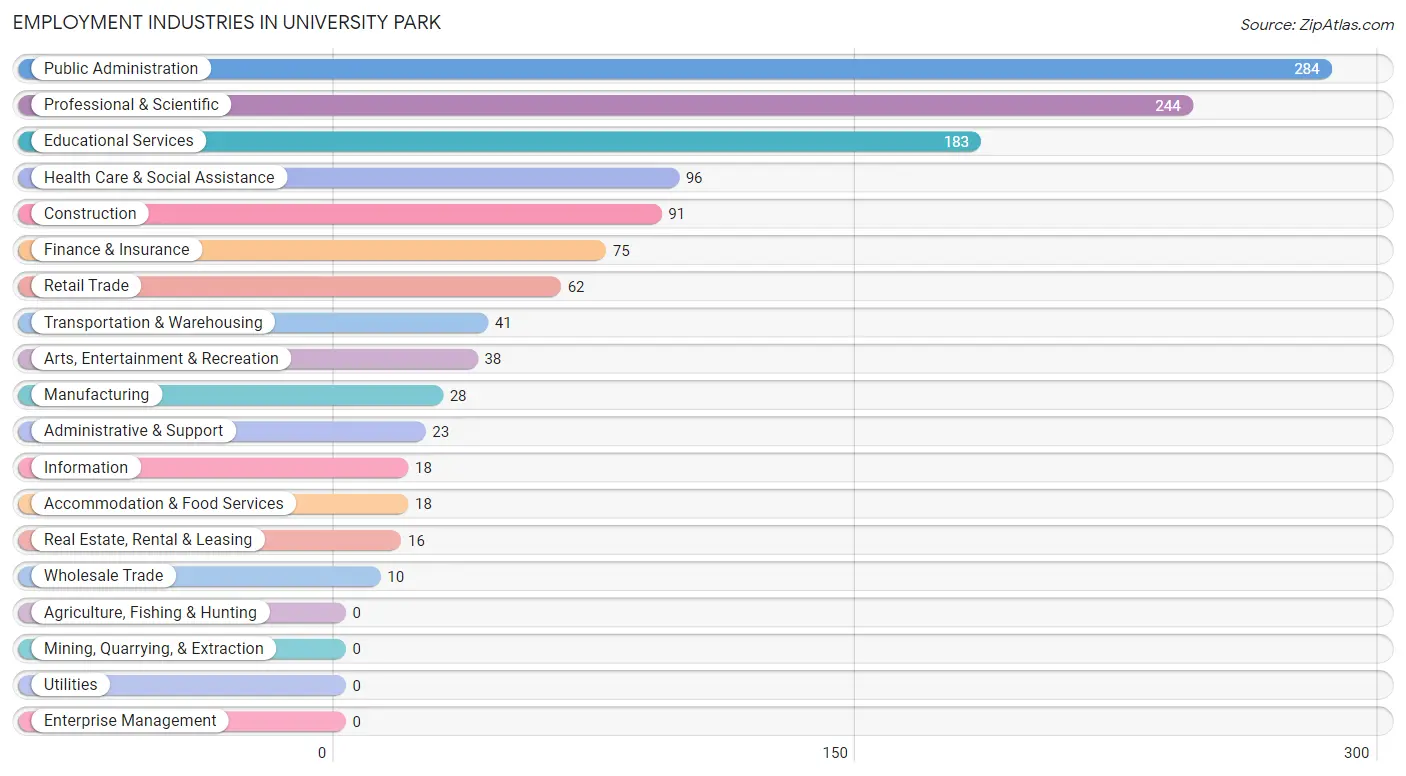
Employment Industries in University Park
The major employment industries in University Park include Public Administration (284 | 21.5%), Professional & Scientific (244 | 18.4%), Educational Services (183 | 13.8%), Health Care & Social Assistance (96 | 7.3%), and Construction (91 | 6.9%).
Employment Industries by Sex in University Park
The University Park industries that see more men than women are Construction (100.0%), Wholesale Trade (100.0%), and Retail Trade (100.0%), whereas the industries that tend to have a higher number of women are Administrative & Support (100.0%), Finance & Insurance (94.7%), and Information (66.7%).
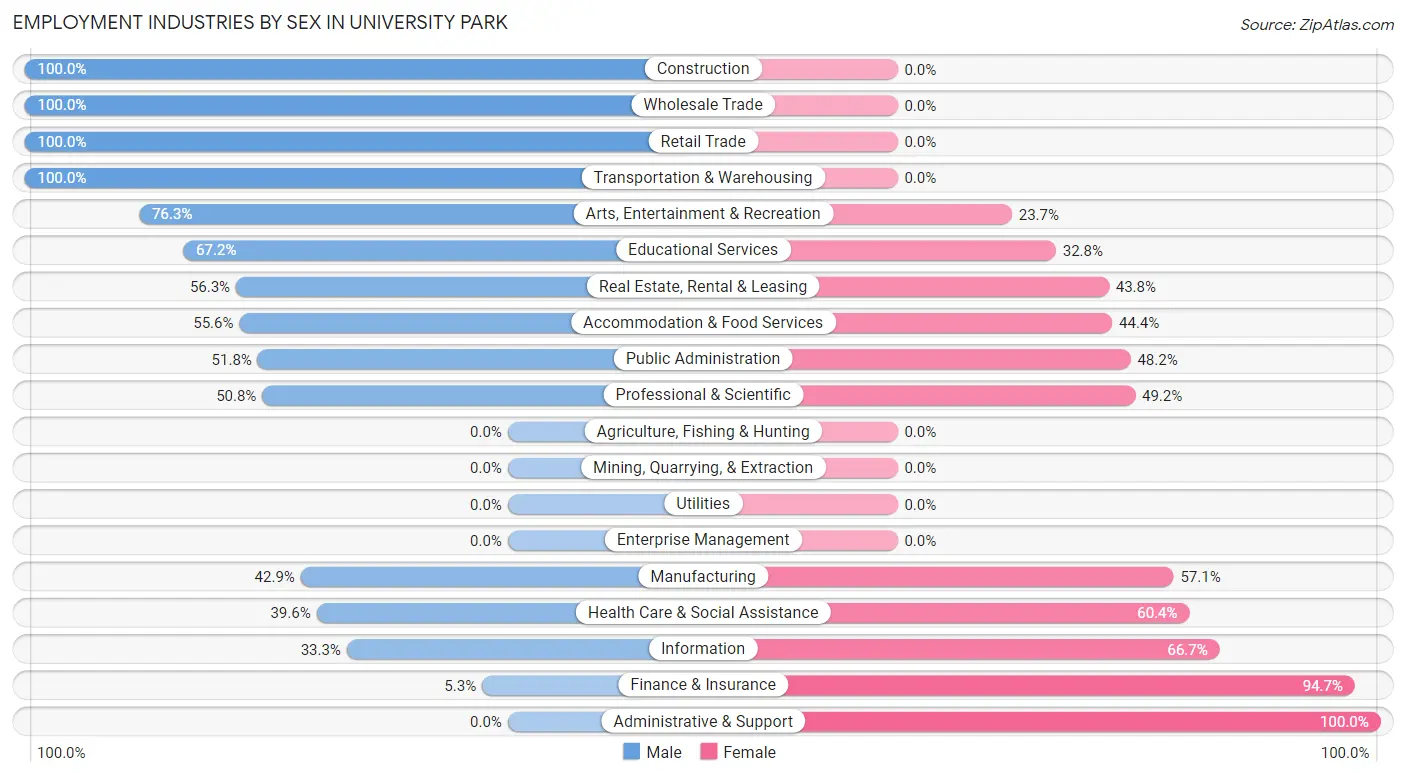
| Industry | Male | Female |
| Agriculture, Fishing & Hunting | 0 (0.0%) | 0 (0.0%) |
| Mining, Quarrying, & Extraction | 0 (0.0%) | 0 (0.0%) |
| Construction | 91 (100.0%) | 0 (0.0%) |
| Manufacturing | 12 (42.9%) | 16 (57.1%) |
| Wholesale Trade | 10 (100.0%) | 0 (0.0%) |
| Retail Trade | 62 (100.0%) | 0 (0.0%) |
| Transportation & Warehousing | 41 (100.0%) | 0 (0.0%) |
| Utilities | 0 (0.0%) | 0 (0.0%) |
| Information | 6 (33.3%) | 12 (66.7%) |
| Finance & Insurance | 4 (5.3%) | 71 (94.7%) |
| Real Estate, Rental & Leasing | 9 (56.2%) | 7 (43.8%) |
| Professional & Scientific | 124 (50.8%) | 120 (49.2%) |
| Enterprise Management | 0 (0.0%) | 0 (0.0%) |
| Administrative & Support | 0 (0.0%) | 23 (100.0%) |
| Educational Services | 123 (67.2%) | 60 (32.8%) |
| Health Care & Social Assistance | 38 (39.6%) | 58 (60.4%) |
| Arts, Entertainment & Recreation | 29 (76.3%) | 9 (23.7%) |
| Accommodation & Food Services | 10 (55.6%) | 8 (44.4%) |
| Public Administration | 147 (51.8%) | 137 (48.2%) |
| Total | 746 (56.4%) | 577 (43.6%) |
Education in University Park
School Enrollment in University Park
The most common levels of schooling among the 495 students in University Park are elementary school (153 | 30.9%), middle school (111 | 22.4%), and high school (75 | 15.1%).
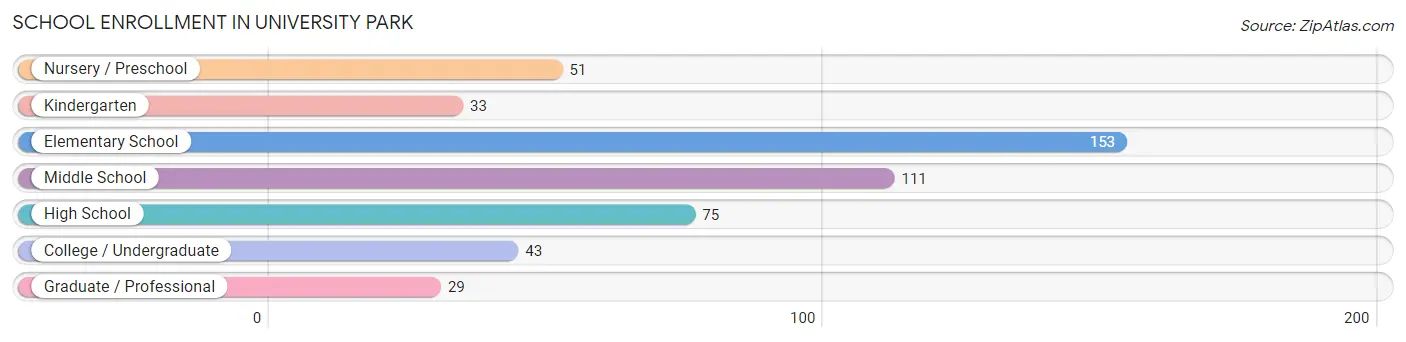
| School Level | # Students | % Students |
| Nursery / Preschool | 51 | 10.3% |
| Kindergarten | 33 | 6.7% |
| Elementary School | 153 | 30.9% |
| Middle School | 111 | 22.4% |
| High School | 75 | 15.1% |
| College / Undergraduate | 43 | 8.7% |
| Graduate / Professional | 29 | 5.9% |
| Total | 495 | 100.0% |
School Enrollment by Age by Funding Source in University Park
Out of a total of 495 students who are enrolled in schools in University Park, 203 (41.0%) attend a private institution, while the remaining 292 (59.0%) are enrolled in public schools. The age group of 3 to 4 year olds has the highest likelihood of being enrolled in private schools, with 42 (100.0% in the age bracket) enrolled. Conversely, the age group of 18 to 19 year olds has the lowest likelihood of being enrolled in a private school, with 8 (100.0% in the age bracket) attending a public institution.
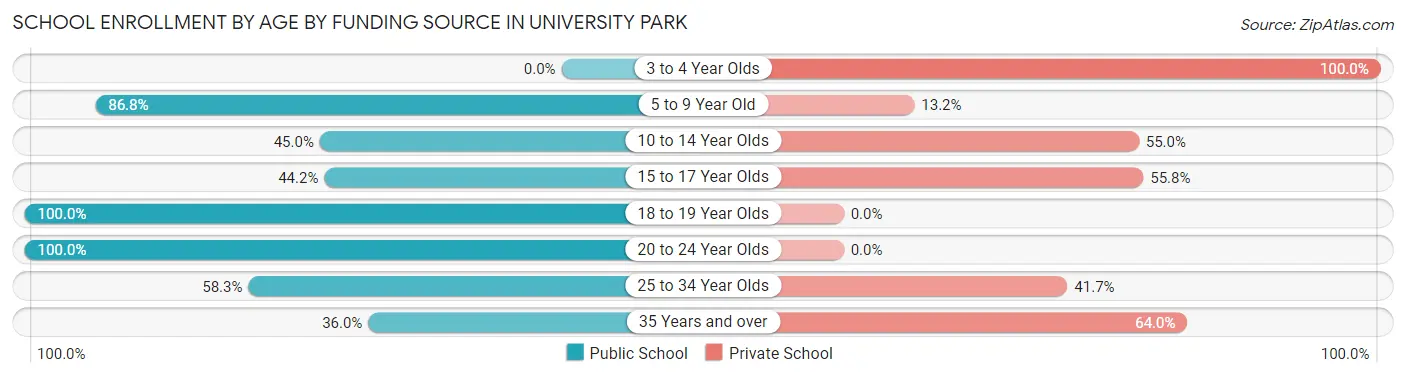
| Age Bracket | Public School | Private School |
| 3 to 4 Year Olds | 0 (0.0%) | 42 (100.0%) |
| 5 to 9 Year Old | 145 (86.8%) | 22 (13.2%) |
| 10 to 14 Year Olds | 77 (45.0%) | 94 (55.0%) |
| 15 to 17 Year Olds | 19 (44.2%) | 24 (55.8%) |
| 18 to 19 Year Olds | 8 (100.0%) | 0 (0.0%) |
| 20 to 24 Year Olds | 27 (100.0%) | 0 (0.0%) |
| 25 to 34 Year Olds | 7 (58.3%) | 5 (41.7%) |
| 35 Years and over | 9 (36.0%) | 16 (64.0%) |
| Total | 292 (59.0%) | 203 (41.0%) |
Educational Attainment by Field of Study in University Park
Social sciences (438 | 24.4%), business (203 | 11.3%), literature & languages (164 | 9.1%), liberal arts & history (147 | 8.2%), and bio, nature & agricultural (134 | 7.5%) are the most common fields of study among 1,793 individuals in University Park who have obtained a bachelor's degree or higher.
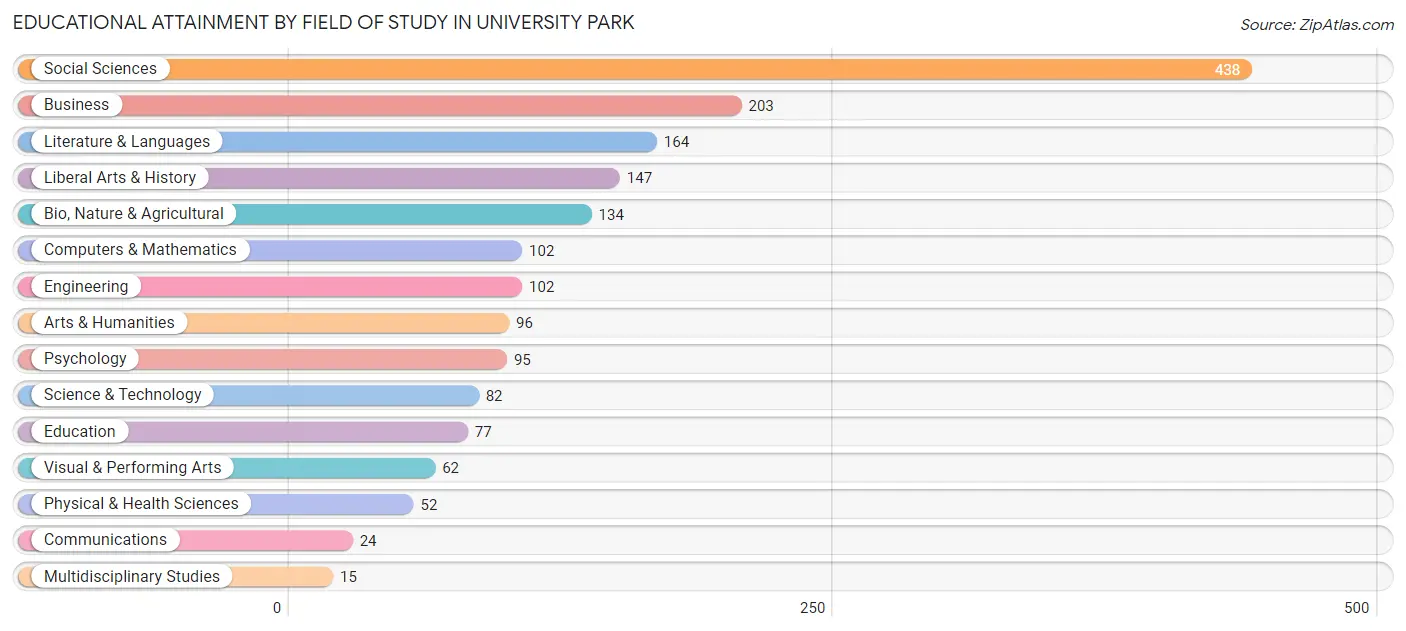
| Field of Study | # Graduates | % Graduates |
| Computers & Mathematics | 102 | 5.7% |
| Bio, Nature & Agricultural | 134 | 7.5% |
| Physical & Health Sciences | 52 | 2.9% |
| Psychology | 95 | 5.3% |
| Social Sciences | 438 | 24.4% |
| Engineering | 102 | 5.7% |
| Multidisciplinary Studies | 15 | 0.8% |
| Science & Technology | 82 | 4.6% |
| Business | 203 | 11.3% |
| Education | 77 | 4.3% |
| Literature & Languages | 164 | 9.1% |
| Liberal Arts & History | 147 | 8.2% |
| Visual & Performing Arts | 62 | 3.5% |
| Communications | 24 | 1.3% |
| Arts & Humanities | 96 | 5.3% |
| Total | 1,793 | 100.0% |
Transportation & Commute in University Park
Vehicle Availability by Sex in University Park
The most prevalent vehicle ownership categories in University Park are males with 2 vehicles (360, accounting for 48.0%) and females with 2 vehicles (257, making up 63.8%).
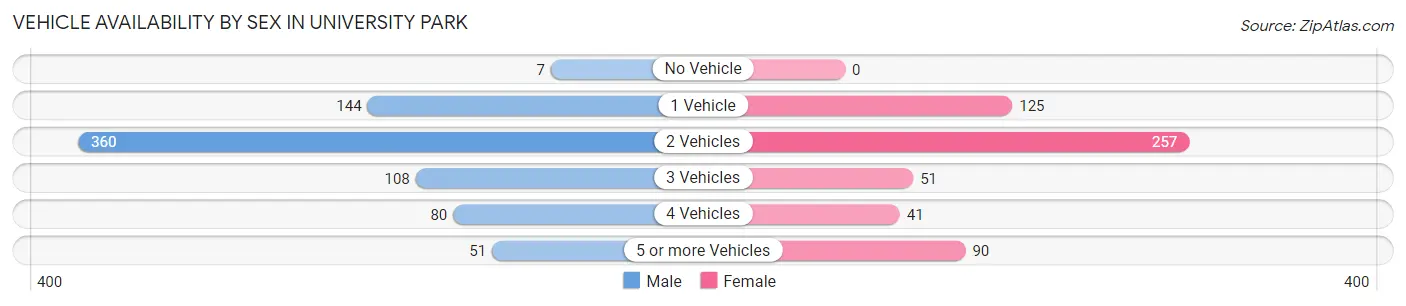
| Vehicles Available | Male | Female |
| No Vehicle | 7 (0.9%) | 0 (0.0%) |
| 1 Vehicle | 144 (19.2%) | 125 (22.2%) |
| 2 Vehicles | 360 (48.0%) | 257 (45.6%) |
| 3 Vehicles | 108 (14.4%) | 51 (9.0%) |
| 4 Vehicles | 80 (10.7%) | 41 (7.3%) |
| 5 or more Vehicles | 51 (6.8%) | 90 (16.0%) |
| Total | 750 (100.0%) | 564 (100.0%) |
Commute Time in University Park
The most frequently occuring commute durations in University Park are 45 to 59 minutes (178 commuters, 20.3%), 30 to 34 minutes (154 commuters, 17.5%), and 35 to 39 minutes (134 commuters, 15.2%).
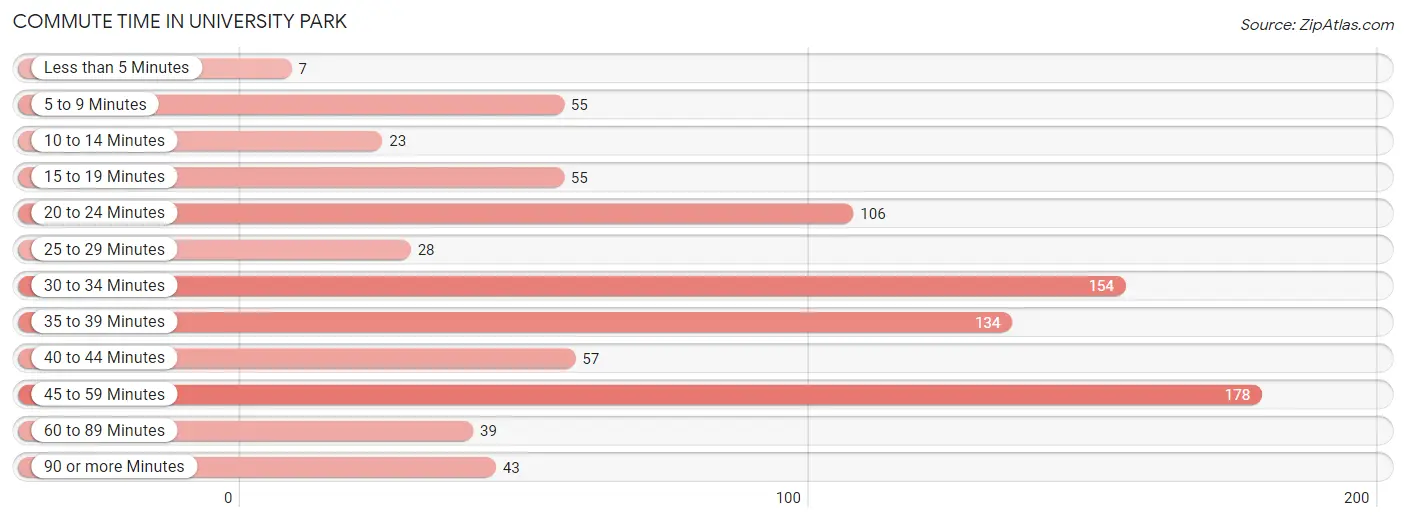
| Commute Time | # Commuters | % Commuters |
| Less than 5 Minutes | 7 | 0.8% |
| 5 to 9 Minutes | 55 | 6.3% |
| 10 to 14 Minutes | 23 | 2.6% |
| 15 to 19 Minutes | 55 | 6.3% |
| 20 to 24 Minutes | 106 | 12.1% |
| 25 to 29 Minutes | 28 | 3.2% |
| 30 to 34 Minutes | 154 | 17.5% |
| 35 to 39 Minutes | 134 | 15.2% |
| 40 to 44 Minutes | 57 | 6.5% |
| 45 to 59 Minutes | 178 | 20.3% |
| 60 to 89 Minutes | 39 | 4.4% |
| 90 or more Minutes | 43 | 4.9% |
Commute Time by Sex in University Park
The most common commute times in University Park are 45 to 59 minutes (113 commuters, 20.7%) for males and 30 to 34 minutes (72 commuters, 21.7%) for females.
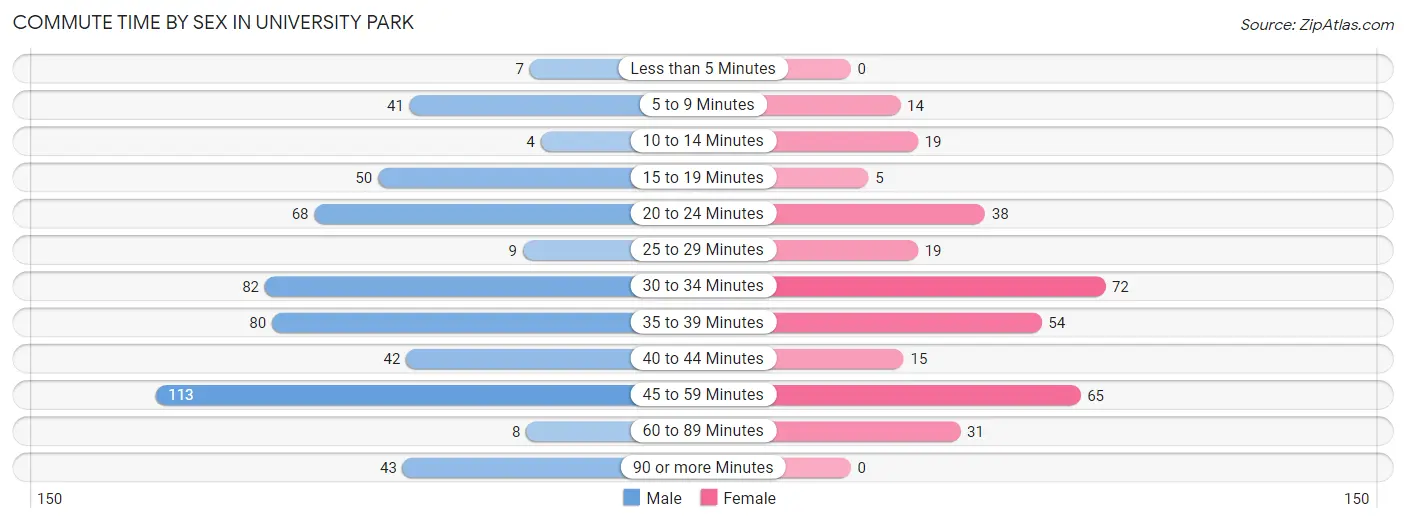
| Commute Time | Male | Female |
| Less than 5 Minutes | 7 (1.3%) | 0 (0.0%) |
| 5 to 9 Minutes | 41 (7.5%) | 14 (4.2%) |
| 10 to 14 Minutes | 4 (0.7%) | 19 (5.7%) |
| 15 to 19 Minutes | 50 (9.1%) | 5 (1.5%) |
| 20 to 24 Minutes | 68 (12.4%) | 38 (11.5%) |
| 25 to 29 Minutes | 9 (1.7%) | 19 (5.7%) |
| 30 to 34 Minutes | 82 (15.0%) | 72 (21.7%) |
| 35 to 39 Minutes | 80 (14.6%) | 54 (16.3%) |
| 40 to 44 Minutes | 42 (7.7%) | 15 (4.5%) |
| 45 to 59 Minutes | 113 (20.7%) | 65 (19.6%) |
| 60 to 89 Minutes | 8 (1.5%) | 31 (9.3%) |
| 90 or more Minutes | 43 (7.9%) | 0 (0.0%) |
Time of Departure to Work by Sex in University Park
The most frequent times of departure to work in University Park are 6:00 AM to 6:29 AM (93, 17.0%) for males and 7:00 AM to 7:29 AM (67, 20.2%) for females.
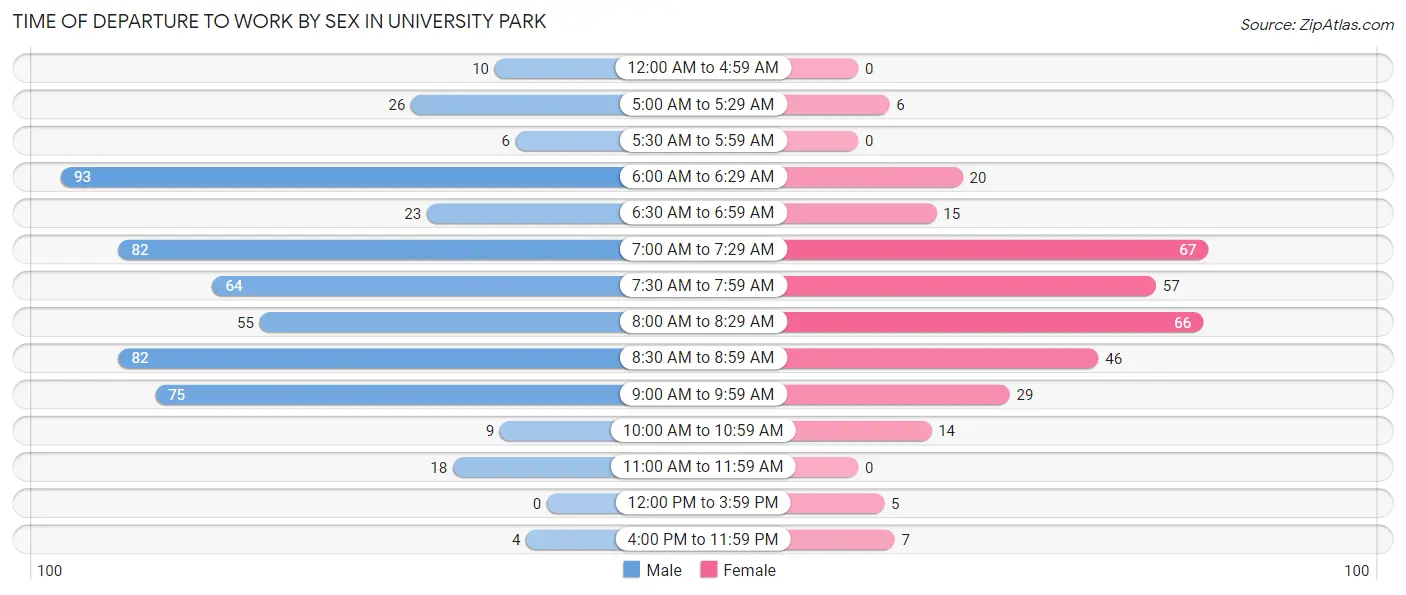
| Time of Departure | Male | Female |
| 12:00 AM to 4:59 AM | 10 (1.8%) | 0 (0.0%) |
| 5:00 AM to 5:29 AM | 26 (4.8%) | 6 (1.8%) |
| 5:30 AM to 5:59 AM | 6 (1.1%) | 0 (0.0%) |
| 6:00 AM to 6:29 AM | 93 (17.0%) | 20 (6.0%) |
| 6:30 AM to 6:59 AM | 23 (4.2%) | 15 (4.5%) |
| 7:00 AM to 7:29 AM | 82 (15.0%) | 67 (20.2%) |
| 7:30 AM to 7:59 AM | 64 (11.7%) | 57 (17.2%) |
| 8:00 AM to 8:29 AM | 55 (10.1%) | 66 (19.9%) |
| 8:30 AM to 8:59 AM | 82 (15.0%) | 46 (13.9%) |
| 9:00 AM to 9:59 AM | 75 (13.7%) | 29 (8.7%) |
| 10:00 AM to 10:59 AM | 9 (1.7%) | 14 (4.2%) |
| 11:00 AM to 11:59 AM | 18 (3.3%) | 0 (0.0%) |
| 12:00 PM to 3:59 PM | 0 (0.0%) | 5 (1.5%) |
| 4:00 PM to 11:59 PM | 4 (0.7%) | 7 (2.1%) |
| Total | 547 (100.0%) | 332 (100.0%) |
Housing Occupancy in University Park
Occupancy by Ownership in University Park
Of the total 997 dwellings in University Park, owner-occupied units account for 972 (97.5%), while renter-occupied units make up 25 (2.5%).
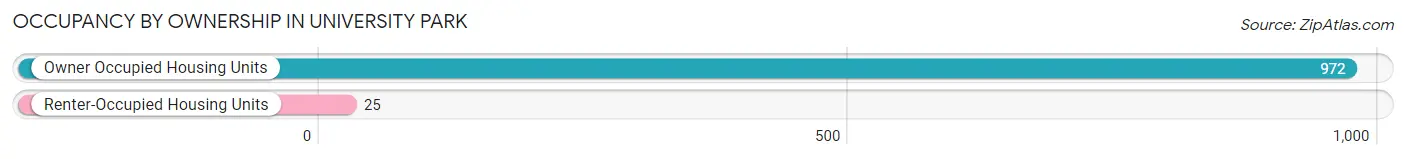
| Occupancy | # Housing Units | % Housing Units |
| Owner Occupied Housing Units | 972 | 97.5% |
| Renter-Occupied Housing Units | 25 | 2.5% |
| Total Occupied Housing Units | 997 | 100.0% |
Occupancy by Household Size in University Park
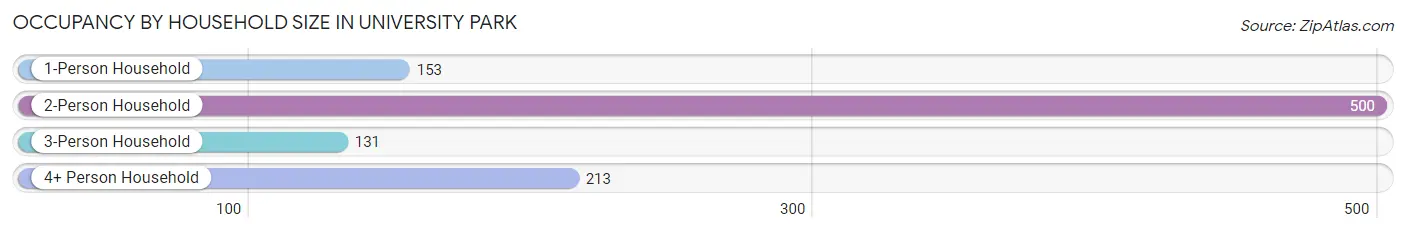
| Household Size | # Housing Units | % Housing Units |
| 1-Person Household | 153 | 15.3% |
| 2-Person Household | 500 | 50.1% |
| 3-Person Household | 131 | 13.1% |
| 4+ Person Household | 213 | 21.4% |
| Total Housing Units | 997 | 100.0% |
Occupancy by Ownership by Household Size in University Park
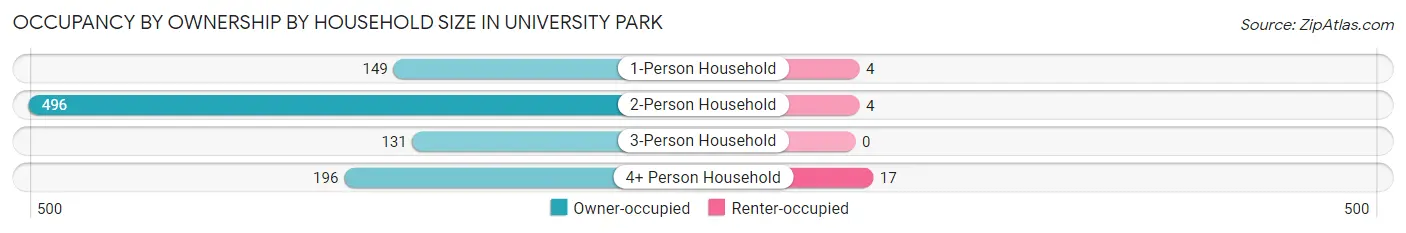
| Household Size | Owner-occupied | Renter-occupied |
| 1-Person Household | 149 (97.4%) | 4 (2.6%) |
| 2-Person Household | 496 (99.2%) | 4 (0.8%) |
| 3-Person Household | 131 (100.0%) | 0 (0.0%) |
| 4+ Person Household | 196 (92.0%) | 17 (8.0%) |
| Total Housing Units | 972 (97.5%) | 25 (2.5%) |
Occupancy by Educational Attainment in University Park
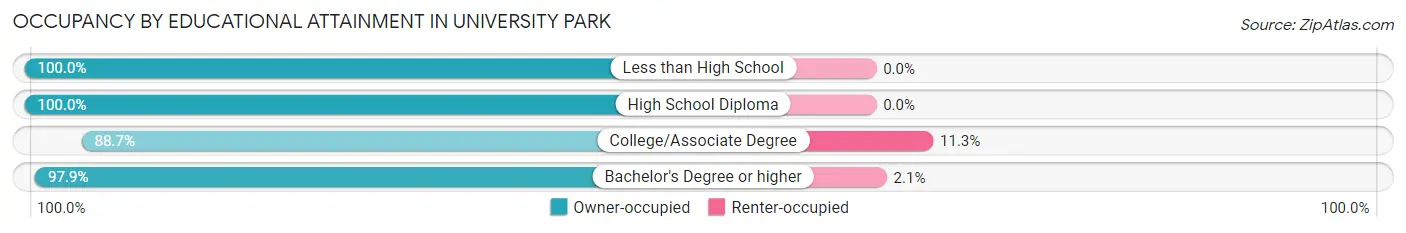
| Household Size | Owner-occupied | Renter-occupied |
| Less than High School | 27 (100.0%) | 0 (0.0%) |
| High School Diploma | 43 (100.0%) | 0 (0.0%) |
| College/Associate Degree | 55 (88.7%) | 7 (11.3%) |
| Bachelor's Degree or higher | 847 (97.9%) | 18 (2.1%) |
Occupancy by Age of Householder in University Park
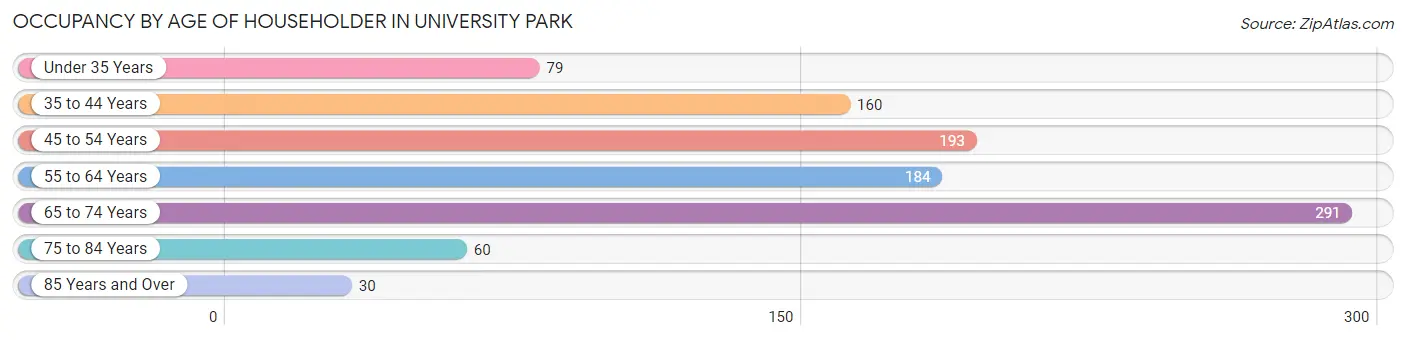
| Age Bracket | # Households | % Households |
| Under 35 Years | 79 | 7.9% |
| 35 to 44 Years | 160 | 16.1% |
| 45 to 54 Years | 193 | 19.4% |
| 55 to 64 Years | 184 | 18.5% |
| 65 to 74 Years | 291 | 29.2% |
| 75 to 84 Years | 60 | 6.0% |
| 85 Years and Over | 30 | 3.0% |
| Total | 997 | 100.0% |
Housing Finances in University Park
Median Income by Occupancy in University Park
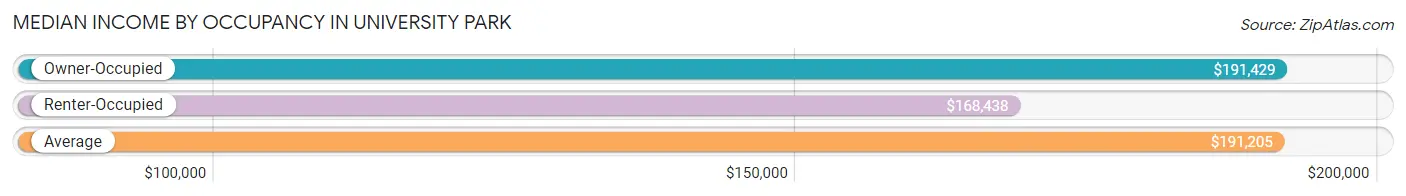
| Occupancy Type | # Households | Median Income |
| Owner-Occupied | 972 (97.5%) | $191,429 |
| Renter-Occupied | 25 (2.5%) | $168,438 |
| Average | 997 (100.0%) | $191,205 |
Occupancy by Householder Income Bracket in University Park
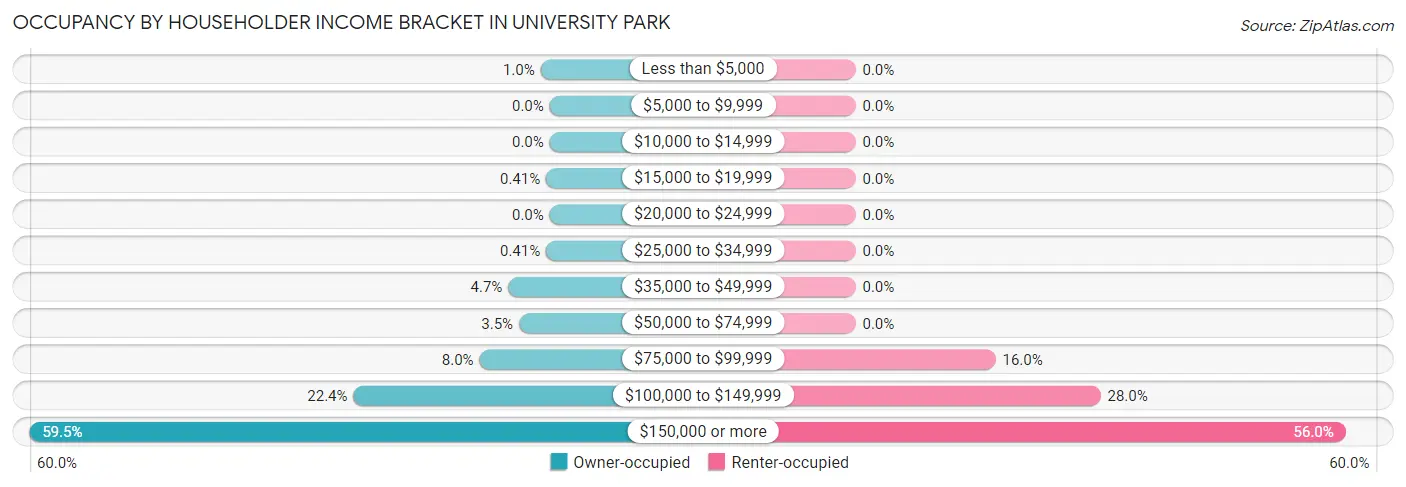
| Income Bracket | Owner-occupied | Renter-occupied |
| Less than $5,000 | 10 (1.0%) | 0 (0.0%) |
| $5,000 to $9,999 | 0 (0.0%) | 0 (0.0%) |
| $10,000 to $14,999 | 0 (0.0%) | 0 (0.0%) |
| $15,000 to $19,999 | 4 (0.4%) | 0 (0.0%) |
| $20,000 to $24,999 | 0 (0.0%) | 0 (0.0%) |
| $25,000 to $34,999 | 4 (0.4%) | 0 (0.0%) |
| $35,000 to $49,999 | 46 (4.7%) | 0 (0.0%) |
| $50,000 to $74,999 | 34 (3.5%) | 0 (0.0%) |
| $75,000 to $99,999 | 78 (8.0%) | 4 (16.0%) |
| $100,000 to $149,999 | 218 (22.4%) | 7 (28.0%) |
| $150,000 or more | 578 (59.5%) | 14 (56.0%) |
| Total | 972 (100.0%) | 25 (100.0%) |
Monthly Housing Cost Tiers in University Park
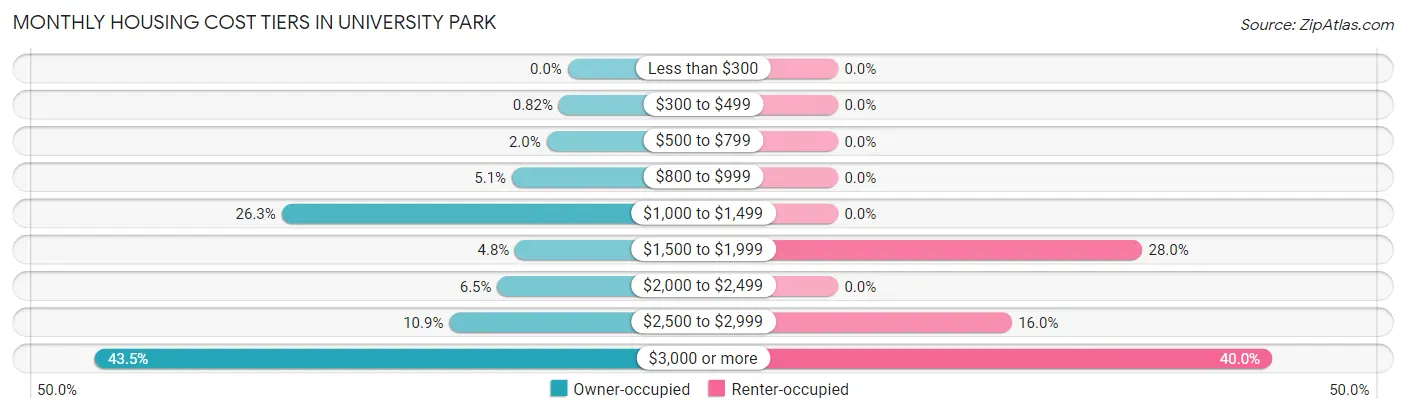
| Monthly Cost | Owner-occupied | Renter-occupied |
| Less than $300 | 0 (0.0%) | 0 (0.0%) |
| $300 to $499 | 8 (0.8%) | 0 (0.0%) |
| $500 to $799 | 19 (1.9%) | 0 (0.0%) |
| $800 to $999 | 50 (5.1%) | 0 (0.0%) |
| $1,000 to $1,499 | 256 (26.3%) | 0 (0.0%) |
| $1,500 to $1,999 | 47 (4.8%) | 7 (28.0%) |
| $2,000 to $2,499 | 63 (6.5%) | 0 (0.0%) |
| $2,500 to $2,999 | 106 (10.9%) | 4 (16.0%) |
| $3,000 or more | 423 (43.5%) | 10 (40.0%) |
| Total | 972 (100.0%) | 25 (100.0%) |
Physical Housing Characteristics in University Park
Housing Structures in University Park
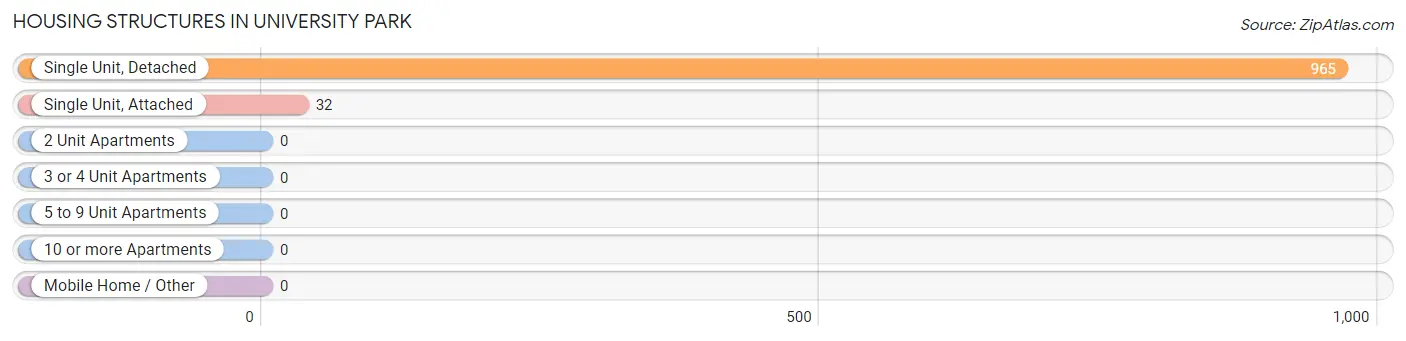
| Structure Type | # Housing Units | % Housing Units |
| Single Unit, Detached | 965 | 96.8% |
| Single Unit, Attached | 32 | 3.2% |
| 2 Unit Apartments | 0 | 0.0% |
| 3 or 4 Unit Apartments | 0 | 0.0% |
| 5 to 9 Unit Apartments | 0 | 0.0% |
| 10 or more Apartments | 0 | 0.0% |
| Mobile Home / Other | 0 | 0.0% |
| Total | 997 | 100.0% |
Housing Structures by Occupancy in University Park
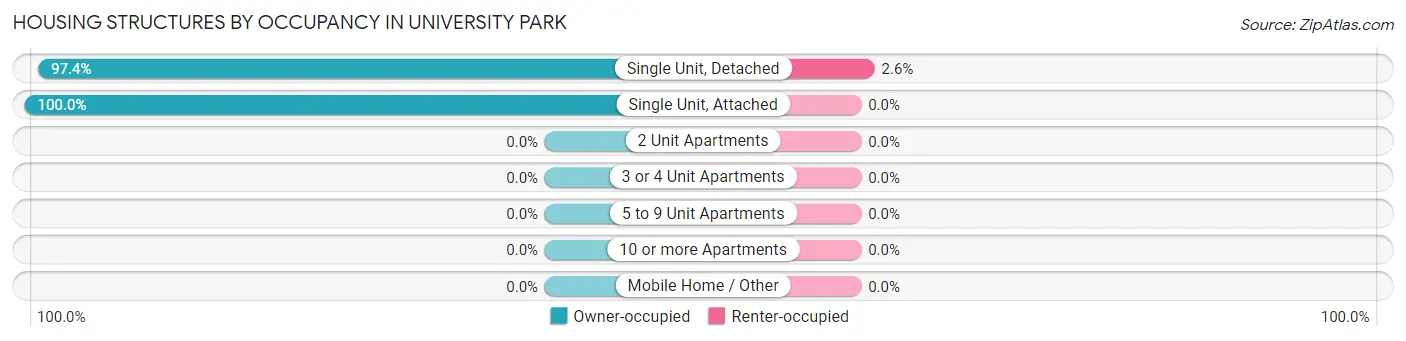
| Structure Type | Owner-occupied | Renter-occupied |
| Single Unit, Detached | 940 (97.4%) | 25 (2.6%) |
| Single Unit, Attached | 32 (100.0%) | 0 (0.0%) |
| 2 Unit Apartments | 0 (0.0%) | 0 (0.0%) |
| 3 or 4 Unit Apartments | 0 (0.0%) | 0 (0.0%) |
| 5 to 9 Unit Apartments | 0 (0.0%) | 0 (0.0%) |
| 10 or more Apartments | 0 (0.0%) | 0 (0.0%) |
| Mobile Home / Other | 0 (0.0%) | 0 (0.0%) |
| Total | 972 (97.5%) | 25 (2.5%) |
Housing Structures by Number of Rooms in University Park
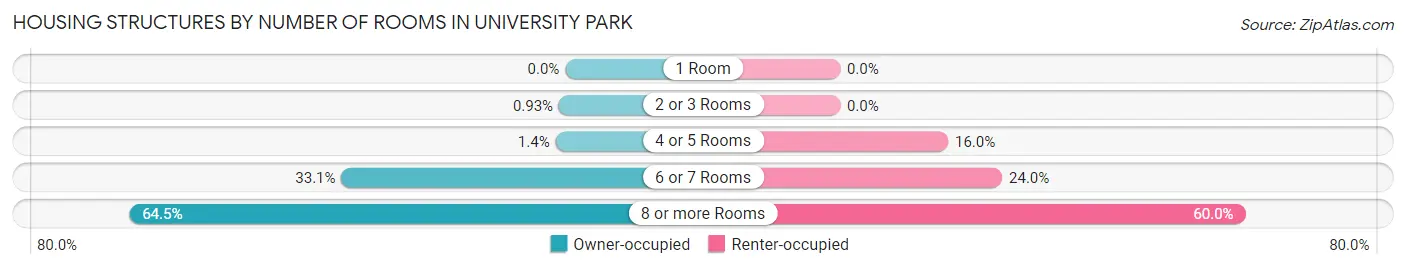
| Number of Rooms | Owner-occupied | Renter-occupied |
| 1 Room | 0 (0.0%) | 0 (0.0%) |
| 2 or 3 Rooms | 9 (0.9%) | 0 (0.0%) |
| 4 or 5 Rooms | 14 (1.4%) | 4 (16.0%) |
| 6 or 7 Rooms | 322 (33.1%) | 6 (24.0%) |
| 8 or more Rooms | 627 (64.5%) | 15 (60.0%) |
| Total | 972 (100.0%) | 25 (100.0%) |
Housing Structure by Heating Type in University Park
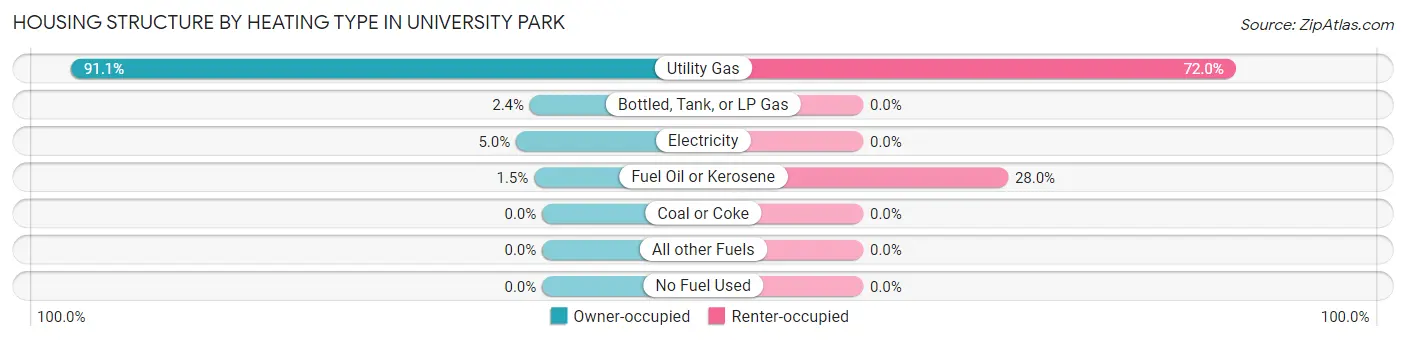
| Heating Type | Owner-occupied | Renter-occupied |
| Utility Gas | 885 (91.0%) | 18 (72.0%) |
| Bottled, Tank, or LP Gas | 23 (2.4%) | 0 (0.0%) |
| Electricity | 49 (5.0%) | 0 (0.0%) |
| Fuel Oil or Kerosene | 15 (1.5%) | 7 (28.0%) |
| Coal or Coke | 0 (0.0%) | 0 (0.0%) |
| All other Fuels | 0 (0.0%) | 0 (0.0%) |
| No Fuel Used | 0 (0.0%) | 0 (0.0%) |
| Total | 972 (100.0%) | 25 (100.0%) |
Household Vehicle Usage in University Park
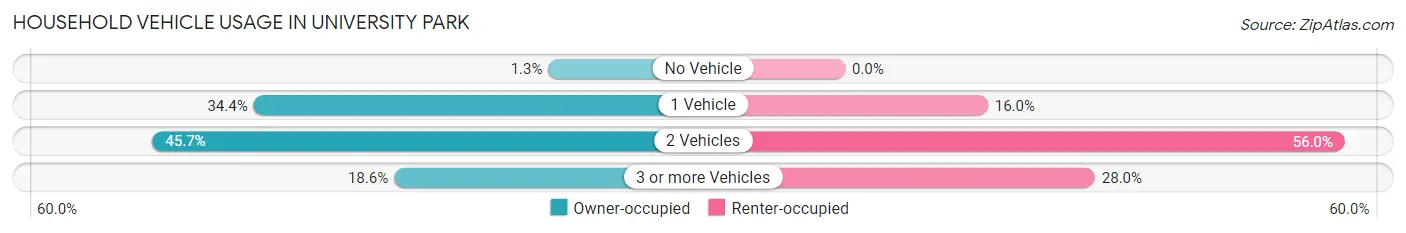
| Vehicles per Household | Owner-occupied | Renter-occupied |
| No Vehicle | 13 (1.3%) | 0 (0.0%) |
| 1 Vehicle | 334 (34.4%) | 4 (16.0%) |
| 2 Vehicles | 444 (45.7%) | 14 (56.0%) |
| 3 or more Vehicles | 181 (18.6%) | 7 (28.0%) |
| Total | 972 (100.0%) | 25 (100.0%) |
Real Estate & Mortgages in University Park
Real Estate and Mortgage Overview in University Park
| Characteristic | Without Mortgage | With Mortgage |
| Housing Units | 325 | 647 |
| Median Property Value | $496,900 | $612,100 |
| Median Household Income | $131,343 | $471 |
| Monthly Housing Costs | $1,104 | $423 |
| Real Estate Taxes | $8,521 | $0 |
Property Value by Mortgage Status in University Park
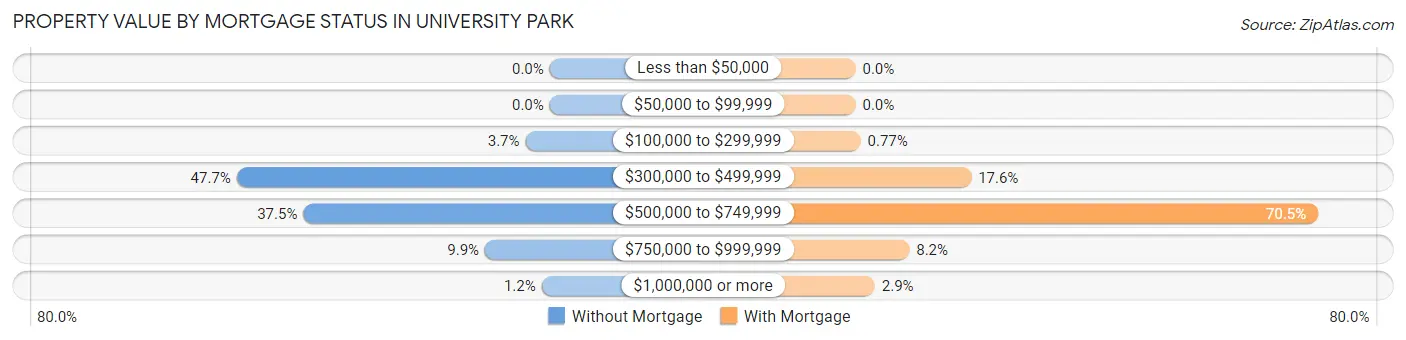
| Property Value | Without Mortgage | With Mortgage |
| Less than $50,000 | 0 (0.0%) | 0 (0.0%) |
| $50,000 to $99,999 | 0 (0.0%) | 0 (0.0%) |
| $100,000 to $299,999 | 12 (3.7%) | 5 (0.8%) |
| $300,000 to $499,999 | 155 (47.7%) | 114 (17.6%) |
| $500,000 to $749,999 | 122 (37.5%) | 456 (70.5%) |
| $750,000 to $999,999 | 32 (9.9%) | 53 (8.2%) |
| $1,000,000 or more | 4 (1.2%) | 19 (2.9%) |
| Total | 325 (100.0%) | 647 (100.0%) |
Household Income by Mortgage Status in University Park
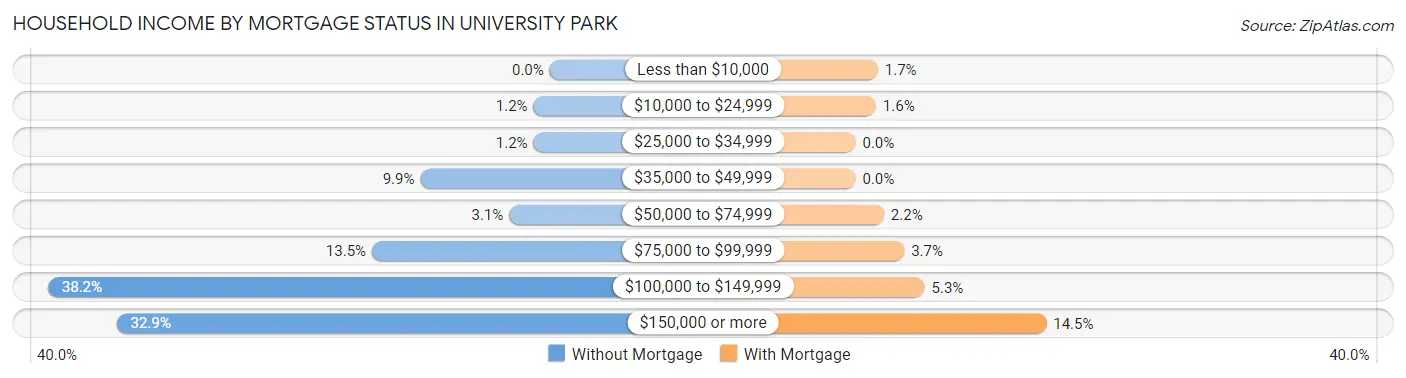
| Household Income | Without Mortgage | With Mortgage |
| Less than $10,000 | 0 (0.0%) | 11 (1.7%) |
| $10,000 to $24,999 | 4 (1.2%) | 10 (1.5%) |
| $25,000 to $34,999 | 4 (1.2%) | 0 (0.0%) |
| $35,000 to $49,999 | 32 (9.9%) | 0 (0.0%) |
| $50,000 to $74,999 | 10 (3.1%) | 14 (2.2%) |
| $75,000 to $99,999 | 44 (13.5%) | 24 (3.7%) |
| $100,000 to $149,999 | 124 (38.2%) | 34 (5.3%) |
| $150,000 or more | 107 (32.9%) | 94 (14.5%) |
| Total | 325 (100.0%) | 647 (100.0%) |
Property Value to Household Income Ratio in University Park
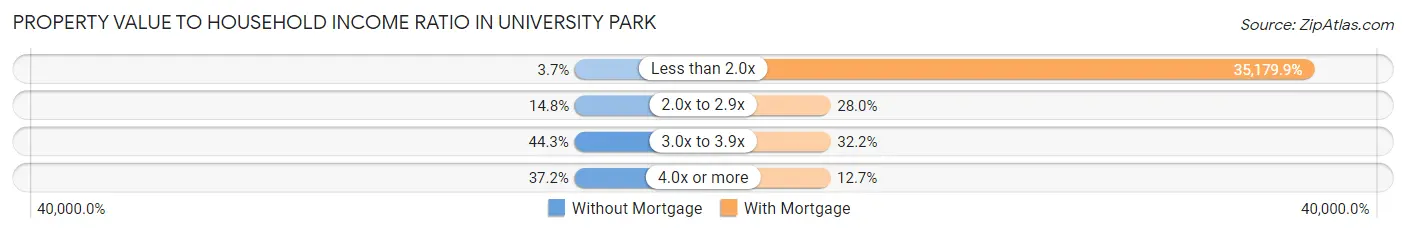
| Value-to-Income Ratio | Without Mortgage | With Mortgage |
| Less than 2.0x | 12 (3.7%) | 227,614 (35,179.9%) |
| 2.0x to 2.9x | 48 (14.8%) | 181 (28.0%) |
| 3.0x to 3.9x | 144 (44.3%) | 208 (32.2%) |
| 4.0x or more | 121 (37.2%) | 82 (12.7%) |
| Total | 325 (100.0%) | 647 (100.0%) |
Real Estate Taxes by Mortgage Status in University Park
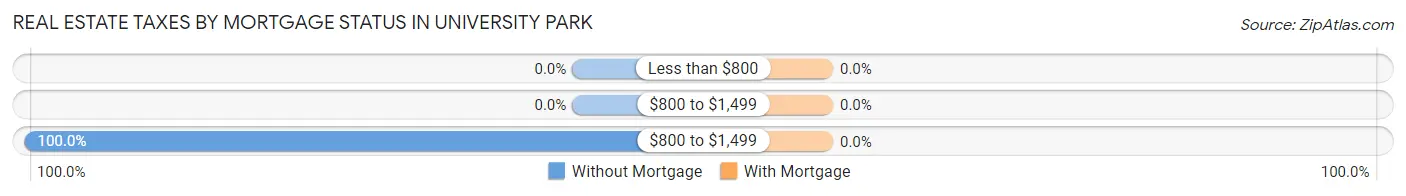
| Property Taxes | Without Mortgage | With Mortgage |
| Less than $800 | 0 (0.0%) | 0 (0.0%) |
| $800 to $1,499 | 0 (0.0%) | 0 (0.0%) |
| $800 to $1,499 | 325 (100.0%) | 0 (0.0%) |
| Total | 325 (100.0%) | 647 (100.0%) |
Health & Disability in University Park
Health Insurance Coverage by Age in University Park
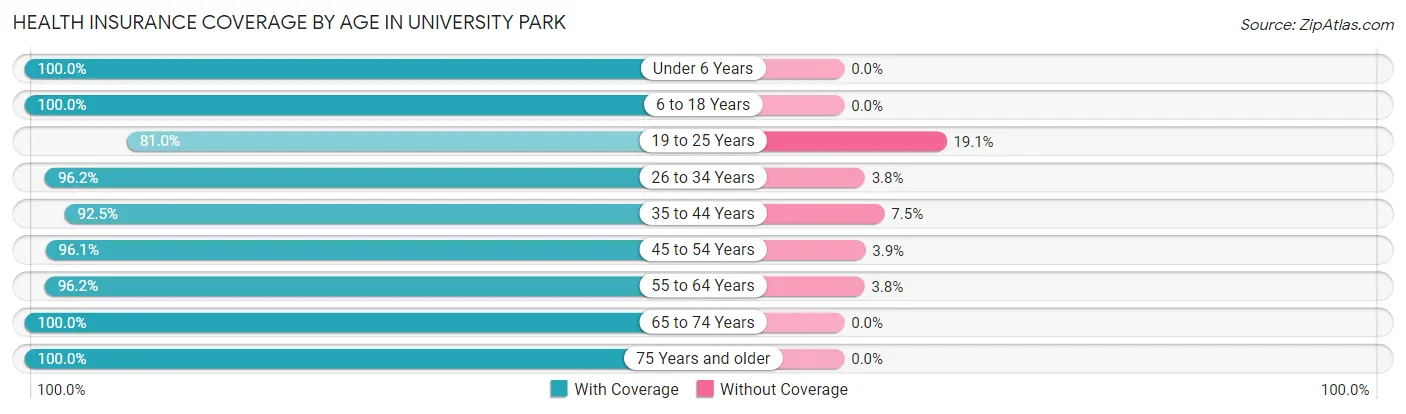
| Age Bracket | With Coverage | Without Coverage |
| Under 6 Years | 184 (100.0%) | 0 (0.0%) |
| 6 to 18 Years | 344 (100.0%) | 0 (0.0%) |
| 19 to 25 Years | 68 (80.9%) | 16 (19.1%) |
| 26 to 34 Years | 202 (96.2%) | 8 (3.8%) |
| 35 to 44 Years | 396 (92.5%) | 32 (7.5%) |
| 45 to 54 Years | 368 (96.1%) | 15 (3.9%) |
| 55 to 64 Years | 384 (96.2%) | 15 (3.8%) |
| 65 to 74 Years | 414 (100.0%) | 0 (0.0%) |
| 75 Years and older | 160 (100.0%) | 0 (0.0%) |
| Total | 2,520 (96.7%) | 86 (3.3%) |
Health Insurance Coverage by Citizenship Status in University Park
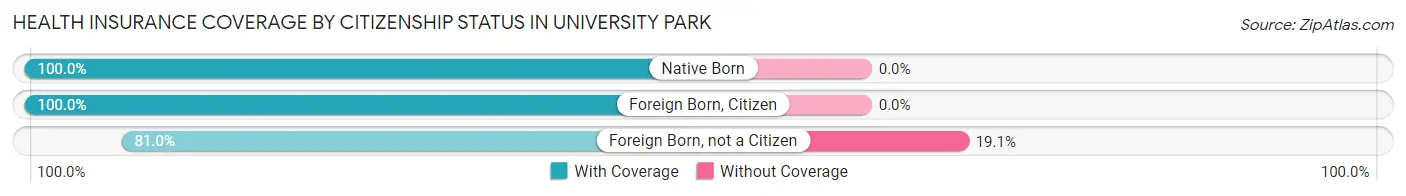
| Citizenship Status | With Coverage | Without Coverage |
| Native Born | 184 (100.0%) | 0 (0.0%) |
| Foreign Born, Citizen | 344 (100.0%) | 0 (0.0%) |
| Foreign Born, not a Citizen | 68 (80.9%) | 16 (19.1%) |
Health Insurance Coverage by Household Income in University Park
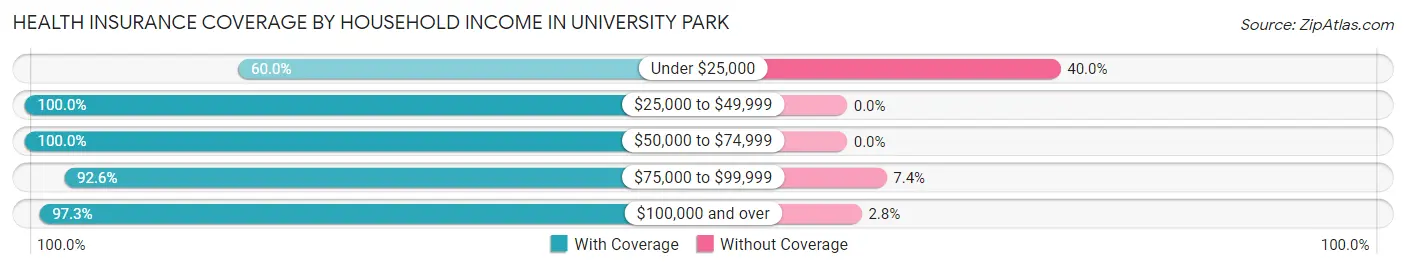
| Household Income | With Coverage | Without Coverage |
| Under $25,000 | 18 (60.0%) | 12 (40.0%) |
| $25,000 to $49,999 | 54 (100.0%) | 0 (0.0%) |
| $50,000 to $74,999 | 44 (100.0%) | 0 (0.0%) |
| $75,000 to $99,999 | 125 (92.6%) | 10 (7.4%) |
| $100,000 and over | 2,264 (97.3%) | 64 (2.8%) |
Public vs Private Health Insurance Coverage by Age in University Park
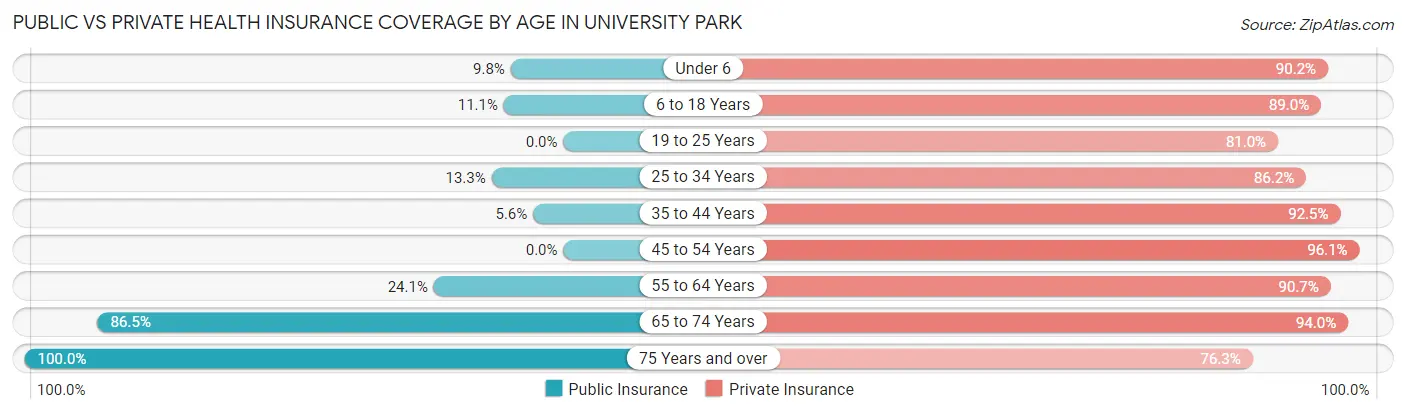
| Age Bracket | Public Insurance | Private Insurance |
| Under 6 | 18 (9.8%) | 166 (90.2%) |
| 6 to 18 Years | 38 (11.1%) | 306 (88.9%) |
| 19 to 25 Years | 0 (0.0%) | 68 (80.9%) |
| 25 to 34 Years | 28 (13.3%) | 181 (86.2%) |
| 35 to 44 Years | 24 (5.6%) | 396 (92.5%) |
| 45 to 54 Years | 0 (0.0%) | 368 (96.1%) |
| 55 to 64 Years | 96 (24.1%) | 362 (90.7%) |
| 65 to 74 Years | 358 (86.5%) | 389 (94.0%) |
| 75 Years and over | 160 (100.0%) | 122 (76.2%) |
| Total | 722 (27.7%) | 2,358 (90.5%) |
Disability Status by Sex by Age in University Park
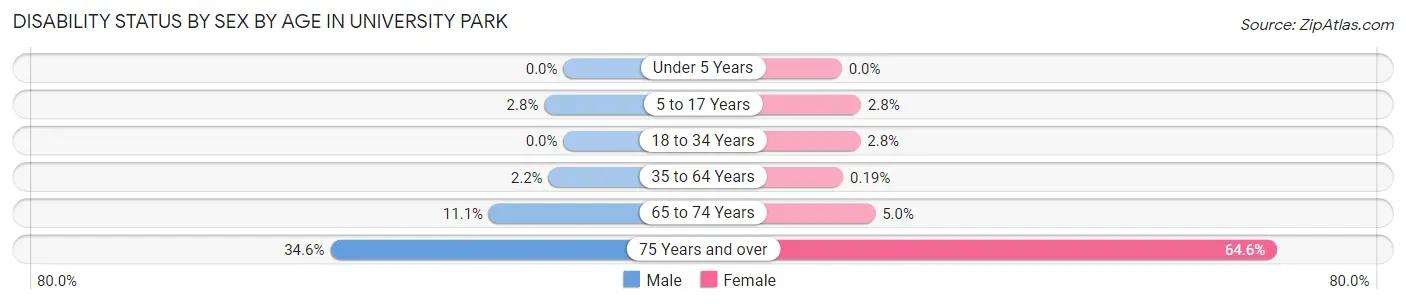
| Age Bracket | Male | Female |
| Under 5 Years | 0 (0.0%) | 0 (0.0%) |
| 5 to 17 Years | 5 (2.8%) | 6 (2.8%) |
| 18 to 34 Years | 0 (0.0%) | 4 (2.8%) |
| 35 to 64 Years | 15 (2.2%) | 1 (0.2%) |
| 65 to 74 Years | 19 (11.1%) | 12 (5.0%) |
| 75 Years and over | 27 (34.6%) | 53 (64.6%) |
Disability Class by Sex by Age in University Park
Disability Class: Hearing Difficulty
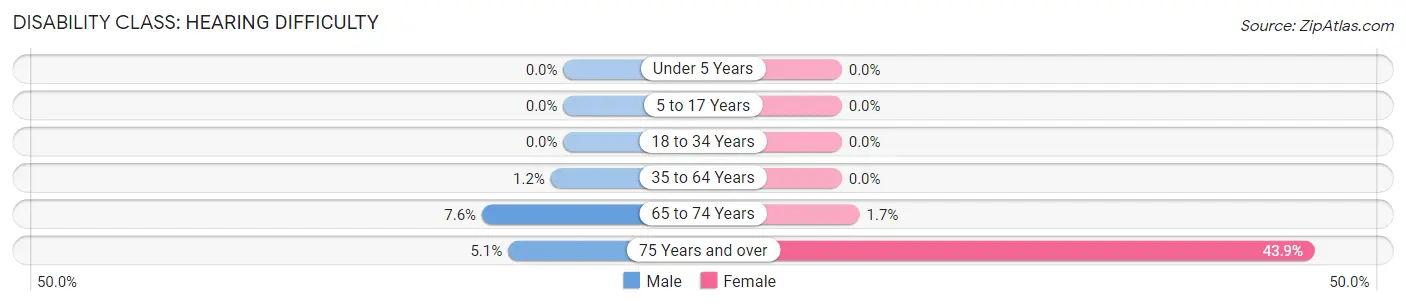
| Age Bracket | Male | Female |
| Under 5 Years | 0 (0.0%) | 0 (0.0%) |
| 5 to 17 Years | 0 (0.0%) | 0 (0.0%) |
| 18 to 34 Years | 0 (0.0%) | 0 (0.0%) |
| 35 to 64 Years | 8 (1.2%) | 0 (0.0%) |
| 65 to 74 Years | 13 (7.6%) | 4 (1.7%) |
| 75 Years and over | 4 (5.1%) | 36 (43.9%) |
Disability Class: Vision Difficulty
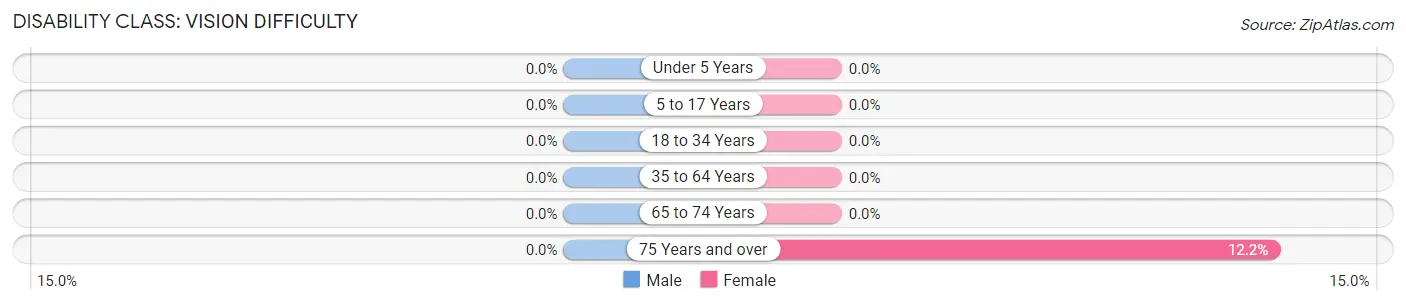
| Age Bracket | Male | Female |
| Under 5 Years | 0 (0.0%) | 0 (0.0%) |
| 5 to 17 Years | 0 (0.0%) | 0 (0.0%) |
| 18 to 34 Years | 0 (0.0%) | 0 (0.0%) |
| 35 to 64 Years | 0 (0.0%) | 0 (0.0%) |
| 65 to 74 Years | 0 (0.0%) | 0 (0.0%) |
| 75 Years and over | 0 (0.0%) | 10 (12.2%) |
Disability Class: Cognitive Difficulty
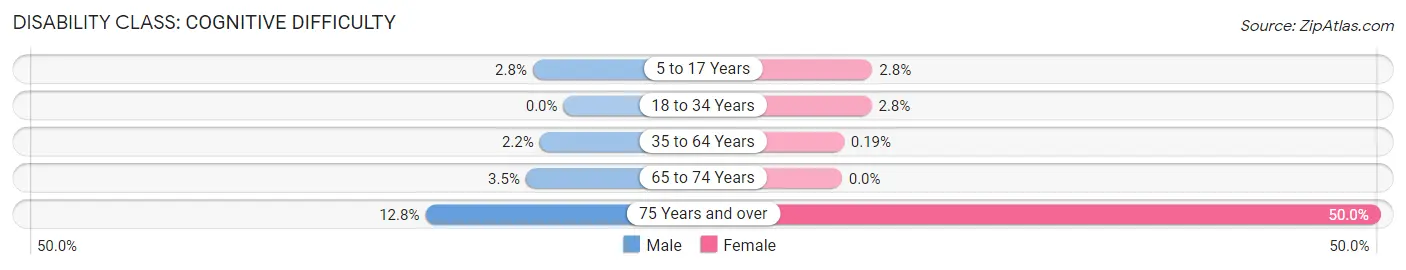
| Age Bracket | Male | Female |
| 5 to 17 Years | 5 (2.8%) | 6 (2.8%) |
| 18 to 34 Years | 0 (0.0%) | 4 (2.8%) |
| 35 to 64 Years | 15 (2.2%) | 1 (0.2%) |
| 65 to 74 Years | 6 (3.5%) | 0 (0.0%) |
| 75 Years and over | 10 (12.8%) | 41 (50.0%) |
Disability Class: Ambulatory Difficulty
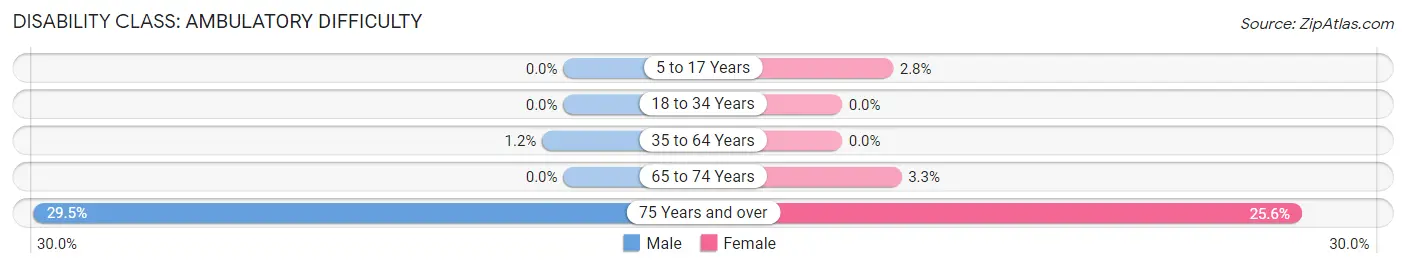
| Age Bracket | Male | Female |
| 5 to 17 Years | 0 (0.0%) | 6 (2.8%) |
| 18 to 34 Years | 0 (0.0%) | 0 (0.0%) |
| 35 to 64 Years | 8 (1.2%) | 0 (0.0%) |
| 65 to 74 Years | 0 (0.0%) | 8 (3.3%) |
| 75 Years and over | 23 (29.5%) | 21 (25.6%) |
Disability Class: Self-Care Difficulty
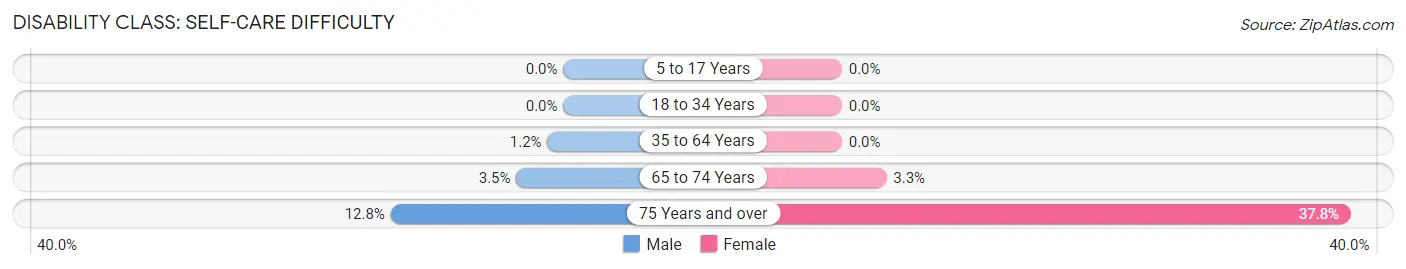
| Age Bracket | Male | Female |
| 5 to 17 Years | 0 (0.0%) | 0 (0.0%) |
| 18 to 34 Years | 0 (0.0%) | 0 (0.0%) |
| 35 to 64 Years | 8 (1.2%) | 0 (0.0%) |
| 65 to 74 Years | 6 (3.5%) | 8 (3.3%) |
| 75 Years and over | 10 (12.8%) | 31 (37.8%) |
Technology Access in University Park
Computing Device Access in University Park
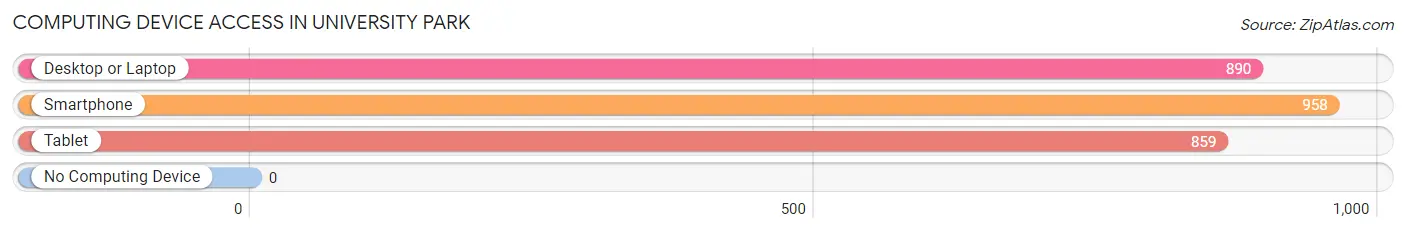
| Device Type | # Households | % Households |
| Desktop or Laptop | 890 | 89.3% |
| Smartphone | 958 | 96.1% |
| Tablet | 859 | 86.2% |
| No Computing Device | 0 | 0.0% |
| Total | 997 | 100.0% |
Internet Access in University Park
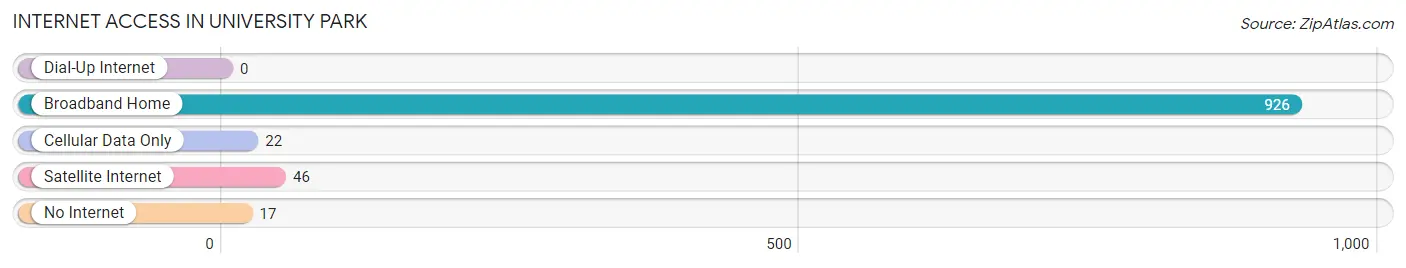
| Internet Type | # Households | % Households |
| Dial-Up Internet | 0 | 0.0% |
| Broadband Home | 926 | 92.9% |
| Cellular Data Only | 22 | 2.2% |
| Satellite Internet | 46 | 4.6% |
| No Internet | 17 | 1.7% |
| Total | 997 | 100.0% |
University Park Summary
University Park, Maryland is a small town located in Prince George’s County, Maryland, just outside of Washington, D.C. It is a part of the Washington Metropolitan Area and is home to a population of 8,521 people as of the 2010 census. The town is known for its small-town charm and its close proximity to the nation’s capital.
History
University Park was founded in 1894 by the University Park Company, which was formed by a group of investors from the University of Maryland. The town was originally intended to be a residential community for faculty and staff of the university. The town was incorporated in 1931 and was named after the university.
Geography
University Park is located in Prince George’s County, Maryland, just outside of Washington, D.C. It is bordered by the cities of Hyattsville and College Park to the north, and by the towns of Berwyn Heights and Riverdale Park to the south. The town is situated on a plateau, with an elevation of about 200 feet above sea level. The town covers an area of 1.2 square miles, with a population density of 6,945 people per square mile.
Economy
University Park is primarily a residential community, with most of its residents employed in the nearby cities of Washington, D.C. and Baltimore. The town is home to a few small businesses, including a grocery store, a pharmacy, and a few restaurants. The town is also home to the University of Maryland, which is the largest employer in the area.
Demographics
As of the 2010 census, University Park had a population of 8,521 people. The racial makeup of the town was 57.3% White, 28.2% African American, 0.3% Native American, 5.2% Asian, 0.1% Pacific Islander, and 8.9% from other races. The median household income was $76,945, and the median family income was $90,945. The per capita income was $37,945.
University Park is a small town with a rich history and a close proximity to the nation’s capital. It is a diverse community with a strong economy and a high quality of life. The town is a great place to live and work, and is a great place to call home.
Common Questions
What is Per Capita Income in University Park?
Per Capita income in University Park is $87,613.
What is the Median Family Income in University Park?
Median Family Income in University Park is $213,750.
What is the Median Household income in University Park?
Median Household Income in University Park is $191,205.
What is Income or Wage Gap in University Park?
Income or Wage Gap in University Park is 3.3%.
Women in University Park earn 96.7 cents for every dollar earned by a man.
What is Inequality or Gini Index in University Park?
Inequality or Gini Index in University Park is 0.35.
What is the Total Population of University Park?
Total Population of University Park is 2,610.
What is the Total Male Population of University Park?
Total Male Population of University Park is 1,339.
What is the Total Female Population of University Park?
Total Female Population of University Park is 1,271.
What is the Ratio of Males per 100 Females in University Park?
There are 105.35 Males per 100 Females in University Park.
What is the Ratio of Females per 100 Males in University Park?
There are 94.92 Females per 100 Males in University Park.
What is the Median Population Age in University Park?
Median Population Age in University Park is 47.0 Years.
What is the Average Family Size in University Park
Average Family Size in University Park is 2.9 People.
What is the Average Household Size in University Park
Average Household Size in University Park is 2.6 People.
How Large is the Labor Force in University Park?
There are 1,337 People in the Labor Forcein in University Park.
What is the Percentage of People in the Labor Force in University Park?
63.3% of People are in the Labor Force in University Park.
What is the Unemployment Rate in University Park?
Unemployment Rate in University Park is 0.7%.