Timonium, MD Map & Demographics
Timonium Map
Timonium Overview
$61,675
PER CAPITA INCOME
$163,779
AVG FAMILY INCOME
$130,811
AVG HOUSEHOLD INCOME
25.5%
WAGE / INCOME GAP [ % ]
74.5¢/ $1
WAGE / INCOME GAP [ $ ]
0.43
INEQUALITY / GINI INDEX
10,793
TOTAL POPULATION
5,389
MALE POPULATION
5,404
FEMALE POPULATION
99.72
MALES / 100 FEMALES
100.28
FEMALES / 100 MALES
49.0
MEDIAN AGE
3.1
AVG FAMILY SIZE
2.5
AVG HOUSEHOLD SIZE
5,560
LABOR FORCE [ PEOPLE ]
60.8%
PERCENT IN LABOR FORCE
4.5%
UNEMPLOYMENT RATE
Timonium Area Codes
Income in Timonium
Income Overview in Timonium
Per Capita Income in Timonium is $61,675, while median incomes of families and households are $163,779 and $130,811 respectively.
| Characteristic | Number | Measure |
| Per Capita Income | 10,793 | $61,675 |
| Median Family Income | 2,806 | $163,779 |
| Mean Family Income | 2,806 | $196,104 |
| Median Household Income | 4,017 | $130,811 |
| Mean Household Income | 4,017 | $160,815 |
| Income Deficit | 2,806 | $0 |
| Wage / Income Gap (%) | 10,793 | 25.54% |
| Wage / Income Gap ($) | 10,793 | 74.46¢ per $1 |
| Gini / Inequality Index | 10,793 | 0.43 |
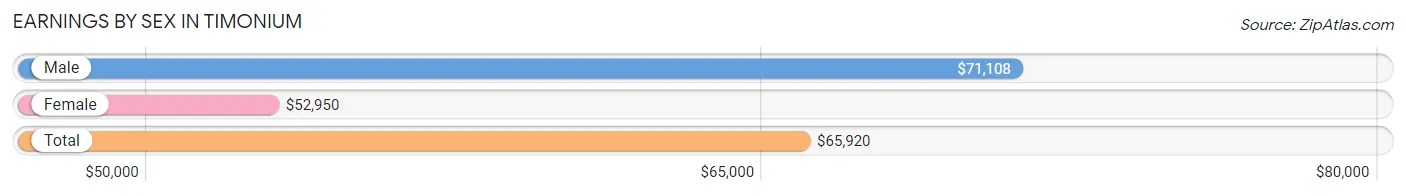
Earnings by Sex in Timonium
Average Earnings in Timonium are $65,920, $71,108 for men and $52,950 for women, a difference of 25.5%.
| Sex | Number | Average Earnings |
| Male | 3,261 (57.1%) | $71,108 |
| Female | 2,453 (42.9%) | $52,950 |
| Total | 5,714 (100.0%) | $65,920 |
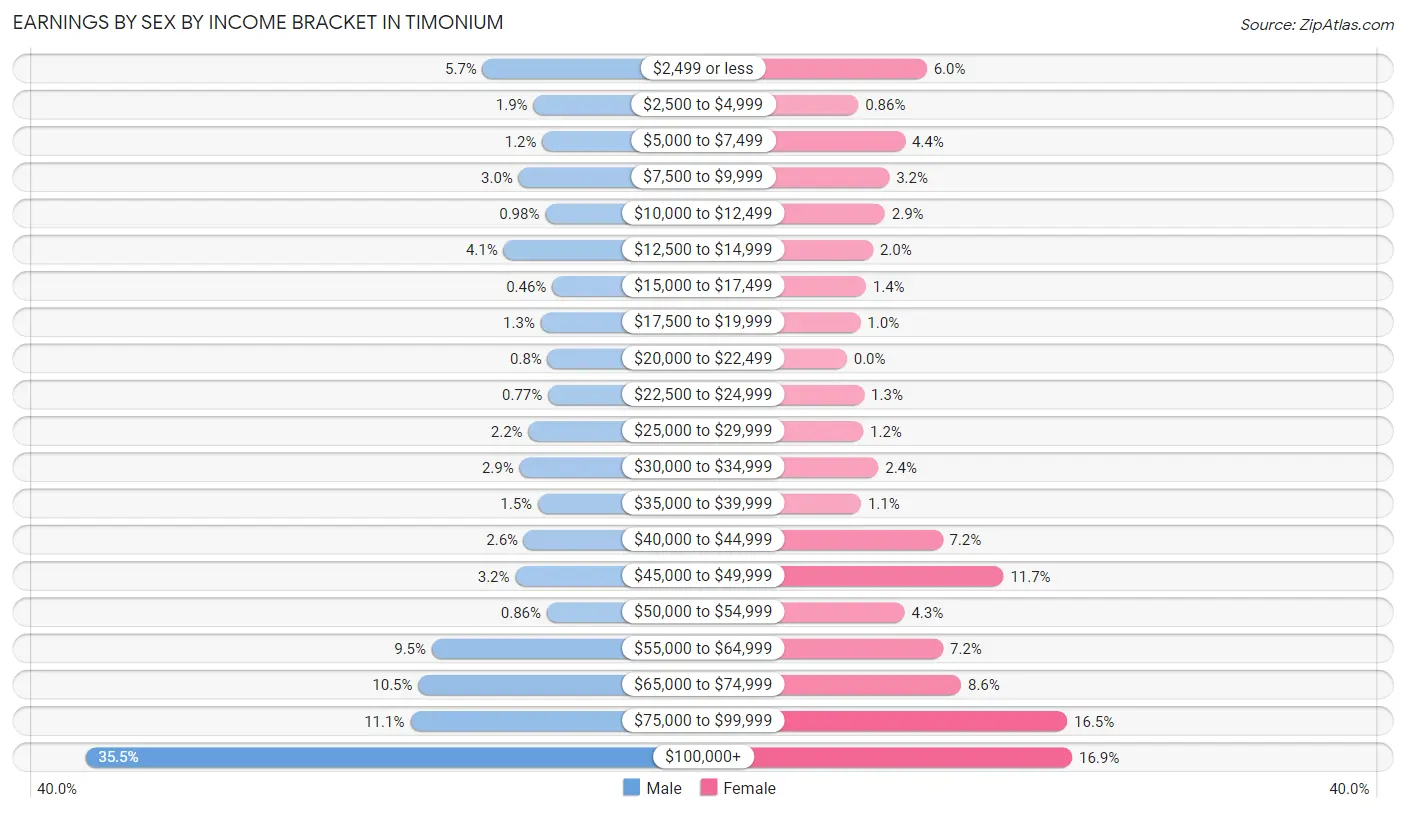
Earnings by Sex by Income Bracket in Timonium
The most common earnings brackets in Timonium are $100,000+ for men (1,156 | 35.4%) and $100,000+ for women (414 | 16.9%).
| Income | Male | Female |
| $2,499 or less | 185 (5.7%) | 147 (6.0%) |
| $2,500 to $4,999 | 61 (1.9%) | 21 (0.9%) |
| $5,000 to $7,499 | 39 (1.2%) | 107 (4.4%) |
| $7,500 to $9,999 | 97 (3.0%) | 78 (3.2%) |
| $10,000 to $12,499 | 32 (1.0%) | 70 (2.9%) |
| $12,500 to $14,999 | 134 (4.1%) | 48 (2.0%) |
| $15,000 to $17,499 | 15 (0.5%) | 35 (1.4%) |
| $17,500 to $19,999 | 43 (1.3%) | 25 (1.0%) |
| $20,000 to $22,499 | 26 (0.8%) | 0 (0.0%) |
| $22,500 to $24,999 | 25 (0.8%) | 32 (1.3%) |
| $25,000 to $29,999 | 73 (2.2%) | 30 (1.2%) |
| $30,000 to $34,999 | 95 (2.9%) | 58 (2.4%) |
| $35,000 to $39,999 | 50 (1.5%) | 26 (1.1%) |
| $40,000 to $44,999 | 84 (2.6%) | 176 (7.2%) |
| $45,000 to $49,999 | 105 (3.2%) | 288 (11.7%) |
| $50,000 to $54,999 | 28 (0.9%) | 106 (4.3%) |
| $55,000 to $64,999 | 309 (9.5%) | 177 (7.2%) |
| $65,000 to $74,999 | 342 (10.5%) | 210 (8.6%) |
| $75,000 to $99,999 | 362 (11.1%) | 405 (16.5%) |
| $100,000+ | 1,156 (35.4%) | 414 (16.9%) |
| Total | 3,261 (100.0%) | 2,453 (100.0%) |
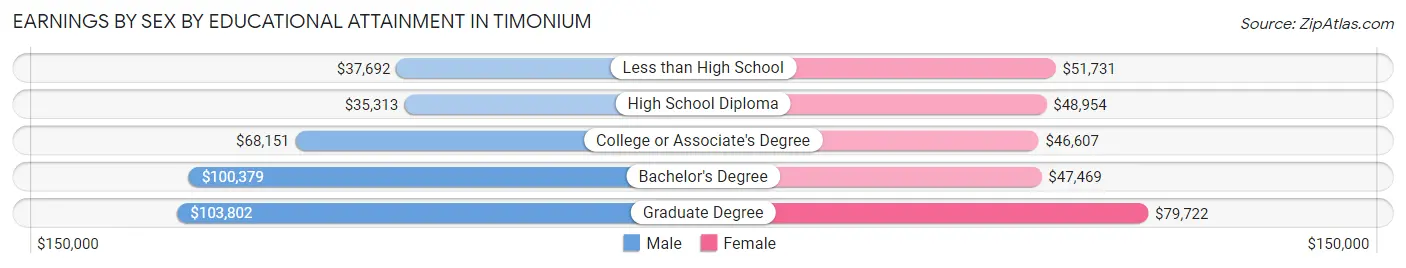
Earnings by Sex by Educational Attainment in Timonium
Average earnings in Timonium are $75,753 for men and $56,890 for women, a difference of 24.9%. Men with an educational attainment of graduate degree enjoy the highest average annual earnings of $103,802, while those with high school diploma education earn the least with $35,313. Women with an educational attainment of graduate degree earn the most with the average annual earnings of $79,722, while those with college or associate's degree education have the smallest earnings of $46,607.
| Educational Attainment | Male Income | Female Income |
| Less than High School | $37,692 | $51,731 |
| High School Diploma | $35,313 | $48,954 |
| College or Associate's Degree | $68,151 | $46,607 |
| Bachelor's Degree | $100,379 | $47,469 |
| Graduate Degree | $103,802 | $79,722 |
| Total | $75,753 | $56,890 |
Family Income in Timonium
Family Income Brackets in Timonium
According to the Timonium family income data, there are 842 families falling into the $200,000+ income range, which is the most common income bracket and makes up 30.0% of all families.
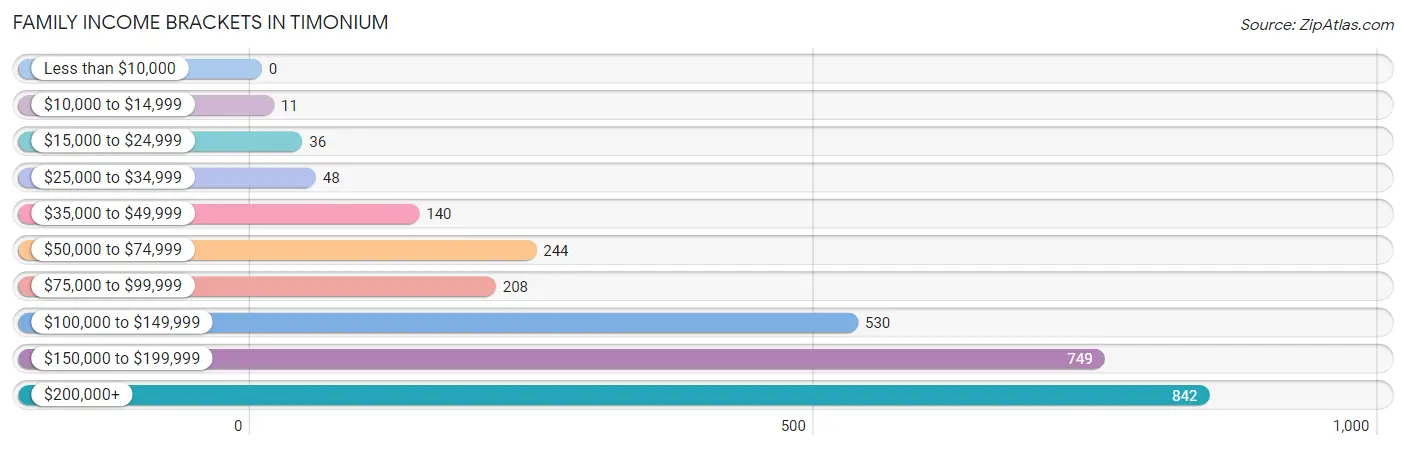
| Income Bracket | # Families | % Families |
| Less than $10,000 | 0 | 0.0% |
| $10,000 to $14,999 | 11 | 0.4% |
| $15,000 to $24,999 | 36 | 1.3% |
| $25,000 to $34,999 | 48 | 1.7% |
| $35,000 to $49,999 | 140 | 5.0% |
| $50,000 to $74,999 | 244 | 8.7% |
| $75,000 to $99,999 | 208 | 7.4% |
| $100,000 to $149,999 | 530 | 18.9% |
| $150,000 to $199,999 | 749 | 26.7% |
| $200,000+ | 842 | 30.0% |
Family Income by Famaliy Size in Timonium
4-person families (645 | 23.0%) account for the highest median family income in Timonium with $239,659 per family, while 2-person families (1,265 | 45.1%) have the highest median income of $67,774 per family member.
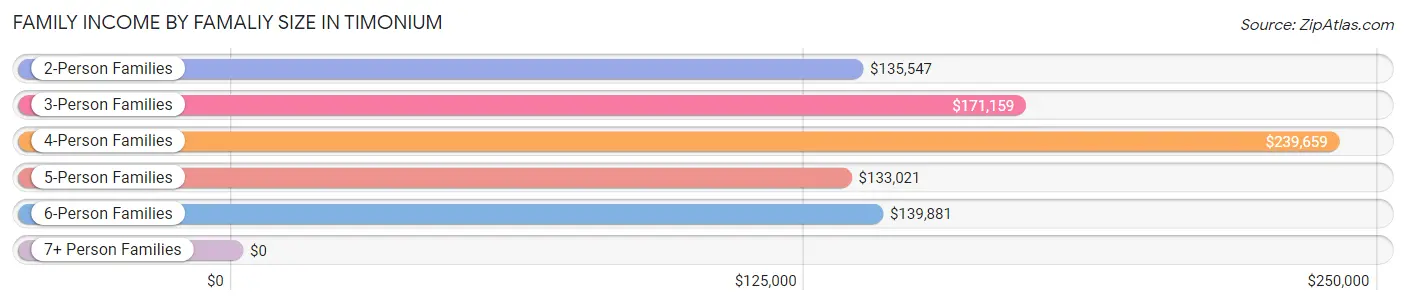
| Income Bracket | # Families | Median Income |
| 2-Person Families | 1,265 (45.1%) | $135,547 |
| 3-Person Families | 668 (23.8%) | $171,159 |
| 4-Person Families | 645 (23.0%) | $239,659 |
| 5-Person Families | 161 (5.7%) | $133,021 |
| 6-Person Families | 58 (2.1%) | $139,881 |
| 7+ Person Families | 9 (0.3%) | $0 |
| Total | 2,806 (100.0%) | $163,779 |
Family Income by Number of Earners in Timonium
The median family income in Timonium is $163,779, with families comprising 3+ earners (359) having the highest median family income of $193,977, while families with no earners (302) have the lowest median family income of $76,429, accounting for 12.8% and 10.8% of families, respectively.
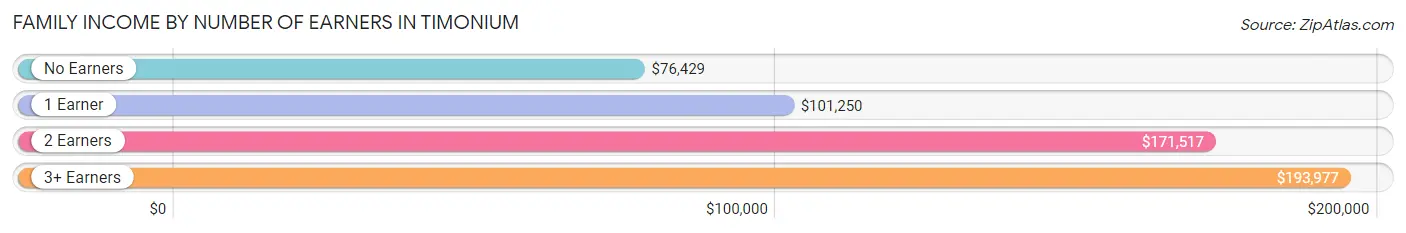
| Number of Earners | # Families | Median Income |
| No Earners | 302 (10.8%) | $76,429 |
| 1 Earner | 675 (24.1%) | $101,250 |
| 2 Earners | 1,470 (52.4%) | $171,517 |
| 3+ Earners | 359 (12.8%) | $193,977 |
| Total | 2,806 (100.0%) | $163,779 |
Household Income in Timonium
Household Income Brackets in Timonium
With 924 households falling in the category, the $200,000+ income range is the most frequent in Timonium, accounting for 23.0% of all households. In contrast, only 20 households (0.5%) fall into the $10,000 to $14,999 income bracket, making it the least populous group.
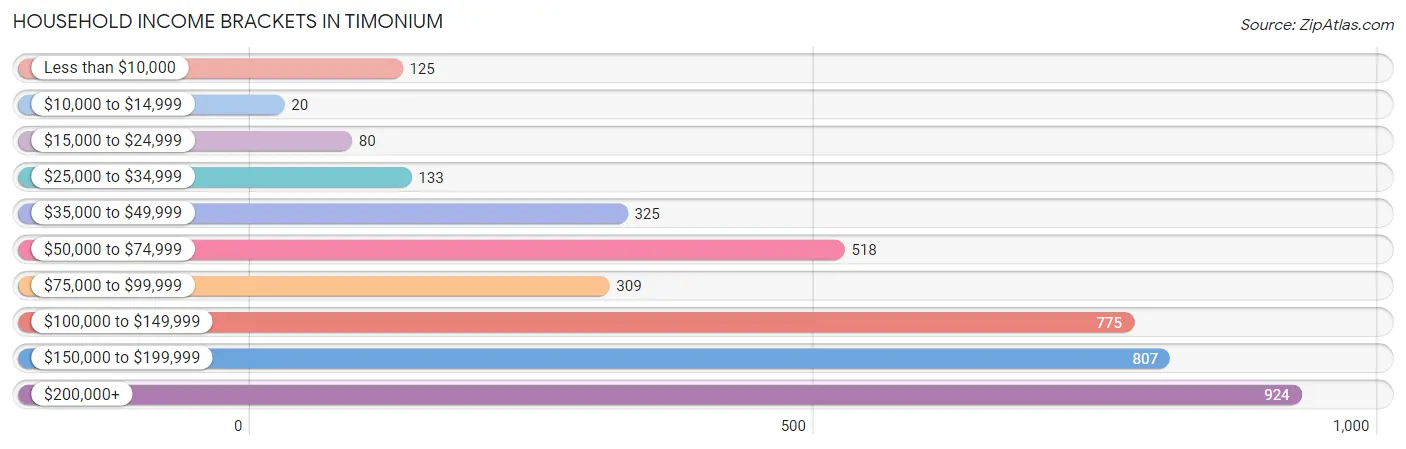
| Income Bracket | # Households | % Households |
| Less than $10,000 | 125 | 3.1% |
| $10,000 to $14,999 | 20 | 0.5% |
| $15,000 to $24,999 | 80 | 2.0% |
| $25,000 to $34,999 | 133 | 3.3% |
| $35,000 to $49,999 | 325 | 8.1% |
| $50,000 to $74,999 | 518 | 12.9% |
| $75,000 to $99,999 | 309 | 7.7% |
| $100,000 to $149,999 | 775 | 19.3% |
| $150,000 to $199,999 | 807 | 20.1% |
| $200,000+ | 924 | 23.0% |
Household Income by Householder Age in Timonium
The median household income in Timonium is $130,811, with the highest median household income of $168,068 found in the 45 to 64 years age bracket for the primary householder. A total of 1,673 households (41.6%) fall into this category. Meanwhile, the 15 to 24 years age bracket for the primary householder has the lowest median household income of $0, with 38 households (0.9%) in this group.
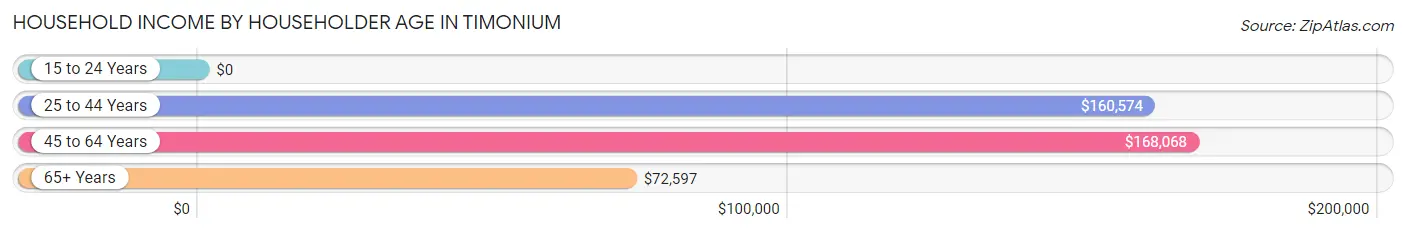
| Income Bracket | # Households | Median Income |
| 15 to 24 Years | 38 (0.9%) | $0 |
| 25 to 44 Years | 895 (22.3%) | $160,574 |
| 45 to 64 Years | 1,673 (41.6%) | $168,068 |
| 65+ Years | 1,411 (35.1%) | $72,597 |
| Total | 4,017 (100.0%) | $130,811 |
Poverty in Timonium
Income Below Poverty by Sex and Age in Timonium
With 3.4% poverty level for males and 3.4% for females among the residents of Timonium, 75 year old and over males and under 5 year old females are the most vulnerable to poverty, with 51 males (9.5%) and 17 females (8.4%) in their respective age groups living below the poverty level.
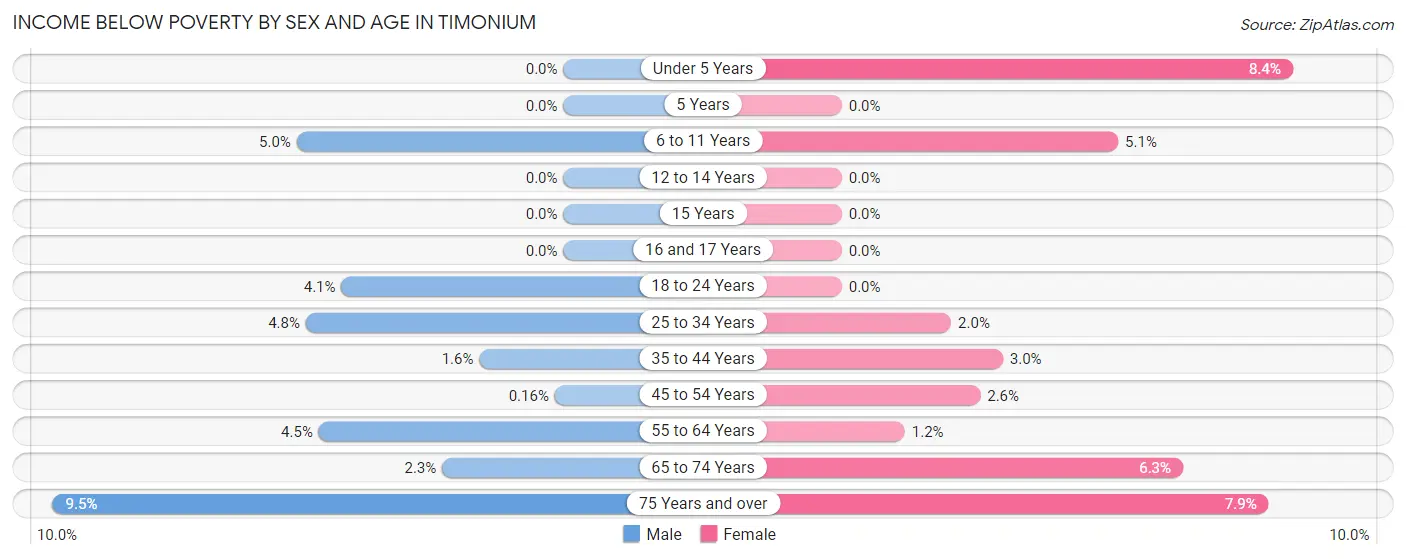
| Age Bracket | Male | Female |
| Under 5 Years | 0 (0.0%) | 17 (8.4%) |
| 5 Years | 0 (0.0%) | 0 (0.0%) |
| 6 to 11 Years | 14 (5.0%) | 20 (5.1%) |
| 12 to 14 Years | 0 (0.0%) | 0 (0.0%) |
| 15 Years | 0 (0.0%) | 0 (0.0%) |
| 16 and 17 Years | 0 (0.0%) | 0 (0.0%) |
| 18 to 24 Years | 12 (4.1%) | 0 (0.0%) |
| 25 to 34 Years | 36 (4.8%) | 10 (2.0%) |
| 35 to 44 Years | 8 (1.6%) | 18 (3.0%) |
| 45 to 54 Years | 1 (0.2%) | 17 (2.6%) |
| 55 to 64 Years | 44 (4.5%) | 11 (1.2%) |
| 65 to 74 Years | 10 (2.2%) | 29 (6.3%) |
| 75 Years and over | 51 (9.5%) | 48 (7.9%) |
| Total | 176 (3.4%) | 170 (3.4%) |
Income Above Poverty by Sex and Age in Timonium
According to the poverty statistics in Timonium, males aged under 5 years and females aged 5 years are the age groups that are most secure financially, with 100.0% of males and 100.0% of females in these age groups living above the poverty line.
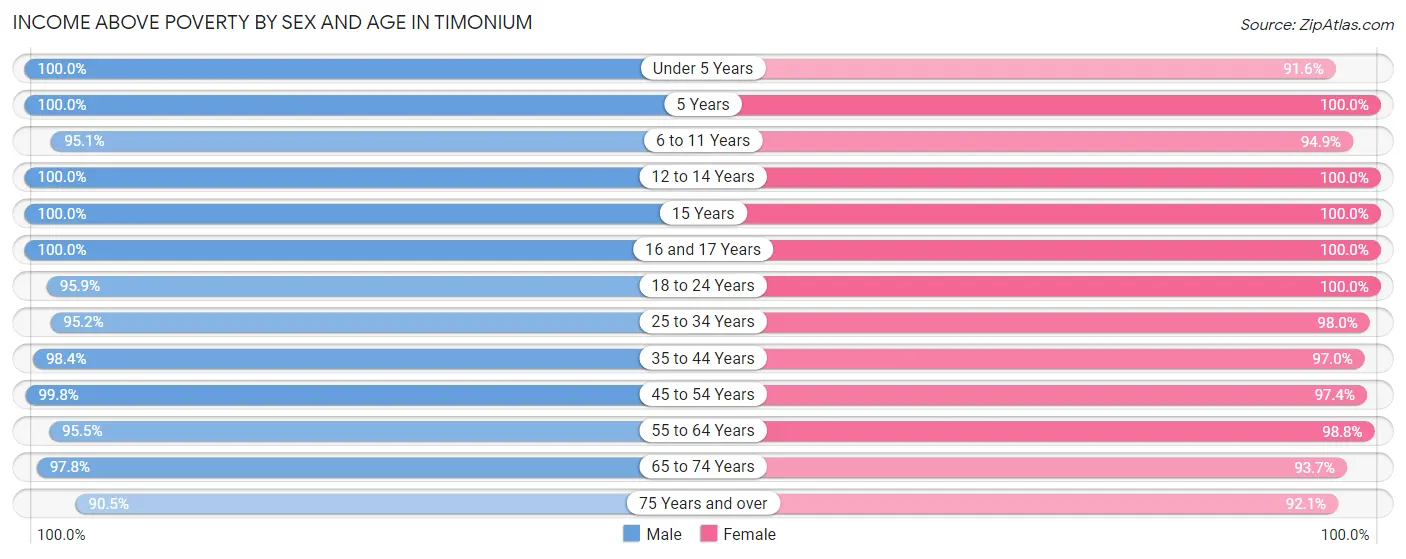
| Age Bracket | Male | Female |
| Under 5 Years | 161 (100.0%) | 186 (91.6%) |
| 5 Years | 83 (100.0%) | 35 (100.0%) |
| 6 to 11 Years | 269 (95.1%) | 370 (94.9%) |
| 12 to 14 Years | 175 (100.0%) | 197 (100.0%) |
| 15 Years | 41 (100.0%) | 71 (100.0%) |
| 16 and 17 Years | 227 (100.0%) | 235 (100.0%) |
| 18 to 24 Years | 279 (95.9%) | 130 (100.0%) |
| 25 to 34 Years | 717 (95.2%) | 482 (98.0%) |
| 35 to 44 Years | 505 (98.4%) | 584 (97.0%) |
| 45 to 54 Years | 641 (99.8%) | 644 (97.4%) |
| 55 to 64 Years | 925 (95.5%) | 928 (98.8%) |
| 65 to 74 Years | 434 (97.8%) | 429 (93.7%) |
| 75 Years and over | 487 (90.5%) | 558 (92.1%) |
| Total | 4,944 (96.6%) | 4,849 (96.6%) |
Income Below Poverty Among Married-Couple Families in Timonium
The poverty statistics for married-couple families in Timonium show that 1.4% or 35 of the total 2,439 families live below the poverty line. Families with 3 or 4 children have the highest poverty rate of 7.4%, comprising of 7 families. On the other hand, families with 5 or more children have the lowest poverty rate of 0.0%, which includes 0 families.
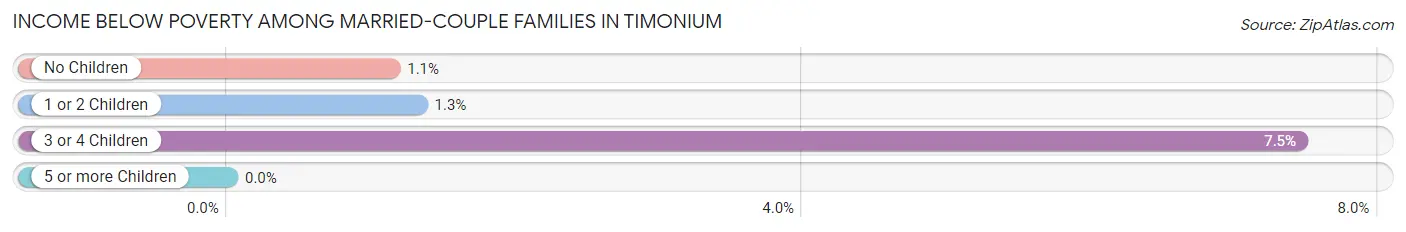
| Children | Above Poverty | Below Poverty |
| No Children | 1,485 (98.9%) | 17 (1.1%) |
| 1 or 2 Children | 823 (98.7%) | 11 (1.3%) |
| 3 or 4 Children | 87 (92.5%) | 7 (7.4%) |
| 5 or more Children | 9 (100.0%) | 0 (0.0%) |
| Total | 2,404 (98.6%) | 35 (1.4%) |
Income Below Poverty Among Single-Parent Households in Timonium
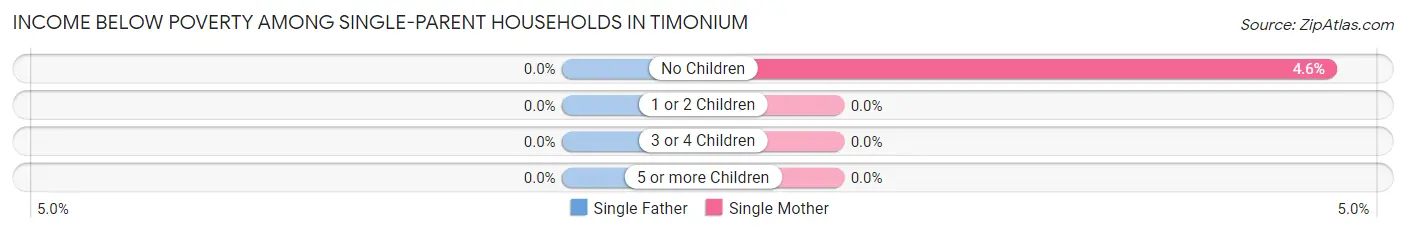
| Children | Single Father | Single Mother |
| No Children | 0 (0.0%) | 5 (4.6%) |
| 1 or 2 Children | 0 (0.0%) | 0 (0.0%) |
| 3 or 4 Children | 0 (0.0%) | 0 (0.0%) |
| 5 or more Children | 0 (0.0%) | 0 (0.0%) |
| Total | 0 (0.0%) | 5 (2.1%) |
Income Below Poverty Among Married-Couple vs Single-Parent Households in Timonium
The poverty data for Timonium shows that 35 of the married-couple family households (1.4%) and 5 of the single-parent households (1.4%) are living below the poverty level. Within the married-couple family households, those with 3 or 4 children have the highest poverty rate, with 7 households (7.4%) falling below the poverty line. Among the single-parent households, those with no children have the highest poverty rate, with 5 household (2.9%) living below poverty.
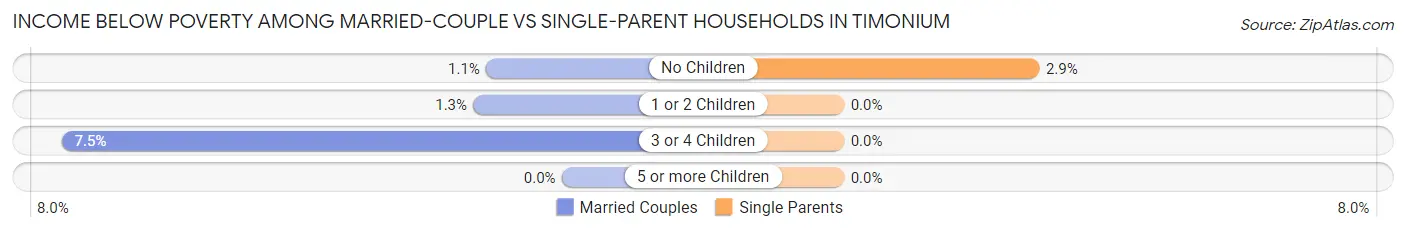
| Children | Married-Couple Families | Single-Parent Households |
| No Children | 17 (1.1%) | 5 (2.9%) |
| 1 or 2 Children | 11 (1.3%) | 0 (0.0%) |
| 3 or 4 Children | 7 (7.4%) | 0 (0.0%) |
| 5 or more Children | 0 (0.0%) | 0 (0.0%) |
| Total | 35 (1.4%) | 5 (1.4%) |
Race in Timonium
The most populous races in Timonium are White / Caucasian (8,804 | 81.6%), Asian (953 | 8.8%), and Black / African American (519 | 4.8%).
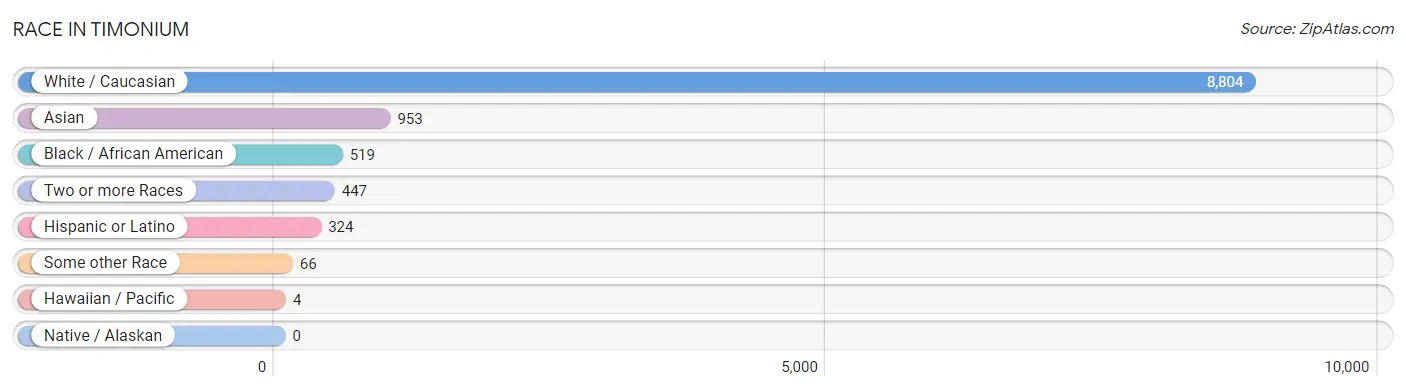
| Race | # Population | % Population |
| Asian | 953 | 8.8% |
| Black / African American | 519 | 4.8% |
| Hawaiian / Pacific | 4 | 0.0% |
| Hispanic or Latino | 324 | 3.0% |
| Native / Alaskan | 0 | 0.0% |
| White / Caucasian | 8,804 | 81.6% |
| Two or more Races | 447 | 4.1% |
| Some other Race | 66 | 0.6% |
| Total | 10,793 | 100.0% |
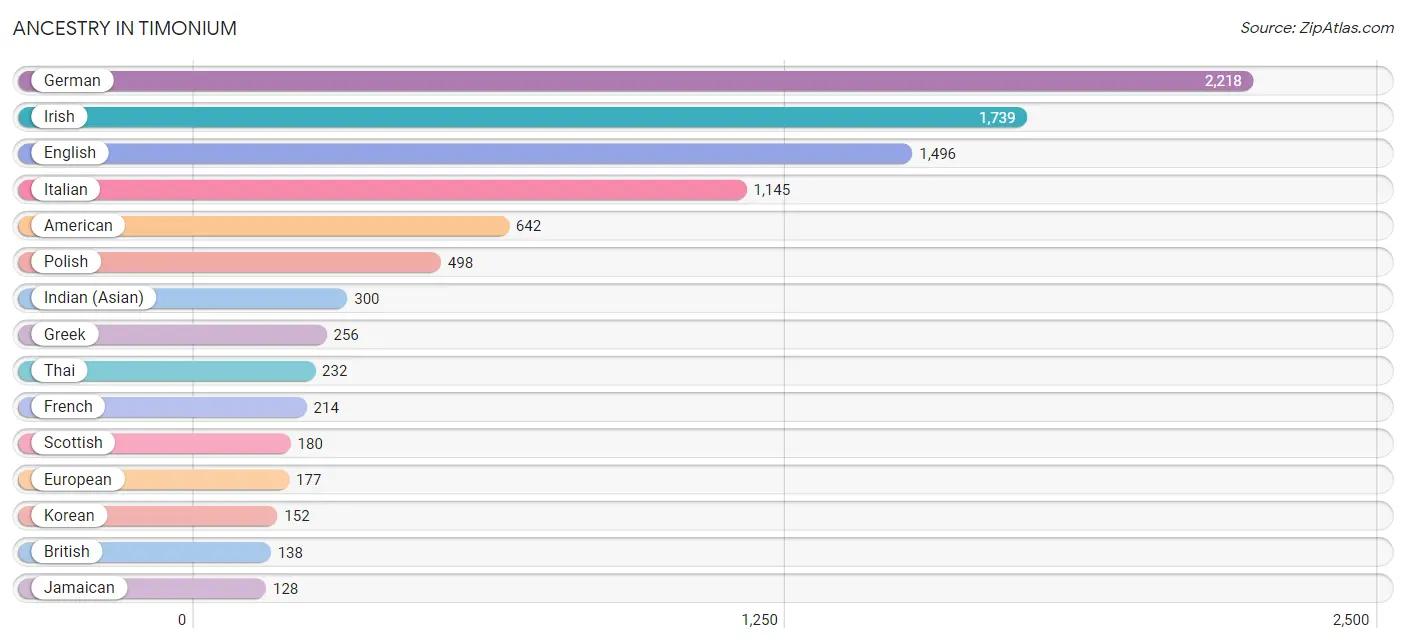
Ancestry in Timonium
The most populous ancestries reported in Timonium are German (2,218 | 20.5%), Irish (1,739 | 16.1%), English (1,496 | 13.9%), Italian (1,145 | 10.6%), and American (642 | 5.9%), together accounting for 67.1% of all Timonium residents.
| Ancestry | # Population | % Population |
| African | 17 | 0.2% |
| American | 642 | 5.9% |
| Arab | 99 | 0.9% |
| Argentinean | 4 | 0.0% |
| Austrian | 18 | 0.2% |
| Belgian | 13 | 0.1% |
| Bhutanese | 110 | 1.0% |
| Bolivian | 25 | 0.2% |
| British | 138 | 1.3% |
| Burmese | 50 | 0.5% |
| Central American | 20 | 0.2% |
| Colombian | 28 | 0.3% |
| Croatian | 10 | 0.1% |
| Cuban | 60 | 0.6% |
| Czech | 32 | 0.3% |
| Czechoslovakian | 39 | 0.4% |
| Dominican | 10 | 0.1% |
| Dutch | 49 | 0.4% |
| Eastern European | 51 | 0.5% |
| Egyptian | 13 | 0.1% |
| English | 1,496 | 13.9% |
| European | 177 | 1.6% |
| Filipino | 31 | 0.3% |
| French | 214 | 2.0% |
| German | 2,218 | 20.5% |
| Greek | 256 | 2.4% |
| Guatemalan | 20 | 0.2% |
| Guyanese | 8 | 0.1% |
| Hungarian | 114 | 1.1% |
| Indian (Asian) | 300 | 2.8% |
| Iranian | 54 | 0.5% |
| Irish | 1,739 | 16.1% |
| Italian | 1,145 | 10.6% |
| Jamaican | 128 | 1.2% |
| Jordanian | 34 | 0.3% |
| Korean | 152 | 1.4% |
| Latvian | 7 | 0.1% |
| Lithuanian | 60 | 0.6% |
| Mexican | 77 | 0.7% |
| Native Hawaiian | 4 | 0.0% |
| Norwegian | 54 | 0.5% |
| Palestinian | 40 | 0.4% |
| Pennsylvania German | 11 | 0.1% |
| Peruvian | 42 | 0.4% |
| Polish | 498 | 4.6% |
| Puerto Rican | 21 | 0.2% |
| Romanian | 26 | 0.2% |
| Russian | 72 | 0.7% |
| Scandinavian | 55 | 0.5% |
| Scotch-Irish | 38 | 0.4% |
| Scottish | 180 | 1.7% |
| Senegalese | 66 | 0.6% |
| Slovak | 39 | 0.4% |
| Slovene | 18 | 0.2% |
| South American | 99 | 0.9% |
| Spaniard | 35 | 0.3% |
| Sri Lankan | 98 | 0.9% |
| Subsaharan African | 98 | 0.9% |
| Swedish | 55 | 0.5% |
| Swiss | 9 | 0.1% |
| Syrian | 35 | 0.3% |
| Thai | 232 | 2.1% |
| Trinidadian and Tobagonian | 8 | 0.1% |
| Turkish | 48 | 0.4% |
| Welsh | 98 | 0.9% | View All 65 Rows |
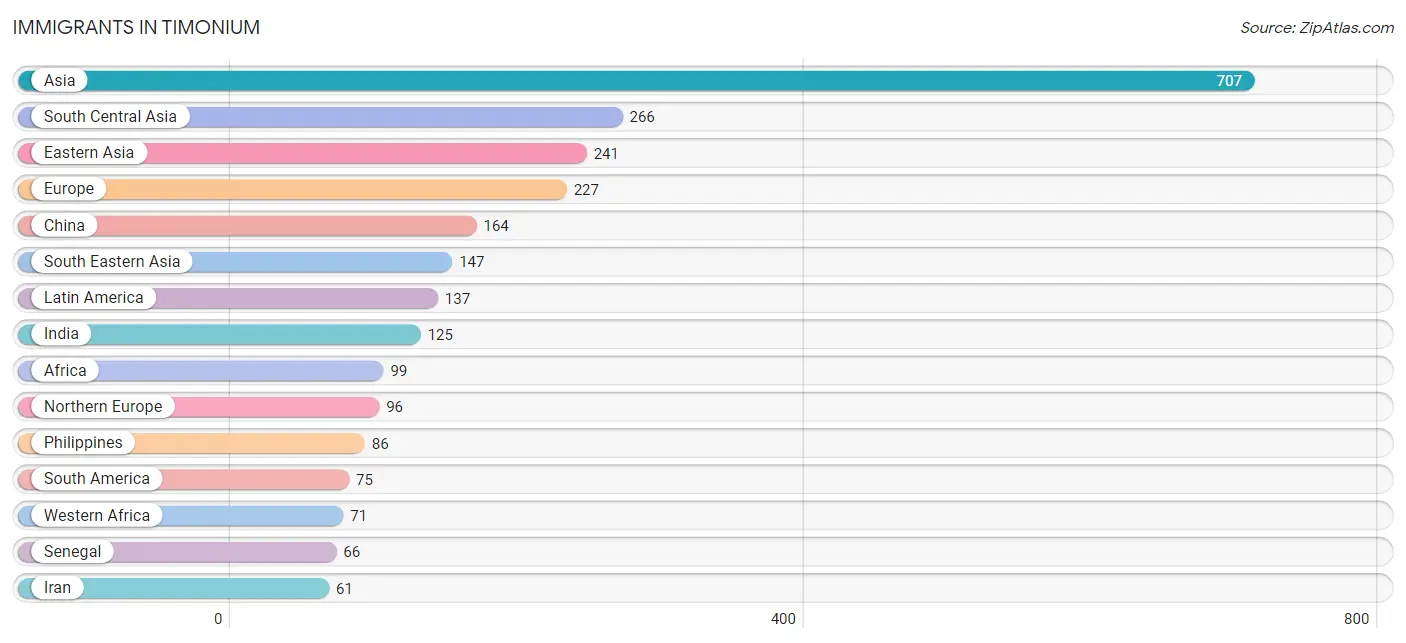
Immigrants in Timonium
The most numerous immigrant groups reported in Timonium came from Asia (707 | 6.6%), South Central Asia (266 | 2.5%), Eastern Asia (241 | 2.2%), Europe (227 | 2.1%), and China (164 | 1.5%), together accounting for 14.9% of all Timonium residents.
| Immigration Origin | # Population | % Population |
| Africa | 99 | 0.9% |
| Argentina | 29 | 0.3% |
| Asia | 707 | 6.6% |
| Austria | 11 | 0.1% |
| Bangladesh | 9 | 0.1% |
| Belarus | 15 | 0.1% |
| Bolivia | 25 | 0.2% |
| Cameroon | 15 | 0.1% |
| Caribbean | 44 | 0.4% |
| Central America | 18 | 0.2% |
| Chile | 11 | 0.1% |
| China | 164 | 1.5% |
| Colombia | 10 | 0.1% |
| Dominican Republic | 10 | 0.1% |
| Eastern Asia | 241 | 2.2% |
| Eastern Europe | 57 | 0.5% |
| Egypt | 13 | 0.1% |
| England | 14 | 0.1% |
| Europe | 227 | 2.1% |
| Germany | 20 | 0.2% |
| Greece | 22 | 0.2% |
| Hong Kong | 6 | 0.1% |
| Hungary | 20 | 0.2% |
| India | 125 | 1.2% |
| Iran | 61 | 0.6% |
| Israel | 13 | 0.1% |
| Jamaica | 34 | 0.3% |
| Japan | 30 | 0.3% |
| Korea | 47 | 0.4% |
| Latin America | 137 | 1.3% |
| Malaysia | 6 | 0.1% |
| Mexico | 18 | 0.2% |
| Middle Africa | 15 | 0.1% |
| Moldova | 8 | 0.1% |
| Northern Africa | 13 | 0.1% |
| Northern Europe | 96 | 0.9% |
| Pakistan | 30 | 0.3% |
| Philippines | 86 | 0.8% |
| Poland | 10 | 0.1% |
| Russia | 4 | 0.0% |
| Saudi Arabia | 8 | 0.1% |
| Senegal | 66 | 0.6% |
| Sierra Leone | 5 | 0.1% |
| Singapore | 13 | 0.1% |
| South America | 75 | 0.7% |
| South Central Asia | 266 | 2.5% |
| South Eastern Asia | 147 | 1.4% |
| Southern Europe | 43 | 0.4% |
| Spain | 21 | 0.2% |
| Sri Lanka | 41 | 0.4% |
| Syria | 12 | 0.1% |
| Taiwan | 16 | 0.2% |
| Turkey | 9 | 0.1% |
| Vietnam | 42 | 0.4% |
| Western Africa | 71 | 0.7% |
| Western Asia | 42 | 0.4% |
| Western Europe | 31 | 0.3% | View All 57 Rows |
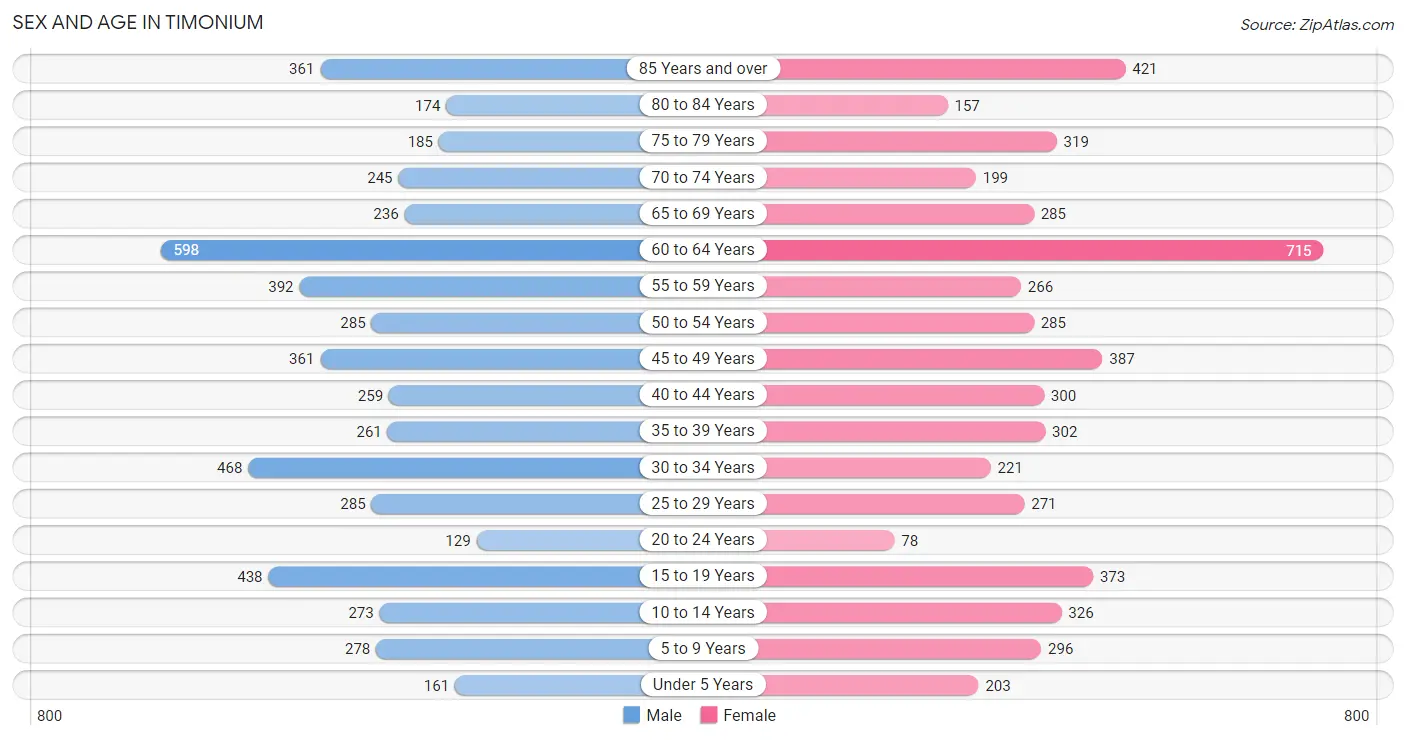
Sex and Age in Timonium
Sex and Age in Timonium
The most populous age groups in Timonium are 60 to 64 Years (598 | 11.1%) for men and 60 to 64 Years (715 | 13.2%) for women.
| Age Bracket | Male | Female |
| Under 5 Years | 161 (3.0%) | 203 (3.8%) |
| 5 to 9 Years | 278 (5.2%) | 296 (5.5%) |
| 10 to 14 Years | 273 (5.1%) | 326 (6.0%) |
| 15 to 19 Years | 438 (8.1%) | 373 (6.9%) |
| 20 to 24 Years | 129 (2.4%) | 78 (1.4%) |
| 25 to 29 Years | 285 (5.3%) | 271 (5.0%) |
| 30 to 34 Years | 468 (8.7%) | 221 (4.1%) |
| 35 to 39 Years | 261 (4.8%) | 302 (5.6%) |
| 40 to 44 Years | 259 (4.8%) | 300 (5.6%) |
| 45 to 49 Years | 361 (6.7%) | 387 (7.2%) |
| 50 to 54 Years | 285 (5.3%) | 285 (5.3%) |
| 55 to 59 Years | 392 (7.3%) | 266 (4.9%) |
| 60 to 64 Years | 598 (11.1%) | 715 (13.2%) |
| 65 to 69 Years | 236 (4.4%) | 285 (5.3%) |
| 70 to 74 Years | 245 (4.5%) | 199 (3.7%) |
| 75 to 79 Years | 185 (3.4%) | 319 (5.9%) |
| 80 to 84 Years | 174 (3.2%) | 157 (2.9%) |
| 85 Years and over | 361 (6.7%) | 421 (7.8%) |
| Total | 5,389 (100.0%) | 5,404 (100.0%) |
Families and Households in Timonium
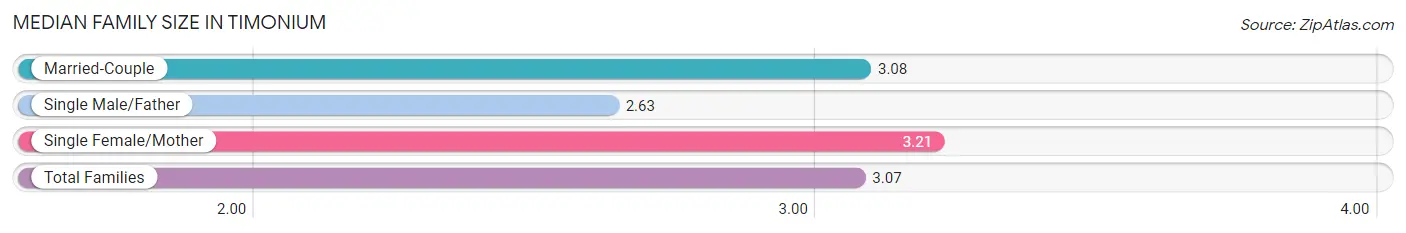
Median Family Size in Timonium
The median family size in Timonium is 3.07 persons per family, with single female/mother families (243 | 8.7%) accounting for the largest median family size of 3.21 persons per family. On the other hand, single male/father families (124 | 4.4%) represent the smallest median family size with 2.63 persons per family.
| Family Type | # Families | Family Size |
| Married-Couple | 2,439 (86.9%) | 3.08 |
| Single Male/Father | 124 (4.4%) | 2.63 |
| Single Female/Mother | 243 (8.7%) | 3.21 |
| Total Families | 2,806 (100.0%) | 3.07 |
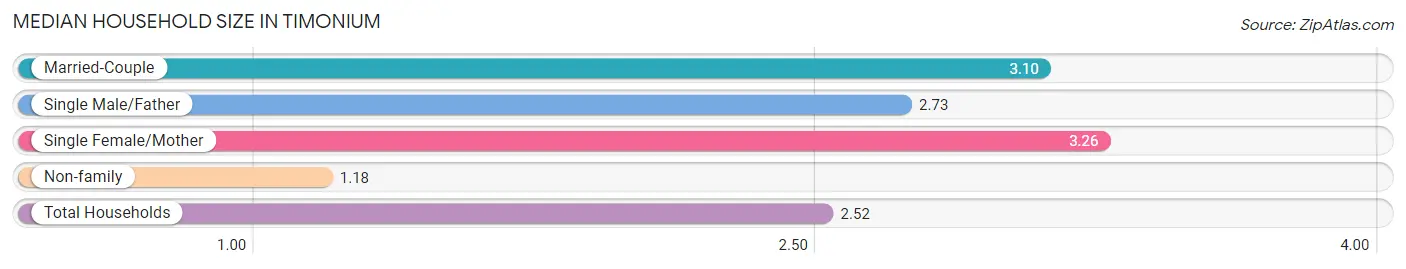
Median Household Size in Timonium
The median household size in Timonium is 2.52 persons per household, with single female/mother households (243 | 6.0%) accounting for the largest median household size of 3.26 persons per household. non-family households (1,211 | 30.1%) represent the smallest median household size with 1.18 persons per household.
| Household Type | # Households | Household Size |
| Married-Couple | 2,439 (60.7%) | 3.10 |
| Single Male/Father | 124 (3.1%) | 2.73 |
| Single Female/Mother | 243 (6.0%) | 3.26 |
| Non-family | 1,211 (30.1%) | 1.18 |
| Total Households | 4,017 (100.0%) | 2.52 |
Household Size by Marriage Status in Timonium
Out of a total of 4,017 households in Timonium, 2,806 (69.9%) are family households, while 1,211 (30.1%) are nonfamily households. The most numerous type of family households are 2-person households, comprising 1,235, and the most common type of nonfamily households are 1-person households, comprising 1,014.
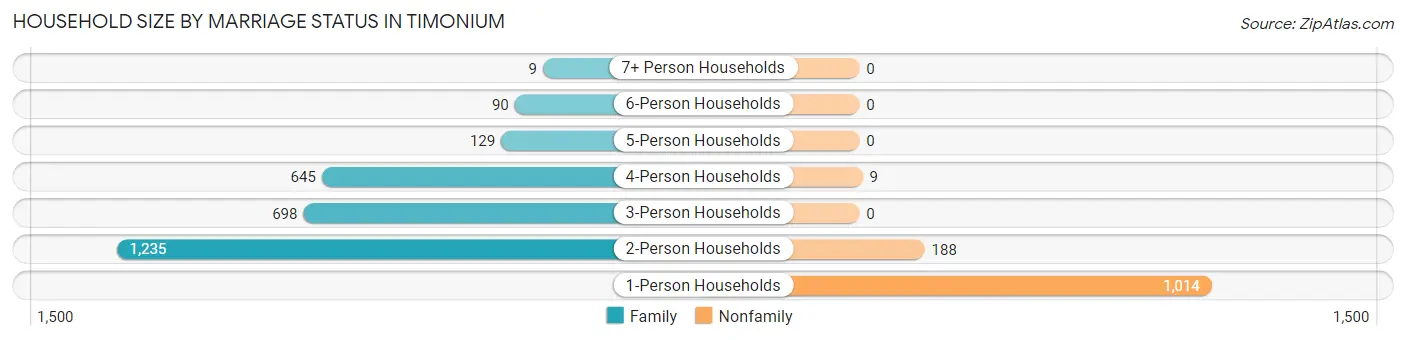
| Household Size | Family Households | Nonfamily Households |
| 1-Person Households | - | 1,014 (25.2%) |
| 2-Person Households | 1,235 (30.7%) | 188 (4.7%) |
| 3-Person Households | 698 (17.4%) | 0 (0.0%) |
| 4-Person Households | 645 (16.1%) | 9 (0.2%) |
| 5-Person Households | 129 (3.2%) | 0 (0.0%) |
| 6-Person Households | 90 (2.2%) | 0 (0.0%) |
| 7+ Person Households | 9 (0.2%) | 0 (0.0%) |
| Total | 2,806 (69.9%) | 1,211 (30.1%) |
Female Fertility in Timonium
Fertility by Age in Timonium
Average fertility rate in Timonium is 58.0 births per 1,000 women. Women in the age bracket of 35 to 50 years have the highest fertility rate with 79.0 births per 1,000 women. Women in the age bracket of 35 to 50 years acount for 72.3% of all women with births.
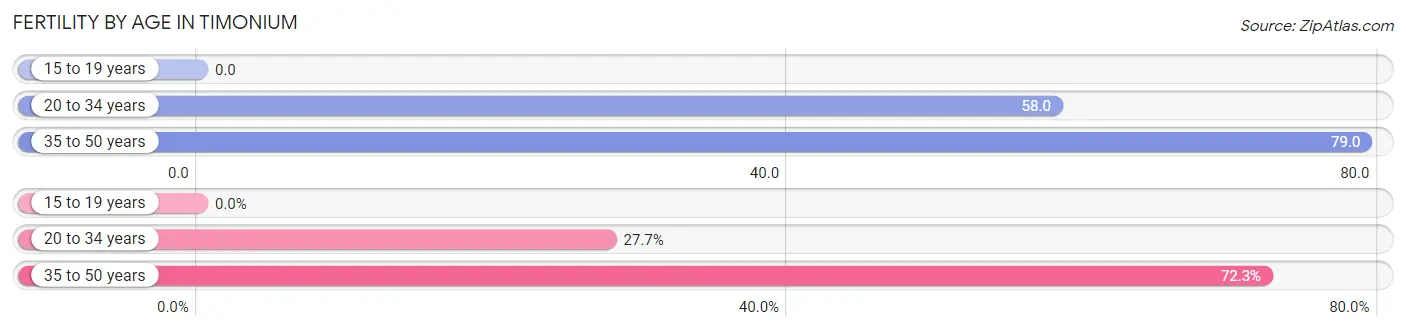
| Age Bracket | Women with Births | Births / 1,000 Women |
| 15 to 19 years | 0 (0.0%) | 0.0 |
| 20 to 34 years | 33 (27.7%) | 58.0 |
| 35 to 50 years | 86 (72.3%) | 79.0 |
| Total | 119 (100.0%) | 58.0 |
Fertility by Age by Marriage Status in Timonium
72.3% of women with births (119) in Timonium are married. The highest percentage of unmarried women with births falls into 35 to 50 years age bracket with 38.4% of them unmarried at the time of birth, while the lowest percentage of unmarried women with births belong to 20 to 34 years age bracket with 0.0% of them unmarried.
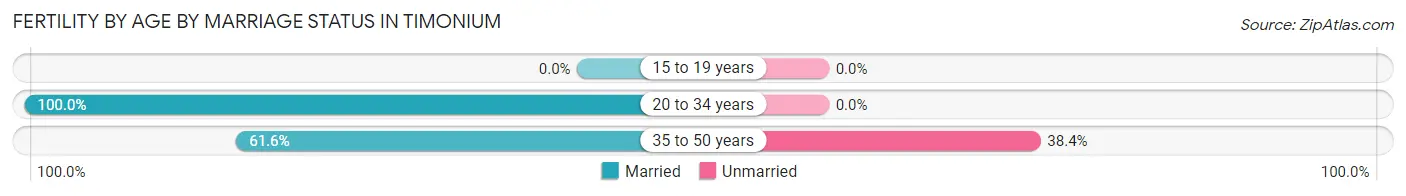
| Age Bracket | Married | Unmarried |
| 15 to 19 years | 0 (0.0%) | 0 (0.0%) |
| 20 to 34 years | 33 (100.0%) | 0 (0.0%) |
| 35 to 50 years | 53 (61.6%) | 33 (38.4%) |
| Total | 86 (72.3%) | 33 (27.7%) |
Fertility by Education in Timonium
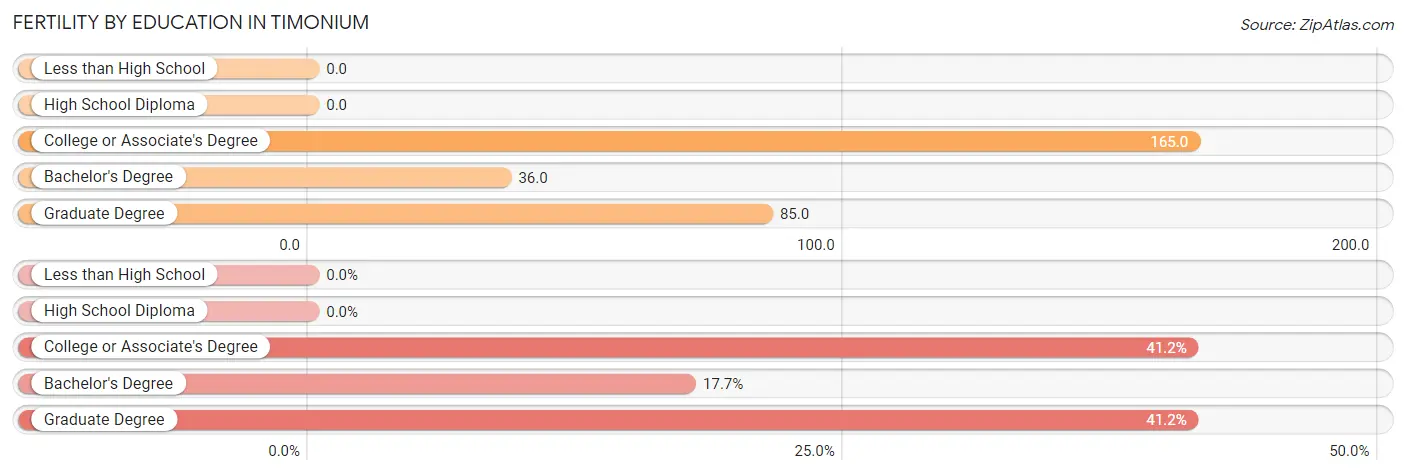
| Educational Attainment | Women with Births | Births / 1,000 Women |
| Less than High School | 0 (0.0%) | 0.0 |
| High School Diploma | 0 (0.0%) | 0.0 |
| College or Associate's Degree | 49 (41.2%) | 165.0 |
| Bachelor's Degree | 21 (17.6%) | 36.0 |
| Graduate Degree | 49 (41.2%) | 85.0 |
| Total | 119 (100.0%) | 58.0 |
Fertility by Education by Marriage Status in Timonium
27.7% of women with births in Timonium are unmarried. Women with the educational attainment of bachelor's degree are most likely to be married with 100.0% of them married at childbirth, while women with the educational attainment of college or associate's degree are least likely to be married with 51.0% of them unmarried at childbirth.
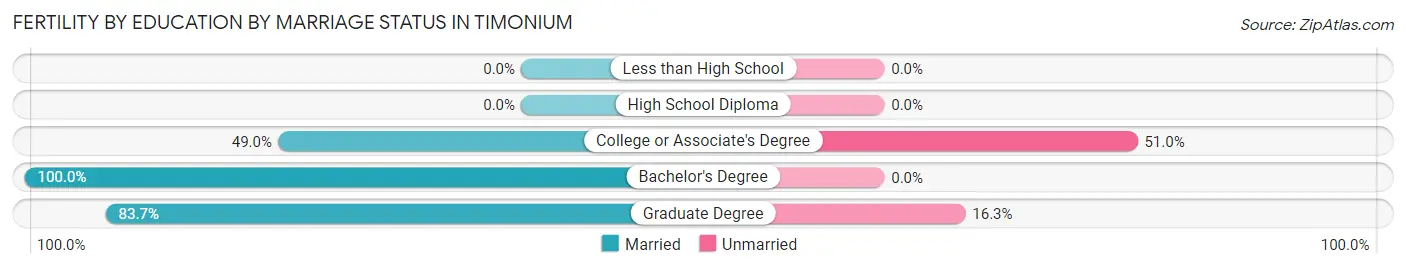
| Educational Attainment | Married | Unmarried |
| Less than High School | 0 (0.0%) | 0 (0.0%) |
| High School Diploma | 0 (0.0%) | 0 (0.0%) |
| College or Associate's Degree | 24 (49.0%) | 25 (51.0%) |
| Bachelor's Degree | 21 (100.0%) | 0 (0.0%) |
| Graduate Degree | 41 (83.7%) | 8 (16.3%) |
| Total | 86 (72.3%) | 33 (27.7%) |
Employment Characteristics in Timonium
Employment by Class of Employer in Timonium
Among the 5,249 employed individuals in Timonium, private company employees (3,102 | 59.1%), not-for-profit organizations (724 | 13.8%), and self-employed (not incorporated) (456 | 8.7%) make up the most common classes of employment.
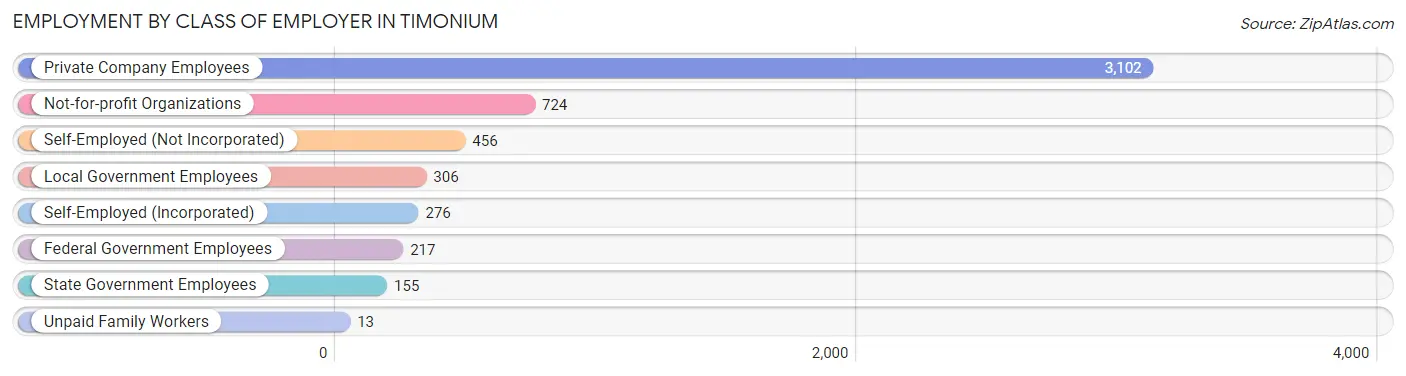
| Employer Class | # Employees | % Employees |
| Private Company Employees | 3,102 | 59.1% |
| Self-Employed (Incorporated) | 276 | 5.3% |
| Self-Employed (Not Incorporated) | 456 | 8.7% |
| Not-for-profit Organizations | 724 | 13.8% |
| Local Government Employees | 306 | 5.8% |
| State Government Employees | 155 | 2.9% |
| Federal Government Employees | 217 | 4.1% |
| Unpaid Family Workers | 13 | 0.3% |
| Total | 5,249 | 100.0% |
Employment Status by Age in Timonium
According to the labor force statistics for Timonium, out of the total population over 16 years of age (9,144), 60.8% or 5,560 individuals are in the labor force, with 4.5% or 250 of them unemployed. The age group with the highest labor force participation rate is 30 to 34 years, with 92.9% or 640 individuals in the labor force. Within the labor force, the 30 to 34 years age range has the highest percentage of unemployed individuals, with 10.9% or 70 of them being unemployed.
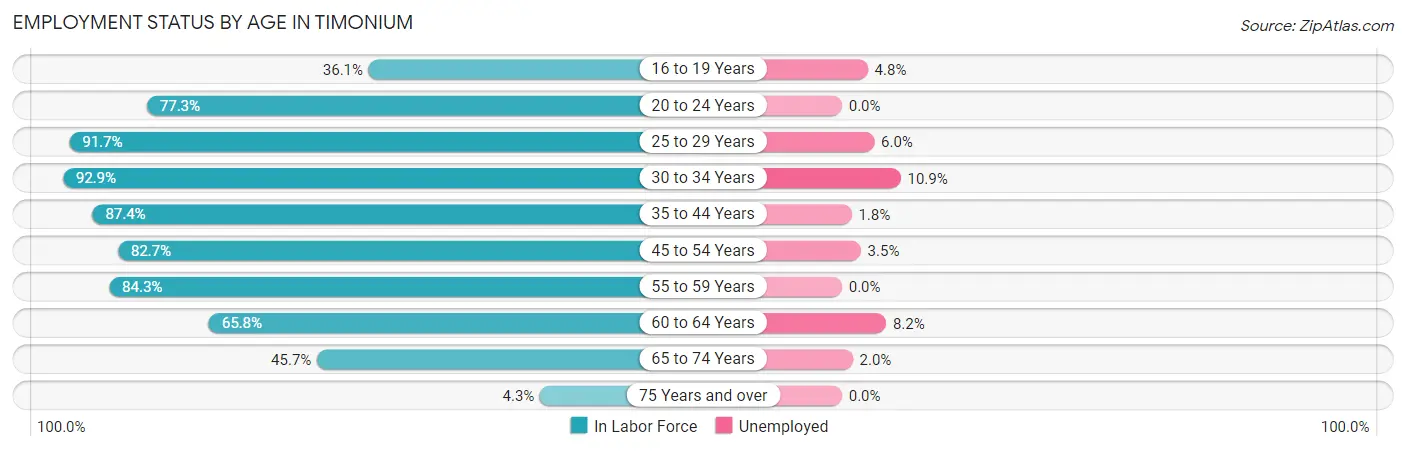
| Age Bracket | In Labor Force | Unemployed |
| 16 to 19 Years | 252 (36.1%) | 12 (4.8%) |
| 20 to 24 Years | 160 (77.3%) | 0 (0.0%) |
| 25 to 29 Years | 510 (91.7%) | 31 (6.0%) |
| 30 to 34 Years | 640 (92.9%) | 70 (10.9%) |
| 35 to 44 Years | 981 (87.4%) | 18 (1.8%) |
| 45 to 54 Years | 1,090 (82.7%) | 38 (3.5%) |
| 55 to 59 Years | 555 (84.3%) | 0 (0.0%) |
| 60 to 64 Years | 864 (65.8%) | 71 (8.2%) |
| 65 to 74 Years | 441 (45.7%) | 9 (2.0%) |
| 75 Years and over | 70 (4.3%) | 0 (0.0%) |
| Total | 5,560 (60.8%) | 250 (4.5%) |
Employment Status by Educational Attainment in Timonium
According to labor force statistics for Timonium, 82.0% of individuals (4,638) out of the total population between 25 and 64 years of age (5,656) are in the labor force, with 4.9% or 227 of them being unemployed. The group with the highest labor force participation rate are those with the educational attainment of bachelor's degree or higher, with 86.8% or 3,356 individuals in the labor force. Within the labor force, individuals with college / associate degree education have the highest percentage of unemployment, with 7.8% or 70 of them being unemployed.
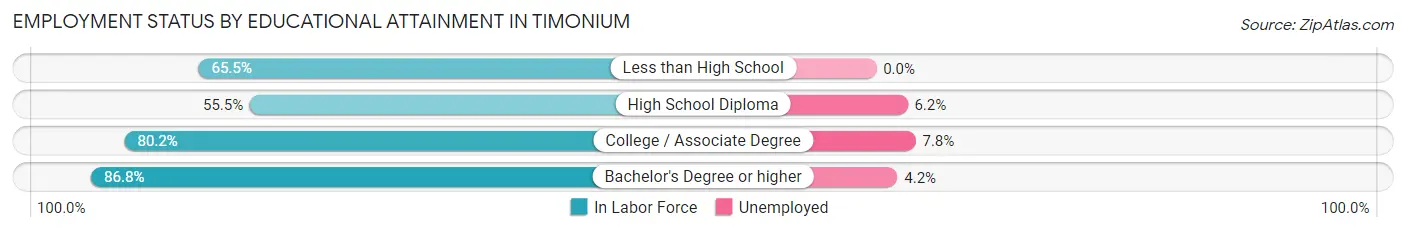
| Educational Attainment | In Labor Force | Unemployed |
| Less than High School | 93 (65.5%) | 0 (0.0%) |
| High School Diploma | 291 (55.5%) | 32 (6.2%) |
| College / Associate Degree | 901 (80.2%) | 88 (7.8%) |
| Bachelor's Degree or higher | 3,356 (86.8%) | 162 (4.2%) |
| Total | 4,638 (82.0%) | 277 (4.9%) |
Employment Occupations by Sex in Timonium
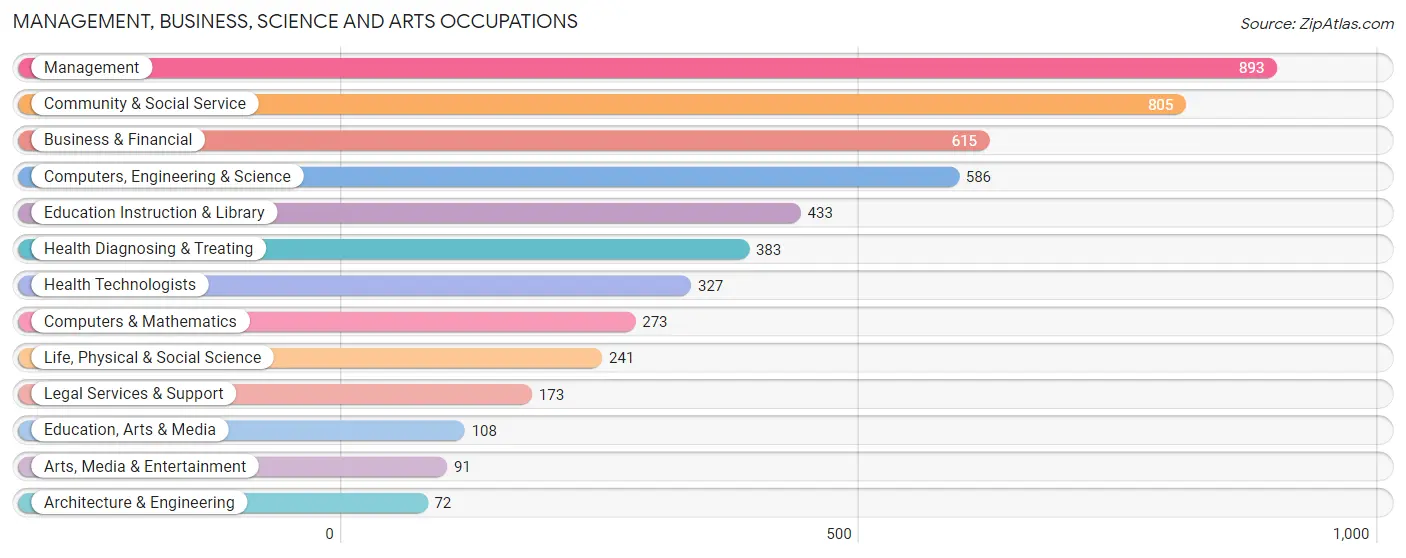
Management, Business, Science and Arts Occupations
The most common Management, Business, Science and Arts occupations in Timonium are Management (893 | 16.8%), Community & Social Service (805 | 15.2%), Business & Financial (615 | 11.6%), Computers, Engineering & Science (586 | 11.0%), and Education Instruction & Library (433 | 8.2%).
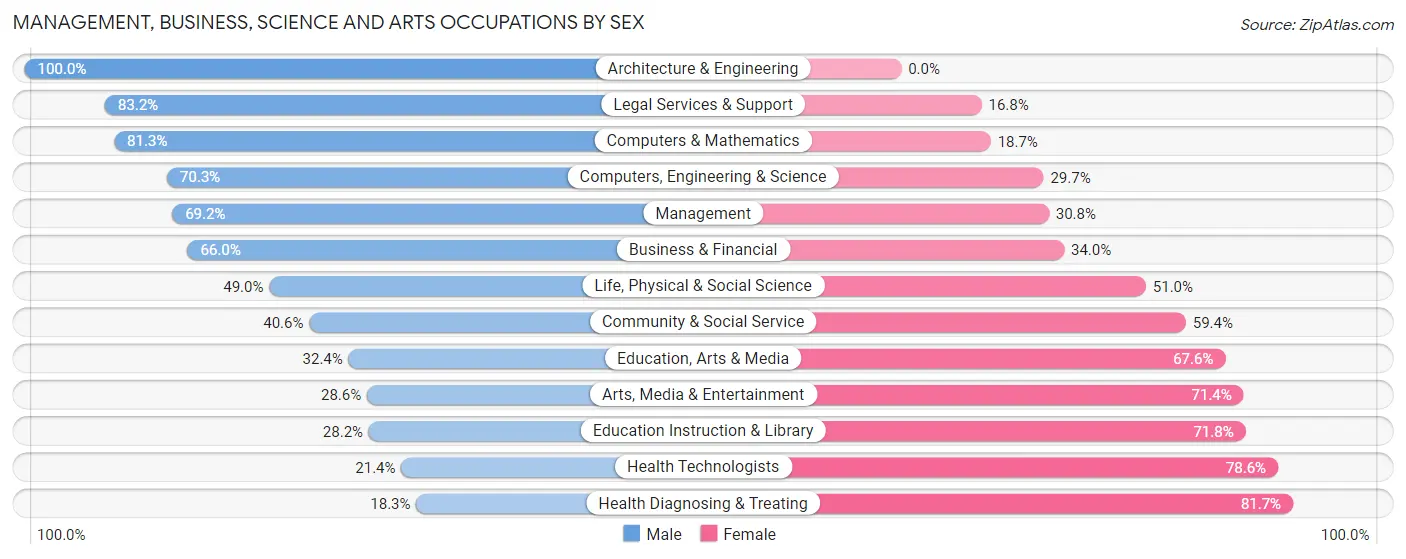
Management, Business, Science and Arts Occupations by Sex
Within the Management, Business, Science and Arts occupations in Timonium, the most male-oriented occupations are Architecture & Engineering (100.0%), Legal Services & Support (83.2%), and Computers & Mathematics (81.3%), while the most female-oriented occupations are Health Diagnosing & Treating (81.7%), Health Technologists (78.6%), and Education Instruction & Library (71.8%).
| Occupation | Male | Female |
| Management | 618 (69.2%) | 275 (30.8%) |
| Business & Financial | 406 (66.0%) | 209 (34.0%) |
| Computers, Engineering & Science | 412 (70.3%) | 174 (29.7%) |
| Computers & Mathematics | 222 (81.3%) | 51 (18.7%) |
| Architecture & Engineering | 72 (100.0%) | 0 (0.0%) |
| Life, Physical & Social Science | 118 (49.0%) | 123 (51.0%) |
| Community & Social Service | 327 (40.6%) | 478 (59.4%) |
| Education, Arts & Media | 35 (32.4%) | 73 (67.6%) |
| Legal Services & Support | 144 (83.2%) | 29 (16.8%) |
| Education Instruction & Library | 122 (28.2%) | 311 (71.8%) |
| Arts, Media & Entertainment | 26 (28.6%) | 65 (71.4%) |
| Health Diagnosing & Treating | 70 (18.3%) | 313 (81.7%) |
| Health Technologists | 70 (21.4%) | 257 (78.6%) |
| Total (Category) | 1,833 (55.8%) | 1,449 (44.2%) |
| Total (Overall) | 3,006 (56.6%) | 2,302 (43.4%) |
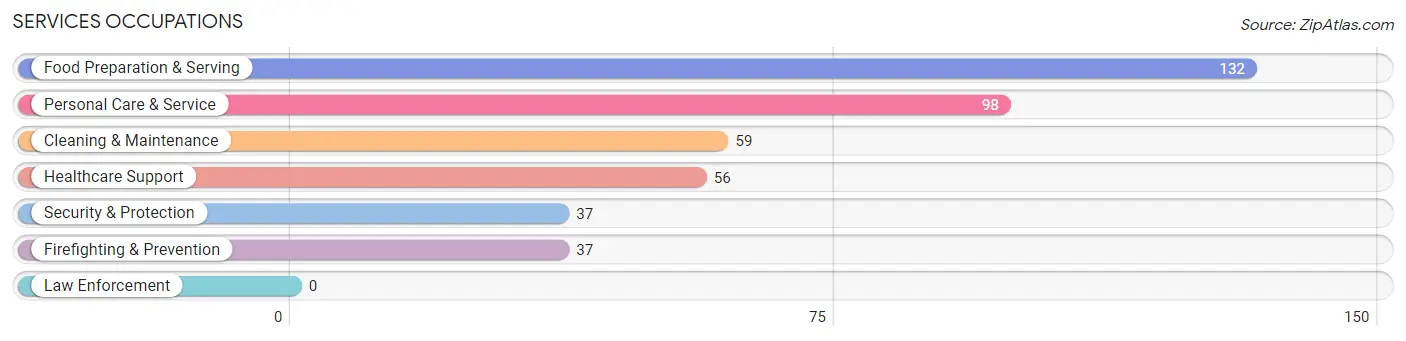
Services Occupations
The most common Services occupations in Timonium are Food Preparation & Serving (132 | 2.5%), Personal Care & Service (98 | 1.8%), Cleaning & Maintenance (59 | 1.1%), Healthcare Support (56 | 1.1%), and Security & Protection (37 | 0.7%).
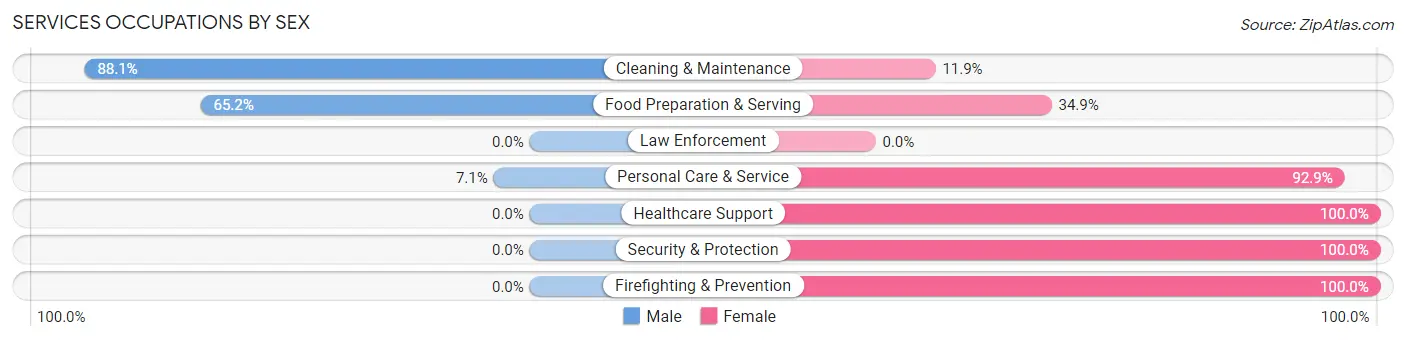
Services Occupations by Sex
Within the Services occupations in Timonium, the most male-oriented occupations are Cleaning & Maintenance (88.1%), Food Preparation & Serving (65.1%), and Personal Care & Service (7.1%), while the most female-oriented occupations are Healthcare Support (100.0%), Security & Protection (100.0%), and Firefighting & Prevention (100.0%).
| Occupation | Male | Female |
| Healthcare Support | 0 (0.0%) | 56 (100.0%) |
| Security & Protection | 0 (0.0%) | 37 (100.0%) |
| Firefighting & Prevention | 0 (0.0%) | 37 (100.0%) |
| Law Enforcement | 0 (0.0%) | 0 (0.0%) |
| Food Preparation & Serving | 86 (65.1%) | 46 (34.8%) |
| Cleaning & Maintenance | 52 (88.1%) | 7 (11.9%) |
| Personal Care & Service | 7 (7.1%) | 91 (92.9%) |
| Total (Category) | 145 (38.0%) | 237 (62.0%) |
| Total (Overall) | 3,006 (56.6%) | 2,302 (43.4%) |
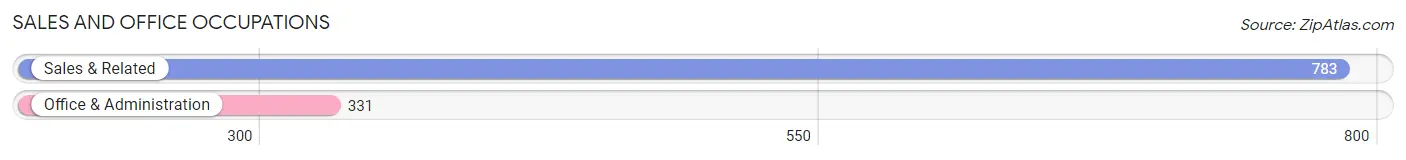
Sales and Office Occupations
The most common Sales and Office occupations in Timonium are Sales & Related (783 | 14.7%), and Office & Administration (331 | 6.2%).
Sales and Office Occupations by Sex
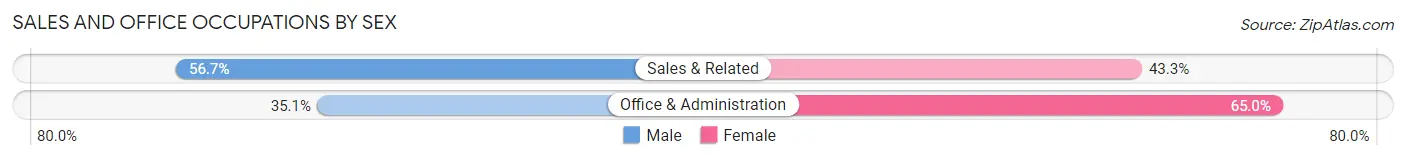
| Occupation | Male | Female |
| Sales & Related | 444 (56.7%) | 339 (43.3%) |
| Office & Administration | 116 (35.0%) | 215 (64.9%) |
| Total (Category) | 560 (50.3%) | 554 (49.7%) |
| Total (Overall) | 3,006 (56.6%) | 2,302 (43.4%) |
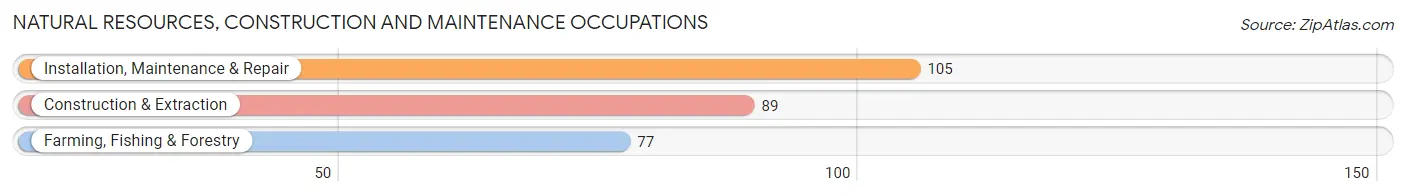
Natural Resources, Construction and Maintenance Occupations
The most common Natural Resources, Construction and Maintenance occupations in Timonium are Installation, Maintenance & Repair (105 | 2.0%), Construction & Extraction (89 | 1.7%), and Farming, Fishing & Forestry (77 | 1.5%).
Natural Resources, Construction and Maintenance Occupations by Sex
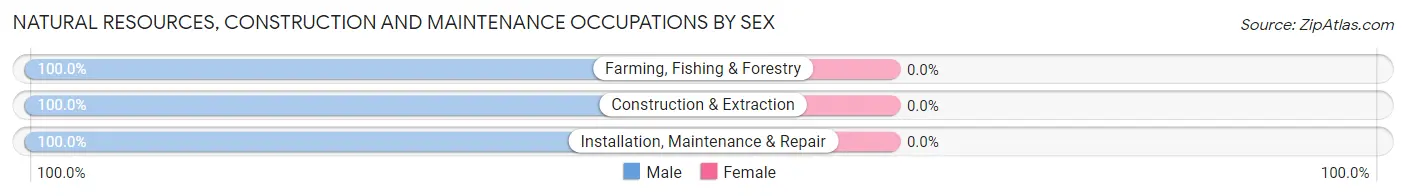
| Occupation | Male | Female |
| Farming, Fishing & Forestry | 77 (100.0%) | 0 (0.0%) |
| Construction & Extraction | 89 (100.0%) | 0 (0.0%) |
| Installation, Maintenance & Repair | 105 (100.0%) | 0 (0.0%) |
| Total (Category) | 271 (100.0%) | 0 (0.0%) |
| Total (Overall) | 3,006 (56.6%) | 2,302 (43.4%) |
Production, Transportation and Moving Occupations
The most common Production, Transportation and Moving occupations in Timonium are Material Moving (118 | 2.2%), Transportation (74 | 1.4%), and Production (67 | 1.3%).
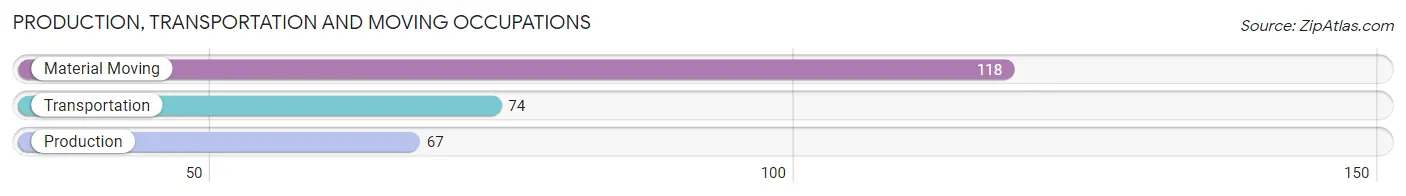
Production, Transportation and Moving Occupations by Sex
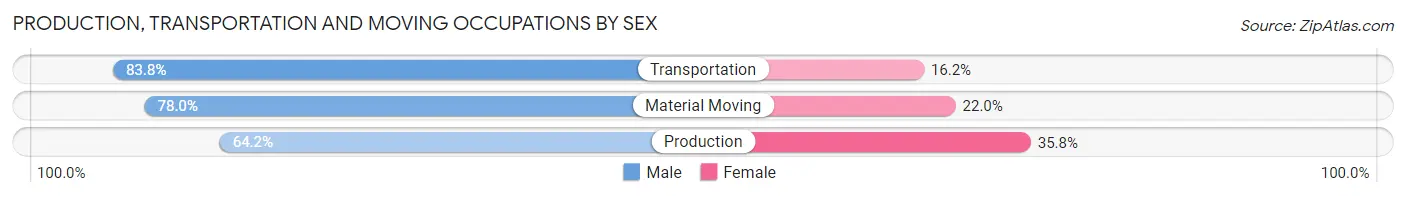
| Occupation | Male | Female |
| Production | 43 (64.2%) | 24 (35.8%) |
| Transportation | 62 (83.8%) | 12 (16.2%) |
| Material Moving | 92 (78.0%) | 26 (22.0%) |
| Total (Category) | 197 (76.1%) | 62 (23.9%) |
| Total (Overall) | 3,006 (56.6%) | 2,302 (43.4%) |
Employment Industries by Sex in Timonium
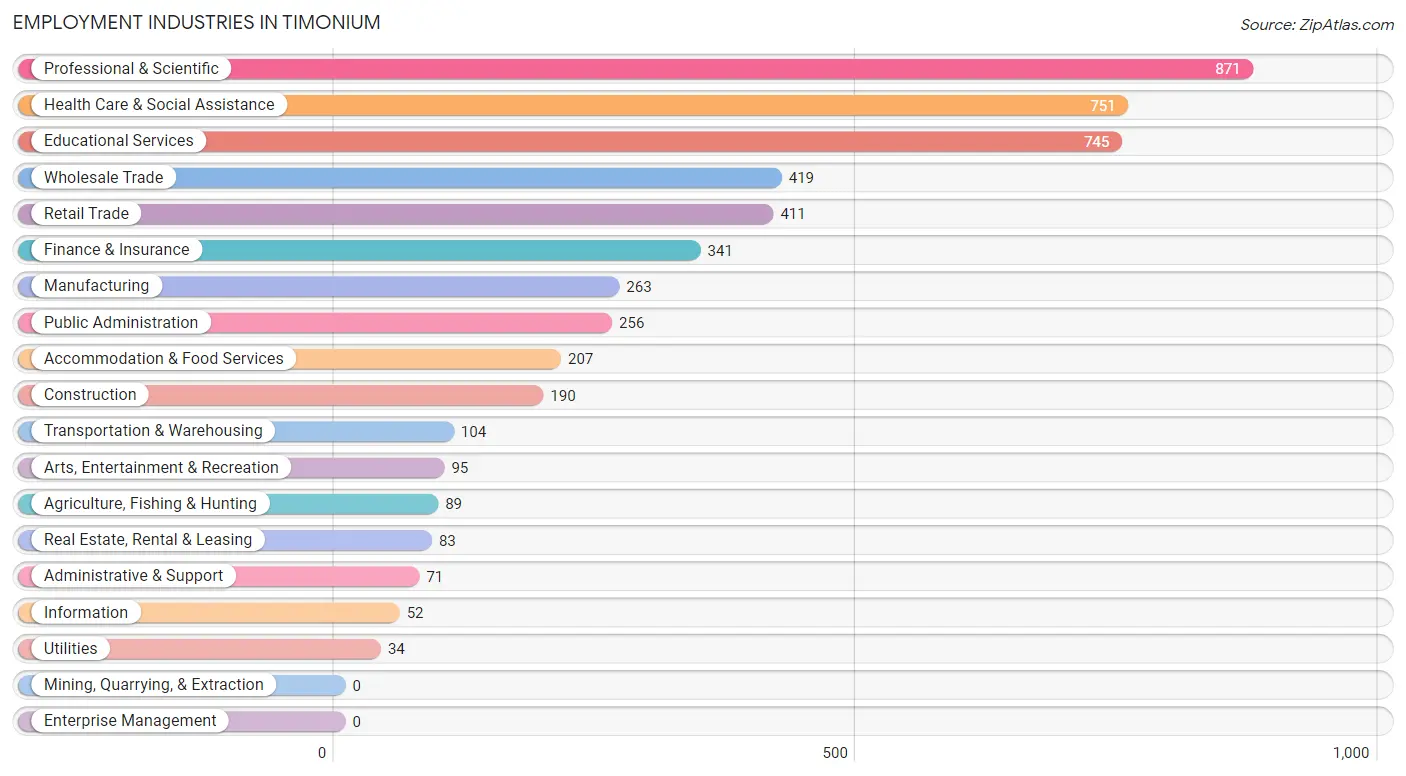
Employment Industries in Timonium
The major employment industries in Timonium include Professional & Scientific (871 | 16.4%), Health Care & Social Assistance (751 | 14.1%), Educational Services (745 | 14.0%), Wholesale Trade (419 | 7.9%), and Retail Trade (411 | 7.7%).
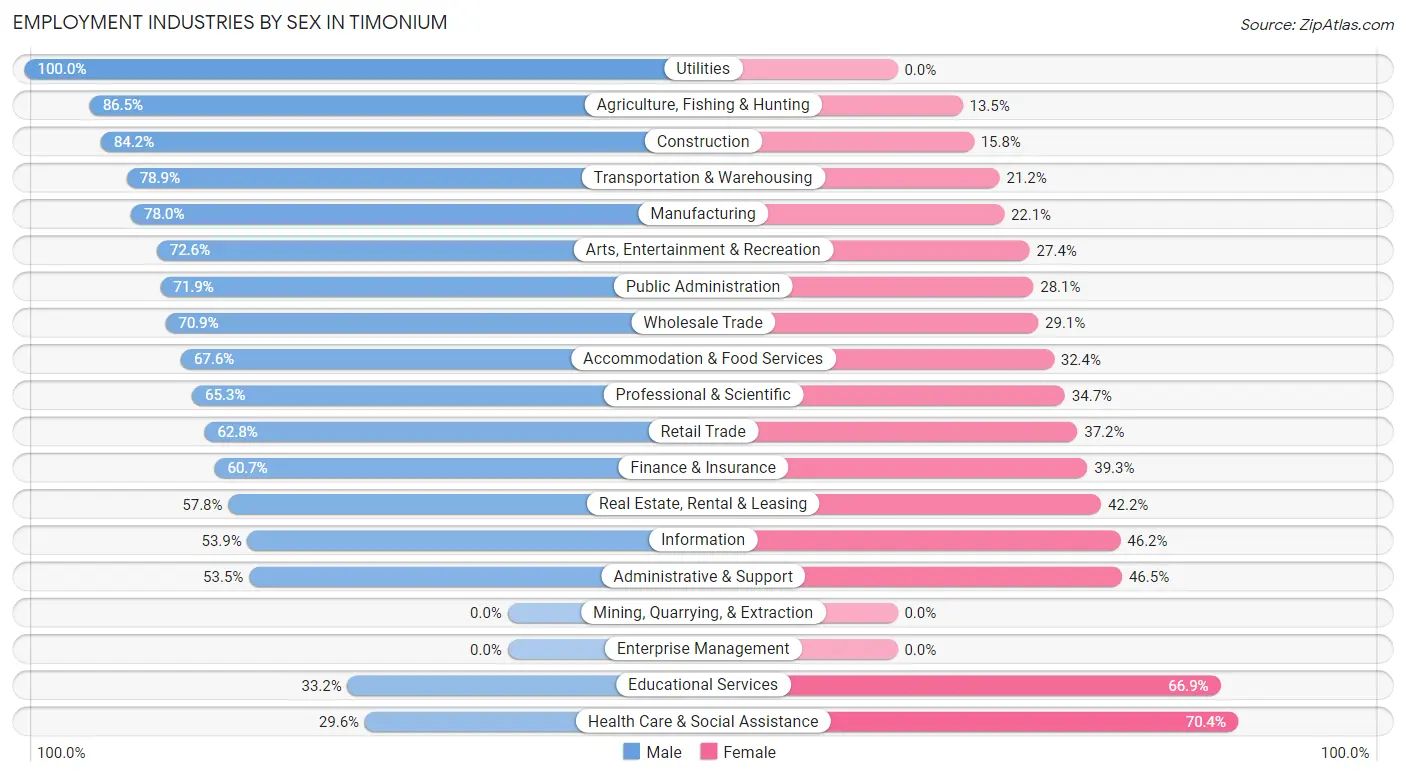
Employment Industries by Sex in Timonium
The Timonium industries that see more men than women are Utilities (100.0%), Agriculture, Fishing & Hunting (86.5%), and Construction (84.2%), whereas the industries that tend to have a higher number of women are Health Care & Social Assistance (70.4%), Educational Services (66.8%), and Administrative & Support (46.5%).
| Industry | Male | Female |
| Agriculture, Fishing & Hunting | 77 (86.5%) | 12 (13.5%) |
| Mining, Quarrying, & Extraction | 0 (0.0%) | 0 (0.0%) |
| Construction | 160 (84.2%) | 30 (15.8%) |
| Manufacturing | 205 (77.9%) | 58 (22.1%) |
| Wholesale Trade | 297 (70.9%) | 122 (29.1%) |
| Retail Trade | 258 (62.8%) | 153 (37.2%) |
| Transportation & Warehousing | 82 (78.8%) | 22 (21.1%) |
| Utilities | 34 (100.0%) | 0 (0.0%) |
| Information | 28 (53.8%) | 24 (46.2%) |
| Finance & Insurance | 207 (60.7%) | 134 (39.3%) |
| Real Estate, Rental & Leasing | 48 (57.8%) | 35 (42.2%) |
| Professional & Scientific | 569 (65.3%) | 302 (34.7%) |
| Enterprise Management | 0 (0.0%) | 0 (0.0%) |
| Administrative & Support | 38 (53.5%) | 33 (46.5%) |
| Educational Services | 247 (33.2%) | 498 (66.8%) |
| Health Care & Social Assistance | 222 (29.6%) | 529 (70.4%) |
| Arts, Entertainment & Recreation | 69 (72.6%) | 26 (27.4%) |
| Accommodation & Food Services | 140 (67.6%) | 67 (32.4%) |
| Public Administration | 184 (71.9%) | 72 (28.1%) |
| Total | 3,006 (56.6%) | 2,302 (43.4%) |
Education in Timonium
School Enrollment in Timonium
The most common levels of schooling among the 2,281 students in Timonium are high school (768 | 33.7%), elementary school (491 | 21.5%), and middle school (426 | 18.7%).
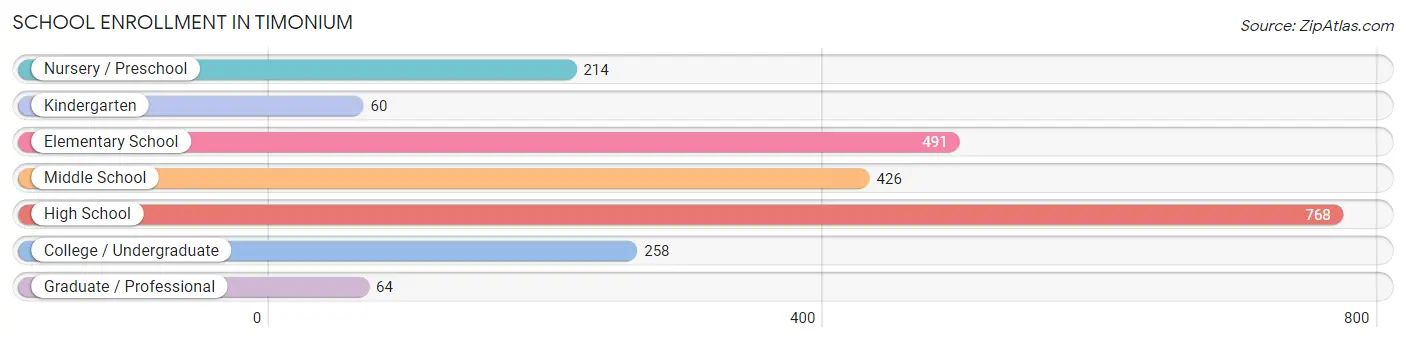
| School Level | # Students | % Students |
| Nursery / Preschool | 214 | 9.4% |
| Kindergarten | 60 | 2.6% |
| Elementary School | 491 | 21.5% |
| Middle School | 426 | 18.7% |
| High School | 768 | 33.7% |
| College / Undergraduate | 258 | 11.3% |
| Graduate / Professional | 64 | 2.8% |
| Total | 2,281 | 100.0% |
School Enrollment by Age by Funding Source in Timonium
Out of a total of 2,281 students who are enrolled in schools in Timonium, 652 (28.6%) attend a private institution, while the remaining 1,629 (71.4%) are enrolled in public schools. The age group of 3 to 4 year olds has the highest likelihood of being enrolled in private schools, with 123 (91.1% in the age bracket) enrolled. Conversely, the age group of 25 to 34 year olds has the lowest likelihood of being enrolled in a private school, with 52 (82.5% in the age bracket) attending a public institution.
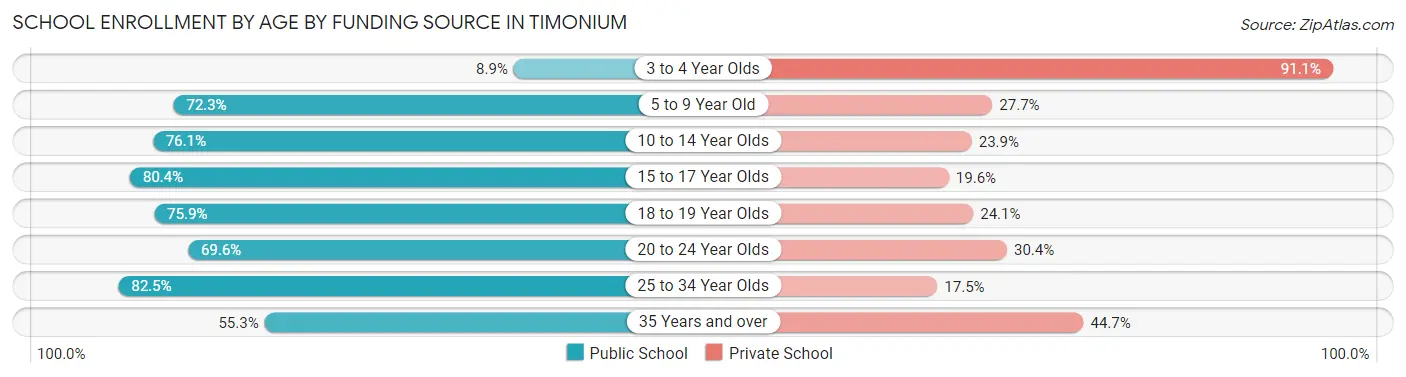
| Age Bracket | Public School | Private School |
| 3 to 4 Year Olds | 12 (8.9%) | 123 (91.1%) |
| 5 to 9 Year Old | 381 (72.3%) | 146 (27.7%) |
| 10 to 14 Year Olds | 456 (76.1%) | 143 (23.9%) |
| 15 to 17 Year Olds | 480 (80.4%) | 117 (19.6%) |
| 18 to 19 Year Olds | 132 (75.9%) | 42 (24.1%) |
| 20 to 24 Year Olds | 64 (69.6%) | 28 (30.4%) |
| 25 to 34 Year Olds | 52 (82.5%) | 11 (17.5%) |
| 35 Years and over | 52 (55.3%) | 42 (44.7%) |
| Total | 1,629 (71.4%) | 652 (28.6%) |
Educational Attainment by Field of Study in Timonium
Business (1,067 | 19.0%), social sciences (556 | 9.9%), communications (545 | 9.7%), education (477 | 8.5%), and science & technology (452 | 8.1%) are the most common fields of study among 5,615 individuals in Timonium who have obtained a bachelor's degree or higher.
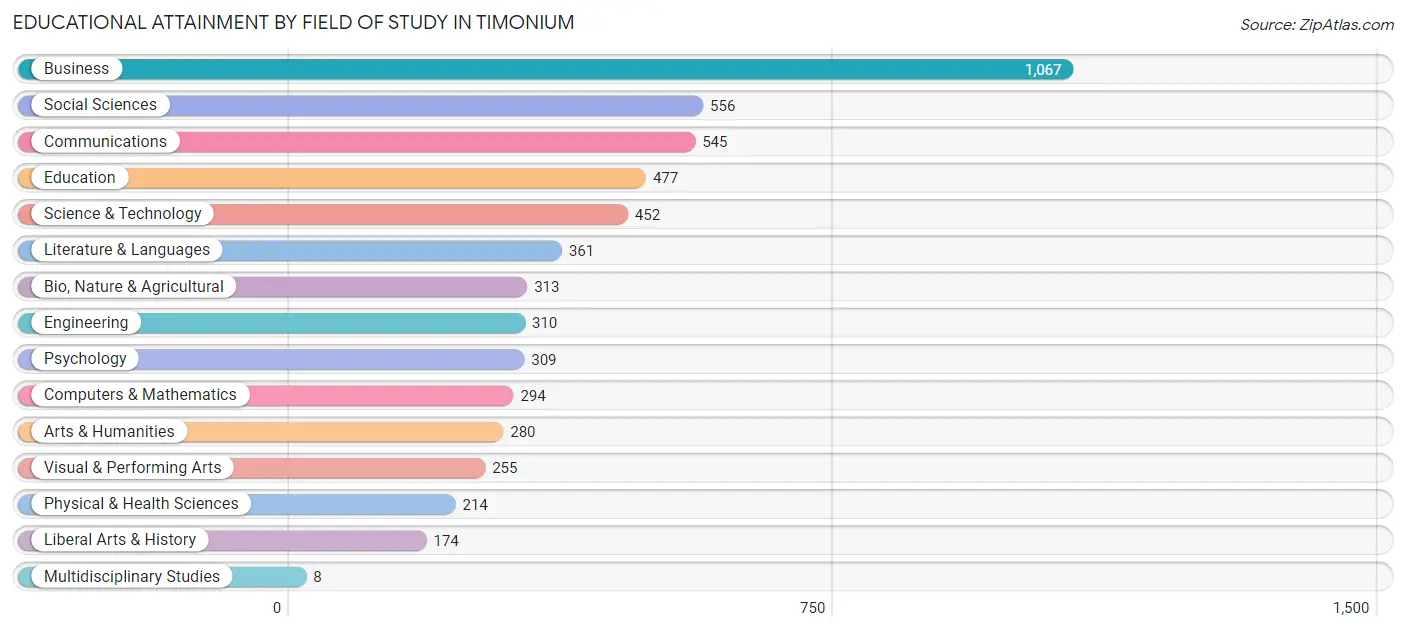
| Field of Study | # Graduates | % Graduates |
| Computers & Mathematics | 294 | 5.2% |
| Bio, Nature & Agricultural | 313 | 5.6% |
| Physical & Health Sciences | 214 | 3.8% |
| Psychology | 309 | 5.5% |
| Social Sciences | 556 | 9.9% |
| Engineering | 310 | 5.5% |
| Multidisciplinary Studies | 8 | 0.1% |
| Science & Technology | 452 | 8.1% |
| Business | 1,067 | 19.0% |
| Education | 477 | 8.5% |
| Literature & Languages | 361 | 6.4% |
| Liberal Arts & History | 174 | 3.1% |
| Visual & Performing Arts | 255 | 4.5% |
| Communications | 545 | 9.7% |
| Arts & Humanities | 280 | 5.0% |
| Total | 5,615 | 100.0% |
Transportation & Commute in Timonium
Vehicle Availability by Sex in Timonium
The most prevalent vehicle ownership categories in Timonium are males with 3 vehicles (1,120, accounting for 37.4%) and females with 3 vehicles (443, making up 49.6%).
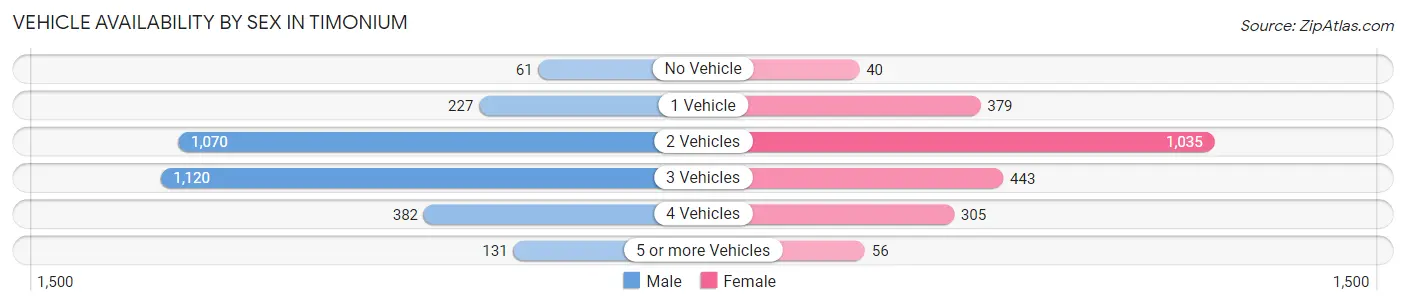
| Vehicles Available | Male | Female |
| No Vehicle | 61 (2.0%) | 40 (1.8%) |
| 1 Vehicle | 227 (7.6%) | 379 (16.8%) |
| 2 Vehicles | 1,070 (35.8%) | 1,035 (45.8%) |
| 3 Vehicles | 1,120 (37.4%) | 443 (19.6%) |
| 4 Vehicles | 382 (12.8%) | 305 (13.5%) |
| 5 or more Vehicles | 131 (4.4%) | 56 (2.5%) |
| Total | 2,991 (100.0%) | 2,258 (100.0%) |
Commute Time in Timonium
The most frequently occuring commute durations in Timonium are 15 to 19 minutes (857 commuters, 20.2%), 20 to 24 minutes (577 commuters, 13.6%), and 30 to 34 minutes (566 commuters, 13.4%).
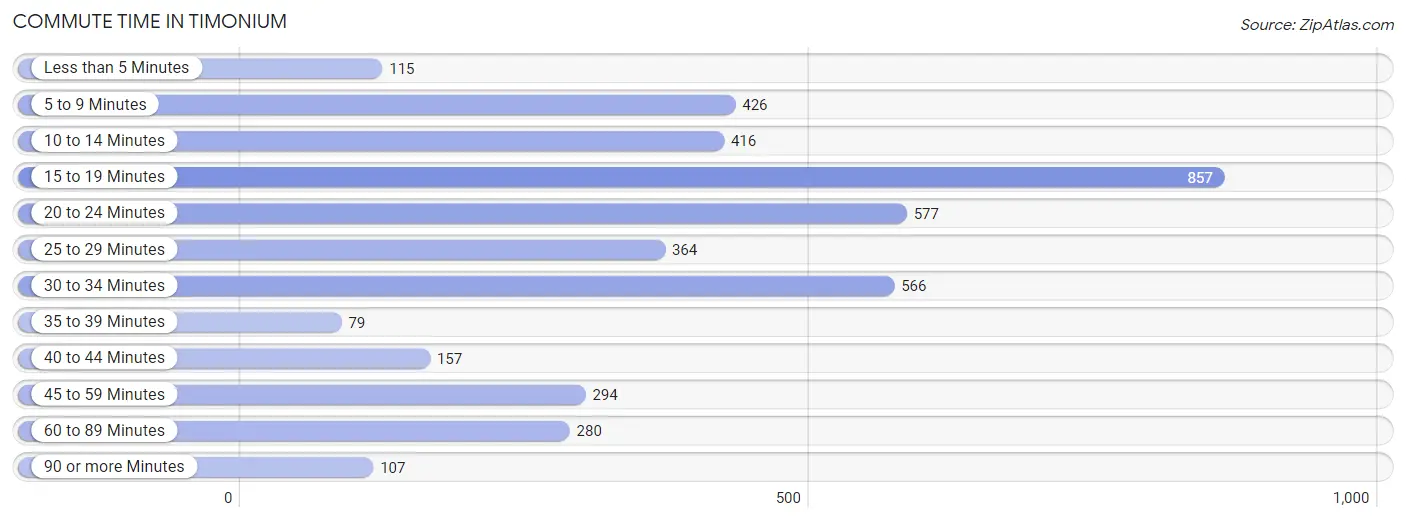
| Commute Time | # Commuters | % Commuters |
| Less than 5 Minutes | 115 | 2.7% |
| 5 to 9 Minutes | 426 | 10.1% |
| 10 to 14 Minutes | 416 | 9.8% |
| 15 to 19 Minutes | 857 | 20.2% |
| 20 to 24 Minutes | 577 | 13.6% |
| 25 to 29 Minutes | 364 | 8.6% |
| 30 to 34 Minutes | 566 | 13.4% |
| 35 to 39 Minutes | 79 | 1.9% |
| 40 to 44 Minutes | 157 | 3.7% |
| 45 to 59 Minutes | 294 | 6.9% |
| 60 to 89 Minutes | 280 | 6.6% |
| 90 or more Minutes | 107 | 2.5% |
Commute Time by Sex in Timonium
The most common commute times in Timonium are 15 to 19 minutes (476 commuters, 20.6%) for males and 15 to 19 minutes (381 commuters, 19.8%) for females.
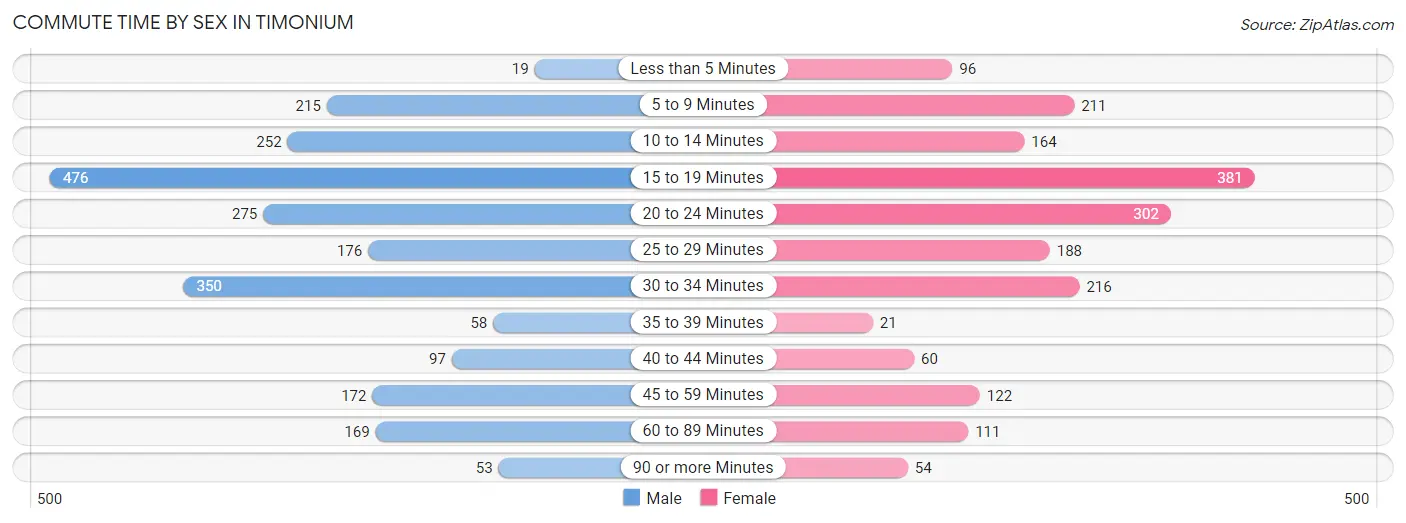
| Commute Time | Male | Female |
| Less than 5 Minutes | 19 (0.8%) | 96 (5.0%) |
| 5 to 9 Minutes | 215 (9.3%) | 211 (11.0%) |
| 10 to 14 Minutes | 252 (10.9%) | 164 (8.5%) |
| 15 to 19 Minutes | 476 (20.6%) | 381 (19.8%) |
| 20 to 24 Minutes | 275 (11.9%) | 302 (15.7%) |
| 25 to 29 Minutes | 176 (7.6%) | 188 (9.8%) |
| 30 to 34 Minutes | 350 (15.1%) | 216 (11.2%) |
| 35 to 39 Minutes | 58 (2.5%) | 21 (1.1%) |
| 40 to 44 Minutes | 97 (4.2%) | 60 (3.1%) |
| 45 to 59 Minutes | 172 (7.4%) | 122 (6.3%) |
| 60 to 89 Minutes | 169 (7.3%) | 111 (5.8%) |
| 90 or more Minutes | 53 (2.3%) | 54 (2.8%) |
Time of Departure to Work by Sex in Timonium
The most frequent times of departure to work in Timonium are 8:00 AM to 8:29 AM (339, 14.7%) for males and 8:30 AM to 8:59 AM (401, 20.8%) for females.
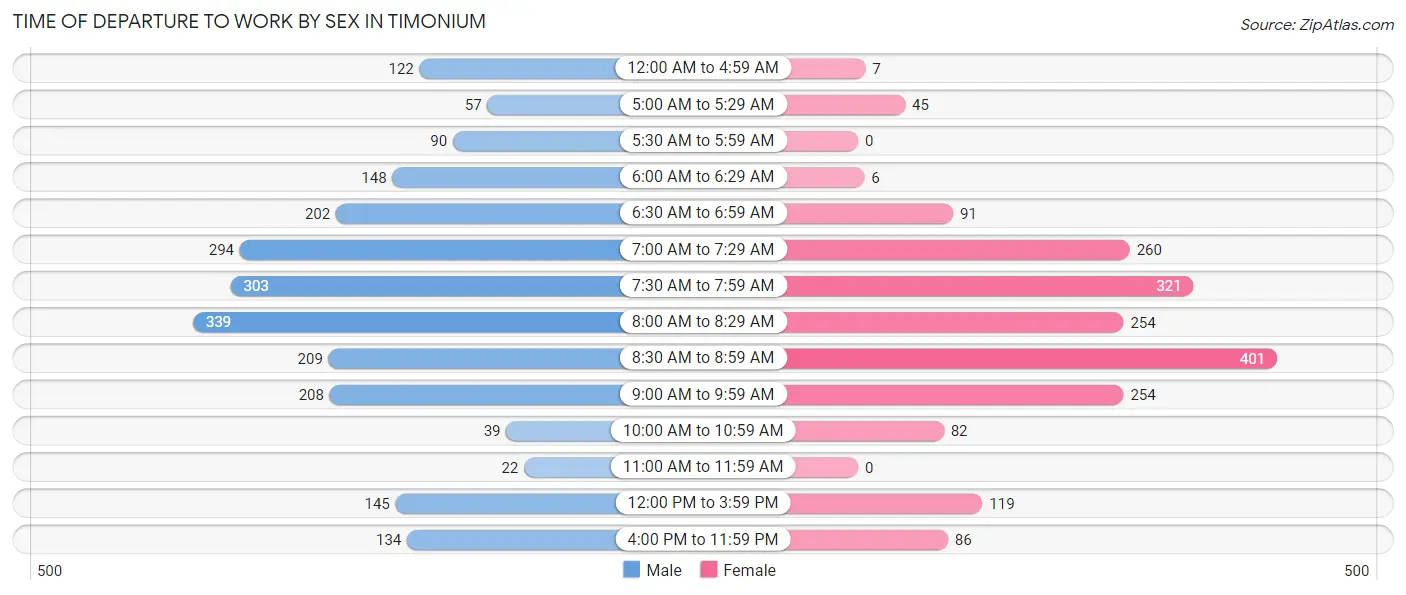
| Time of Departure | Male | Female |
| 12:00 AM to 4:59 AM | 122 (5.3%) | 7 (0.4%) |
| 5:00 AM to 5:29 AM | 57 (2.5%) | 45 (2.3%) |
| 5:30 AM to 5:59 AM | 90 (3.9%) | 0 (0.0%) |
| 6:00 AM to 6:29 AM | 148 (6.4%) | 6 (0.3%) |
| 6:30 AM to 6:59 AM | 202 (8.7%) | 91 (4.7%) |
| 7:00 AM to 7:29 AM | 294 (12.7%) | 260 (13.5%) |
| 7:30 AM to 7:59 AM | 303 (13.1%) | 321 (16.7%) |
| 8:00 AM to 8:29 AM | 339 (14.7%) | 254 (13.2%) |
| 8:30 AM to 8:59 AM | 209 (9.0%) | 401 (20.8%) |
| 9:00 AM to 9:59 AM | 208 (9.0%) | 254 (13.2%) |
| 10:00 AM to 10:59 AM | 39 (1.7%) | 82 (4.3%) |
| 11:00 AM to 11:59 AM | 22 (0.9%) | 0 (0.0%) |
| 12:00 PM to 3:59 PM | 145 (6.3%) | 119 (6.2%) |
| 4:00 PM to 11:59 PM | 134 (5.8%) | 86 (4.5%) |
| Total | 2,312 (100.0%) | 1,926 (100.0%) |
Housing Occupancy in Timonium
Occupancy by Ownership in Timonium
Of the total 4,017 dwellings in Timonium, owner-occupied units account for 3,222 (80.2%), while renter-occupied units make up 795 (19.8%).
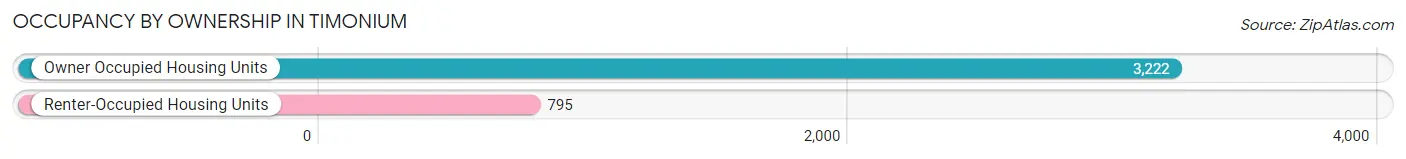
| Occupancy | # Housing Units | % Housing Units |
| Owner Occupied Housing Units | 3,222 | 80.2% |
| Renter-Occupied Housing Units | 795 | 19.8% |
| Total Occupied Housing Units | 4,017 | 100.0% |
Occupancy by Household Size in Timonium
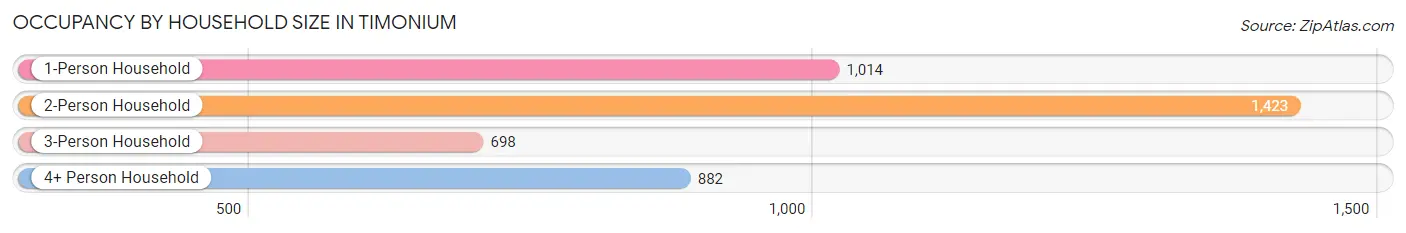
| Household Size | # Housing Units | % Housing Units |
| 1-Person Household | 1,014 | 25.2% |
| 2-Person Household | 1,423 | 35.4% |
| 3-Person Household | 698 | 17.4% |
| 4+ Person Household | 882 | 22.0% |
| Total Housing Units | 4,017 | 100.0% |
Occupancy by Ownership by Household Size in Timonium
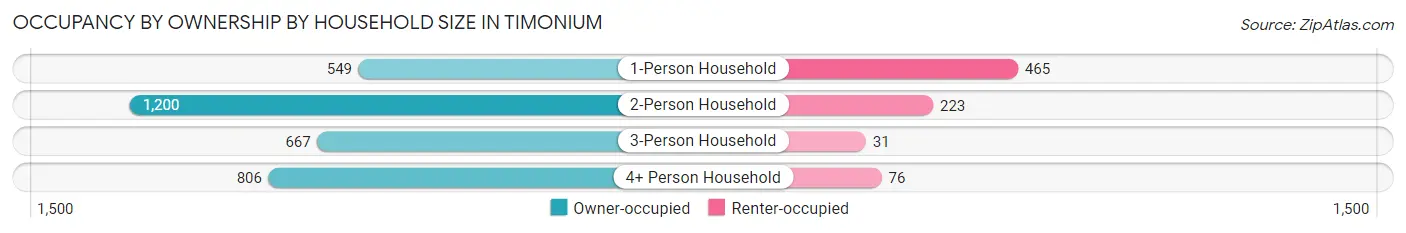
| Household Size | Owner-occupied | Renter-occupied |
| 1-Person Household | 549 (54.1%) | 465 (45.9%) |
| 2-Person Household | 1,200 (84.3%) | 223 (15.7%) |
| 3-Person Household | 667 (95.6%) | 31 (4.4%) |
| 4+ Person Household | 806 (91.4%) | 76 (8.6%) |
| Total Housing Units | 3,222 (80.2%) | 795 (19.8%) |
Occupancy by Educational Attainment in Timonium
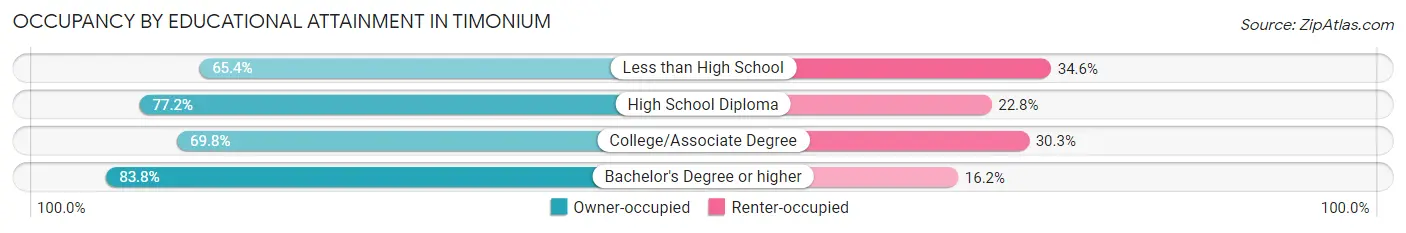
| Household Size | Owner-occupied | Renter-occupied |
| Less than High School | 68 (65.4%) | 36 (34.6%) |
| High School Diploma | 274 (77.2%) | 81 (22.8%) |
| College/Associate Degree | 505 (69.8%) | 219 (30.2%) |
| Bachelor's Degree or higher | 2,375 (83.8%) | 459 (16.2%) |
Occupancy by Age of Householder in Timonium
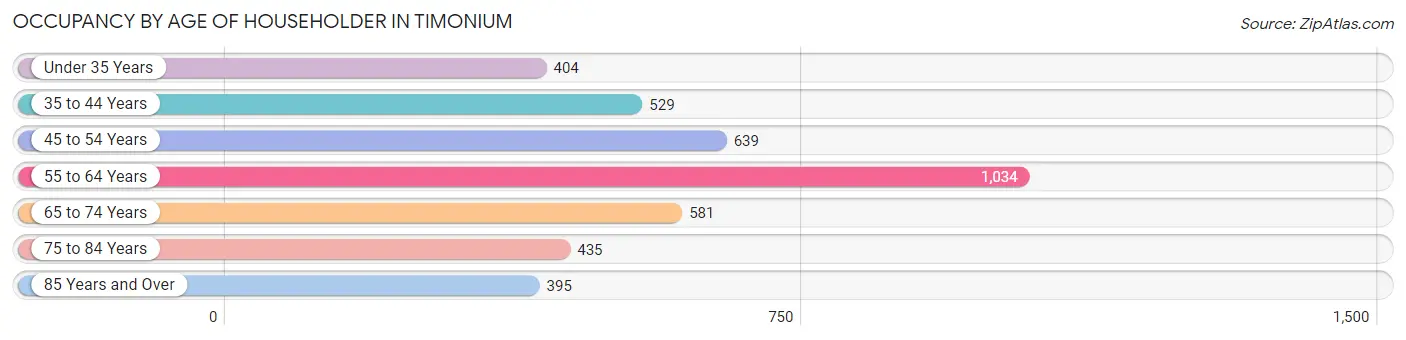
| Age Bracket | # Households | % Households |
| Under 35 Years | 404 | 10.1% |
| 35 to 44 Years | 529 | 13.2% |
| 45 to 54 Years | 639 | 15.9% |
| 55 to 64 Years | 1,034 | 25.7% |
| 65 to 74 Years | 581 | 14.5% |
| 75 to 84 Years | 435 | 10.8% |
| 85 Years and Over | 395 | 9.8% |
| Total | 4,017 | 100.0% |
Housing Finances in Timonium
Median Income by Occupancy in Timonium
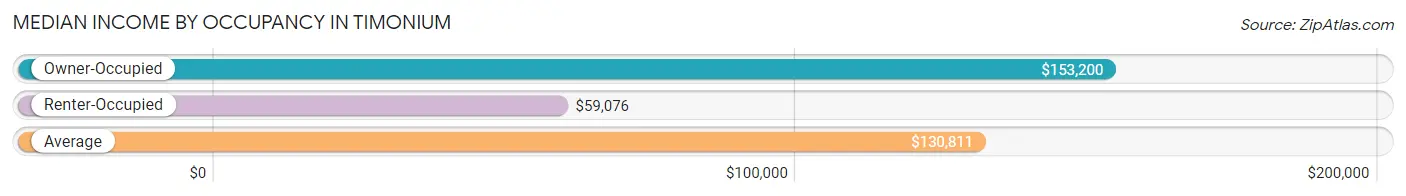
| Occupancy Type | # Households | Median Income |
| Owner-Occupied | 3,222 (80.2%) | $153,200 |
| Renter-Occupied | 795 (19.8%) | $59,076 |
| Average | 4,017 (100.0%) | $130,811 |
Occupancy by Householder Income Bracket in Timonium
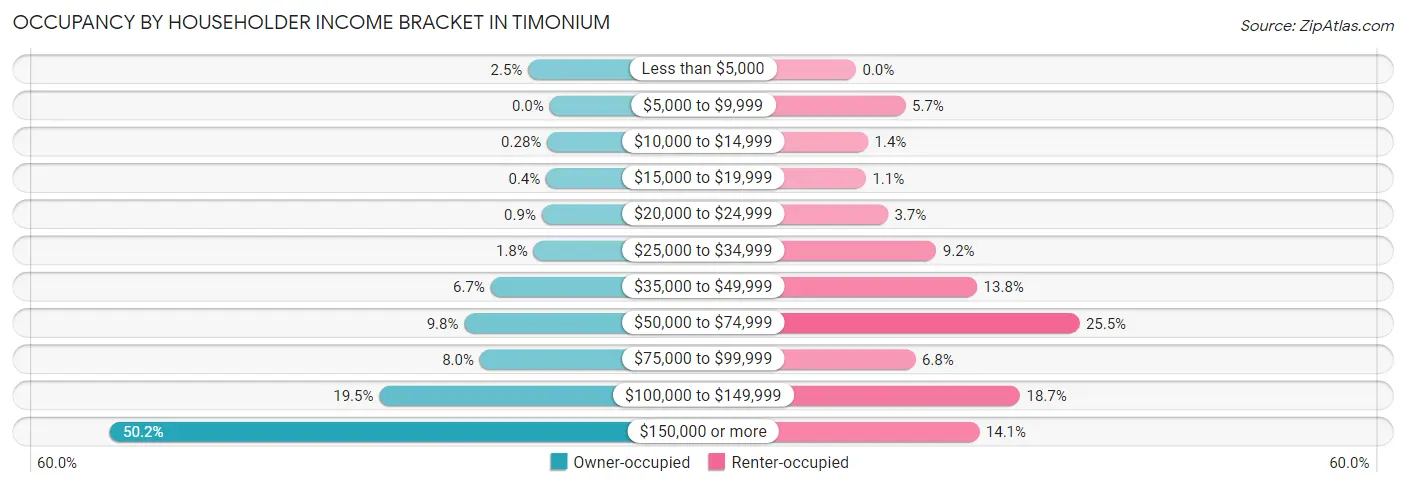
| Income Bracket | Owner-occupied | Renter-occupied |
| Less than $5,000 | 79 (2.5%) | 0 (0.0%) |
| $5,000 to $9,999 | 0 (0.0%) | 45 (5.7%) |
| $10,000 to $14,999 | 9 (0.3%) | 11 (1.4%) |
| $15,000 to $19,999 | 13 (0.4%) | 9 (1.1%) |
| $20,000 to $24,999 | 29 (0.9%) | 29 (3.6%) |
| $25,000 to $34,999 | 59 (1.8%) | 73 (9.2%) |
| $35,000 to $49,999 | 217 (6.7%) | 110 (13.8%) |
| $50,000 to $74,999 | 314 (9.8%) | 203 (25.5%) |
| $75,000 to $99,999 | 257 (8.0%) | 54 (6.8%) |
| $100,000 to $149,999 | 627 (19.5%) | 149 (18.7%) |
| $150,000 or more | 1,618 (50.2%) | 112 (14.1%) |
| Total | 3,222 (100.0%) | 795 (100.0%) |
Monthly Housing Cost Tiers in Timonium
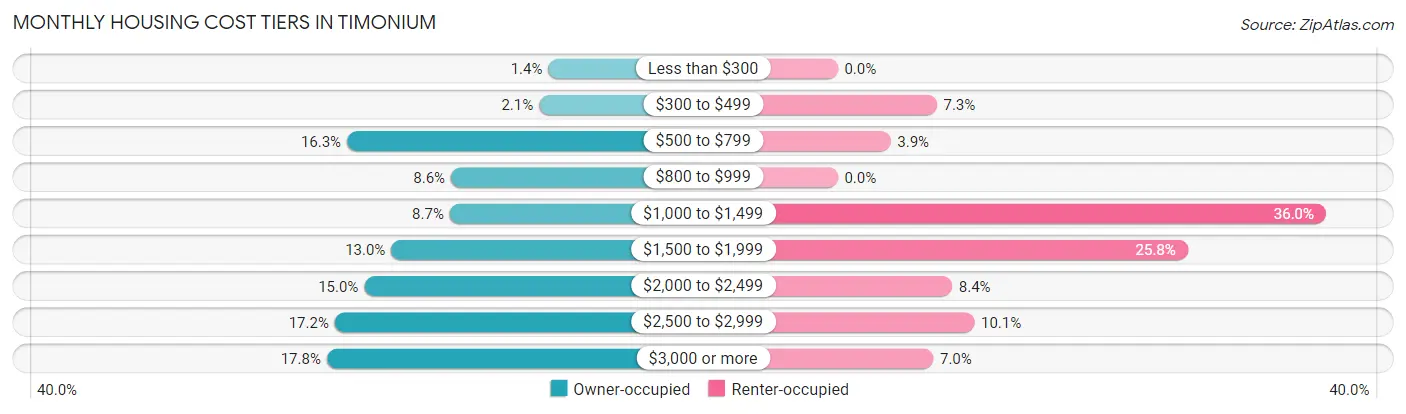
| Monthly Cost | Owner-occupied | Renter-occupied |
| Less than $300 | 46 (1.4%) | 0 (0.0%) |
| $300 to $499 | 68 (2.1%) | 58 (7.3%) |
| $500 to $799 | 524 (16.3%) | 31 (3.9%) |
| $800 to $999 | 277 (8.6%) | 0 (0.0%) |
| $1,000 to $1,499 | 280 (8.7%) | 286 (36.0%) |
| $1,500 to $1,999 | 419 (13.0%) | 205 (25.8%) |
| $2,000 to $2,499 | 483 (15.0%) | 67 (8.4%) |
| $2,500 to $2,999 | 553 (17.2%) | 80 (10.1%) |
| $3,000 or more | 572 (17.7%) | 56 (7.0%) |
| Total | 3,222 (100.0%) | 795 (100.0%) |
Physical Housing Characteristics in Timonium
Housing Structures in Timonium
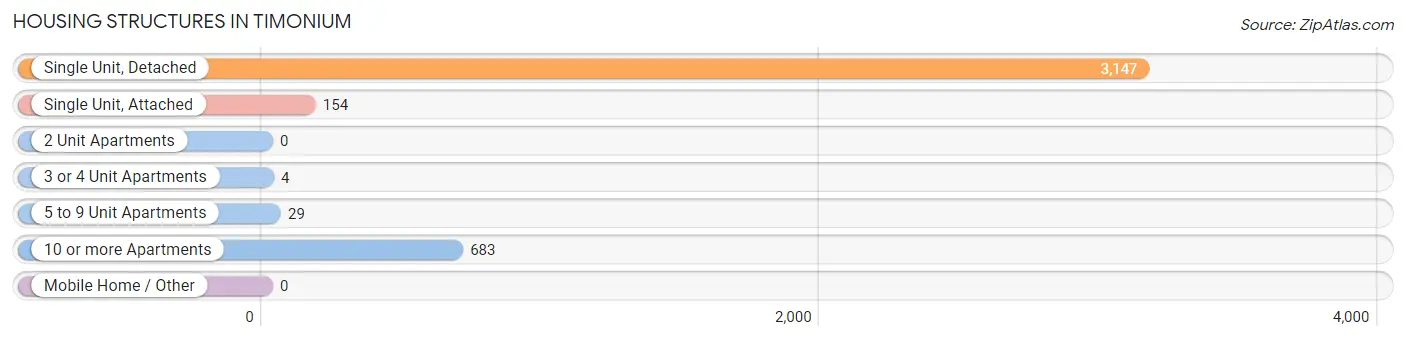
| Structure Type | # Housing Units | % Housing Units |
| Single Unit, Detached | 3,147 | 78.3% |
| Single Unit, Attached | 154 | 3.8% |
| 2 Unit Apartments | 0 | 0.0% |
| 3 or 4 Unit Apartments | 4 | 0.1% |
| 5 to 9 Unit Apartments | 29 | 0.7% |
| 10 or more Apartments | 683 | 17.0% |
| Mobile Home / Other | 0 | 0.0% |
| Total | 4,017 | 100.0% |
Housing Structures by Occupancy in Timonium
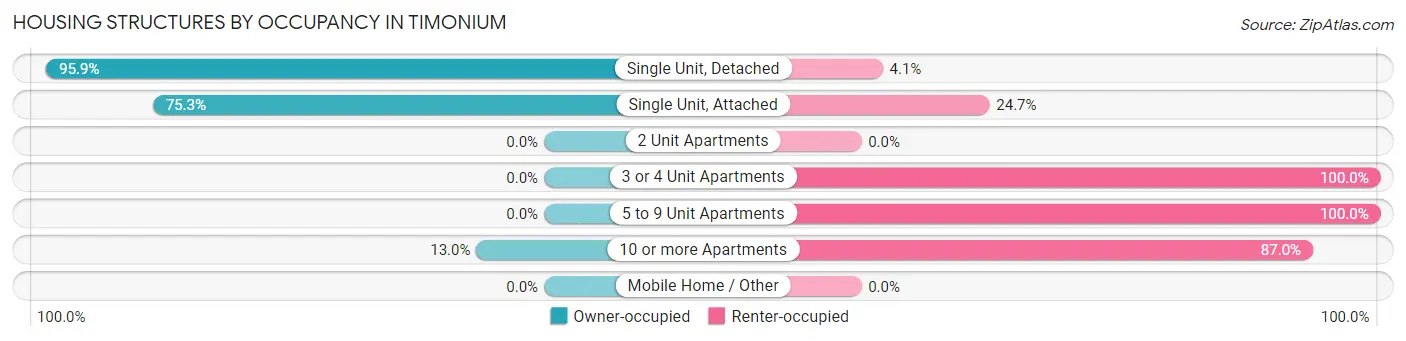
| Structure Type | Owner-occupied | Renter-occupied |
| Single Unit, Detached | 3,017 (95.9%) | 130 (4.1%) |
| Single Unit, Attached | 116 (75.3%) | 38 (24.7%) |
| 2 Unit Apartments | 0 (0.0%) | 0 (0.0%) |
| 3 or 4 Unit Apartments | 0 (0.0%) | 4 (100.0%) |
| 5 to 9 Unit Apartments | 0 (0.0%) | 29 (100.0%) |
| 10 or more Apartments | 89 (13.0%) | 594 (87.0%) |
| Mobile Home / Other | 0 (0.0%) | 0 (0.0%) |
| Total | 3,222 (80.2%) | 795 (19.8%) |
Housing Structures by Number of Rooms in Timonium
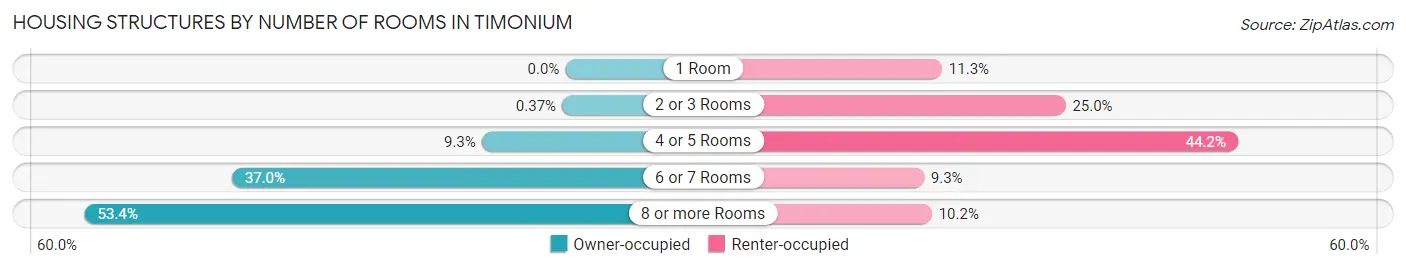
| Number of Rooms | Owner-occupied | Renter-occupied |
| 1 Room | 0 (0.0%) | 90 (11.3%) |
| 2 or 3 Rooms | 12 (0.4%) | 199 (25.0%) |
| 4 or 5 Rooms | 299 (9.3%) | 351 (44.2%) |
| 6 or 7 Rooms | 1,192 (37.0%) | 74 (9.3%) |
| 8 or more Rooms | 1,719 (53.3%) | 81 (10.2%) |
| Total | 3,222 (100.0%) | 795 (100.0%) |
Housing Structure by Heating Type in Timonium
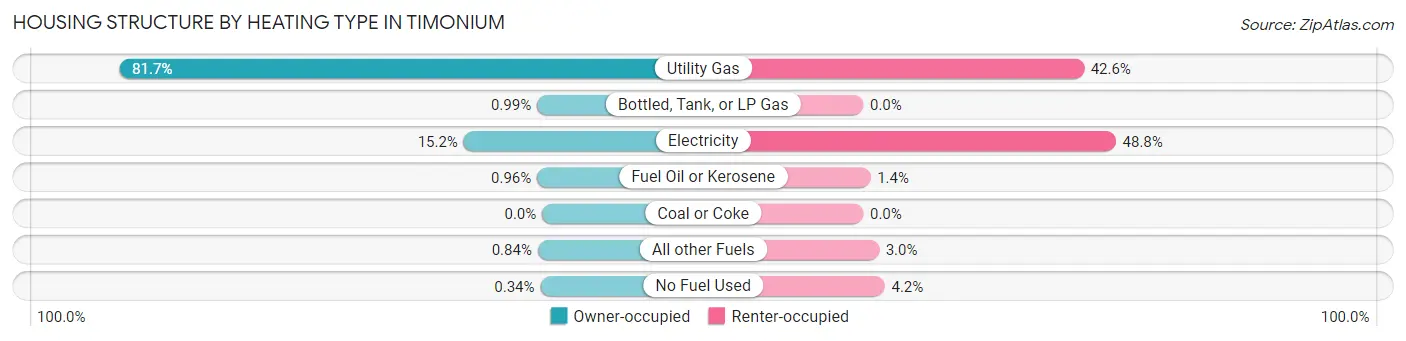
| Heating Type | Owner-occupied | Renter-occupied |
| Utility Gas | 2,633 (81.7%) | 339 (42.6%) |
| Bottled, Tank, or LP Gas | 32 (1.0%) | 0 (0.0%) |
| Electricity | 488 (15.1%) | 388 (48.8%) |
| Fuel Oil or Kerosene | 31 (1.0%) | 11 (1.4%) |
| Coal or Coke | 0 (0.0%) | 0 (0.0%) |
| All other Fuels | 27 (0.8%) | 24 (3.0%) |
| No Fuel Used | 11 (0.3%) | 33 (4.2%) |
| Total | 3,222 (100.0%) | 795 (100.0%) |
Household Vehicle Usage in Timonium
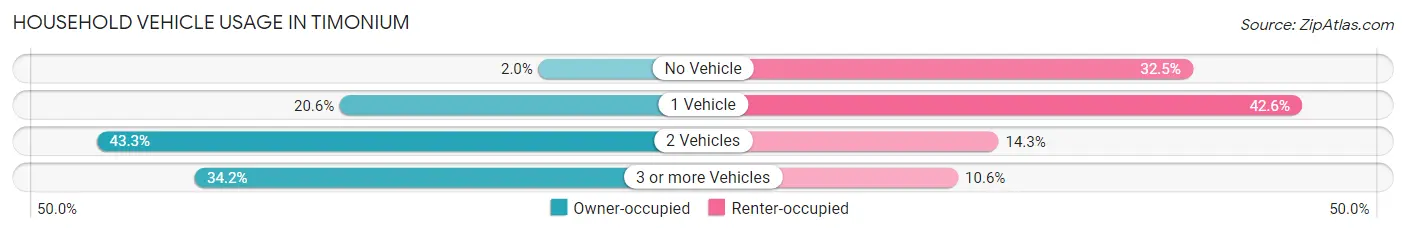
| Vehicles per Household | Owner-occupied | Renter-occupied |
| No Vehicle | 65 (2.0%) | 258 (32.5%) |
| 1 Vehicle | 662 (20.5%) | 339 (42.6%) |
| 2 Vehicles | 1,394 (43.3%) | 114 (14.3%) |
| 3 or more Vehicles | 1,101 (34.2%) | 84 (10.6%) |
| Total | 3,222 (100.0%) | 795 (100.0%) |
Real Estate & Mortgages in Timonium
Real Estate and Mortgage Overview in Timonium
| Characteristic | Without Mortgage | With Mortgage |
| Housing Units | 1,018 | 2,204 |
| Median Property Value | $450,200 | $482,000 |
| Median Household Income | $93,889 | $1,356 |
| Monthly Housing Costs | $761 | $572 |
| Real Estate Taxes | $4,698 | $62 |
Property Value by Mortgage Status in Timonium
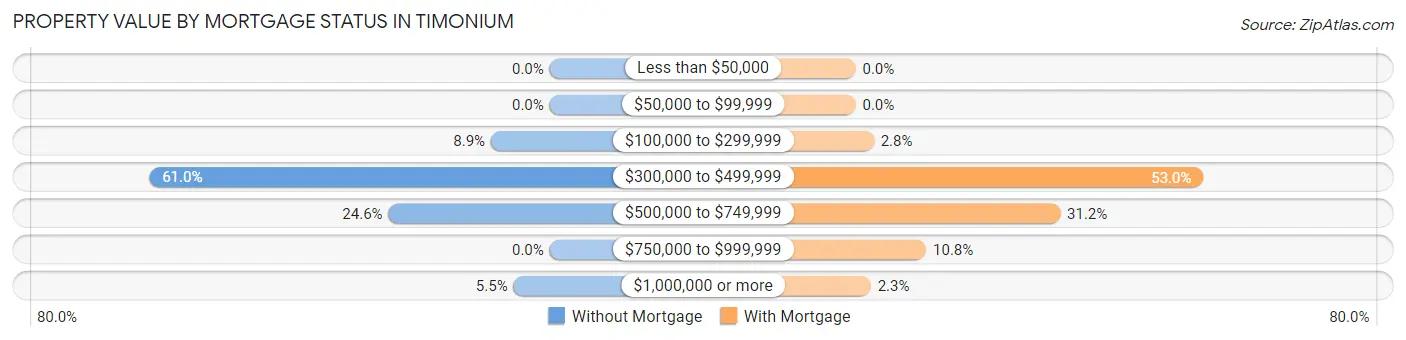
| Property Value | Without Mortgage | With Mortgage |
| Less than $50,000 | 0 (0.0%) | 0 (0.0%) |
| $50,000 to $99,999 | 0 (0.0%) | 0 (0.0%) |
| $100,000 to $299,999 | 91 (8.9%) | 61 (2.8%) |
| $300,000 to $499,999 | 621 (61.0%) | 1,168 (53.0%) |
| $500,000 to $749,999 | 250 (24.6%) | 687 (31.2%) |
| $750,000 to $999,999 | 0 (0.0%) | 237 (10.7%) |
| $1,000,000 or more | 56 (5.5%) | 51 (2.3%) |
| Total | 1,018 (100.0%) | 2,204 (100.0%) |
Household Income by Mortgage Status in Timonium
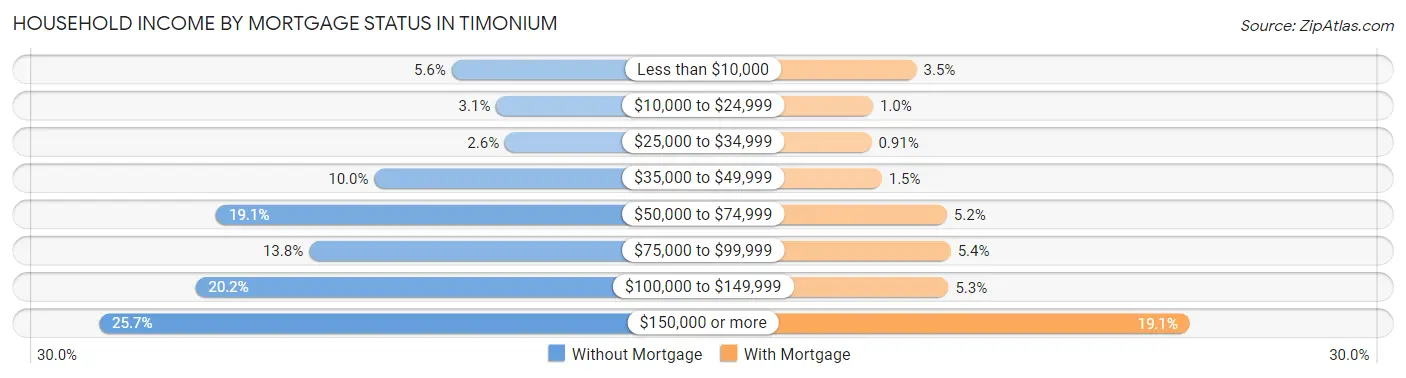
| Household Income | Without Mortgage | With Mortgage |
| Less than $10,000 | 57 (5.6%) | 77 (3.5%) |
| $10,000 to $24,999 | 31 (3.0%) | 22 (1.0%) |
| $25,000 to $34,999 | 26 (2.5%) | 20 (0.9%) |
| $35,000 to $49,999 | 102 (10.0%) | 33 (1.5%) |
| $50,000 to $74,999 | 194 (19.1%) | 115 (5.2%) |
| $75,000 to $99,999 | 140 (13.8%) | 120 (5.4%) |
| $100,000 to $149,999 | 206 (20.2%) | 117 (5.3%) |
| $150,000 or more | 262 (25.7%) | 421 (19.1%) |
| Total | 1,018 (100.0%) | 2,204 (100.0%) |
Property Value to Household Income Ratio in Timonium
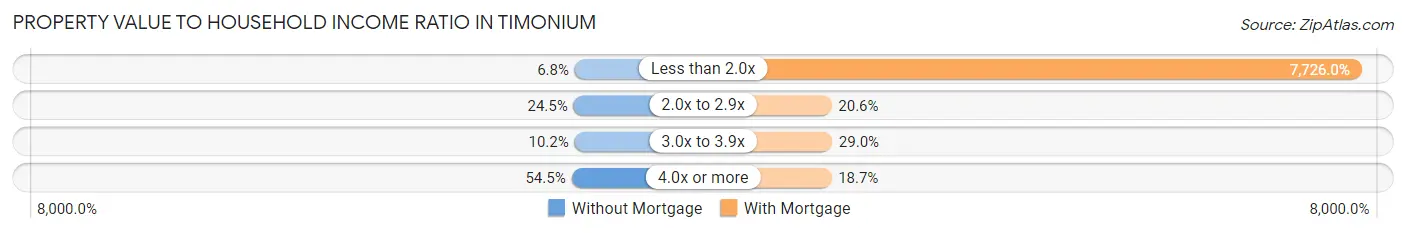
| Value-to-Income Ratio | Without Mortgage | With Mortgage |
| Less than 2.0x | 69 (6.8%) | 170,281 (7,726.0%) |
| 2.0x to 2.9x | 249 (24.5%) | 453 (20.5%) |
| 3.0x to 3.9x | 104 (10.2%) | 640 (29.0%) |
| 4.0x or more | 555 (54.5%) | 412 (18.7%) |
| Total | 1,018 (100.0%) | 2,204 (100.0%) |
Real Estate Taxes by Mortgage Status in Timonium
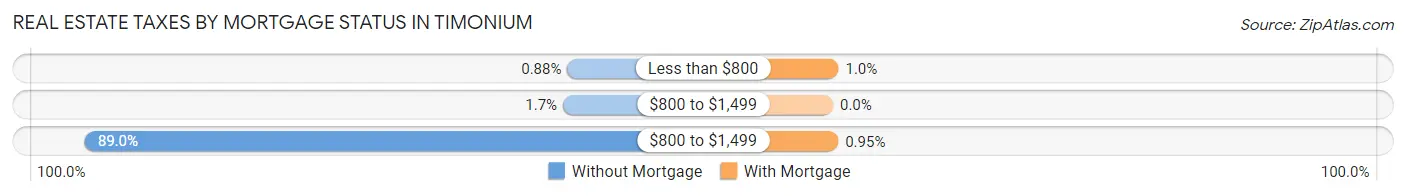
| Property Taxes | Without Mortgage | With Mortgage |
| Less than $800 | 9 (0.9%) | 22 (1.0%) |
| $800 to $1,499 | 17 (1.7%) | 0 (0.0%) |
| $800 to $1,499 | 906 (89.0%) | 21 (0.9%) |
| Total | 1,018 (100.0%) | 2,204 (100.0%) |
Health & Disability in Timonium
Health Insurance Coverage by Age in Timonium
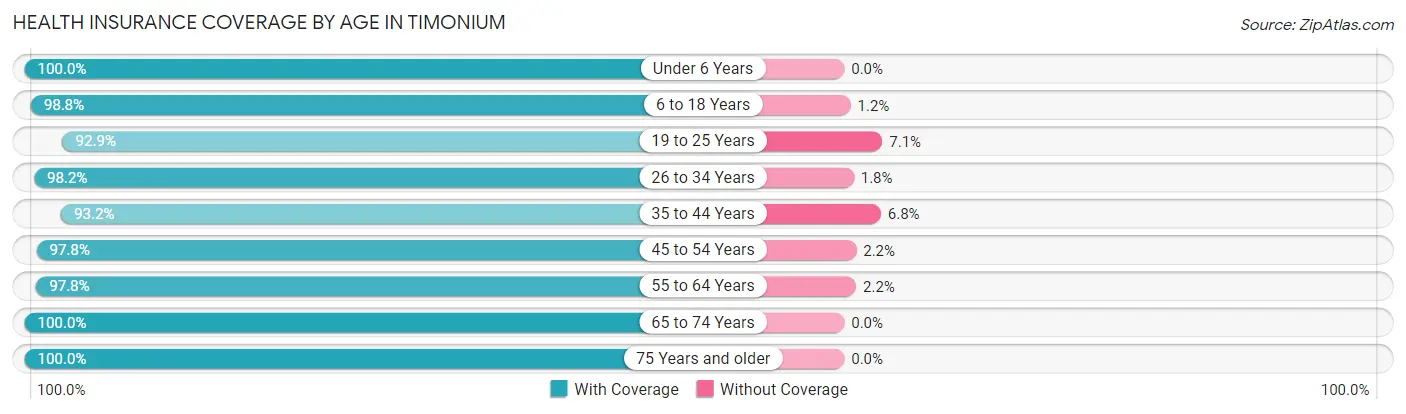
| Age Bracket | With Coverage | Without Coverage |
| Under 6 Years | 482 (100.0%) | 0 (0.0%) |
| 6 to 18 Years | 1,759 (98.8%) | 21 (1.2%) |
| 19 to 25 Years | 340 (92.9%) | 26 (7.1%) |
| 26 to 34 Years | 1,112 (98.2%) | 20 (1.8%) |
| 35 to 44 Years | 1,039 (93.2%) | 76 (6.8%) |
| 45 to 54 Years | 1,274 (97.8%) | 29 (2.2%) |
| 55 to 64 Years | 1,866 (97.8%) | 42 (2.2%) |
| 65 to 74 Years | 902 (100.0%) | 0 (0.0%) |
| 75 Years and older | 1,144 (100.0%) | 0 (0.0%) |
| Total | 9,918 (97.9%) | 214 (2.1%) |
Health Insurance Coverage by Citizenship Status in Timonium
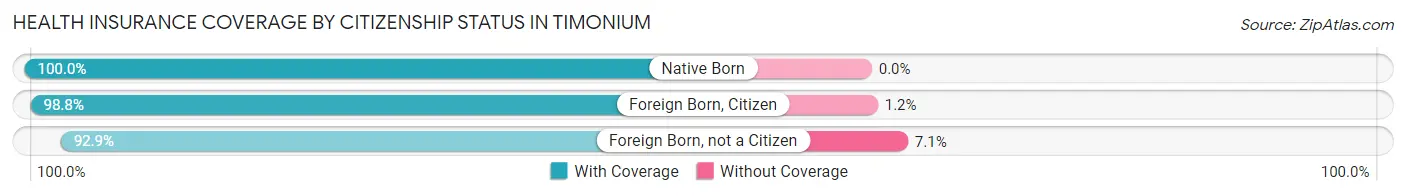
| Citizenship Status | With Coverage | Without Coverage |
| Native Born | 482 (100.0%) | 0 (0.0%) |
| Foreign Born, Citizen | 1,759 (98.8%) | 21 (1.2%) |
| Foreign Born, not a Citizen | 340 (92.9%) | 26 (7.1%) |
Health Insurance Coverage by Household Income in Timonium
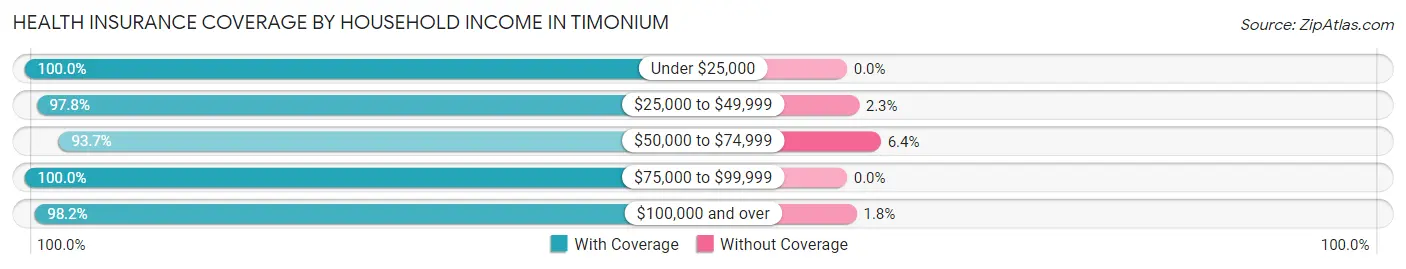
| Household Income | With Coverage | Without Coverage |
| Under $25,000 | 342 (100.0%) | 0 (0.0%) |
| $25,000 to $49,999 | 783 (97.8%) | 18 (2.2%) |
| $50,000 to $74,999 | 870 (93.6%) | 59 (6.4%) |
| $75,000 to $99,999 | 618 (100.0%) | 0 (0.0%) |
| $100,000 and over | 7,292 (98.2%) | 135 (1.8%) |
Public vs Private Health Insurance Coverage by Age in Timonium
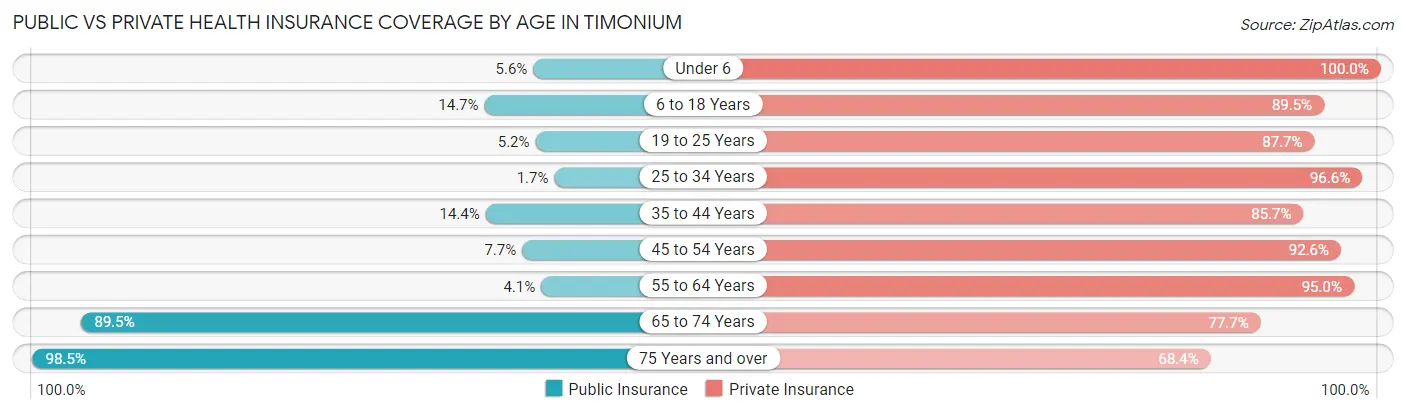
| Age Bracket | Public Insurance | Private Insurance |
| Under 6 | 27 (5.6%) | 482 (100.0%) |
| 6 to 18 Years | 261 (14.7%) | 1,593 (89.5%) |
| 19 to 25 Years | 19 (5.2%) | 321 (87.7%) |
| 25 to 34 Years | 19 (1.7%) | 1,093 (96.6%) |
| 35 to 44 Years | 161 (14.4%) | 955 (85.7%) |
| 45 to 54 Years | 100 (7.7%) | 1,207 (92.6%) |
| 55 to 64 Years | 79 (4.1%) | 1,813 (95.0%) |
| 65 to 74 Years | 807 (89.5%) | 701 (77.7%) |
| 75 Years and over | 1,127 (98.5%) | 783 (68.4%) |
| Total | 2,600 (25.7%) | 8,948 (88.3%) |
Disability Status by Sex by Age in Timonium
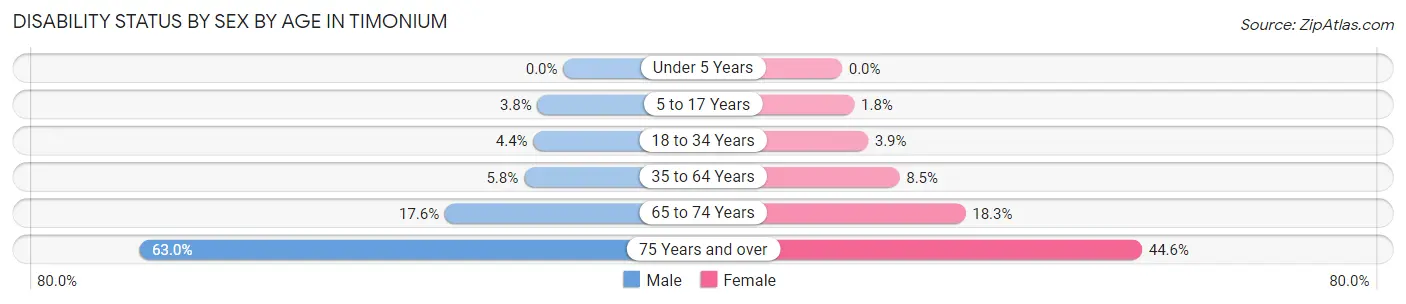
| Age Bracket | Male | Female |
| Under 5 Years | 0 (0.0%) | 0 (0.0%) |
| 5 to 17 Years | 31 (3.8%) | 17 (1.8%) |
| 18 to 34 Years | 46 (4.4%) | 24 (3.9%) |
| 35 to 64 Years | 124 (5.8%) | 188 (8.5%) |
| 65 to 74 Years | 78 (17.6%) | 84 (18.3%) |
| 75 Years and over | 339 (63.0%) | 270 (44.6%) |
Disability Class by Sex by Age in Timonium
Disability Class: Hearing Difficulty
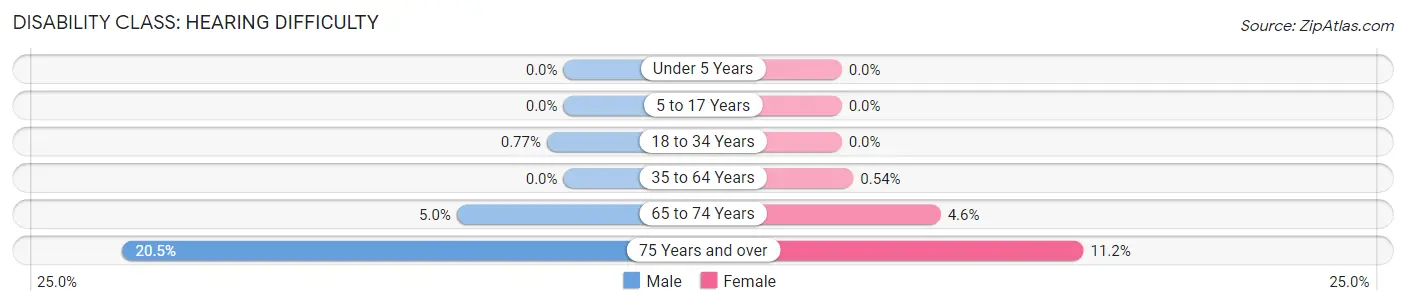
| Age Bracket | Male | Female |
| Under 5 Years | 0 (0.0%) | 0 (0.0%) |
| 5 to 17 Years | 0 (0.0%) | 0 (0.0%) |
| 18 to 34 Years | 8 (0.8%) | 0 (0.0%) |
| 35 to 64 Years | 0 (0.0%) | 12 (0.5%) |
| 65 to 74 Years | 22 (5.0%) | 21 (4.6%) |
| 75 Years and over | 110 (20.4%) | 68 (11.2%) |
Disability Class: Vision Difficulty
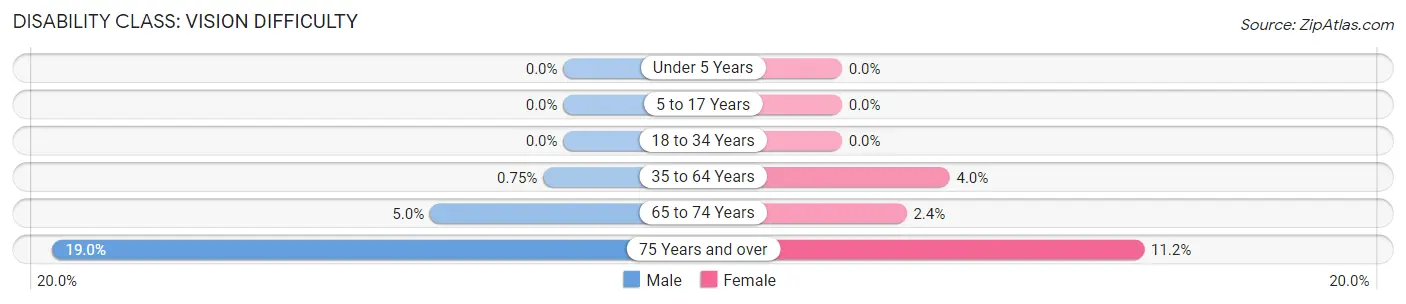
| Age Bracket | Male | Female |
| Under 5 Years | 0 (0.0%) | 0 (0.0%) |
| 5 to 17 Years | 0 (0.0%) | 0 (0.0%) |
| 18 to 34 Years | 0 (0.0%) | 0 (0.0%) |
| 35 to 64 Years | 16 (0.7%) | 88 (4.0%) |
| 65 to 74 Years | 22 (5.0%) | 11 (2.4%) |
| 75 Years and over | 102 (19.0%) | 68 (11.2%) |
Disability Class: Cognitive Difficulty
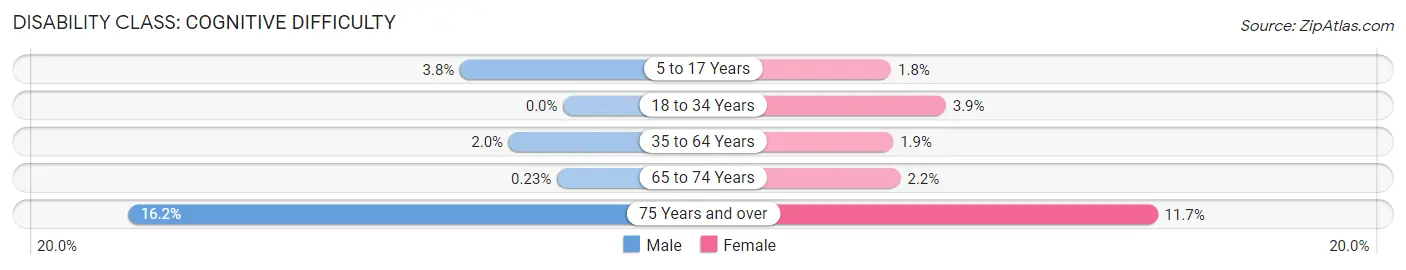
| Age Bracket | Male | Female |
| 5 to 17 Years | 31 (3.8%) | 17 (1.8%) |
| 18 to 34 Years | 0 (0.0%) | 24 (3.9%) |
| 35 to 64 Years | 43 (2.0%) | 42 (1.9%) |
| 65 to 74 Years | 1 (0.2%) | 10 (2.2%) |
| 75 Years and over | 87 (16.2%) | 71 (11.7%) |
Disability Class: Ambulatory Difficulty
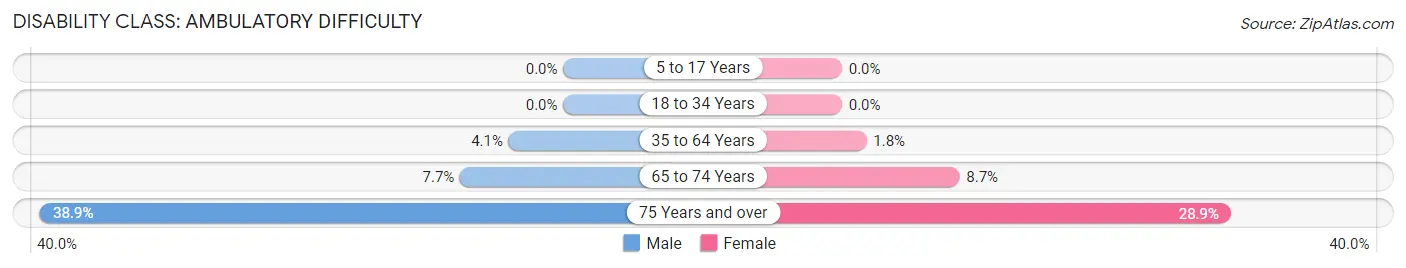
| Age Bracket | Male | Female |
| 5 to 17 Years | 0 (0.0%) | 0 (0.0%) |
| 18 to 34 Years | 0 (0.0%) | 0 (0.0%) |
| 35 to 64 Years | 86 (4.1%) | 40 (1.8%) |
| 65 to 74 Years | 34 (7.7%) | 40 (8.7%) |
| 75 Years and over | 209 (38.9%) | 175 (28.9%) |
Disability Class: Self-Care Difficulty
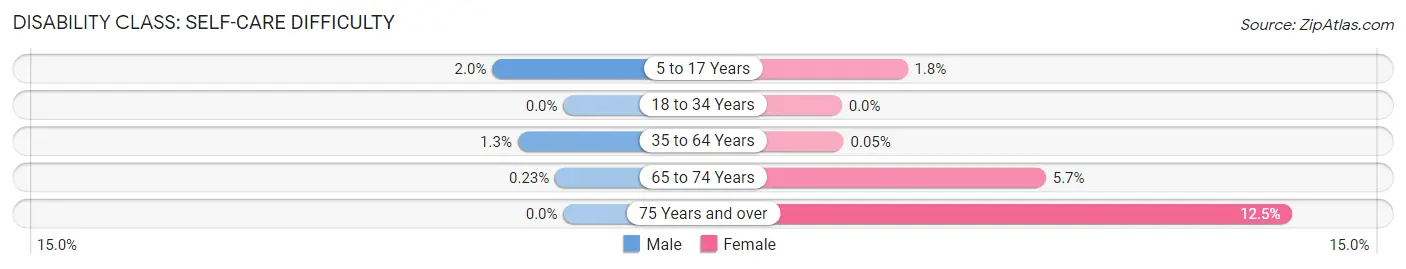
| Age Bracket | Male | Female |
| 5 to 17 Years | 16 (2.0%) | 17 (1.8%) |
| 18 to 34 Years | 0 (0.0%) | 0 (0.0%) |
| 35 to 64 Years | 27 (1.3%) | 1 (0.1%) |
| 65 to 74 Years | 1 (0.2%) | 26 (5.7%) |
| 75 Years and over | 0 (0.0%) | 76 (12.5%) |
Technology Access in Timonium
Computing Device Access in Timonium
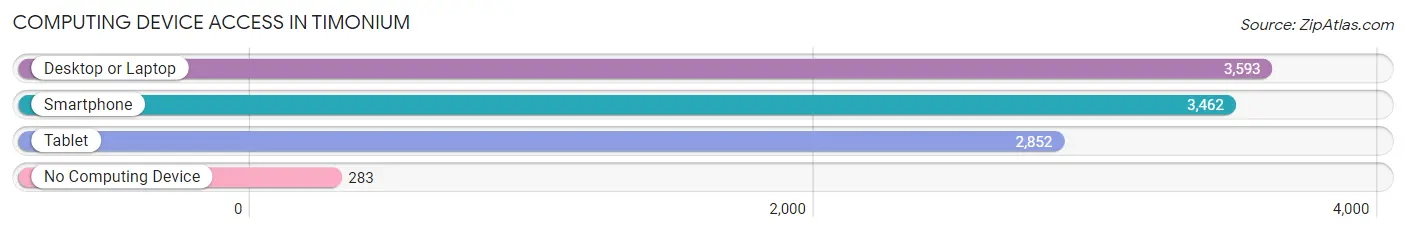
| Device Type | # Households | % Households |
| Desktop or Laptop | 3,593 | 89.4% |
| Smartphone | 3,462 | 86.2% |
| Tablet | 2,852 | 71.0% |
| No Computing Device | 283 | 7.0% |
| Total | 4,017 | 100.0% |
Internet Access in Timonium
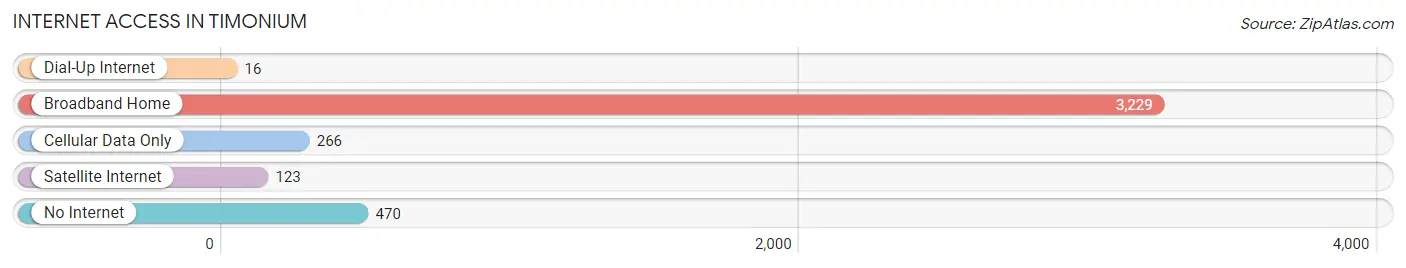
| Internet Type | # Households | % Households |
| Dial-Up Internet | 16 | 0.4% |
| Broadband Home | 3,229 | 80.4% |
| Cellular Data Only | 266 | 6.6% |
| Satellite Internet | 123 | 3.1% |
| No Internet | 470 | 11.7% |
| Total | 4,017 | 100.0% |
Timonium Summary
Timonium, Maryland is a small unincorporated community located in Baltimore County, Maryland. It is situated just north of the city of Baltimore and is part of the Baltimore-Washington metropolitan area. The community is home to approximately 8,000 people and is known for its small-town charm and close-knit community.
History
Timonium was first settled in the late 1700s by German immigrants who were attracted to the area by its fertile soil and abundant natural resources. The community was originally known as “Timonium Crossroads” and was home to a number of small farms and businesses. In 1854, the Baltimore and Ohio Railroad opened a station in the area, which helped to spur the growth of the community.
In the early 1900s, the area began to develop into a residential community. The Timonium Fairgrounds were established in 1922 and the area was incorporated as a town in 1925. The town was named after the Roman general Timon, who was known for his bravery and courage.
Geography
Timonium is located in the Piedmont region of Maryland, which is characterized by rolling hills and valleys. The area is situated on the western edge of the Chesapeake Bay watershed and is bordered by the Patapsco River to the east and the Gunpowder River to the west. The community is located approximately 10 miles north of downtown Baltimore and is accessible via Interstate 83 and the Baltimore Beltway.
Economy
Timonium is home to a number of businesses and industries, including retail stores, restaurants, and professional services. The community is also home to the Timonium Fairgrounds, which hosts a variety of events throughout the year, including the Maryland State Fair. The area is also home to a number of corporate offices, including those of the McCormick & Company, Inc. and the T. Rowe Price Group.
Demographics
As of the 2010 census, the population of Timonium was 8,039. The racial makeup of the community was 79.3% White, 11.2% African American, 0.3% Native American, 4.2% Asian, and 4.9% from other races. The median household income was $90,945, and the median age was 41.7 years.
Timonium is a diverse and vibrant community that is known for its small-town charm and close-knit community. The area is home to a variety of businesses and industries, and is a popular destination for visitors and residents alike. With its convenient location and abundance of amenities, Timonium is an ideal place to live, work, and play.
Common Questions
What is Per Capita Income in Timonium?
Per Capita income in Timonium is $61,675.
What is the Median Family Income in Timonium?
Median Family Income in Timonium is $163,779.
What is the Median Household income in Timonium?
Median Household Income in Timonium is $130,811.
What is Income or Wage Gap in Timonium?
Income or Wage Gap in Timonium is 25.5%.
Women in Timonium earn 74.5 cents for every dollar earned by a man.
What is Inequality or Gini Index in Timonium?
Inequality or Gini Index in Timonium is 0.43.
What is the Total Population of Timonium?
Total Population of Timonium is 10,793.
What is the Total Male Population of Timonium?
Total Male Population of Timonium is 5,389.
What is the Total Female Population of Timonium?
Total Female Population of Timonium is 5,404.
What is the Ratio of Males per 100 Females in Timonium?
There are 99.72 Males per 100 Females in Timonium.
What is the Ratio of Females per 100 Males in Timonium?
There are 100.28 Females per 100 Males in Timonium.
What is the Median Population Age in Timonium?
Median Population Age in Timonium is 49.0 Years.
What is the Average Family Size in Timonium
Average Family Size in Timonium is 3.1 People.
What is the Average Household Size in Timonium
Average Household Size in Timonium is 2.5 People.
How Large is the Labor Force in Timonium?
There are 5,560 People in the Labor Forcein in Timonium.
What is the Percentage of People in the Labor Force in Timonium?
60.8% of People are in the Labor Force in Timonium.
What is the Unemployment Rate in Timonium?
Unemployment Rate in Timonium is 4.5%.