Point Of Rocks, MD Map & Demographics
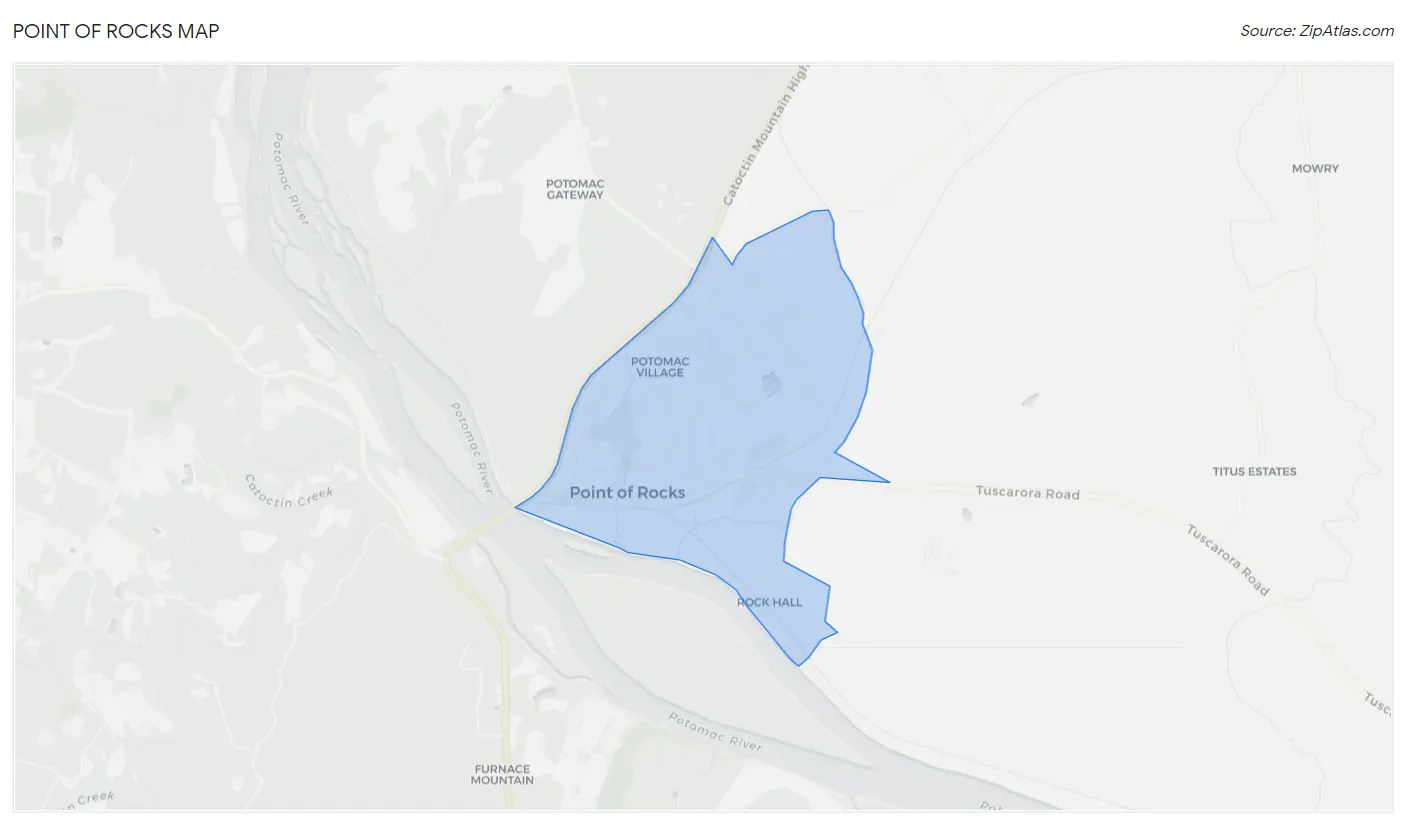
Point Of Rocks Map
Point Of Rocks Overview
$48,104
PER CAPITA INCOME
$132,368
AVG FAMILY INCOME
$126,944
AVG HOUSEHOLD INCOME
53.1%
WAGE / INCOME GAP [ % ]
46.9¢/ $1
WAGE / INCOME GAP [ $ ]
0.29
INEQUALITY / GINI INDEX
2,360
TOTAL POPULATION
1,284
MALE POPULATION
1,076
FEMALE POPULATION
119.33
MALES / 100 FEMALES
83.80
FEMALES / 100 MALES
38.3
MEDIAN AGE
3.2
AVG FAMILY SIZE
3.2
AVG HOUSEHOLD SIZE
1,222
LABOR FORCE [ PEOPLE ]
66.6%
PERCENT IN LABOR FORCE
3.6%
UNEMPLOYMENT RATE
Point Of Rocks Zip Codes
Point Of Rocks Area Codes
Income in Point Of Rocks
Income Overview in Point Of Rocks
Per Capita Income in Point Of Rocks is $48,104, while median incomes of families and households are $132,368 and $126,944 respectively.
| Characteristic | Number | Measure |
| Per Capita Income | 2,360 | $48,104 |
| Median Family Income | 686 | $132,368 |
| Mean Family Income | 686 | $152,403 |
| Median Household Income | 726 | $126,944 |
| Mean Household Income | 726 | $155,694 |
| Income Deficit | 686 | $0 |
| Wage / Income Gap (%) | 2,360 | 53.12% |
| Wage / Income Gap ($) | 2,360 | 46.88¢ per $1 |
| Gini / Inequality Index | 2,360 | 0.29 |
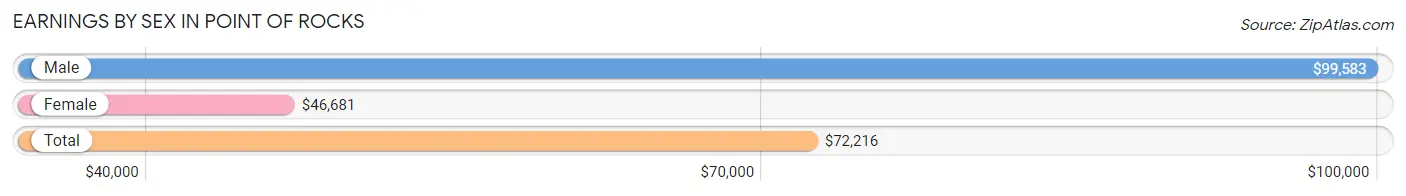
Earnings by Sex in Point Of Rocks
Average Earnings in Point Of Rocks are $72,216, $99,583 for men and $46,681 for women, a difference of 53.1%.
| Sex | Number | Average Earnings |
| Male | 806 (65.6%) | $99,583 |
| Female | 423 (34.4%) | $46,681 |
| Total | 1,229 (100.0%) | $72,216 |
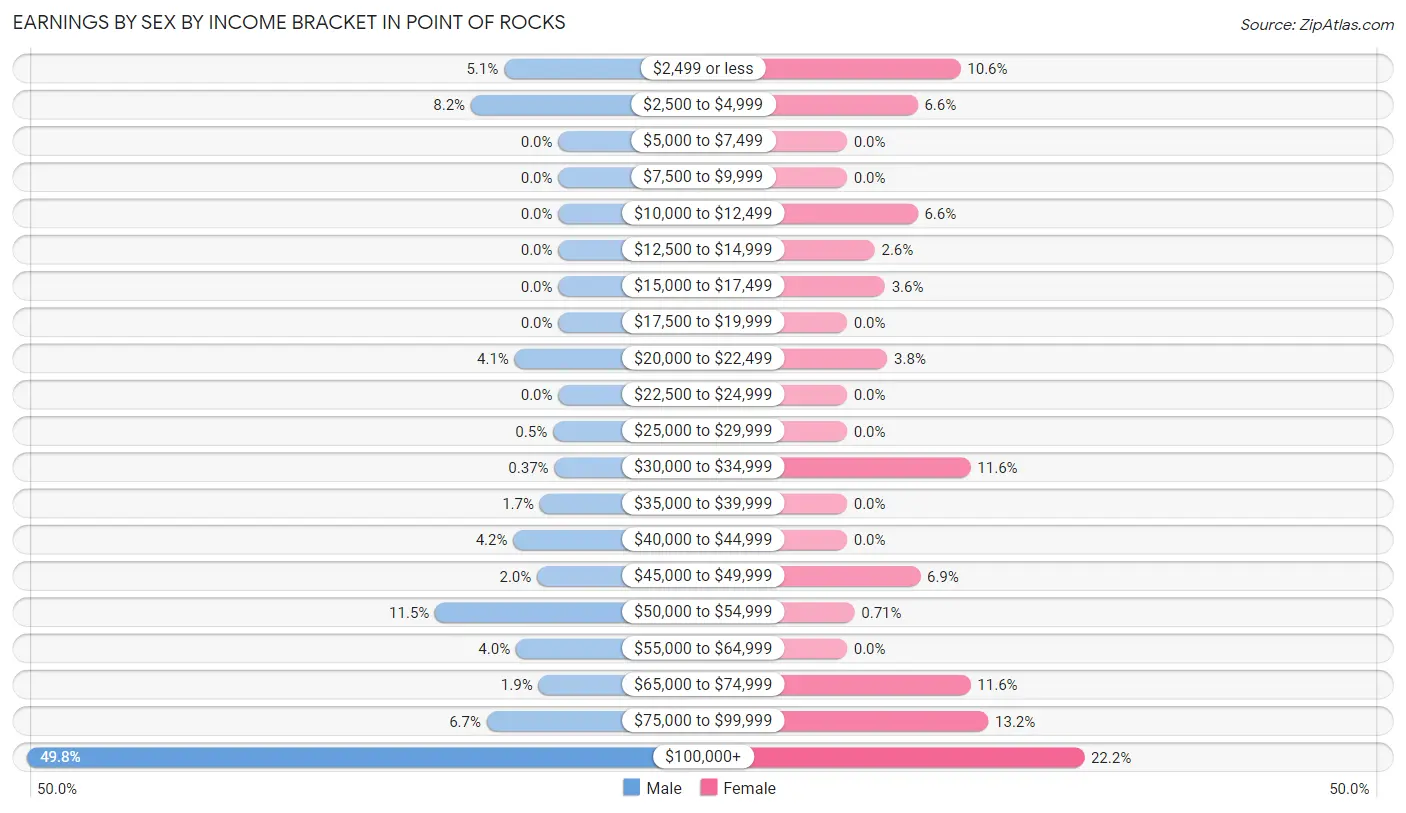
Earnings by Sex by Income Bracket in Point Of Rocks
The most common earnings brackets in Point Of Rocks are $100,000+ for men (401 | 49.7%) and $100,000+ for women (94 | 22.2%).
| Income | Male | Female |
| $2,499 or less | 41 (5.1%) | 45 (10.6%) |
| $2,500 to $4,999 | 66 (8.2%) | 28 (6.6%) |
| $5,000 to $7,499 | 0 (0.0%) | 0 (0.0%) |
| $7,500 to $9,999 | 0 (0.0%) | 0 (0.0%) |
| $10,000 to $12,499 | 0 (0.0%) | 28 (6.6%) |
| $12,500 to $14,999 | 0 (0.0%) | 11 (2.6%) |
| $15,000 to $17,499 | 0 (0.0%) | 15 (3.5%) |
| $17,500 to $19,999 | 0 (0.0%) | 0 (0.0%) |
| $20,000 to $22,499 | 33 (4.1%) | 16 (3.8%) |
| $22,500 to $24,999 | 0 (0.0%) | 0 (0.0%) |
| $25,000 to $29,999 | 4 (0.5%) | 0 (0.0%) |
| $30,000 to $34,999 | 3 (0.4%) | 49 (11.6%) |
| $35,000 to $39,999 | 14 (1.7%) | 0 (0.0%) |
| $40,000 to $44,999 | 34 (4.2%) | 0 (0.0%) |
| $45,000 to $49,999 | 16 (2.0%) | 29 (6.9%) |
| $50,000 to $54,999 | 93 (11.5%) | 3 (0.7%) |
| $55,000 to $64,999 | 32 (4.0%) | 0 (0.0%) |
| $65,000 to $74,999 | 15 (1.9%) | 49 (11.6%) |
| $75,000 to $99,999 | 54 (6.7%) | 56 (13.2%) |
| $100,000+ | 401 (49.7%) | 94 (22.2%) |
| Total | 806 (100.0%) | 423 (100.0%) |
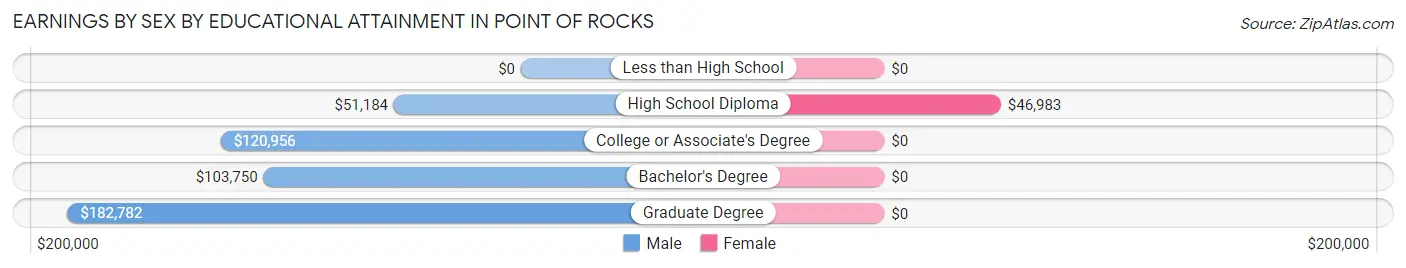
Earnings by Sex by Educational Attainment in Point Of Rocks
Average earnings in Point Of Rocks are $104,122 for men and $46,681 for women, a difference of 55.2%. Men with an educational attainment of graduate degree enjoy the highest average annual earnings of $182,782, while those with high school diploma education earn the least with $51,184. Women with an educational attainment of high school diploma earn the most with the average annual earnings of $46,983, while those with high school diploma education have the smallest earnings of $46,983.
| Educational Attainment | Male Income | Female Income |
| Less than High School | - | - |
| High School Diploma | $51,184 | $46,983 |
| College or Associate's Degree | $120,956 | $0 |
| Bachelor's Degree | $103,750 | $0 |
| Graduate Degree | $182,782 | $0 |
| Total | $104,122 | $46,681 |
Family Income in Point Of Rocks
Family Income Brackets in Point Of Rocks
According to the Point Of Rocks family income data, there are 212 families falling into the $100,000 to $149,999 income range, which is the most common income bracket and makes up 30.9% of all families.
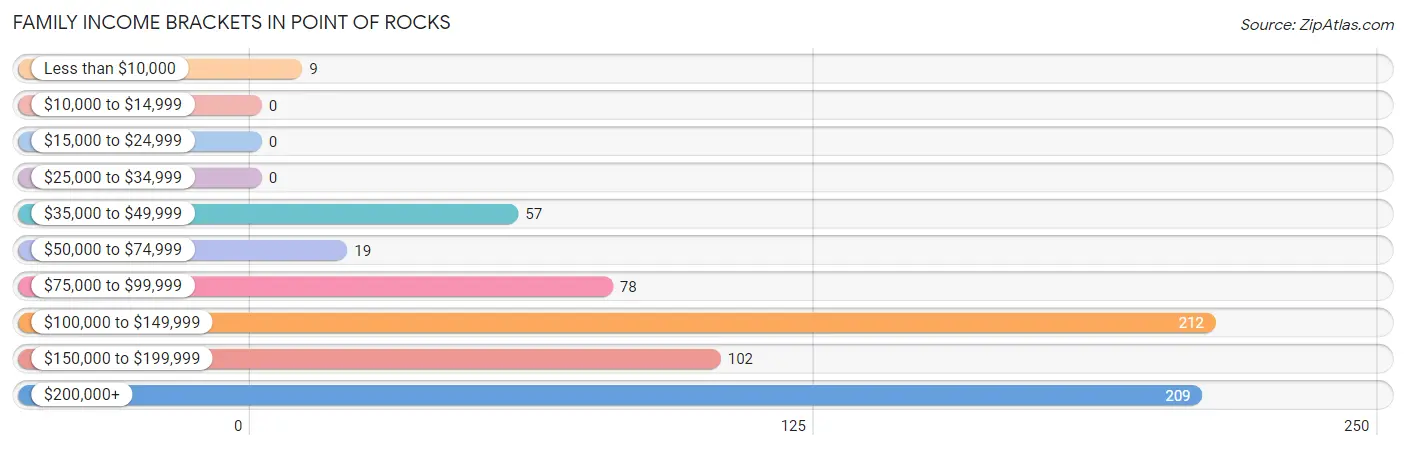
| Income Bracket | # Families | % Families |
| Less than $10,000 | 9 | 1.3% |
| $10,000 to $14,999 | 0 | 0.0% |
| $15,000 to $24,999 | 0 | 0.0% |
| $25,000 to $34,999 | 0 | 0.0% |
| $35,000 to $49,999 | 57 | 8.3% |
| $50,000 to $74,999 | 19 | 2.8% |
| $75,000 to $99,999 | 78 | 11.4% |
| $100,000 to $149,999 | 212 | 30.9% |
| $150,000 to $199,999 | 102 | 14.9% |
| $200,000+ | 209 | 30.5% |
Family Income by Famaliy Size in Point Of Rocks
5-person families (127 | 18.5%) account for the highest median family income in Point Of Rocks with $171,991 per family, while 4-person families (105 | 15.3%) have the highest median income of $35,710 per family member.
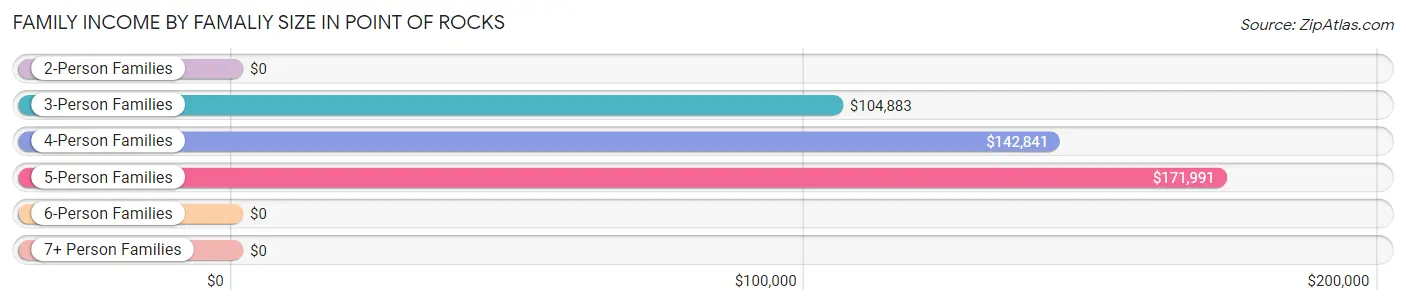
| Income Bracket | # Families | Median Income |
| 2-Person Families | 283 (41.2%) | $0 |
| 3-Person Families | 148 (21.6%) | $104,883 |
| 4-Person Families | 105 (15.3%) | $142,841 |
| 5-Person Families | 127 (18.5%) | $171,991 |
| 6-Person Families | 18 (2.6%) | $0 |
| 7+ Person Families | 5 (0.7%) | $0 |
| Total | 686 (100.0%) | $132,368 |
Family Income by Number of Earners in Point Of Rocks
The median family income in Point Of Rocks is $132,368, with families comprising 3+ earners (91) having the highest median family income of $171,898, while families with no earners (39) have the lowest median family income of $90,688, accounting for 13.3% and 5.7% of families, respectively.
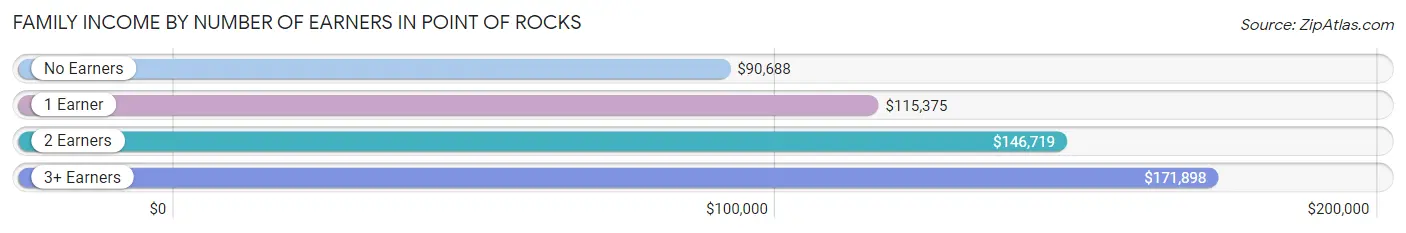
| Number of Earners | # Families | Median Income |
| No Earners | 39 (5.7%) | $90,688 |
| 1 Earner | 305 (44.5%) | $115,375 |
| 2 Earners | 251 (36.6%) | $146,719 |
| 3+ Earners | 91 (13.3%) | $171,898 |
| Total | 686 (100.0%) | $132,368 |
Household Income in Point Of Rocks
Household Income Brackets in Point Of Rocks
With 253 households falling in the category, the $100,000 to $149,999 income range is the most frequent in Point Of Rocks, accounting for 34.8% of all households.
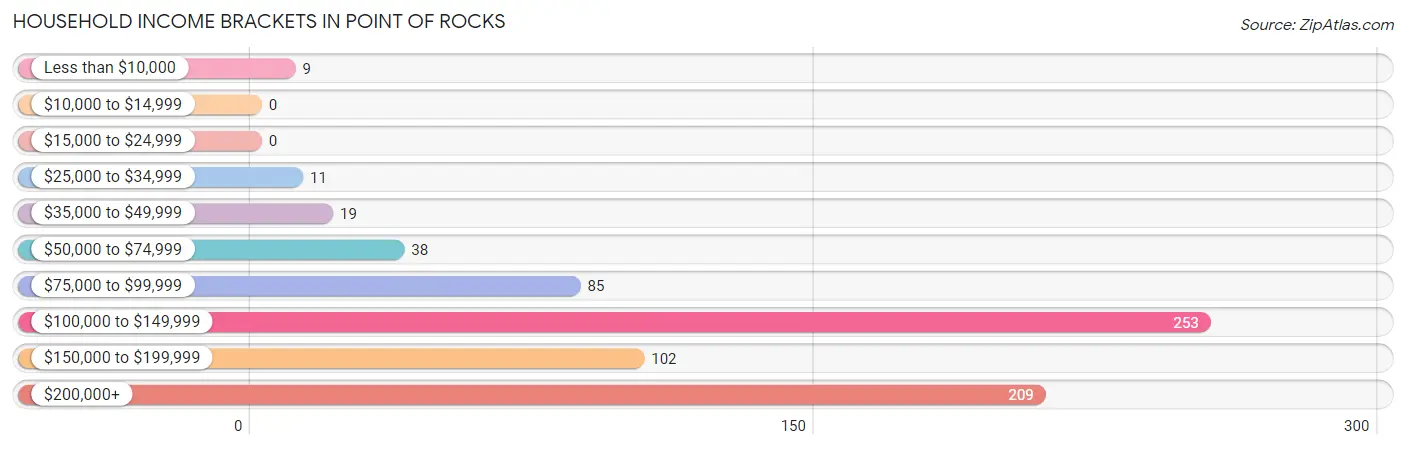
| Income Bracket | # Households | % Households |
| Less than $10,000 | 9 | 1.2% |
| $10,000 to $14,999 | 0 | 0.0% |
| $15,000 to $24,999 | 0 | 0.0% |
| $25,000 to $34,999 | 11 | 1.5% |
| $35,000 to $49,999 | 19 | 2.6% |
| $50,000 to $74,999 | 38 | 5.2% |
| $75,000 to $99,999 | 85 | 11.7% |
| $100,000 to $149,999 | 253 | 34.8% |
| $150,000 to $199,999 | 102 | 14.0% |
| $200,000+ | 209 | 28.8% |
Household Income by Householder Age in Point Of Rocks
The median household income in Point Of Rocks is $126,944, with the highest median household income of $167,750 found in the 45 to 64 years age bracket for the primary householder. A total of 449 households (61.9%) fall into this category.
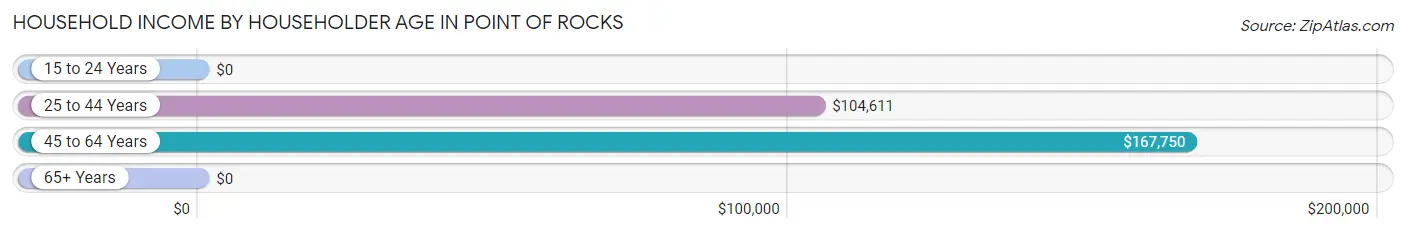
| Income Bracket | # Households | Median Income |
| 15 to 24 Years | 0 (0.0%) | $0 |
| 25 to 44 Years | 255 (35.1%) | $104,611 |
| 45 to 64 Years | 449 (61.9%) | $167,750 |
| 65+ Years | 22 (3.0%) | $0 |
| Total | 726 (100.0%) | $126,944 |
Poverty in Point Of Rocks
Income Below Poverty by Sex and Age in Point Of Rocks
With 2.1% poverty level for males and 2.8% for females among the residents of Point Of Rocks, 55 to 64 year old males and 55 to 64 year old females are the most vulnerable to poverty, with 27 males (11.1%) and 26 females (12.9%) in their respective age groups living below the poverty level.
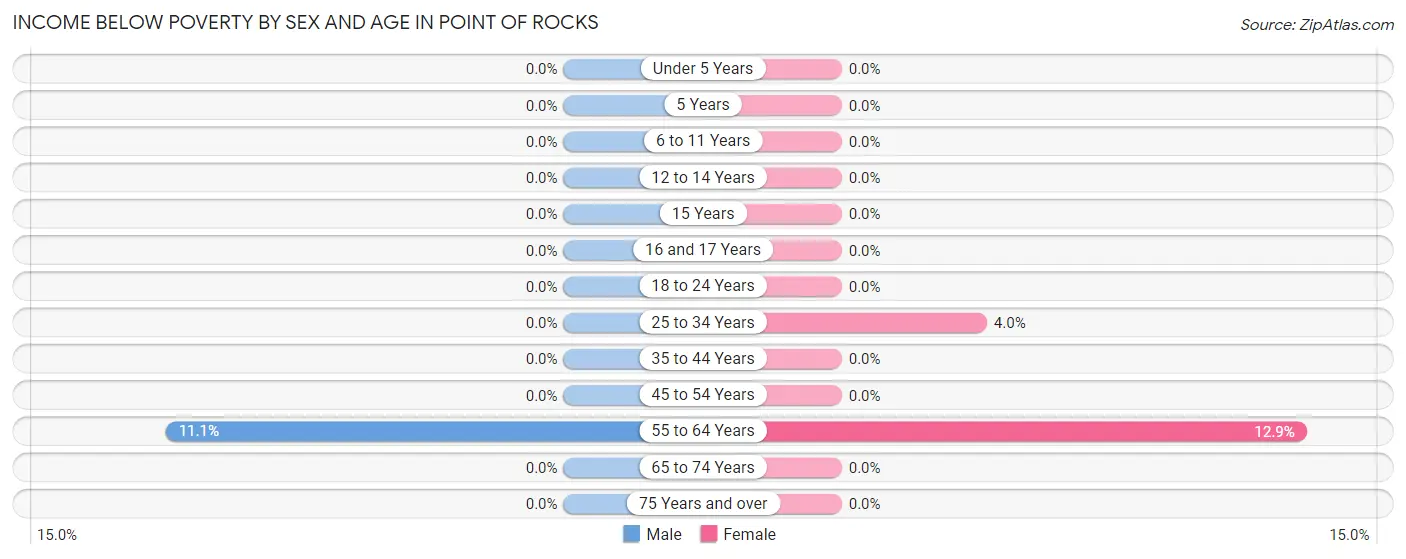
| Age Bracket | Male | Female |
| Under 5 Years | 0 (0.0%) | 0 (0.0%) |
| 5 Years | 0 (0.0%) | 0 (0.0%) |
| 6 to 11 Years | 0 (0.0%) | 0 (0.0%) |
| 12 to 14 Years | 0 (0.0%) | 0 (0.0%) |
| 15 Years | 0 (0.0%) | 0 (0.0%) |
| 16 and 17 Years | 0 (0.0%) | 0 (0.0%) |
| 18 to 24 Years | 0 (0.0%) | 0 (0.0%) |
| 25 to 34 Years | 0 (0.0%) | 4 (4.0%) |
| 35 to 44 Years | 0 (0.0%) | 0 (0.0%) |
| 45 to 54 Years | 0 (0.0%) | 0 (0.0%) |
| 55 to 64 Years | 27 (11.1%) | 26 (12.9%) |
| 65 to 74 Years | 0 (0.0%) | 0 (0.0%) |
| 75 Years and over | 0 (0.0%) | 0 (0.0%) |
| Total | 27 (2.1%) | 30 (2.8%) |
Income Above Poverty by Sex and Age in Point Of Rocks
According to the poverty statistics in Point Of Rocks, males aged under 5 years and females aged under 5 years are the age groups that are most secure financially, with 100.0% of males and 100.0% of females in these age groups living above the poverty line.
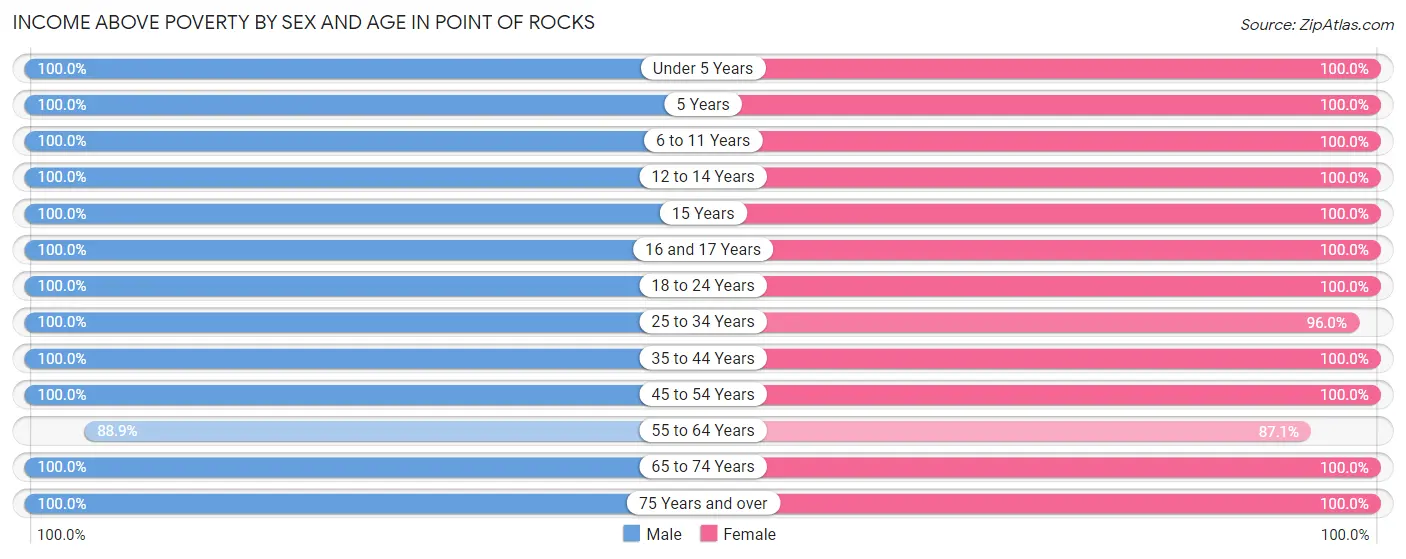
| Age Bracket | Male | Female |
| Under 5 Years | 127 (100.0%) | 83 (100.0%) |
| 5 Years | 22 (100.0%) | 19 (100.0%) |
| 6 to 11 Years | 51 (100.0%) | 101 (100.0%) |
| 12 to 14 Years | 46 (100.0%) | 40 (100.0%) |
| 15 Years | 20 (100.0%) | 16 (100.0%) |
| 16 and 17 Years | 37 (100.0%) | 10 (100.0%) |
| 18 to 24 Years | 127 (100.0%) | 62 (100.0%) |
| 25 to 34 Years | 135 (100.0%) | 95 (96.0%) |
| 35 to 44 Years | 171 (100.0%) | 161 (100.0%) |
| 45 to 54 Years | 169 (100.0%) | 206 (100.0%) |
| 55 to 64 Years | 217 (88.9%) | 175 (87.1%) |
| 65 to 74 Years | 99 (100.0%) | 39 (100.0%) |
| 75 Years and over | 36 (100.0%) | 39 (100.0%) |
| Total | 1,257 (97.9%) | 1,046 (97.2%) |
Income Below Poverty Among Married-Couple Families in Point Of Rocks
The poverty statistics for married-couple families in Point Of Rocks show that 1.5% or 9 of the total 595 families live below the poverty line. Families with no children have the highest poverty rate of 3.6%, comprising of 9 families. On the other hand, families with 1 or 2 children have the lowest poverty rate of 0.0%, which includes 0 families.
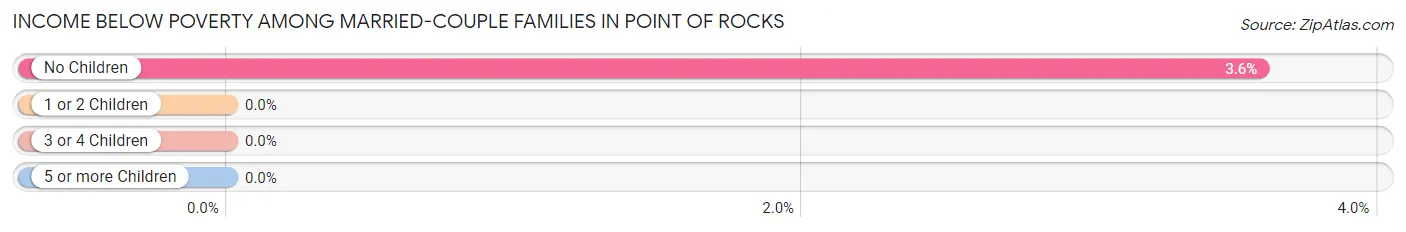
| Children | Above Poverty | Below Poverty |
| No Children | 242 (96.4%) | 9 (3.6%) |
| 1 or 2 Children | 309 (100.0%) | 0 (0.0%) |
| 3 or 4 Children | 30 (100.0%) | 0 (0.0%) |
| 5 or more Children | 5 (100.0%) | 0 (0.0%) |
| Total | 586 (98.5%) | 9 (1.5%) |
Income Below Poverty Among Single-Parent Households in Point Of Rocks
| Children | Single Father | Single Mother |
| No Children | 0 (0.0%) | 0 (0.0%) |
| 1 or 2 Children | 0 (0.0%) | 0 (0.0%) |
| 3 or 4 Children | 0 (0.0%) | 0 (0.0%) |
| 5 or more Children | 0 (0.0%) | 0 (0.0%) |
| Total | 0 (0.0%) | 0 (0.0%) |
Income Below Poverty Among Married-Couple vs Single-Parent Households in Point Of Rocks
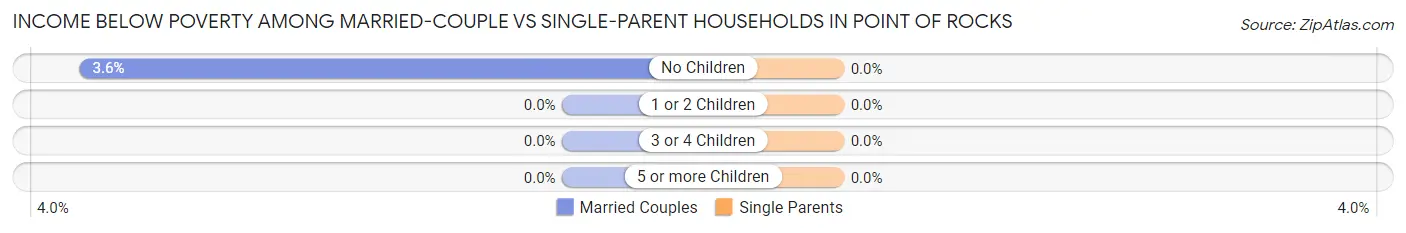
| Children | Married-Couple Families | Single-Parent Households |
| No Children | 9 (3.6%) | 0 (0.0%) |
| 1 or 2 Children | 0 (0.0%) | 0 (0.0%) |
| 3 or 4 Children | 0 (0.0%) | 0 (0.0%) |
| 5 or more Children | 0 (0.0%) | 0 (0.0%) |
| Total | 9 (1.5%) | 0 (0.0%) |
Race in Point Of Rocks
The most populous races in Point Of Rocks are White / Caucasian (1,659 | 70.3%), Hispanic or Latino (356 | 15.1%), and Black / African American (301 | 12.8%).
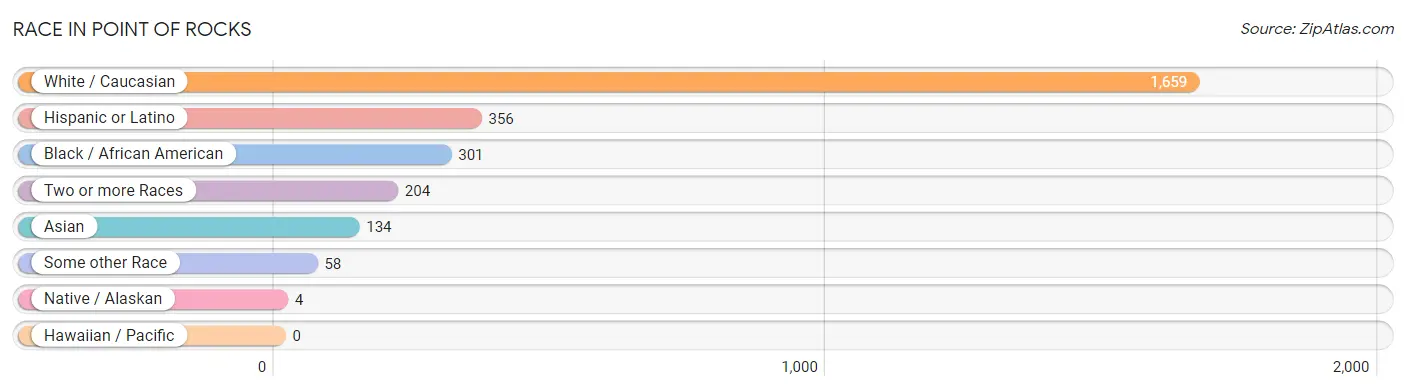
| Race | # Population | % Population |
| Asian | 134 | 5.7% |
| Black / African American | 301 | 12.8% |
| Hawaiian / Pacific | 0 | 0.0% |
| Hispanic or Latino | 356 | 15.1% |
| Native / Alaskan | 4 | 0.2% |
| White / Caucasian | 1,659 | 70.3% |
| Two or more Races | 204 | 8.6% |
| Some other Race | 58 | 2.5% |
| Total | 2,360 | 100.0% |
Ancestry in Point Of Rocks
The most populous ancestries reported in Point Of Rocks are German (403 | 17.1%), English (333 | 14.1%), Irish (289 | 12.2%), Puerto Rican (154 | 6.5%), and American (151 | 6.4%), together accounting for 56.4% of all Point Of Rocks residents.
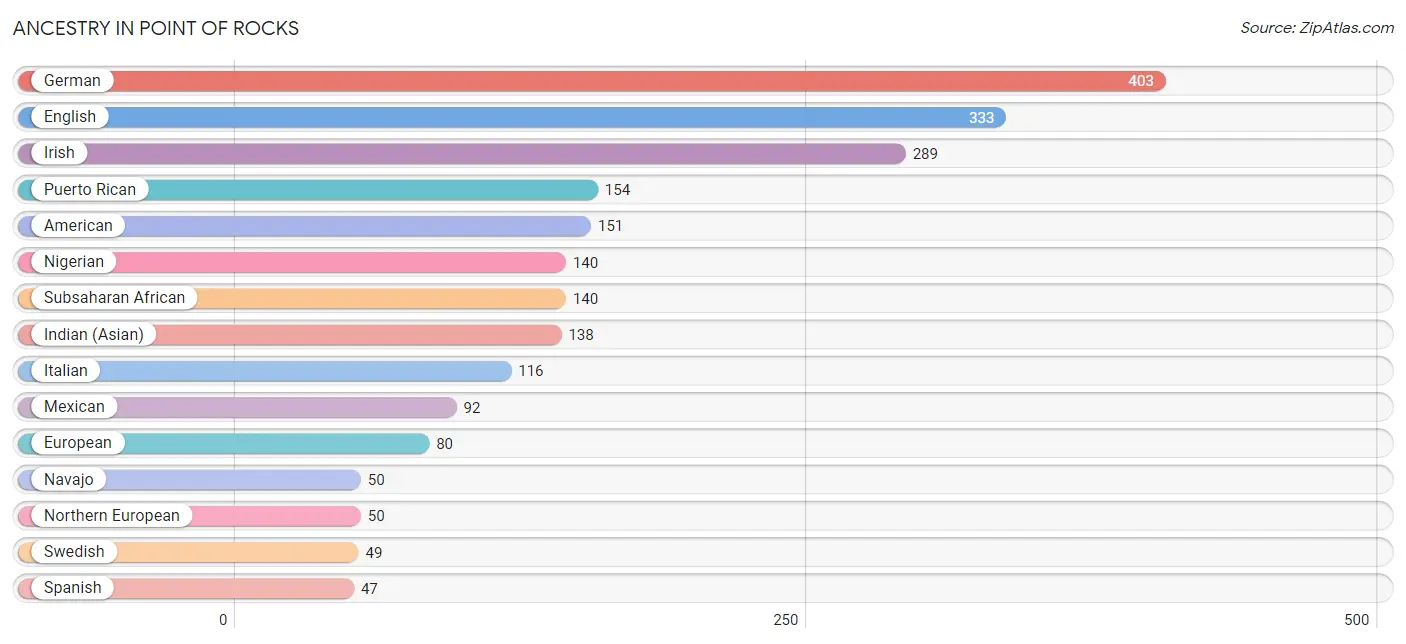
| Ancestry | # Population | % Population |
| American | 151 | 6.4% |
| Central American | 31 | 1.3% |
| Central American Indian | 4 | 0.2% |
| Colombian | 13 | 0.5% |
| Dutch | 28 | 1.2% |
| Eastern European | 20 | 0.9% |
| Ecuadorian | 19 | 0.8% |
| English | 333 | 14.1% |
| European | 80 | 3.4% |
| French Canadian | 14 | 0.6% |
| German | 403 | 17.1% |
| Hungarian | 7 | 0.3% |
| Indian (Asian) | 138 | 5.9% |
| Irish | 289 | 12.2% |
| Italian | 116 | 4.9% |
| Korean | 38 | 1.6% |
| Mexican | 92 | 3.9% |
| Native Hawaiian | 35 | 1.5% |
| Navajo | 50 | 2.1% |
| New Zealander | 12 | 0.5% |
| Nicaraguan | 29 | 1.2% |
| Nigerian | 140 | 5.9% |
| Northern European | 50 | 2.1% |
| Pennsylvania German | 19 | 0.8% |
| Puerto Rican | 154 | 6.5% |
| Romanian | 8 | 0.3% |
| Salvadoran | 2 | 0.1% |
| Scotch-Irish | 8 | 0.3% |
| Scottish | 29 | 1.2% |
| South American | 32 | 1.4% |
| Spanish | 47 | 2.0% |
| Subsaharan African | 140 | 5.9% |
| Swedish | 49 | 2.1% |
| Swiss | 13 | 0.5% |
| Ukrainian | 10 | 0.4% | View All 35 Rows |
Immigrants in Point Of Rocks
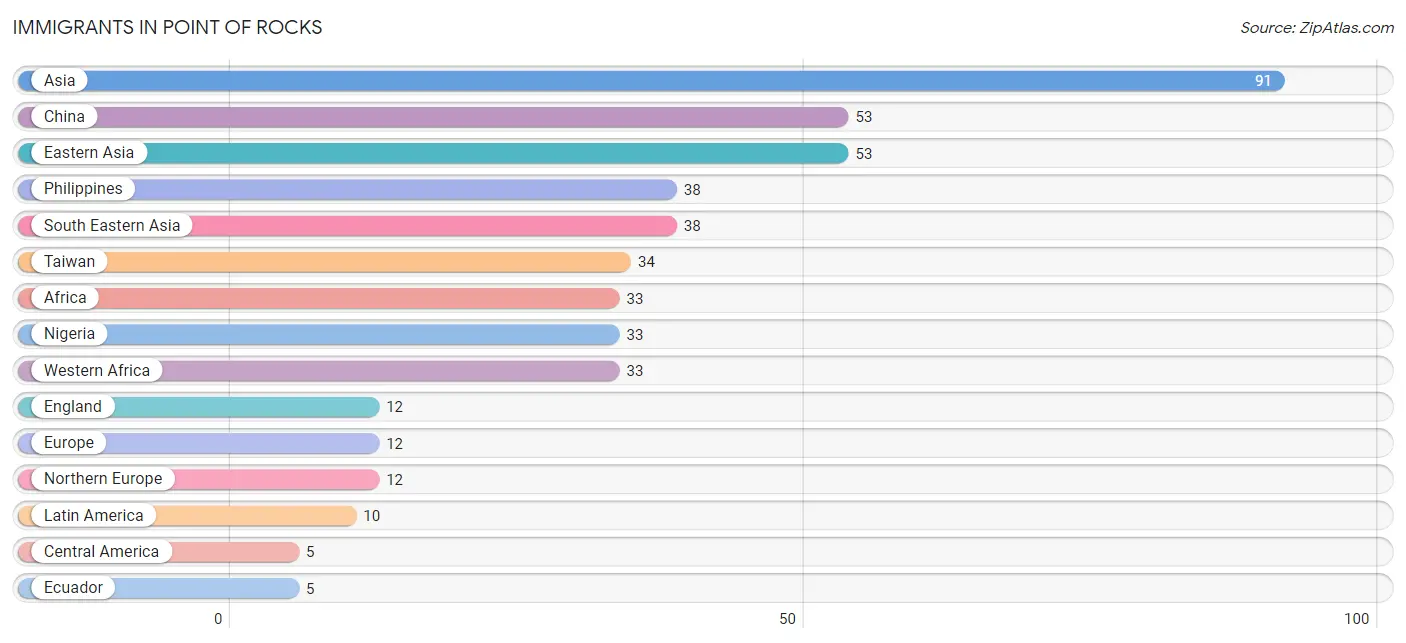
The most numerous immigrant groups reported in Point Of Rocks came from Asia (91 | 3.9%), China (53 | 2.2%), Eastern Asia (53 | 2.2%), Philippines (38 | 1.6%), and South Eastern Asia (38 | 1.6%), together accounting for 11.6% of all Point Of Rocks residents.
| Immigration Origin | # Population | % Population |
| Africa | 33 | 1.4% |
| Asia | 91 | 3.9% |
| Central America | 5 | 0.2% |
| China | 53 | 2.2% |
| Eastern Asia | 53 | 2.2% |
| Ecuador | 5 | 0.2% |
| England | 12 | 0.5% |
| Europe | 12 | 0.5% |
| Latin America | 10 | 0.4% |
| Nicaragua | 5 | 0.2% |
| Nigeria | 33 | 1.4% |
| Northern Europe | 12 | 0.5% |
| Philippines | 38 | 1.6% |
| South America | 5 | 0.2% |
| South Eastern Asia | 38 | 1.6% |
| Taiwan | 34 | 1.4% |
| Western Africa | 33 | 1.4% | View All 17 Rows |
Sex and Age in Point Of Rocks
Sex and Age in Point Of Rocks
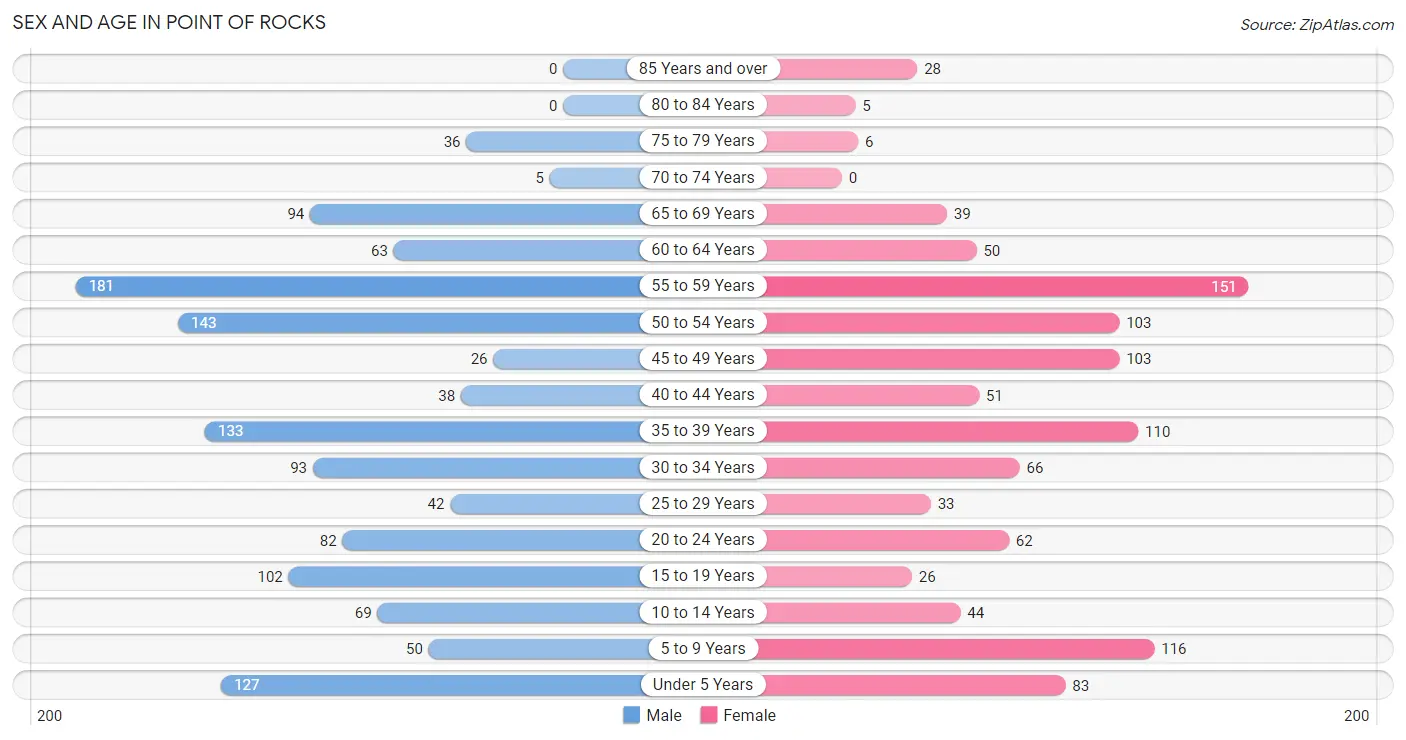
The most populous age groups in Point Of Rocks are 55 to 59 Years (181 | 14.1%) for men and 55 to 59 Years (151 | 14.0%) for women.
| Age Bracket | Male | Female |
| Under 5 Years | 127 (9.9%) | 83 (7.7%) |
| 5 to 9 Years | 50 (3.9%) | 116 (10.8%) |
| 10 to 14 Years | 69 (5.4%) | 44 (4.1%) |
| 15 to 19 Years | 102 (7.9%) | 26 (2.4%) |
| 20 to 24 Years | 82 (6.4%) | 62 (5.8%) |
| 25 to 29 Years | 42 (3.3%) | 33 (3.1%) |
| 30 to 34 Years | 93 (7.2%) | 66 (6.1%) |
| 35 to 39 Years | 133 (10.4%) | 110 (10.2%) |
| 40 to 44 Years | 38 (3.0%) | 51 (4.7%) |
| 45 to 49 Years | 26 (2.0%) | 103 (9.6%) |
| 50 to 54 Years | 143 (11.1%) | 103 (9.6%) |
| 55 to 59 Years | 181 (14.1%) | 151 (14.0%) |
| 60 to 64 Years | 63 (4.9%) | 50 (4.6%) |
| 65 to 69 Years | 94 (7.3%) | 39 (3.6%) |
| 70 to 74 Years | 5 (0.4%) | 0 (0.0%) |
| 75 to 79 Years | 36 (2.8%) | 6 (0.6%) |
| 80 to 84 Years | 0 (0.0%) | 5 (0.5%) |
| 85 Years and over | 0 (0.0%) | 28 (2.6%) |
| Total | 1,284 (100.0%) | 1,076 (100.0%) |
Families and Households in Point Of Rocks
Median Family Size in Point Of Rocks
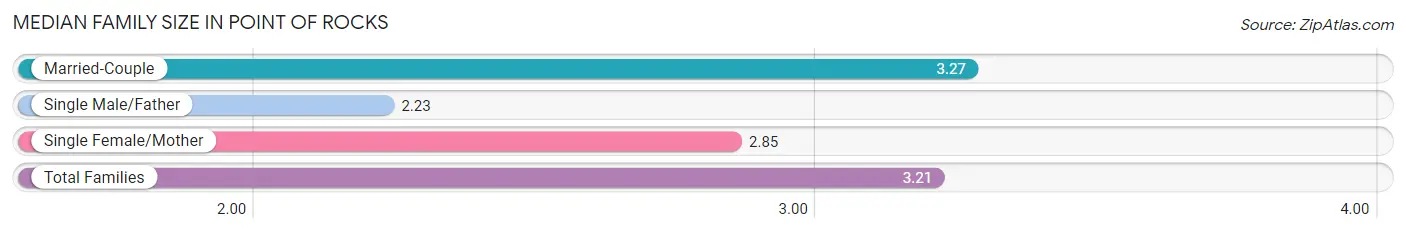
The median family size in Point Of Rocks is 3.21 persons per family, with married-couple families (595 | 86.7%) accounting for the largest median family size of 3.27 persons per family. On the other hand, single male/father families (13 | 1.9%) represent the smallest median family size with 2.23 persons per family.
| Family Type | # Families | Family Size |
| Married-Couple | 595 (86.7%) | 3.27 |
| Single Male/Father | 13 (1.9%) | 2.23 |
| Single Female/Mother | 78 (11.4%) | 2.85 |
| Total Families | 686 (100.0%) | 3.21 |
Median Household Size in Point Of Rocks
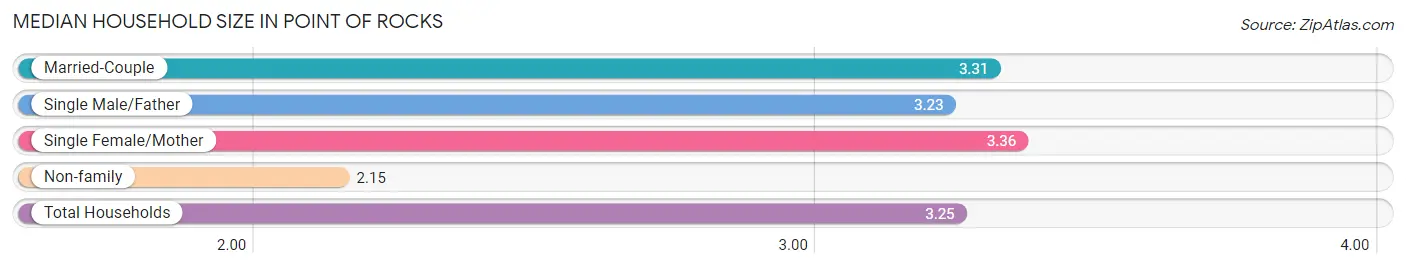
The median household size in Point Of Rocks is 3.25 persons per household, with single female/mother households (78 | 10.7%) accounting for the largest median household size of 3.36 persons per household. non-family households (40 | 5.5%) represent the smallest median household size with 2.15 persons per household.
| Household Type | # Households | Household Size |
| Married-Couple | 595 (82.0%) | 3.31 |
| Single Male/Father | 13 (1.8%) | 3.23 |
| Single Female/Mother | 78 (10.7%) | 3.36 |
| Non-family | 40 (5.5%) | 2.15 |
| Total Households | 726 (100.0%) | 3.25 |
Household Size by Marriage Status in Point Of Rocks
Out of a total of 726 households in Point Of Rocks, 686 (94.5%) are family households, while 40 (5.5%) are nonfamily households. The most numerous type of family households are 2-person households, comprising 232, and the most common type of nonfamily households are 3-person households, comprising 19.
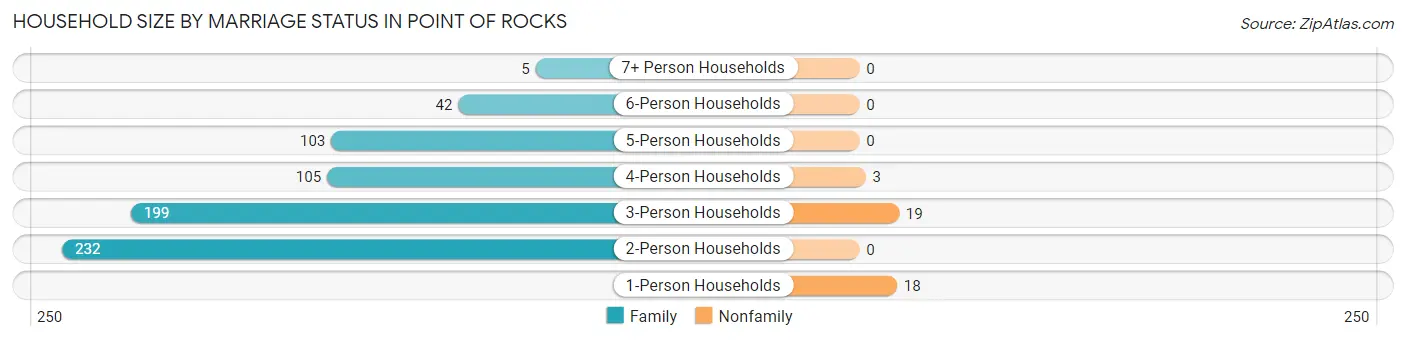
| Household Size | Family Households | Nonfamily Households |
| 1-Person Households | - | 18 (2.5%) |
| 2-Person Households | 232 (32.0%) | 0 (0.0%) |
| 3-Person Households | 199 (27.4%) | 19 (2.6%) |
| 4-Person Households | 105 (14.5%) | 3 (0.4%) |
| 5-Person Households | 103 (14.2%) | 0 (0.0%) |
| 6-Person Households | 42 (5.8%) | 0 (0.0%) |
| 7+ Person Households | 5 (0.7%) | 0 (0.0%) |
| Total | 686 (94.5%) | 40 (5.5%) |
Female Fertility in Point Of Rocks
Fertility by Age in Point Of Rocks
Average fertility rate in Point Of Rocks is 39.0 births per 1,000 women. Women in the age bracket of 20 to 34 years have the highest fertility rate with 50.0 births per 1,000 women. Women in the age bracket of 35 to 50 years acount for 57.9% of all women with births.
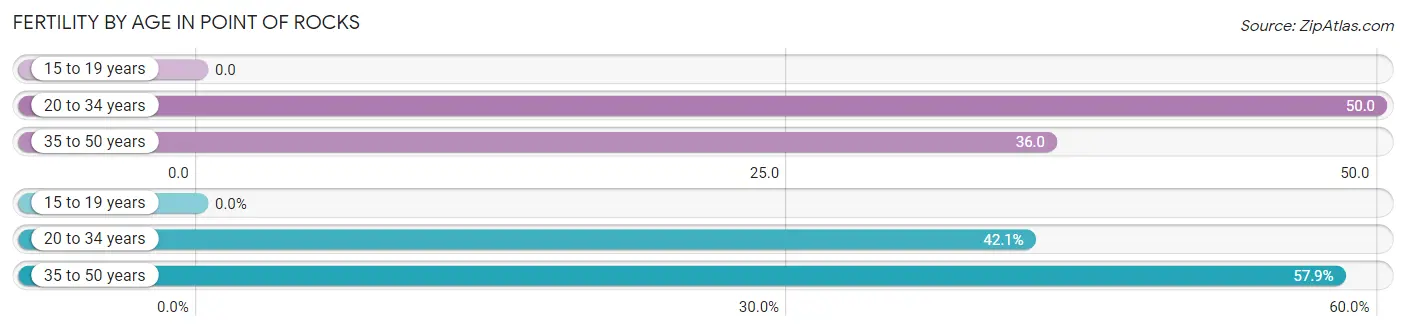
| Age Bracket | Women with Births | Births / 1,000 Women |
| 15 to 19 years | 0 (0.0%) | 0.0 |
| 20 to 34 years | 8 (42.1%) | 50.0 |
| 35 to 50 years | 11 (57.9%) | 36.0 |
| Total | 19 (100.0%) | 39.0 |
Fertility by Age by Marriage Status in Point Of Rocks
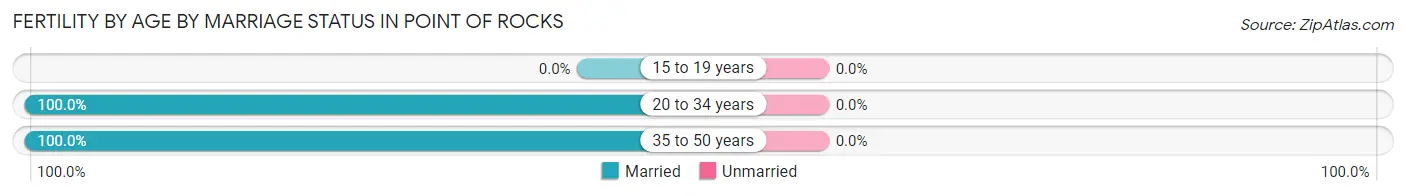
| Age Bracket | Married | Unmarried |
| 15 to 19 years | 0 (0.0%) | 0 (0.0%) |
| 20 to 34 years | 8 (100.0%) | 0 (0.0%) |
| 35 to 50 years | 11 (100.0%) | 0 (0.0%) |
| Total | 19 (100.0%) | 0 (0.0%) |
Fertility by Education in Point Of Rocks
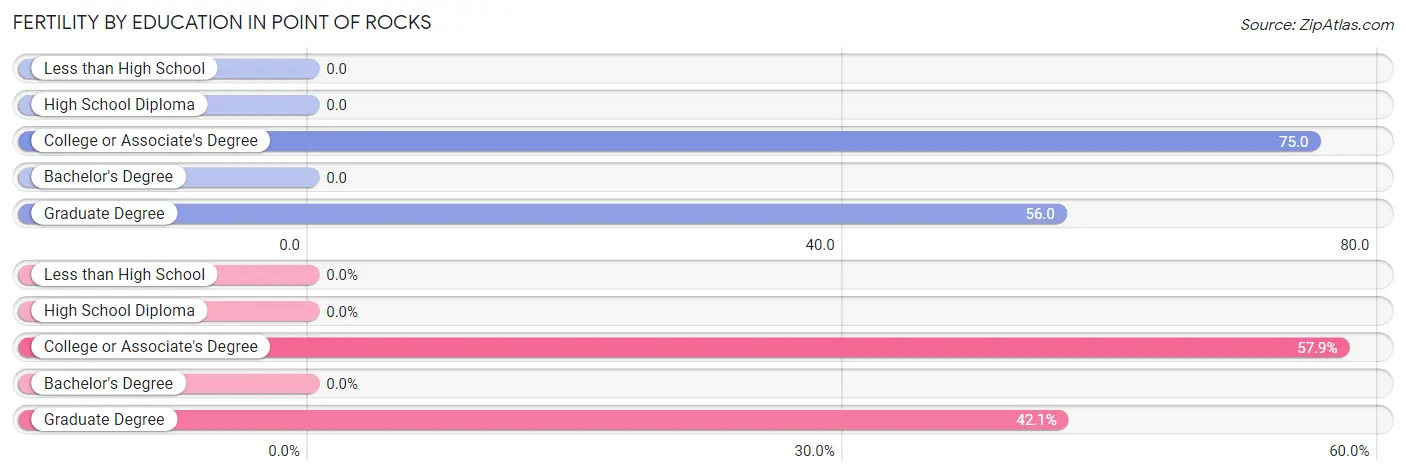
| Educational Attainment | Women with Births | Births / 1,000 Women |
| Less than High School | 0 (0.0%) | 0.0 |
| High School Diploma | 0 (0.0%) | 0.0 |
| College or Associate's Degree | 11 (57.9%) | 75.0 |
| Bachelor's Degree | 0 (0.0%) | 0.0 |
| Graduate Degree | 8 (42.1%) | 56.0 |
| Total | 19 (100.0%) | 39.0 |
Fertility by Education by Marriage Status in Point Of Rocks
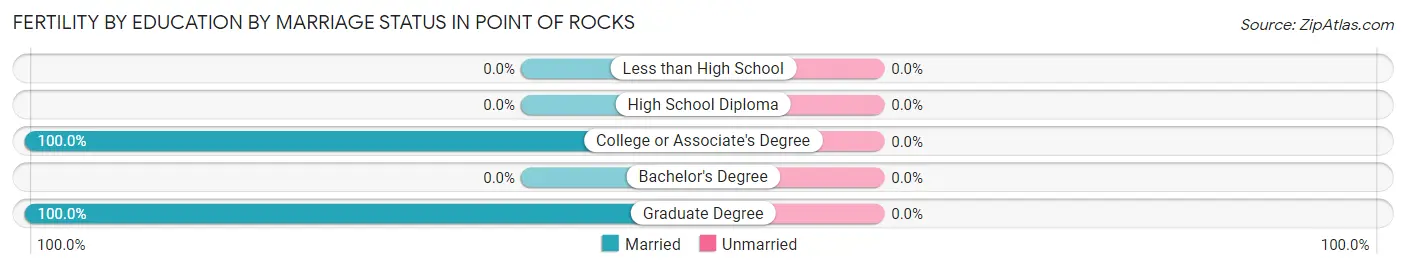
| Educational Attainment | Married | Unmarried |
| Less than High School | 0 (0.0%) | 0 (0.0%) |
| High School Diploma | 0 (0.0%) | 0 (0.0%) |
| College or Associate's Degree | 11 (100.0%) | 0 (0.0%) |
| Bachelor's Degree | 0 (0.0%) | 0 (0.0%) |
| Graduate Degree | 8 (100.0%) | 0 (0.0%) |
| Total | 19 (100.0%) | 0 (0.0%) |
Employment Characteristics in Point Of Rocks
Employment by Class of Employer in Point Of Rocks
Among the 1,132 employed individuals in Point Of Rocks, private company employees (831 | 73.4%), not-for-profit organizations (121 | 10.7%), and federal government employees (74 | 6.5%) make up the most common classes of employment.
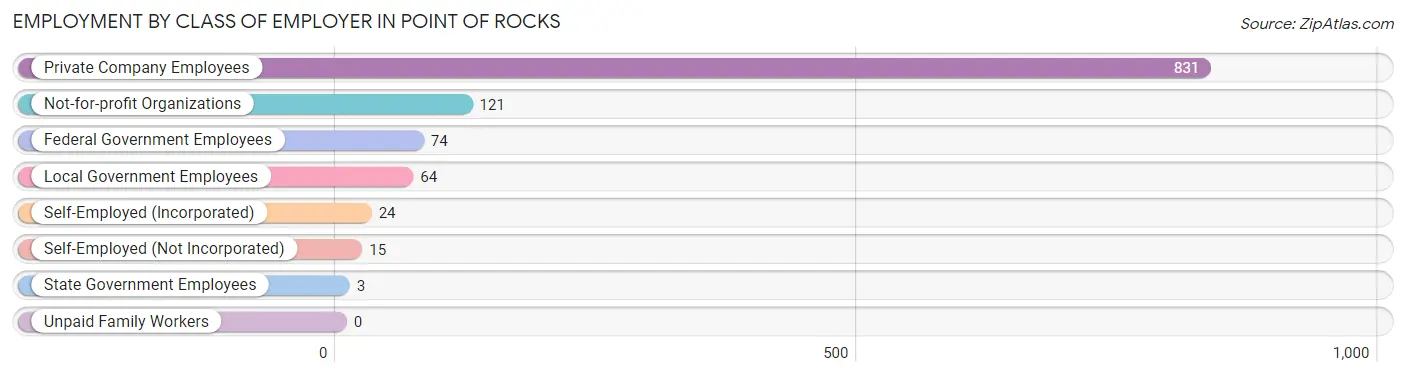
| Employer Class | # Employees | % Employees |
| Private Company Employees | 831 | 73.4% |
| Self-Employed (Incorporated) | 24 | 2.1% |
| Self-Employed (Not Incorporated) | 15 | 1.3% |
| Not-for-profit Organizations | 121 | 10.7% |
| Local Government Employees | 64 | 5.7% |
| State Government Employees | 3 | 0.3% |
| Federal Government Employees | 74 | 6.5% |
| Unpaid Family Workers | 0 | 0.0% |
| Total | 1,132 | 100.0% |
Employment Status by Age in Point Of Rocks
According to the labor force statistics for Point Of Rocks, out of the total population over 16 years of age (1,835), 66.6% or 1,222 individuals are in the labor force, with 3.6% or 44 of them unemployed. The age group with the highest labor force participation rate is 25 to 29 years, with 100.0% or 75 individuals in the labor force. Within the labor force, the 20 to 24 years age range has the highest percentage of unemployed individuals, with 19.0% or 19 of them being unemployed.
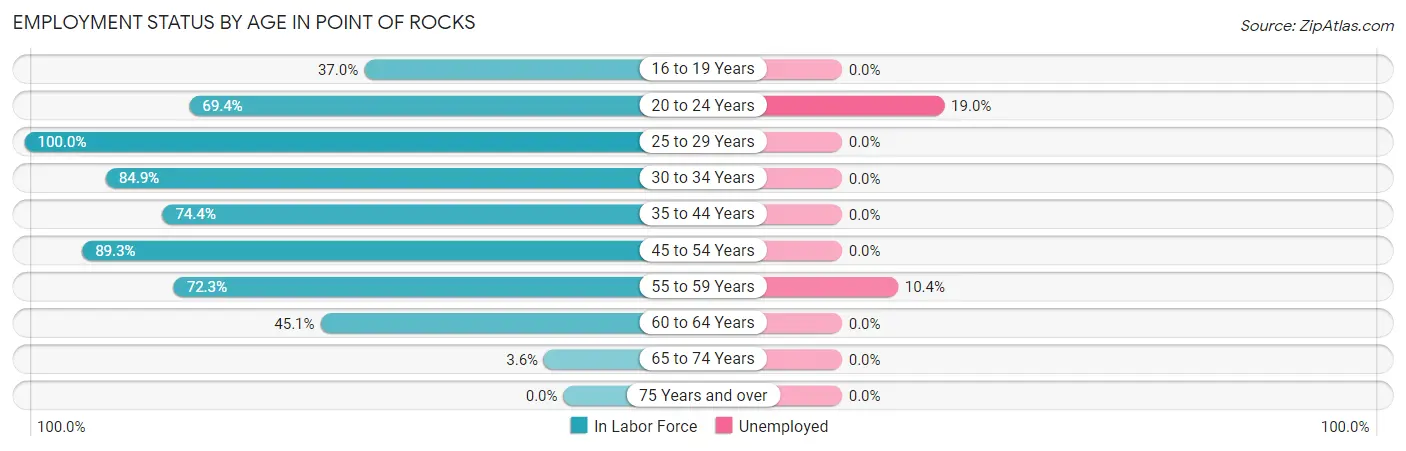
| Age Bracket | In Labor Force | Unemployed |
| 16 to 19 Years | 34 (37.0%) | 0 (0.0%) |
| 20 to 24 Years | 100 (69.4%) | 19 (19.0%) |
| 25 to 29 Years | 75 (100.0%) | 0 (0.0%) |
| 30 to 34 Years | 135 (84.9%) | 0 (0.0%) |
| 35 to 44 Years | 247 (74.4%) | 0 (0.0%) |
| 45 to 54 Years | 335 (89.3%) | 0 (0.0%) |
| 55 to 59 Years | 240 (72.3%) | 25 (10.4%) |
| 60 to 64 Years | 51 (45.1%) | 0 (0.0%) |
| 65 to 74 Years | 5 (3.6%) | 0 (0.0%) |
| 75 Years and over | 0 (0.0%) | 0 (0.0%) |
| Total | 1,222 (66.6%) | 44 (3.6%) |
Employment Status by Educational Attainment in Point Of Rocks
According to labor force statistics for Point Of Rocks, 78.1% of individuals (1,082) out of the total population between 25 and 64 years of age (1,386) are in the labor force, with 2.3% or 25 of them being unemployed. The group with the highest labor force participation rate are those with the educational attainment of college / associate degree, with 92.1% or 337 individuals in the labor force. Within the labor force, individuals with high school diploma education have the highest percentage of unemployment, with 10.4% or 25 of them being unemployed.
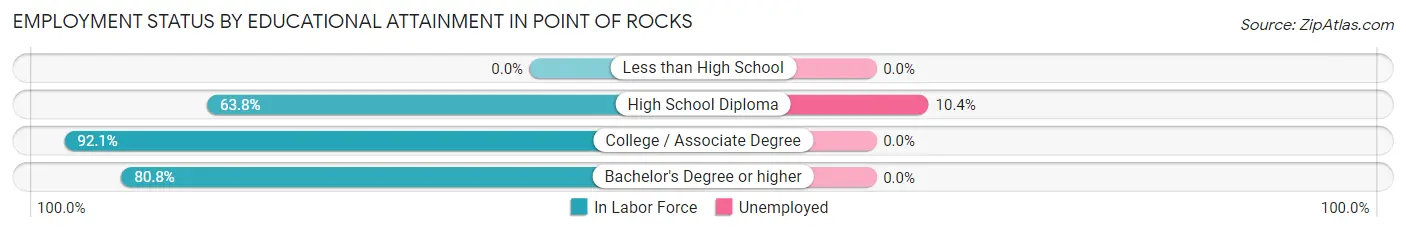
| Educational Attainment | In Labor Force | Unemployed |
| Less than High School | 0 (0.0%) | 0 (0.0%) |
| High School Diploma | 240 (63.8%) | 39 (10.4%) |
| College / Associate Degree | 337 (92.1%) | 0 (0.0%) |
| Bachelor's Degree or higher | 506 (80.8%) | 0 (0.0%) |
| Total | 1,082 (78.1%) | 32 (2.3%) |
Employment Occupations by Sex in Point Of Rocks
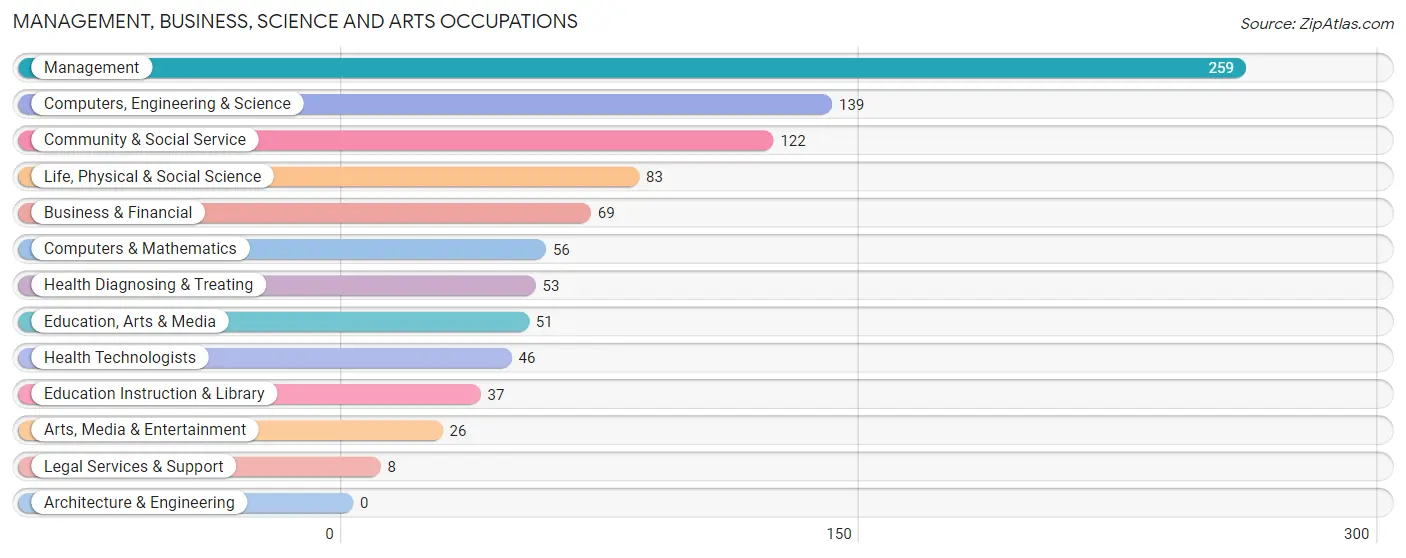
Management, Business, Science and Arts Occupations
The most common Management, Business, Science and Arts occupations in Point Of Rocks are Management (259 | 22.0%), Computers, Engineering & Science (139 | 11.8%), Community & Social Service (122 | 10.4%), Life, Physical & Social Science (83 | 7.0%), and Business & Financial (69 | 5.9%).
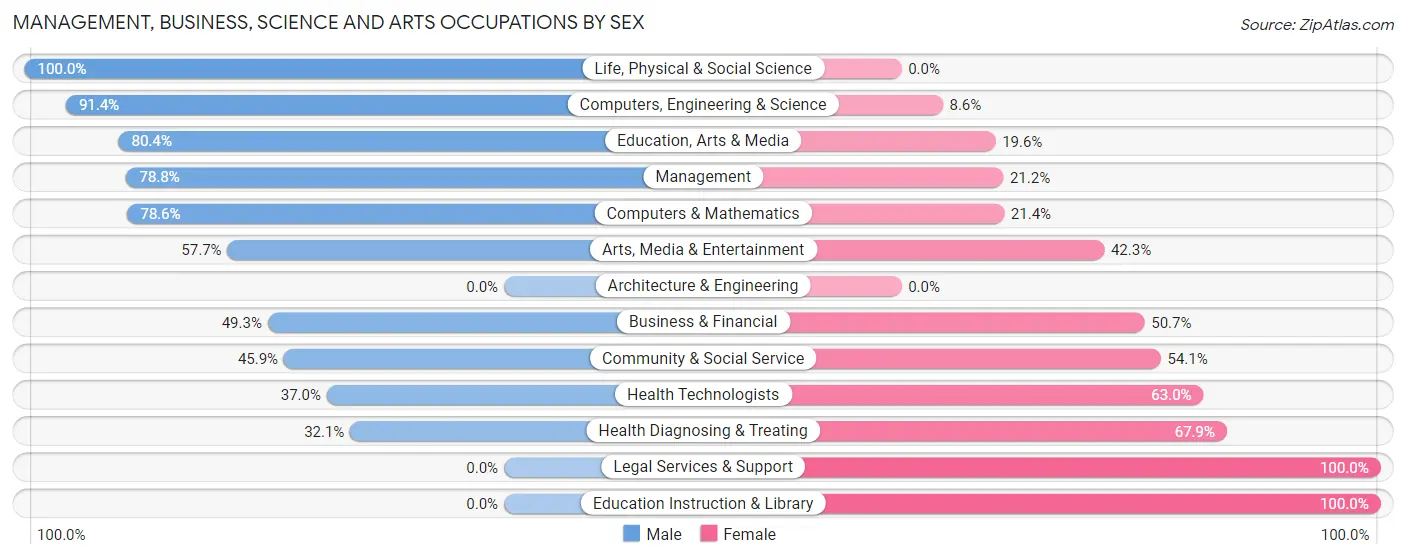
Management, Business, Science and Arts Occupations by Sex
Within the Management, Business, Science and Arts occupations in Point Of Rocks, the most male-oriented occupations are Life, Physical & Social Science (100.0%), Computers, Engineering & Science (91.4%), and Education, Arts & Media (80.4%), while the most female-oriented occupations are Legal Services & Support (100.0%), Education Instruction & Library (100.0%), and Health Diagnosing & Treating (67.9%).
| Occupation | Male | Female |
| Management | 204 (78.8%) | 55 (21.2%) |
| Business & Financial | 34 (49.3%) | 35 (50.7%) |
| Computers, Engineering & Science | 127 (91.4%) | 12 (8.6%) |
| Computers & Mathematics | 44 (78.6%) | 12 (21.4%) |
| Architecture & Engineering | 0 (0.0%) | 0 (0.0%) |
| Life, Physical & Social Science | 83 (100.0%) | 0 (0.0%) |
| Community & Social Service | 56 (45.9%) | 66 (54.1%) |
| Education, Arts & Media | 41 (80.4%) | 10 (19.6%) |
| Legal Services & Support | 0 (0.0%) | 8 (100.0%) |
| Education Instruction & Library | 0 (0.0%) | 37 (100.0%) |
| Arts, Media & Entertainment | 15 (57.7%) | 11 (42.3%) |
| Health Diagnosing & Treating | 17 (32.1%) | 36 (67.9%) |
| Health Technologists | 17 (37.0%) | 29 (63.0%) |
| Total (Category) | 438 (68.2%) | 204 (31.8%) |
| Total (Overall) | 769 (65.3%) | 409 (34.7%) |
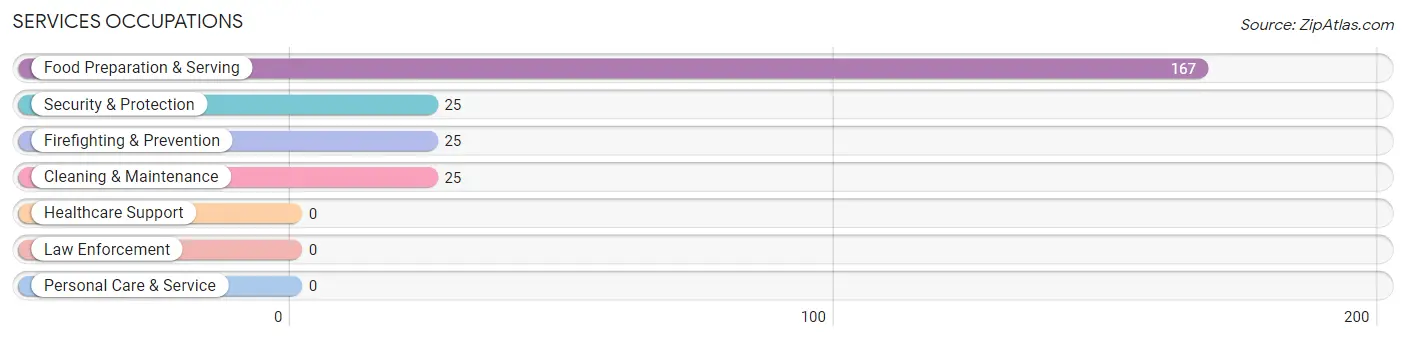
Services Occupations
The most common Services occupations in Point Of Rocks are Food Preparation & Serving (167 | 14.2%), Security & Protection (25 | 2.1%), Firefighting & Prevention (25 | 2.1%), and Cleaning & Maintenance (25 | 2.1%).
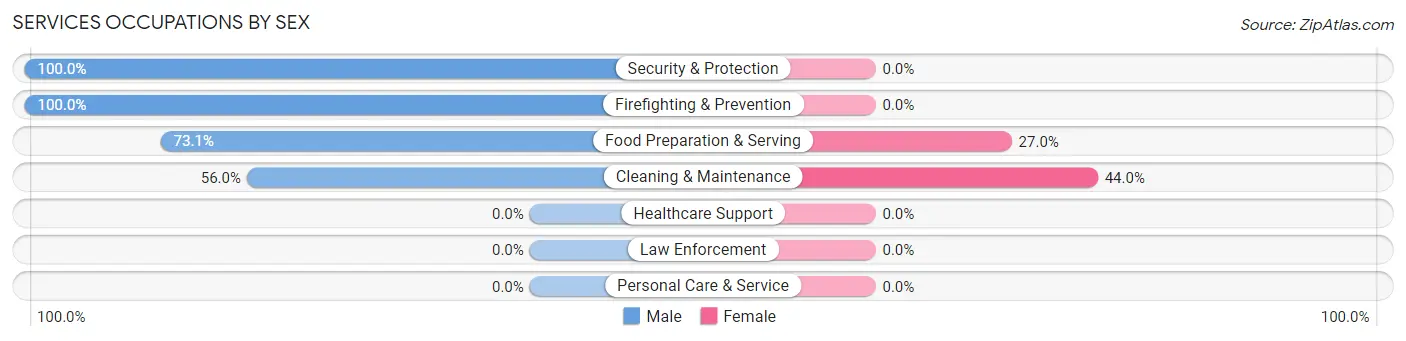
Services Occupations by Sex
Within the Services occupations in Point Of Rocks, the most male-oriented occupations are Security & Protection (100.0%), Firefighting & Prevention (100.0%), and Food Preparation & Serving (73.1%), while the most female-oriented occupations are Cleaning & Maintenance (44.0%), and Food Preparation & Serving (27.0%).
| Occupation | Male | Female |
| Healthcare Support | 0 (0.0%) | 0 (0.0%) |
| Security & Protection | 25 (100.0%) | 0 (0.0%) |
| Firefighting & Prevention | 25 (100.0%) | 0 (0.0%) |
| Law Enforcement | 0 (0.0%) | 0 (0.0%) |
| Food Preparation & Serving | 122 (73.1%) | 45 (27.0%) |
| Cleaning & Maintenance | 14 (56.0%) | 11 (44.0%) |
| Personal Care & Service | 0 (0.0%) | 0 (0.0%) |
| Total (Category) | 161 (74.2%) | 56 (25.8%) |
| Total (Overall) | 769 (65.3%) | 409 (34.7%) |
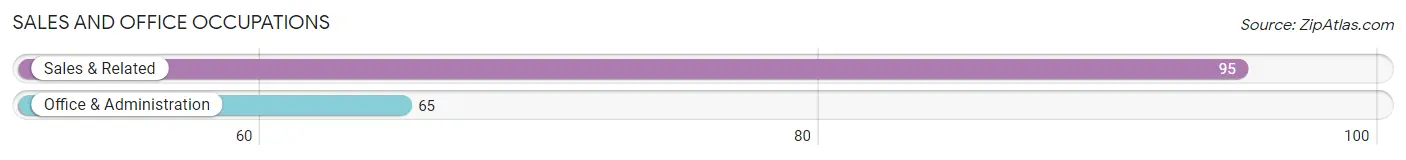
Sales and Office Occupations
The most common Sales and Office occupations in Point Of Rocks are Sales & Related (95 | 8.1%), and Office & Administration (65 | 5.5%).
Sales and Office Occupations by Sex
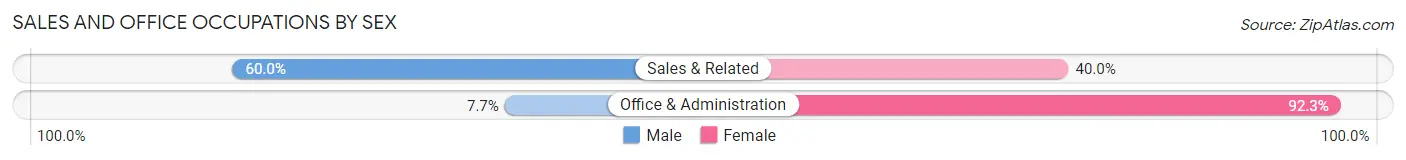
| Occupation | Male | Female |
| Sales & Related | 57 (60.0%) | 38 (40.0%) |
| Office & Administration | 5 (7.7%) | 60 (92.3%) |
| Total (Category) | 62 (38.8%) | 98 (61.3%) |
| Total (Overall) | 769 (65.3%) | 409 (34.7%) |
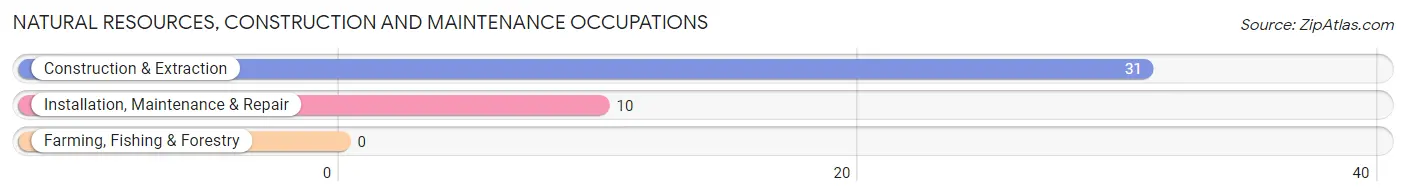
Natural Resources, Construction and Maintenance Occupations
The most common Natural Resources, Construction and Maintenance occupations in Point Of Rocks are Construction & Extraction (31 | 2.6%), and Installation, Maintenance & Repair (10 | 0.9%).
Natural Resources, Construction and Maintenance Occupations by Sex
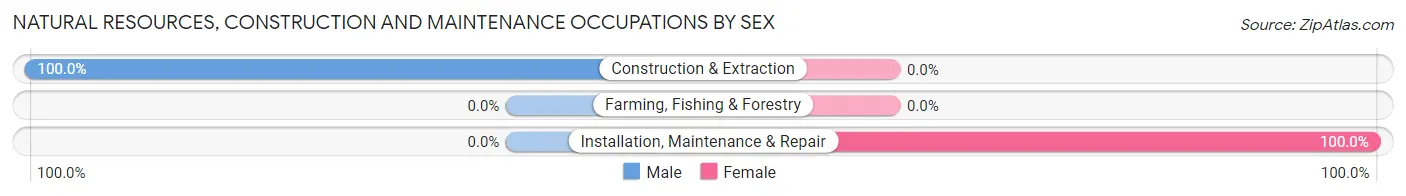
| Occupation | Male | Female |
| Farming, Fishing & Forestry | 0 (0.0%) | 0 (0.0%) |
| Construction & Extraction | 31 (100.0%) | 0 (0.0%) |
| Installation, Maintenance & Repair | 0 (0.0%) | 10 (100.0%) |
| Total (Category) | 31 (75.6%) | 10 (24.4%) |
| Total (Overall) | 769 (65.3%) | 409 (34.7%) |
Production, Transportation and Moving Occupations
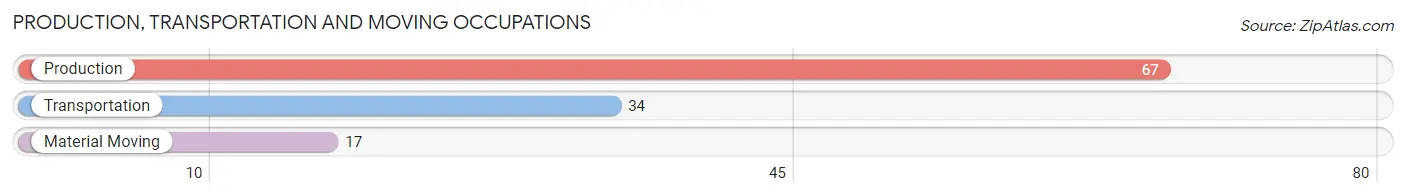
The most common Production, Transportation and Moving occupations in Point Of Rocks are Production (67 | 5.7%), Transportation (34 | 2.9%), and Material Moving (17 | 1.4%).
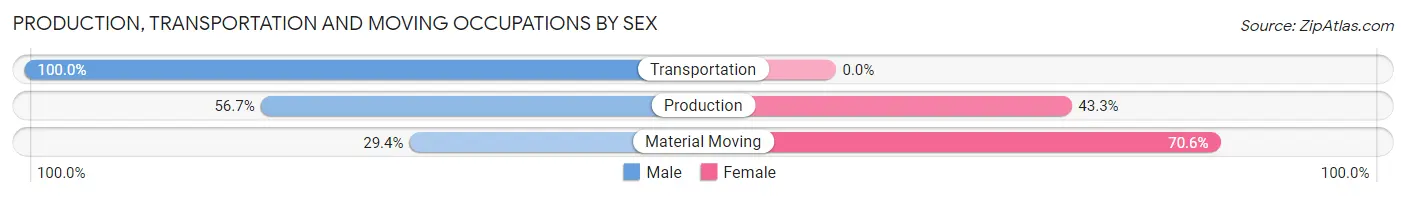
Production, Transportation and Moving Occupations by Sex
| Occupation | Male | Female |
| Production | 38 (56.7%) | 29 (43.3%) |
| Transportation | 34 (100.0%) | 0 (0.0%) |
| Material Moving | 5 (29.4%) | 12 (70.6%) |
| Total (Category) | 77 (65.2%) | 41 (34.7%) |
| Total (Overall) | 769 (65.3%) | 409 (34.7%) |
Employment Industries by Sex in Point Of Rocks
Employment Industries in Point Of Rocks
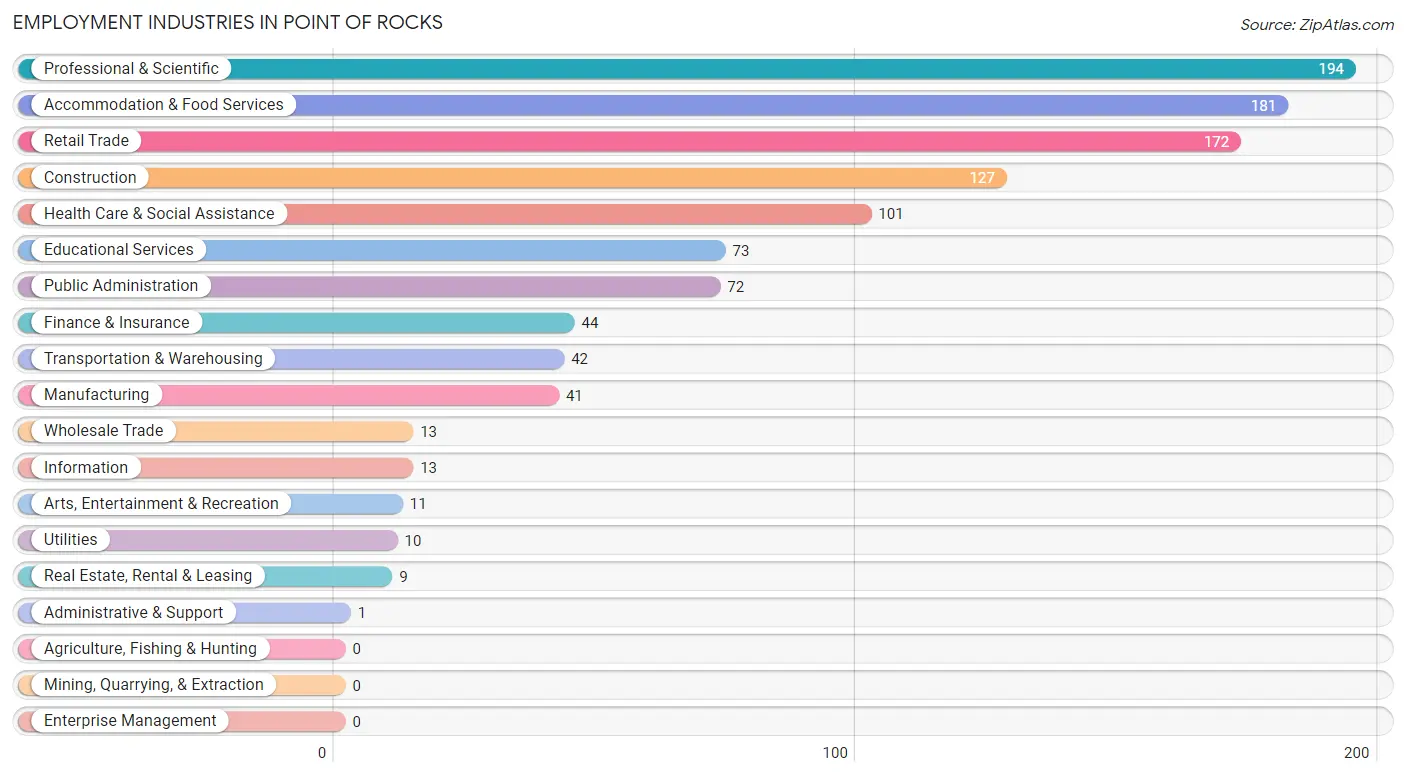
The major employment industries in Point Of Rocks include Professional & Scientific (194 | 16.5%), Accommodation & Food Services (181 | 15.4%), Retail Trade (172 | 14.6%), Construction (127 | 10.8%), and Health Care & Social Assistance (101 | 8.6%).
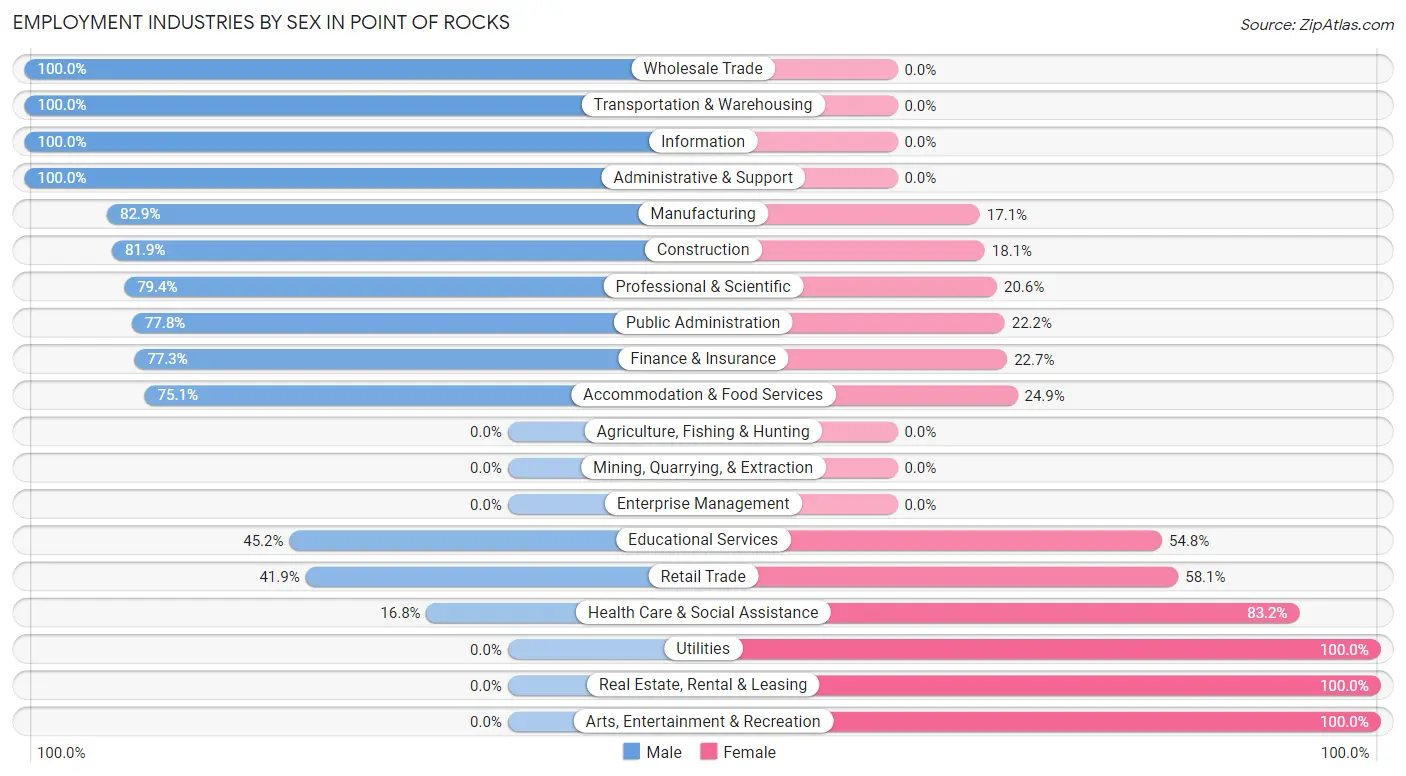
Employment Industries by Sex in Point Of Rocks
The Point Of Rocks industries that see more men than women are Wholesale Trade (100.0%), Transportation & Warehousing (100.0%), and Information (100.0%), whereas the industries that tend to have a higher number of women are Utilities (100.0%), Real Estate, Rental & Leasing (100.0%), and Arts, Entertainment & Recreation (100.0%).
| Industry | Male | Female |
| Agriculture, Fishing & Hunting | 0 (0.0%) | 0 (0.0%) |
| Mining, Quarrying, & Extraction | 0 (0.0%) | 0 (0.0%) |
| Construction | 104 (81.9%) | 23 (18.1%) |
| Manufacturing | 34 (82.9%) | 7 (17.1%) |
| Wholesale Trade | 13 (100.0%) | 0 (0.0%) |
| Retail Trade | 72 (41.9%) | 100 (58.1%) |
| Transportation & Warehousing | 42 (100.0%) | 0 (0.0%) |
| Utilities | 0 (0.0%) | 10 (100.0%) |
| Information | 13 (100.0%) | 0 (0.0%) |
| Finance & Insurance | 34 (77.3%) | 10 (22.7%) |
| Real Estate, Rental & Leasing | 0 (0.0%) | 9 (100.0%) |
| Professional & Scientific | 154 (79.4%) | 40 (20.6%) |
| Enterprise Management | 0 (0.0%) | 0 (0.0%) |
| Administrative & Support | 1 (100.0%) | 0 (0.0%) |
| Educational Services | 33 (45.2%) | 40 (54.8%) |
| Health Care & Social Assistance | 17 (16.8%) | 84 (83.2%) |
| Arts, Entertainment & Recreation | 0 (0.0%) | 11 (100.0%) |
| Accommodation & Food Services | 136 (75.1%) | 45 (24.9%) |
| Public Administration | 56 (77.8%) | 16 (22.2%) |
| Total | 769 (65.3%) | 409 (34.7%) |
Education in Point Of Rocks
School Enrollment in Point Of Rocks
The most common levels of schooling among the 573 students in Point Of Rocks are college / undergraduate (175 | 30.5%), elementary school (118 | 20.6%), and high school (109 | 19.0%).
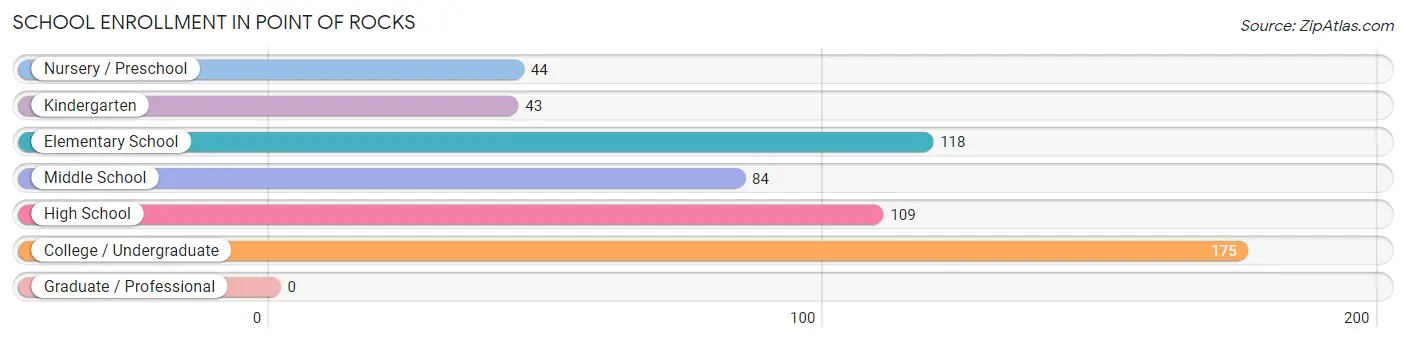
| School Level | # Students | % Students |
| Nursery / Preschool | 44 | 7.7% |
| Kindergarten | 43 | 7.5% |
| Elementary School | 118 | 20.6% |
| Middle School | 84 | 14.7% |
| High School | 109 | 19.0% |
| College / Undergraduate | 175 | 30.5% |
| Graduate / Professional | 0 | 0.0% |
| Total | 573 | 100.0% |
School Enrollment by Age by Funding Source in Point Of Rocks
Out of a total of 573 students who are enrolled in schools in Point Of Rocks, 95 (16.6%) attend a private institution, while the remaining 478 (83.4%) are enrolled in public schools. The age group of 3 to 4 year olds has the highest likelihood of being enrolled in private schools, with 18 (72.0% in the age bracket) enrolled. Conversely, the age group of 15 to 17 year olds has the lowest likelihood of being enrolled in a private school, with 83 (100.0% in the age bracket) attending a public institution.
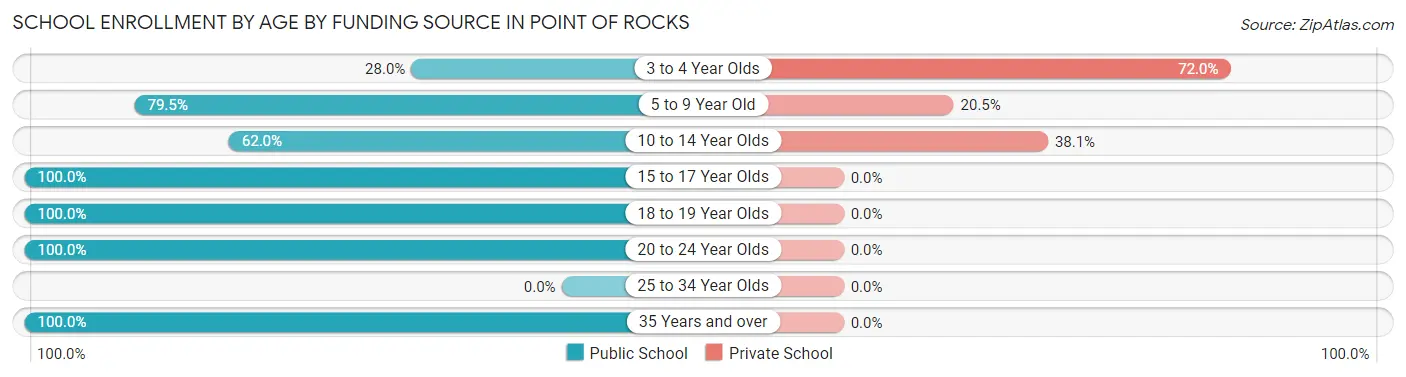
| Age Bracket | Public School | Private School |
| 3 to 4 Year Olds | 7 (28.0%) | 18 (72.0%) |
| 5 to 9 Year Old | 132 (79.5%) | 34 (20.5%) |
| 10 to 14 Year Olds | 70 (62.0%) | 43 (38.1%) |
| 15 to 17 Year Olds | 83 (100.0%) | 0 (0.0%) |
| 18 to 19 Year Olds | 45 (100.0%) | 0 (0.0%) |
| 20 to 24 Year Olds | 127 (100.0%) | 0 (0.0%) |
| 25 to 34 Year Olds | 0 (0.0%) | 0 (0.0%) |
| 35 Years and over | 14 (100.0%) | 0 (0.0%) |
| Total | 478 (83.4%) | 95 (16.6%) |
Educational Attainment by Field of Study in Point Of Rocks
Business (132 | 18.1%), bio, nature & agricultural (99 | 13.6%), computers & mathematics (92 | 12.6%), social sciences (86 | 11.8%), and liberal arts & history (49 | 6.7%) are the most common fields of study among 728 individuals in Point Of Rocks who have obtained a bachelor's degree or higher.
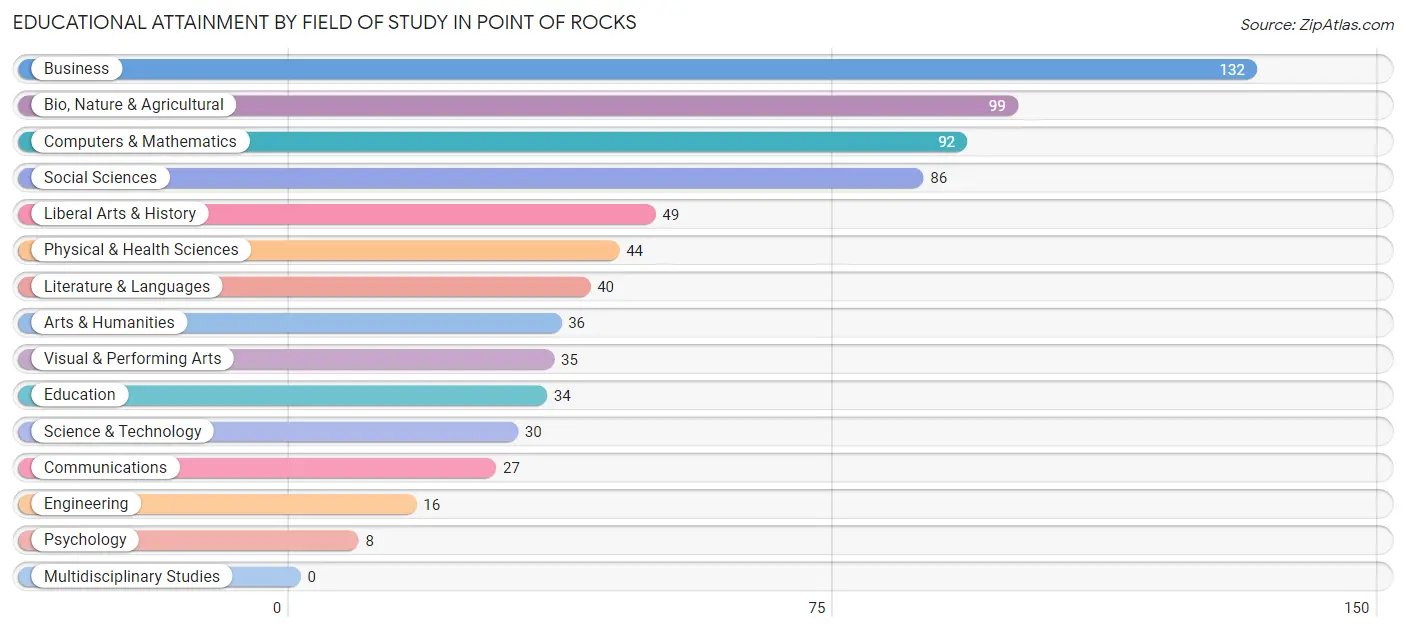
| Field of Study | # Graduates | % Graduates |
| Computers & Mathematics | 92 | 12.6% |
| Bio, Nature & Agricultural | 99 | 13.6% |
| Physical & Health Sciences | 44 | 6.0% |
| Psychology | 8 | 1.1% |
| Social Sciences | 86 | 11.8% |
| Engineering | 16 | 2.2% |
| Multidisciplinary Studies | 0 | 0.0% |
| Science & Technology | 30 | 4.1% |
| Business | 132 | 18.1% |
| Education | 34 | 4.7% |
| Literature & Languages | 40 | 5.5% |
| Liberal Arts & History | 49 | 6.7% |
| Visual & Performing Arts | 35 | 4.8% |
| Communications | 27 | 3.7% |
| Arts & Humanities | 36 | 5.0% |
| Total | 728 | 100.0% |
Transportation & Commute in Point Of Rocks
Vehicle Availability by Sex in Point Of Rocks
The most prevalent vehicle ownership categories in Point Of Rocks are males with 2 vehicles (391, accounting for 53.5%) and females with 2 vehicles (223, making up 97.5%).
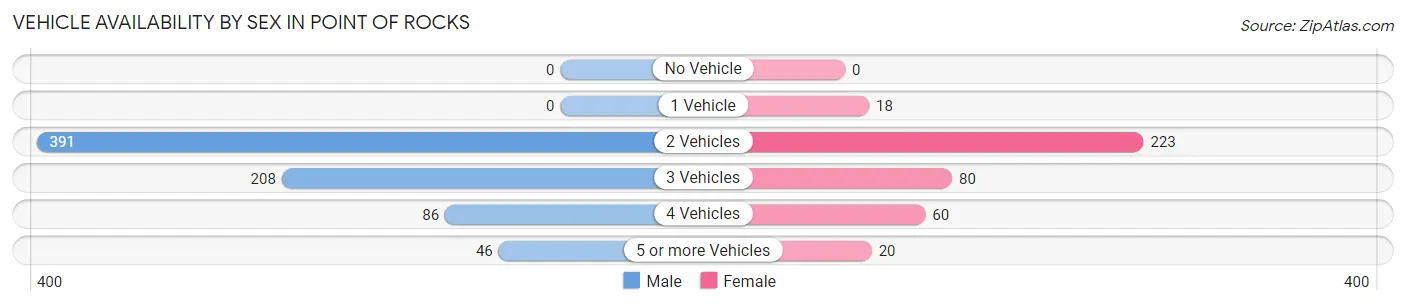
| Vehicles Available | Male | Female |
| No Vehicle | 0 (0.0%) | 0 (0.0%) |
| 1 Vehicle | 0 (0.0%) | 18 (4.5%) |
| 2 Vehicles | 391 (53.5%) | 223 (55.6%) |
| 3 Vehicles | 208 (28.4%) | 80 (20.0%) |
| 4 Vehicles | 86 (11.8%) | 60 (15.0%) |
| 5 or more Vehicles | 46 (6.3%) | 20 (5.0%) |
| Total | 731 (100.0%) | 401 (100.0%) |
Commute Time in Point Of Rocks
The most frequently occuring commute durations in Point Of Rocks are 45 to 59 minutes (235 commuters, 26.3%), 60 to 89 minutes (189 commuters, 21.1%), and 15 to 19 minutes (147 commuters, 16.4%).
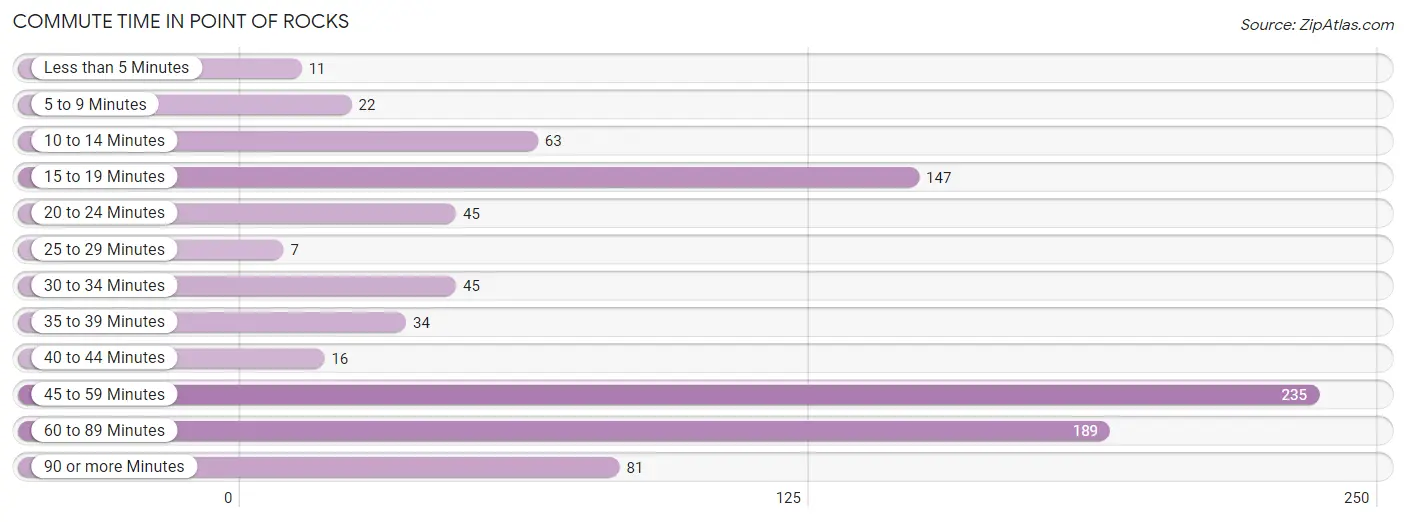
| Commute Time | # Commuters | % Commuters |
| Less than 5 Minutes | 11 | 1.2% |
| 5 to 9 Minutes | 22 | 2.5% |
| 10 to 14 Minutes | 63 | 7.0% |
| 15 to 19 Minutes | 147 | 16.4% |
| 20 to 24 Minutes | 45 | 5.0% |
| 25 to 29 Minutes | 7 | 0.8% |
| 30 to 34 Minutes | 45 | 5.0% |
| 35 to 39 Minutes | 34 | 3.8% |
| 40 to 44 Minutes | 16 | 1.8% |
| 45 to 59 Minutes | 235 | 26.3% |
| 60 to 89 Minutes | 189 | 21.1% |
| 90 or more Minutes | 81 | 9.0% |
Commute Time by Sex in Point Of Rocks
The most common commute times in Point Of Rocks are 45 to 59 minutes (174 commuters, 30.4%) for males and 60 to 89 minutes (90 commuters, 27.9%) for females.
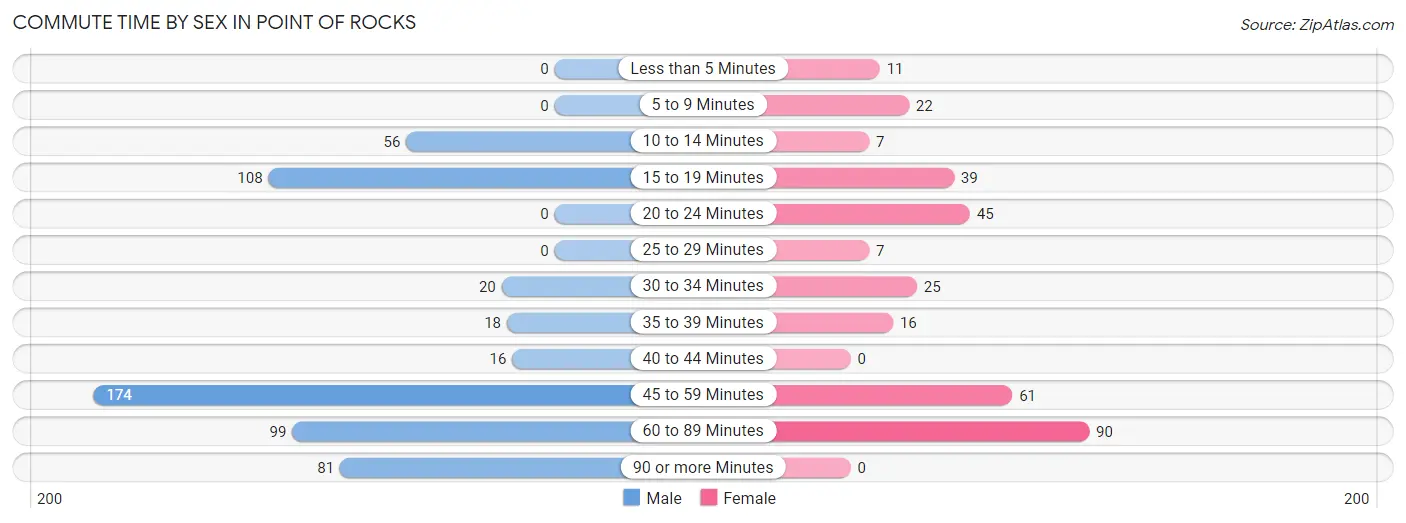
| Commute Time | Male | Female |
| Less than 5 Minutes | 0 (0.0%) | 11 (3.4%) |
| 5 to 9 Minutes | 0 (0.0%) | 22 (6.8%) |
| 10 to 14 Minutes | 56 (9.8%) | 7 (2.2%) |
| 15 to 19 Minutes | 108 (18.9%) | 39 (12.1%) |
| 20 to 24 Minutes | 0 (0.0%) | 45 (13.9%) |
| 25 to 29 Minutes | 0 (0.0%) | 7 (2.2%) |
| 30 to 34 Minutes | 20 (3.5%) | 25 (7.7%) |
| 35 to 39 Minutes | 18 (3.2%) | 16 (5.0%) |
| 40 to 44 Minutes | 16 (2.8%) | 0 (0.0%) |
| 45 to 59 Minutes | 174 (30.4%) | 61 (18.9%) |
| 60 to 89 Minutes | 99 (17.3%) | 90 (27.9%) |
| 90 or more Minutes | 81 (14.2%) | 0 (0.0%) |
Time of Departure to Work by Sex in Point Of Rocks
The most frequent times of departure to work in Point Of Rocks are 11:00 AM to 11:59 AM (81, 14.2%) for males and 7:00 AM to 7:29 AM (93, 28.8%) for females.
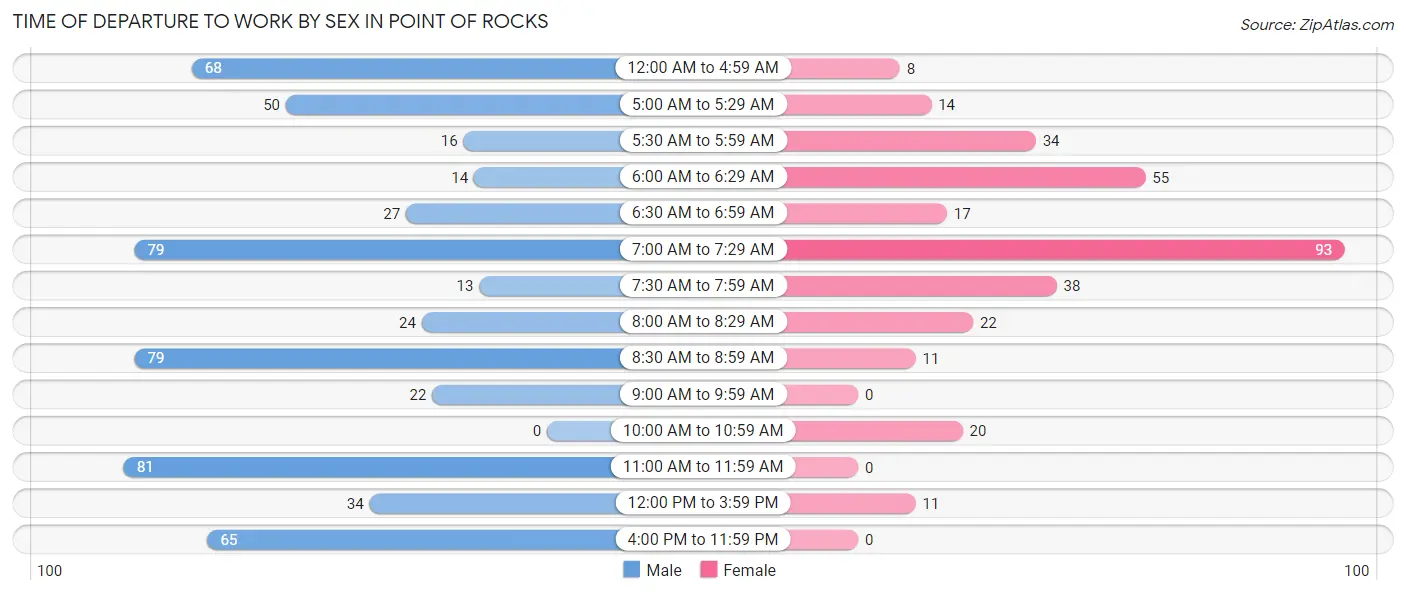
| Time of Departure | Male | Female |
| 12:00 AM to 4:59 AM | 68 (11.9%) | 8 (2.5%) |
| 5:00 AM to 5:29 AM | 50 (8.7%) | 14 (4.3%) |
| 5:30 AM to 5:59 AM | 16 (2.8%) | 34 (10.5%) |
| 6:00 AM to 6:29 AM | 14 (2.5%) | 55 (17.0%) |
| 6:30 AM to 6:59 AM | 27 (4.7%) | 17 (5.3%) |
| 7:00 AM to 7:29 AM | 79 (13.8%) | 93 (28.8%) |
| 7:30 AM to 7:59 AM | 13 (2.3%) | 38 (11.8%) |
| 8:00 AM to 8:29 AM | 24 (4.2%) | 22 (6.8%) |
| 8:30 AM to 8:59 AM | 79 (13.8%) | 11 (3.4%) |
| 9:00 AM to 9:59 AM | 22 (3.8%) | 0 (0.0%) |
| 10:00 AM to 10:59 AM | 0 (0.0%) | 20 (6.2%) |
| 11:00 AM to 11:59 AM | 81 (14.2%) | 0 (0.0%) |
| 12:00 PM to 3:59 PM | 34 (5.9%) | 11 (3.4%) |
| 4:00 PM to 11:59 PM | 65 (11.4%) | 0 (0.0%) |
| Total | 572 (100.0%) | 323 (100.0%) |
Housing Occupancy in Point Of Rocks
Occupancy by Ownership in Point Of Rocks
Of the total 726 dwellings in Point Of Rocks, owner-occupied units account for 721 (99.3%), while renter-occupied units make up 5 (0.7%).
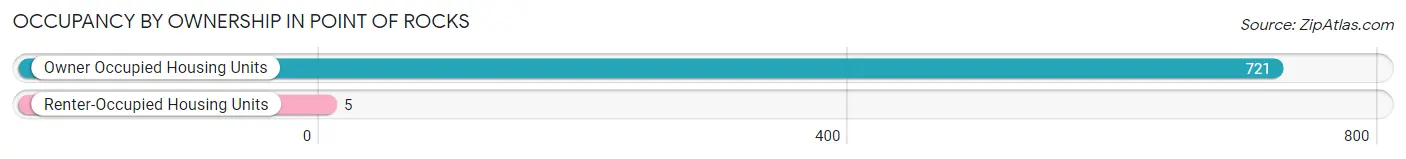
| Occupancy | # Housing Units | % Housing Units |
| Owner Occupied Housing Units | 721 | 99.3% |
| Renter-Occupied Housing Units | 5 | 0.7% |
| Total Occupied Housing Units | 726 | 100.0% |
Occupancy by Household Size in Point Of Rocks
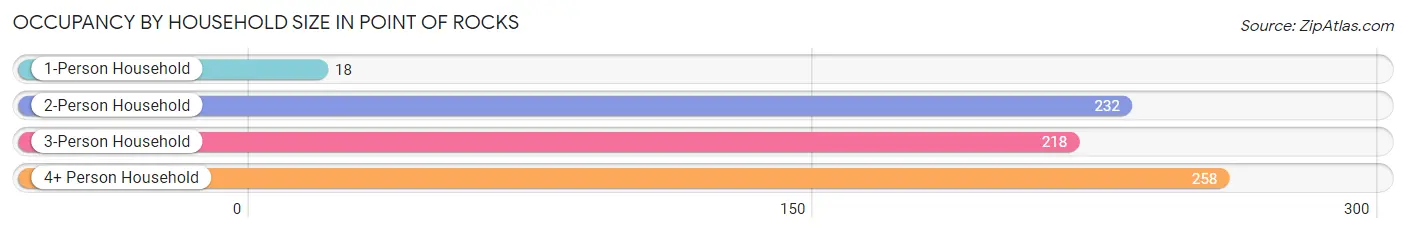
| Household Size | # Housing Units | % Housing Units |
| 1-Person Household | 18 | 2.5% |
| 2-Person Household | 232 | 32.0% |
| 3-Person Household | 218 | 30.0% |
| 4+ Person Household | 258 | 35.5% |
| Total Housing Units | 726 | 100.0% |
Occupancy by Ownership by Household Size in Point Of Rocks
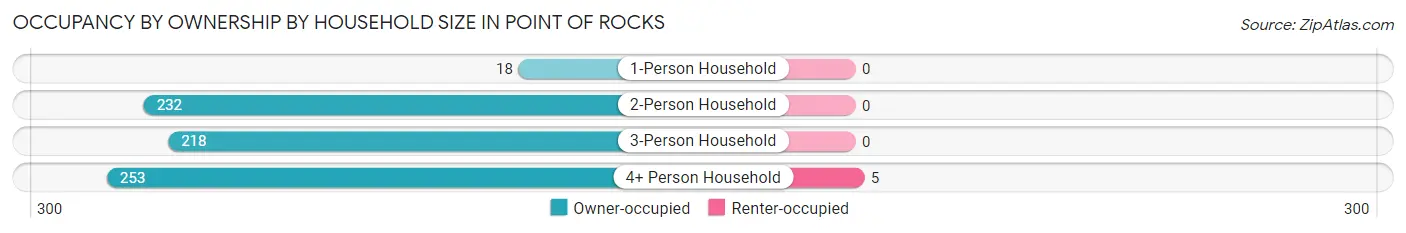
| Household Size | Owner-occupied | Renter-occupied |
| 1-Person Household | 18 (100.0%) | 0 (0.0%) |
| 2-Person Household | 232 (100.0%) | 0 (0.0%) |
| 3-Person Household | 218 (100.0%) | 0 (0.0%) |
| 4+ Person Household | 253 (98.1%) | 5 (1.9%) |
| Total Housing Units | 721 (99.3%) | 5 (0.7%) |
Occupancy by Educational Attainment in Point Of Rocks
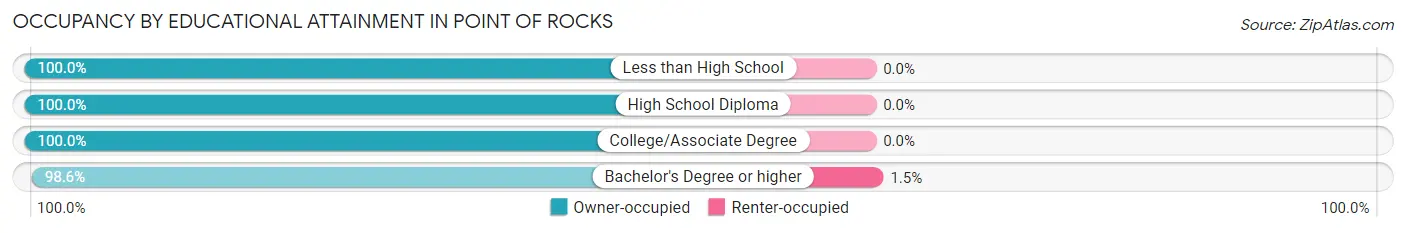
| Household Size | Owner-occupied | Renter-occupied |
| Less than High School | 9 (100.0%) | 0 (0.0%) |
| High School Diploma | 129 (100.0%) | 0 (0.0%) |
| College/Associate Degree | 242 (100.0%) | 0 (0.0%) |
| Bachelor's Degree or higher | 341 (98.6%) | 5 (1.5%) |
Occupancy by Age of Householder in Point Of Rocks
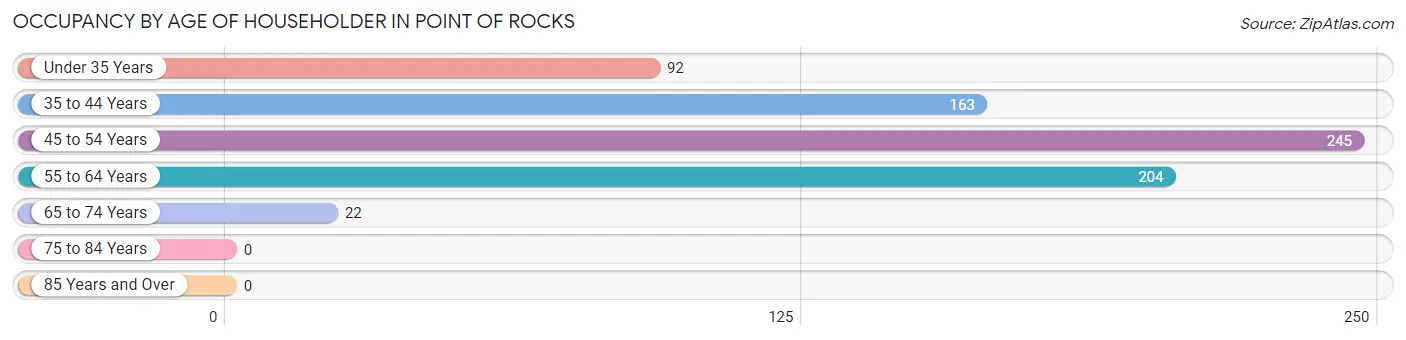
| Age Bracket | # Households | % Households |
| Under 35 Years | 92 | 12.7% |
| 35 to 44 Years | 163 | 22.5% |
| 45 to 54 Years | 245 | 33.8% |
| 55 to 64 Years | 204 | 28.1% |
| 65 to 74 Years | 22 | 3.0% |
| 75 to 84 Years | 0 | 0.0% |
| 85 Years and Over | 0 | 0.0% |
| Total | 726 | 100.0% |
Housing Finances in Point Of Rocks
Median Income by Occupancy in Point Of Rocks
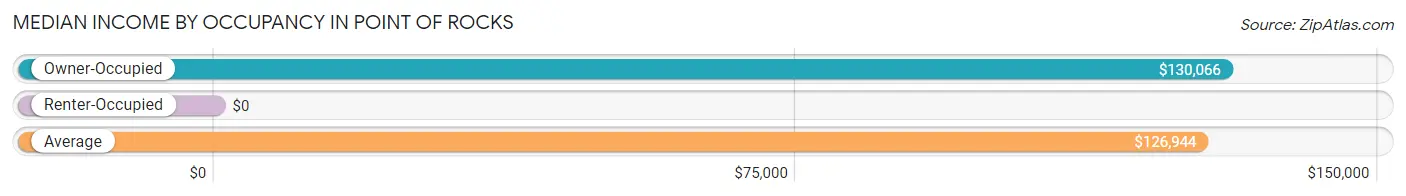
| Occupancy Type | # Households | Median Income |
| Owner-Occupied | 721 (99.3%) | $130,066 |
| Renter-Occupied | 5 (0.7%) | $0 |
| Average | 726 (100.0%) | $126,944 |
Occupancy by Householder Income Bracket in Point Of Rocks
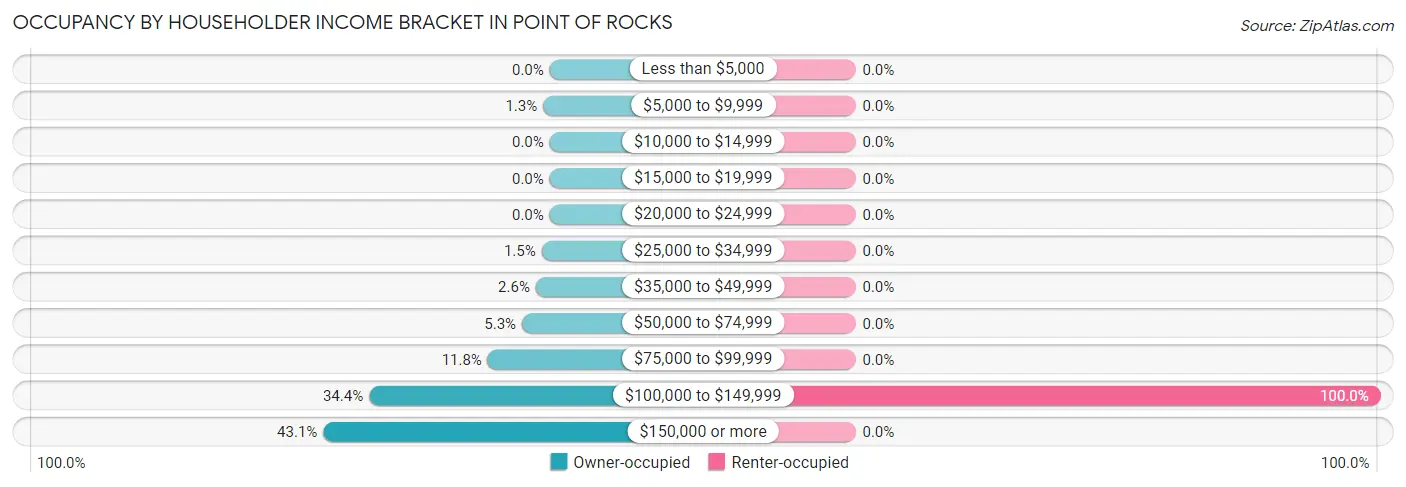
| Income Bracket | Owner-occupied | Renter-occupied |
| Less than $5,000 | 0 (0.0%) | 0 (0.0%) |
| $5,000 to $9,999 | 9 (1.3%) | 0 (0.0%) |
| $10,000 to $14,999 | 0 (0.0%) | 0 (0.0%) |
| $15,000 to $19,999 | 0 (0.0%) | 0 (0.0%) |
| $20,000 to $24,999 | 0 (0.0%) | 0 (0.0%) |
| $25,000 to $34,999 | 11 (1.5%) | 0 (0.0%) |
| $35,000 to $49,999 | 19 (2.6%) | 0 (0.0%) |
| $50,000 to $74,999 | 38 (5.3%) | 0 (0.0%) |
| $75,000 to $99,999 | 85 (11.8%) | 0 (0.0%) |
| $100,000 to $149,999 | 248 (34.4%) | 5 (100.0%) |
| $150,000 or more | 311 (43.1%) | 0 (0.0%) |
| Total | 721 (100.0%) | 5 (100.0%) |
Monthly Housing Cost Tiers in Point Of Rocks
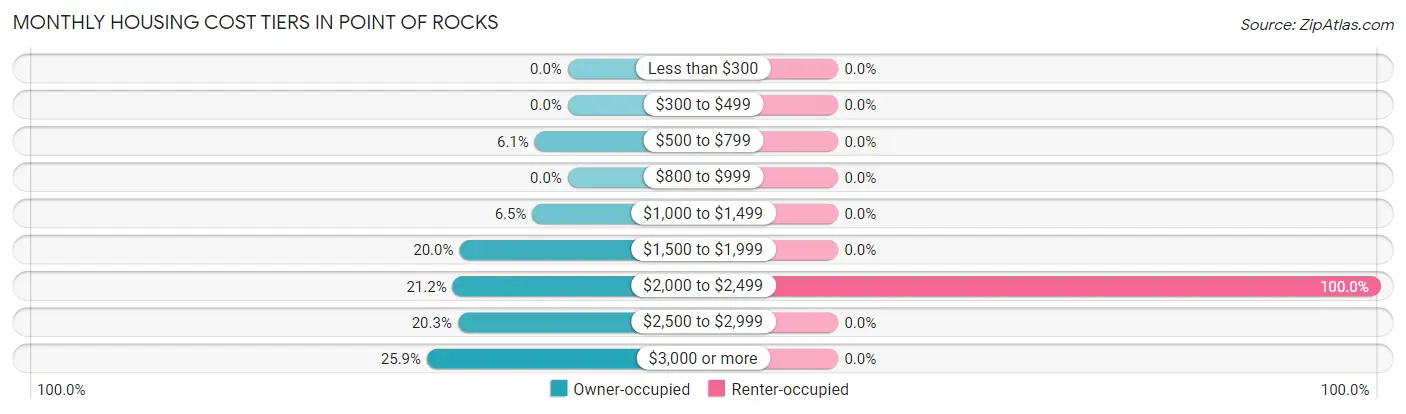
| Monthly Cost | Owner-occupied | Renter-occupied |
| Less than $300 | 0 (0.0%) | 0 (0.0%) |
| $300 to $499 | 0 (0.0%) | 0 (0.0%) |
| $500 to $799 | 44 (6.1%) | 0 (0.0%) |
| $800 to $999 | 0 (0.0%) | 0 (0.0%) |
| $1,000 to $1,499 | 47 (6.5%) | 0 (0.0%) |
| $1,500 to $1,999 | 144 (20.0%) | 0 (0.0%) |
| $2,000 to $2,499 | 153 (21.2%) | 5 (100.0%) |
| $2,500 to $2,999 | 146 (20.3%) | 0 (0.0%) |
| $3,000 or more | 187 (25.9%) | 0 (0.0%) |
| Total | 721 (100.0%) | 5 (100.0%) |
Physical Housing Characteristics in Point Of Rocks
Housing Structures in Point Of Rocks
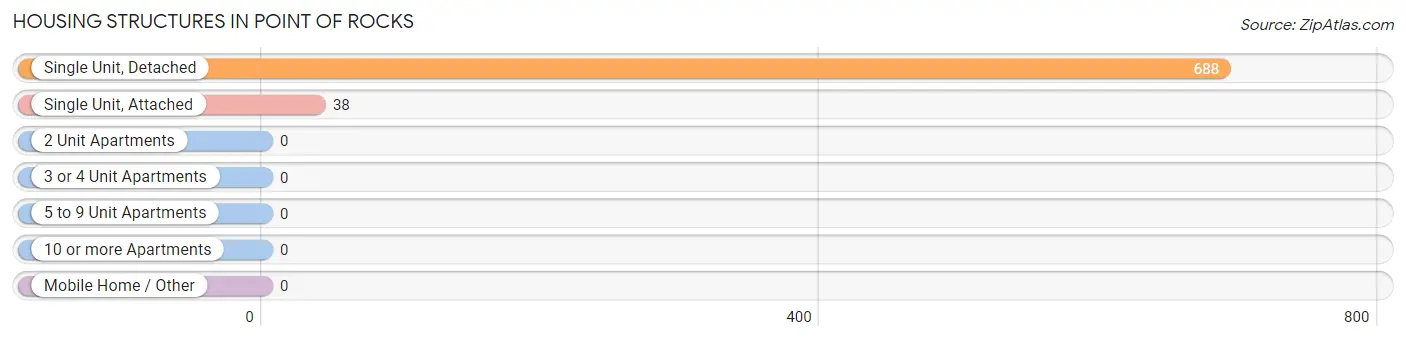
| Structure Type | # Housing Units | % Housing Units |
| Single Unit, Detached | 688 | 94.8% |
| Single Unit, Attached | 38 | 5.2% |
| 2 Unit Apartments | 0 | 0.0% |
| 3 or 4 Unit Apartments | 0 | 0.0% |
| 5 to 9 Unit Apartments | 0 | 0.0% |
| 10 or more Apartments | 0 | 0.0% |
| Mobile Home / Other | 0 | 0.0% |
| Total | 726 | 100.0% |
Housing Structures by Occupancy in Point Of Rocks
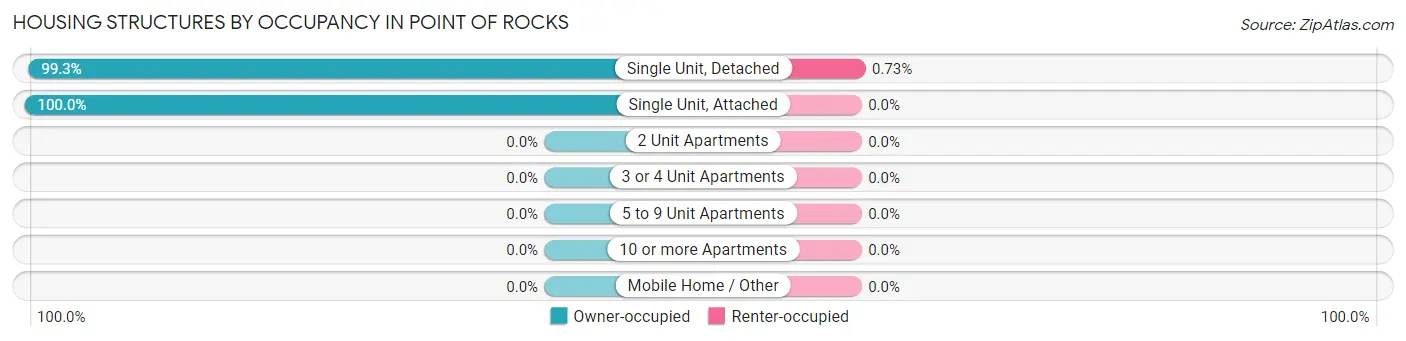
| Structure Type | Owner-occupied | Renter-occupied |
| Single Unit, Detached | 683 (99.3%) | 5 (0.7%) |
| Single Unit, Attached | 38 (100.0%) | 0 (0.0%) |
| 2 Unit Apartments | 0 (0.0%) | 0 (0.0%) |
| 3 or 4 Unit Apartments | 0 (0.0%) | 0 (0.0%) |
| 5 to 9 Unit Apartments | 0 (0.0%) | 0 (0.0%) |
| 10 or more Apartments | 0 (0.0%) | 0 (0.0%) |
| Mobile Home / Other | 0 (0.0%) | 0 (0.0%) |
| Total | 721 (99.3%) | 5 (0.7%) |
Housing Structures by Number of Rooms in Point Of Rocks
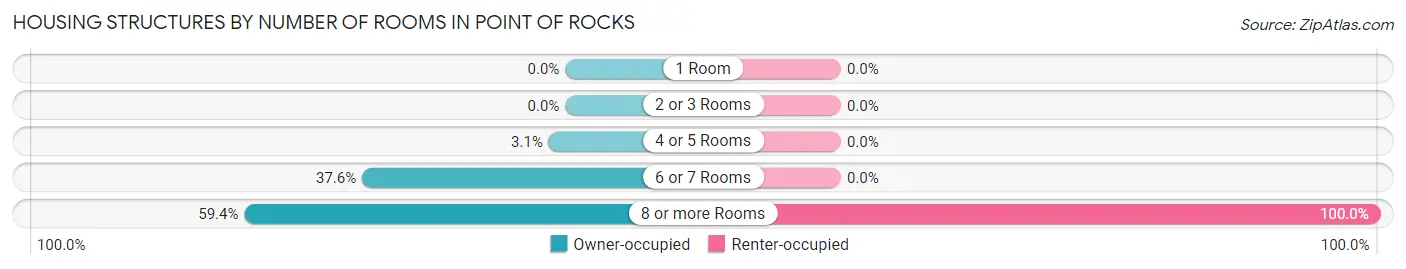
| Number of Rooms | Owner-occupied | Renter-occupied |
| 1 Room | 0 (0.0%) | 0 (0.0%) |
| 2 or 3 Rooms | 0 (0.0%) | 0 (0.0%) |
| 4 or 5 Rooms | 22 (3.0%) | 0 (0.0%) |
| 6 or 7 Rooms | 271 (37.6%) | 0 (0.0%) |
| 8 or more Rooms | 428 (59.4%) | 5 (100.0%) |
| Total | 721 (100.0%) | 5 (100.0%) |
Housing Structure by Heating Type in Point Of Rocks
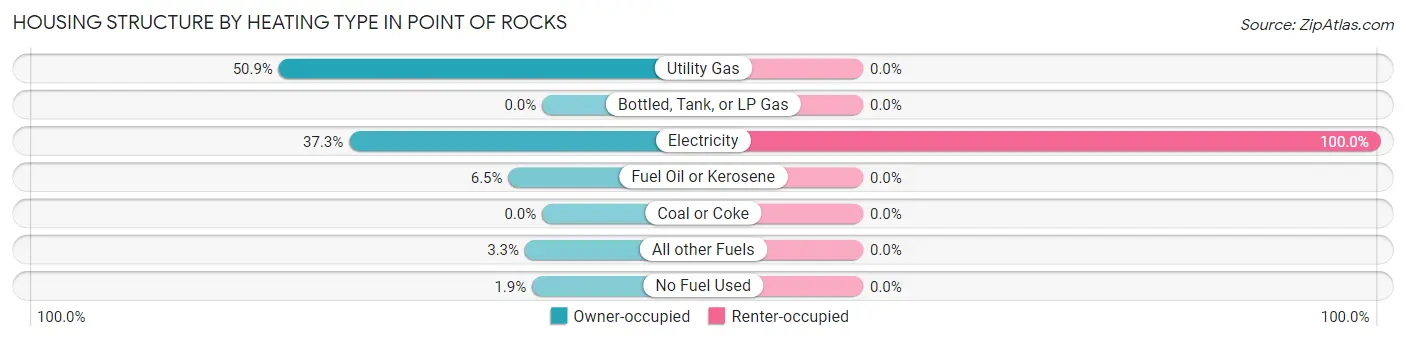
| Heating Type | Owner-occupied | Renter-occupied |
| Utility Gas | 367 (50.9%) | 0 (0.0%) |
| Bottled, Tank, or LP Gas | 0 (0.0%) | 0 (0.0%) |
| Electricity | 269 (37.3%) | 5 (100.0%) |
| Fuel Oil or Kerosene | 47 (6.5%) | 0 (0.0%) |
| Coal or Coke | 0 (0.0%) | 0 (0.0%) |
| All other Fuels | 24 (3.3%) | 0 (0.0%) |
| No Fuel Used | 14 (1.9%) | 0 (0.0%) |
| Total | 721 (100.0%) | 5 (100.0%) |
Household Vehicle Usage in Point Of Rocks
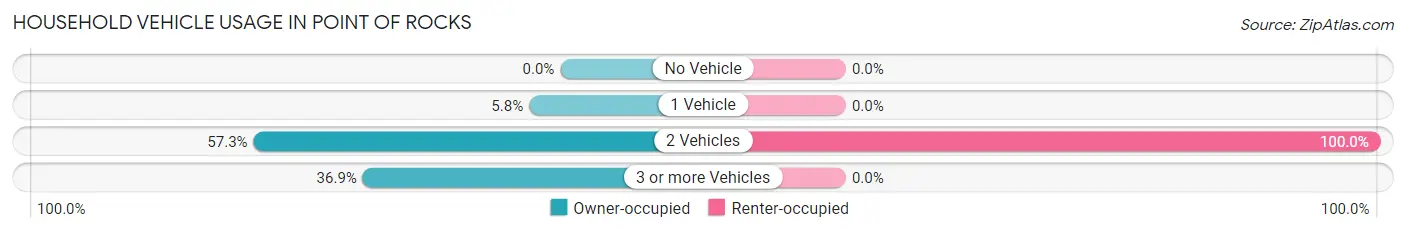
| Vehicles per Household | Owner-occupied | Renter-occupied |
| No Vehicle | 0 (0.0%) | 0 (0.0%) |
| 1 Vehicle | 42 (5.8%) | 0 (0.0%) |
| 2 Vehicles | 413 (57.3%) | 5 (100.0%) |
| 3 or more Vehicles | 266 (36.9%) | 0 (0.0%) |
| Total | 721 (100.0%) | 5 (100.0%) |
Real Estate & Mortgages in Point Of Rocks
Real Estate and Mortgage Overview in Point Of Rocks
| Characteristic | Without Mortgage | With Mortgage |
| Housing Units | 63 | 658 |
| Median Property Value | - | - |
| Median Household Income | - | - |
| Monthly Housing Costs | $764 | $187 |
| Real Estate Taxes | - | - |
Property Value by Mortgage Status in Point Of Rocks
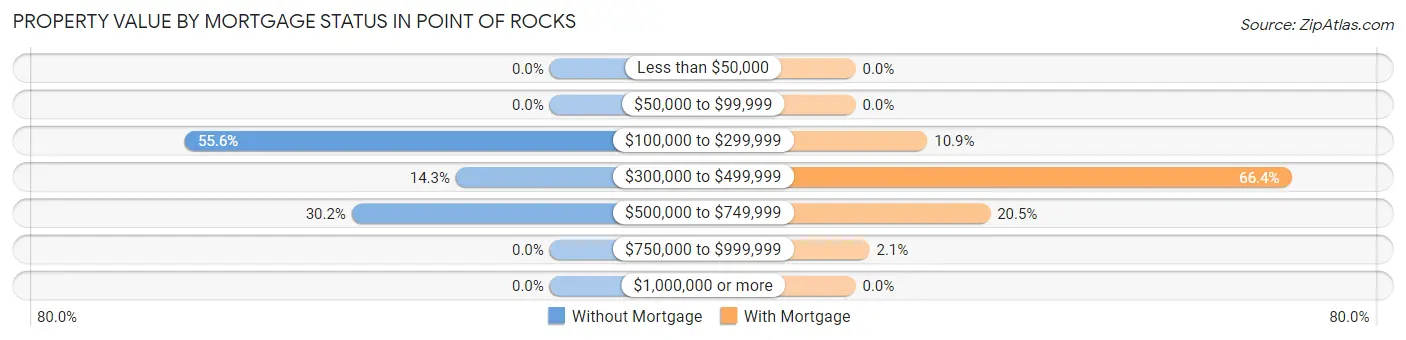
| Property Value | Without Mortgage | With Mortgage |
| Less than $50,000 | 0 (0.0%) | 0 (0.0%) |
| $50,000 to $99,999 | 0 (0.0%) | 0 (0.0%) |
| $100,000 to $299,999 | 35 (55.6%) | 72 (10.9%) |
| $300,000 to $499,999 | 9 (14.3%) | 437 (66.4%) |
| $500,000 to $749,999 | 19 (30.2%) | 135 (20.5%) |
| $750,000 to $999,999 | 0 (0.0%) | 14 (2.1%) |
| $1,000,000 or more | 0 (0.0%) | 0 (0.0%) |
| Total | 63 (100.0%) | 658 (100.0%) |
Household Income by Mortgage Status in Point Of Rocks
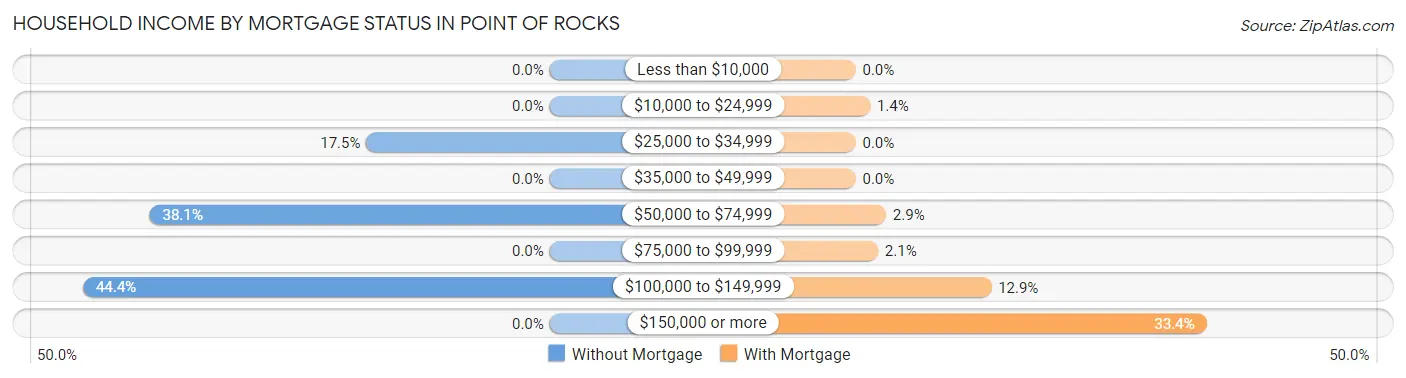
| Household Income | Without Mortgage | With Mortgage |
| Less than $10,000 | 0 (0.0%) | 0 (0.0%) |
| $10,000 to $24,999 | 0 (0.0%) | 9 (1.4%) |
| $25,000 to $34,999 | 11 (17.5%) | 0 (0.0%) |
| $35,000 to $49,999 | 0 (0.0%) | 0 (0.0%) |
| $50,000 to $74,999 | 24 (38.1%) | 19 (2.9%) |
| $75,000 to $99,999 | 0 (0.0%) | 14 (2.1%) |
| $100,000 to $149,999 | 28 (44.4%) | 85 (12.9%) |
| $150,000 or more | 0 (0.0%) | 220 (33.4%) |
| Total | 63 (100.0%) | 658 (100.0%) |
Property Value to Household Income Ratio in Point Of Rocks
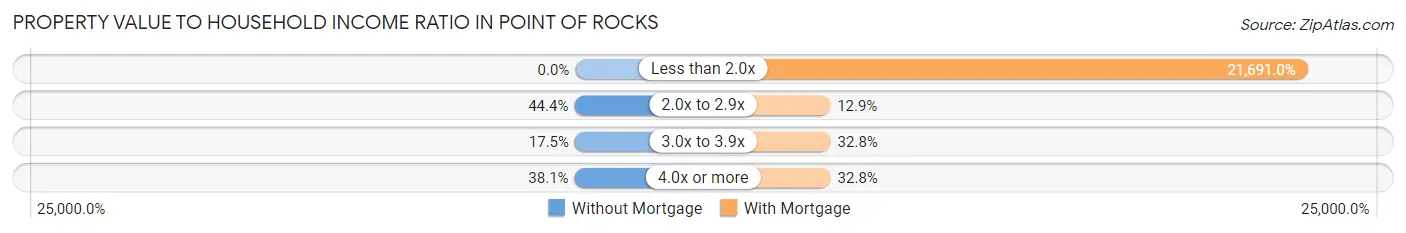
| Value-to-Income Ratio | Without Mortgage | With Mortgage |
| Less than 2.0x | 0 (0.0%) | 142,727 (21,691.0%) |
| 2.0x to 2.9x | 28 (44.4%) | 85 (12.9%) |
| 3.0x to 3.9x | 11 (17.5%) | 216 (32.8%) |
| 4.0x or more | 24 (38.1%) | 216 (32.8%) |
| Total | 63 (100.0%) | 658 (100.0%) |
Real Estate Taxes by Mortgage Status in Point Of Rocks
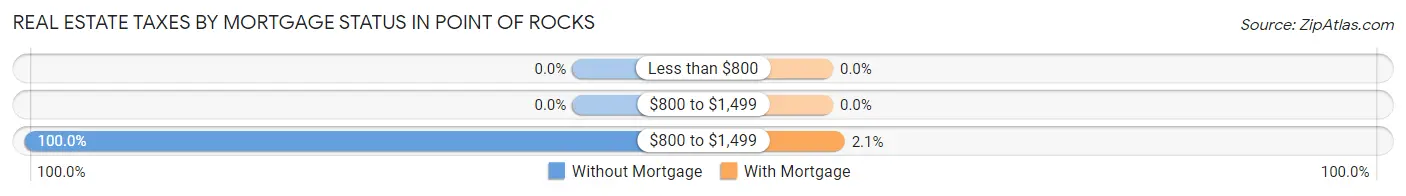
| Property Taxes | Without Mortgage | With Mortgage |
| Less than $800 | 0 (0.0%) | 0 (0.0%) |
| $800 to $1,499 | 0 (0.0%) | 0 (0.0%) |
| $800 to $1,499 | 63 (100.0%) | 14 (2.1%) |
| Total | 63 (100.0%) | 658 (100.0%) |
Health & Disability in Point Of Rocks
Health Insurance Coverage by Age in Point Of Rocks
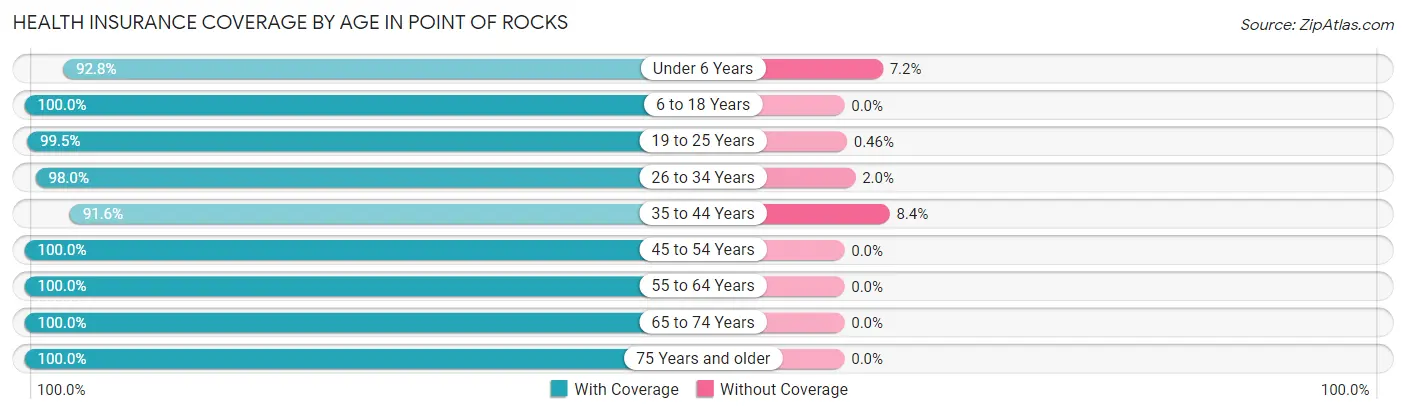
| Age Bracket | With Coverage | Without Coverage |
| Under 6 Years | 233 (92.8%) | 18 (7.2%) |
| 6 to 18 Years | 332 (100.0%) | 0 (0.0%) |
| 19 to 25 Years | 215 (99.5%) | 1 (0.5%) |
| 26 to 34 Years | 192 (98.0%) | 4 (2.0%) |
| 35 to 44 Years | 304 (91.6%) | 28 (8.4%) |
| 45 to 54 Years | 375 (100.0%) | 0 (0.0%) |
| 55 to 64 Years | 445 (100.0%) | 0 (0.0%) |
| 65 to 74 Years | 138 (100.0%) | 0 (0.0%) |
| 75 Years and older | 75 (100.0%) | 0 (0.0%) |
| Total | 2,309 (97.8%) | 51 (2.2%) |
Health Insurance Coverage by Citizenship Status in Point Of Rocks
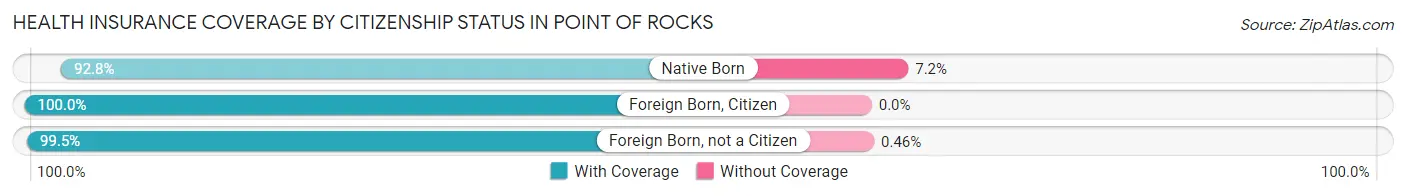
| Citizenship Status | With Coverage | Without Coverage |
| Native Born | 233 (92.8%) | 18 (7.2%) |
| Foreign Born, Citizen | 332 (100.0%) | 0 (0.0%) |
| Foreign Born, not a Citizen | 215 (99.5%) | 1 (0.5%) |
Health Insurance Coverage by Household Income in Point Of Rocks
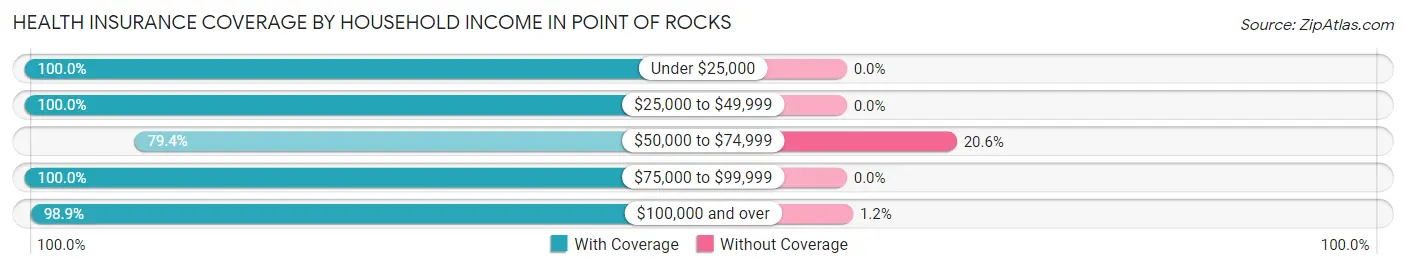
| Household Income | With Coverage | Without Coverage |
| Under $25,000 | 18 (100.0%) | 0 (0.0%) |
| $25,000 to $49,999 | 47 (100.0%) | 0 (0.0%) |
| $50,000 to $74,999 | 108 (79.4%) | 28 (20.6%) |
| $75,000 to $99,999 | 167 (100.0%) | 0 (0.0%) |
| $100,000 and over | 1,969 (98.9%) | 23 (1.1%) |
Public vs Private Health Insurance Coverage by Age in Point Of Rocks
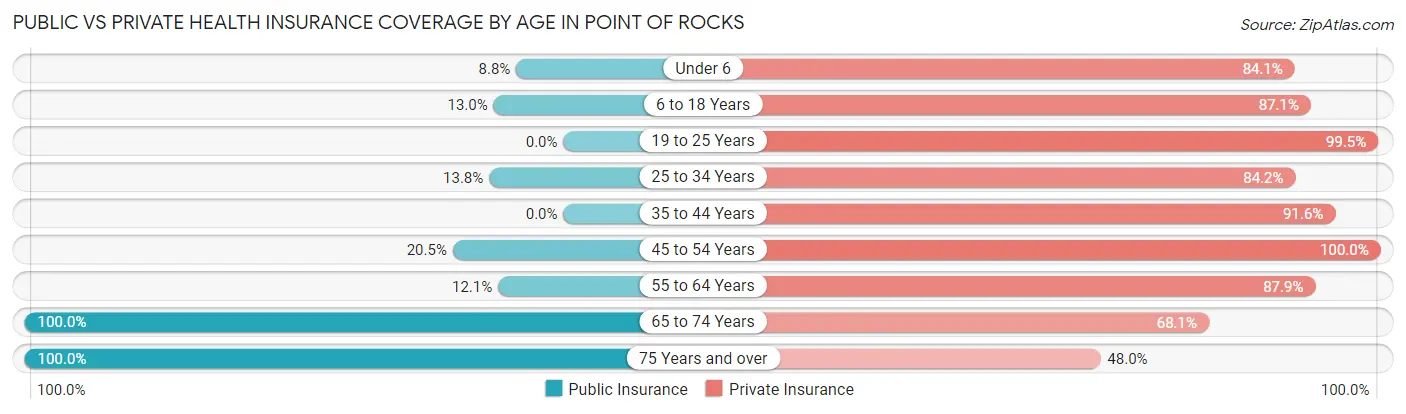
| Age Bracket | Public Insurance | Private Insurance |
| Under 6 | 22 (8.8%) | 211 (84.1%) |
| 6 to 18 Years | 43 (13.0%) | 289 (87.1%) |
| 19 to 25 Years | 0 (0.0%) | 215 (99.5%) |
| 25 to 34 Years | 27 (13.8%) | 165 (84.2%) |
| 35 to 44 Years | 0 (0.0%) | 304 (91.6%) |
| 45 to 54 Years | 77 (20.5%) | 375 (100.0%) |
| 55 to 64 Years | 54 (12.1%) | 391 (87.9%) |
| 65 to 74 Years | 138 (100.0%) | 94 (68.1%) |
| 75 Years and over | 75 (100.0%) | 36 (48.0%) |
| Total | 436 (18.5%) | 2,080 (88.1%) |
Disability Status by Sex by Age in Point Of Rocks
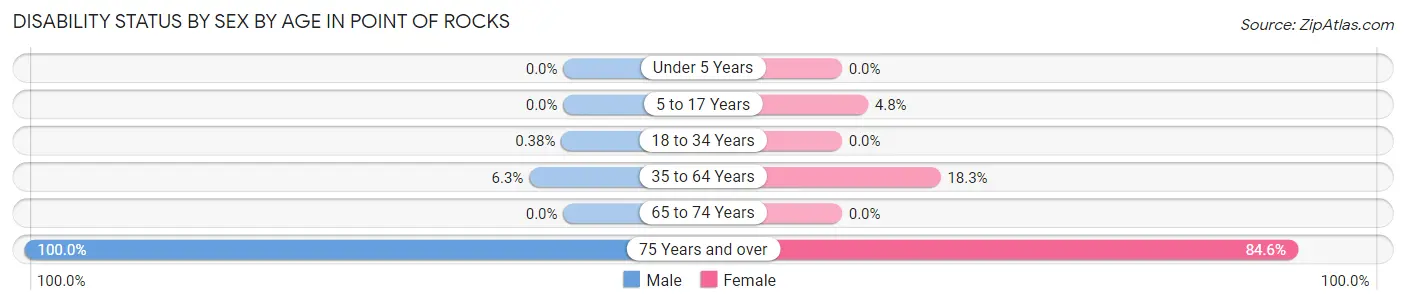
| Age Bracket | Male | Female |
| Under 5 Years | 0 (0.0%) | 0 (0.0%) |
| 5 to 17 Years | 0 (0.0%) | 9 (4.8%) |
| 18 to 34 Years | 1 (0.4%) | 0 (0.0%) |
| 35 to 64 Years | 37 (6.3%) | 104 (18.3%) |
| 65 to 74 Years | 0 (0.0%) | 0 (0.0%) |
| 75 Years and over | 36 (100.0%) | 33 (84.6%) |
Disability Class by Sex by Age in Point Of Rocks
Disability Class: Hearing Difficulty
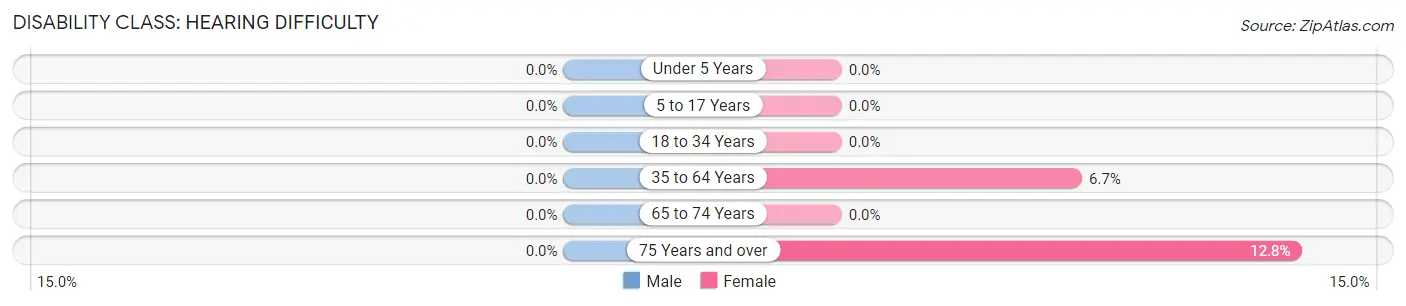
| Age Bracket | Male | Female |
| Under 5 Years | 0 (0.0%) | 0 (0.0%) |
| 5 to 17 Years | 0 (0.0%) | 0 (0.0%) |
| 18 to 34 Years | 0 (0.0%) | 0 (0.0%) |
| 35 to 64 Years | 0 (0.0%) | 38 (6.7%) |
| 65 to 74 Years | 0 (0.0%) | 0 (0.0%) |
| 75 Years and over | 0 (0.0%) | 5 (12.8%) |
Disability Class: Vision Difficulty
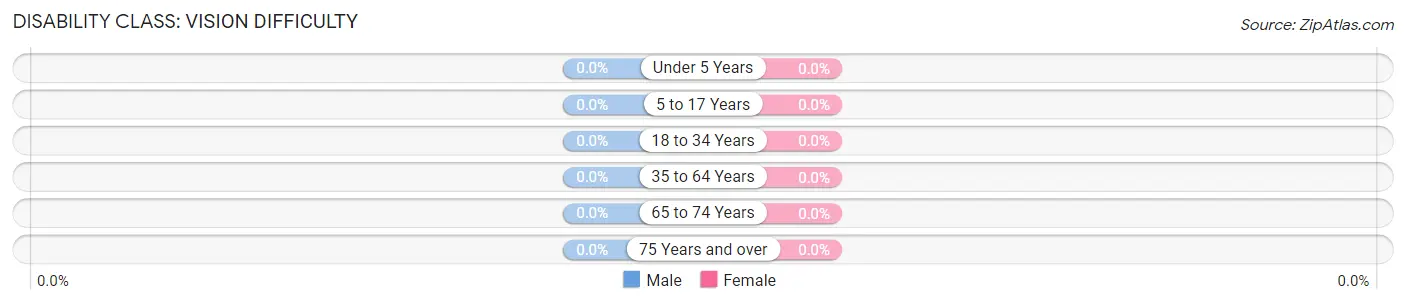
| Age Bracket | Male | Female |
| Under 5 Years | 0 (0.0%) | 0 (0.0%) |
| 5 to 17 Years | 0 (0.0%) | 0 (0.0%) |
| 18 to 34 Years | 0 (0.0%) | 0 (0.0%) |
| 35 to 64 Years | 0 (0.0%) | 0 (0.0%) |
| 65 to 74 Years | 0 (0.0%) | 0 (0.0%) |
| 75 Years and over | 0 (0.0%) | 0 (0.0%) |
Disability Class: Cognitive Difficulty
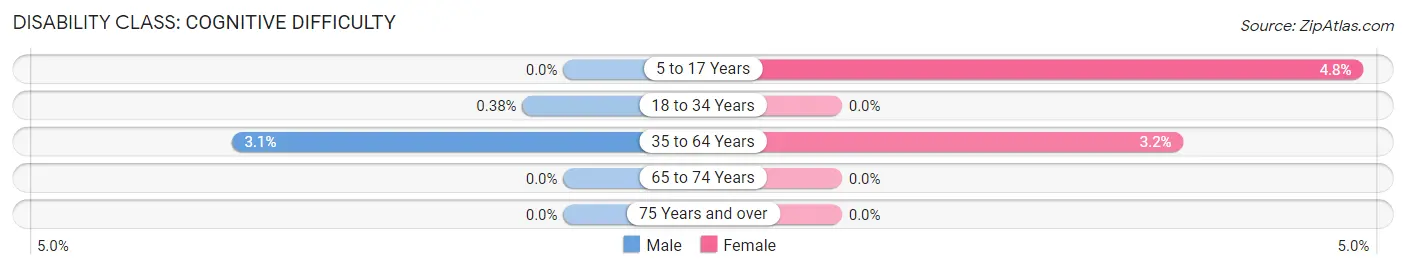
| Age Bracket | Male | Female |
| 5 to 17 Years | 0 (0.0%) | 9 (4.8%) |
| 18 to 34 Years | 1 (0.4%) | 0 (0.0%) |
| 35 to 64 Years | 18 (3.1%) | 18 (3.2%) |
| 65 to 74 Years | 0 (0.0%) | 0 (0.0%) |
| 75 Years and over | 0 (0.0%) | 0 (0.0%) |
Disability Class: Ambulatory Difficulty
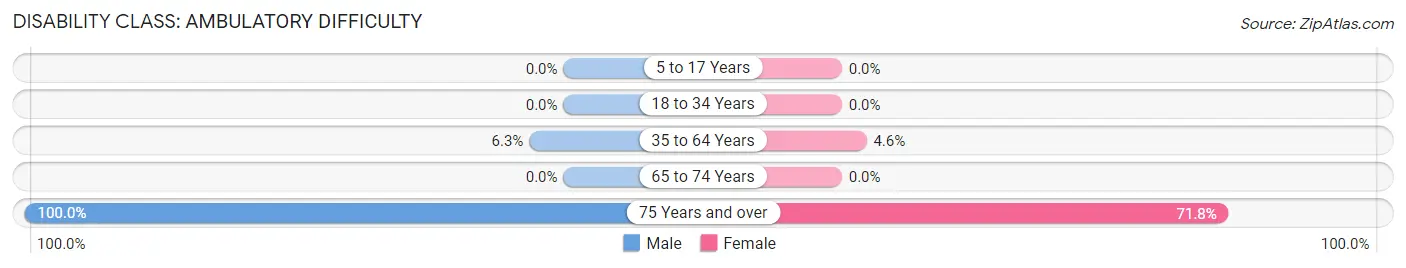
| Age Bracket | Male | Female |
| 5 to 17 Years | 0 (0.0%) | 0 (0.0%) |
| 18 to 34 Years | 0 (0.0%) | 0 (0.0%) |
| 35 to 64 Years | 37 (6.3%) | 26 (4.6%) |
| 65 to 74 Years | 0 (0.0%) | 0 (0.0%) |
| 75 Years and over | 36 (100.0%) | 28 (71.8%) |
Disability Class: Self-Care Difficulty
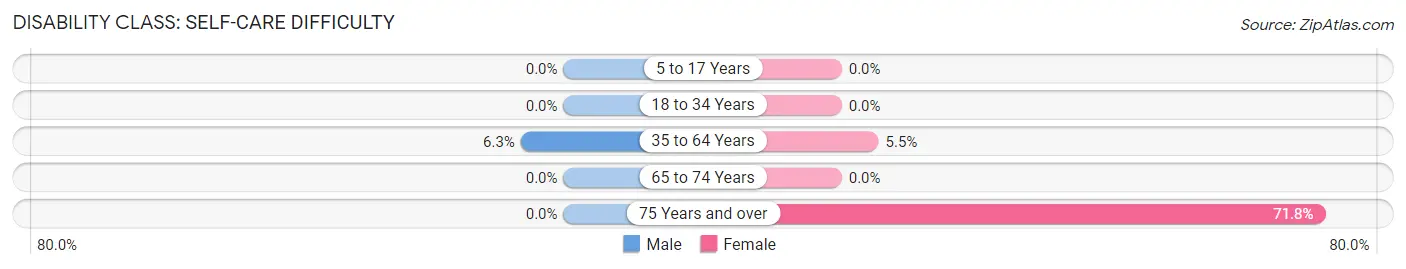
| Age Bracket | Male | Female |
| 5 to 17 Years | 0 (0.0%) | 0 (0.0%) |
| 18 to 34 Years | 0 (0.0%) | 0 (0.0%) |
| 35 to 64 Years | 37 (6.3%) | 31 (5.5%) |
| 65 to 74 Years | 0 (0.0%) | 0 (0.0%) |
| 75 Years and over | 0 (0.0%) | 28 (71.8%) |
Technology Access in Point Of Rocks
Computing Device Access in Point Of Rocks
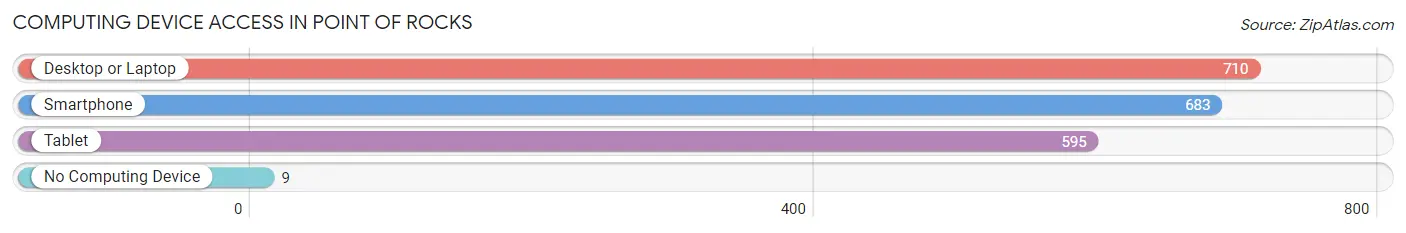
| Device Type | # Households | % Households |
| Desktop or Laptop | 710 | 97.8% |
| Smartphone | 683 | 94.1% |
| Tablet | 595 | 82.0% |
| No Computing Device | 9 | 1.2% |
| Total | 726 | 100.0% |
Internet Access in Point Of Rocks
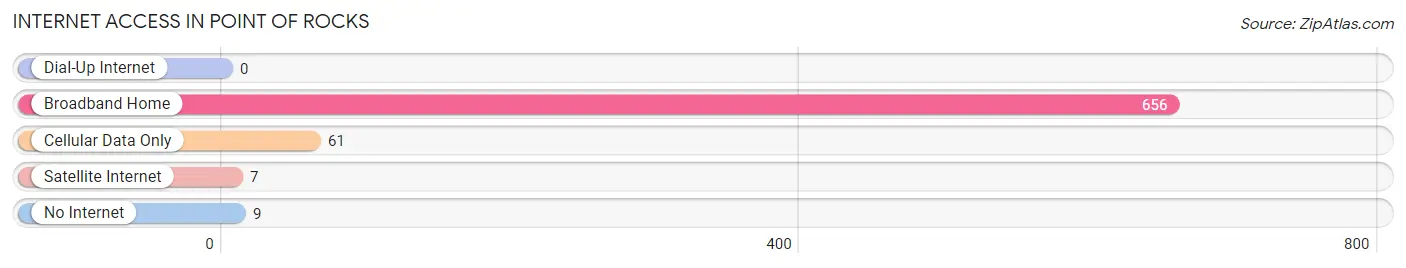
| Internet Type | # Households | % Households |
| Dial-Up Internet | 0 | 0.0% |
| Broadband Home | 656 | 90.4% |
| Cellular Data Only | 61 | 8.4% |
| Satellite Internet | 7 | 1.0% |
| No Internet | 9 | 1.2% |
| Total | 726 | 100.0% |
Point Of Rocks Summary
Point of Rocks is a small town located in Frederick County, Maryland. It is situated on the Potomac River, approximately 40 miles northwest of Washington, D.C. The town is named for a large outcropping of rocks in the river, which was used as a navigational landmark by early settlers.
History
The area around Point of Rocks has been inhabited for thousands of years. Native American tribes, including the Susquehannock, Piscataway, and Shawnee, lived in the area prior to European settlement. The first European settlers arrived in the area in the late 17th century. The town was officially established in 1790 and was named for the large outcropping of rocks in the Potomac River.
In the 19th century, Point of Rocks became an important transportation hub. The Chesapeake and Ohio Canal was built in the area in 1828, connecting the Potomac River with the Ohio River. The Baltimore and Ohio Railroad also built a line through the town in 1831, making Point of Rocks a major stop on the route between Baltimore and Washington, D.C.
The town was also the site of a major Civil War battle in 1862. Confederate forces attempted to cross the Potomac River at Point of Rocks, but were repelled by Union forces. The battle was a major victory for the Union and helped to secure the area around Washington, D.C.
Geography
Point of Rocks is located in Frederick County, Maryland. It is situated on the Potomac River, approximately 40 miles northwest of Washington, D.C. The town is bordered by the Catoctin Mountains to the west and the Monocacy River to the east.
The town has a total area of 1.2 square miles, all of which is land. The terrain is mostly flat, with some rolling hills. The climate is humid subtropical, with hot, humid summers and cold, wet winters.
Economy
The economy of Point of Rocks is largely based on tourism and agriculture. The town is home to several historic sites, including the Chesapeake and Ohio Canal, the Baltimore and Ohio Railroad, and the Point of Rocks Battlefield. These sites attract visitors from all over the world.
Agriculture is also an important part of the local economy. The area is home to several farms, which produce a variety of crops, including corn, soybeans, and hay.
Demographics
As of the 2010 census, the population of Point of Rocks was 1,466. The racial makeup of the town was 94.3% White, 2.2% African American, 0.3% Native American, 0.7% Asian, 0.1% Pacific Islander, and 2.4% from other races. Hispanic or Latino of any race were 3.2% of the population.
The median household income in Point of Rocks was $63,125, and the median family income was $71,250. The per capita income was $27,945. About 5.3% of families and 7.2% of the population were below the poverty line.
Common Questions
What is Per Capita Income in Point Of Rocks?
Per Capita income in Point Of Rocks is $48,104.
What is the Median Family Income in Point Of Rocks?
Median Family Income in Point Of Rocks is $132,368.
What is the Median Household income in Point Of Rocks?
Median Household Income in Point Of Rocks is $126,944.
What is Income or Wage Gap in Point Of Rocks?
Income or Wage Gap in Point Of Rocks is 53.1%.
Women in Point Of Rocks earn 46.9 cents for every dollar earned by a man.
What is Inequality or Gini Index in Point Of Rocks?
Inequality or Gini Index in Point Of Rocks is 0.29.
What is the Total Population of Point Of Rocks?
Total Population of Point Of Rocks is 2,360.
What is the Total Male Population of Point Of Rocks?
Total Male Population of Point Of Rocks is 1,284.
What is the Total Female Population of Point Of Rocks?
Total Female Population of Point Of Rocks is 1,076.
What is the Ratio of Males per 100 Females in Point Of Rocks?
There are 119.33 Males per 100 Females in Point Of Rocks.
What is the Ratio of Females per 100 Males in Point Of Rocks?
There are 83.80 Females per 100 Males in Point Of Rocks.
What is the Median Population Age in Point Of Rocks?
Median Population Age in Point Of Rocks is 38.3 Years.
What is the Average Family Size in Point Of Rocks
Average Family Size in Point Of Rocks is 3.2 People.
What is the Average Household Size in Point Of Rocks
Average Household Size in Point Of Rocks is 3.2 People.
How Large is the Labor Force in Point Of Rocks?
There are 1,222 People in the Labor Forcein in Point Of Rocks.
What is the Percentage of People in the Labor Force in Point Of Rocks?
66.6% of People are in the Labor Force in Point Of Rocks.
What is the Unemployment Rate in Point Of Rocks?
Unemployment Rate in Point Of Rocks is 3.6%.