Martin s Additions, MD Map & Demographics
Martin s Additions Map
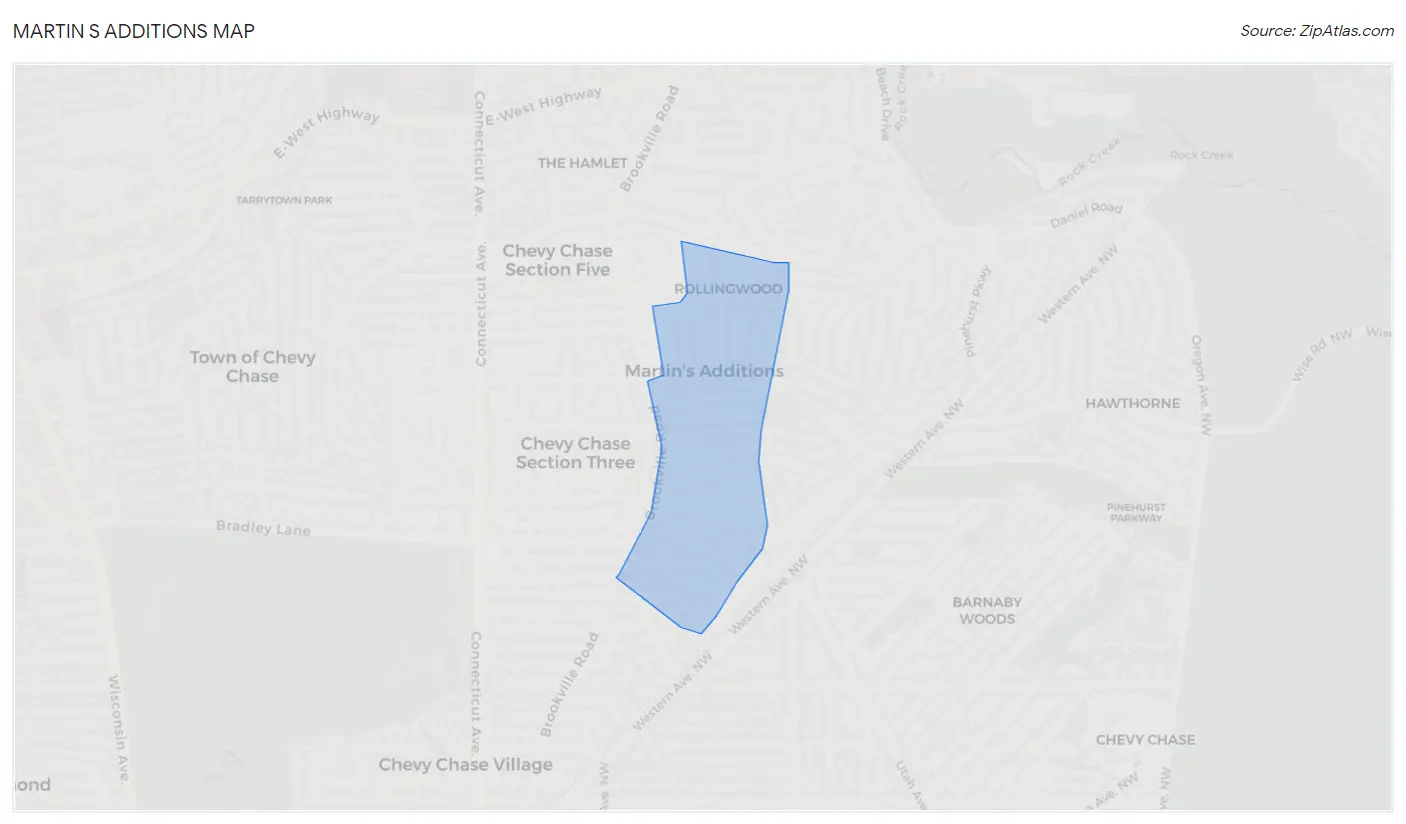
Martin s Additions Overview
$172,692
PER CAPITA INCOME
$250,001
AVG FAMILY INCOME
$250,001
AVG HOUSEHOLD INCOME
58.2%
WAGE / INCOME GAP [ % ]
41.8¢/ $1
WAGE / INCOME GAP [ $ ]
0.47
INEQUALITY / GINI INDEX
993
TOTAL POPULATION
492
MALE POPULATION
501
FEMALE POPULATION
98.20
MALES / 100 FEMALES
101.83
FEMALES / 100 MALES
47.0
MEDIAN AGE
3.3
AVG FAMILY SIZE
3.0
AVG HOUSEHOLD SIZE
505
LABOR FORCE [ PEOPLE ]
65.1%
PERCENT IN LABOR FORCE
0.6%
UNEMPLOYMENT RATE
Income in Martin s Additions
Income Overview in Martin s Additions
Per Capita Income in Martin s Additions is $172,692, while median incomes of families and households are $250,001 and $250,001 respectively.
| Characteristic | Number | Measure |
| Per Capita Income | 993 | $172,692 |
| Median Family Income | 280 | $250,001 |
| Mean Family Income | 280 | $571,018 |
| Median Household Income | 328 | $250,001 |
| Mean Household Income | 328 | $521,458 |
| Income Deficit | 280 | $0 |
| Wage / Income Gap (%) | 993 | 58.22% |
| Wage / Income Gap ($) | 993 | 41.78¢ per $1 |
| Gini / Inequality Index | 993 | 0.47 |
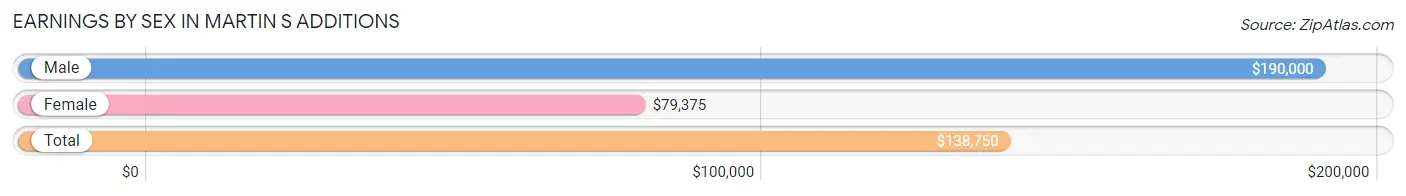
Earnings by Sex in Martin s Additions
Average Earnings in Martin s Additions are $138,750, $190,000 for men and $79,375 for women, a difference of 58.2%.
| Sex | Number | Average Earnings |
| Male | 300 (55.2%) | $190,000 |
| Female | 243 (44.8%) | $79,375 |
| Total | 543 (100.0%) | $138,750 |
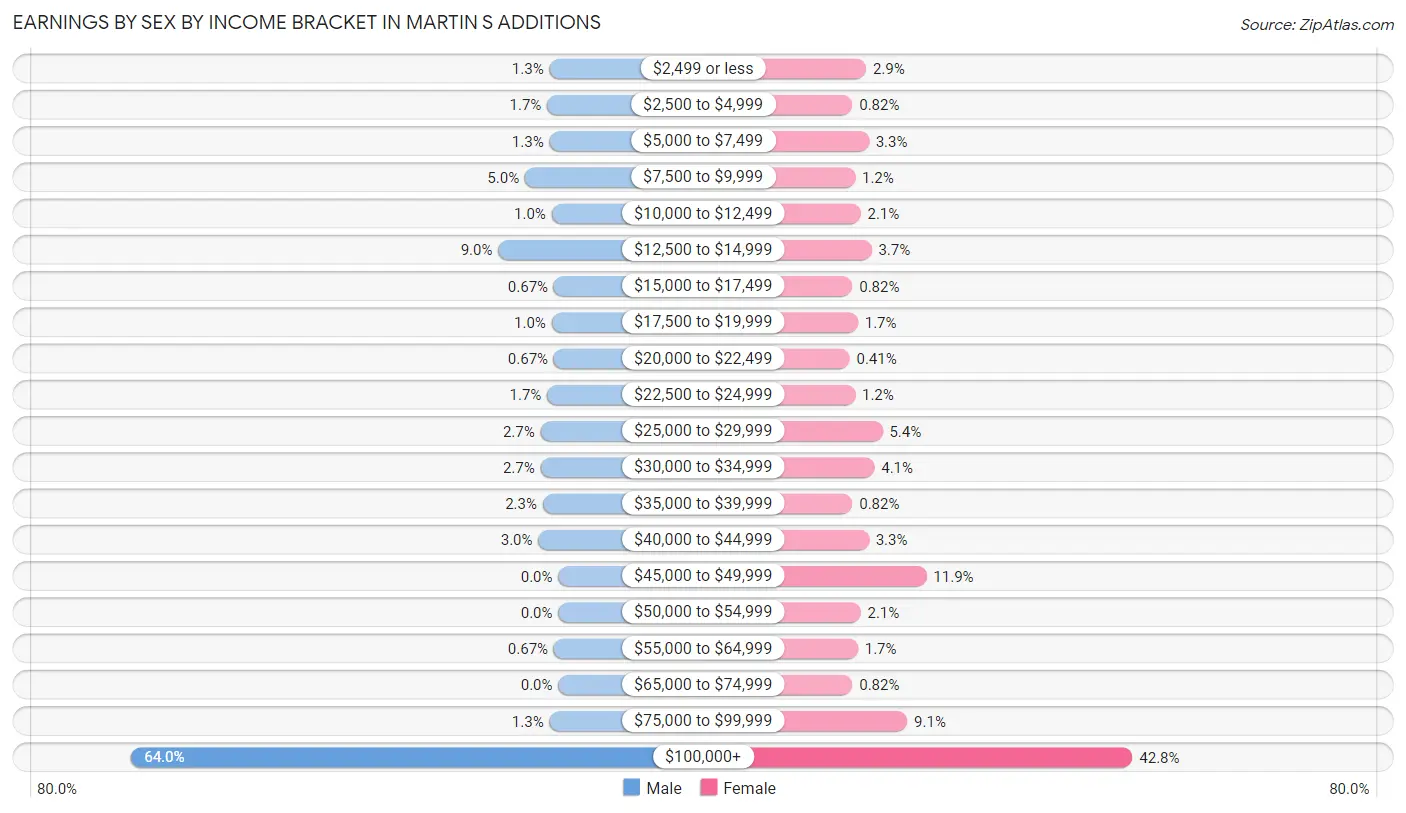
Earnings by Sex by Income Bracket in Martin s Additions
The most common earnings brackets in Martin s Additions are $100,000+ for men (192 | 64.0%) and $100,000+ for women (104 | 42.8%).
| Income | Male | Female |
| $2,499 or less | 4 (1.3%) | 7 (2.9%) |
| $2,500 to $4,999 | 5 (1.7%) | 2 (0.8%) |
| $5,000 to $7,499 | 4 (1.3%) | 8 (3.3%) |
| $7,500 to $9,999 | 15 (5.0%) | 3 (1.2%) |
| $10,000 to $12,499 | 3 (1.0%) | 5 (2.1%) |
| $12,500 to $14,999 | 27 (9.0%) | 9 (3.7%) |
| $15,000 to $17,499 | 2 (0.7%) | 2 (0.8%) |
| $17,500 to $19,999 | 3 (1.0%) | 4 (1.7%) |
| $20,000 to $22,499 | 2 (0.7%) | 1 (0.4%) |
| $22,500 to $24,999 | 5 (1.7%) | 3 (1.2%) |
| $25,000 to $29,999 | 8 (2.7%) | 13 (5.3%) |
| $30,000 to $34,999 | 8 (2.7%) | 10 (4.1%) |
| $35,000 to $39,999 | 7 (2.3%) | 2 (0.8%) |
| $40,000 to $44,999 | 9 (3.0%) | 8 (3.3%) |
| $45,000 to $49,999 | 0 (0.0%) | 29 (11.9%) |
| $50,000 to $54,999 | 0 (0.0%) | 5 (2.1%) |
| $55,000 to $64,999 | 2 (0.7%) | 4 (1.7%) |
| $65,000 to $74,999 | 0 (0.0%) | 2 (0.8%) |
| $75,000 to $99,999 | 4 (1.3%) | 22 (9.0%) |
| $100,000+ | 192 (64.0%) | 104 (42.8%) |
| Total | 300 (100.0%) | 243 (100.0%) |
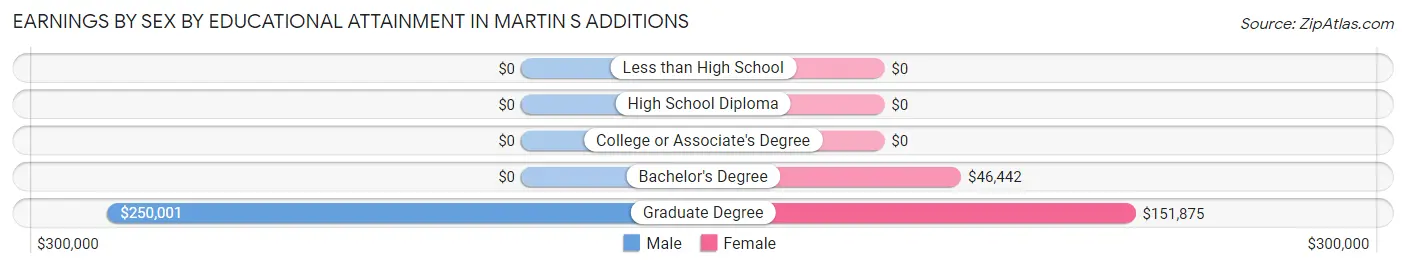
Earnings by Sex by Educational Attainment in Martin s Additions
Average earnings in Martin s Additions are $233,542 for men and $93,750 for women, a difference of 59.9%. Men with an educational attainment of graduate degree enjoy the highest average annual earnings of $250,001, while those with graduate degree education earn the least with $250,001. Women with an educational attainment of graduate degree earn the most with the average annual earnings of $151,875, while those with bachelor's degree education have the smallest earnings of $46,442.
| Educational Attainment | Male Income | Female Income |
| Less than High School | - | - |
| High School Diploma | - | - |
| College or Associate's Degree | - | - |
| Bachelor's Degree | - | - |
| Graduate Degree | $250,001 | $151,875 |
| Total | $233,542 | $93,750 |
Family Income in Martin s Additions
Family Income Brackets in Martin s Additions
According to the Martin s Additions family income data, there are 222 families falling into the $200,000+ income range, which is the most common income bracket and makes up 79.3% of all families.
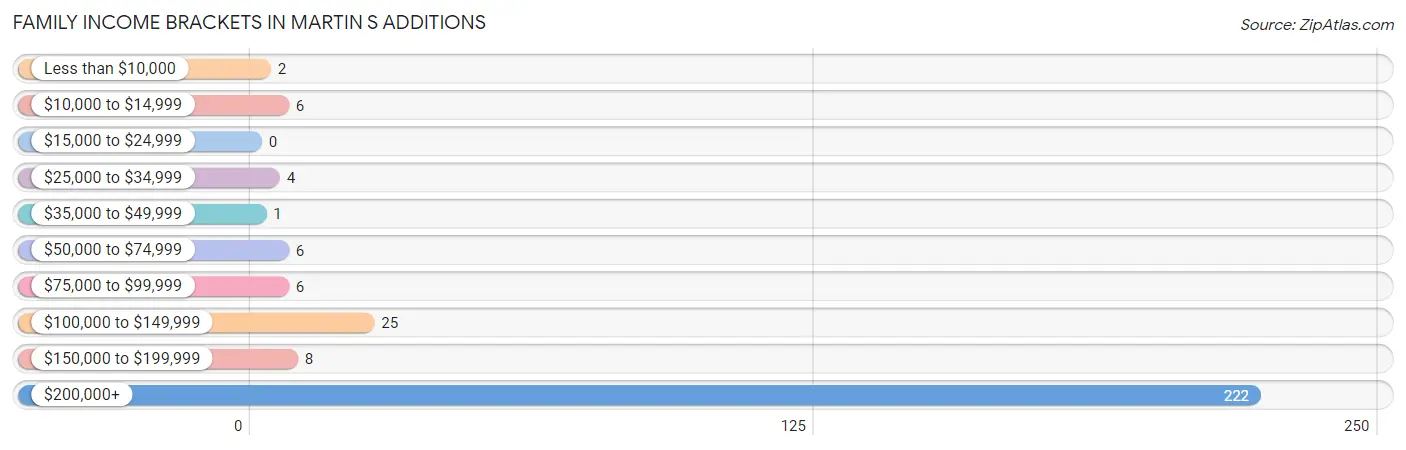
| Income Bracket | # Families | % Families |
| Less than $10,000 | 2 | 0.7% |
| $10,000 to $14,999 | 6 | 2.1% |
| $15,000 to $24,999 | 0 | 0.0% |
| $25,000 to $34,999 | 4 | 1.4% |
| $35,000 to $49,999 | 1 | 0.4% |
| $50,000 to $74,999 | 6 | 2.1% |
| $75,000 to $99,999 | 6 | 2.1% |
| $100,000 to $149,999 | 25 | 8.9% |
| $150,000 to $199,999 | 8 | 2.9% |
| $200,000+ | 222 | 79.3% |
Family Income by Famaliy Size in Martin s Additions
3-person families (74 | 26.4%) account for the highest median family income in Martin s Additions with $250,001 per family, while 2-person families (112 | 40.0%) have the highest median income of $124,375 per family member.
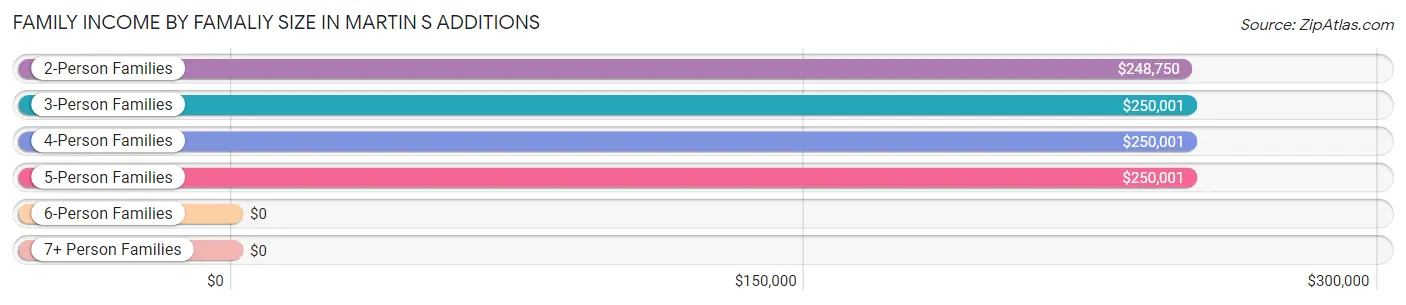
| Income Bracket | # Families | Median Income |
| 2-Person Families | 112 (40.0%) | $248,750 |
| 3-Person Families | 74 (26.4%) | $250,001 |
| 4-Person Families | 55 (19.6%) | $250,001 |
| 5-Person Families | 27 (9.6%) | $250,001 |
| 6-Person Families | 12 (4.3%) | $0 |
| 7+ Person Families | 0 (0.0%) | $0 |
| Total | 280 (100.0%) | $250,001 |
Family Income by Number of Earners in Martin s Additions
The median family income in Martin s Additions is $250,001, with families comprising 1 earner (69) having the highest median family income of $250,001, while families with no earners (34) have the lowest median family income of $165,000, accounting for 24.6% and 12.1% of families, respectively.
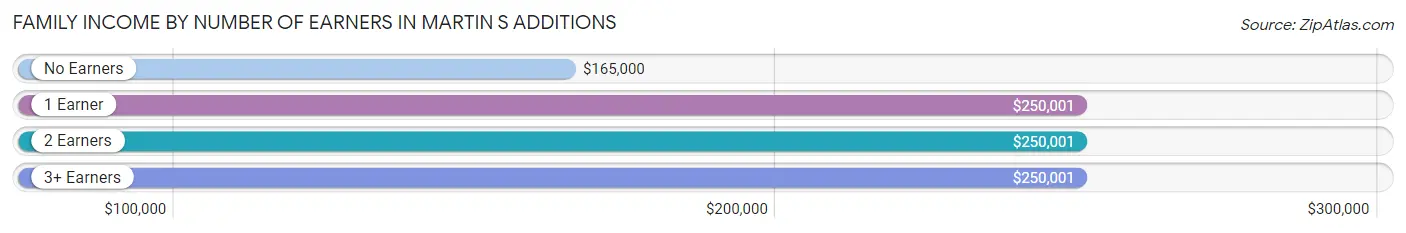
| Number of Earners | # Families | Median Income |
| No Earners | 34 (12.1%) | $165,000 |
| 1 Earner | 69 (24.6%) | $250,001 |
| 2 Earners | 132 (47.1%) | $250,001 |
| 3+ Earners | 45 (16.1%) | $250,001 |
| Total | 280 (100.0%) | $250,001 |
Household Income in Martin s Additions
Household Income Brackets in Martin s Additions
With 236 households falling in the category, the $200,000+ income range is the most frequent in Martin s Additions, accounting for 72.0% of all households. In contrast, only 2 households (0.6%) fall into the less than $10,000 income bracket, making it the least populous group.
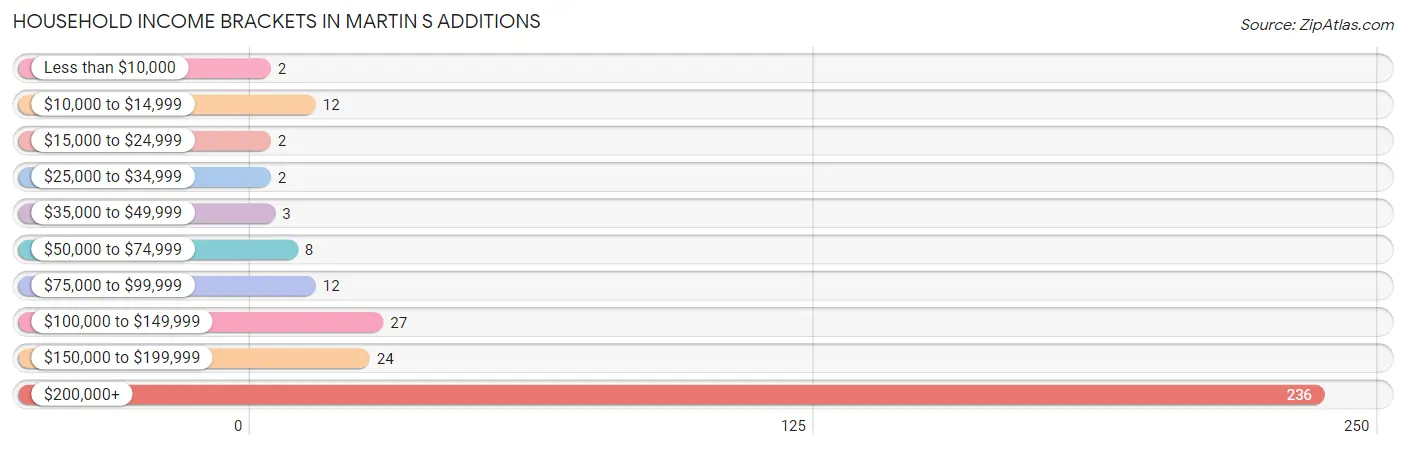
| Income Bracket | # Households | % Households |
| Less than $10,000 | 2 | 0.6% |
| $10,000 to $14,999 | 12 | 3.7% |
| $15,000 to $24,999 | 2 | 0.6% |
| $25,000 to $34,999 | 2 | 0.6% |
| $35,000 to $49,999 | 3 | 0.9% |
| $50,000 to $74,999 | 8 | 2.4% |
| $75,000 to $99,999 | 12 | 3.7% |
| $100,000 to $149,999 | 27 | 8.2% |
| $150,000 to $199,999 | 24 | 7.3% |
| $200,000+ | 236 | 72.0% |
Household Income by Householder Age in Martin s Additions
The median household income in Martin s Additions is $250,001, with the highest median household income of $250,001 found in the 25 to 44 years age bracket for the primary householder. A total of 48 households (14.6%) fall into this category.
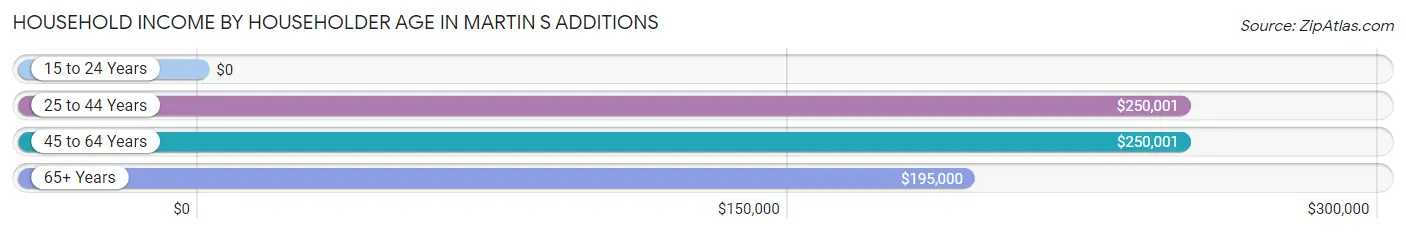
| Income Bracket | # Households | Median Income |
| 15 to 24 Years | 0 (0.0%) | $0 |
| 25 to 44 Years | 48 (14.6%) | $250,001 |
| 45 to 64 Years | 168 (51.2%) | $250,001 |
| 65+ Years | 112 (34.2%) | $195,000 |
| Total | 328 (100.0%) | $250,001 |
Poverty in Martin s Additions
Income Below Poverty by Sex and Age in Martin s Additions
With 6.1% poverty level for males and 4.4% for females among the residents of Martin s Additions, 5 year old males and 6 to 11 year old females are the most vulnerable to poverty, with 6 males (54.5%) and 8 females (18.2%) in their respective age groups living below the poverty level.
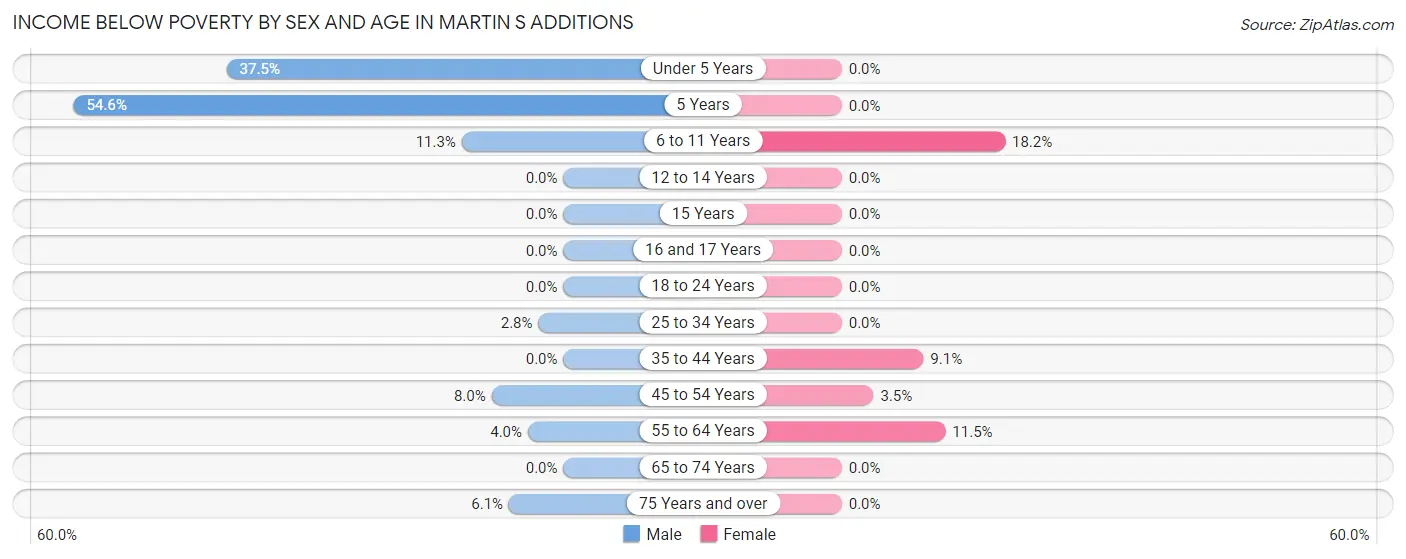
| Age Bracket | Male | Female |
| Under 5 Years | 6 (37.5%) | 0 (0.0%) |
| 5 Years | 6 (54.5%) | 0 (0.0%) |
| 6 to 11 Years | 6 (11.3%) | 8 (18.2%) |
| 12 to 14 Years | 0 (0.0%) | 0 (0.0%) |
| 15 Years | 0 (0.0%) | 0 (0.0%) |
| 16 and 17 Years | 0 (0.0%) | 0 (0.0%) |
| 18 to 24 Years | 0 (0.0%) | 0 (0.0%) |
| 25 to 34 Years | 1 (2.8%) | 0 (0.0%) |
| 35 to 44 Years | 0 (0.0%) | 5 (9.1%) |
| 45 to 54 Years | 6 (8.0%) | 3 (3.5%) |
| 55 to 64 Years | 3 (4.0%) | 6 (11.5%) |
| 65 to 74 Years | 0 (0.0%) | 0 (0.0%) |
| 75 Years and over | 2 (6.1%) | 0 (0.0%) |
| Total | 30 (6.1%) | 22 (4.4%) |
Income Above Poverty by Sex and Age in Martin s Additions
According to the poverty statistics in Martin s Additions, males aged 12 to 14 years and females aged under 5 years are the age groups that are most secure financially, with 100.0% of males and 100.0% of females in these age groups living above the poverty line.
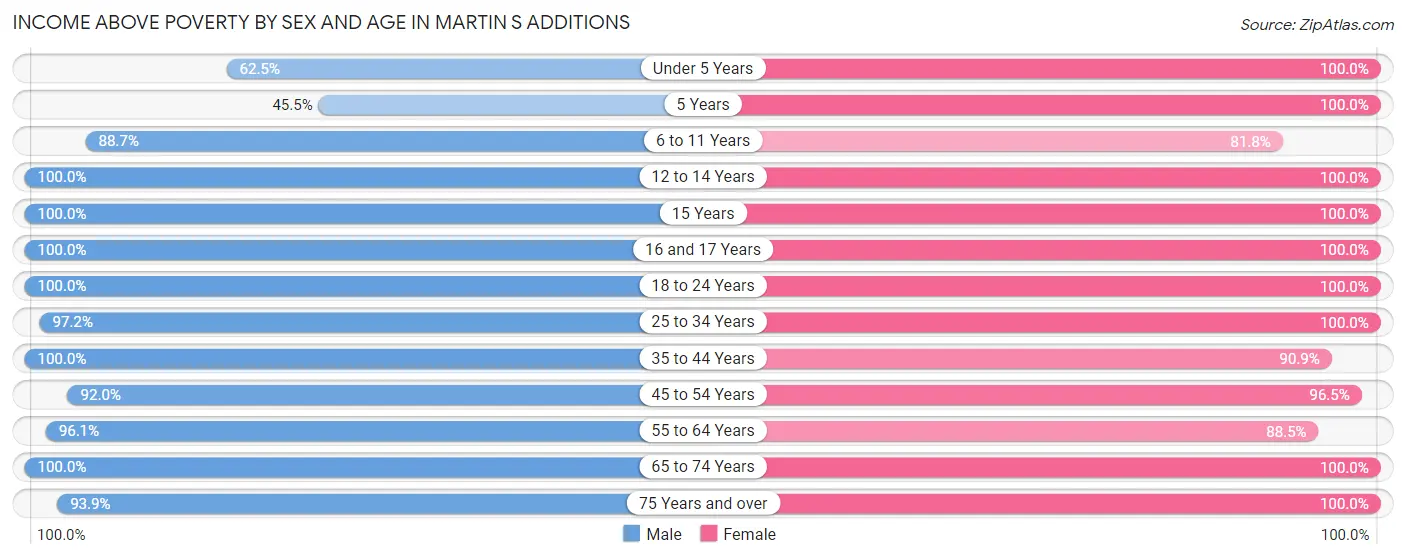
| Age Bracket | Male | Female |
| Under 5 Years | 10 (62.5%) | 38 (100.0%) |
| 5 Years | 5 (45.5%) | 10 (100.0%) |
| 6 to 11 Years | 47 (88.7%) | 36 (81.8%) |
| 12 to 14 Years | 8 (100.0%) | 22 (100.0%) |
| 15 Years | 9 (100.0%) | 2 (100.0%) |
| 16 and 17 Years | 12 (100.0%) | 18 (100.0%) |
| 18 to 24 Years | 50 (100.0%) | 36 (100.0%) |
| 25 to 34 Years | 35 (97.2%) | 12 (100.0%) |
| 35 to 44 Years | 41 (100.0%) | 50 (90.9%) |
| 45 to 54 Years | 69 (92.0%) | 82 (96.5%) |
| 55 to 64 Years | 73 (96.1%) | 46 (88.5%) |
| 65 to 74 Years | 70 (100.0%) | 81 (100.0%) |
| 75 Years and over | 31 (93.9%) | 44 (100.0%) |
| Total | 460 (93.9%) | 477 (95.6%) |
Income Below Poverty Among Married-Couple Families in Martin s Additions
The poverty statistics for married-couple families in Martin s Additions show that 2.4% or 6 of the total 252 families live below the poverty line. Families with 3 or 4 children have the highest poverty rate of 21.4%, comprising of 6 families. On the other hand, families with no children have the lowest poverty rate of 0.0%, which includes 0 families.
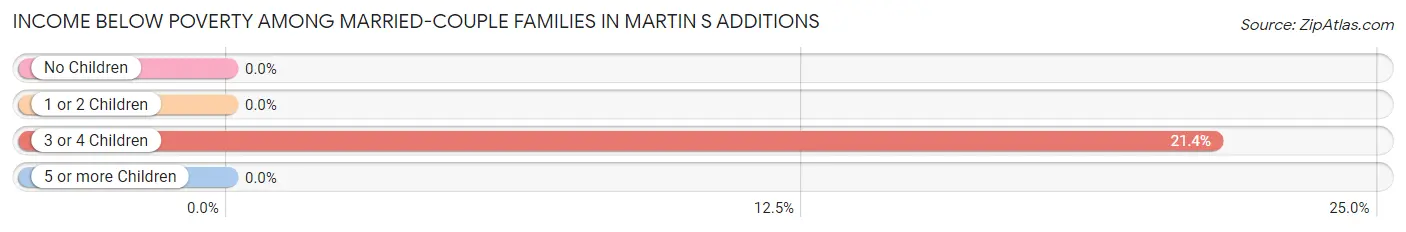
| Children | Above Poverty | Below Poverty |
| No Children | 148 (100.0%) | 0 (0.0%) |
| 1 or 2 Children | 76 (100.0%) | 0 (0.0%) |
| 3 or 4 Children | 22 (78.6%) | 6 (21.4%) |
| 5 or more Children | 0 (0.0%) | 0 (0.0%) |
| Total | 246 (97.6%) | 6 (2.4%) |
Income Below Poverty Among Single-Parent Households in Martin s Additions
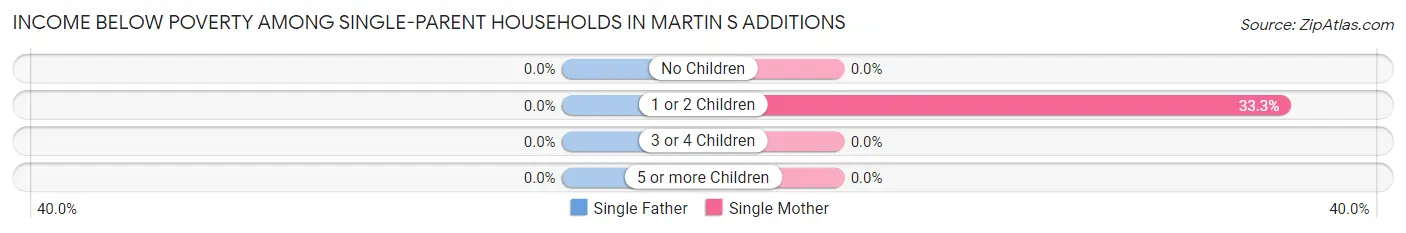
| Children | Single Father | Single Mother |
| No Children | 0 (0.0%) | 0 (0.0%) |
| 1 or 2 Children | 0 (0.0%) | 2 (33.3%) |
| 3 or 4 Children | 0 (0.0%) | 0 (0.0%) |
| 5 or more Children | 0 (0.0%) | 0 (0.0%) |
| Total | 0 (0.0%) | 2 (8.3%) |
Income Below Poverty Among Married-Couple vs Single-Parent Households in Martin s Additions
The poverty data for Martin s Additions shows that 6 of the married-couple family households (2.4%) and 2 of the single-parent households (7.1%) are living below the poverty level. Within the married-couple family households, those with 3 or 4 children have the highest poverty rate, with 6 households (21.4%) falling below the poverty line. Among the single-parent households, those with 1 or 2 children have the highest poverty rate, with 2 household (25.0%) living below poverty.
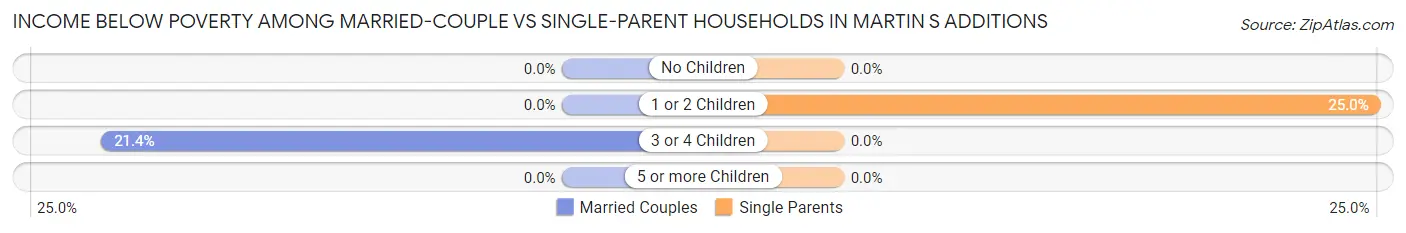
| Children | Married-Couple Families | Single-Parent Households |
| No Children | 0 (0.0%) | 0 (0.0%) |
| 1 or 2 Children | 0 (0.0%) | 2 (25.0%) |
| 3 or 4 Children | 6 (21.4%) | 0 (0.0%) |
| 5 or more Children | 0 (0.0%) | 0 (0.0%) |
| Total | 6 (2.4%) | 2 (7.1%) |
Race in Martin s Additions
The most populous races in Martin s Additions are White / Caucasian (926 | 93.2%), Two or more Races (45 | 4.5%), and Hispanic or Latino (34 | 3.4%).
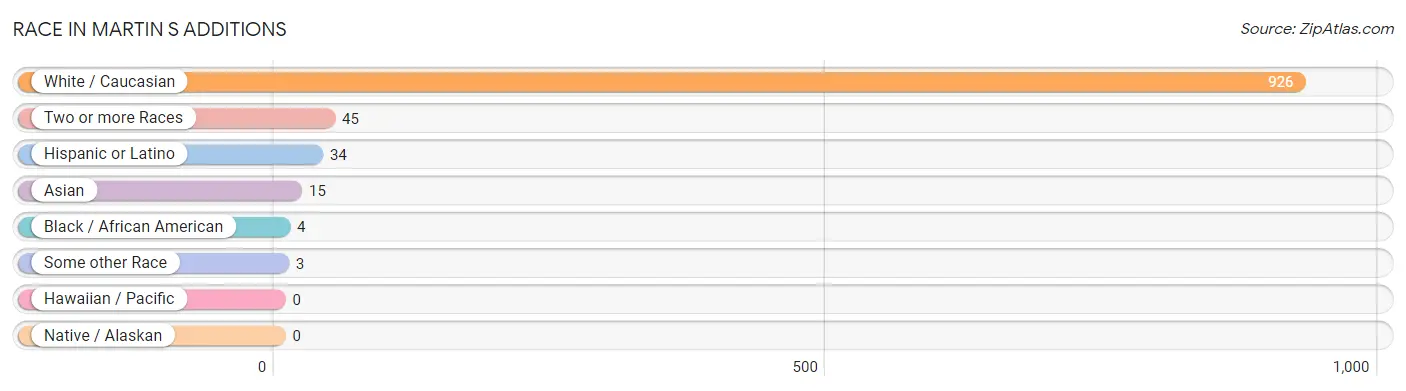
| Race | # Population | % Population |
| Asian | 15 | 1.5% |
| Black / African American | 4 | 0.4% |
| Hawaiian / Pacific | 0 | 0.0% |
| Hispanic or Latino | 34 | 3.4% |
| Native / Alaskan | 0 | 0.0% |
| White / Caucasian | 926 | 93.2% |
| Two or more Races | 45 | 4.5% |
| Some other Race | 3 | 0.3% |
| Total | 993 | 100.0% |
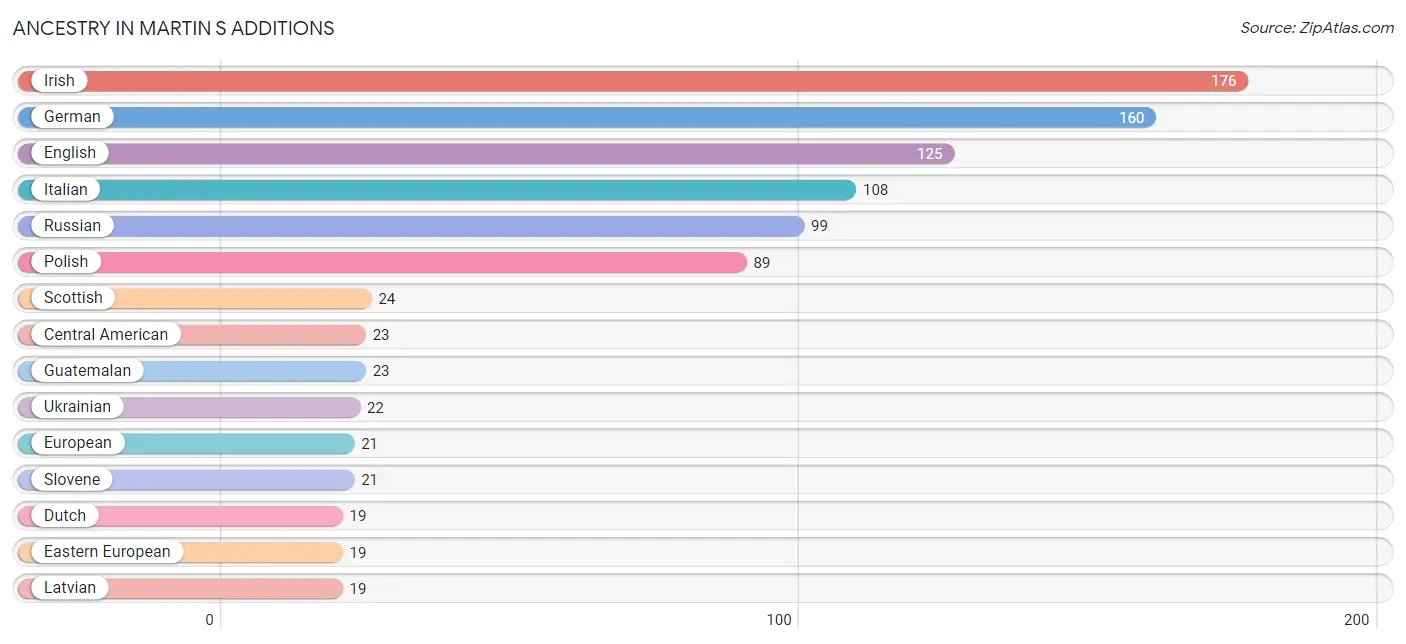
Ancestry in Martin s Additions
The most populous ancestries reported in Martin s Additions are Irish (176 | 17.7%), German (160 | 16.1%), English (125 | 12.6%), Italian (108 | 10.9%), and Russian (99 | 10.0%), together accounting for 67.3% of all Martin s Additions residents.
| Ancestry | # Population | % Population |
| American | 5 | 0.5% |
| Arab | 9 | 0.9% |
| Argentinean | 5 | 0.5% |
| Assyrian / Chaldean / Syriac | 4 | 0.4% |
| Austrian | 12 | 1.2% |
| Basque | 2 | 0.2% |
| British | 11 | 1.1% |
| Cajun | 2 | 0.2% |
| Central American | 23 | 2.3% |
| Colombian | 3 | 0.3% |
| Czech | 5 | 0.5% |
| Danish | 2 | 0.2% |
| Dutch | 19 | 1.9% |
| Eastern European | 19 | 1.9% |
| Ecuadorian | 1 | 0.1% |
| Egyptian | 3 | 0.3% |
| English | 125 | 12.6% |
| European | 21 | 2.1% |
| French | 14 | 1.4% |
| French Canadian | 5 | 0.5% |
| German | 160 | 16.1% |
| Greek | 2 | 0.2% |
| Guatemalan | 23 | 2.3% |
| Hungarian | 8 | 0.8% |
| Indian (Asian) | 3 | 0.3% |
| Iranian | 2 | 0.2% |
| Irish | 176 | 17.7% |
| Italian | 108 | 10.9% |
| Korean | 7 | 0.7% |
| Latvian | 19 | 1.9% |
| Lebanese | 4 | 0.4% |
| Lithuanian | 5 | 0.5% |
| Mexican | 2 | 0.2% |
| Northern European | 2 | 0.2% |
| Norwegian | 6 | 0.6% |
| Polish | 89 | 9.0% |
| Romanian | 1 | 0.1% |
| Russian | 99 | 10.0% |
| Scotch-Irish | 11 | 1.1% |
| Scottish | 24 | 2.4% |
| Slovak | 6 | 0.6% |
| Slovene | 21 | 2.1% |
| South American | 9 | 0.9% |
| Swedish | 16 | 1.6% |
| Swiss | 2 | 0.2% |
| Syrian | 8 | 0.8% |
| Thai | 5 | 0.5% |
| Tlingit-Haida | 2 | 0.2% |
| Turkish | 2 | 0.2% |
| Ukrainian | 22 | 2.2% |
| Welsh | 19 | 1.9% | View All 51 Rows |
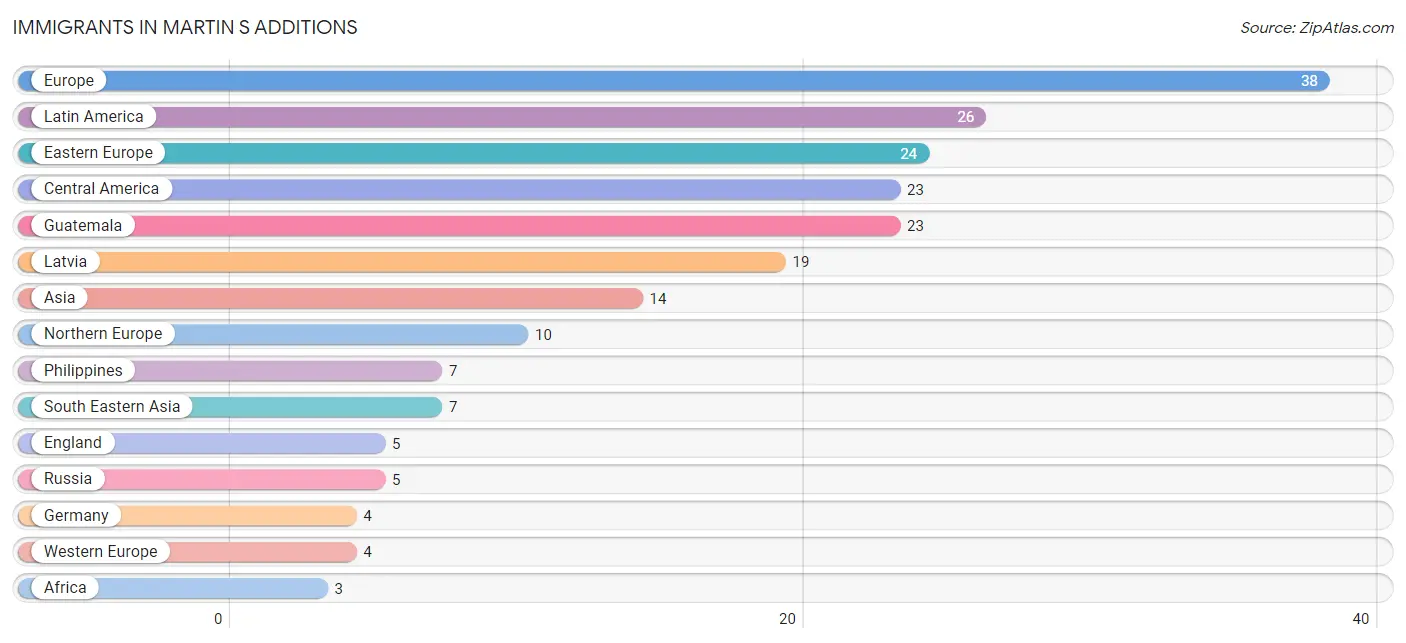
Immigrants in Martin s Additions
The most numerous immigrant groups reported in Martin s Additions came from Europe (38 | 3.8%), Latin America (26 | 2.6%), Eastern Europe (24 | 2.4%), Central America (23 | 2.3%), and Guatemala (23 | 2.3%), together accounting for 13.5% of all Martin s Additions residents.
| Immigration Origin | # Population | % Population |
| Africa | 3 | 0.3% |
| Argentina | 1 | 0.1% |
| Asia | 14 | 1.4% |
| Central America | 23 | 2.3% |
| China | 3 | 0.3% |
| Colombia | 1 | 0.1% |
| Eastern Asia | 3 | 0.3% |
| Eastern Europe | 24 | 2.4% |
| Ecuador | 1 | 0.1% |
| England | 5 | 0.5% |
| Europe | 38 | 3.8% |
| Germany | 4 | 0.4% |
| Guatemala | 23 | 2.3% |
| India | 2 | 0.2% |
| Ireland | 1 | 0.1% |
| Israel | 2 | 0.2% |
| Latin America | 26 | 2.6% |
| Latvia | 19 | 1.9% |
| Northern Europe | 10 | 1.0% |
| Philippines | 7 | 0.7% |
| Russia | 5 | 0.5% |
| South Africa | 3 | 0.3% |
| South America | 3 | 0.3% |
| South Central Asia | 2 | 0.2% |
| South Eastern Asia | 7 | 0.7% |
| Western Asia | 2 | 0.2% |
| Western Europe | 4 | 0.4% | View All 27 Rows |
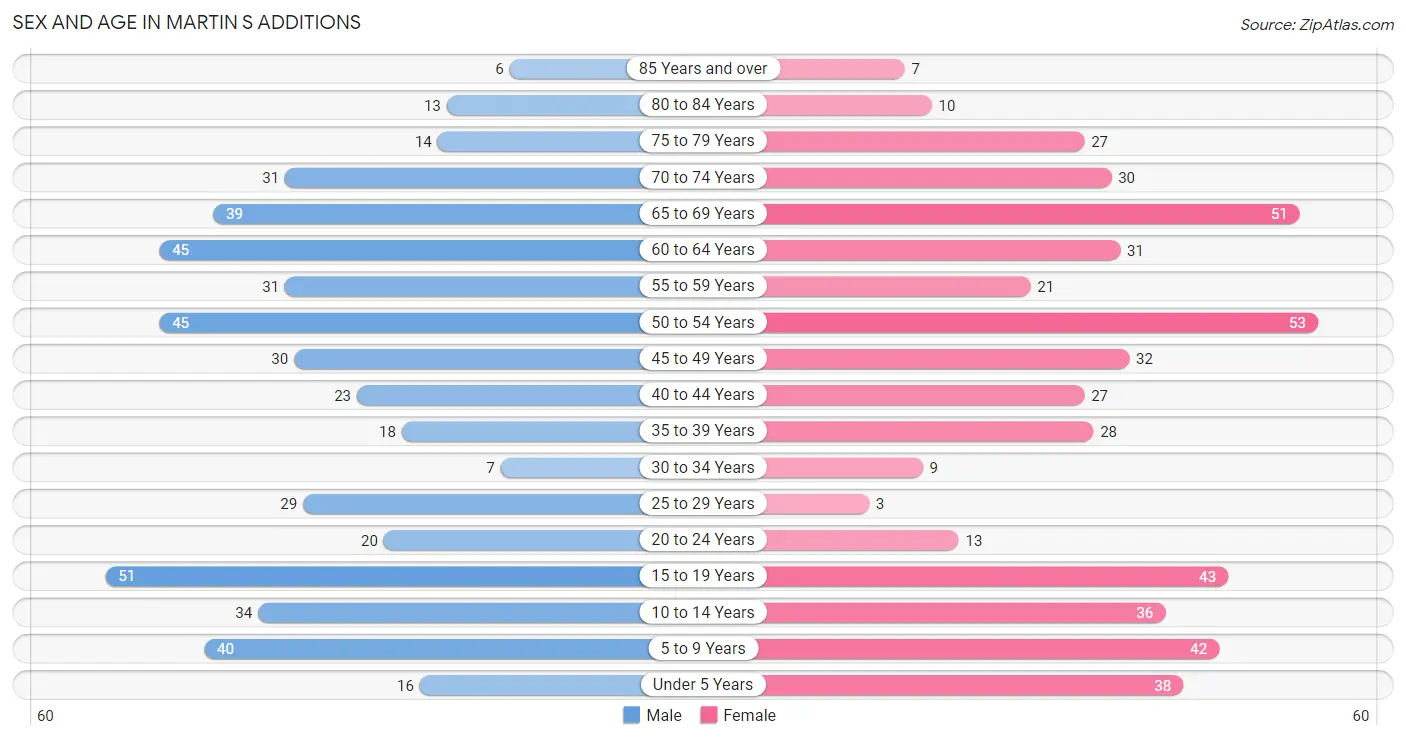
Sex and Age in Martin s Additions
Sex and Age in Martin s Additions
The most populous age groups in Martin s Additions are 15 to 19 Years (51 | 10.4%) for men and 50 to 54 Years (53 | 10.6%) for women.
| Age Bracket | Male | Female |
| Under 5 Years | 16 (3.3%) | 38 (7.6%) |
| 5 to 9 Years | 40 (8.1%) | 42 (8.4%) |
| 10 to 14 Years | 34 (6.9%) | 36 (7.2%) |
| 15 to 19 Years | 51 (10.4%) | 43 (8.6%) |
| 20 to 24 Years | 20 (4.1%) | 13 (2.6%) |
| 25 to 29 Years | 29 (5.9%) | 3 (0.6%) |
| 30 to 34 Years | 7 (1.4%) | 9 (1.8%) |
| 35 to 39 Years | 18 (3.7%) | 28 (5.6%) |
| 40 to 44 Years | 23 (4.7%) | 27 (5.4%) |
| 45 to 49 Years | 30 (6.1%) | 32 (6.4%) |
| 50 to 54 Years | 45 (9.1%) | 53 (10.6%) |
| 55 to 59 Years | 31 (6.3%) | 21 (4.2%) |
| 60 to 64 Years | 45 (9.1%) | 31 (6.2%) |
| 65 to 69 Years | 39 (7.9%) | 51 (10.2%) |
| 70 to 74 Years | 31 (6.3%) | 30 (6.0%) |
| 75 to 79 Years | 14 (2.9%) | 27 (5.4%) |
| 80 to 84 Years | 13 (2.6%) | 10 (2.0%) |
| 85 Years and over | 6 (1.2%) | 7 (1.4%) |
| Total | 492 (100.0%) | 501 (100.0%) |
Families and Households in Martin s Additions
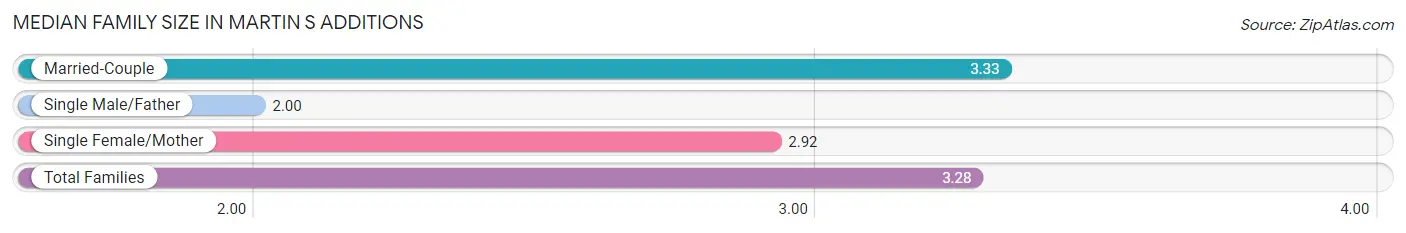
Median Family Size in Martin s Additions
The median family size in Martin s Additions is 3.28 persons per family, with married-couple families (252 | 90.0%) accounting for the largest median family size of 3.33 persons per family. On the other hand, single male/father families (4 | 1.4%) represent the smallest median family size with 2.00 persons per family.
| Family Type | # Families | Family Size |
| Married-Couple | 252 (90.0%) | 3.33 |
| Single Male/Father | 4 (1.4%) | 2.00 |
| Single Female/Mother | 24 (8.6%) | 2.92 |
| Total Families | 280 (100.0%) | 3.28 |
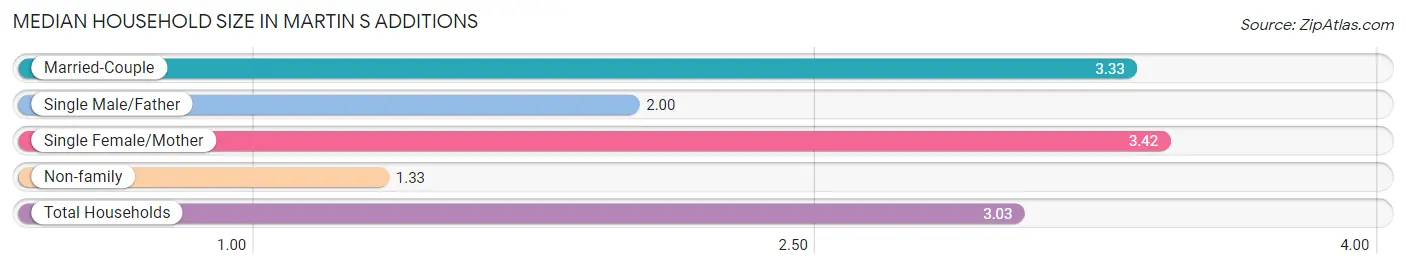
Median Household Size in Martin s Additions
The median household size in Martin s Additions is 3.03 persons per household, with single female/mother households (24 | 7.3%) accounting for the largest median household size of 3.42 persons per household. non-family households (48 | 14.6%) represent the smallest median household size with 1.33 persons per household.
| Household Type | # Households | Household Size |
| Married-Couple | 252 (76.8%) | 3.33 |
| Single Male/Father | 4 (1.2%) | 2.00 |
| Single Female/Mother | 24 (7.3%) | 3.42 |
| Non-family | 48 (14.6%) | 1.33 |
| Total Households | 328 (100.0%) | 3.03 |
Household Size by Marriage Status in Martin s Additions
Out of a total of 328 households in Martin s Additions, 280 (85.4%) are family households, while 48 (14.6%) are nonfamily households. The most numerous type of family households are 2-person households, comprising 105, and the most common type of nonfamily households are 1-person households, comprising 37.
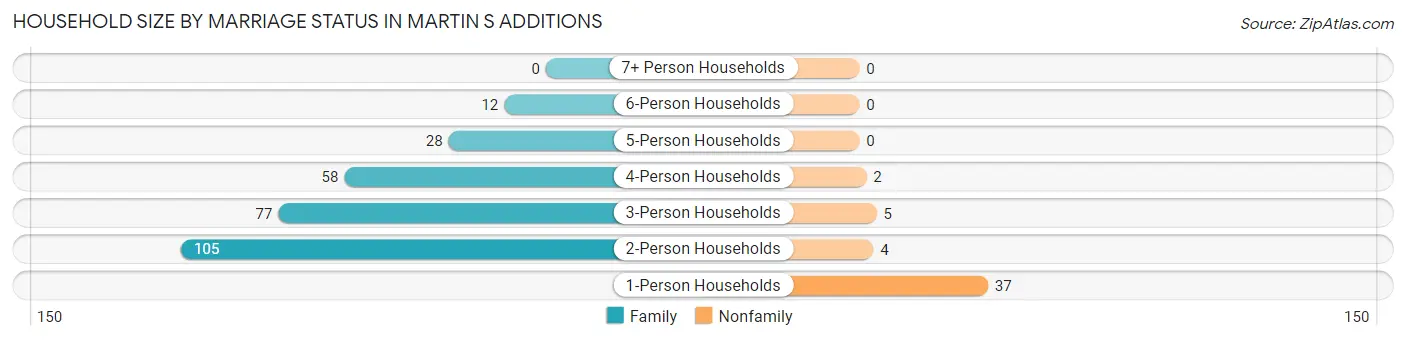
| Household Size | Family Households | Nonfamily Households |
| 1-Person Households | - | 37 (11.3%) |
| 2-Person Households | 105 (32.0%) | 4 (1.2%) |
| 3-Person Households | 77 (23.5%) | 5 (1.5%) |
| 4-Person Households | 58 (17.7%) | 2 (0.6%) |
| 5-Person Households | 28 (8.5%) | 0 (0.0%) |
| 6-Person Households | 12 (3.7%) | 0 (0.0%) |
| 7+ Person Households | 0 (0.0%) | 0 (0.0%) |
| Total | 280 (85.4%) | 48 (14.6%) |
Female Fertility in Martin s Additions
Fertility by Age in Martin s Additions
Average fertility rate in Martin s Additions is 65.0 births per 1,000 women. Women in the age bracket of 35 to 50 years have the highest fertility rate with 108.0 births per 1,000 women. Women in the age bracket of 35 to 50 years acount for 100.0% of all women with births.
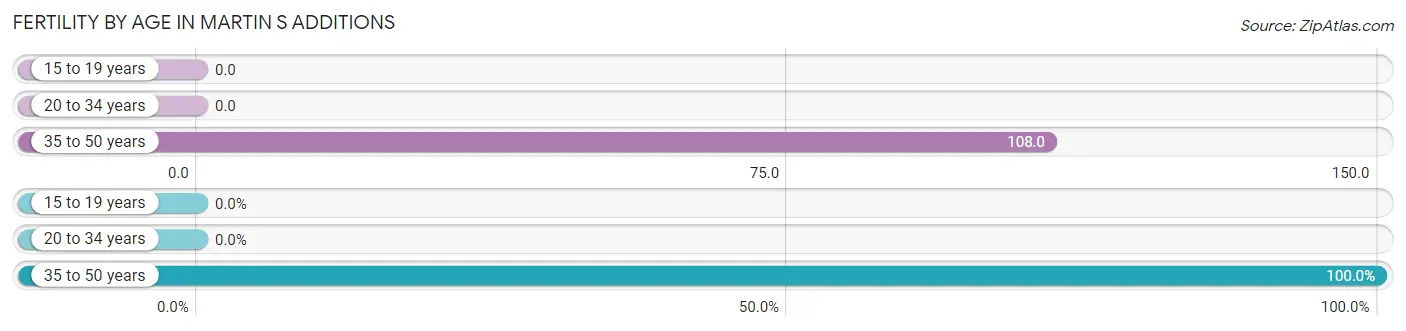
| Age Bracket | Women with Births | Births / 1,000 Women |
| 15 to 19 years | 0 (0.0%) | 0.0 |
| 20 to 34 years | 0 (0.0%) | 0.0 |
| 35 to 50 years | 11 (100.0%) | 108.0 |
| Total | 11 (100.0%) | 65.0 |
Fertility by Age by Marriage Status in Martin s Additions
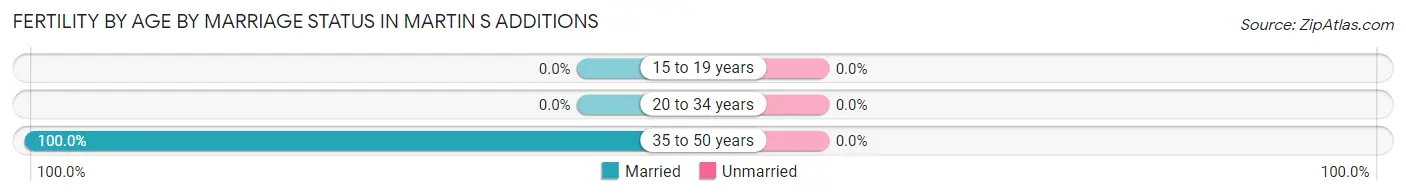
| Age Bracket | Married | Unmarried |
| 15 to 19 years | 0 (0.0%) | 0 (0.0%) |
| 20 to 34 years | 0 (0.0%) | 0 (0.0%) |
| 35 to 50 years | 11 (100.0%) | 0 (0.0%) |
| Total | 11 (100.0%) | 0 (0.0%) |
Fertility by Education in Martin s Additions
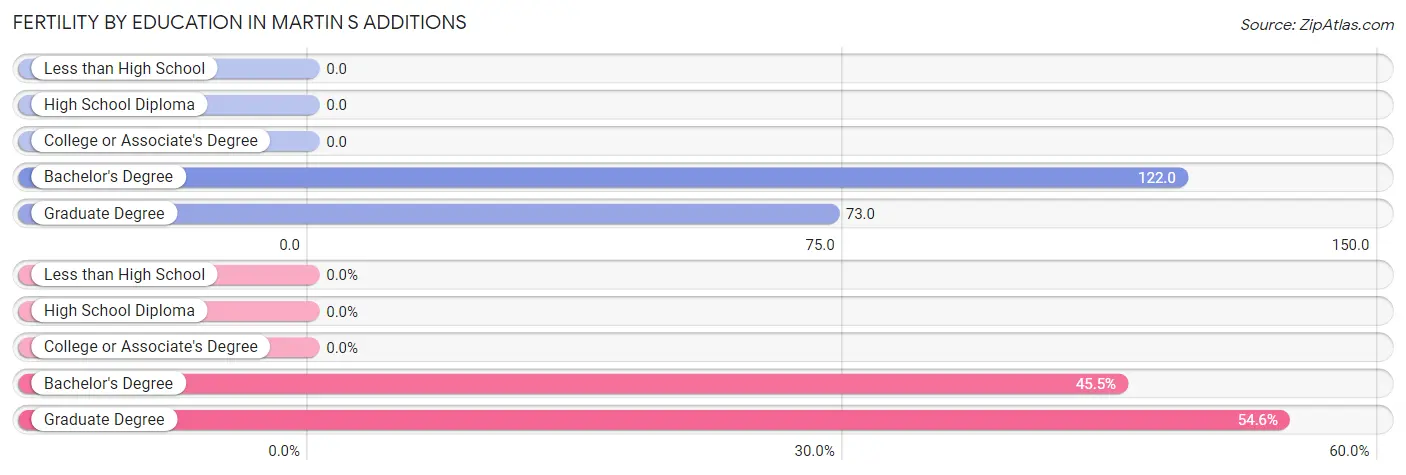
| Educational Attainment | Women with Births | Births / 1,000 Women |
| Less than High School | 0 (0.0%) | 0.0 |
| High School Diploma | 0 (0.0%) | 0.0 |
| College or Associate's Degree | 0 (0.0%) | 0.0 |
| Bachelor's Degree | 5 (45.5%) | 122.0 |
| Graduate Degree | 6 (54.5%) | 73.0 |
| Total | 11 (100.0%) | 65.0 |
Fertility by Education by Marriage Status in Martin s Additions
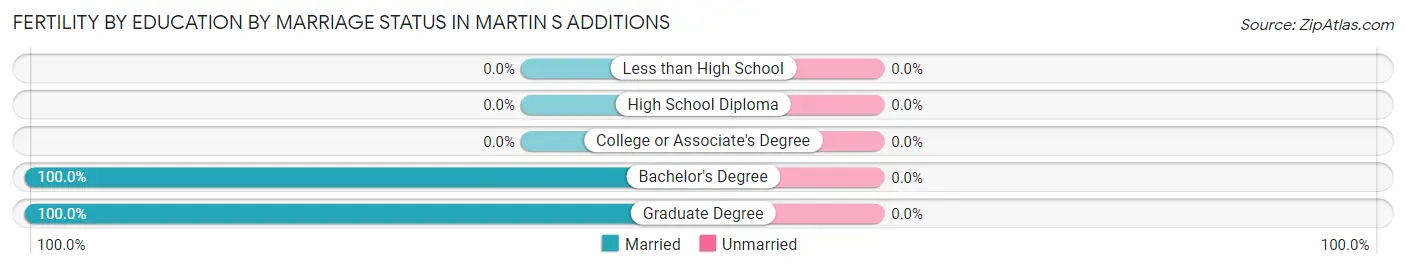
| Educational Attainment | Married | Unmarried |
| Less than High School | 0 (0.0%) | 0 (0.0%) |
| High School Diploma | 0 (0.0%) | 0 (0.0%) |
| College or Associate's Degree | 0 (0.0%) | 0 (0.0%) |
| Bachelor's Degree | 5 (100.0%) | 0 (0.0%) |
| Graduate Degree | 6 (100.0%) | 0 (0.0%) |
| Total | 11 (100.0%) | 0 (0.0%) |
Employment Characteristics in Martin s Additions
Employment by Class of Employer in Martin s Additions
Among the 474 employed individuals in Martin s Additions, private company employees (267 | 56.3%), self-employed (not incorporated) (50 | 10.5%), and federal government employees (38 | 8.0%) make up the most common classes of employment.
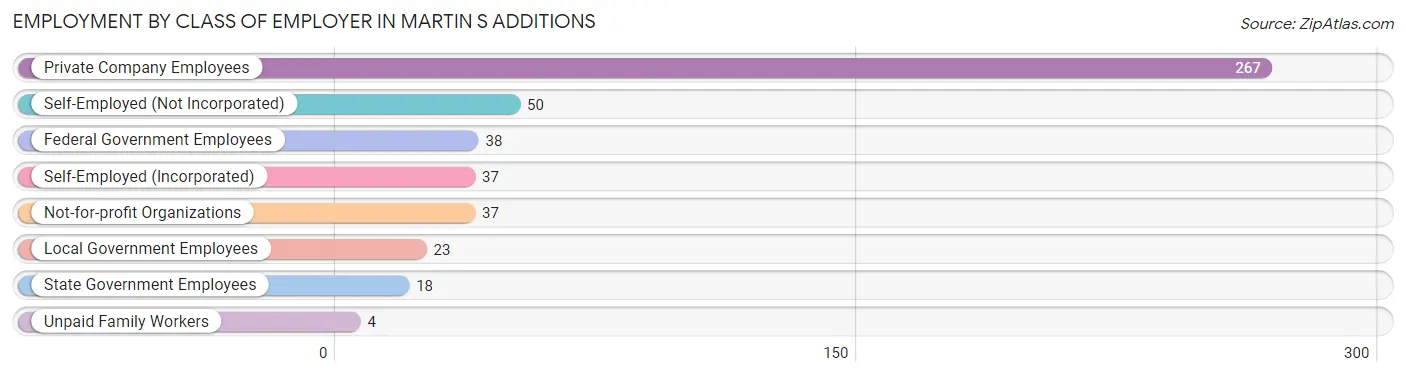
| Employer Class | # Employees | % Employees |
| Private Company Employees | 267 | 56.3% |
| Self-Employed (Incorporated) | 37 | 7.8% |
| Self-Employed (Not Incorporated) | 50 | 10.5% |
| Not-for-profit Organizations | 37 | 7.8% |
| Local Government Employees | 23 | 4.9% |
| State Government Employees | 18 | 3.8% |
| Federal Government Employees | 38 | 8.0% |
| Unpaid Family Workers | 4 | 0.8% |
| Total | 474 | 100.0% |
Employment Status by Age in Martin s Additions
According to the labor force statistics for Martin s Additions, out of the total population over 16 years of age (776), 65.1% or 505 individuals are in the labor force, with 0.6% or 3 of them unemployed. The age group with the highest labor force participation rate is 25 to 29 years, with 100.0% or 32 individuals in the labor force. Within the labor force, the 65 to 74 years age range has the highest percentage of unemployed individuals, with 2.5% or 2 of them being unemployed.
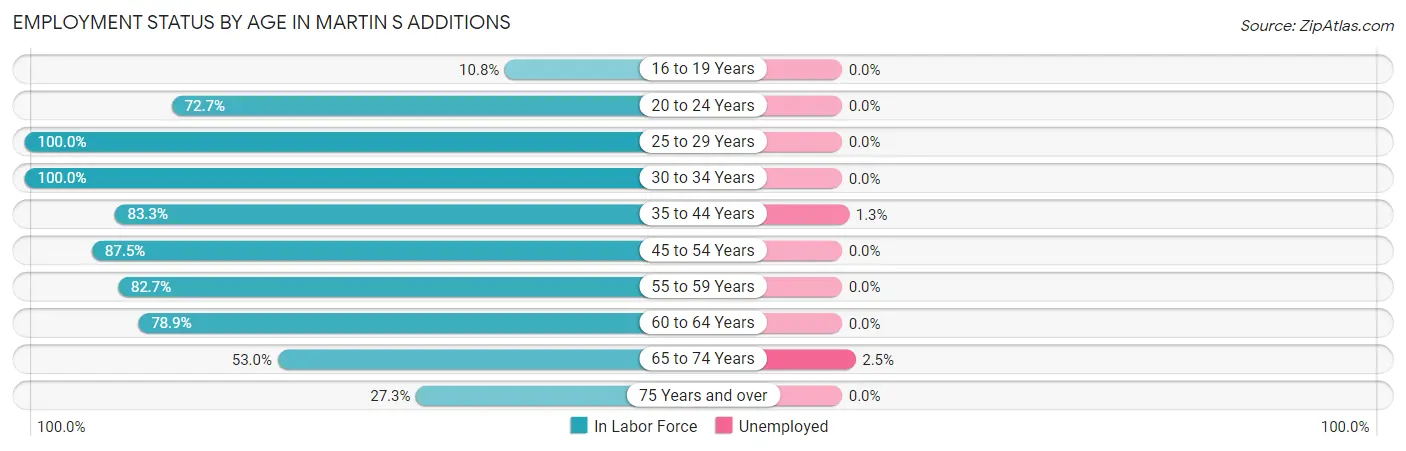
| Age Bracket | In Labor Force | Unemployed |
| 16 to 19 Years | 9 (10.8%) | 0 (0.0%) |
| 20 to 24 Years | 24 (72.7%) | 0 (0.0%) |
| 25 to 29 Years | 32 (100.0%) | 0 (0.0%) |
| 30 to 34 Years | 16 (100.0%) | 0 (0.0%) |
| 35 to 44 Years | 80 (83.3%) | 1 (1.3%) |
| 45 to 54 Years | 140 (87.5%) | 0 (0.0%) |
| 55 to 59 Years | 43 (82.7%) | 0 (0.0%) |
| 60 to 64 Years | 60 (78.9%) | 0 (0.0%) |
| 65 to 74 Years | 80 (53.0%) | 2 (2.5%) |
| 75 Years and over | 21 (27.3%) | 0 (0.0%) |
| Total | 505 (65.1%) | 3 (0.6%) |
Employment Status by Educational Attainment in Martin s Additions
According to labor force statistics for Martin s Additions, 85.9% of individuals (371) out of the total population between 25 and 64 years of age (432) are in the labor force, with 0.3% or 1 of them being unemployed. The group with the highest labor force participation rate are those with the educational attainment of high school diploma, with 100.0% or 3 individuals in the labor force. Within the labor force, individuals with bachelor's degree or higher education have the highest percentage of unemployment, with 0.3% or 1 of them being unemployed.
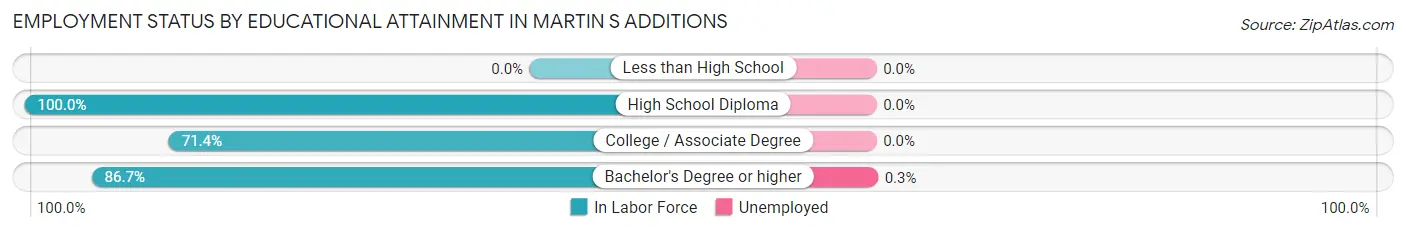
| Educational Attainment | In Labor Force | Unemployed |
| Less than High School | 0 (0.0%) | 0 (0.0%) |
| High School Diploma | 3 (100.0%) | 0 (0.0%) |
| College / Associate Degree | 10 (71.4%) | 0 (0.0%) |
| Bachelor's Degree or higher | 358 (86.7%) | 1 (0.3%) |
| Total | 371 (85.9%) | 1 (0.3%) |
Employment Occupations by Sex in Martin s Additions
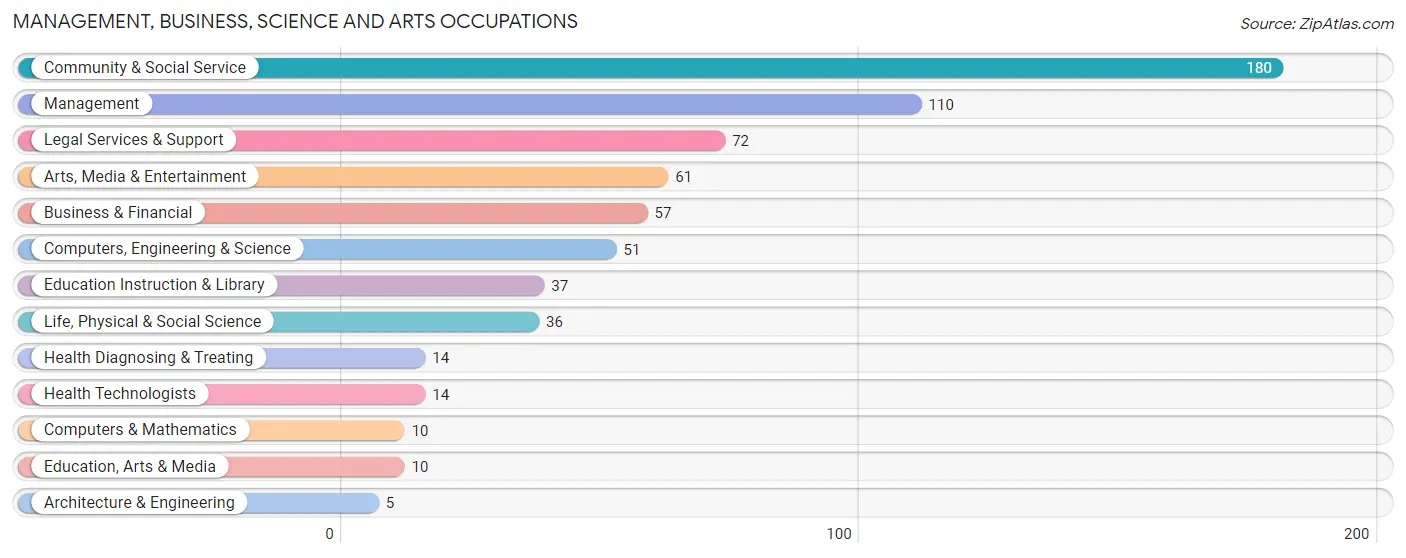
Management, Business, Science and Arts Occupations
The most common Management, Business, Science and Arts occupations in Martin s Additions are Community & Social Service (180 | 35.9%), Management (110 | 21.9%), Legal Services & Support (72 | 14.3%), Arts, Media & Entertainment (61 | 12.1%), and Business & Financial (57 | 11.4%).
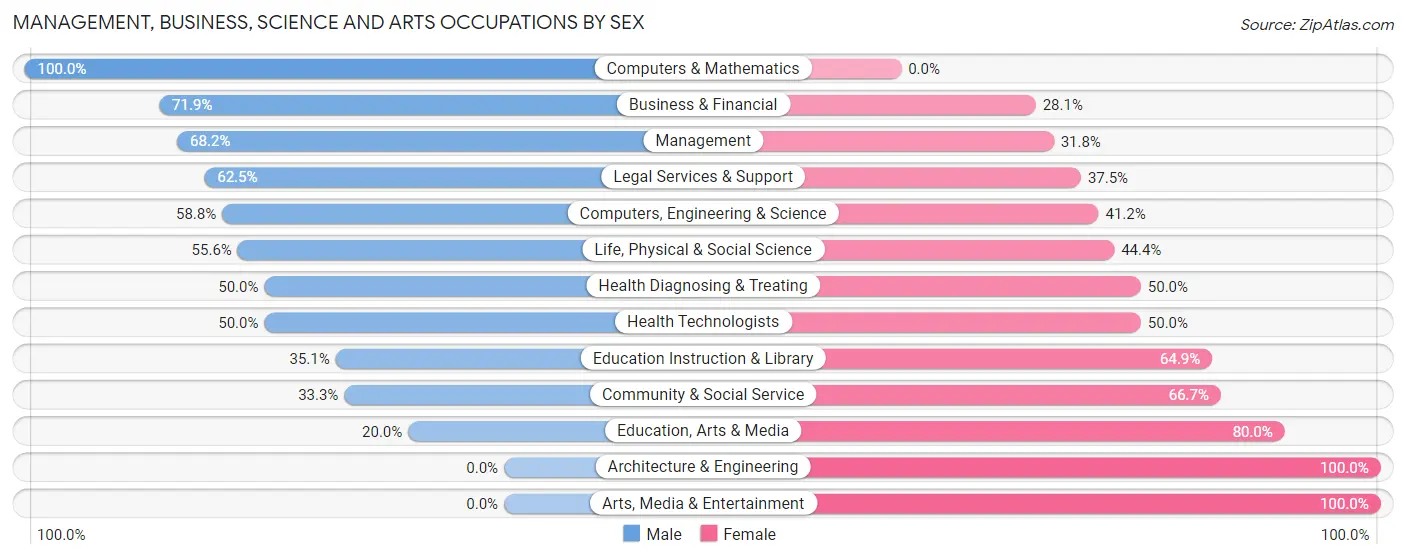
Management, Business, Science and Arts Occupations by Sex
Within the Management, Business, Science and Arts occupations in Martin s Additions, the most male-oriented occupations are Computers & Mathematics (100.0%), Business & Financial (71.9%), and Management (68.2%), while the most female-oriented occupations are Architecture & Engineering (100.0%), Arts, Media & Entertainment (100.0%), and Education, Arts & Media (80.0%).
| Occupation | Male | Female |
| Management | 75 (68.2%) | 35 (31.8%) |
| Business & Financial | 41 (71.9%) | 16 (28.1%) |
| Computers, Engineering & Science | 30 (58.8%) | 21 (41.2%) |
| Computers & Mathematics | 10 (100.0%) | 0 (0.0%) |
| Architecture & Engineering | 0 (0.0%) | 5 (100.0%) |
| Life, Physical & Social Science | 20 (55.6%) | 16 (44.4%) |
| Community & Social Service | 60 (33.3%) | 120 (66.7%) |
| Education, Arts & Media | 2 (20.0%) | 8 (80.0%) |
| Legal Services & Support | 45 (62.5%) | 27 (37.5%) |
| Education Instruction & Library | 13 (35.1%) | 24 (64.9%) |
| Arts, Media & Entertainment | 0 (0.0%) | 61 (100.0%) |
| Health Diagnosing & Treating | 7 (50.0%) | 7 (50.0%) |
| Health Technologists | 7 (50.0%) | 7 (50.0%) |
| Total (Category) | 213 (51.7%) | 199 (48.3%) |
| Total (Overall) | 282 (56.2%) | 220 (43.8%) |
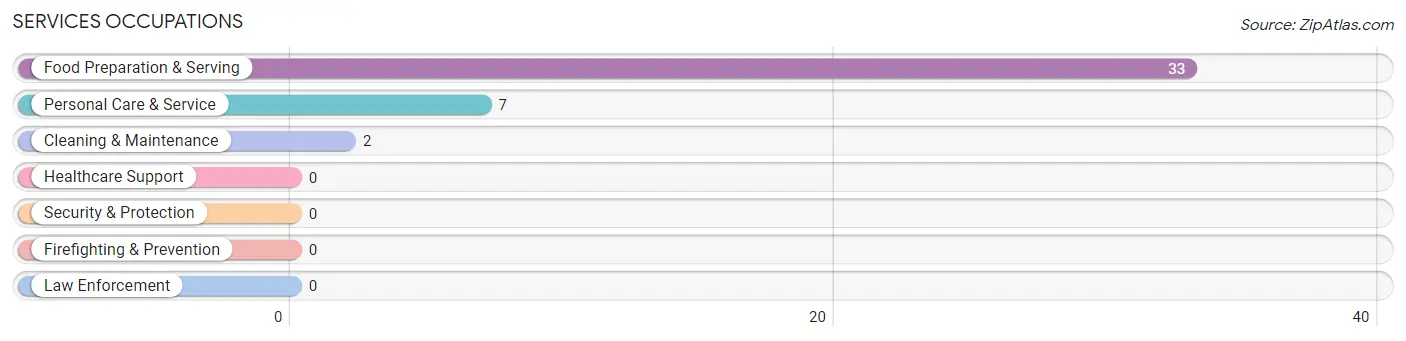
Services Occupations
The most common Services occupations in Martin s Additions are Food Preparation & Serving (33 | 6.6%), Personal Care & Service (7 | 1.4%), and Cleaning & Maintenance (2 | 0.4%).
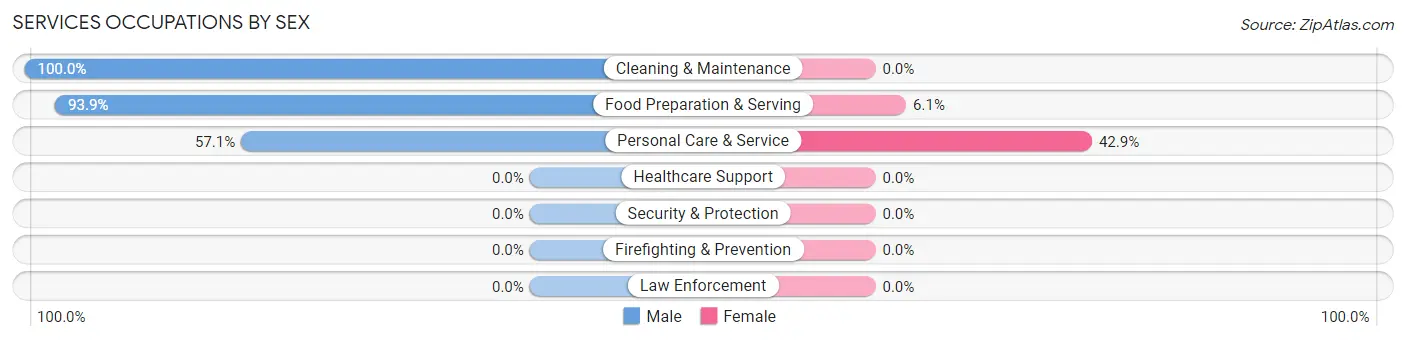
Services Occupations by Sex
Within the Services occupations in Martin s Additions, the most male-oriented occupations are Cleaning & Maintenance (100.0%), Food Preparation & Serving (93.9%), and Personal Care & Service (57.1%), while the most female-oriented occupations are Personal Care & Service (42.9%), and Food Preparation & Serving (6.1%).
| Occupation | Male | Female |
| Healthcare Support | 0 (0.0%) | 0 (0.0%) |
| Security & Protection | 0 (0.0%) | 0 (0.0%) |
| Firefighting & Prevention | 0 (0.0%) | 0 (0.0%) |
| Law Enforcement | 0 (0.0%) | 0 (0.0%) |
| Food Preparation & Serving | 31 (93.9%) | 2 (6.1%) |
| Cleaning & Maintenance | 2 (100.0%) | 0 (0.0%) |
| Personal Care & Service | 4 (57.1%) | 3 (42.9%) |
| Total (Category) | 37 (88.1%) | 5 (11.9%) |
| Total (Overall) | 282 (56.2%) | 220 (43.8%) |
Sales and Office Occupations
The most common Sales and Office occupations in Martin s Additions are Sales & Related (30 | 6.0%), and Office & Administration (9 | 1.8%).
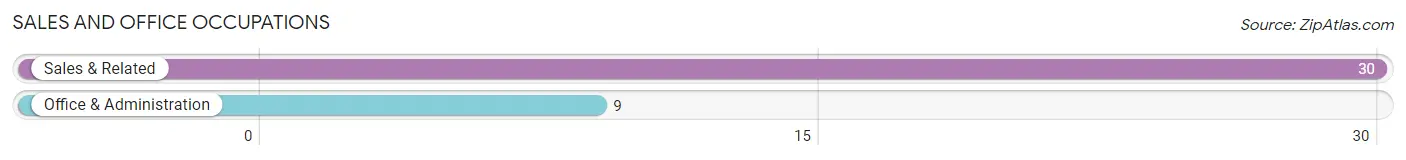
Sales and Office Occupations by Sex
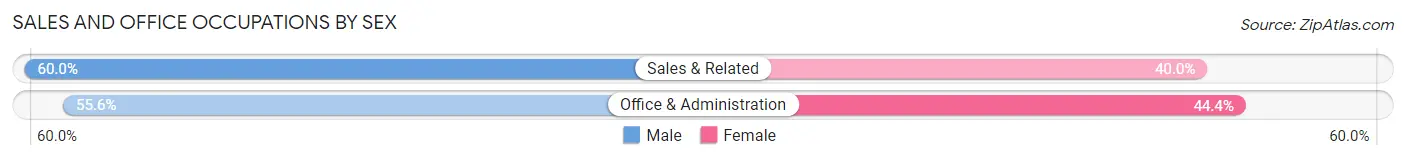
| Occupation | Male | Female |
| Sales & Related | 18 (60.0%) | 12 (40.0%) |
| Office & Administration | 5 (55.6%) | 4 (44.4%) |
| Total (Category) | 23 (59.0%) | 16 (41.0%) |
| Total (Overall) | 282 (56.2%) | 220 (43.8%) |
Natural Resources, Construction and Maintenance Occupations
The most common Natural Resources, Construction and Maintenance occupations in Martin s Additions are Construction & Extraction (5 | 1.0%), and Installation, Maintenance & Repair (2 | 0.4%).
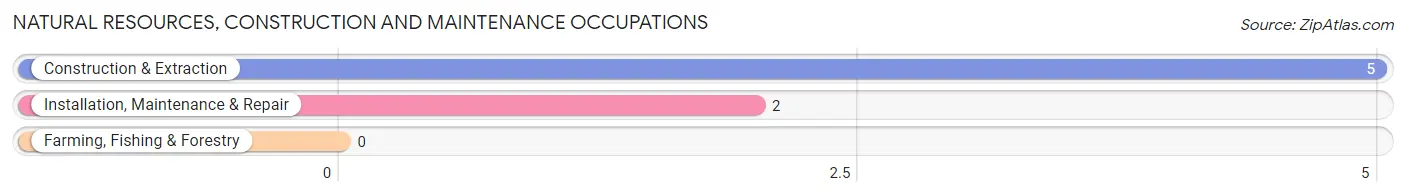
Natural Resources, Construction and Maintenance Occupations by Sex
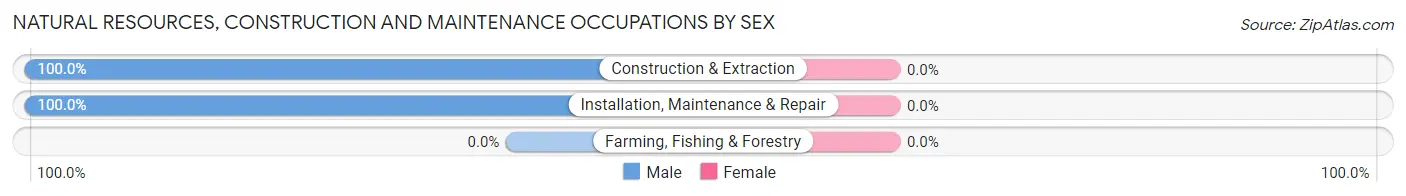
| Occupation | Male | Female |
| Farming, Fishing & Forestry | 0 (0.0%) | 0 (0.0%) |
| Construction & Extraction | 5 (100.0%) | 0 (0.0%) |
| Installation, Maintenance & Repair | 2 (100.0%) | 0 (0.0%) |
| Total (Category) | 7 (100.0%) | 0 (0.0%) |
| Total (Overall) | 282 (56.2%) | 220 (43.8%) |
Production, Transportation and Moving Occupations
The most common Production, Transportation and Moving occupations in Martin s Additions are Transportation (1 | 0.2%), and Material Moving (1 | 0.2%).
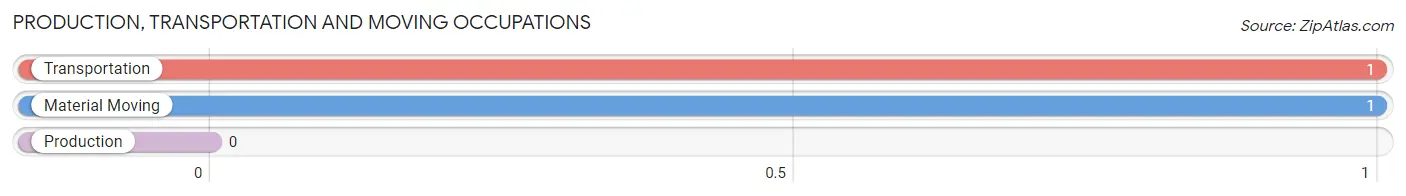
Production, Transportation and Moving Occupations by Sex
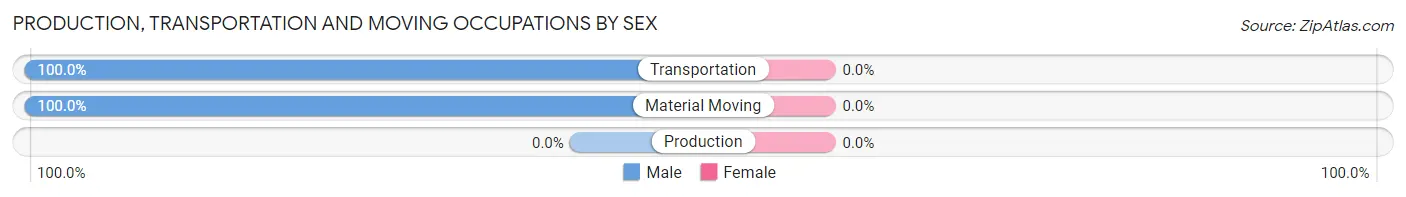
| Occupation | Male | Female |
| Production | 0 (0.0%) | 0 (0.0%) |
| Transportation | 1 (100.0%) | 0 (0.0%) |
| Material Moving | 1 (100.0%) | 0 (0.0%) |
| Total (Category) | 2 (100.0%) | 0 (0.0%) |
| Total (Overall) | 282 (56.2%) | 220 (43.8%) |
Employment Industries by Sex in Martin s Additions
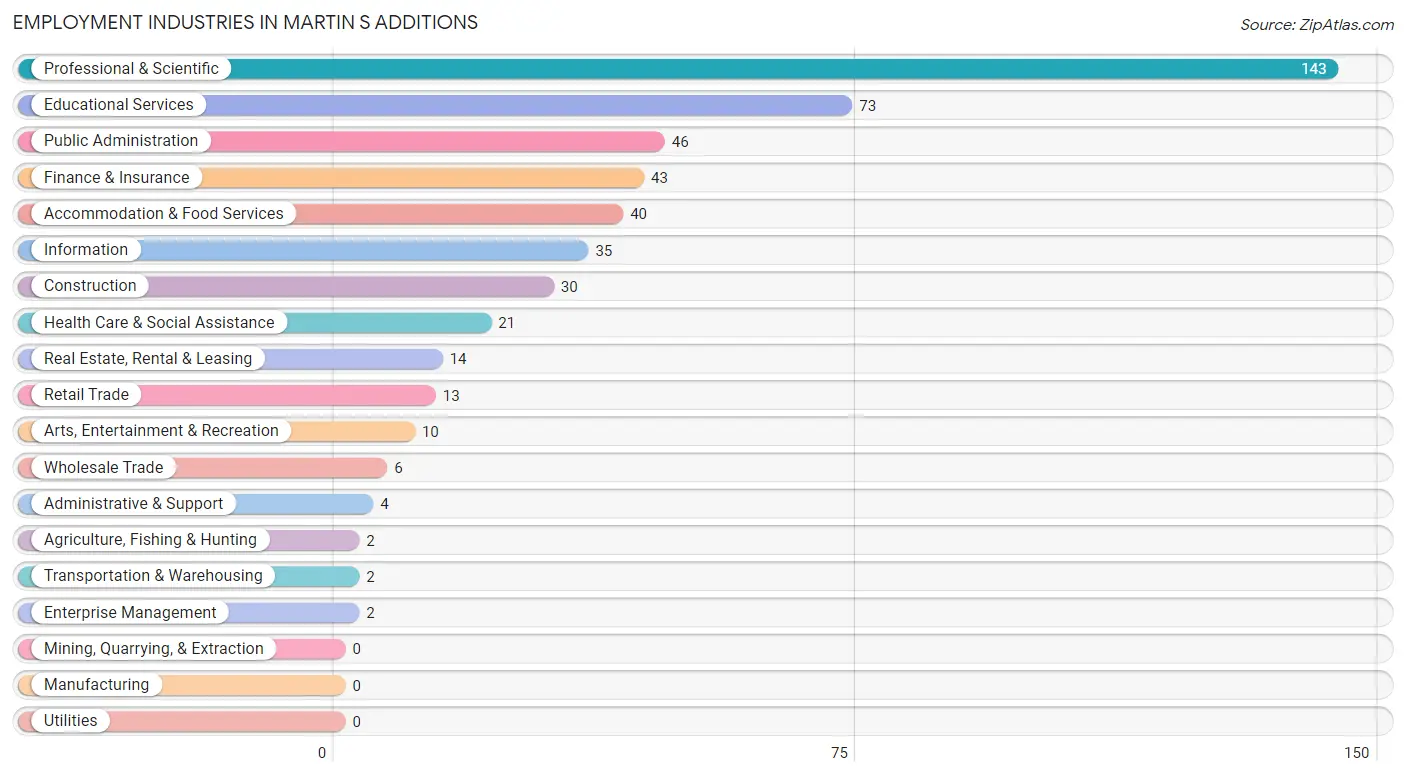
Employment Industries in Martin s Additions
The major employment industries in Martin s Additions include Professional & Scientific (143 | 28.5%), Educational Services (73 | 14.5%), Public Administration (46 | 9.2%), Finance & Insurance (43 | 8.6%), and Accommodation & Food Services (40 | 8.0%).
Employment Industries by Sex in Martin s Additions
The Martin s Additions industries that see more men than women are Transportation & Warehousing (100.0%), Enterprise Management (100.0%), and Administrative & Support (100.0%), whereas the industries that tend to have a higher number of women are Agriculture, Fishing & Hunting (100.0%), Arts, Entertainment & Recreation (100.0%), and Educational Services (84.9%).
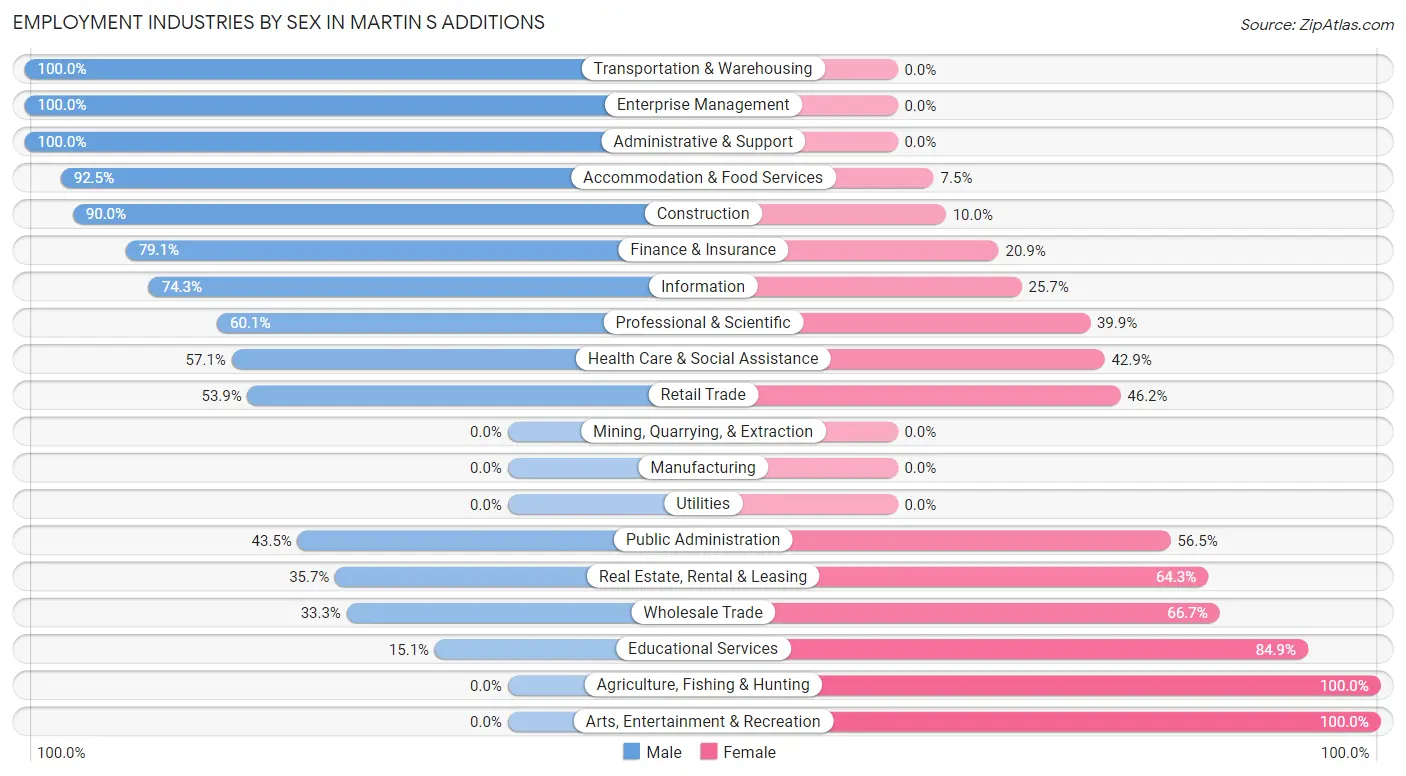
| Industry | Male | Female |
| Agriculture, Fishing & Hunting | 0 (0.0%) | 2 (100.0%) |
| Mining, Quarrying, & Extraction | 0 (0.0%) | 0 (0.0%) |
| Construction | 27 (90.0%) | 3 (10.0%) |
| Manufacturing | 0 (0.0%) | 0 (0.0%) |
| Wholesale Trade | 2 (33.3%) | 4 (66.7%) |
| Retail Trade | 7 (53.8%) | 6 (46.2%) |
| Transportation & Warehousing | 2 (100.0%) | 0 (0.0%) |
| Utilities | 0 (0.0%) | 0 (0.0%) |
| Information | 26 (74.3%) | 9 (25.7%) |
| Finance & Insurance | 34 (79.1%) | 9 (20.9%) |
| Real Estate, Rental & Leasing | 5 (35.7%) | 9 (64.3%) |
| Professional & Scientific | 86 (60.1%) | 57 (39.9%) |
| Enterprise Management | 2 (100.0%) | 0 (0.0%) |
| Administrative & Support | 4 (100.0%) | 0 (0.0%) |
| Educational Services | 11 (15.1%) | 62 (84.9%) |
| Health Care & Social Assistance | 12 (57.1%) | 9 (42.9%) |
| Arts, Entertainment & Recreation | 0 (0.0%) | 10 (100.0%) |
| Accommodation & Food Services | 37 (92.5%) | 3 (7.5%) |
| Public Administration | 20 (43.5%) | 26 (56.5%) |
| Total | 282 (56.2%) | 220 (43.8%) |
Education in Martin s Additions
School Enrollment in Martin s Additions
The most common levels of schooling among the 287 students in Martin s Additions are high school (78 | 27.2%), middle school (61 | 21.2%), and elementary school (50 | 17.4%).
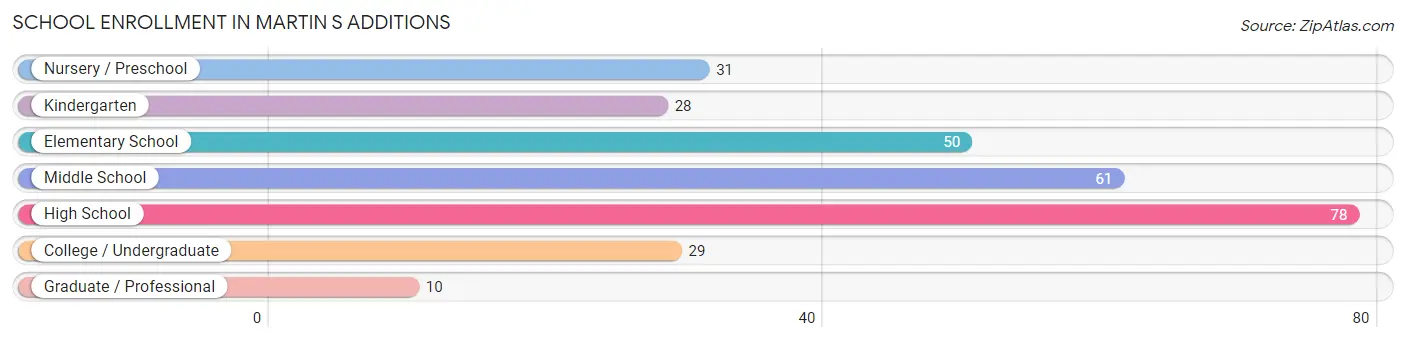
| School Level | # Students | % Students |
| Nursery / Preschool | 31 | 10.8% |
| Kindergarten | 28 | 9.8% |
| Elementary School | 50 | 17.4% |
| Middle School | 61 | 21.2% |
| High School | 78 | 27.2% |
| College / Undergraduate | 29 | 10.1% |
| Graduate / Professional | 10 | 3.5% |
| Total | 287 | 100.0% |
School Enrollment by Age by Funding Source in Martin s Additions
Out of a total of 287 students who are enrolled in schools in Martin s Additions, 128 (44.6%) attend a private institution, while the remaining 159 (55.4%) are enrolled in public schools. The age group of 25 to 34 year olds has the highest likelihood of being enrolled in private schools, with 1 (100.0% in the age bracket) enrolled. Conversely, the age group of 20 to 24 year olds has the lowest likelihood of being enrolled in a private school, with 15 (100.0% in the age bracket) attending a public institution.
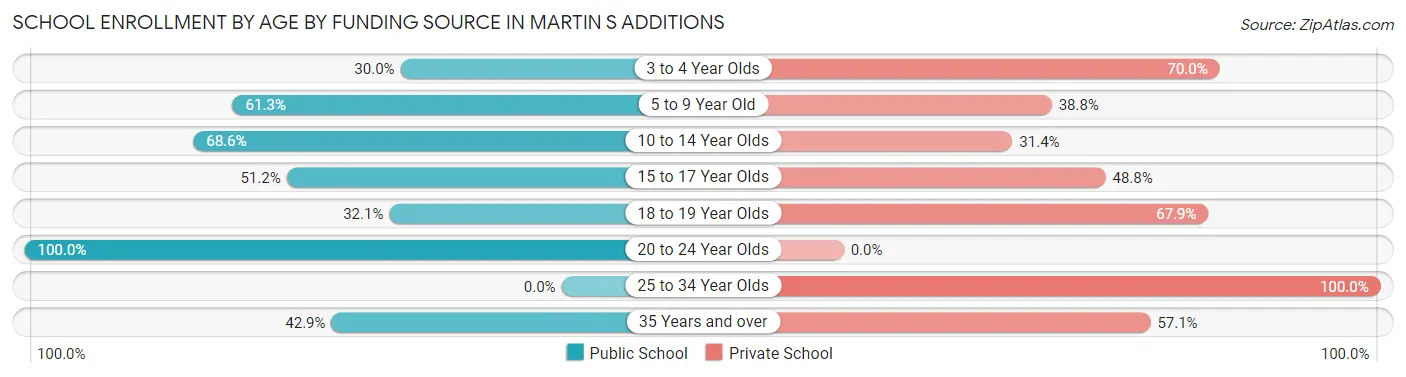
| Age Bracket | Public School | Private School |
| 3 to 4 Year Olds | 6 (30.0%) | 14 (70.0%) |
| 5 to 9 Year Old | 49 (61.3%) | 31 (38.8%) |
| 10 to 14 Year Olds | 48 (68.6%) | 22 (31.4%) |
| 15 to 17 Year Olds | 21 (51.2%) | 20 (48.8%) |
| 18 to 19 Year Olds | 17 (32.1%) | 36 (67.9%) |
| 20 to 24 Year Olds | 15 (100.0%) | 0 (0.0%) |
| 25 to 34 Year Olds | 0 (0.0%) | 1 (100.0%) |
| 35 Years and over | 3 (42.9%) | 4 (57.1%) |
| Total | 159 (55.4%) | 128 (44.6%) |
Educational Attainment by Field of Study in Martin s Additions
Social sciences (192 | 28.9%), liberal arts & history (92 | 13.9%), literature & languages (82 | 12.3%), business (55 | 8.3%), and psychology (41 | 6.2%) are the most common fields of study among 664 individuals in Martin s Additions who have obtained a bachelor's degree or higher.
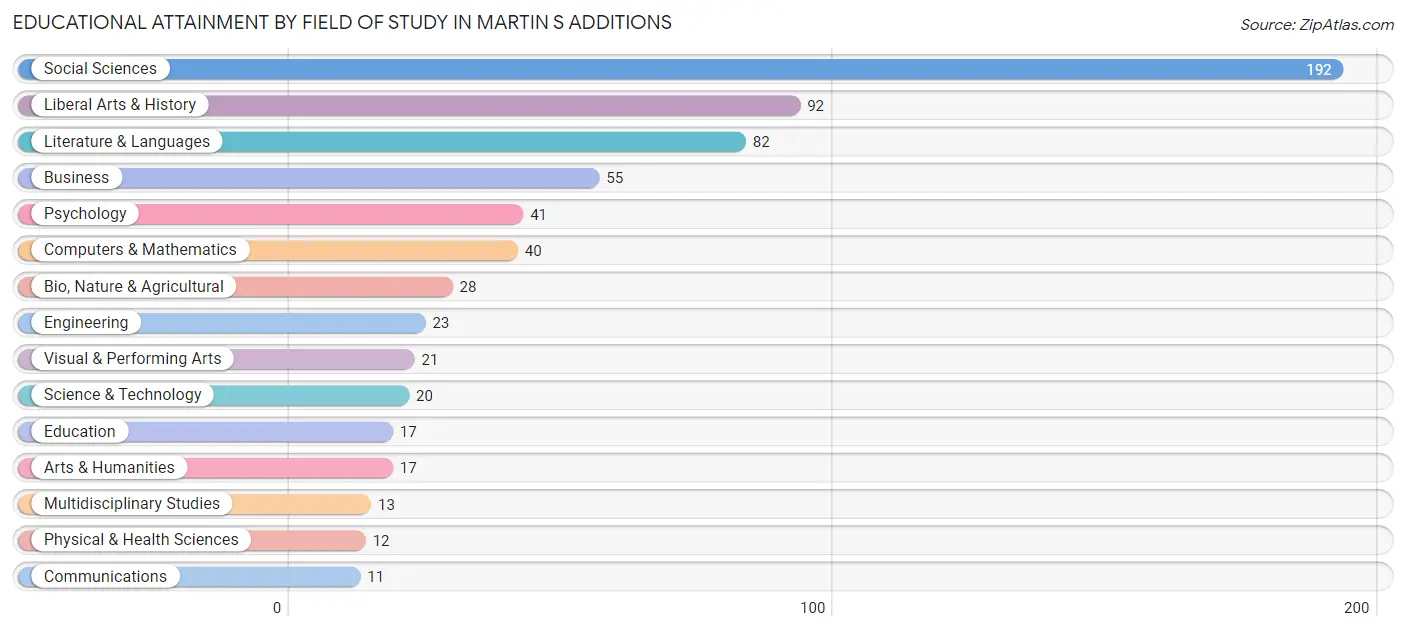
| Field of Study | # Graduates | % Graduates |
| Computers & Mathematics | 40 | 6.0% |
| Bio, Nature & Agricultural | 28 | 4.2% |
| Physical & Health Sciences | 12 | 1.8% |
| Psychology | 41 | 6.2% |
| Social Sciences | 192 | 28.9% |
| Engineering | 23 | 3.5% |
| Multidisciplinary Studies | 13 | 2.0% |
| Science & Technology | 20 | 3.0% |
| Business | 55 | 8.3% |
| Education | 17 | 2.6% |
| Literature & Languages | 82 | 12.3% |
| Liberal Arts & History | 92 | 13.9% |
| Visual & Performing Arts | 21 | 3.2% |
| Communications | 11 | 1.7% |
| Arts & Humanities | 17 | 2.6% |
| Total | 664 | 100.0% |
Transportation & Commute in Martin s Additions
Vehicle Availability by Sex in Martin s Additions
The most prevalent vehicle ownership categories in Martin s Additions are males with 2 vehicles (142, accounting for 55.0%) and females with 2 vehicles (125, making up 65.7%).
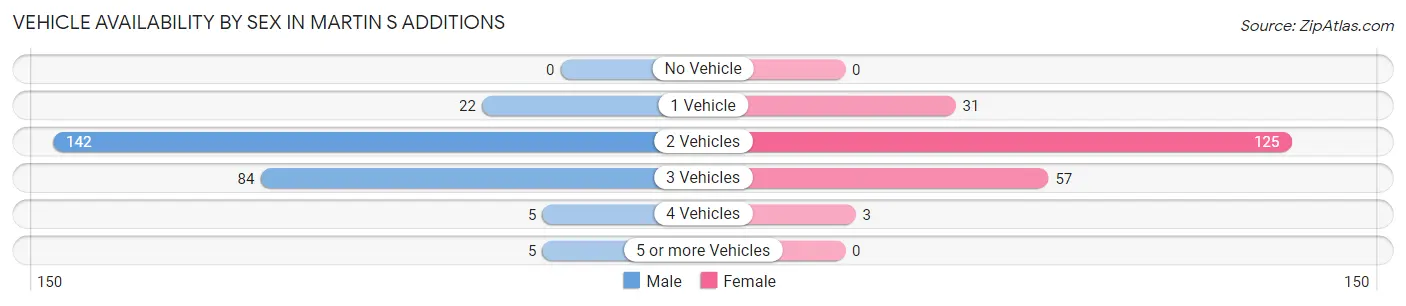
| Vehicles Available | Male | Female |
| No Vehicle | 0 (0.0%) | 0 (0.0%) |
| 1 Vehicle | 22 (8.5%) | 31 (14.3%) |
| 2 Vehicles | 142 (55.0%) | 125 (57.9%) |
| 3 Vehicles | 84 (32.6%) | 57 (26.4%) |
| 4 Vehicles | 5 (1.9%) | 3 (1.4%) |
| 5 or more Vehicles | 5 (1.9%) | 0 (0.0%) |
| Total | 258 (100.0%) | 216 (100.0%) |
Commute Time in Martin s Additions
The most frequently occuring commute durations in Martin s Additions are 15 to 19 minutes (67 commuters, 21.3%), 30 to 34 minutes (44 commuters, 14.0%), and 45 to 59 minutes (39 commuters, 12.4%).
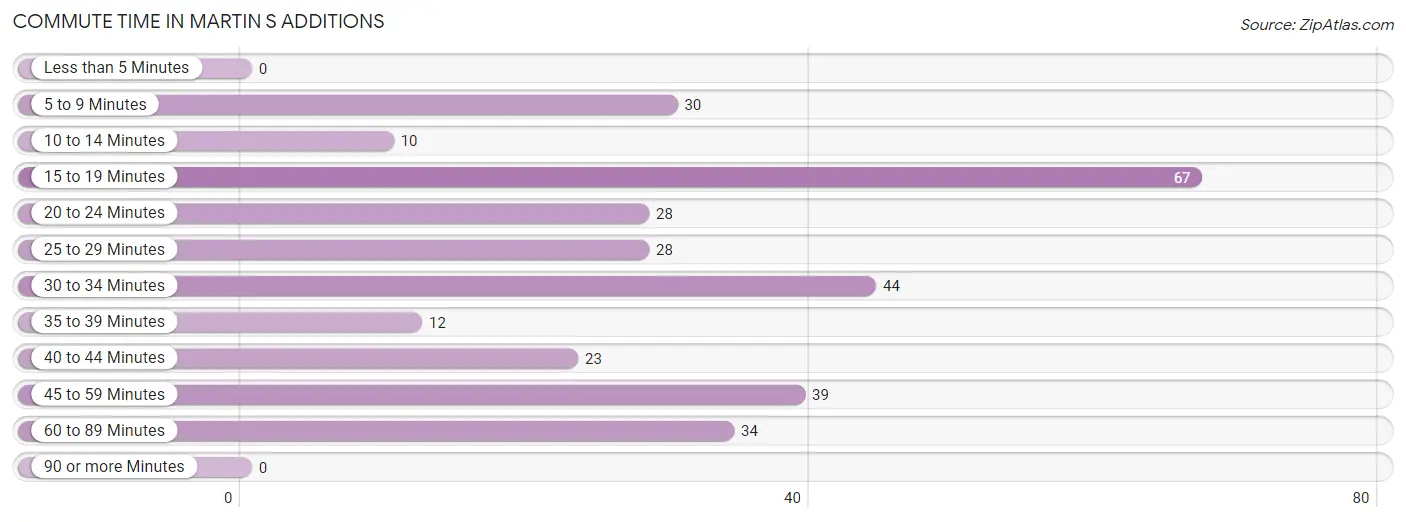
| Commute Time | # Commuters | % Commuters |
| Less than 5 Minutes | 0 | 0.0% |
| 5 to 9 Minutes | 30 | 9.5% |
| 10 to 14 Minutes | 10 | 3.2% |
| 15 to 19 Minutes | 67 | 21.3% |
| 20 to 24 Minutes | 28 | 8.9% |
| 25 to 29 Minutes | 28 | 8.9% |
| 30 to 34 Minutes | 44 | 14.0% |
| 35 to 39 Minutes | 12 | 3.8% |
| 40 to 44 Minutes | 23 | 7.3% |
| 45 to 59 Minutes | 39 | 12.4% |
| 60 to 89 Minutes | 34 | 10.8% |
| 90 or more Minutes | 0 | 0.0% |
Commute Time by Sex in Martin s Additions
The most common commute times in Martin s Additions are 60 to 89 minutes (31 commuters, 17.9%) for males and 15 to 19 minutes (44 commuters, 31.0%) for females.
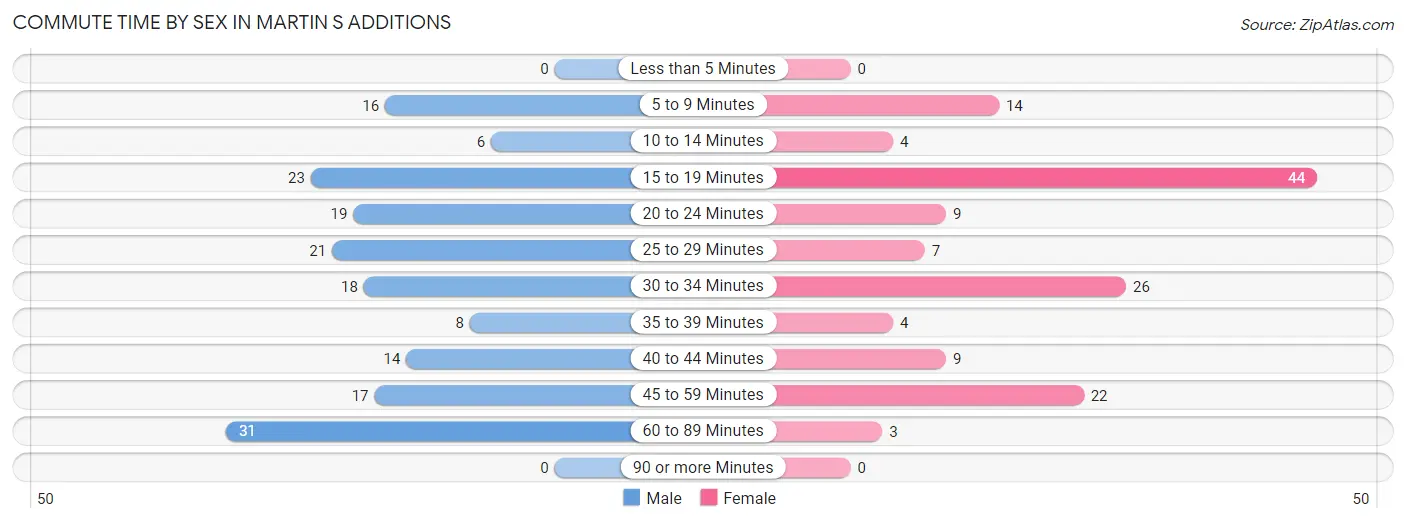
| Commute Time | Male | Female |
| Less than 5 Minutes | 0 (0.0%) | 0 (0.0%) |
| 5 to 9 Minutes | 16 (9.2%) | 14 (9.9%) |
| 10 to 14 Minutes | 6 (3.5%) | 4 (2.8%) |
| 15 to 19 Minutes | 23 (13.3%) | 44 (31.0%) |
| 20 to 24 Minutes | 19 (11.0%) | 9 (6.3%) |
| 25 to 29 Minutes | 21 (12.1%) | 7 (4.9%) |
| 30 to 34 Minutes | 18 (10.4%) | 26 (18.3%) |
| 35 to 39 Minutes | 8 (4.6%) | 4 (2.8%) |
| 40 to 44 Minutes | 14 (8.1%) | 9 (6.3%) |
| 45 to 59 Minutes | 17 (9.8%) | 22 (15.5%) |
| 60 to 89 Minutes | 31 (17.9%) | 3 (2.1%) |
| 90 or more Minutes | 0 (0.0%) | 0 (0.0%) |
Time of Departure to Work by Sex in Martin s Additions
The most frequent times of departure to work in Martin s Additions are 8:00 AM to 8:29 AM (52, 30.1%) for males and 8:00 AM to 8:29 AM (32, 22.5%) for females.
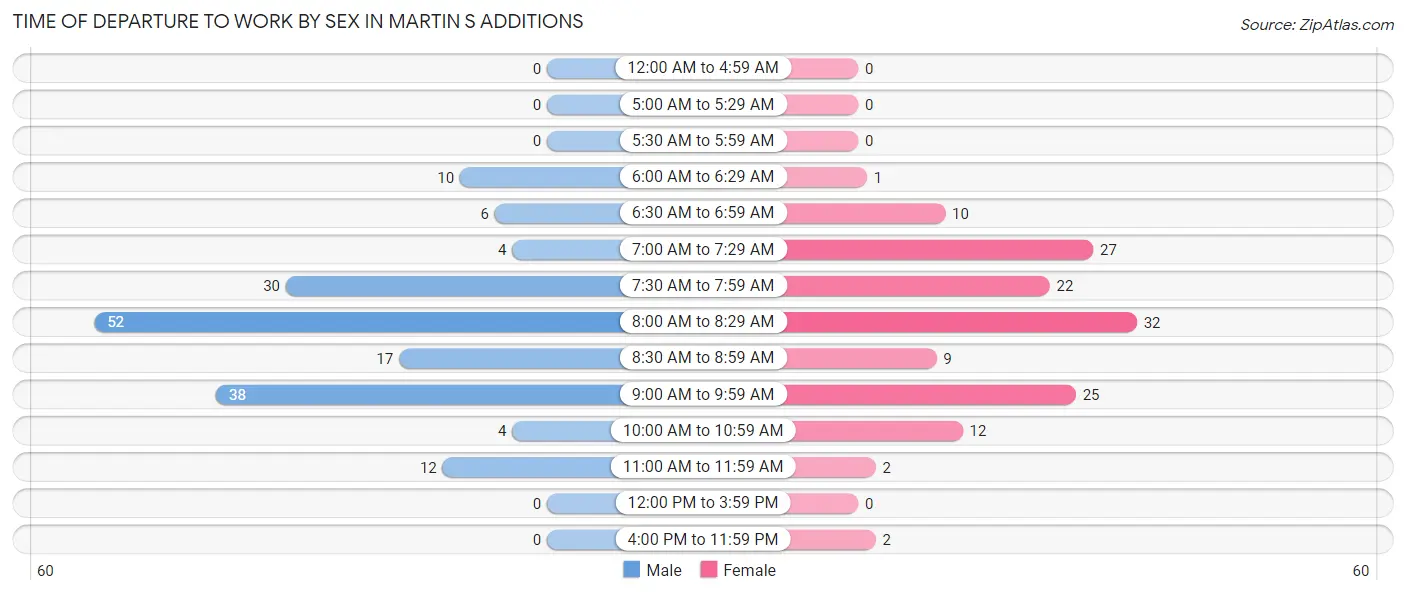
| Time of Departure | Male | Female |
| 12:00 AM to 4:59 AM | 0 (0.0%) | 0 (0.0%) |
| 5:00 AM to 5:29 AM | 0 (0.0%) | 0 (0.0%) |
| 5:30 AM to 5:59 AM | 0 (0.0%) | 0 (0.0%) |
| 6:00 AM to 6:29 AM | 10 (5.8%) | 1 (0.7%) |
| 6:30 AM to 6:59 AM | 6 (3.5%) | 10 (7.0%) |
| 7:00 AM to 7:29 AM | 4 (2.3%) | 27 (19.0%) |
| 7:30 AM to 7:59 AM | 30 (17.3%) | 22 (15.5%) |
| 8:00 AM to 8:29 AM | 52 (30.1%) | 32 (22.5%) |
| 8:30 AM to 8:59 AM | 17 (9.8%) | 9 (6.3%) |
| 9:00 AM to 9:59 AM | 38 (22.0%) | 25 (17.6%) |
| 10:00 AM to 10:59 AM | 4 (2.3%) | 12 (8.5%) |
| 11:00 AM to 11:59 AM | 12 (6.9%) | 2 (1.4%) |
| 12:00 PM to 3:59 PM | 0 (0.0%) | 0 (0.0%) |
| 4:00 PM to 11:59 PM | 0 (0.0%) | 2 (1.4%) |
| Total | 173 (100.0%) | 142 (100.0%) |
Housing Occupancy in Martin s Additions
Occupancy by Ownership in Martin s Additions
Of the total 328 dwellings in Martin s Additions, owner-occupied units account for 320 (97.6%), while renter-occupied units make up 8 (2.4%).
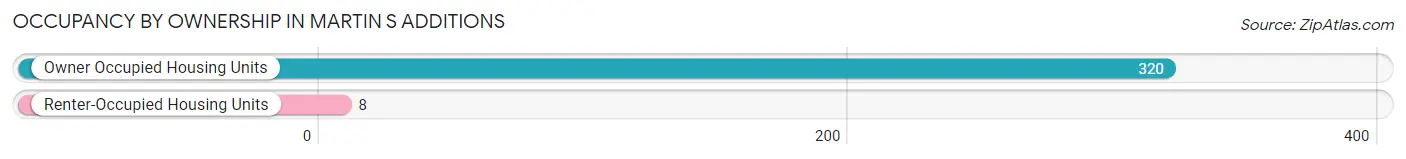
| Occupancy | # Housing Units | % Housing Units |
| Owner Occupied Housing Units | 320 | 97.6% |
| Renter-Occupied Housing Units | 8 | 2.4% |
| Total Occupied Housing Units | 328 | 100.0% |
Occupancy by Household Size in Martin s Additions
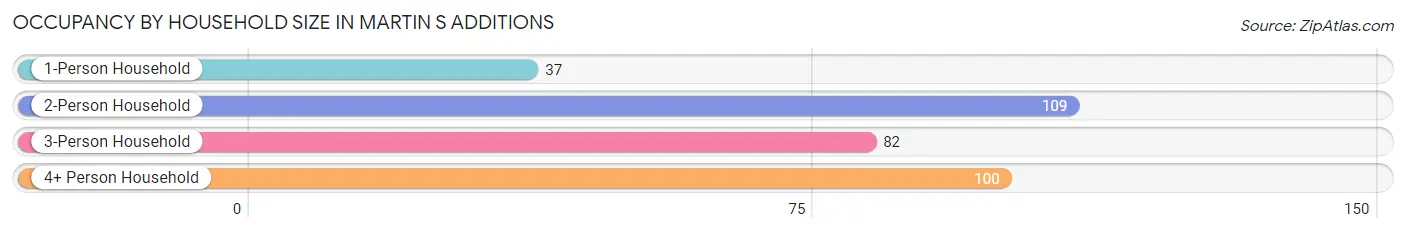
| Household Size | # Housing Units | % Housing Units |
| 1-Person Household | 37 | 11.3% |
| 2-Person Household | 109 | 33.2% |
| 3-Person Household | 82 | 25.0% |
| 4+ Person Household | 100 | 30.5% |
| Total Housing Units | 328 | 100.0% |
Occupancy by Ownership by Household Size in Martin s Additions
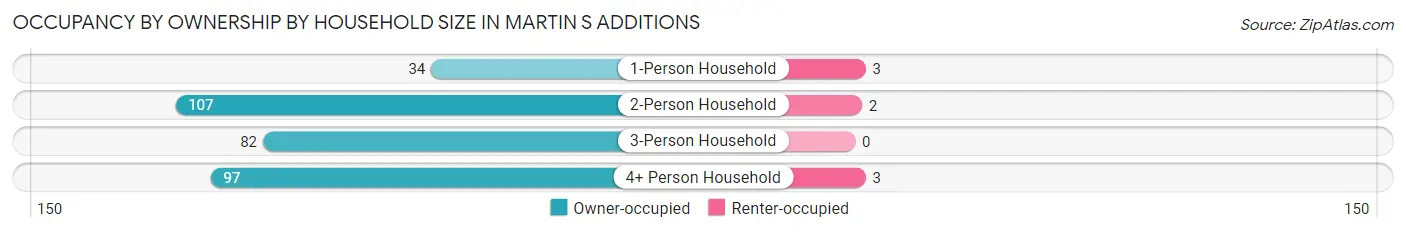
| Household Size | Owner-occupied | Renter-occupied |
| 1-Person Household | 34 (91.9%) | 3 (8.1%) |
| 2-Person Household | 107 (98.2%) | 2 (1.8%) |
| 3-Person Household | 82 (100.0%) | 0 (0.0%) |
| 4+ Person Household | 97 (97.0%) | 3 (3.0%) |
| Total Housing Units | 320 (97.6%) | 8 (2.4%) |
Occupancy by Educational Attainment in Martin s Additions
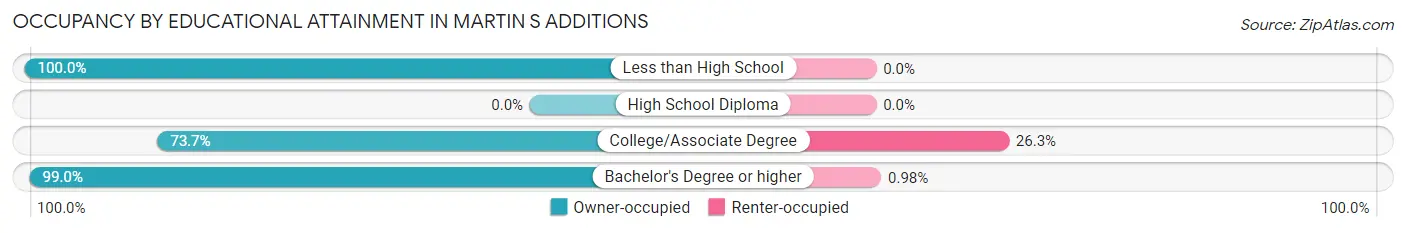
| Household Size | Owner-occupied | Renter-occupied |
| Less than High School | 2 (100.0%) | 0 (0.0%) |
| High School Diploma | 0 (0.0%) | 0 (0.0%) |
| College/Associate Degree | 14 (73.7%) | 5 (26.3%) |
| Bachelor's Degree or higher | 304 (99.0%) | 3 (1.0%) |
Occupancy by Age of Householder in Martin s Additions
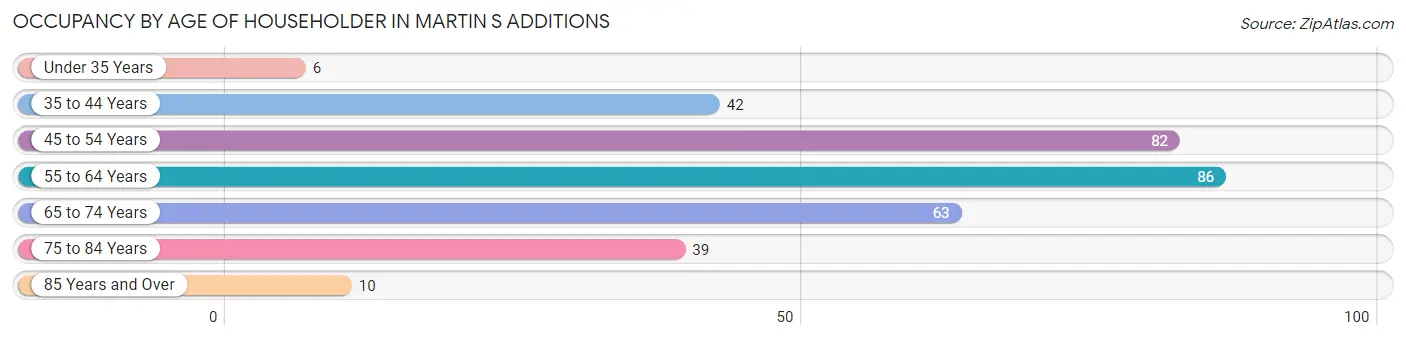
| Age Bracket | # Households | % Households |
| Under 35 Years | 6 | 1.8% |
| 35 to 44 Years | 42 | 12.8% |
| 45 to 54 Years | 82 | 25.0% |
| 55 to 64 Years | 86 | 26.2% |
| 65 to 74 Years | 63 | 19.2% |
| 75 to 84 Years | 39 | 11.9% |
| 85 Years and Over | 10 | 3.0% |
| Total | 328 | 100.0% |
Housing Finances in Martin s Additions
Median Income by Occupancy in Martin s Additions
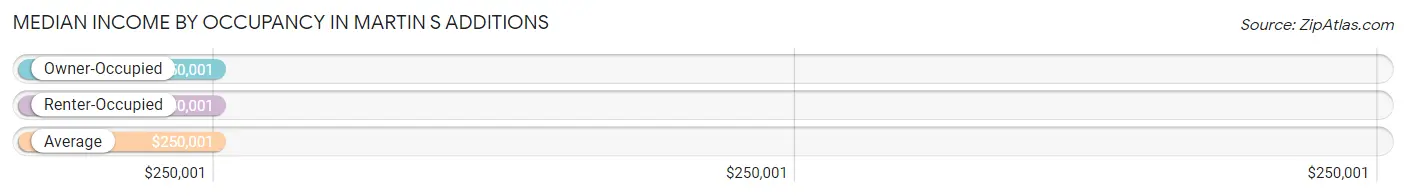
| Occupancy Type | # Households | Median Income |
| Owner-Occupied | 320 (97.6%) | $250,001 |
| Renter-Occupied | 8 (2.4%) | $250,001 |
| Average | 328 (100.0%) | $250,001 |
Occupancy by Householder Income Bracket in Martin s Additions
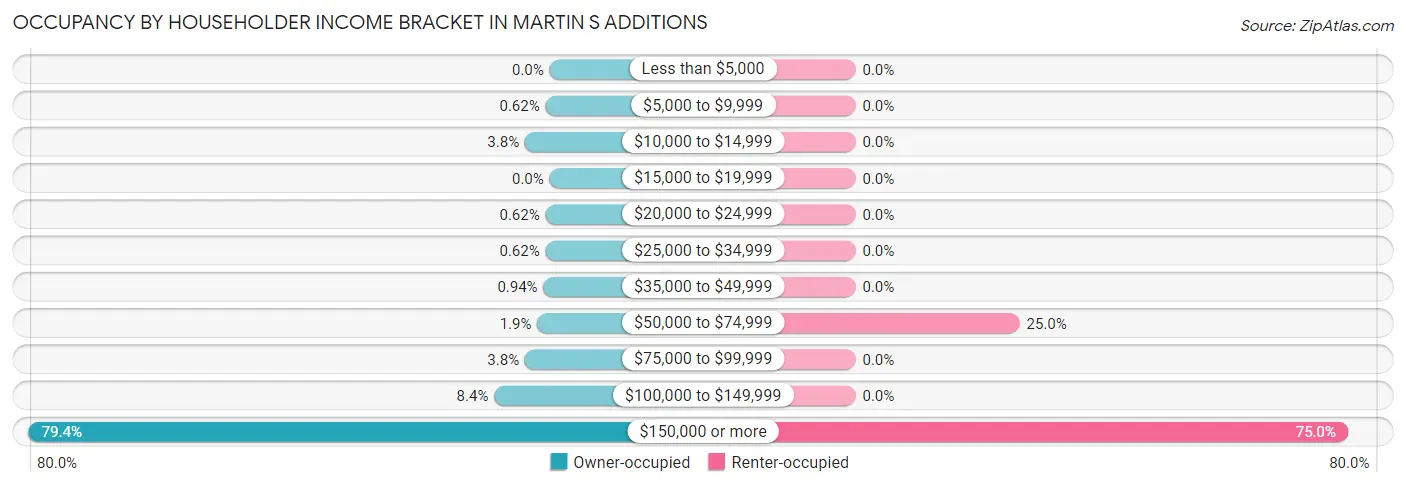
| Income Bracket | Owner-occupied | Renter-occupied |
| Less than $5,000 | 0 (0.0%) | 0 (0.0%) |
| $5,000 to $9,999 | 2 (0.6%) | 0 (0.0%) |
| $10,000 to $14,999 | 12 (3.7%) | 0 (0.0%) |
| $15,000 to $19,999 | 0 (0.0%) | 0 (0.0%) |
| $20,000 to $24,999 | 2 (0.6%) | 0 (0.0%) |
| $25,000 to $34,999 | 2 (0.6%) | 0 (0.0%) |
| $35,000 to $49,999 | 3 (0.9%) | 0 (0.0%) |
| $50,000 to $74,999 | 6 (1.9%) | 2 (25.0%) |
| $75,000 to $99,999 | 12 (3.7%) | 0 (0.0%) |
| $100,000 to $149,999 | 27 (8.4%) | 0 (0.0%) |
| $150,000 or more | 254 (79.4%) | 6 (75.0%) |
| Total | 320 (100.0%) | 8 (100.0%) |
Monthly Housing Cost Tiers in Martin s Additions
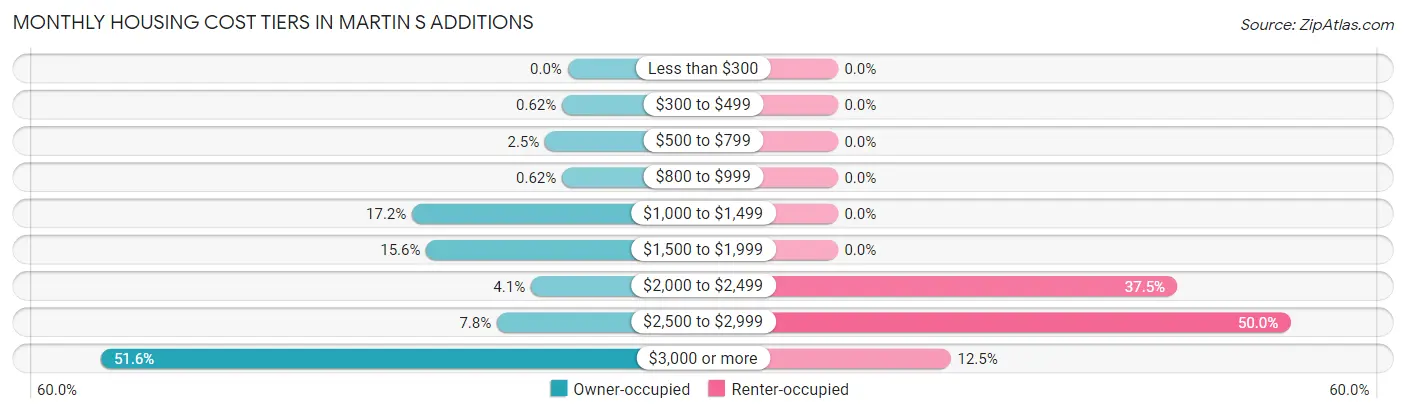
| Monthly Cost | Owner-occupied | Renter-occupied |
| Less than $300 | 0 (0.0%) | 0 (0.0%) |
| $300 to $499 | 2 (0.6%) | 0 (0.0%) |
| $500 to $799 | 8 (2.5%) | 0 (0.0%) |
| $800 to $999 | 2 (0.6%) | 0 (0.0%) |
| $1,000 to $1,499 | 55 (17.2%) | 0 (0.0%) |
| $1,500 to $1,999 | 50 (15.6%) | 0 (0.0%) |
| $2,000 to $2,499 | 13 (4.1%) | 3 (37.5%) |
| $2,500 to $2,999 | 25 (7.8%) | 4 (50.0%) |
| $3,000 or more | 165 (51.6%) | 1 (12.5%) |
| Total | 320 (100.0%) | 8 (100.0%) |
Physical Housing Characteristics in Martin s Additions
Housing Structures in Martin s Additions
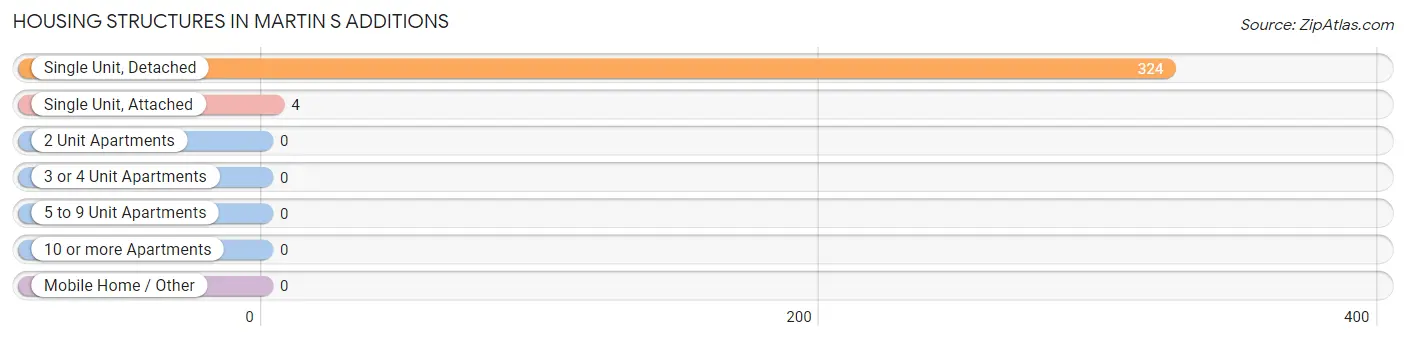
| Structure Type | # Housing Units | % Housing Units |
| Single Unit, Detached | 324 | 98.8% |
| Single Unit, Attached | 4 | 1.2% |
| 2 Unit Apartments | 0 | 0.0% |
| 3 or 4 Unit Apartments | 0 | 0.0% |
| 5 to 9 Unit Apartments | 0 | 0.0% |
| 10 or more Apartments | 0 | 0.0% |
| Mobile Home / Other | 0 | 0.0% |
| Total | 328 | 100.0% |
Housing Structures by Occupancy in Martin s Additions
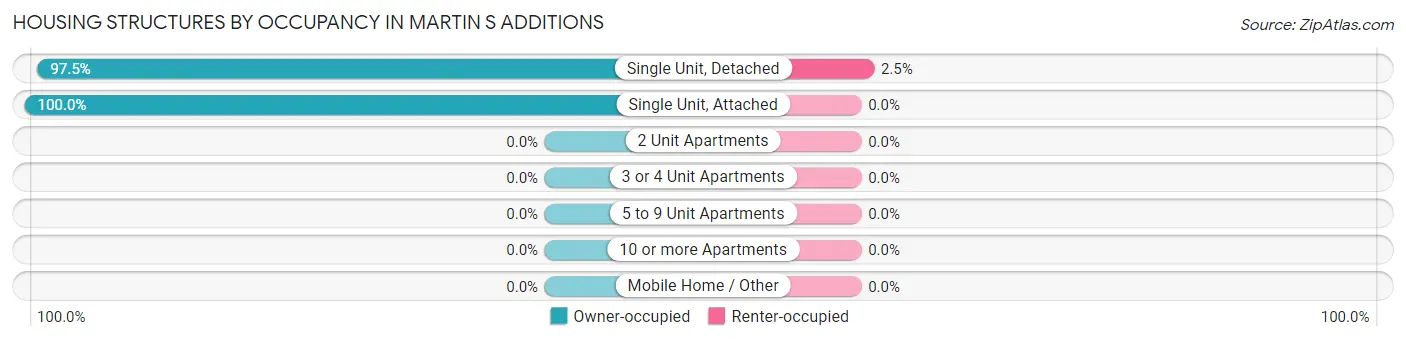
| Structure Type | Owner-occupied | Renter-occupied |
| Single Unit, Detached | 316 (97.5%) | 8 (2.5%) |
| Single Unit, Attached | 4 (100.0%) | 0 (0.0%) |
| 2 Unit Apartments | 0 (0.0%) | 0 (0.0%) |
| 3 or 4 Unit Apartments | 0 (0.0%) | 0 (0.0%) |
| 5 to 9 Unit Apartments | 0 (0.0%) | 0 (0.0%) |
| 10 or more Apartments | 0 (0.0%) | 0 (0.0%) |
| Mobile Home / Other | 0 (0.0%) | 0 (0.0%) |
| Total | 320 (97.6%) | 8 (2.4%) |
Housing Structures by Number of Rooms in Martin s Additions
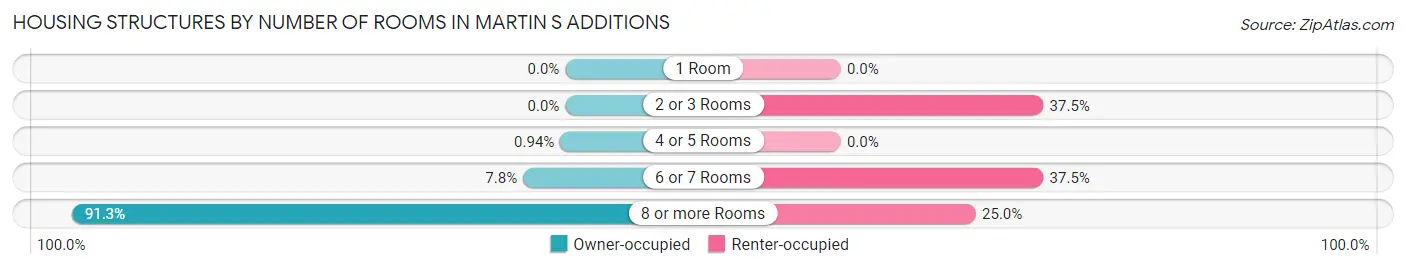
| Number of Rooms | Owner-occupied | Renter-occupied |
| 1 Room | 0 (0.0%) | 0 (0.0%) |
| 2 or 3 Rooms | 0 (0.0%) | 3 (37.5%) |
| 4 or 5 Rooms | 3 (0.9%) | 0 (0.0%) |
| 6 or 7 Rooms | 25 (7.8%) | 3 (37.5%) |
| 8 or more Rooms | 292 (91.2%) | 2 (25.0%) |
| Total | 320 (100.0%) | 8 (100.0%) |
Housing Structure by Heating Type in Martin s Additions
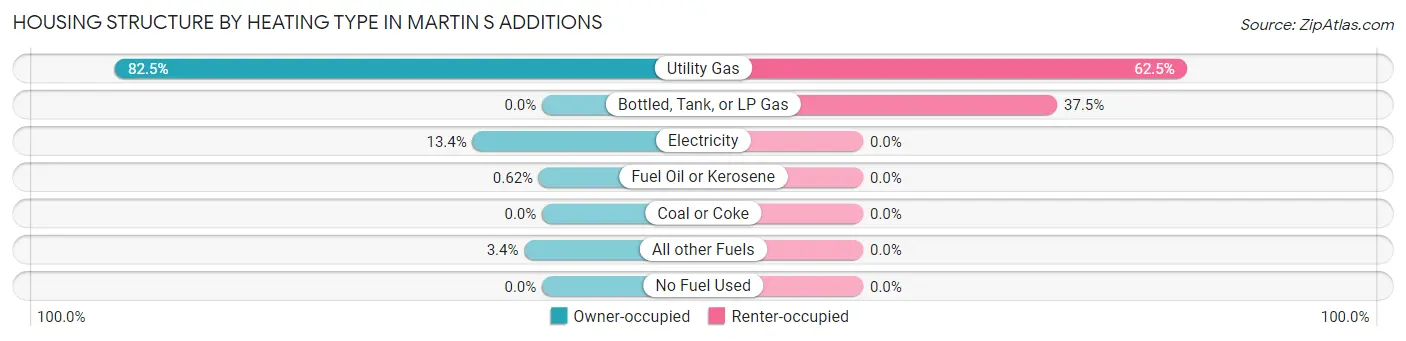
| Heating Type | Owner-occupied | Renter-occupied |
| Utility Gas | 264 (82.5%) | 5 (62.5%) |
| Bottled, Tank, or LP Gas | 0 (0.0%) | 3 (37.5%) |
| Electricity | 43 (13.4%) | 0 (0.0%) |
| Fuel Oil or Kerosene | 2 (0.6%) | 0 (0.0%) |
| Coal or Coke | 0 (0.0%) | 0 (0.0%) |
| All other Fuels | 11 (3.4%) | 0 (0.0%) |
| No Fuel Used | 0 (0.0%) | 0 (0.0%) |
| Total | 320 (100.0%) | 8 (100.0%) |
Household Vehicle Usage in Martin s Additions
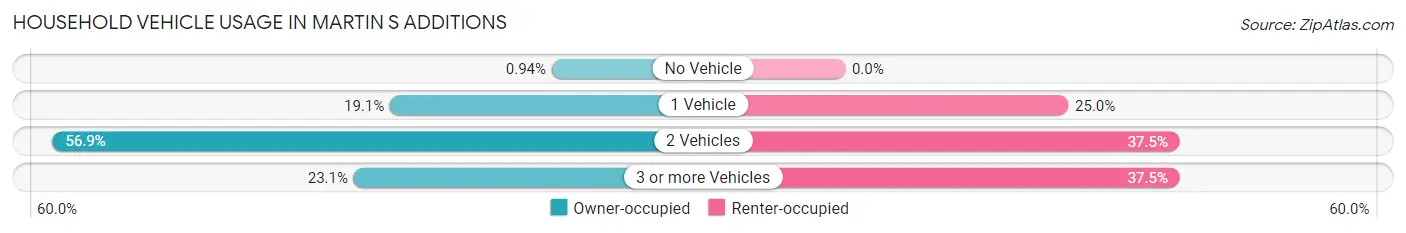
| Vehicles per Household | Owner-occupied | Renter-occupied |
| No Vehicle | 3 (0.9%) | 0 (0.0%) |
| 1 Vehicle | 61 (19.1%) | 2 (25.0%) |
| 2 Vehicles | 182 (56.9%) | 3 (37.5%) |
| 3 or more Vehicles | 74 (23.1%) | 3 (37.5%) |
| Total | 320 (100.0%) | 8 (100.0%) |
Real Estate & Mortgages in Martin s Additions
Real Estate and Mortgage Overview in Martin s Additions
| Characteristic | Without Mortgage | With Mortgage |
| Housing Units | 134 | 186 |
| Median Property Value | $1,181,300 | $1,522,700 |
| Median Household Income | $250,001 | $147 |
| Monthly Housing Costs | $1,501 | $161 |
| Real Estate Taxes | $10,001 | $1 |
Property Value by Mortgage Status in Martin s Additions
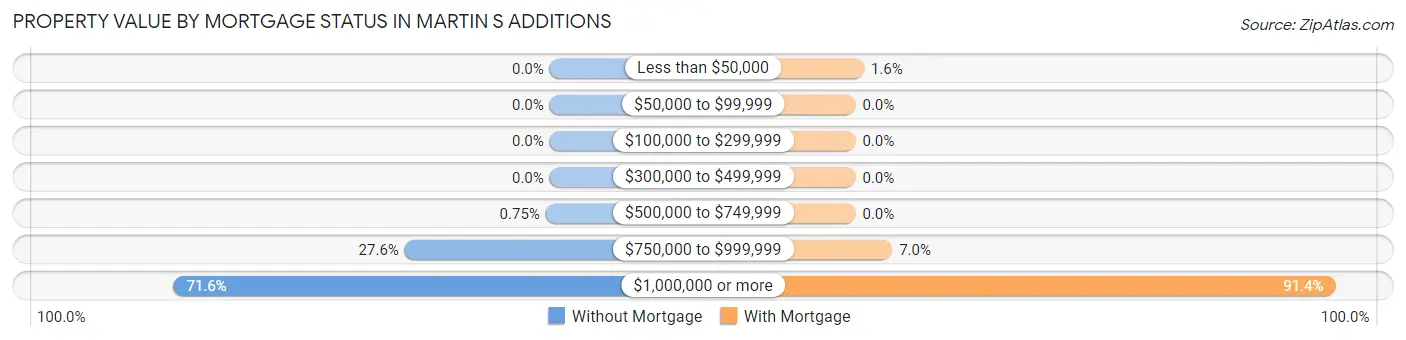
| Property Value | Without Mortgage | With Mortgage |
| Less than $50,000 | 0 (0.0%) | 3 (1.6%) |
| $50,000 to $99,999 | 0 (0.0%) | 0 (0.0%) |
| $100,000 to $299,999 | 0 (0.0%) | 0 (0.0%) |
| $300,000 to $499,999 | 0 (0.0%) | 0 (0.0%) |
| $500,000 to $749,999 | 1 (0.7%) | 0 (0.0%) |
| $750,000 to $999,999 | 37 (27.6%) | 13 (7.0%) |
| $1,000,000 or more | 96 (71.6%) | 170 (91.4%) |
| Total | 134 (100.0%) | 186 (100.0%) |
Household Income by Mortgage Status in Martin s Additions
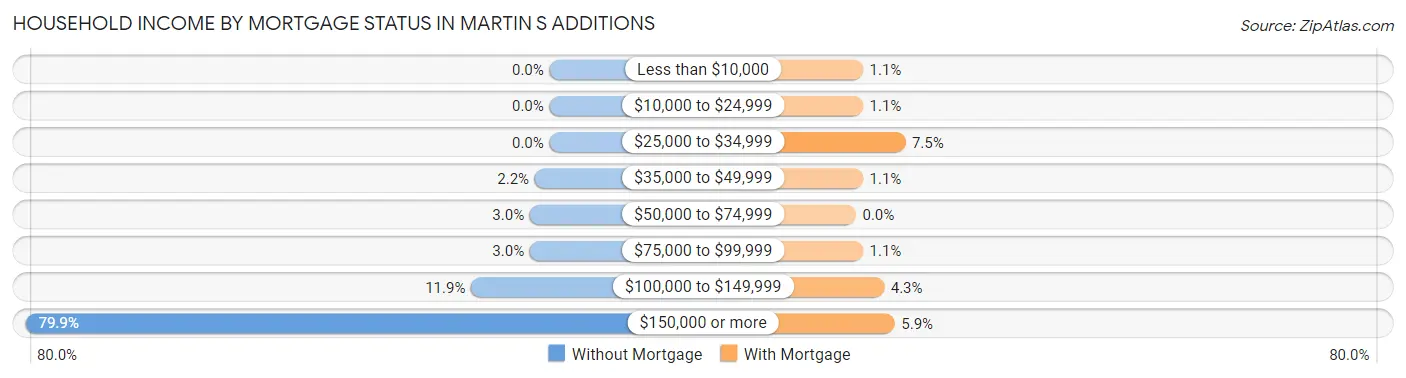
| Household Income | Without Mortgage | With Mortgage |
| Less than $10,000 | 0 (0.0%) | 2 (1.1%) |
| $10,000 to $24,999 | 0 (0.0%) | 2 (1.1%) |
| $25,000 to $34,999 | 0 (0.0%) | 14 (7.5%) |
| $35,000 to $49,999 | 3 (2.2%) | 2 (1.1%) |
| $50,000 to $74,999 | 4 (3.0%) | 0 (0.0%) |
| $75,000 to $99,999 | 4 (3.0%) | 2 (1.1%) |
| $100,000 to $149,999 | 16 (11.9%) | 8 (4.3%) |
| $150,000 or more | 107 (79.8%) | 11 (5.9%) |
| Total | 134 (100.0%) | 186 (100.0%) |
Property Value to Household Income Ratio in Martin s Additions
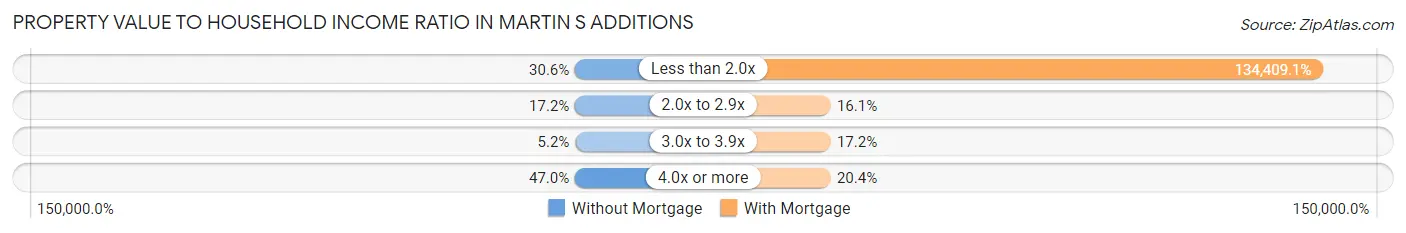
| Value-to-Income Ratio | Without Mortgage | With Mortgage |
| Less than 2.0x | 41 (30.6%) | 250,001 (134,409.1%) |
| 2.0x to 2.9x | 23 (17.2%) | 30 (16.1%) |
| 3.0x to 3.9x | 7 (5.2%) | 32 (17.2%) |
| 4.0x or more | 63 (47.0%) | 38 (20.4%) |
| Total | 134 (100.0%) | 186 (100.0%) |
Real Estate Taxes by Mortgage Status in Martin s Additions
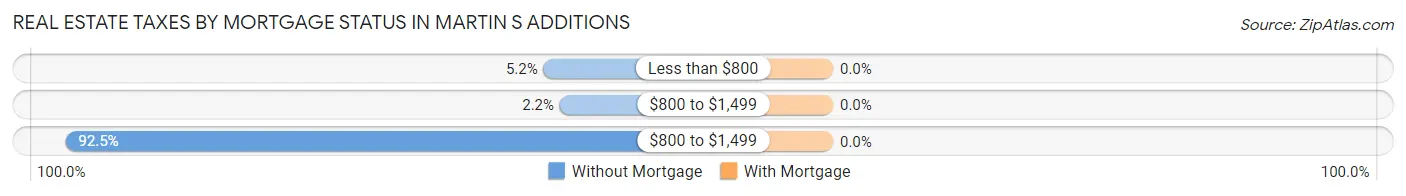
| Property Taxes | Without Mortgage | With Mortgage |
| Less than $800 | 7 (5.2%) | 0 (0.0%) |
| $800 to $1,499 | 3 (2.2%) | 0 (0.0%) |
| $800 to $1,499 | 124 (92.5%) | 0 (0.0%) |
| Total | 134 (100.0%) | 186 (100.0%) |
Health & Disability in Martin s Additions
Health Insurance Coverage by Age in Martin s Additions
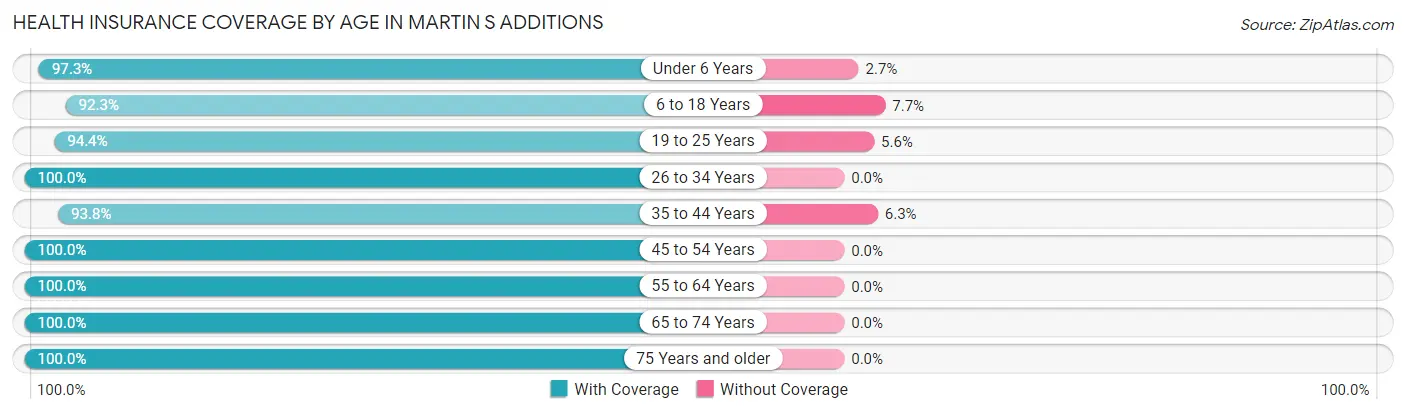
| Age Bracket | With Coverage | Without Coverage |
| Under 6 Years | 73 (97.3%) | 2 (2.7%) |
| 6 to 18 Years | 193 (92.3%) | 16 (7.7%) |
| 19 to 25 Years | 68 (94.4%) | 4 (5.6%) |
| 26 to 34 Years | 25 (100.0%) | 0 (0.0%) |
| 35 to 44 Years | 90 (93.8%) | 6 (6.2%) |
| 45 to 54 Years | 160 (100.0%) | 0 (0.0%) |
| 55 to 64 Years | 128 (100.0%) | 0 (0.0%) |
| 65 to 74 Years | 151 (100.0%) | 0 (0.0%) |
| 75 Years and older | 77 (100.0%) | 0 (0.0%) |
| Total | 965 (97.2%) | 28 (2.8%) |
Health Insurance Coverage by Citizenship Status in Martin s Additions
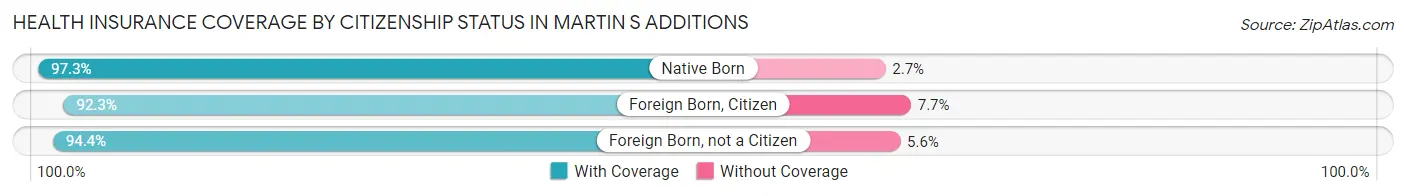
| Citizenship Status | With Coverage | Without Coverage |
| Native Born | 73 (97.3%) | 2 (2.7%) |
| Foreign Born, Citizen | 193 (92.3%) | 16 (7.7%) |
| Foreign Born, not a Citizen | 68 (94.4%) | 4 (5.6%) |
Health Insurance Coverage by Household Income in Martin s Additions
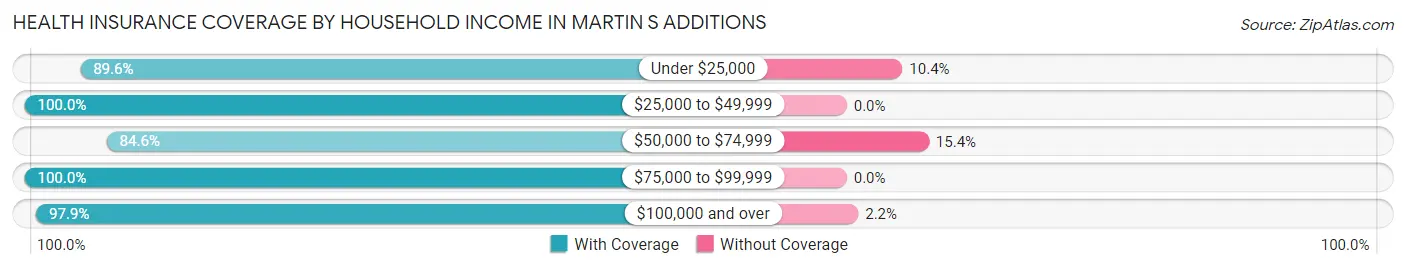
| Household Income | With Coverage | Without Coverage |
| Under $25,000 | 43 (89.6%) | 5 (10.4%) |
| $25,000 to $49,999 | 9 (100.0%) | 0 (0.0%) |
| $50,000 to $74,999 | 22 (84.6%) | 4 (15.4%) |
| $75,000 to $99,999 | 28 (100.0%) | 0 (0.0%) |
| $100,000 and over | 863 (97.9%) | 19 (2.1%) |
Public vs Private Health Insurance Coverage by Age in Martin s Additions
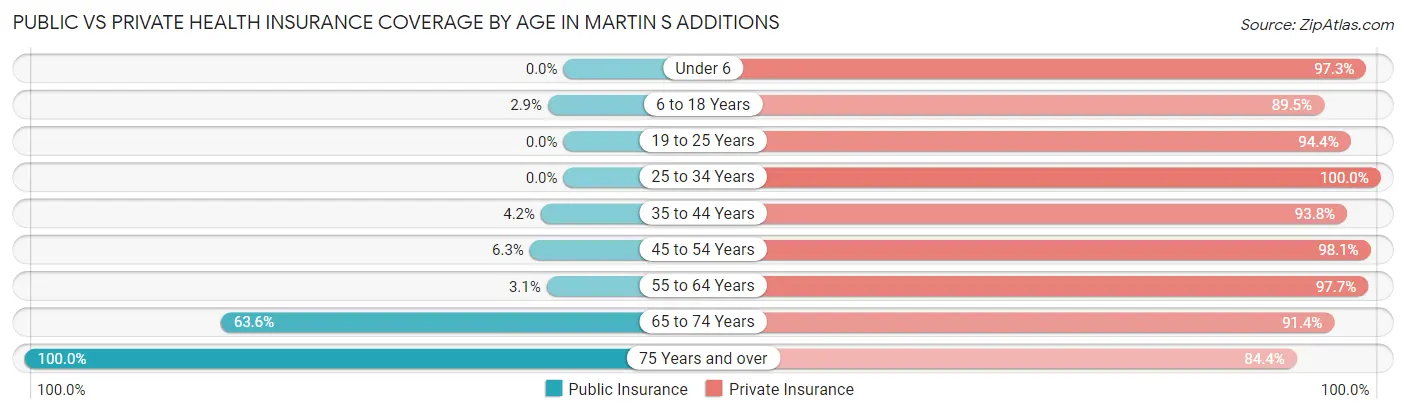
| Age Bracket | Public Insurance | Private Insurance |
| Under 6 | 0 (0.0%) | 73 (97.3%) |
| 6 to 18 Years | 6 (2.9%) | 187 (89.5%) |
| 19 to 25 Years | 0 (0.0%) | 68 (94.4%) |
| 25 to 34 Years | 0 (0.0%) | 25 (100.0%) |
| 35 to 44 Years | 4 (4.2%) | 90 (93.8%) |
| 45 to 54 Years | 10 (6.2%) | 157 (98.1%) |
| 55 to 64 Years | 4 (3.1%) | 125 (97.7%) |
| 65 to 74 Years | 96 (63.6%) | 138 (91.4%) |
| 75 Years and over | 77 (100.0%) | 65 (84.4%) |
| Total | 197 (19.8%) | 928 (93.4%) |
Disability Status by Sex by Age in Martin s Additions
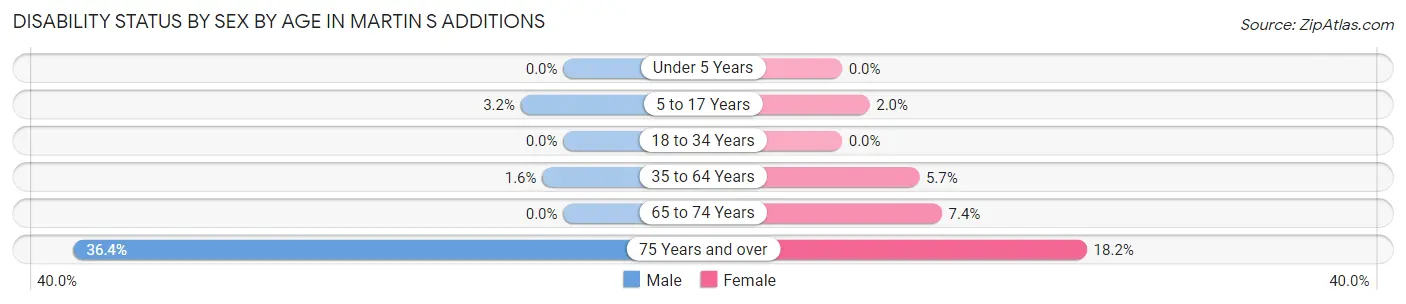
| Age Bracket | Male | Female |
| Under 5 Years | 0 (0.0%) | 0 (0.0%) |
| 5 to 17 Years | 3 (3.2%) | 2 (2.0%) |
| 18 to 34 Years | 0 (0.0%) | 0 (0.0%) |
| 35 to 64 Years | 3 (1.6%) | 11 (5.7%) |
| 65 to 74 Years | 0 (0.0%) | 6 (7.4%) |
| 75 Years and over | 12 (36.4%) | 8 (18.2%) |
Disability Class by Sex by Age in Martin s Additions
Disability Class: Hearing Difficulty

| Age Bracket | Male | Female |
| Under 5 Years | 0 (0.0%) | 0 (0.0%) |
| 5 to 17 Years | 3 (3.2%) | 0 (0.0%) |
| 18 to 34 Years | 0 (0.0%) | 0 (0.0%) |
| 35 to 64 Years | 0 (0.0%) | 5 (2.6%) |
| 65 to 74 Years | 0 (0.0%) | 0 (0.0%) |
| 75 Years and over | 7 (21.2%) | 3 (6.8%) |
Disability Class: Vision Difficulty
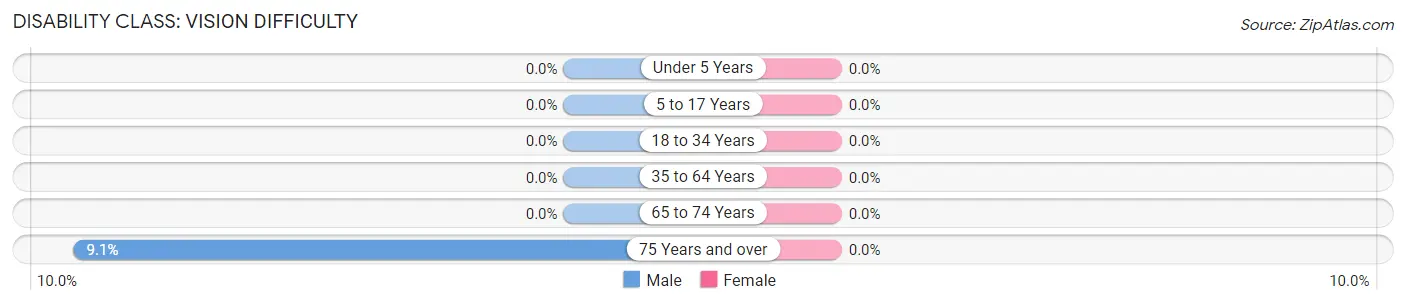
| Age Bracket | Male | Female |
| Under 5 Years | 0 (0.0%) | 0 (0.0%) |
| 5 to 17 Years | 0 (0.0%) | 0 (0.0%) |
| 18 to 34 Years | 0 (0.0%) | 0 (0.0%) |
| 35 to 64 Years | 0 (0.0%) | 0 (0.0%) |
| 65 to 74 Years | 0 (0.0%) | 0 (0.0%) |
| 75 Years and over | 3 (9.1%) | 0 (0.0%) |
Disability Class: Cognitive Difficulty
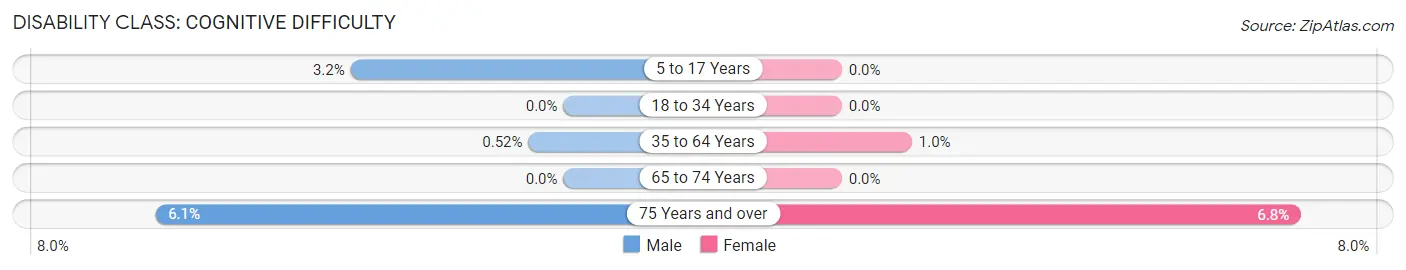
| Age Bracket | Male | Female |
| 5 to 17 Years | 3 (3.2%) | 0 (0.0%) |
| 18 to 34 Years | 0 (0.0%) | 0 (0.0%) |
| 35 to 64 Years | 1 (0.5%) | 2 (1.0%) |
| 65 to 74 Years | 0 (0.0%) | 0 (0.0%) |
| 75 Years and over | 2 (6.1%) | 3 (6.8%) |
Disability Class: Ambulatory Difficulty
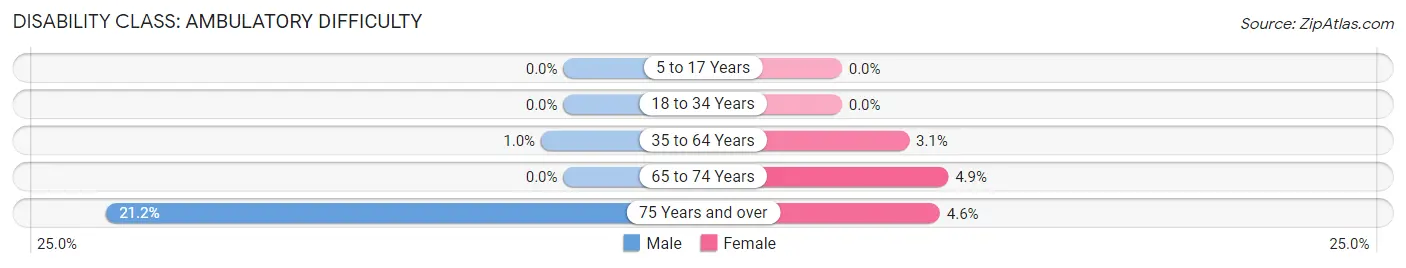
| Age Bracket | Male | Female |
| 5 to 17 Years | 0 (0.0%) | 0 (0.0%) |
| 18 to 34 Years | 0 (0.0%) | 0 (0.0%) |
| 35 to 64 Years | 2 (1.0%) | 6 (3.1%) |
| 65 to 74 Years | 0 (0.0%) | 4 (4.9%) |
| 75 Years and over | 7 (21.2%) | 2 (4.5%) |
Disability Class: Self-Care Difficulty
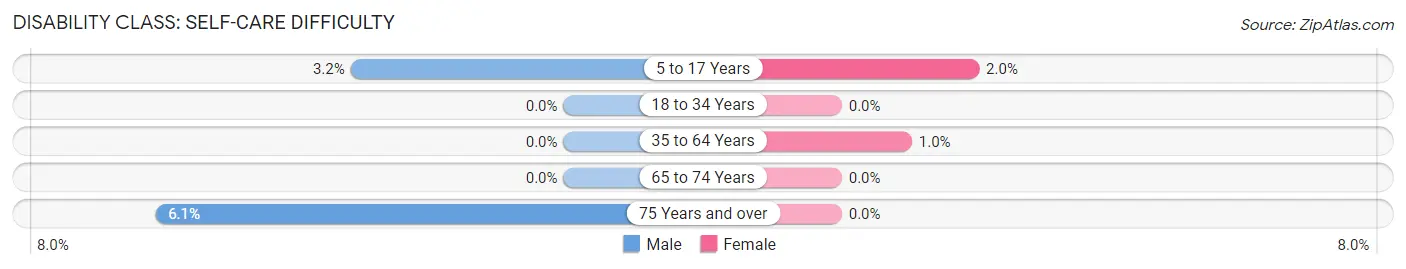
| Age Bracket | Male | Female |
| 5 to 17 Years | 3 (3.2%) | 2 (2.0%) |
| 18 to 34 Years | 0 (0.0%) | 0 (0.0%) |
| 35 to 64 Years | 0 (0.0%) | 2 (1.0%) |
| 65 to 74 Years | 0 (0.0%) | 0 (0.0%) |
| 75 Years and over | 2 (6.1%) | 0 (0.0%) |
Technology Access in Martin s Additions
Computing Device Access in Martin s Additions
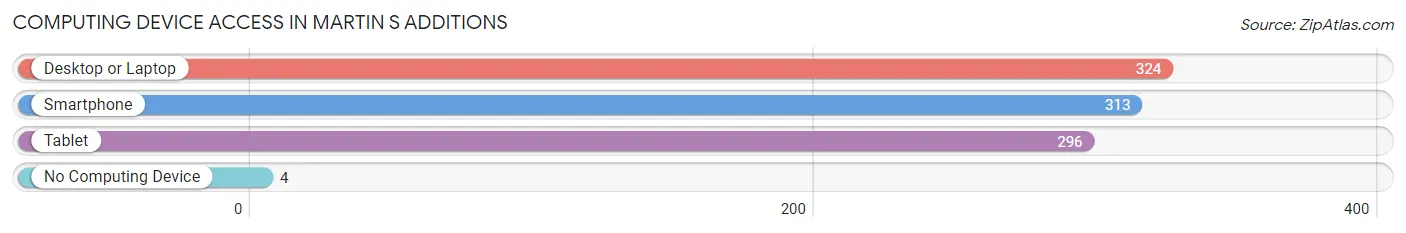
| Device Type | # Households | % Households |
| Desktop or Laptop | 324 | 98.8% |
| Smartphone | 313 | 95.4% |
| Tablet | 296 | 90.2% |
| No Computing Device | 4 | 1.2% |
| Total | 328 | 100.0% |
Internet Access in Martin s Additions
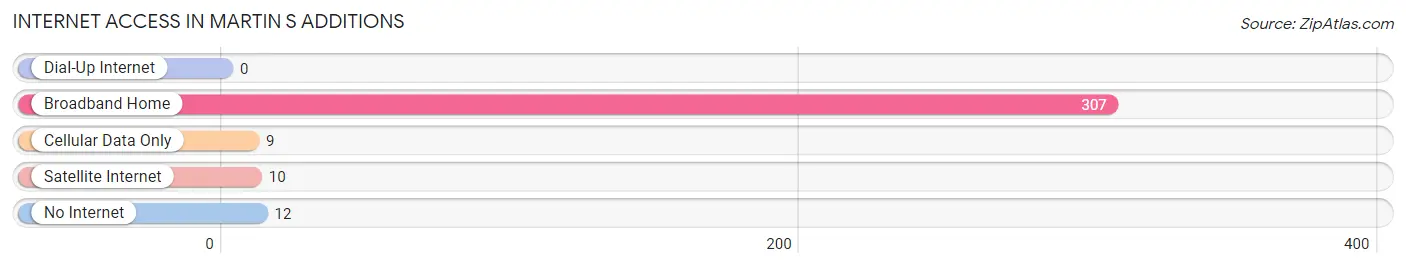
| Internet Type | # Households | % Households |
| Dial-Up Internet | 0 | 0.0% |
| Broadband Home | 307 | 93.6% |
| Cellular Data Only | 9 | 2.7% |
| Satellite Internet | 10 | 3.0% |
| No Internet | 12 | 3.7% |
| Total | 328 | 100.0% |
Martin s Additions Summary
History
Maryland is a state located in the Mid-Atlantic region of the United States. It is bordered by Virginia, West Virginia, and the District of Columbia to the south and west; Pennsylvania to the north; and Delaware to the east. The state was named after Queen Henrietta Maria of England, wife of King Charles I. Maryland was one of the original thirteen colonies that formed the United States.
The first European settlers in Maryland were the English, who arrived in 1634. They established the first permanent settlement in the area, St. Mary's City, in 1634. The colony was founded by Cecil Calvert, the second Lord Baltimore, and was intended to be a refuge for English Catholics. The colony was granted a charter by King Charles I in 1632.
The colony of Maryland was a royal colony until the American Revolution. During the Revolution, Maryland declared its independence from Britain and joined the other colonies in the fight for freedom. After the war, Maryland became one of the original thirteen states of the United States.
Geography
Maryland is located in the Mid-Atlantic region of the United States. It is bordered by Virginia, West Virginia, and the District of Columbia to the south and west; Pennsylvania to the north; and Delaware to the east. The state has an area of 12,407 square miles, making it the 42nd largest state in the country.
The terrain of Maryland is mostly flat, with rolling hills in the western part of the state. The highest point in the state is Hoye-Crest, located in Garrett County, which has an elevation of 3,360 feet. The state is home to several major rivers, including the Potomac, Patuxent, and Susquehanna.
Economy
The economy of Maryland is largely based on services, manufacturing, and agriculture. The state is home to several major industries, including aerospace, biotechnology, and information technology. The state is also home to several major military installations, including the Naval Air Station Patuxent River and the Aberdeen Proving Ground.
The state's agricultural sector is largely focused on poultry and dairy production. The state is also home to several major ports, including the Port of Baltimore and the Port of Chesapeake.
Demographics
As of the 2010 census, the population of Maryland was 5,773,552. The state is home to a diverse population, with the largest ethnic groups being African American (30.2%), White (60.5%), and Hispanic or Latino (9.3%).
The median household income in Maryland is $75,847, and the median family income is $93,844. The state has a poverty rate of 9.7%.
The largest cities in Maryland are Baltimore (population 621,342), Columbia (population 99,615), and Silver Spring (population 71,452). The state capital is Annapolis (population 38,394).
Common Questions
What is Per Capita Income in Martin s Additions?
Per Capita income in Martin s Additions is $172,692.
What is the Median Family Income in Martin s Additions?
Median Family Income in Martin s Additions is $250,001.
What is the Median Household income in Martin s Additions?
Median Household Income in Martin s Additions is $250,001.
What is Income or Wage Gap in Martin s Additions?
Income or Wage Gap in Martin s Additions is 58.2%.
Women in Martin s Additions earn 41.8 cents for every dollar earned by a man.
What is Inequality or Gini Index in Martin s Additions?
Inequality or Gini Index in Martin s Additions is 0.47.
What is the Total Population of Martin s Additions?
Total Population of Martin s Additions is 993.
What is the Total Male Population of Martin s Additions?
Total Male Population of Martin s Additions is 492.
What is the Total Female Population of Martin s Additions?
Total Female Population of Martin s Additions is 501.
What is the Ratio of Males per 100 Females in Martin s Additions?
There are 98.20 Males per 100 Females in Martin s Additions.
What is the Ratio of Females per 100 Males in Martin s Additions?
There are 101.83 Females per 100 Males in Martin s Additions.
What is the Median Population Age in Martin s Additions?
Median Population Age in Martin s Additions is 47.0 Years.
What is the Average Family Size in Martin s Additions
Average Family Size in Martin s Additions is 3.3 People.
What is the Average Household Size in Martin s Additions
Average Household Size in Martin s Additions is 3.0 People.
How Large is the Labor Force in Martin s Additions?
There are 505 People in the Labor Forcein in Martin s Additions.
What is the Percentage of People in the Labor Force in Martin s Additions?
65.1% of People are in the Labor Force in Martin s Additions.
What is the Unemployment Rate in Martin s Additions?
Unemployment Rate in Martin s Additions is 0.6%.