Wheaton, MD Map & Demographics
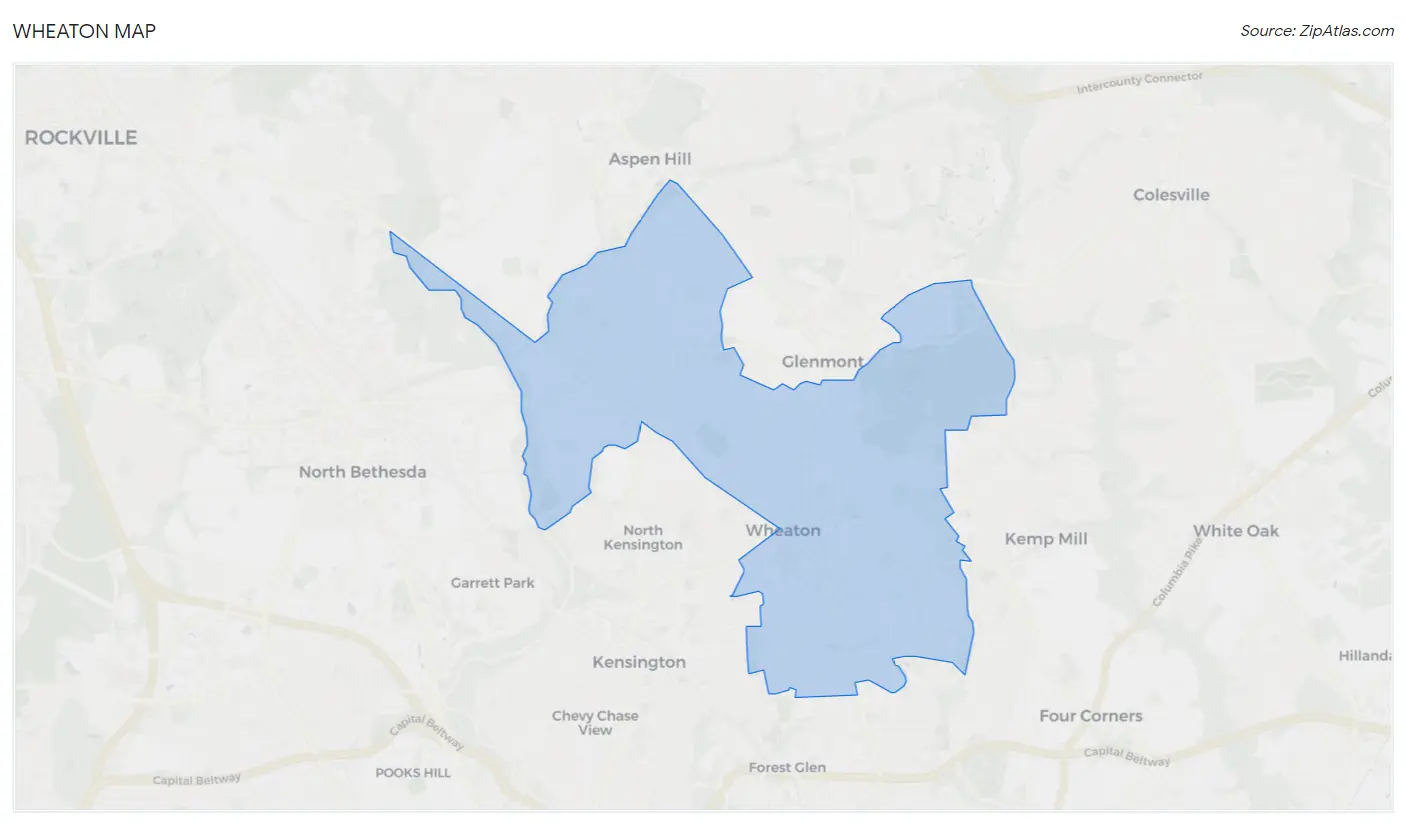
Wheaton Map
Wheaton Overview
$41,025
PER CAPITA INCOME
$108,147
AVG FAMILY INCOME
$101,229
AVG HOUSEHOLD INCOME
8.9%
WAGE / INCOME GAP [ % ]
91.1¢/ $1
WAGE / INCOME GAP [ $ ]
$10,845
FAMILY INCOME DEFICIT
0.41
INEQUALITY / GINI INDEX
52,775
TOTAL POPULATION
26,979
MALE POPULATION
25,796
FEMALE POPULATION
104.59
MALES / 100 FEMALES
95.62
FEMALES / 100 MALES
36.0
MEDIAN AGE
3.6
AVG FAMILY SIZE
3.1
AVG HOUSEHOLD SIZE
30,252
LABOR FORCE [ PEOPLE ]
72.3%
PERCENT IN LABOR FORCE
6.0%
UNEMPLOYMENT RATE
Income in Wheaton
Income Overview in Wheaton
Per Capita Income in Wheaton is $41,025, while median incomes of families and households are $108,147 and $101,229 respectively.
| Characteristic | Number | Measure |
| Per Capita Income | 52,775 | $41,025 |
| Median Family Income | 12,303 | $108,147 |
| Mean Family Income | 12,303 | $134,485 |
| Median Household Income | 16,734 | $101,229 |
| Mean Household Income | 16,734 | $126,559 |
| Income Deficit | 12,303 | $10,845 |
| Wage / Income Gap (%) | 52,775 | 8.92% |
| Wage / Income Gap ($) | 52,775 | 91.08¢ per $1 |
| Gini / Inequality Index | 52,775 | 0.41 |
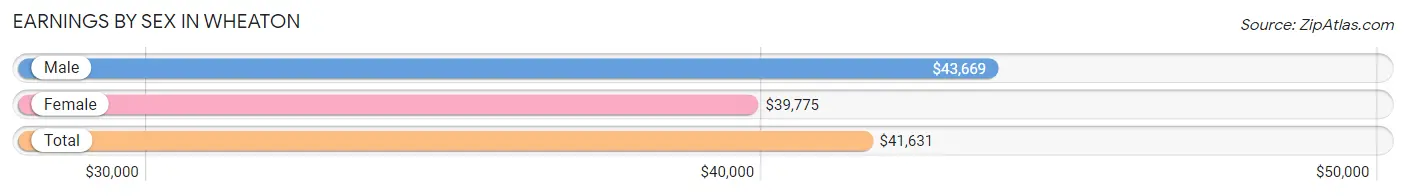
Earnings by Sex in Wheaton
Average Earnings in Wheaton are $41,631, $43,669 for men and $39,775 for women, a difference of 8.9%.
| Sex | Number | Average Earnings |
| Male | 17,302 (55.9%) | $43,669 |
| Female | 13,622 (44.1%) | $39,775 |
| Total | 30,924 (100.0%) | $41,631 |
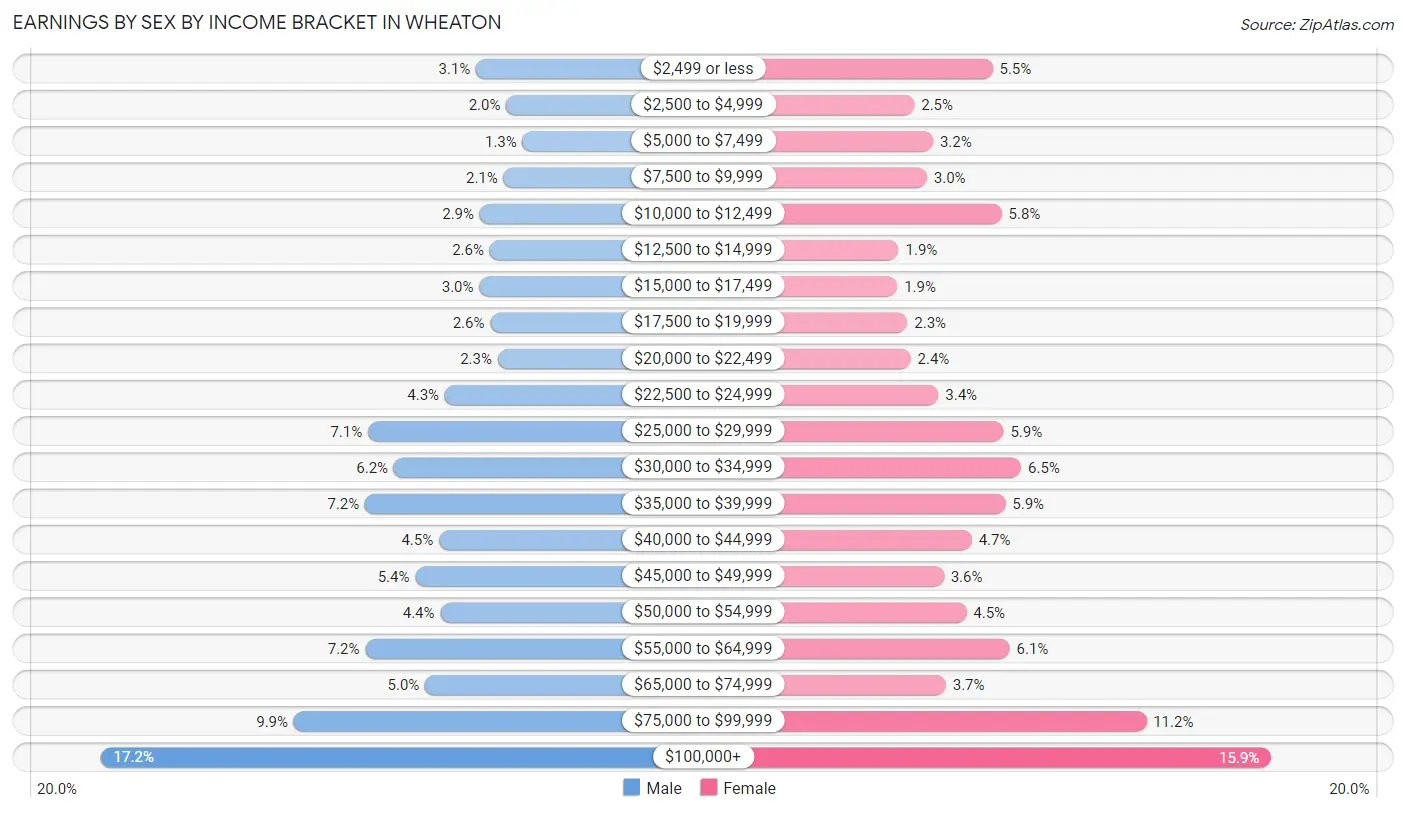
Earnings by Sex by Income Bracket in Wheaton
The most common earnings brackets in Wheaton are $100,000+ for men (2,967 | 17.2%) and $100,000+ for women (2,166 | 15.9%).
| Income | Male | Female |
| $2,499 or less | 533 (3.1%) | 744 (5.5%) |
| $2,500 to $4,999 | 337 (1.9%) | 344 (2.5%) |
| $5,000 to $7,499 | 231 (1.3%) | 440 (3.2%) |
| $7,500 to $9,999 | 355 (2.1%) | 408 (3.0%) |
| $10,000 to $12,499 | 508 (2.9%) | 790 (5.8%) |
| $12,500 to $14,999 | 445 (2.6%) | 264 (1.9%) |
| $15,000 to $17,499 | 513 (3.0%) | 258 (1.9%) |
| $17,500 to $19,999 | 441 (2.5%) | 309 (2.3%) |
| $20,000 to $22,499 | 392 (2.3%) | 325 (2.4%) |
| $22,500 to $24,999 | 735 (4.3%) | 467 (3.4%) |
| $25,000 to $29,999 | 1,234 (7.1%) | 800 (5.9%) |
| $30,000 to $34,999 | 1,066 (6.2%) | 890 (6.5%) |
| $35,000 to $39,999 | 1,252 (7.2%) | 809 (5.9%) |
| $40,000 to $44,999 | 773 (4.5%) | 637 (4.7%) |
| $45,000 to $49,999 | 927 (5.4%) | 495 (3.6%) |
| $50,000 to $54,999 | 764 (4.4%) | 610 (4.5%) |
| $55,000 to $64,999 | 1,251 (7.2%) | 831 (6.1%) |
| $65,000 to $74,999 | 863 (5.0%) | 506 (3.7%) |
| $75,000 to $99,999 | 1,715 (9.9%) | 1,529 (11.2%) |
| $100,000+ | 2,967 (17.2%) | 2,166 (15.9%) |
| Total | 17,302 (100.0%) | 13,622 (100.0%) |
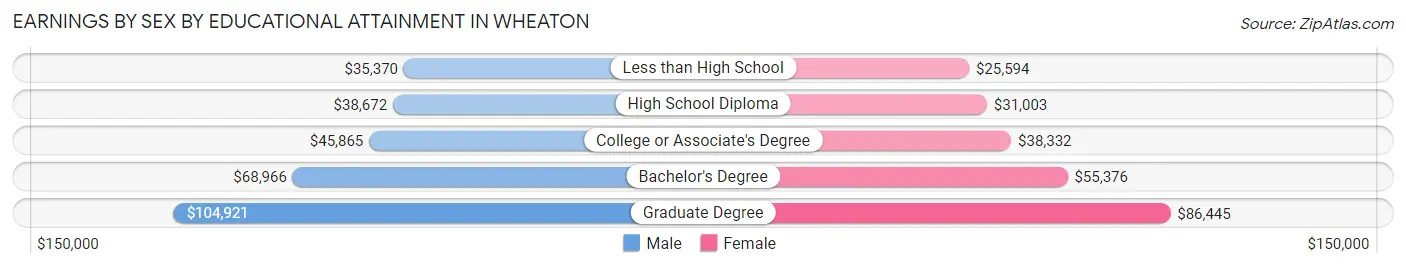
Earnings by Sex by Educational Attainment in Wheaton
Average earnings in Wheaton are $47,181 for men and $46,278 for women, a difference of 1.9%. Men with an educational attainment of graduate degree enjoy the highest average annual earnings of $104,921, while those with less than high school education earn the least with $35,370. Women with an educational attainment of graduate degree earn the most with the average annual earnings of $86,445, while those with less than high school education have the smallest earnings of $25,594.
| Educational Attainment | Male Income | Female Income |
| Less than High School | $35,370 | $25,594 |
| High School Diploma | $38,672 | $31,003 |
| College or Associate's Degree | $45,865 | $38,332 |
| Bachelor's Degree | $68,966 | $55,376 |
| Graduate Degree | $104,921 | $86,445 |
| Total | $47,181 | $46,278 |
Family Income in Wheaton
Family Income Brackets in Wheaton
According to the Wheaton family income data, there are 2,817 families falling into the $100,000 to $149,999 income range, which is the most common income bracket and makes up 22.9% of all families. Conversely, the $10,000 to $14,999 income bracket is the least frequent group with only 86 families (0.7%) belonging to this category.
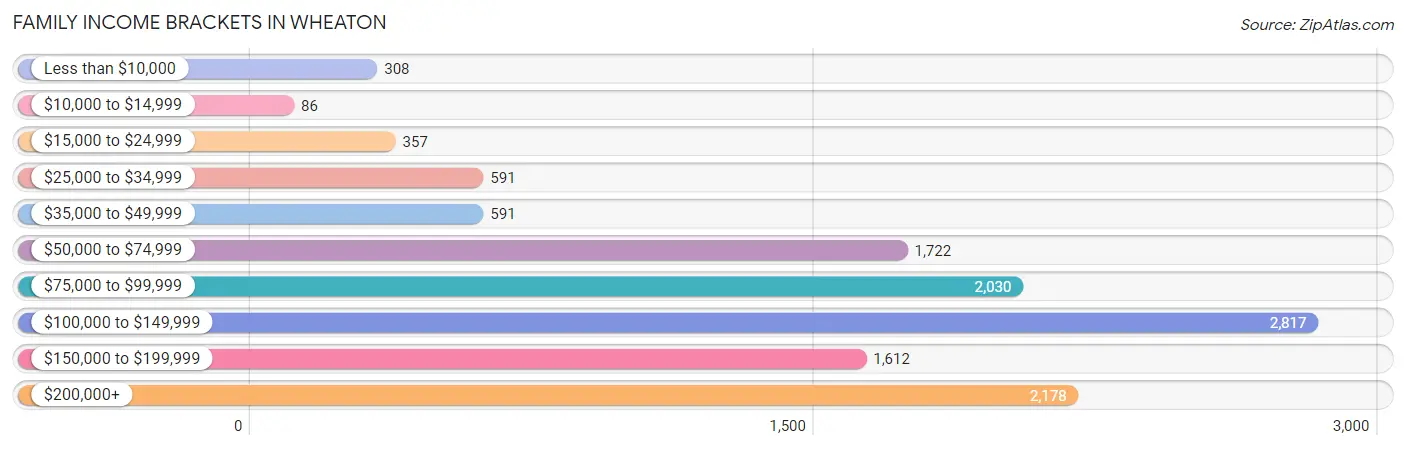
| Income Bracket | # Families | % Families |
| Less than $10,000 | 308 | 2.5% |
| $10,000 to $14,999 | 86 | 0.7% |
| $15,000 to $24,999 | 357 | 2.9% |
| $25,000 to $34,999 | 591 | 4.8% |
| $35,000 to $49,999 | 591 | 4.8% |
| $50,000 to $74,999 | 1,722 | 14.0% |
| $75,000 to $99,999 | 2,030 | 16.5% |
| $100,000 to $149,999 | 2,817 | 22.9% |
| $150,000 to $199,999 | 1,612 | 13.1% |
| $200,000+ | 2,178 | 17.7% |
Family Income by Famaliy Size in Wheaton
7+ person families (751 | 6.1%) account for the highest median family income in Wheaton with $138,914 per family, while 2-person families (4,196 | 34.1%) have the highest median income of $48,700 per family member.
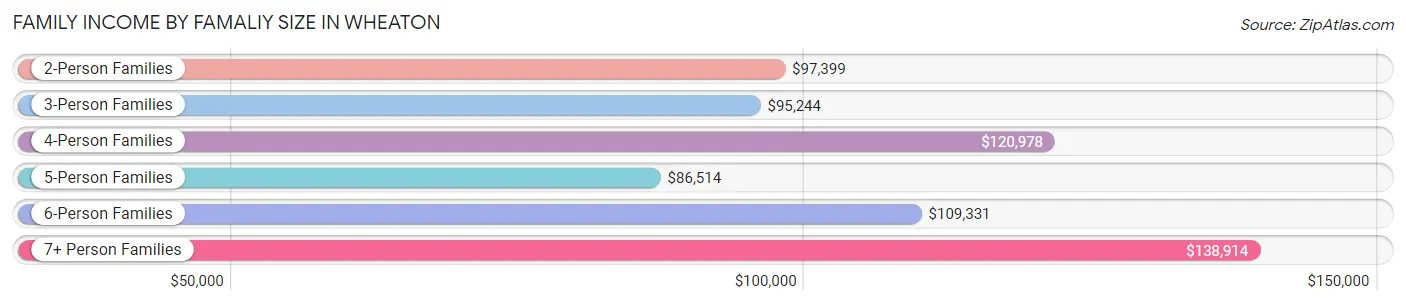
| Income Bracket | # Families | Median Income |
| 2-Person Families | 4,196 (34.1%) | $97,399 |
| 3-Person Families | 2,841 (23.1%) | $95,244 |
| 4-Person Families | 2,582 (21.0%) | $120,978 |
| 5-Person Families | 1,349 (11.0%) | $86,514 |
| 6-Person Families | 584 (4.8%) | $109,331 |
| 7+ Person Families | 751 (6.1%) | $138,914 |
| Total | 12,303 (100.0%) | $108,147 |
Family Income by Number of Earners in Wheaton
The median family income in Wheaton is $108,147, with families comprising 3+ earners (2,994) having the highest median family income of $133,878, while families with no earners (961) have the lowest median family income of $65,179, accounting for 24.3% and 7.8% of families, respectively.
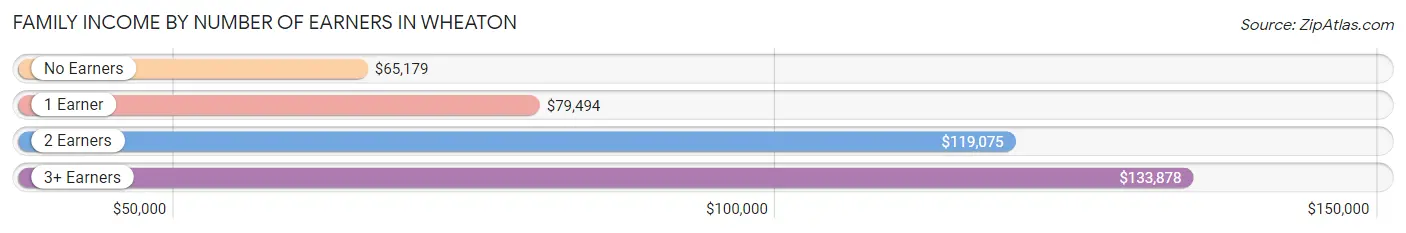
| Number of Earners | # Families | Median Income |
| No Earners | 961 (7.8%) | $65,179 |
| 1 Earner | 2,953 (24.0%) | $79,494 |
| 2 Earners | 5,395 (43.9%) | $119,075 |
| 3+ Earners | 2,994 (24.3%) | $133,878 |
| Total | 12,303 (100.0%) | $108,147 |
Household Income in Wheaton
Household Income Brackets in Wheaton
With 3,782 households falling in the category, the $100,000 to $149,999 income range is the most frequent in Wheaton, accounting for 22.6% of all households. In contrast, only 435 households (2.6%) fall into the $10,000 to $14,999 income bracket, making it the least populous group.
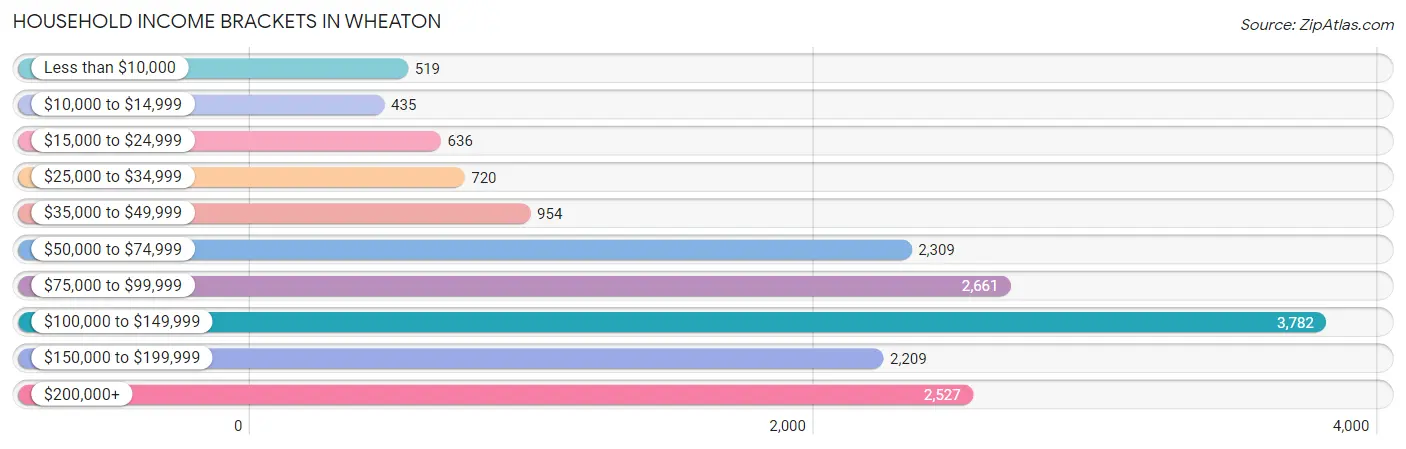
| Income Bracket | # Households | % Households |
| Less than $10,000 | 519 | 3.1% |
| $10,000 to $14,999 | 435 | 2.6% |
| $15,000 to $24,999 | 636 | 3.8% |
| $25,000 to $34,999 | 720 | 4.3% |
| $35,000 to $49,999 | 954 | 5.7% |
| $50,000 to $74,999 | 2,309 | 13.8% |
| $75,000 to $99,999 | 2,661 | 15.9% |
| $100,000 to $149,999 | 3,782 | 22.6% |
| $150,000 to $199,999 | 2,209 | 13.2% |
| $200,000+ | 2,527 | 15.1% |
Household Income by Householder Age in Wheaton
The median household income in Wheaton is $101,229, with the highest median household income of $114,826 found in the 25 to 44 years age bracket for the primary householder. A total of 6,002 households (35.9%) fall into this category. Meanwhile, the 15 to 24 years age bracket for the primary householder has the lowest median household income of $75,200, with 290 households (1.7%) in this group.
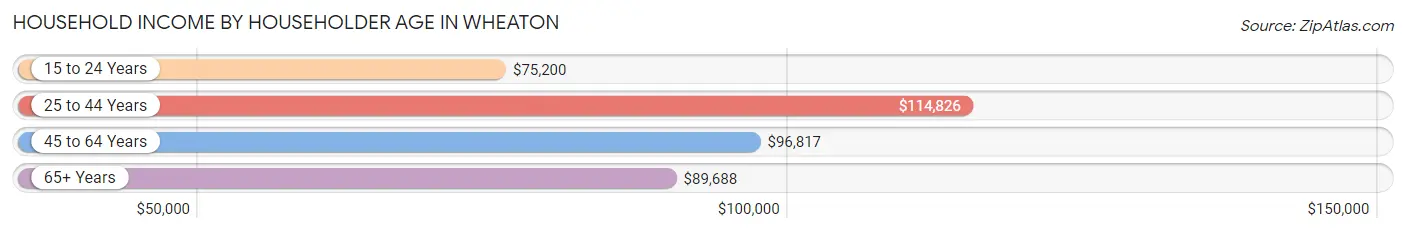
| Income Bracket | # Households | Median Income |
| 15 to 24 Years | 290 (1.7%) | $75,200 |
| 25 to 44 Years | 6,002 (35.9%) | $114,826 |
| 45 to 64 Years | 6,825 (40.8%) | $96,817 |
| 65+ Years | 3,617 (21.6%) | $89,688 |
| Total | 16,734 (100.0%) | $101,229 |
Poverty in Wheaton
Income Below Poverty by Sex and Age in Wheaton
With 9.1% poverty level for males and 10.8% for females among the residents of Wheaton, 5 year old males and 16 and 17 year old females are the most vulnerable to poverty, with 124 males (38.0%) and 156 females (22.2%) in their respective age groups living below the poverty level.
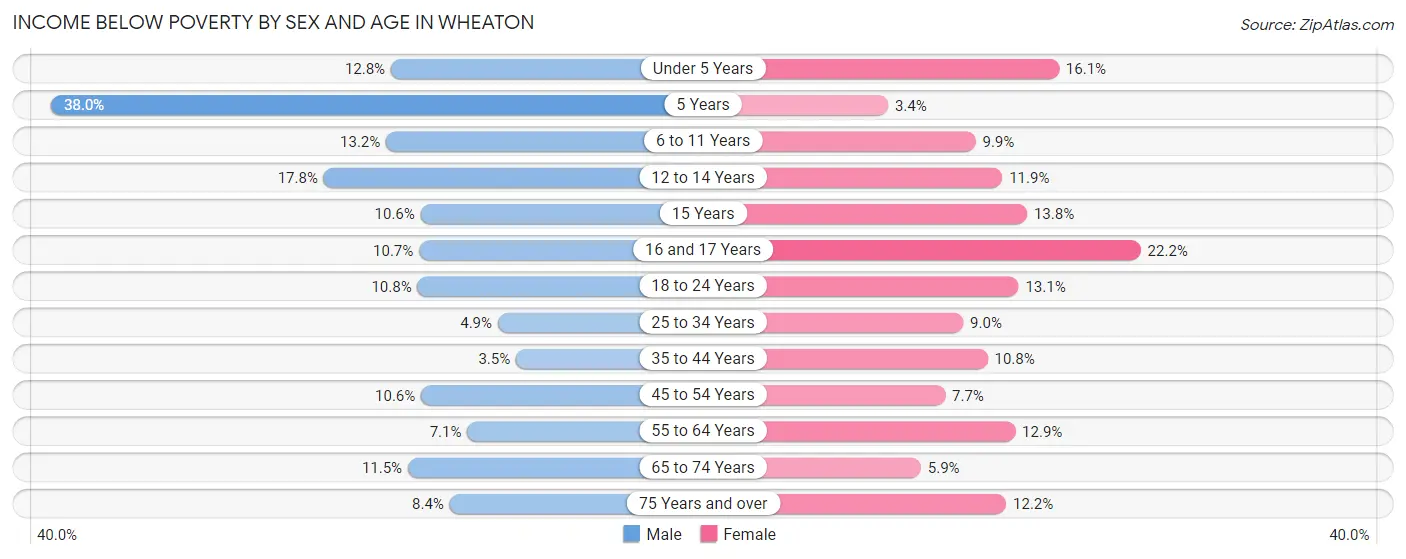
| Age Bracket | Male | Female |
| Under 5 Years | 179 (12.8%) | 279 (16.1%) |
| 5 Years | 124 (38.0%) | 16 (3.4%) |
| 6 to 11 Years | 295 (13.2%) | 199 (9.9%) |
| 12 to 14 Years | 179 (17.8%) | 86 (11.9%) |
| 15 Years | 32 (10.6%) | 59 (13.8%) |
| 16 and 17 Years | 78 (10.7%) | 156 (22.2%) |
| 18 to 24 Years | 261 (10.8%) | 277 (13.1%) |
| 25 to 34 Years | 222 (4.9%) | 365 (9.0%) |
| 35 to 44 Years | 144 (3.5%) | 360 (10.8%) |
| 45 to 54 Years | 378 (10.6%) | 249 (7.7%) |
| 55 to 64 Years | 230 (7.1%) | 427 (12.9%) |
| 65 to 74 Years | 234 (11.5%) | 115 (5.9%) |
| 75 Years and over | 69 (8.4%) | 180 (12.2%) |
| Total | 2,425 (9.1%) | 2,768 (10.8%) |
Income Above Poverty by Sex and Age in Wheaton
According to the poverty statistics in Wheaton, males aged 35 to 44 years and females aged 5 years are the age groups that are most secure financially, with 96.5% of males and 96.6% of females in these age groups living above the poverty line.
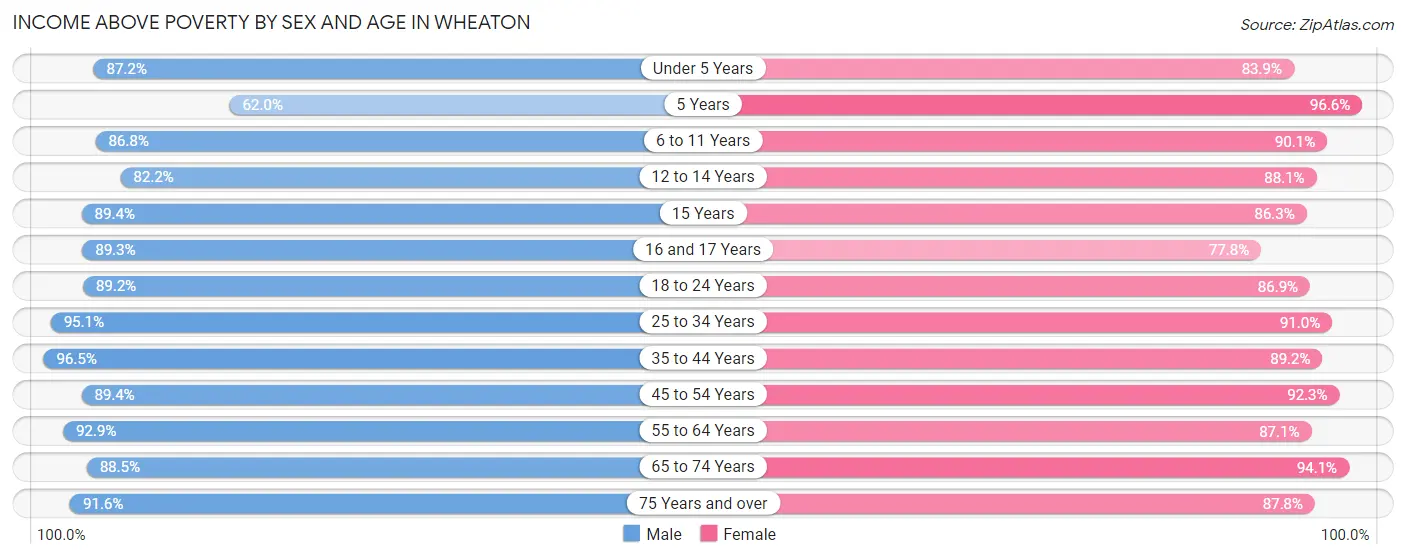
| Age Bracket | Male | Female |
| Under 5 Years | 1,219 (87.2%) | 1,452 (83.9%) |
| 5 Years | 202 (62.0%) | 451 (96.6%) |
| 6 to 11 Years | 1,947 (86.8%) | 1,806 (90.1%) |
| 12 to 14 Years | 827 (82.2%) | 636 (88.1%) |
| 15 Years | 270 (89.4%) | 370 (86.3%) |
| 16 and 17 Years | 650 (89.3%) | 547 (77.8%) |
| 18 to 24 Years | 2,150 (89.2%) | 1,834 (86.9%) |
| 25 to 34 Years | 4,344 (95.1%) | 3,685 (91.0%) |
| 35 to 44 Years | 3,963 (96.5%) | 2,966 (89.2%) |
| 45 to 54 Years | 3,203 (89.4%) | 2,997 (92.3%) |
| 55 to 64 Years | 2,998 (92.9%) | 2,891 (87.1%) |
| 65 to 74 Years | 1,794 (88.5%) | 1,843 (94.1%) |
| 75 Years and over | 749 (91.6%) | 1,295 (87.8%) |
| Total | 24,316 (90.9%) | 22,773 (89.2%) |
Income Below Poverty Among Married-Couple Families in Wheaton
The poverty statistics for married-couple families in Wheaton show that 4.1% or 347 of the total 8,477 families live below the poverty line. Families with 3 or 4 children have the highest poverty rate of 8.1%, comprising of 54 families. On the other hand, families with 5 or more children have the lowest poverty rate of 0.0%, which includes 0 families.
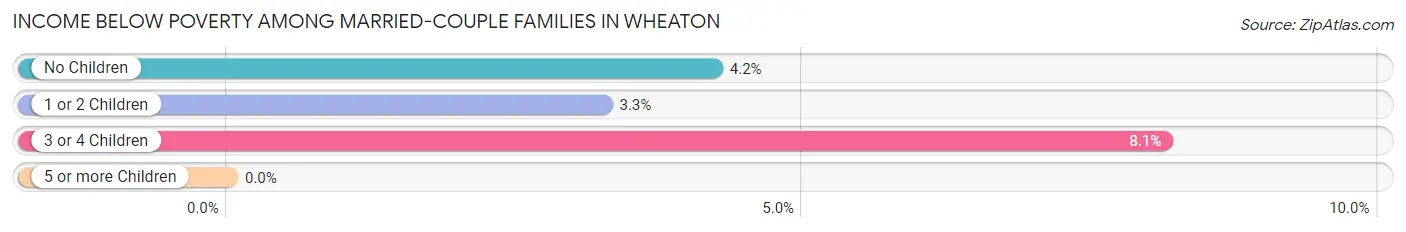
| Children | Above Poverty | Below Poverty |
| No Children | 3,922 (95.8%) | 173 (4.2%) |
| 1 or 2 Children | 3,557 (96.7%) | 120 (3.3%) |
| 3 or 4 Children | 609 (91.9%) | 54 (8.1%) |
| 5 or more Children | 42 (100.0%) | 0 (0.0%) |
| Total | 8,130 (95.9%) | 347 (4.1%) |
Income Below Poverty Among Single-Parent Households in Wheaton
According to the poverty data in Wheaton, 4.7% or 53 single-father households and 19.3% or 523 single-mother households are living below the poverty line. Among single-father households, those with 3 or 4 children have the highest poverty rate, with 14 households (7.1%) experiencing poverty. Likewise, among single-mother households, those with 5 or more children have the highest poverty rate, with 41 households (100.0%) falling below the poverty line.
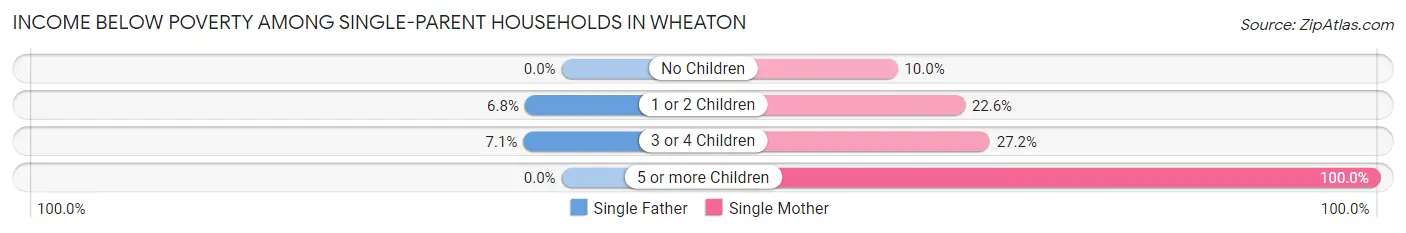
| Children | Single Father | Single Mother |
| No Children | 0 (0.0%) | 109 (10.0%) |
| 1 or 2 Children | 39 (6.8%) | 272 (22.6%) |
| 3 or 4 Children | 14 (7.1%) | 101 (27.2%) |
| 5 or more Children | 0 (0.0%) | 41 (100.0%) |
| Total | 53 (4.7%) | 523 (19.3%) |
Income Below Poverty Among Married-Couple vs Single-Parent Households in Wheaton
The poverty data for Wheaton shows that 347 of the married-couple family households (4.1%) and 576 of the single-parent households (15.0%) are living below the poverty level. Within the married-couple family households, those with 3 or 4 children have the highest poverty rate, with 54 households (8.1%) falling below the poverty line. Among the single-parent households, those with 5 or more children have the highest poverty rate, with 41 household (100.0%) living below poverty.
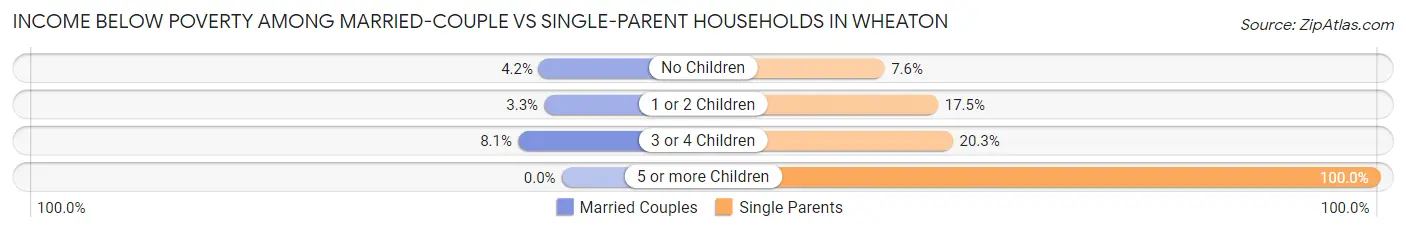
| Children | Married-Couple Families | Single-Parent Households |
| No Children | 173 (4.2%) | 109 (7.5%) |
| 1 or 2 Children | 120 (3.3%) | 311 (17.5%) |
| 3 or 4 Children | 54 (8.1%) | 115 (20.3%) |
| 5 or more Children | 0 (0.0%) | 41 (100.0%) |
| Total | 347 (4.1%) | 576 (15.0%) |
Race in Wheaton
The most populous races in Wheaton are Hispanic or Latino (23,326 | 44.2%), Some other Race (16,900 | 32.0%), and White / Caucasian (15,548 | 29.5%).
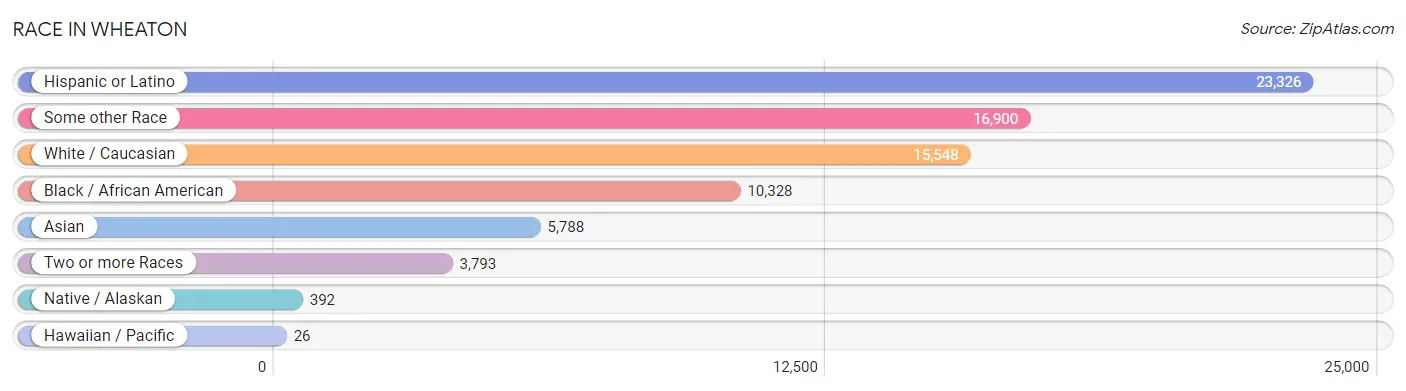
| Race | # Population | % Population |
| Asian | 5,788 | 11.0% |
| Black / African American | 10,328 | 19.6% |
| Hawaiian / Pacific | 26 | 0.1% |
| Hispanic or Latino | 23,326 | 44.2% |
| Native / Alaskan | 392 | 0.7% |
| White / Caucasian | 15,548 | 29.5% |
| Two or more Races | 3,793 | 7.2% |
| Some other Race | 16,900 | 32.0% |
| Total | 52,775 | 100.0% |
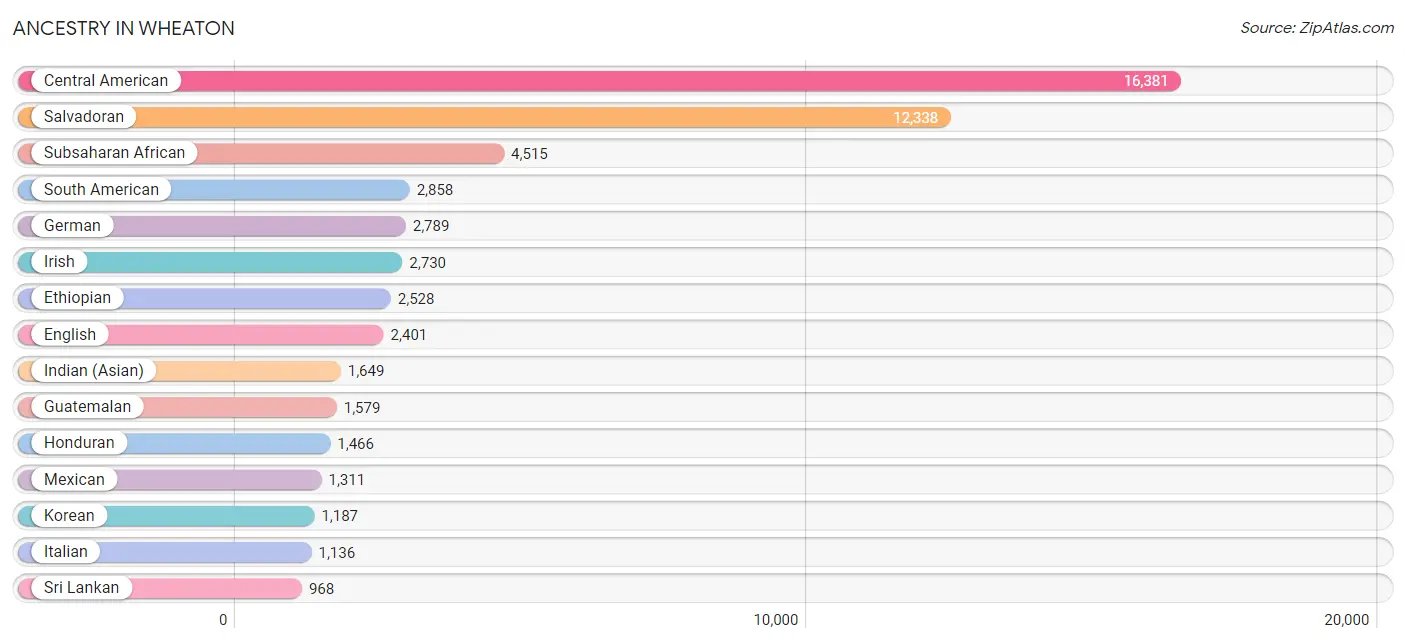
Ancestry in Wheaton
The most populous ancestries reported in Wheaton are Central American (16,381 | 31.0%), Salvadoran (12,338 | 23.4%), Subsaharan African (4,515 | 8.6%), South American (2,858 | 5.4%), and German (2,789 | 5.3%), together accounting for 73.7% of all Wheaton residents.
| Ancestry | # Population | % Population |
| African | 851 | 1.6% |
| Albanian | 36 | 0.1% |
| American | 762 | 1.4% |
| Apache | 16 | 0.0% |
| Arab | 415 | 0.8% |
| Argentinean | 71 | 0.1% |
| Austrian | 215 | 0.4% |
| Barbadian | 9 | 0.0% |
| Bermudan | 12 | 0.0% |
| Bhutanese | 142 | 0.3% |
| Blackfeet | 12 | 0.0% |
| Bolivian | 492 | 0.9% |
| Brazilian | 109 | 0.2% |
| British | 223 | 0.4% |
| British West Indian | 48 | 0.1% |
| Bulgarian | 11 | 0.0% |
| Burmese | 364 | 0.7% |
| Canadian | 35 | 0.1% |
| Central American | 16,381 | 31.0% |
| Central American Indian | 311 | 0.6% |
| Cherokee | 140 | 0.3% |
| Chilean | 160 | 0.3% |
| Choctaw | 19 | 0.0% |
| Colombian | 606 | 1.1% |
| Costa Rican | 66 | 0.1% |
| Creek | 5 | 0.0% |
| Croatian | 40 | 0.1% |
| Cuban | 36 | 0.1% |
| Czech | 64 | 0.1% |
| Danish | 101 | 0.2% |
| Dominican | 896 | 1.7% |
| Dutch | 184 | 0.4% |
| Eastern European | 136 | 0.3% |
| Ecuadorian | 249 | 0.5% |
| Egyptian | 7 | 0.0% |
| English | 2,401 | 4.5% |
| Ethiopian | 2,528 | 4.8% |
| European | 390 | 0.7% |
| Finnish | 70 | 0.1% |
| French | 330 | 0.6% |
| French Canadian | 77 | 0.2% |
| German | 2,789 | 5.3% |
| Ghanaian | 240 | 0.4% |
| Greek | 311 | 0.6% |
| Guamanian / Chamorro | 40 | 0.1% |
| Guatemalan | 1,579 | 3.0% |
| Guyanese | 23 | 0.0% |
| Haitian | 117 | 0.2% |
| Honduran | 1,466 | 2.8% |
| Hungarian | 61 | 0.1% |
| Icelander | 45 | 0.1% |
| Indian (Asian) | 1,649 | 3.1% |
| Indonesian | 81 | 0.2% |
| Iranian | 85 | 0.2% |
| Irish | 2,730 | 5.2% |
| Italian | 1,136 | 2.1% |
| Jamaican | 560 | 1.1% |
| Japanese | 41 | 0.1% |
| Kenyan | 128 | 0.2% |
| Korean | 1,187 | 2.2% |
| Laotian | 153 | 0.3% |
| Latvian | 27 | 0.1% |
| Lebanese | 163 | 0.3% |
| Liberian | 13 | 0.0% |
| Lithuanian | 71 | 0.1% |
| Mexican | 1,311 | 2.5% |
| Mexican American Indian | 307 | 0.6% |
| Nicaraguan | 578 | 1.1% |
| Nigerian | 317 | 0.6% |
| Northern European | 56 | 0.1% |
| Norwegian | 93 | 0.2% |
| Pakistani | 481 | 0.9% |
| Palestinian | 78 | 0.2% |
| Panamanian | 331 | 0.6% |
| Paraguayan | 116 | 0.2% |
| Pennsylvania German | 9 | 0.0% |
| Peruvian | 801 | 1.5% |
| Polish | 563 | 1.1% |
| Portuguese | 445 | 0.8% |
| Puerto Rican | 808 | 1.5% |
| Romanian | 9 | 0.0% |
| Russian | 416 | 0.8% |
| Salvadoran | 12,338 | 23.4% |
| Scandinavian | 232 | 0.4% |
| Scotch-Irish | 277 | 0.5% |
| Scottish | 359 | 0.7% |
| Slovak | 24 | 0.1% |
| Slovene | 66 | 0.1% |
| South African | 9 | 0.0% |
| South American | 2,858 | 5.4% |
| South American Indian | 31 | 0.1% |
| Spaniard | 89 | 0.2% |
| Spanish | 47 | 0.1% |
| Sri Lankan | 968 | 1.8% |
| Subsaharan African | 4,515 | 8.6% |
| Swedish | 284 | 0.5% |
| Swiss | 111 | 0.2% |
| Syrian | 13 | 0.0% |
| Thai | 350 | 0.7% |
| Trinidadian and Tobagonian | 49 | 0.1% |
| Turkish | 51 | 0.1% |
| U.S. Virgin Islander | 5 | 0.0% |
| Ukrainian | 95 | 0.2% |
| Uruguayan | 116 | 0.2% |
| Venezuelan | 247 | 0.5% |
| Welsh | 85 | 0.2% |
| West Indian | 34 | 0.1% |
| Yugoslavian | 10 | 0.0% |
| Zimbabwean | 77 | 0.2% | View All 109 Rows |
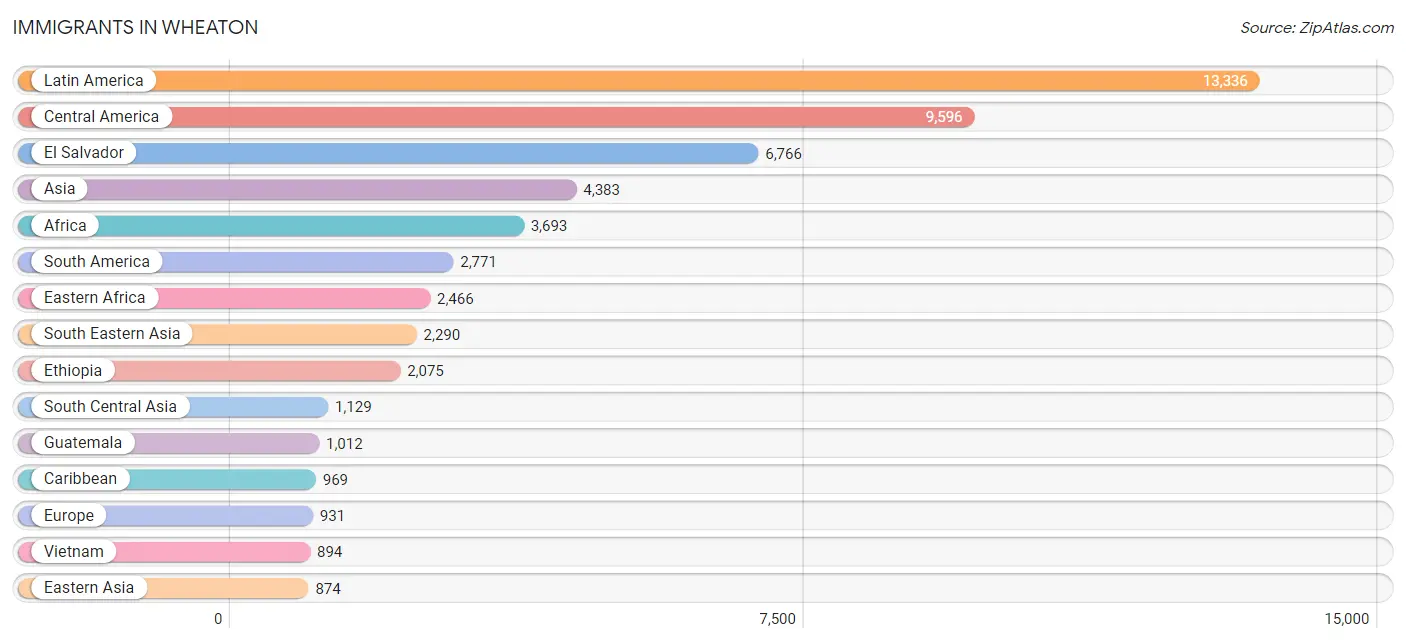
Immigrants in Wheaton
The most numerous immigrant groups reported in Wheaton came from Latin America (13,336 | 25.3%), Central America (9,596 | 18.2%), El Salvador (6,766 | 12.8%), Asia (4,383 | 8.3%), and Africa (3,693 | 7.0%), together accounting for 71.6% of all Wheaton residents.
| Immigration Origin | # Population | % Population |
| Africa | 3,693 | 7.0% |
| Albania | 12 | 0.0% |
| Argentina | 25 | 0.1% |
| Asia | 4,383 | 8.3% |
| Bahamas | 4 | 0.0% |
| Bangladesh | 57 | 0.1% |
| Belarus | 22 | 0.0% |
| Bolivia | 459 | 0.9% |
| Bosnia and Herzegovina | 18 | 0.0% |
| Brazil | 285 | 0.5% |
| Bulgaria | 11 | 0.0% |
| Cabo Verde | 38 | 0.1% |
| Cambodia | 54 | 0.1% |
| Canada | 21 | 0.0% |
| Caribbean | 969 | 1.8% |
| Central America | 9,596 | 18.2% |
| Chile | 103 | 0.2% |
| China | 725 | 1.4% |
| Colombia | 548 | 1.0% |
| Congo | 8 | 0.0% |
| Costa Rica | 36 | 0.1% |
| Cuba | 14 | 0.0% |
| Dominican Republic | 547 | 1.0% |
| Eastern Africa | 2,466 | 4.7% |
| Eastern Asia | 874 | 1.7% |
| Eastern Europe | 152 | 0.3% |
| Ecuador | 273 | 0.5% |
| El Salvador | 6,766 | 12.8% |
| England | 28 | 0.1% |
| Eritrea | 196 | 0.4% |
| Ethiopia | 2,075 | 3.9% |
| Europe | 931 | 1.8% |
| France | 47 | 0.1% |
| Germany | 93 | 0.2% |
| Ghana | 237 | 0.4% |
| Greece | 70 | 0.1% |
| Grenada | 12 | 0.0% |
| Guatemala | 1,012 | 1.9% |
| Guyana | 6 | 0.0% |
| Haiti | 16 | 0.0% |
| Honduras | 734 | 1.4% |
| Hong Kong | 72 | 0.1% |
| India | 182 | 0.3% |
| Indonesia | 87 | 0.2% |
| Iran | 30 | 0.1% |
| Ireland | 25 | 0.1% |
| Israel | 10 | 0.0% |
| Italy | 19 | 0.0% |
| Jamaica | 355 | 0.7% |
| Japan | 24 | 0.1% |
| Jordan | 8 | 0.0% |
| Kenya | 76 | 0.1% |
| Korea | 125 | 0.2% |
| Latin America | 13,336 | 25.3% |
| Liberia | 19 | 0.0% |
| Malaysia | 38 | 0.1% |
| Mexico | 686 | 1.3% |
| Middle Africa | 235 | 0.4% |
| Morocco | 16 | 0.0% |
| Nepal | 752 | 1.4% |
| Netherlands | 9 | 0.0% |
| Nicaragua | 240 | 0.4% |
| Nigeria | 119 | 0.2% |
| Northern Africa | 38 | 0.1% |
| Northern Europe | 372 | 0.7% |
| Pakistan | 49 | 0.1% |
| Panama | 122 | 0.2% |
| Peru | 730 | 1.4% |
| Philippines | 783 | 1.5% |
| Poland | 11 | 0.0% |
| Portugal | 153 | 0.3% |
| Romania | 47 | 0.1% |
| Russia | 23 | 0.0% |
| Senegal | 61 | 0.1% |
| Sierra Leone | 34 | 0.1% |
| South Africa | 4 | 0.0% |
| South America | 2,771 | 5.2% |
| South Central Asia | 1,129 | 2.1% |
| South Eastern Asia | 2,290 | 4.3% |
| Southern Europe | 256 | 0.5% |
| Spain | 14 | 0.0% |
| Sri Lanka | 59 | 0.1% |
| Sweden | 14 | 0.0% |
| Taiwan | 89 | 0.2% |
| Thailand | 353 | 0.7% |
| Trinidad and Tobago | 21 | 0.0% |
| Turkey | 30 | 0.1% |
| Uganda | 8 | 0.0% |
| Ukraine | 8 | 0.0% |
| Venezuela | 247 | 0.5% |
| Vietnam | 894 | 1.7% |
| Western Africa | 874 | 1.7% |
| Western Asia | 81 | 0.2% |
| Western Europe | 151 | 0.3% |
| Yemen | 33 | 0.1% |
| Zaire | 213 | 0.4% |
| Zimbabwe | 87 | 0.2% | View All 97 Rows |
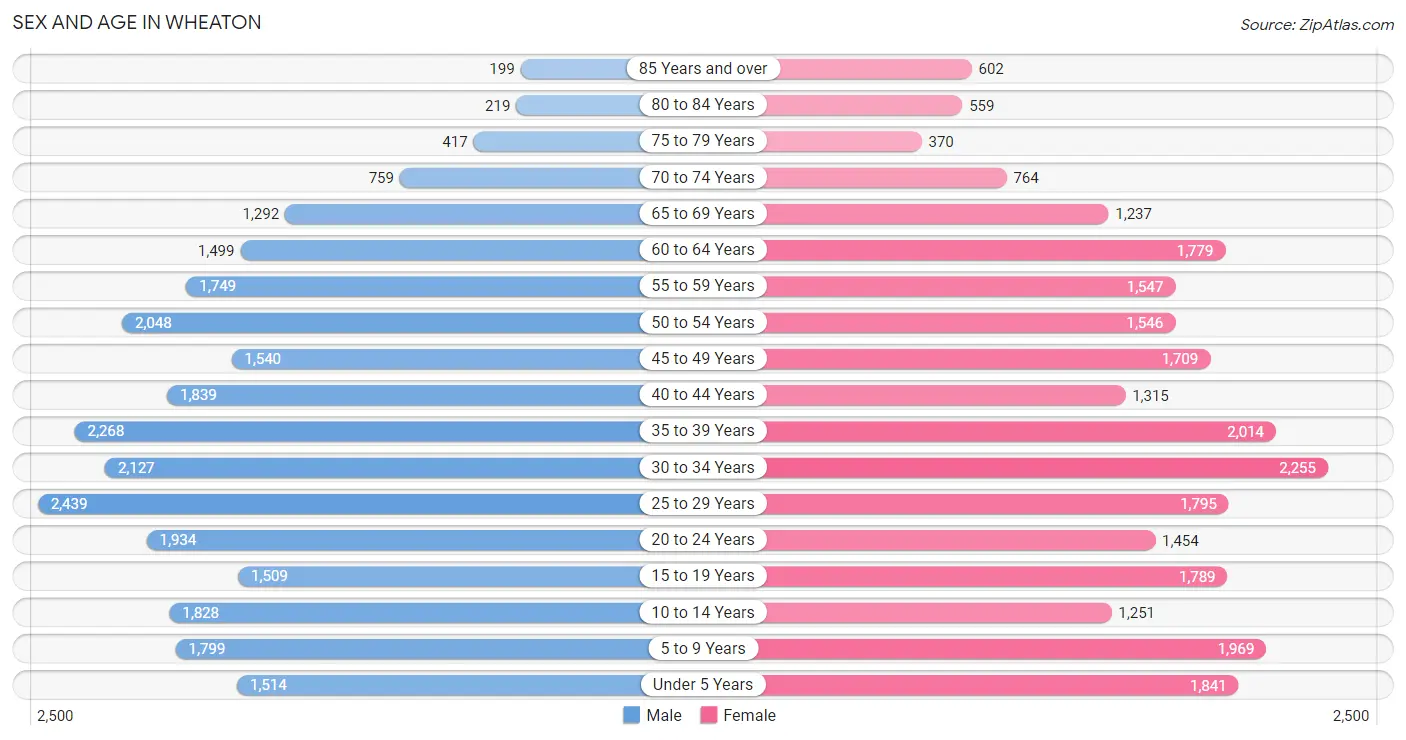
Sex and Age in Wheaton
Sex and Age in Wheaton
The most populous age groups in Wheaton are 25 to 29 Years (2,439 | 9.0%) for men and 30 to 34 Years (2,255 | 8.7%) for women.
| Age Bracket | Male | Female |
| Under 5 Years | 1,514 (5.6%) | 1,841 (7.1%) |
| 5 to 9 Years | 1,799 (6.7%) | 1,969 (7.6%) |
| 10 to 14 Years | 1,828 (6.8%) | 1,251 (4.9%) |
| 15 to 19 Years | 1,509 (5.6%) | 1,789 (6.9%) |
| 20 to 24 Years | 1,934 (7.2%) | 1,454 (5.6%) |
| 25 to 29 Years | 2,439 (9.0%) | 1,795 (7.0%) |
| 30 to 34 Years | 2,127 (7.9%) | 2,255 (8.7%) |
| 35 to 39 Years | 2,268 (8.4%) | 2,014 (7.8%) |
| 40 to 44 Years | 1,839 (6.8%) | 1,315 (5.1%) |
| 45 to 49 Years | 1,540 (5.7%) | 1,709 (6.6%) |
| 50 to 54 Years | 2,048 (7.6%) | 1,546 (6.0%) |
| 55 to 59 Years | 1,749 (6.5%) | 1,547 (6.0%) |
| 60 to 64 Years | 1,499 (5.6%) | 1,779 (6.9%) |
| 65 to 69 Years | 1,292 (4.8%) | 1,237 (4.8%) |
| 70 to 74 Years | 759 (2.8%) | 764 (3.0%) |
| 75 to 79 Years | 417 (1.5%) | 370 (1.4%) |
| 80 to 84 Years | 219 (0.8%) | 559 (2.2%) |
| 85 Years and over | 199 (0.7%) | 602 (2.3%) |
| Total | 26,979 (100.0%) | 25,796 (100.0%) |
Families and Households in Wheaton
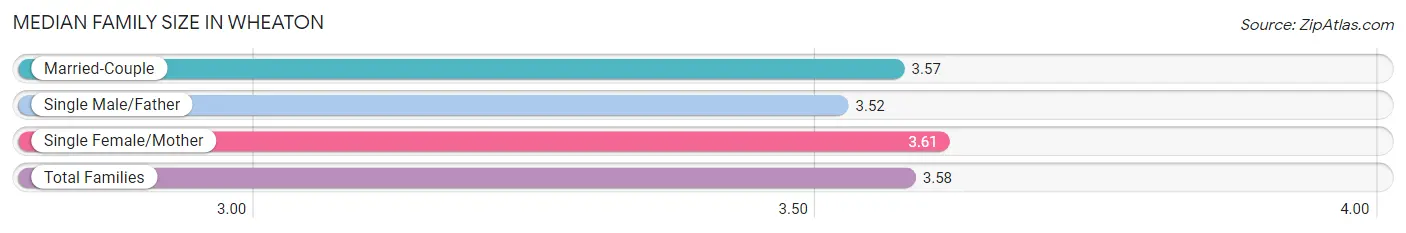
Median Family Size in Wheaton
The median family size in Wheaton is 3.58 persons per family, with single female/mother families (2,704 | 22.0%) accounting for the largest median family size of 3.61 persons per family. On the other hand, single male/father families (1,122 | 9.1%) represent the smallest median family size with 3.52 persons per family.
| Family Type | # Families | Family Size |
| Married-Couple | 8,477 (68.9%) | 3.57 |
| Single Male/Father | 1,122 (9.1%) | 3.52 |
| Single Female/Mother | 2,704 (22.0%) | 3.61 |
| Total Families | 12,303 (100.0%) | 3.58 |
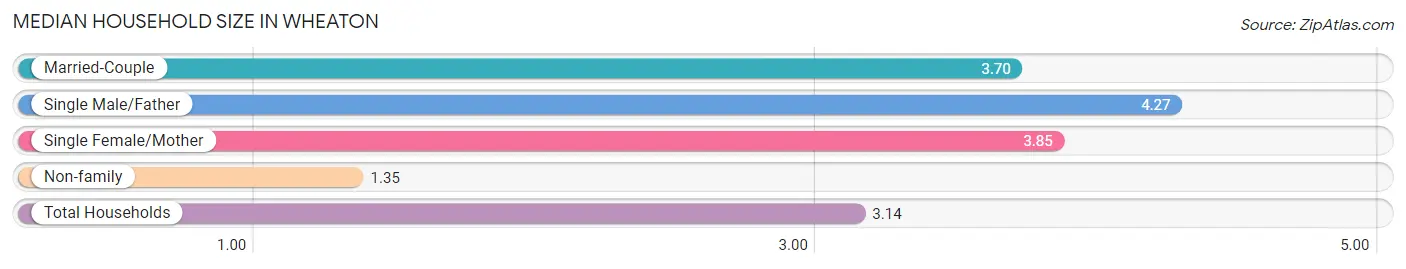
Median Household Size in Wheaton
The median household size in Wheaton is 3.14 persons per household, with single male/father households (1,122 | 6.7%) accounting for the largest median household size of 4.27 persons per household. non-family households (4,431 | 26.5%) represent the smallest median household size with 1.35 persons per household.
| Household Type | # Households | Household Size |
| Married-Couple | 8,477 (50.7%) | 3.70 |
| Single Male/Father | 1,122 (6.7%) | 4.27 |
| Single Female/Mother | 2,704 (16.2%) | 3.85 |
| Non-family | 4,431 (26.5%) | 1.35 |
| Total Households | 16,734 (100.0%) | 3.14 |
Household Size by Marriage Status in Wheaton
Out of a total of 16,734 households in Wheaton, 12,303 (73.5%) are family households, while 4,431 (26.5%) are nonfamily households. The most numerous type of family households are 2-person households, comprising 3,719, and the most common type of nonfamily households are 1-person households, comprising 3,455.
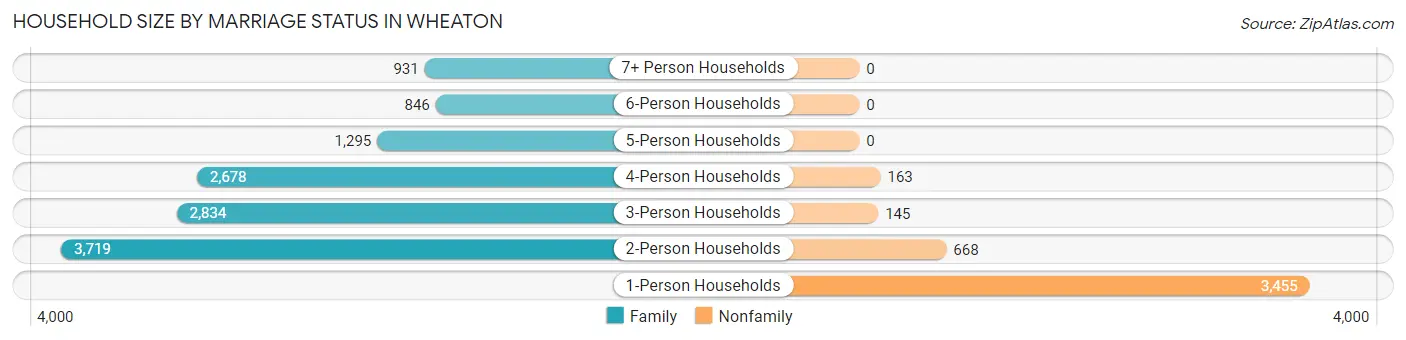
| Household Size | Family Households | Nonfamily Households |
| 1-Person Households | - | 3,455 (20.6%) |
| 2-Person Households | 3,719 (22.2%) | 668 (4.0%) |
| 3-Person Households | 2,834 (16.9%) | 145 (0.9%) |
| 4-Person Households | 2,678 (16.0%) | 163 (1.0%) |
| 5-Person Households | 1,295 (7.7%) | 0 (0.0%) |
| 6-Person Households | 846 (5.1%) | 0 (0.0%) |
| 7+ Person Households | 931 (5.6%) | 0 (0.0%) |
| Total | 12,303 (73.5%) | 4,431 (26.5%) |
Female Fertility in Wheaton
Fertility by Age in Wheaton
Average fertility rate in Wheaton is 71.0 births per 1,000 women. Women in the age bracket of 20 to 34 years have the highest fertility rate with 108.0 births per 1,000 women. Women in the age bracket of 20 to 34 years acount for 66.6% of all women with births.
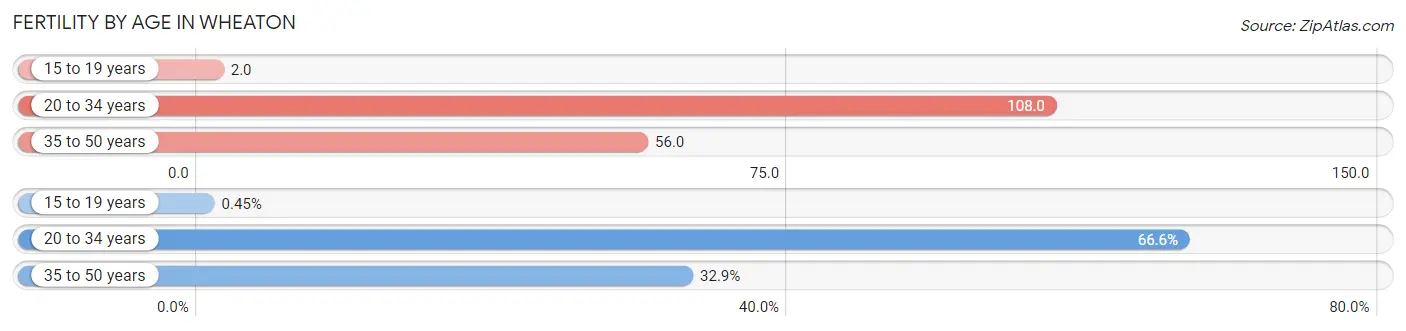
| Age Bracket | Women with Births | Births / 1,000 Women |
| 15 to 19 years | 4 (0.4%) | 2.0 |
| 20 to 34 years | 597 (66.6%) | 108.0 |
| 35 to 50 years | 295 (32.9%) | 56.0 |
| Total | 896 (100.0%) | 71.0 |
Fertility by Age by Marriage Status in Wheaton
64.5% of women with births (896) in Wheaton are married. The highest percentage of unmarried women with births falls into 15 to 19 years age bracket with 100.0% of them unmarried at the time of birth, while the lowest percentage of unmarried women with births belong to 35 to 50 years age bracket with 33.2% of them unmarried.
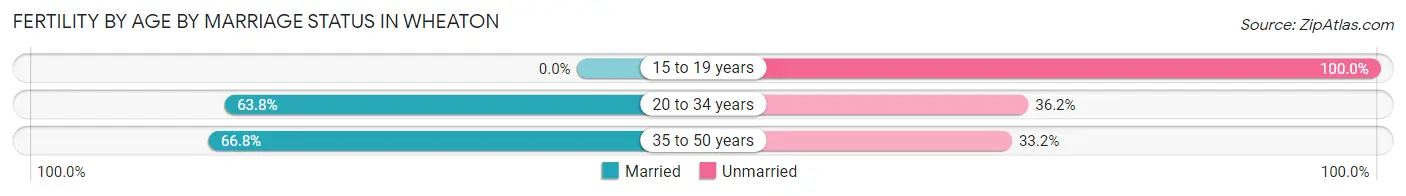
| Age Bracket | Married | Unmarried |
| 15 to 19 years | 0 (0.0%) | 4 (100.0%) |
| 20 to 34 years | 381 (63.8%) | 216 (36.2%) |
| 35 to 50 years | 197 (66.8%) | 98 (33.2%) |
| Total | 578 (64.5%) | 318 (35.5%) |
Fertility by Education in Wheaton
Average fertility rate in Wheaton is 71.0 births per 1,000 women. Women with the education attainment of graduate degree have the highest fertility rate of 109.0 births per 1,000 women, while women with the education attainment of bachelor's degree have the lowest fertility at 15.0 births per 1,000 women. Women with the education attainment of high school diploma represent 30.5% of all women with births.
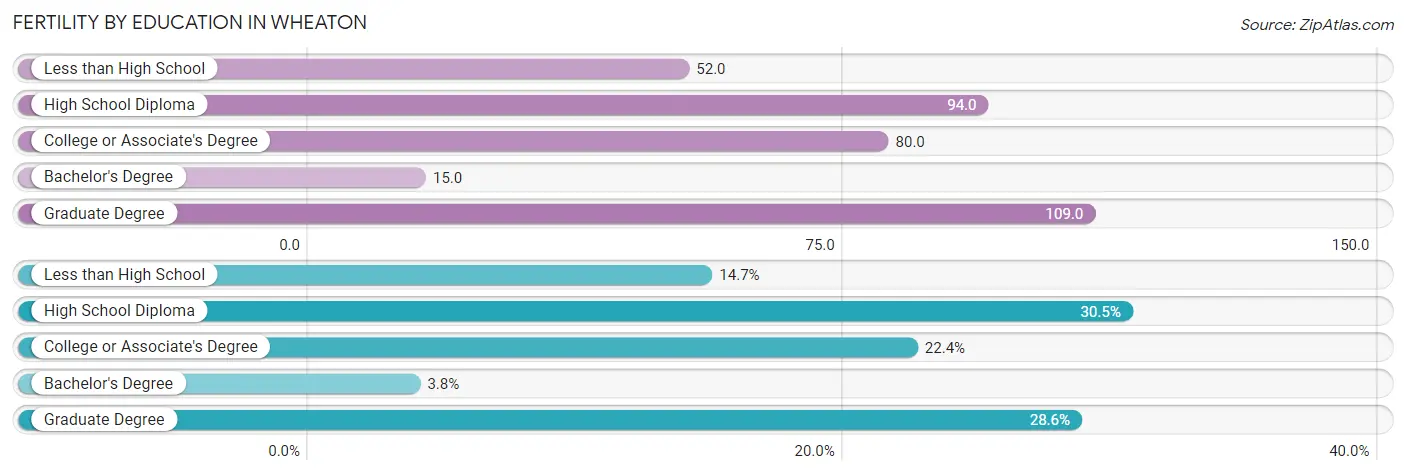
| Educational Attainment | Women with Births | Births / 1,000 Women |
| Less than High School | 132 (14.7%) | 52.0 |
| High School Diploma | 273 (30.5%) | 94.0 |
| College or Associate's Degree | 201 (22.4%) | 80.0 |
| Bachelor's Degree | 34 (3.8%) | 15.0 |
| Graduate Degree | 256 (28.6%) | 109.0 |
| Total | 896 (100.0%) | 71.0 |
Fertility by Education by Marriage Status in Wheaton
35.5% of women with births in Wheaton are unmarried. Women with the educational attainment of bachelor's degree are most likely to be married with 100.0% of them married at childbirth, while women with the educational attainment of less than high school are least likely to be married with 93.9% of them unmarried at childbirth.
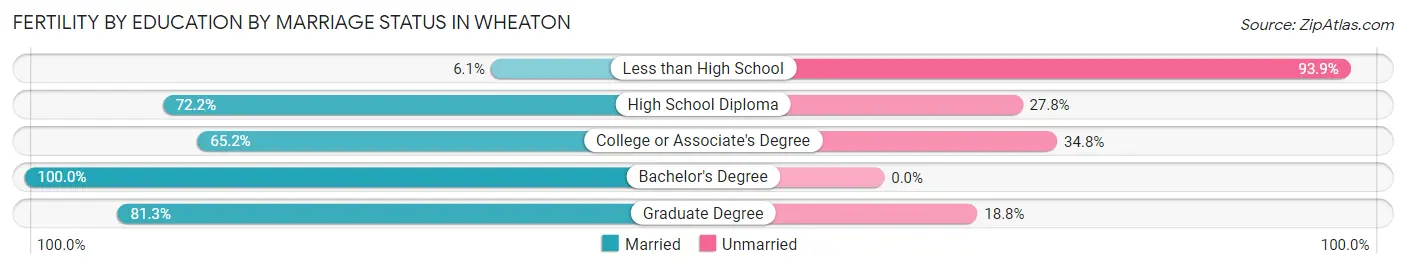
| Educational Attainment | Married | Unmarried |
| Less than High School | 8 (6.1%) | 124 (93.9%) |
| High School Diploma | 197 (72.2%) | 76 (27.8%) |
| College or Associate's Degree | 131 (65.2%) | 70 (34.8%) |
| Bachelor's Degree | 34 (100.0%) | 0 (0.0%) |
| Graduate Degree | 208 (81.2%) | 48 (18.8%) |
| Total | 578 (64.5%) | 318 (35.5%) |
Employment Characteristics in Wheaton
Employment by Class of Employer in Wheaton
Among the 27,285 employed individuals in Wheaton, private company employees (16,869 | 61.8%), federal government employees (2,921 | 10.7%), and not-for-profit organizations (2,503 | 9.2%) make up the most common classes of employment.
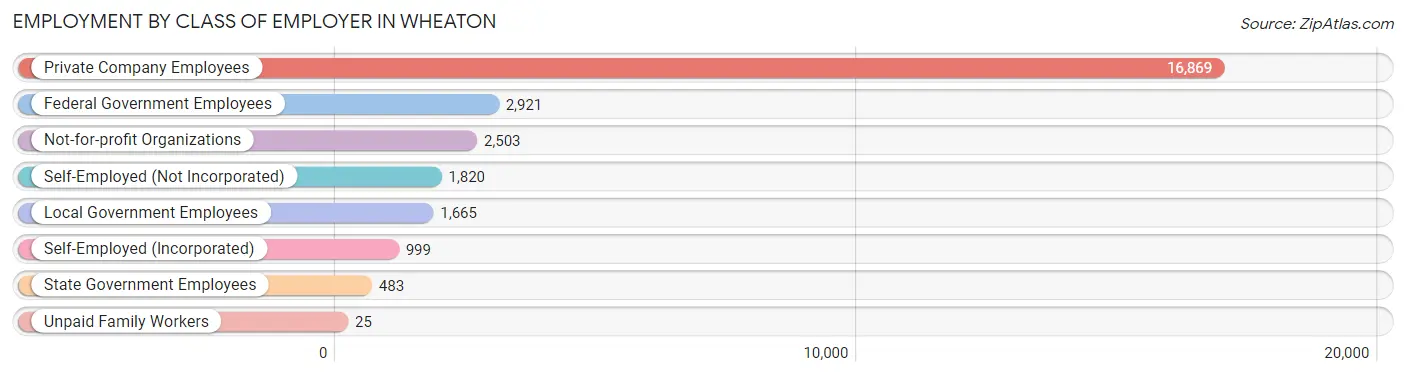
| Employer Class | # Employees | % Employees |
| Private Company Employees | 16,869 | 61.8% |
| Self-Employed (Incorporated) | 999 | 3.7% |
| Self-Employed (Not Incorporated) | 1,820 | 6.7% |
| Not-for-profit Organizations | 2,503 | 9.2% |
| Local Government Employees | 1,665 | 6.1% |
| State Government Employees | 483 | 1.8% |
| Federal Government Employees | 2,921 | 10.7% |
| Unpaid Family Workers | 25 | 0.1% |
| Total | 27,285 | 100.0% |
Employment Status by Age in Wheaton
According to the labor force statistics for Wheaton, out of the total population over 16 years of age (41,842), 72.3% or 30,252 individuals are in the labor force, with 6.0% or 1,815 of them unemployed. The age group with the highest labor force participation rate is 30 to 34 years, with 91.4% or 4,005 individuals in the labor force. Within the labor force, the 16 to 19 years age range has the highest percentage of unemployed individuals, with 34.4% or 272 of them being unemployed.
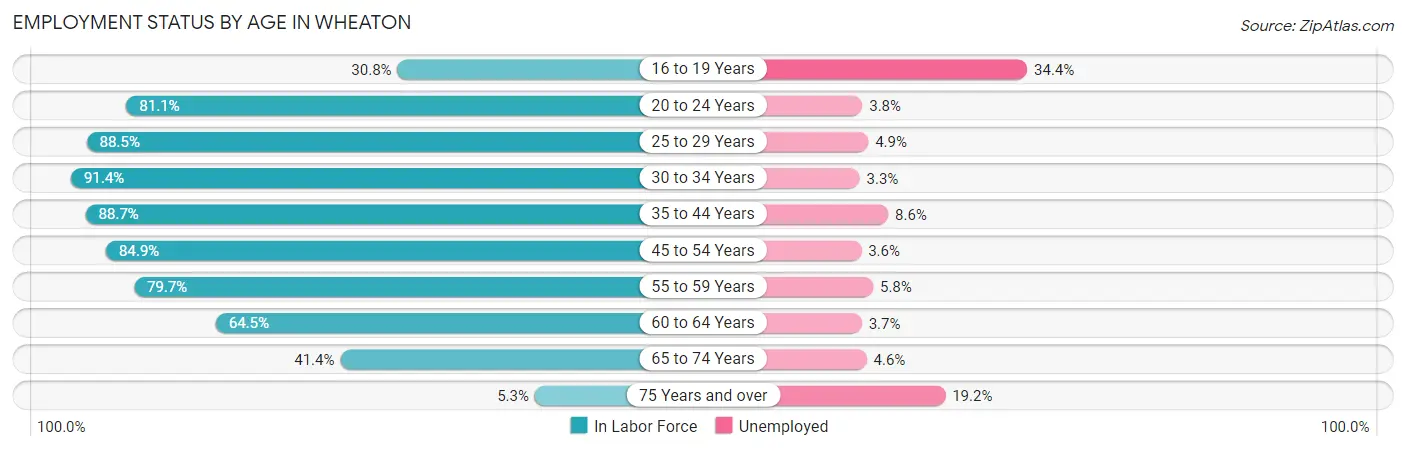
| Age Bracket | In Labor Force | Unemployed |
| 16 to 19 Years | 791 (30.8%) | 272 (34.4%) |
| 20 to 24 Years | 2,748 (81.1%) | 104 (3.8%) |
| 25 to 29 Years | 3,747 (88.5%) | 184 (4.9%) |
| 30 to 34 Years | 4,005 (91.4%) | 132 (3.3%) |
| 35 to 44 Years | 6,596 (88.7%) | 567 (8.6%) |
| 45 to 54 Years | 5,810 (84.9%) | 209 (3.6%) |
| 55 to 59 Years | 2,627 (79.7%) | 152 (5.8%) |
| 60 to 64 Years | 2,114 (64.5%) | 78 (3.7%) |
| 65 to 74 Years | 1,678 (41.4%) | 77 (4.6%) |
| 75 Years and over | 125 (5.3%) | 24 (19.2%) |
| Total | 30,252 (72.3%) | 1,815 (6.0%) |
Employment Status by Educational Attainment in Wheaton
According to labor force statistics for Wheaton, 84.5% of individuals (24,901) out of the total population between 25 and 64 years of age (29,469) are in the labor force, with 5.3% or 1,320 of them being unemployed. The group with the highest labor force participation rate are those with the educational attainment of bachelor's degree or higher, with 88.4% or 9,566 individuals in the labor force. Within the labor force, individuals with high school diploma education have the highest percentage of unemployment, with 7.6% or 391 of them being unemployed.
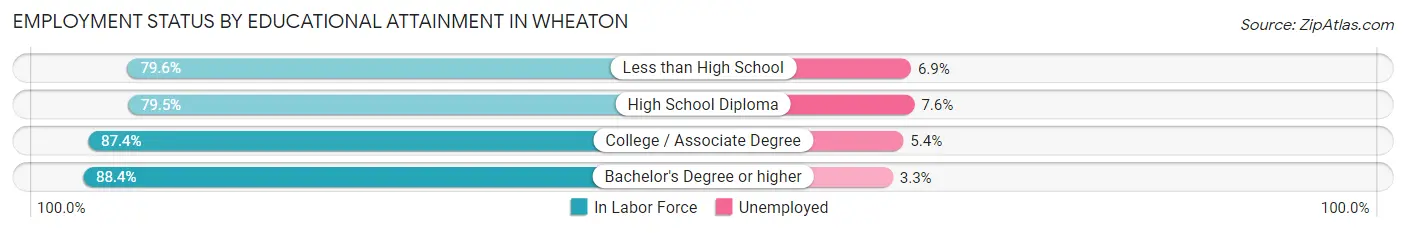
| Educational Attainment | In Labor Force | Unemployed |
| Less than High School | 4,624 (79.6%) | 401 (6.9%) |
| High School Diploma | 5,146 (79.5%) | 492 (7.6%) |
| College / Associate Degree | 5,564 (87.4%) | 344 (5.4%) |
| Bachelor's Degree or higher | 9,566 (88.4%) | 357 (3.3%) |
| Total | 24,901 (84.5%) | 1,562 (5.3%) |
Employment Occupations by Sex in Wheaton
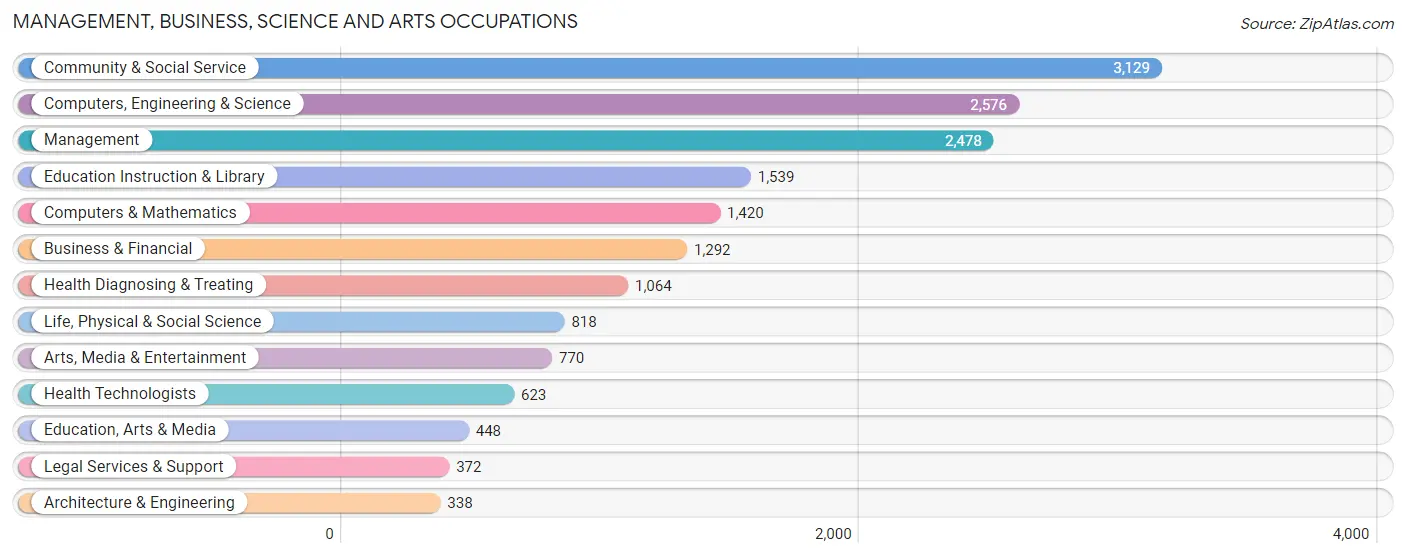
Management, Business, Science and Arts Occupations
The most common Management, Business, Science and Arts occupations in Wheaton are Community & Social Service (3,129 | 11.1%), Computers, Engineering & Science (2,576 | 9.1%), Management (2,478 | 8.8%), Education Instruction & Library (1,539 | 5.5%), and Computers & Mathematics (1,420 | 5.0%).
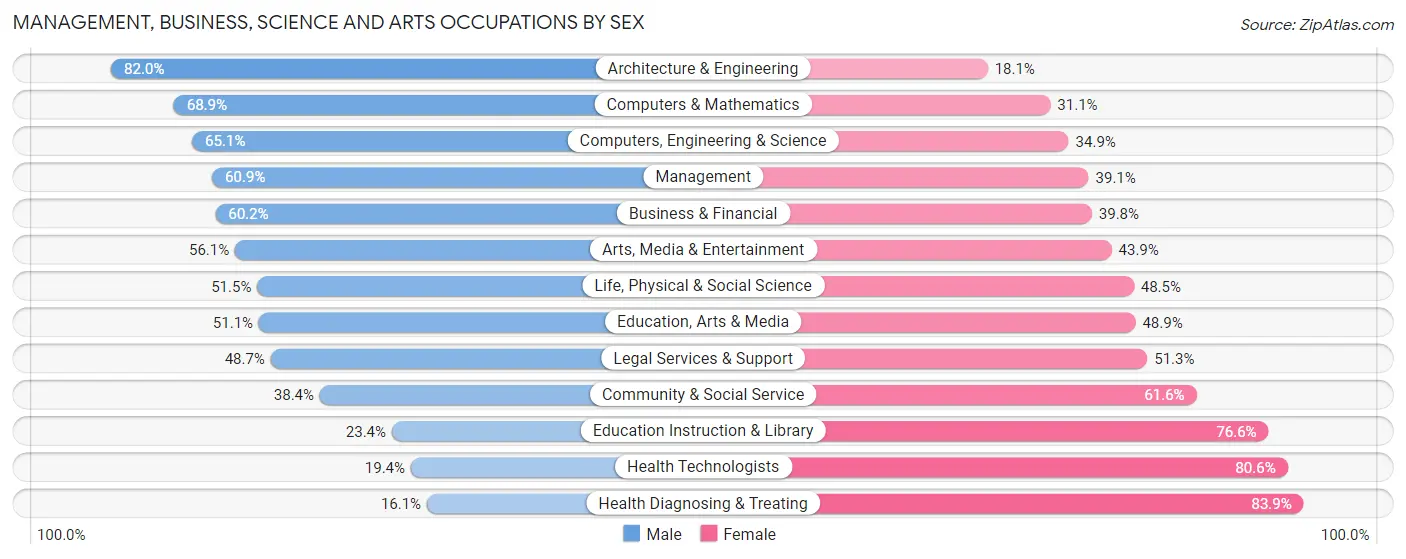
Management, Business, Science and Arts Occupations by Sex
Within the Management, Business, Science and Arts occupations in Wheaton, the most male-oriented occupations are Architecture & Engineering (82.0%), Computers & Mathematics (68.9%), and Computers, Engineering & Science (65.1%), while the most female-oriented occupations are Health Diagnosing & Treating (83.9%), Health Technologists (80.6%), and Education Instruction & Library (76.6%).
| Occupation | Male | Female |
| Management | 1,509 (60.9%) | 969 (39.1%) |
| Business & Financial | 778 (60.2%) | 514 (39.8%) |
| Computers, Engineering & Science | 1,676 (65.1%) | 900 (34.9%) |
| Computers & Mathematics | 978 (68.9%) | 442 (31.1%) |
| Architecture & Engineering | 277 (82.0%) | 61 (18.0%) |
| Life, Physical & Social Science | 421 (51.5%) | 397 (48.5%) |
| Community & Social Service | 1,202 (38.4%) | 1,927 (61.6%) |
| Education, Arts & Media | 229 (51.1%) | 219 (48.9%) |
| Legal Services & Support | 181 (48.7%) | 191 (51.3%) |
| Education Instruction & Library | 360 (23.4%) | 1,179 (76.6%) |
| Arts, Media & Entertainment | 432 (56.1%) | 338 (43.9%) |
| Health Diagnosing & Treating | 171 (16.1%) | 893 (83.9%) |
| Health Technologists | 121 (19.4%) | 502 (80.6%) |
| Total (Category) | 5,336 (50.6%) | 5,203 (49.4%) |
| Total (Overall) | 15,924 (56.5%) | 12,254 (43.5%) |
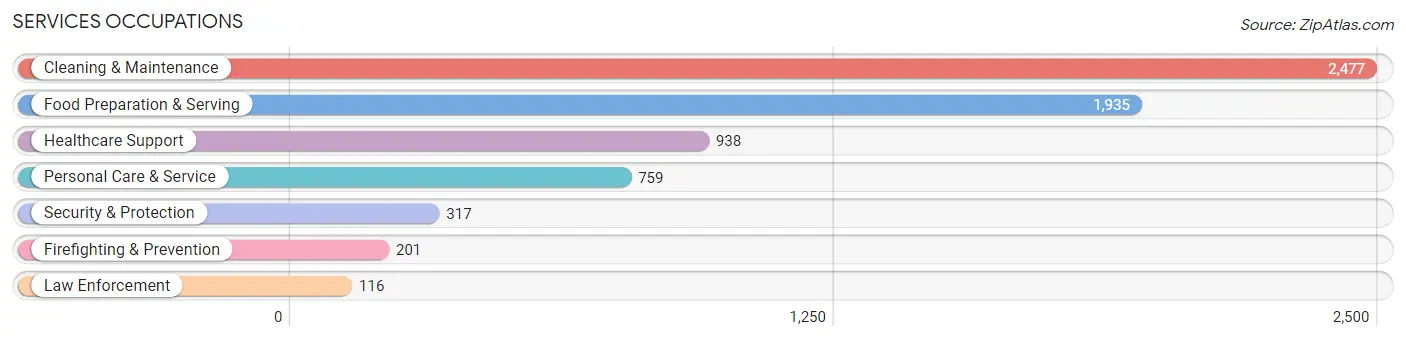
Services Occupations
The most common Services occupations in Wheaton are Cleaning & Maintenance (2,477 | 8.8%), Food Preparation & Serving (1,935 | 6.9%), Healthcare Support (938 | 3.3%), Personal Care & Service (759 | 2.7%), and Security & Protection (317 | 1.1%).
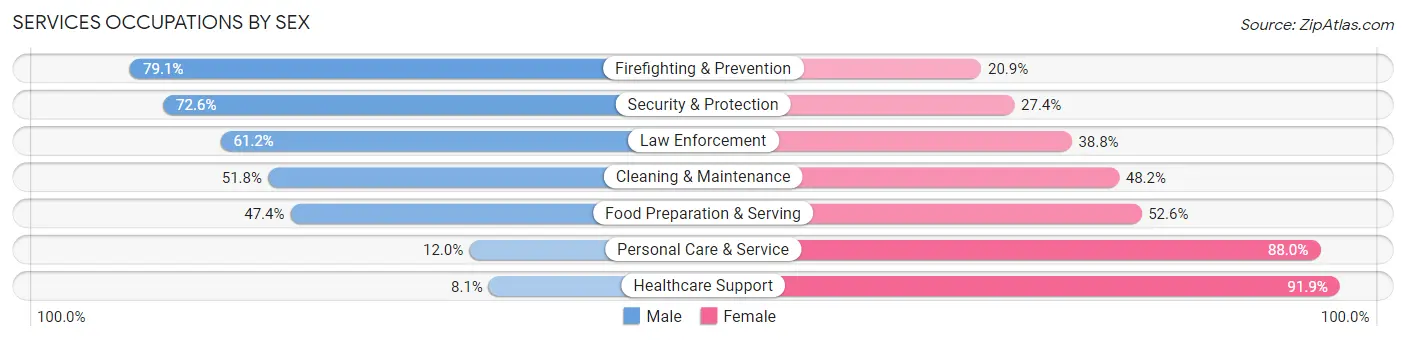
Services Occupations by Sex
Within the Services occupations in Wheaton, the most male-oriented occupations are Firefighting & Prevention (79.1%), Security & Protection (72.6%), and Law Enforcement (61.2%), while the most female-oriented occupations are Healthcare Support (91.9%), Personal Care & Service (88.0%), and Food Preparation & Serving (52.6%).
| Occupation | Male | Female |
| Healthcare Support | 76 (8.1%) | 862 (91.9%) |
| Security & Protection | 230 (72.6%) | 87 (27.4%) |
| Firefighting & Prevention | 159 (79.1%) | 42 (20.9%) |
| Law Enforcement | 71 (61.2%) | 45 (38.8%) |
| Food Preparation & Serving | 917 (47.4%) | 1,018 (52.6%) |
| Cleaning & Maintenance | 1,284 (51.8%) | 1,193 (48.2%) |
| Personal Care & Service | 91 (12.0%) | 668 (88.0%) |
| Total (Category) | 2,598 (40.4%) | 3,828 (59.6%) |
| Total (Overall) | 15,924 (56.5%) | 12,254 (43.5%) |
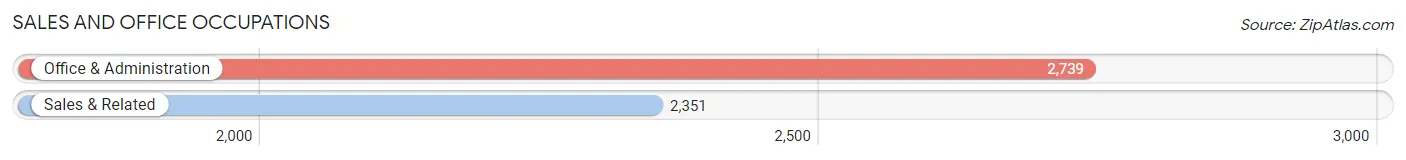
Sales and Office Occupations
The most common Sales and Office occupations in Wheaton are Office & Administration (2,739 | 9.7%), and Sales & Related (2,351 | 8.3%).
Sales and Office Occupations by Sex
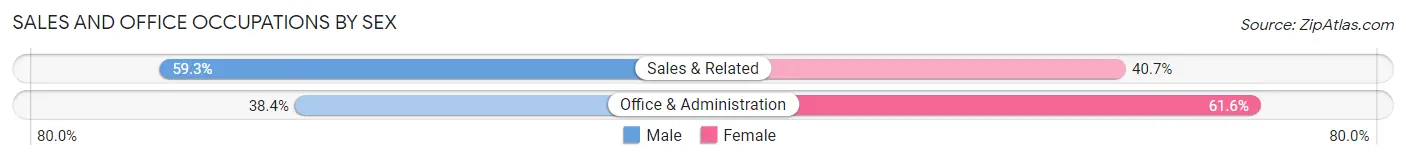
| Occupation | Male | Female |
| Sales & Related | 1,394 (59.3%) | 957 (40.7%) |
| Office & Administration | 1,053 (38.4%) | 1,686 (61.6%) |
| Total (Category) | 2,447 (48.1%) | 2,643 (51.9%) |
| Total (Overall) | 15,924 (56.5%) | 12,254 (43.5%) |
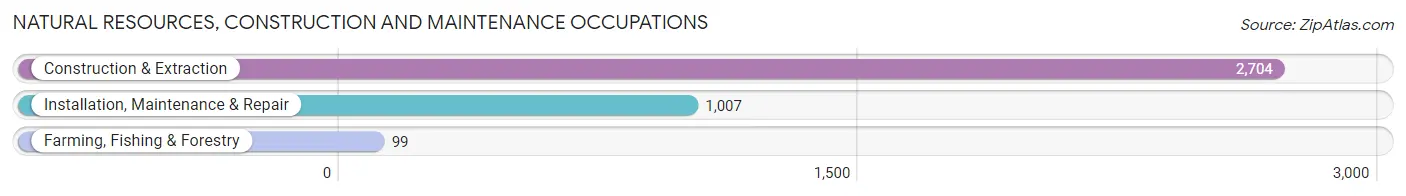
Natural Resources, Construction and Maintenance Occupations
The most common Natural Resources, Construction and Maintenance occupations in Wheaton are Construction & Extraction (2,704 | 9.6%), Installation, Maintenance & Repair (1,007 | 3.6%), and Farming, Fishing & Forestry (99 | 0.4%).
Natural Resources, Construction and Maintenance Occupations by Sex
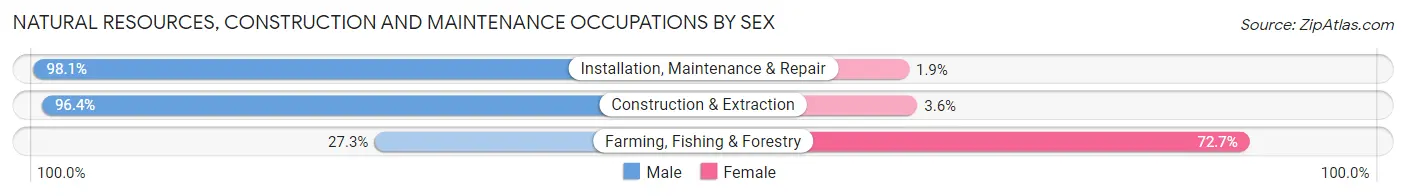
| Occupation | Male | Female |
| Farming, Fishing & Forestry | 27 (27.3%) | 72 (72.7%) |
| Construction & Extraction | 2,606 (96.4%) | 98 (3.6%) |
| Installation, Maintenance & Repair | 988 (98.1%) | 19 (1.9%) |
| Total (Category) | 3,621 (95.0%) | 189 (5.0%) |
| Total (Overall) | 15,924 (56.5%) | 12,254 (43.5%) |
Production, Transportation and Moving Occupations
The most common Production, Transportation and Moving occupations in Wheaton are Transportation (1,203 | 4.3%), Production (667 | 2.4%), and Material Moving (443 | 1.6%).
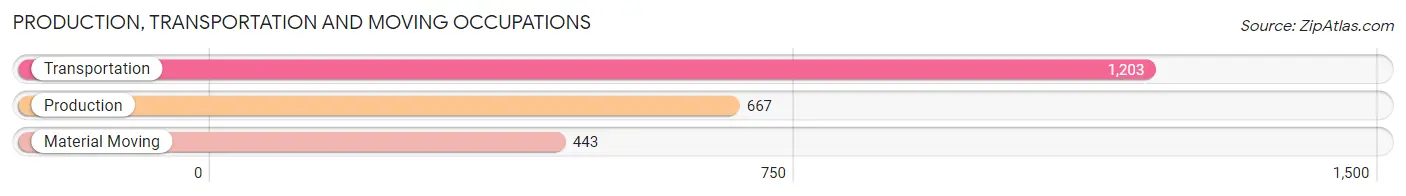
Production, Transportation and Moving Occupations by Sex
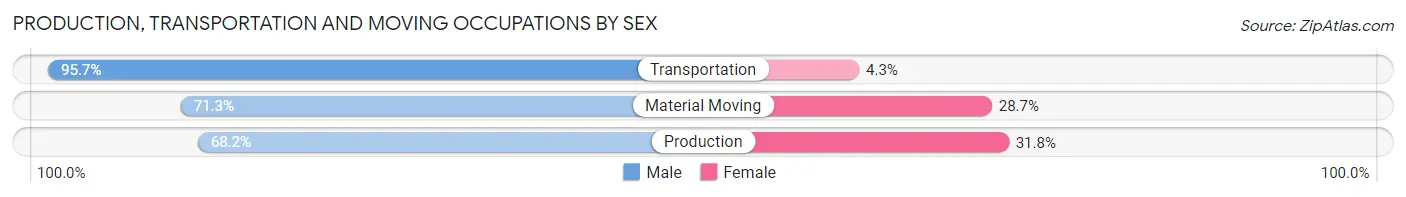
| Occupation | Male | Female |
| Production | 455 (68.2%) | 212 (31.8%) |
| Transportation | 1,151 (95.7%) | 52 (4.3%) |
| Material Moving | 316 (71.3%) | 127 (28.7%) |
| Total (Category) | 1,922 (83.1%) | 391 (16.9%) |
| Total (Overall) | 15,924 (56.5%) | 12,254 (43.5%) |
Employment Industries by Sex in Wheaton
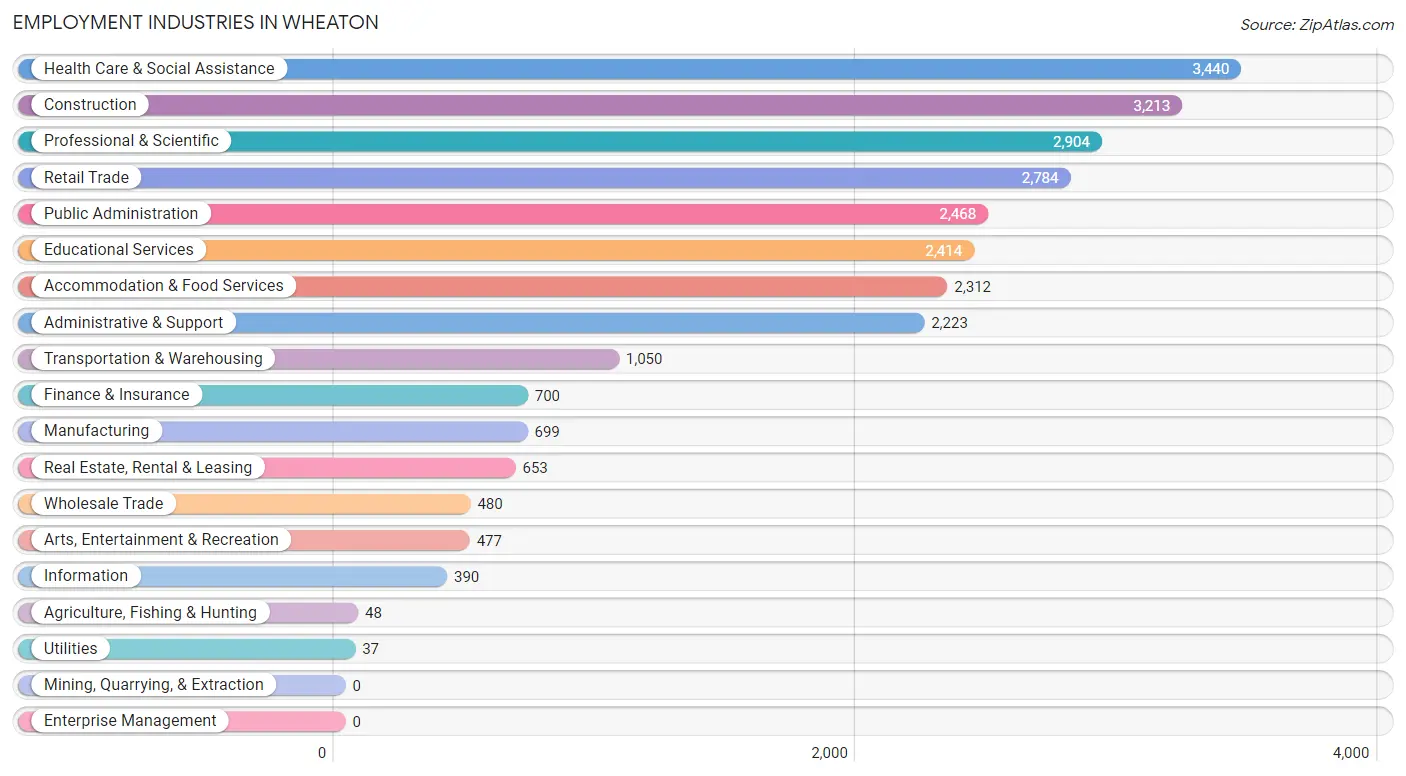
Employment Industries in Wheaton
The major employment industries in Wheaton include Health Care & Social Assistance (3,440 | 12.2%), Construction (3,213 | 11.4%), Professional & Scientific (2,904 | 10.3%), Retail Trade (2,784 | 9.9%), and Public Administration (2,468 | 8.8%).
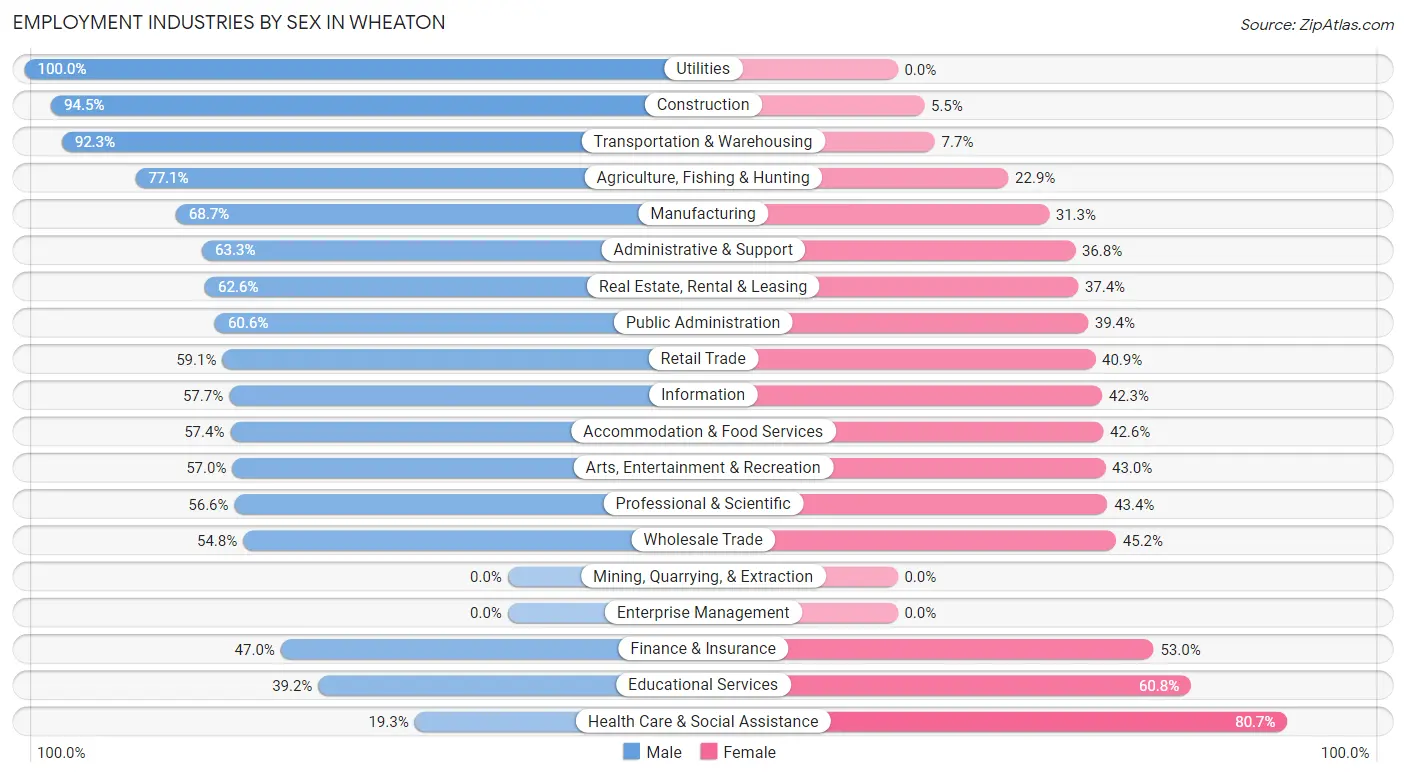
Employment Industries by Sex in Wheaton
The Wheaton industries that see more men than women are Utilities (100.0%), Construction (94.5%), and Transportation & Warehousing (92.3%), whereas the industries that tend to have a higher number of women are Health Care & Social Assistance (80.7%), Educational Services (60.8%), and Finance & Insurance (53.0%).
| Industry | Male | Female |
| Agriculture, Fishing & Hunting | 37 (77.1%) | 11 (22.9%) |
| Mining, Quarrying, & Extraction | 0 (0.0%) | 0 (0.0%) |
| Construction | 3,036 (94.5%) | 177 (5.5%) |
| Manufacturing | 480 (68.7%) | 219 (31.3%) |
| Wholesale Trade | 263 (54.8%) | 217 (45.2%) |
| Retail Trade | 1,645 (59.1%) | 1,139 (40.9%) |
| Transportation & Warehousing | 969 (92.3%) | 81 (7.7%) |
| Utilities | 37 (100.0%) | 0 (0.0%) |
| Information | 225 (57.7%) | 165 (42.3%) |
| Finance & Insurance | 329 (47.0%) | 371 (53.0%) |
| Real Estate, Rental & Leasing | 409 (62.6%) | 244 (37.4%) |
| Professional & Scientific | 1,643 (56.6%) | 1,261 (43.4%) |
| Enterprise Management | 0 (0.0%) | 0 (0.0%) |
| Administrative & Support | 1,406 (63.2%) | 817 (36.7%) |
| Educational Services | 947 (39.2%) | 1,467 (60.8%) |
| Health Care & Social Assistance | 664 (19.3%) | 2,776 (80.7%) |
| Arts, Entertainment & Recreation | 272 (57.0%) | 205 (43.0%) |
| Accommodation & Food Services | 1,328 (57.4%) | 984 (42.6%) |
| Public Administration | 1,495 (60.6%) | 973 (39.4%) |
| Total | 15,924 (56.5%) | 12,254 (43.5%) |
Education in Wheaton
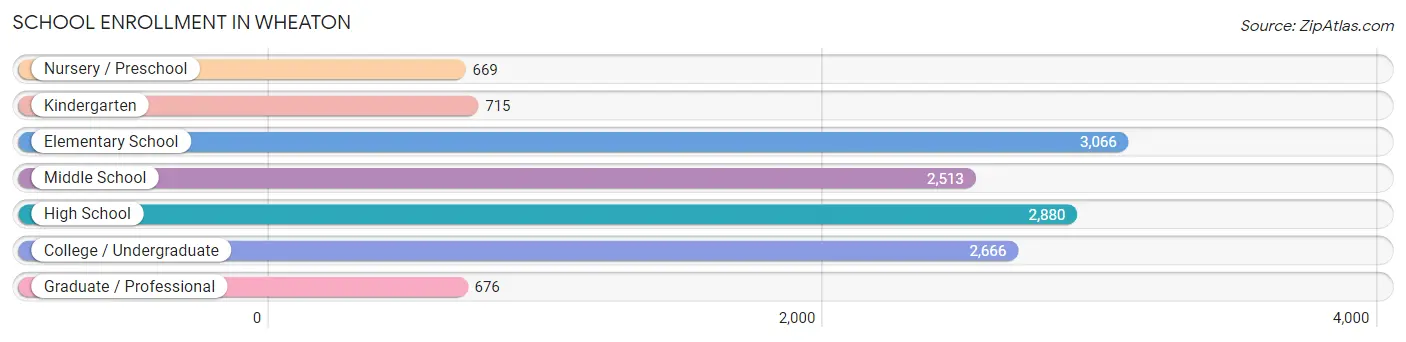
School Enrollment in Wheaton
The most common levels of schooling among the 13,185 students in Wheaton are elementary school (3,066 | 23.3%), high school (2,880 | 21.8%), and college / undergraduate (2,666 | 20.2%).
| School Level | # Students | % Students |
| Nursery / Preschool | 669 | 5.1% |
| Kindergarten | 715 | 5.4% |
| Elementary School | 3,066 | 23.3% |
| Middle School | 2,513 | 19.1% |
| High School | 2,880 | 21.8% |
| College / Undergraduate | 2,666 | 20.2% |
| Graduate / Professional | 676 | 5.1% |
| Total | 13,185 | 100.0% |
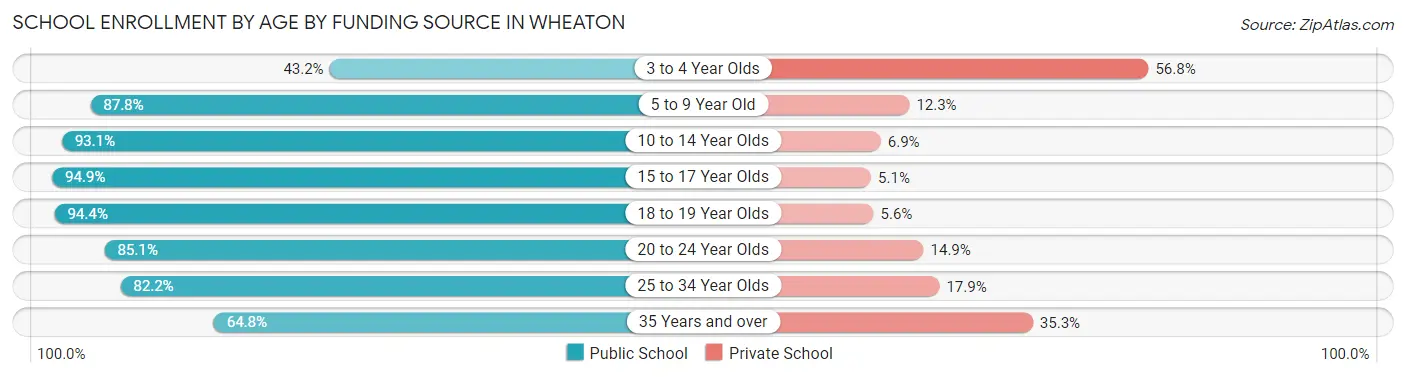
School Enrollment by Age by Funding Source in Wheaton
Out of a total of 13,185 students who are enrolled in schools in Wheaton, 1,661 (12.6%) attend a private institution, while the remaining 11,524 (87.4%) are enrolled in public schools. The age group of 3 to 4 year olds has the highest likelihood of being enrolled in private schools, with 293 (56.8% in the age bracket) enrolled. Conversely, the age group of 15 to 17 year olds has the lowest likelihood of being enrolled in a private school, with 2,002 (94.9% in the age bracket) attending a public institution.
| Age Bracket | Public School | Private School |
| 3 to 4 Year Olds | 223 (43.2%) | 293 (56.8%) |
| 5 to 9 Year Old | 3,145 (87.7%) | 439 (12.2%) |
| 10 to 14 Year Olds | 2,851 (93.1%) | 212 (6.9%) |
| 15 to 17 Year Olds | 2,002 (94.9%) | 108 (5.1%) |
| 18 to 19 Year Olds | 830 (94.4%) | 49 (5.6%) |
| 20 to 24 Year Olds | 1,435 (85.1%) | 251 (14.9%) |
| 25 to 34 Year Olds | 764 (82.2%) | 166 (17.8%) |
| 35 Years and over | 270 (64.7%) | 147 (35.2%) |
| Total | 11,524 (87.4%) | 1,661 (12.6%) |
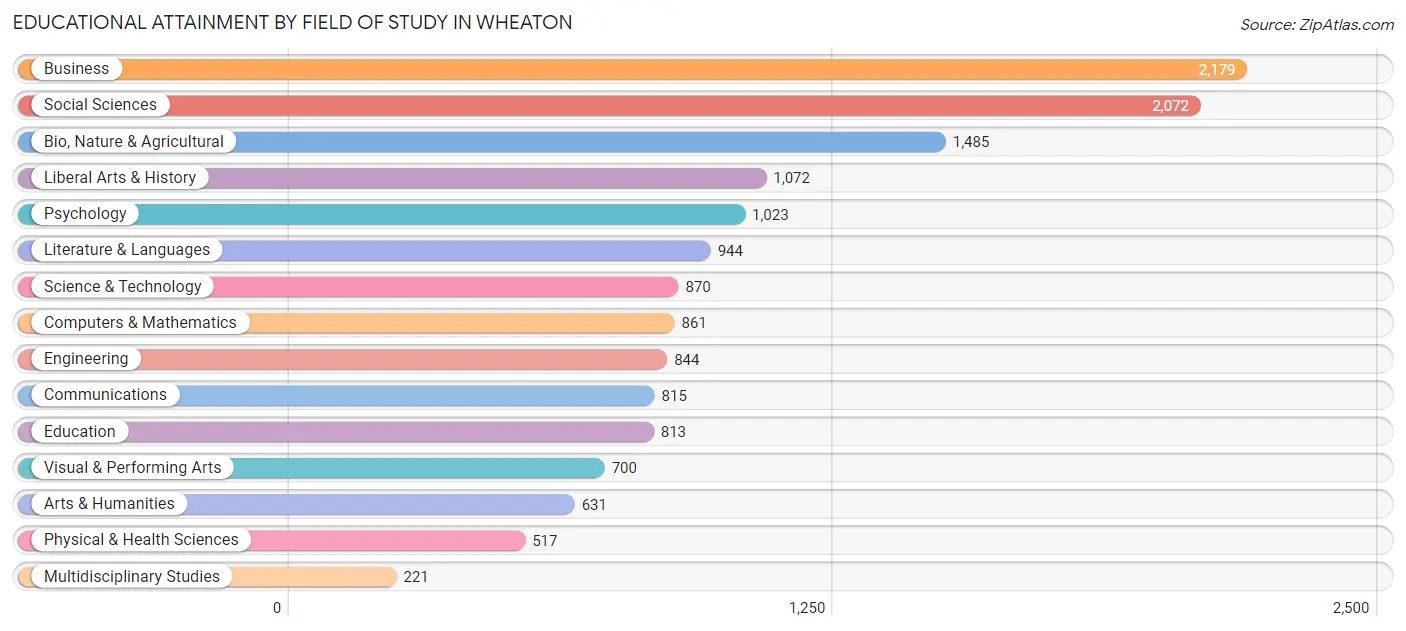
Educational Attainment by Field of Study in Wheaton
Business (2,179 | 14.5%), social sciences (2,072 | 13.8%), bio, nature & agricultural (1,485 | 9.9%), liberal arts & history (1,072 | 7.1%), and psychology (1,023 | 6.8%) are the most common fields of study among 15,047 individuals in Wheaton who have obtained a bachelor's degree or higher.
| Field of Study | # Graduates | % Graduates |
| Computers & Mathematics | 861 | 5.7% |
| Bio, Nature & Agricultural | 1,485 | 9.9% |
| Physical & Health Sciences | 517 | 3.4% |
| Psychology | 1,023 | 6.8% |
| Social Sciences | 2,072 | 13.8% |
| Engineering | 844 | 5.6% |
| Multidisciplinary Studies | 221 | 1.5% |
| Science & Technology | 870 | 5.8% |
| Business | 2,179 | 14.5% |
| Education | 813 | 5.4% |
| Literature & Languages | 944 | 6.3% |
| Liberal Arts & History | 1,072 | 7.1% |
| Visual & Performing Arts | 700 | 4.6% |
| Communications | 815 | 5.4% |
| Arts & Humanities | 631 | 4.2% |
| Total | 15,047 | 100.0% |
Transportation & Commute in Wheaton
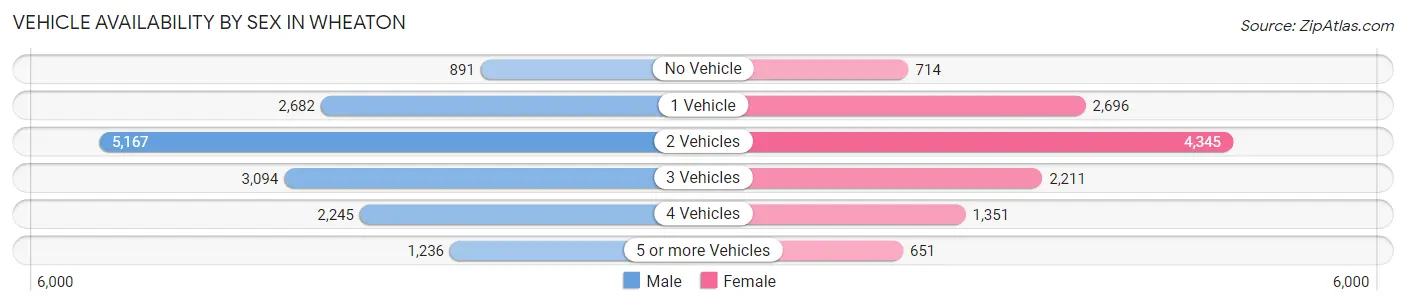
Vehicle Availability by Sex in Wheaton
The most prevalent vehicle ownership categories in Wheaton are males with 2 vehicles (5,167, accounting for 33.7%) and females with 2 vehicles (4,345, making up 43.2%).
| Vehicles Available | Male | Female |
| No Vehicle | 891 (5.8%) | 714 (6.0%) |
| 1 Vehicle | 2,682 (17.5%) | 2,696 (22.5%) |
| 2 Vehicles | 5,167 (33.7%) | 4,345 (36.3%) |
| 3 Vehicles | 3,094 (20.2%) | 2,211 (18.5%) |
| 4 Vehicles | 2,245 (14.7%) | 1,351 (11.3%) |
| 5 or more Vehicles | 1,236 (8.1%) | 651 (5.4%) |
| Total | 15,315 (100.0%) | 11,968 (100.0%) |
Commute Time in Wheaton
The most frequently occuring commute durations in Wheaton are 30 to 34 minutes (4,554 commuters, 19.4%), 45 to 59 minutes (3,639 commuters, 15.5%), and 15 to 19 minutes (2,633 commuters, 11.2%).
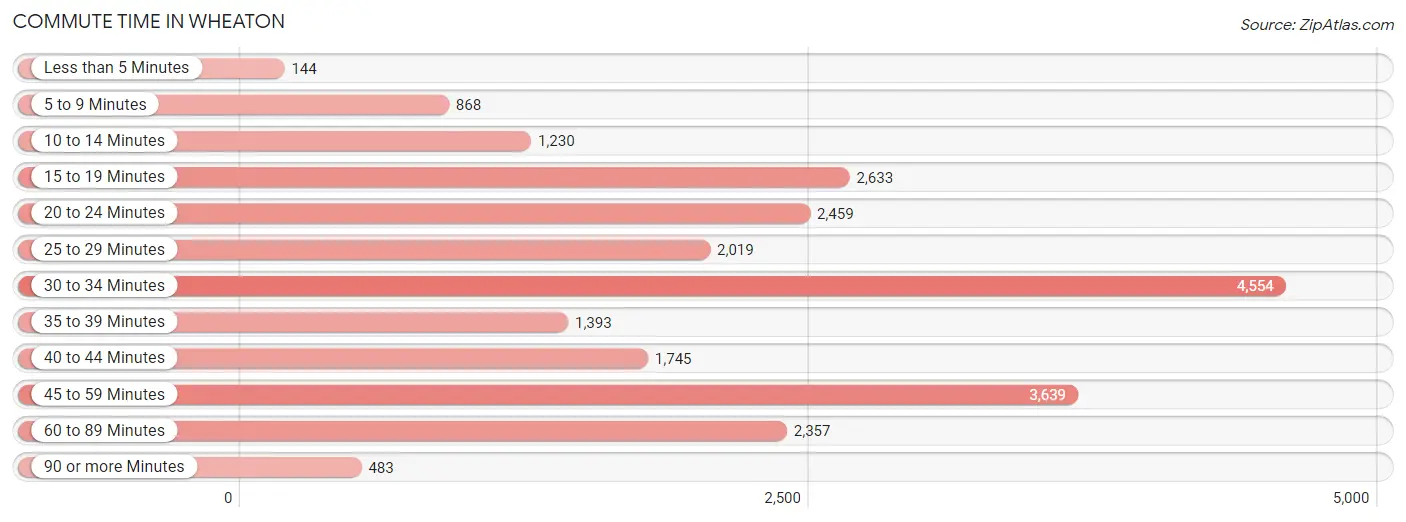
| Commute Time | # Commuters | % Commuters |
| Less than 5 Minutes | 144 | 0.6% |
| 5 to 9 Minutes | 868 | 3.7% |
| 10 to 14 Minutes | 1,230 | 5.2% |
| 15 to 19 Minutes | 2,633 | 11.2% |
| 20 to 24 Minutes | 2,459 | 10.4% |
| 25 to 29 Minutes | 2,019 | 8.6% |
| 30 to 34 Minutes | 4,554 | 19.4% |
| 35 to 39 Minutes | 1,393 | 5.9% |
| 40 to 44 Minutes | 1,745 | 7.4% |
| 45 to 59 Minutes | 3,639 | 15.5% |
| 60 to 89 Minutes | 2,357 | 10.0% |
| 90 or more Minutes | 483 | 2.1% |
Commute Time by Sex in Wheaton
The most common commute times in Wheaton are 30 to 34 minutes (2,697 commuters, 20.4%) for males and 30 to 34 minutes (1,857 commuters, 18.0%) for females.
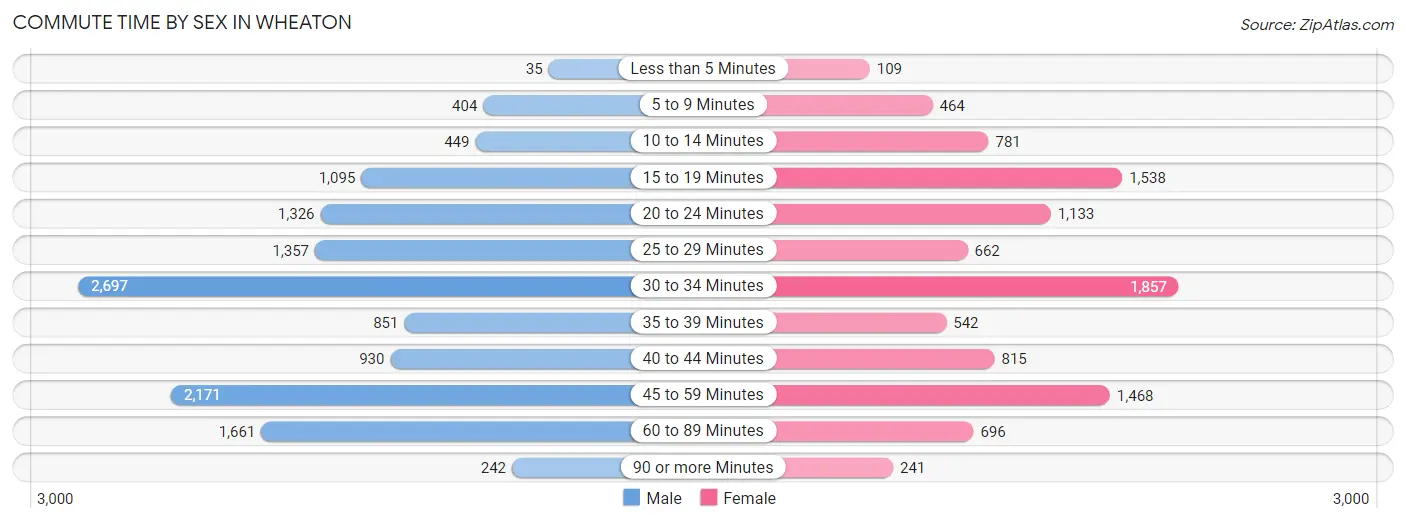
| Commute Time | Male | Female |
| Less than 5 Minutes | 35 (0.3%) | 109 (1.1%) |
| 5 to 9 Minutes | 404 (3.1%) | 464 (4.5%) |
| 10 to 14 Minutes | 449 (3.4%) | 781 (7.6%) |
| 15 to 19 Minutes | 1,095 (8.3%) | 1,538 (14.9%) |
| 20 to 24 Minutes | 1,326 (10.0%) | 1,133 (11.0%) |
| 25 to 29 Minutes | 1,357 (10.3%) | 662 (6.4%) |
| 30 to 34 Minutes | 2,697 (20.4%) | 1,857 (18.0%) |
| 35 to 39 Minutes | 851 (6.4%) | 542 (5.3%) |
| 40 to 44 Minutes | 930 (7.0%) | 815 (7.9%) |
| 45 to 59 Minutes | 2,171 (16.4%) | 1,468 (14.2%) |
| 60 to 89 Minutes | 1,661 (12.6%) | 696 (6.8%) |
| 90 or more Minutes | 242 (1.8%) | 241 (2.3%) |
Time of Departure to Work by Sex in Wheaton
The most frequent times of departure to work in Wheaton are 7:00 AM to 7:29 AM (2,071, 15.7%) for males and 8:00 AM to 8:29 AM (1,989, 19.3%) for females.
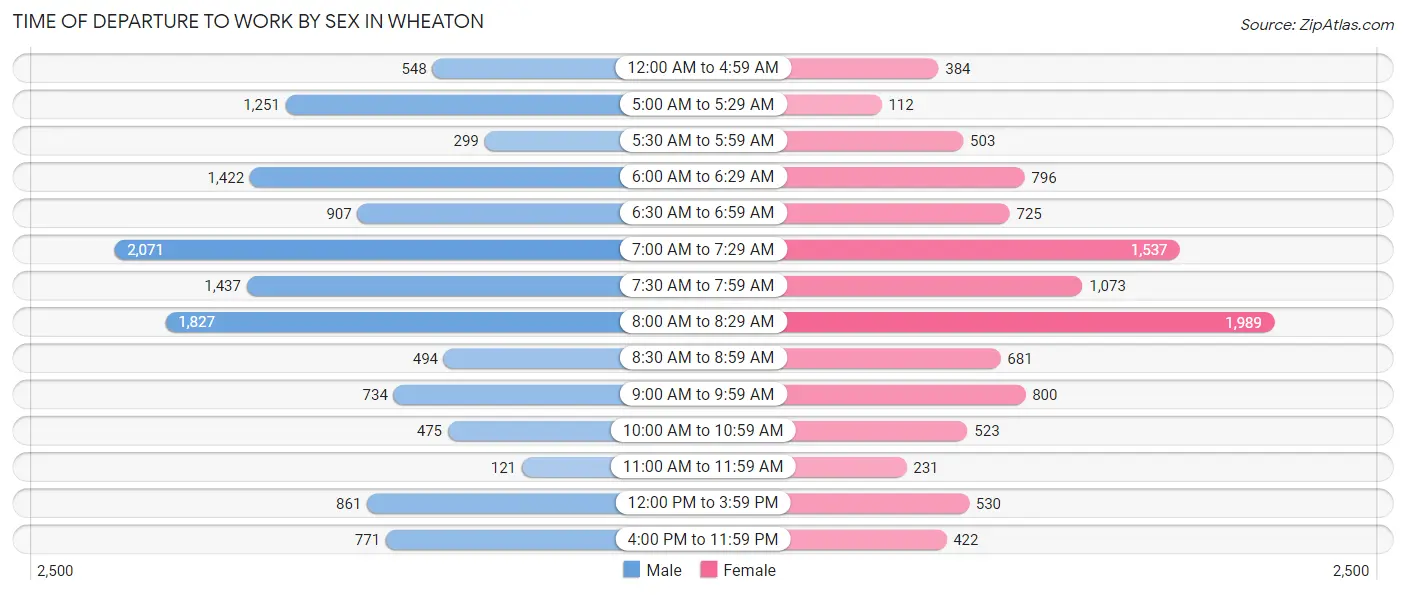
| Time of Departure | Male | Female |
| 12:00 AM to 4:59 AM | 548 (4.2%) | 384 (3.7%) |
| 5:00 AM to 5:29 AM | 1,251 (9.5%) | 112 (1.1%) |
| 5:30 AM to 5:59 AM | 299 (2.3%) | 503 (4.9%) |
| 6:00 AM to 6:29 AM | 1,422 (10.8%) | 796 (7.7%) |
| 6:30 AM to 6:59 AM | 907 (6.9%) | 725 (7.0%) |
| 7:00 AM to 7:29 AM | 2,071 (15.7%) | 1,537 (14.9%) |
| 7:30 AM to 7:59 AM | 1,437 (10.9%) | 1,073 (10.4%) |
| 8:00 AM to 8:29 AM | 1,827 (13.8%) | 1,989 (19.3%) |
| 8:30 AM to 8:59 AM | 494 (3.7%) | 681 (6.6%) |
| 9:00 AM to 9:59 AM | 734 (5.6%) | 800 (7.8%) |
| 10:00 AM to 10:59 AM | 475 (3.6%) | 523 (5.1%) |
| 11:00 AM to 11:59 AM | 121 (0.9%) | 231 (2.2%) |
| 12:00 PM to 3:59 PM | 861 (6.5%) | 530 (5.1%) |
| 4:00 PM to 11:59 PM | 771 (5.8%) | 422 (4.1%) |
| Total | 13,218 (100.0%) | 10,306 (100.0%) |
Housing Occupancy in Wheaton
Occupancy by Ownership in Wheaton
Of the total 16,734 dwellings in Wheaton, owner-occupied units account for 10,672 (63.8%), while renter-occupied units make up 6,062 (36.2%).
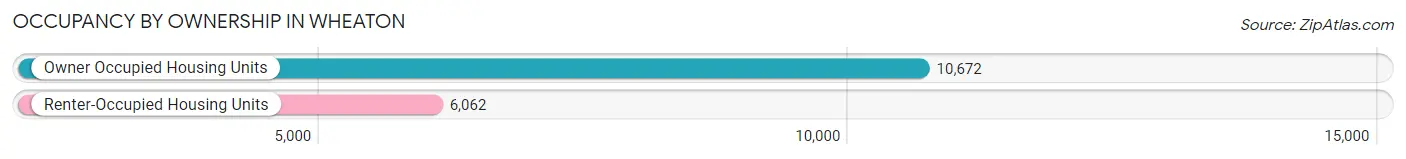
| Occupancy | # Housing Units | % Housing Units |
| Owner Occupied Housing Units | 10,672 | 63.8% |
| Renter-Occupied Housing Units | 6,062 | 36.2% |
| Total Occupied Housing Units | 16,734 | 100.0% |
Occupancy by Household Size in Wheaton
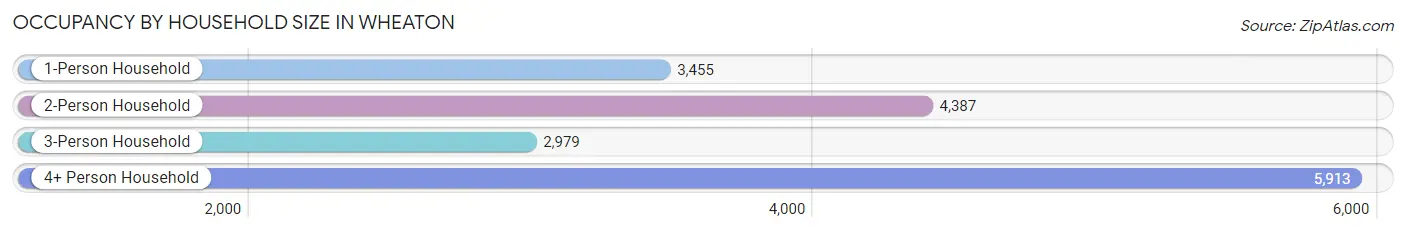
| Household Size | # Housing Units | % Housing Units |
| 1-Person Household | 3,455 | 20.6% |
| 2-Person Household | 4,387 | 26.2% |
| 3-Person Household | 2,979 | 17.8% |
| 4+ Person Household | 5,913 | 35.3% |
| Total Housing Units | 16,734 | 100.0% |
Occupancy by Ownership by Household Size in Wheaton
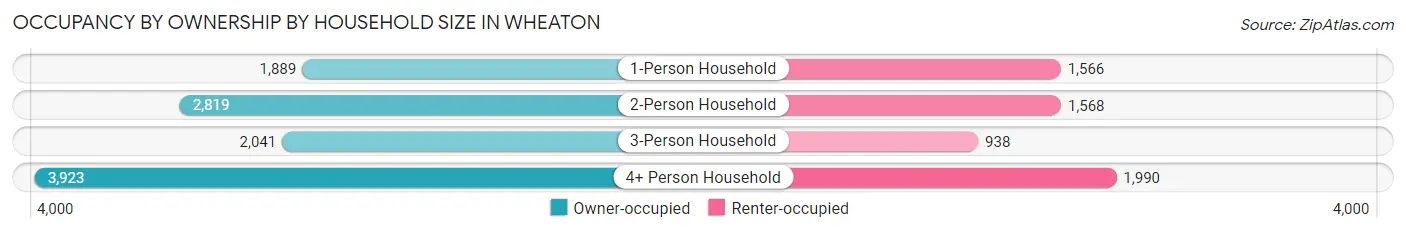
| Household Size | Owner-occupied | Renter-occupied |
| 1-Person Household | 1,889 (54.7%) | 1,566 (45.3%) |
| 2-Person Household | 2,819 (64.3%) | 1,568 (35.7%) |
| 3-Person Household | 2,041 (68.5%) | 938 (31.5%) |
| 4+ Person Household | 3,923 (66.3%) | 1,990 (33.7%) |
| Total Housing Units | 10,672 (63.8%) | 6,062 (36.2%) |
Occupancy by Educational Attainment in Wheaton
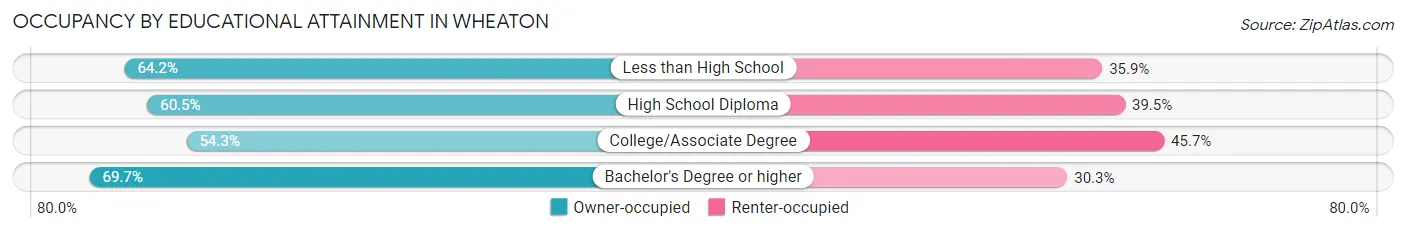
| Household Size | Owner-occupied | Renter-occupied |
| Less than High School | 1,850 (64.1%) | 1,034 (35.8%) |
| High School Diploma | 1,564 (60.5%) | 1,020 (39.5%) |
| College/Associate Degree | 2,095 (54.3%) | 1,762 (45.7%) |
| Bachelor's Degree or higher | 5,163 (69.7%) | 2,246 (30.3%) |
Occupancy by Age of Householder in Wheaton
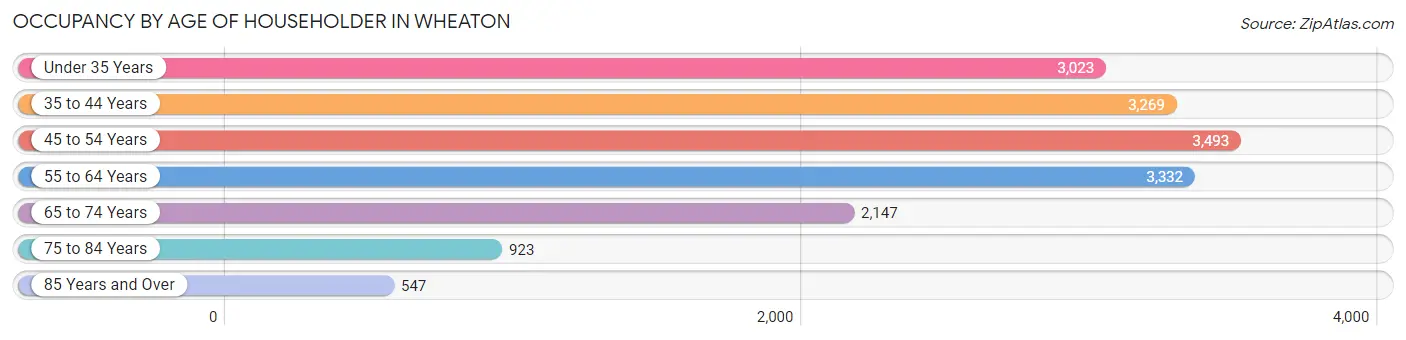
| Age Bracket | # Households | % Households |
| Under 35 Years | 3,023 | 18.1% |
| 35 to 44 Years | 3,269 | 19.5% |
| 45 to 54 Years | 3,493 | 20.9% |
| 55 to 64 Years | 3,332 | 19.9% |
| 65 to 74 Years | 2,147 | 12.8% |
| 75 to 84 Years | 923 | 5.5% |
| 85 Years and Over | 547 | 3.3% |
| Total | 16,734 | 100.0% |
Housing Finances in Wheaton
Median Income by Occupancy in Wheaton
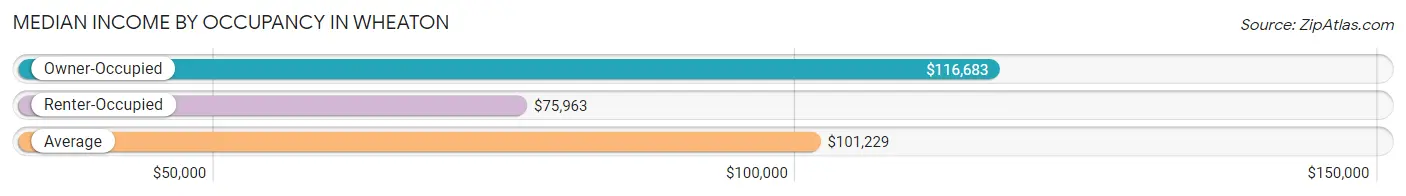
| Occupancy Type | # Households | Median Income |
| Owner-Occupied | 10,672 (63.8%) | $116,683 |
| Renter-Occupied | 6,062 (36.2%) | $75,963 |
| Average | 16,734 (100.0%) | $101,229 |
Occupancy by Householder Income Bracket in Wheaton
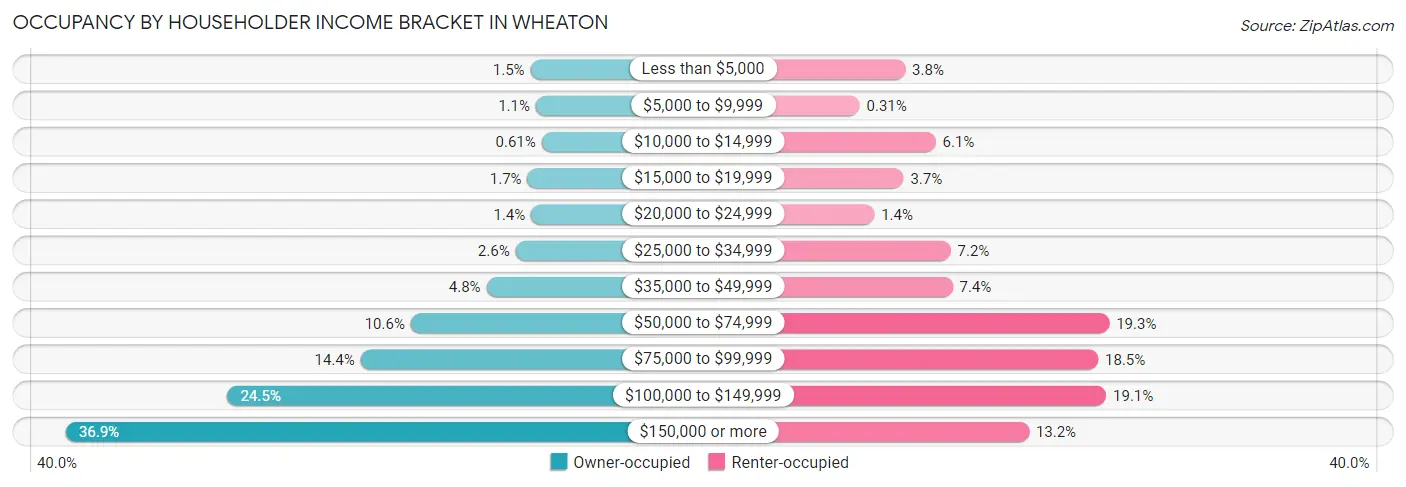
| Income Bracket | Owner-occupied | Renter-occupied |
| Less than $5,000 | 156 (1.5%) | 229 (3.8%) |
| $5,000 to $9,999 | 112 (1.1%) | 19 (0.3%) |
| $10,000 to $14,999 | 65 (0.6%) | 370 (6.1%) |
| $15,000 to $19,999 | 180 (1.7%) | 221 (3.6%) |
| $20,000 to $24,999 | 151 (1.4%) | 86 (1.4%) |
| $25,000 to $34,999 | 277 (2.6%) | 439 (7.2%) |
| $35,000 to $49,999 | 513 (4.8%) | 448 (7.4%) |
| $50,000 to $74,999 | 1,129 (10.6%) | 1,172 (19.3%) |
| $75,000 to $99,999 | 1,537 (14.4%) | 1,120 (18.5%) |
| $100,000 to $149,999 | 2,619 (24.5%) | 1,157 (19.1%) |
| $150,000 or more | 3,933 (36.8%) | 801 (13.2%) |
| Total | 10,672 (100.0%) | 6,062 (100.0%) |
Monthly Housing Cost Tiers in Wheaton
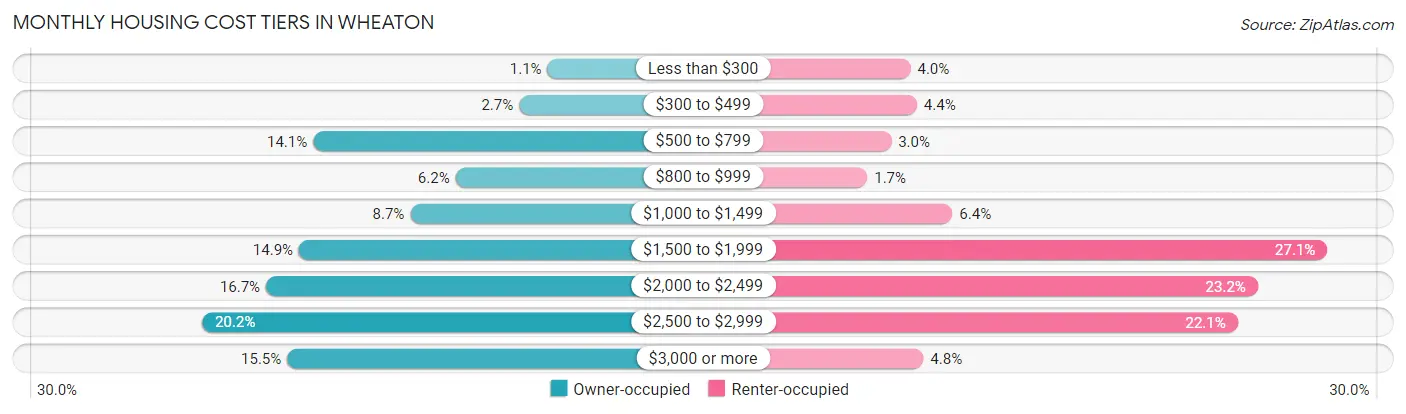
| Monthly Cost | Owner-occupied | Renter-occupied |
| Less than $300 | 119 (1.1%) | 245 (4.0%) |
| $300 to $499 | 287 (2.7%) | 266 (4.4%) |
| $500 to $799 | 1,502 (14.1%) | 180 (3.0%) |
| $800 to $999 | 662 (6.2%) | 100 (1.7%) |
| $1,000 to $1,499 | 928 (8.7%) | 385 (6.4%) |
| $1,500 to $1,999 | 1,585 (14.8%) | 1,640 (27.1%) |
| $2,000 to $2,499 | 1,779 (16.7%) | 1,407 (23.2%) |
| $2,500 to $2,999 | 2,156 (20.2%) | 1,340 (22.1%) |
| $3,000 or more | 1,654 (15.5%) | 288 (4.8%) |
| Total | 10,672 (100.0%) | 6,062 (100.0%) |
Physical Housing Characteristics in Wheaton
Housing Structures in Wheaton
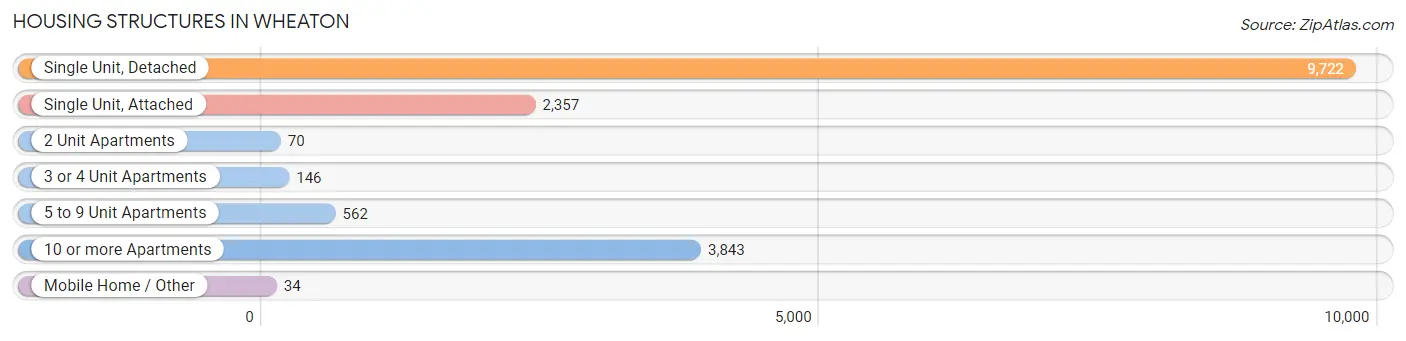
| Structure Type | # Housing Units | % Housing Units |
| Single Unit, Detached | 9,722 | 58.1% |
| Single Unit, Attached | 2,357 | 14.1% |
| 2 Unit Apartments | 70 | 0.4% |
| 3 or 4 Unit Apartments | 146 | 0.9% |
| 5 to 9 Unit Apartments | 562 | 3.4% |
| 10 or more Apartments | 3,843 | 23.0% |
| Mobile Home / Other | 34 | 0.2% |
| Total | 16,734 | 100.0% |
Housing Structures by Occupancy in Wheaton
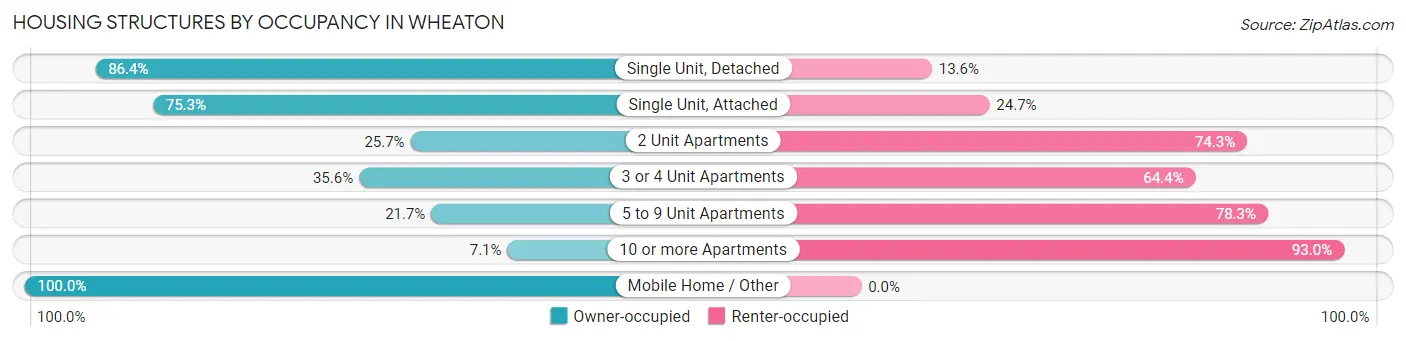
| Structure Type | Owner-occupied | Renter-occupied |
| Single Unit, Detached | 8,400 (86.4%) | 1,322 (13.6%) |
| Single Unit, Attached | 1,775 (75.3%) | 582 (24.7%) |
| 2 Unit Apartments | 18 (25.7%) | 52 (74.3%) |
| 3 or 4 Unit Apartments | 52 (35.6%) | 94 (64.4%) |
| 5 to 9 Unit Apartments | 122 (21.7%) | 440 (78.3%) |
| 10 or more Apartments | 271 (7.0%) | 3,572 (92.9%) |
| Mobile Home / Other | 34 (100.0%) | 0 (0.0%) |
| Total | 10,672 (63.8%) | 6,062 (36.2%) |
Housing Structures by Number of Rooms in Wheaton
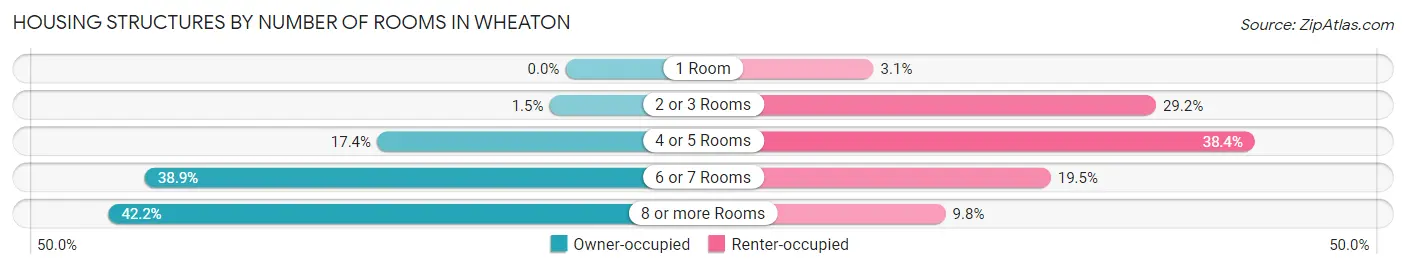
| Number of Rooms | Owner-occupied | Renter-occupied |
| 1 Room | 0 (0.0%) | 189 (3.1%) |
| 2 or 3 Rooms | 157 (1.5%) | 1,772 (29.2%) |
| 4 or 5 Rooms | 1,859 (17.4%) | 2,326 (38.4%) |
| 6 or 7 Rooms | 4,148 (38.9%) | 1,182 (19.5%) |
| 8 or more Rooms | 4,508 (42.2%) | 593 (9.8%) |
| Total | 10,672 (100.0%) | 6,062 (100.0%) |
Housing Structure by Heating Type in Wheaton
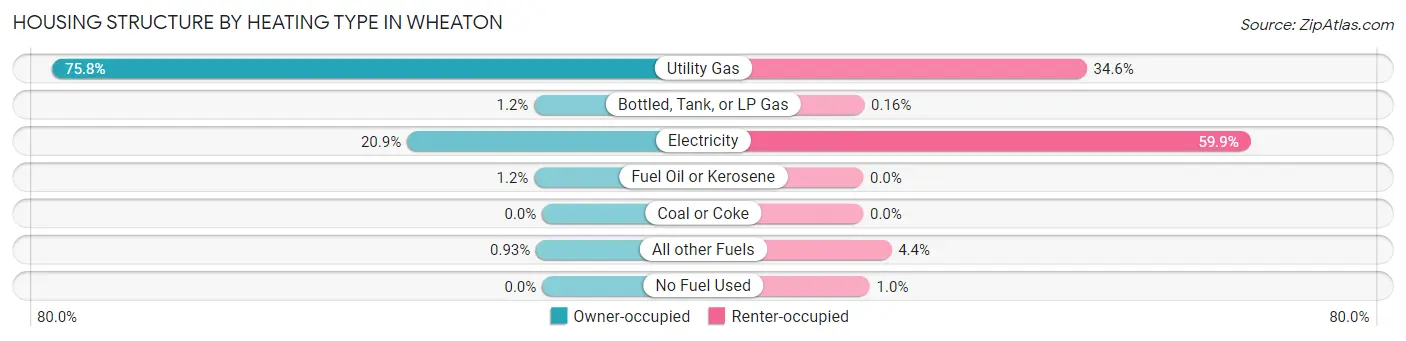
| Heating Type | Owner-occupied | Renter-occupied |
| Utility Gas | 8,084 (75.7%) | 2,095 (34.6%) |
| Bottled, Tank, or LP Gas | 130 (1.2%) | 10 (0.2%) |
| Electricity | 2,229 (20.9%) | 3,631 (59.9%) |
| Fuel Oil or Kerosene | 130 (1.2%) | 0 (0.0%) |
| Coal or Coke | 0 (0.0%) | 0 (0.0%) |
| All other Fuels | 99 (0.9%) | 264 (4.3%) |
| No Fuel Used | 0 (0.0%) | 62 (1.0%) |
| Total | 10,672 (100.0%) | 6,062 (100.0%) |
Household Vehicle Usage in Wheaton
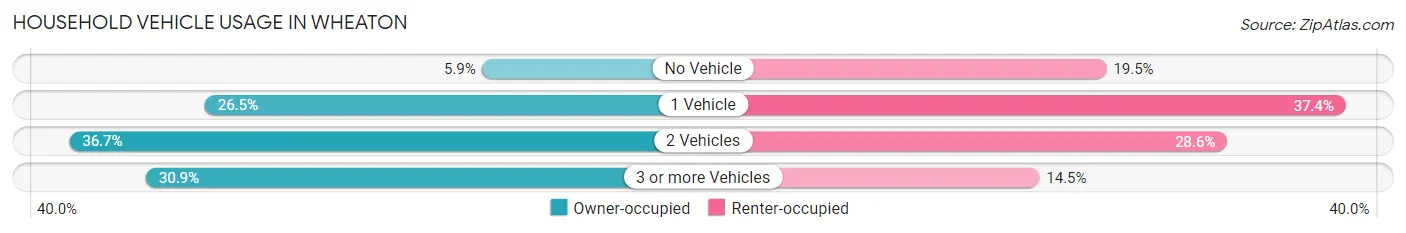
| Vehicles per Household | Owner-occupied | Renter-occupied |
| No Vehicle | 626 (5.9%) | 1,184 (19.5%) |
| 1 Vehicle | 2,832 (26.5%) | 2,267 (37.4%) |
| 2 Vehicles | 3,912 (36.7%) | 1,731 (28.5%) |
| 3 or more Vehicles | 3,302 (30.9%) | 880 (14.5%) |
| Total | 10,672 (100.0%) | 6,062 (100.0%) |
Real Estate & Mortgages in Wheaton
Real Estate and Mortgage Overview in Wheaton
| Characteristic | Without Mortgage | With Mortgage |
| Housing Units | 2,670 | 8,002 |
| Median Property Value | $445,700 | $457,800 |
| Median Household Income | $101,023 | $3,194 |
| Monthly Housing Costs | $698 | $1,654 |
| Real Estate Taxes | $3,897 | $135 |
Property Value by Mortgage Status in Wheaton
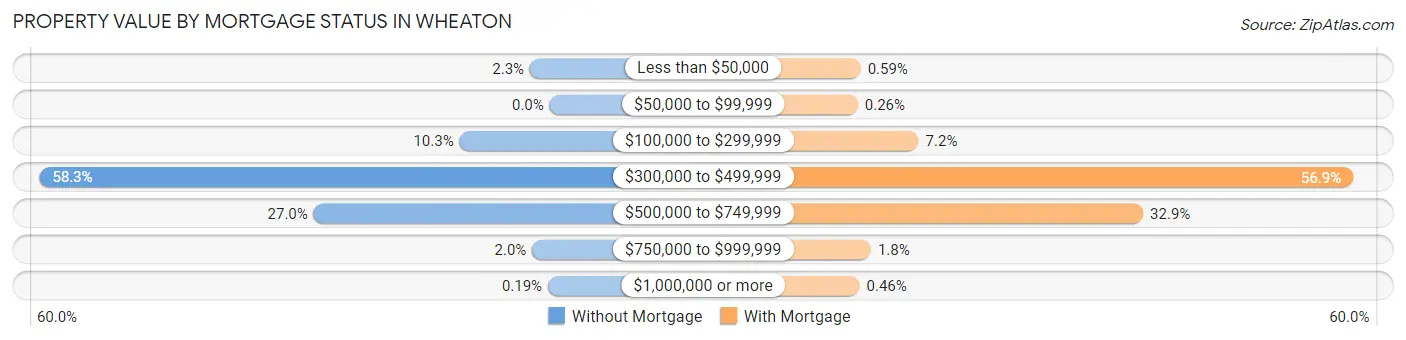
| Property Value | Without Mortgage | With Mortgage |
| Less than $50,000 | 60 (2.2%) | 47 (0.6%) |
| $50,000 to $99,999 | 0 (0.0%) | 21 (0.3%) |
| $100,000 to $299,999 | 275 (10.3%) | 577 (7.2%) |
| $300,000 to $499,999 | 1,557 (58.3%) | 4,549 (56.9%) |
| $500,000 to $749,999 | 720 (27.0%) | 2,630 (32.9%) |
| $750,000 to $999,999 | 53 (2.0%) | 141 (1.8%) |
| $1,000,000 or more | 5 (0.2%) | 37 (0.5%) |
| Total | 2,670 (100.0%) | 8,002 (100.0%) |
Household Income by Mortgage Status in Wheaton
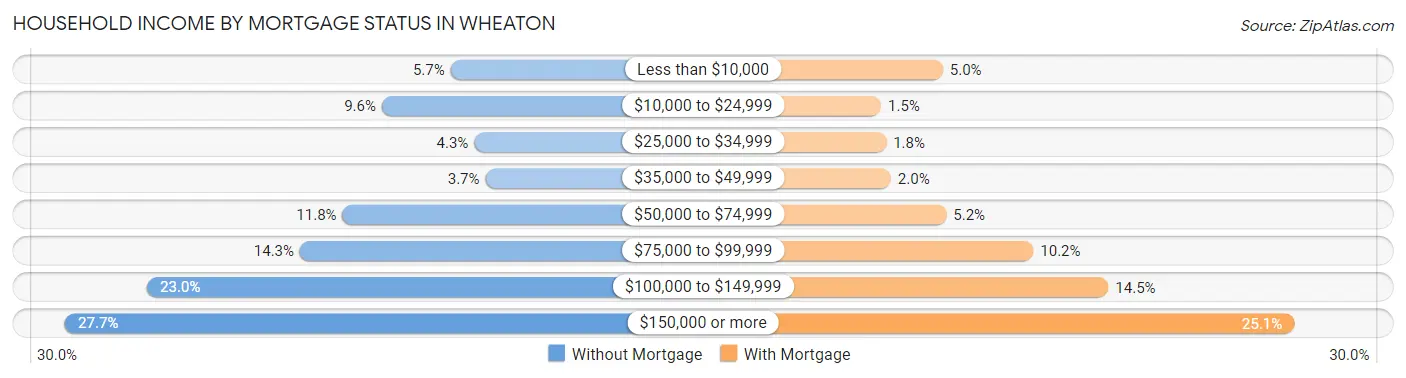
| Household Income | Without Mortgage | With Mortgage |
| Less than $10,000 | 151 (5.7%) | 399 (5.0%) |
| $10,000 to $24,999 | 256 (9.6%) | 117 (1.5%) |
| $25,000 to $34,999 | 115 (4.3%) | 140 (1.8%) |
| $35,000 to $49,999 | 98 (3.7%) | 162 (2.0%) |
| $50,000 to $74,999 | 316 (11.8%) | 415 (5.2%) |
| $75,000 to $99,999 | 381 (14.3%) | 813 (10.2%) |
| $100,000 to $149,999 | 614 (23.0%) | 1,156 (14.4%) |
| $150,000 or more | 739 (27.7%) | 2,005 (25.1%) |
| Total | 2,670 (100.0%) | 8,002 (100.0%) |
Property Value to Household Income Ratio in Wheaton
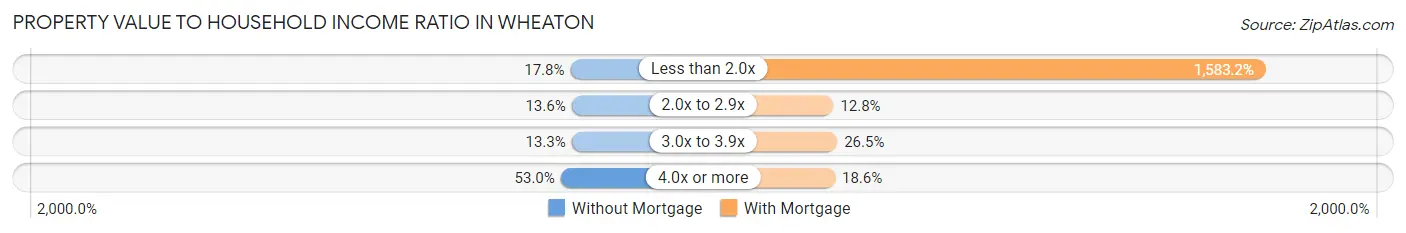
| Value-to-Income Ratio | Without Mortgage | With Mortgage |
| Less than 2.0x | 476 (17.8%) | 126,686 (1,583.2%) |
| 2.0x to 2.9x | 362 (13.6%) | 1,027 (12.8%) |
| 3.0x to 3.9x | 354 (13.3%) | 2,120 (26.5%) |
| 4.0x or more | 1,415 (53.0%) | 1,487 (18.6%) |
| Total | 2,670 (100.0%) | 8,002 (100.0%) |
Real Estate Taxes by Mortgage Status in Wheaton
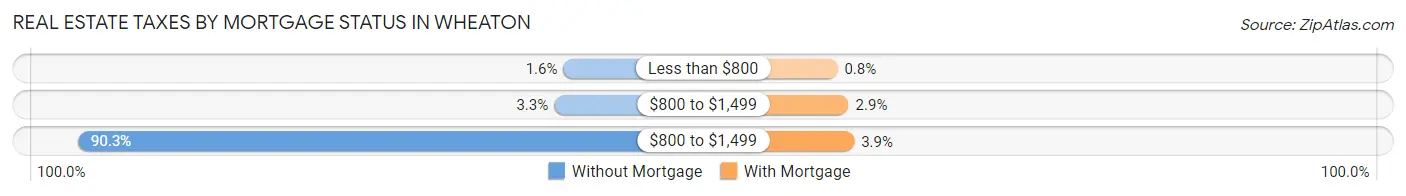
| Property Taxes | Without Mortgage | With Mortgage |
| Less than $800 | 43 (1.6%) | 64 (0.8%) |
| $800 to $1,499 | 88 (3.3%) | 228 (2.9%) |
| $800 to $1,499 | 2,410 (90.3%) | 310 (3.9%) |
| Total | 2,670 (100.0%) | 8,002 (100.0%) |
Health & Disability in Wheaton
Health Insurance Coverage by Age in Wheaton
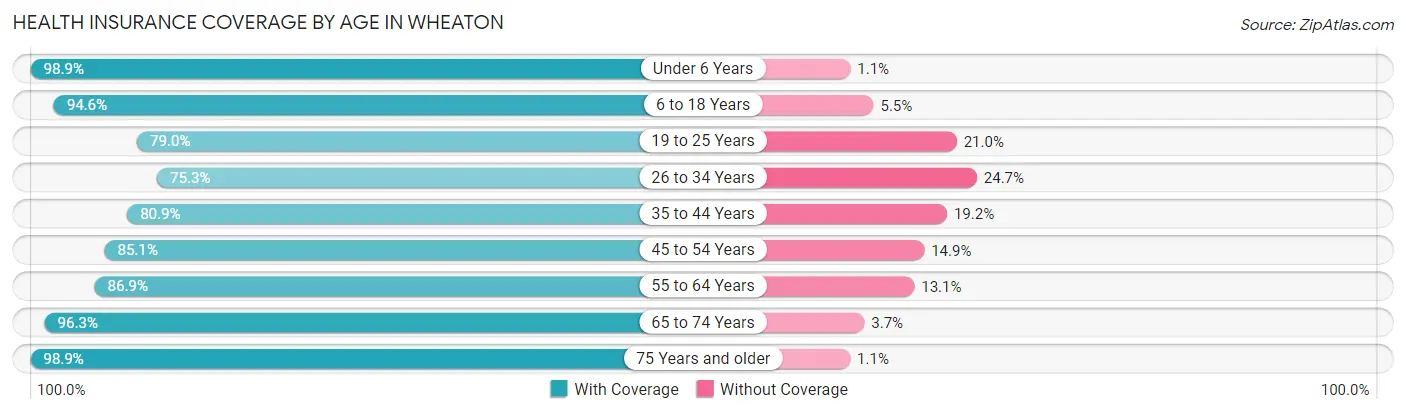
| Age Bracket | With Coverage | Without Coverage |
| Under 6 Years | 4,101 (98.9%) | 47 (1.1%) |
| 6 to 18 Years | 8,317 (94.6%) | 479 (5.4%) |
| 19 to 25 Years | 3,493 (79.0%) | 927 (21.0%) |
| 26 to 34 Years | 5,952 (75.3%) | 1,955 (24.7%) |
| 35 to 44 Years | 5,974 (80.8%) | 1,415 (19.2%) |
| 45 to 54 Years | 5,802 (85.1%) | 1,017 (14.9%) |
| 55 to 64 Years | 5,691 (86.9%) | 855 (13.1%) |
| 65 to 74 Years | 3,837 (96.3%) | 149 (3.7%) |
| 75 Years and older | 2,268 (98.9%) | 25 (1.1%) |
| Total | 45,435 (86.9%) | 6,869 (13.1%) |
Health Insurance Coverage by Citizenship Status in Wheaton
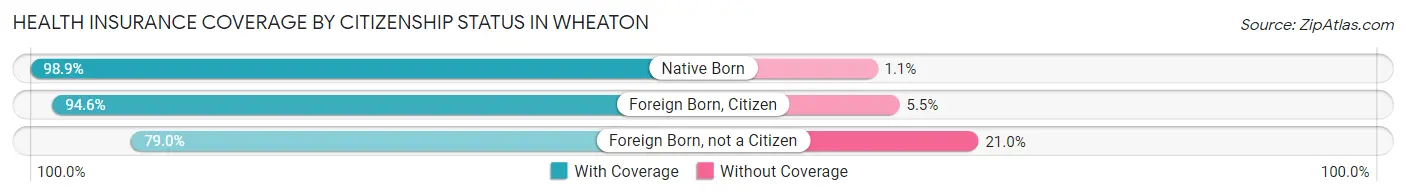
| Citizenship Status | With Coverage | Without Coverage |
| Native Born | 4,101 (98.9%) | 47 (1.1%) |
| Foreign Born, Citizen | 8,317 (94.6%) | 479 (5.4%) |
| Foreign Born, not a Citizen | 3,493 (79.0%) | 927 (21.0%) |
Health Insurance Coverage by Household Income in Wheaton
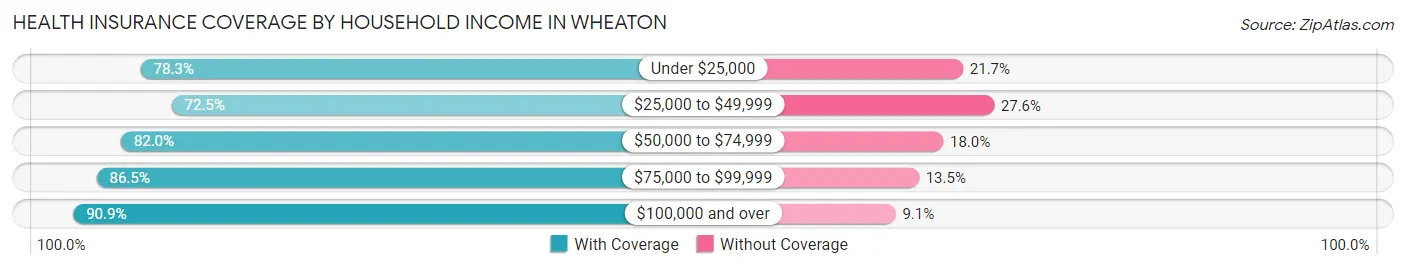
| Household Income | With Coverage | Without Coverage |
| Under $25,000 | 2,235 (78.3%) | 621 (21.7%) |
| $25,000 to $49,999 | 3,103 (72.5%) | 1,180 (27.6%) |
| $50,000 to $74,999 | 5,738 (82.0%) | 1,263 (18.0%) |
| $75,000 to $99,999 | 6,532 (86.5%) | 1,018 (13.5%) |
| $100,000 and over | 27,785 (90.9%) | 2,787 (9.1%) |
Public vs Private Health Insurance Coverage by Age in Wheaton
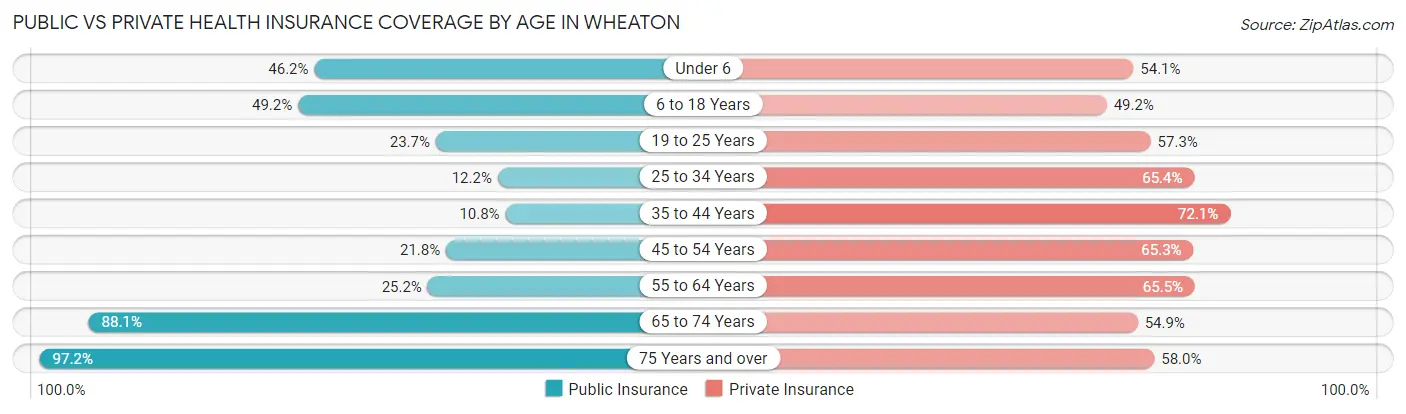
| Age Bracket | Public Insurance | Private Insurance |
| Under 6 | 1,917 (46.2%) | 2,245 (54.1%) |
| 6 to 18 Years | 4,331 (49.2%) | 4,325 (49.2%) |
| 19 to 25 Years | 1,046 (23.7%) | 2,534 (57.3%) |
| 25 to 34 Years | 963 (12.2%) | 5,173 (65.4%) |
| 35 to 44 Years | 794 (10.7%) | 5,325 (72.1%) |
| 45 to 54 Years | 1,485 (21.8%) | 4,450 (65.3%) |
| 55 to 64 Years | 1,648 (25.2%) | 4,290 (65.5%) |
| 65 to 74 Years | 3,512 (88.1%) | 2,189 (54.9%) |
| 75 Years and over | 2,229 (97.2%) | 1,330 (58.0%) |
| Total | 17,925 (34.3%) | 31,861 (60.9%) |
Disability Status by Sex by Age in Wheaton
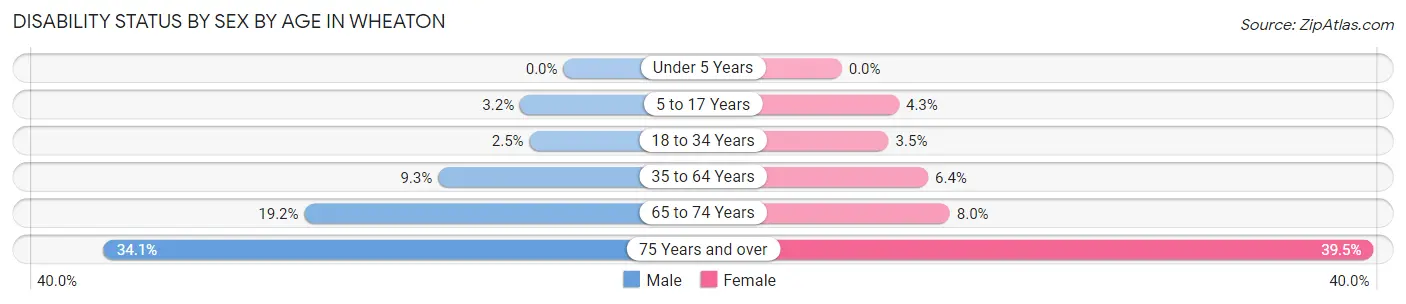
| Age Bracket | Male | Female |
| Under 5 Years | 0 (0.0%) | 0 (0.0%) |
| 5 to 17 Years | 150 (3.2%) | 185 (4.3%) |
| 18 to 34 Years | 174 (2.5%) | 209 (3.5%) |
| 35 to 64 Years | 1,014 (9.3%) | 632 (6.4%) |
| 65 to 74 Years | 390 (19.2%) | 157 (8.0%) |
| 75 Years and over | 279 (34.1%) | 582 (39.5%) |
Disability Class by Sex by Age in Wheaton
Disability Class: Hearing Difficulty
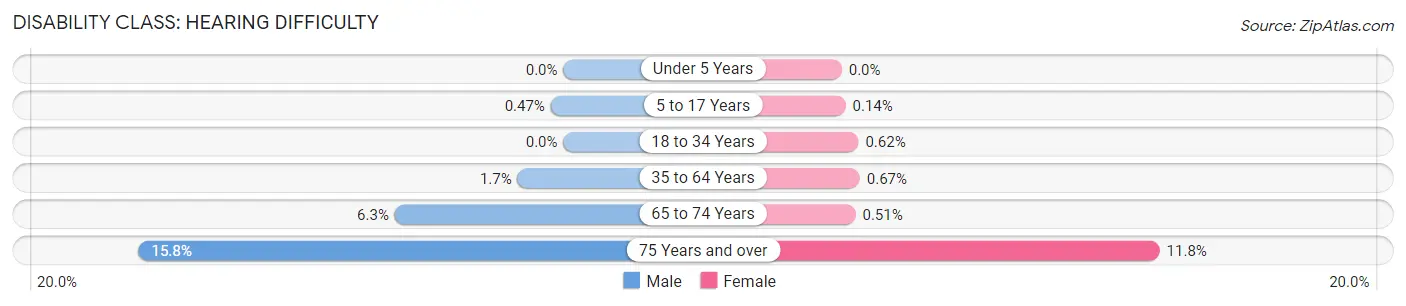
| Age Bracket | Male | Female |
| Under 5 Years | 0 (0.0%) | 0 (0.0%) |
| 5 to 17 Years | 22 (0.5%) | 6 (0.1%) |
| 18 to 34 Years | 0 (0.0%) | 37 (0.6%) |
| 35 to 64 Years | 185 (1.7%) | 66 (0.7%) |
| 65 to 74 Years | 127 (6.3%) | 10 (0.5%) |
| 75 Years and over | 129 (15.8%) | 174 (11.8%) |
Disability Class: Vision Difficulty
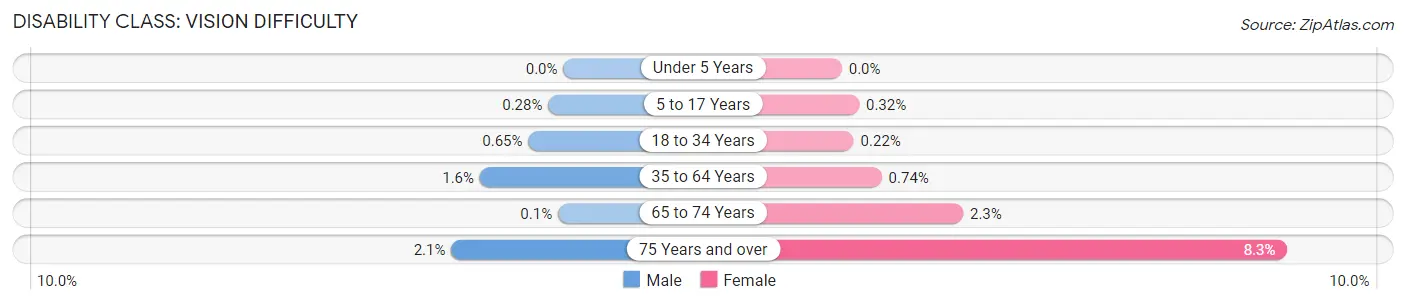
| Age Bracket | Male | Female |
| Under 5 Years | 0 (0.0%) | 0 (0.0%) |
| 5 to 17 Years | 13 (0.3%) | 14 (0.3%) |
| 18 to 34 Years | 45 (0.6%) | 13 (0.2%) |
| 35 to 64 Years | 169 (1.5%) | 73 (0.7%) |
| 65 to 74 Years | 2 (0.1%) | 44 (2.2%) |
| 75 Years and over | 17 (2.1%) | 122 (8.3%) |
Disability Class: Cognitive Difficulty
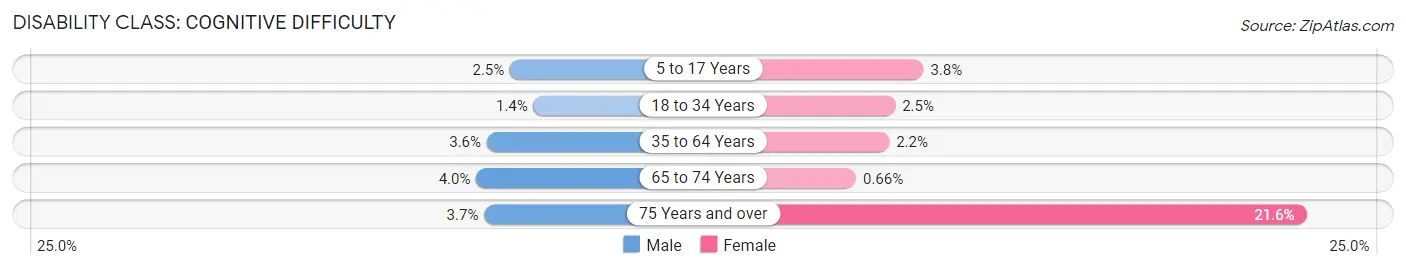
| Age Bracket | Male | Female |
| 5 to 17 Years | 115 (2.5%) | 165 (3.8%) |
| 18 to 34 Years | 95 (1.4%) | 149 (2.5%) |
| 35 to 64 Years | 387 (3.5%) | 217 (2.2%) |
| 65 to 74 Years | 82 (4.0%) | 13 (0.7%) |
| 75 Years and over | 30 (3.7%) | 318 (21.6%) |
Disability Class: Ambulatory Difficulty
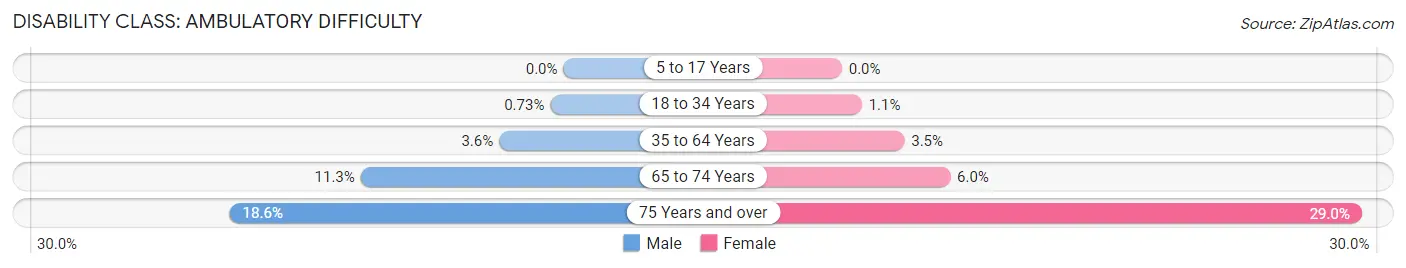
| Age Bracket | Male | Female |
| 5 to 17 Years | 0 (0.0%) | 0 (0.0%) |
| 18 to 34 Years | 50 (0.7%) | 67 (1.1%) |
| 35 to 64 Years | 390 (3.6%) | 343 (3.5%) |
| 65 to 74 Years | 229 (11.3%) | 118 (6.0%) |
| 75 Years and over | 152 (18.6%) | 427 (28.9%) |
Disability Class: Self-Care Difficulty
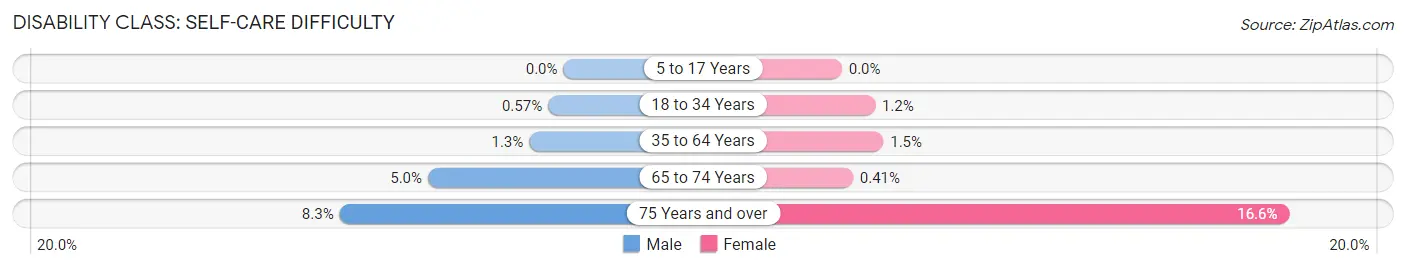
| Age Bracket | Male | Female |
| 5 to 17 Years | 0 (0.0%) | 0 (0.0%) |
| 18 to 34 Years | 39 (0.6%) | 74 (1.2%) |
| 35 to 64 Years | 138 (1.3%) | 152 (1.5%) |
| 65 to 74 Years | 102 (5.0%) | 8 (0.4%) |
| 75 Years and over | 68 (8.3%) | 245 (16.6%) |
Technology Access in Wheaton
Computing Device Access in Wheaton
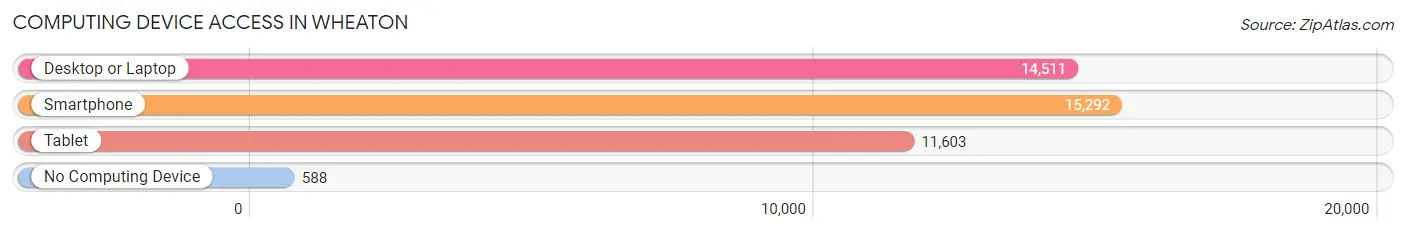
| Device Type | # Households | % Households |
| Desktop or Laptop | 14,511 | 86.7% |
| Smartphone | 15,292 | 91.4% |
| Tablet | 11,603 | 69.3% |
| No Computing Device | 588 | 3.5% |
| Total | 16,734 | 100.0% |
Internet Access in Wheaton
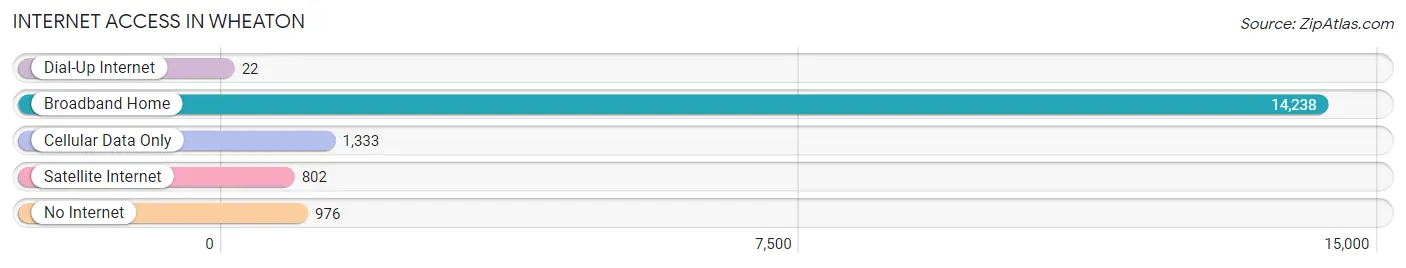
| Internet Type | # Households | % Households |
| Dial-Up Internet | 22 | 0.1% |
| Broadband Home | 14,238 | 85.1% |
| Cellular Data Only | 1,333 | 8.0% |
| Satellite Internet | 802 | 4.8% |
| No Internet | 976 | 5.8% |
| Total | 16,734 | 100.0% |
Wheaton Summary
History
Wheaton is a census-designated place (CDP) located in Montgomery County, Maryland. It is a suburb of Washington, D.C. and is located approximately 10 miles north of the city. The area was first settled in the late 1700s and was known as “Wheatonsville”. The name was changed to Wheaton in 1894 when the post office was established.
Wheaton was originally a farming community, but in the early 1900s it began to develop into a residential area. The area was annexed by the City of Silver Spring in the 1950s and became part of Montgomery County in the 1960s.
Wheaton has a rich history of civil rights activism. In the 1950s, the area was home to a number of civil rights organizations, including the Montgomery County Council of Human Relations and the Montgomery County Council of Churches. In the 1960s, the area was the site of several protests and marches, including the March on Washington in 1963.
Geography
Wheaton is located in Montgomery County, Maryland, approximately 10 miles north of Washington, D.C. The area is bordered by the cities of Silver Spring and Takoma Park to the south, and by the towns of Kensington and Garrett Park to the north.
The area is mostly residential, with some commercial and industrial development. The area is served by the Washington Metro Red Line, which runs through the center of Wheaton.
The area is home to several parks, including Wheaton Regional Park, Brookside Gardens, and Wheaton Regional Park. The area is also home to several schools, including Wheaton High School, John F. Kennedy High School, and Albert Einstein High School.
Economy
Wheaton is a primarily residential area, but it does have some commercial and industrial development. The area is home to several shopping centers, including Westfield Wheaton, Wheaton Mall, and Wheaton Plaza. The area is also home to several office parks, including the Wheaton Business Park and the Wheaton Triangle.
The area is home to several major employers, including the National Institutes of Health, the National Oceanic and Atmospheric Administration, and the U.S. Department of Health and Human Services.
Demographics
As of the 2010 census, the population of Wheaton was 48,284. The racial makeup of the area was 57.3% White, 16.2% African American, 0.4% Native American, 11.7% Asian, 0.1% Pacific Islander, 9.7% from other races, and 5.6% from two or more races. Hispanic or Latino of any race were 18.3% of the population.
The median household income in Wheaton was $76,837 in 2018. The median home value was $400,000 in 2018. The median age of the population was 37.7 years.
Common Questions
What is Per Capita Income in Wheaton?
Per Capita income in Wheaton is $41,025.
What is the Median Family Income in Wheaton?
Median Family Income in Wheaton is $108,147.
What is the Median Household income in Wheaton?
Median Household Income in Wheaton is $101,229.
What is Income or Wage Gap in Wheaton?
Income or Wage Gap in Wheaton is 8.9%.
Women in Wheaton earn 91.1 cents for every dollar earned by a man.
What is Family Income Deficit in Wheaton?
Family Income Deficit in Wheaton is $10,845.
Families that are below poverty line in Wheaton earn $10,845 less on average than the poverty threshold level.
What is Inequality or Gini Index in Wheaton?
Inequality or Gini Index in Wheaton is 0.41.
What is the Total Population of Wheaton?
Total Population of Wheaton is 52,775.
What is the Total Male Population of Wheaton?
Total Male Population of Wheaton is 26,979.
What is the Total Female Population of Wheaton?
Total Female Population of Wheaton is 25,796.
What is the Ratio of Males per 100 Females in Wheaton?
There are 104.59 Males per 100 Females in Wheaton.
What is the Ratio of Females per 100 Males in Wheaton?
There are 95.62 Females per 100 Males in Wheaton.
What is the Median Population Age in Wheaton?
Median Population Age in Wheaton is 36.0 Years.
What is the Average Family Size in Wheaton
Average Family Size in Wheaton is 3.6 People.
What is the Average Household Size in Wheaton
Average Household Size in Wheaton is 3.1 People.
How Large is the Labor Force in Wheaton?
There are 30,252 People in the Labor Forcein in Wheaton.
What is the Percentage of People in the Labor Force in Wheaton?
72.3% of People are in the Labor Force in Wheaton.
What is the Unemployment Rate in Wheaton?
Unemployment Rate in Wheaton is 6.0%.