Silver Spring, MD Map & Demographics
Silver Spring Map
Silver Spring Overview
$54,095
PER CAPITA INCOME
$118,315
AVG FAMILY INCOME
$95,213
AVG HOUSEHOLD INCOME
17.4%
WAGE / INCOME GAP [ % ]
82.6¢/ $1
WAGE / INCOME GAP [ $ ]
0.45
INEQUALITY / GINI INDEX
81,808
TOTAL POPULATION
40,084
MALE POPULATION
41,724
FEMALE POPULATION
96.07
MALES / 100 FEMALES
104.09
FEMALES / 100 MALES
34.9
MEDIAN AGE
3.2
AVG FAMILY SIZE
2.4
AVG HOUSEHOLD SIZE
51,244
LABOR FORCE [ PEOPLE ]
79.0%
PERCENT IN LABOR FORCE
4.7%
UNEMPLOYMENT RATE
Income in Silver Spring
Income Overview in Silver Spring
Per Capita Income in Silver Spring is $54,095, while median incomes of families and households are $118,315 and $95,213 respectively.
| Characteristic | Number | Measure |
| Per Capita Income | 81,808 | $54,095 |
| Median Family Income | 18,403 | $118,315 |
| Mean Family Income | 18,403 | $154,874 |
| Median Household Income | 33,884 | $95,213 |
| Mean Household Income | 33,884 | $128,592 |
| Income Deficit | 18,403 | $0 |
| Wage / Income Gap (%) | 81,808 | 17.42% |
| Wage / Income Gap ($) | 81,808 | 82.58¢ per $1 |
| Gini / Inequality Index | 81,808 | 0.45 |
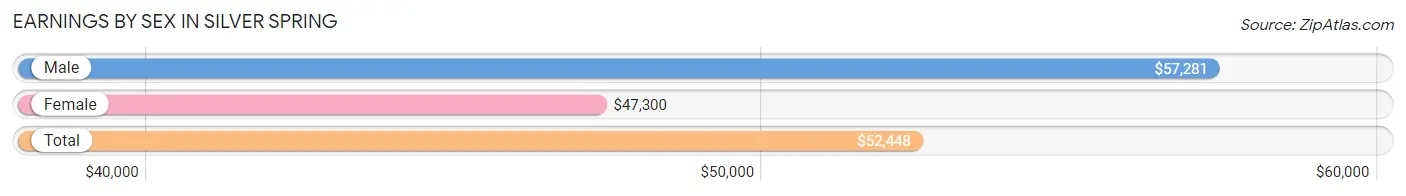
Earnings by Sex in Silver Spring
Average Earnings in Silver Spring are $52,448, $57,281 for men and $47,300 for women, a difference of 17.4%.
| Sex | Number | Average Earnings |
| Male | 26,261 (50.5%) | $57,281 |
| Female | 25,739 (49.5%) | $47,300 |
| Total | 52,000 (100.0%) | $52,448 |
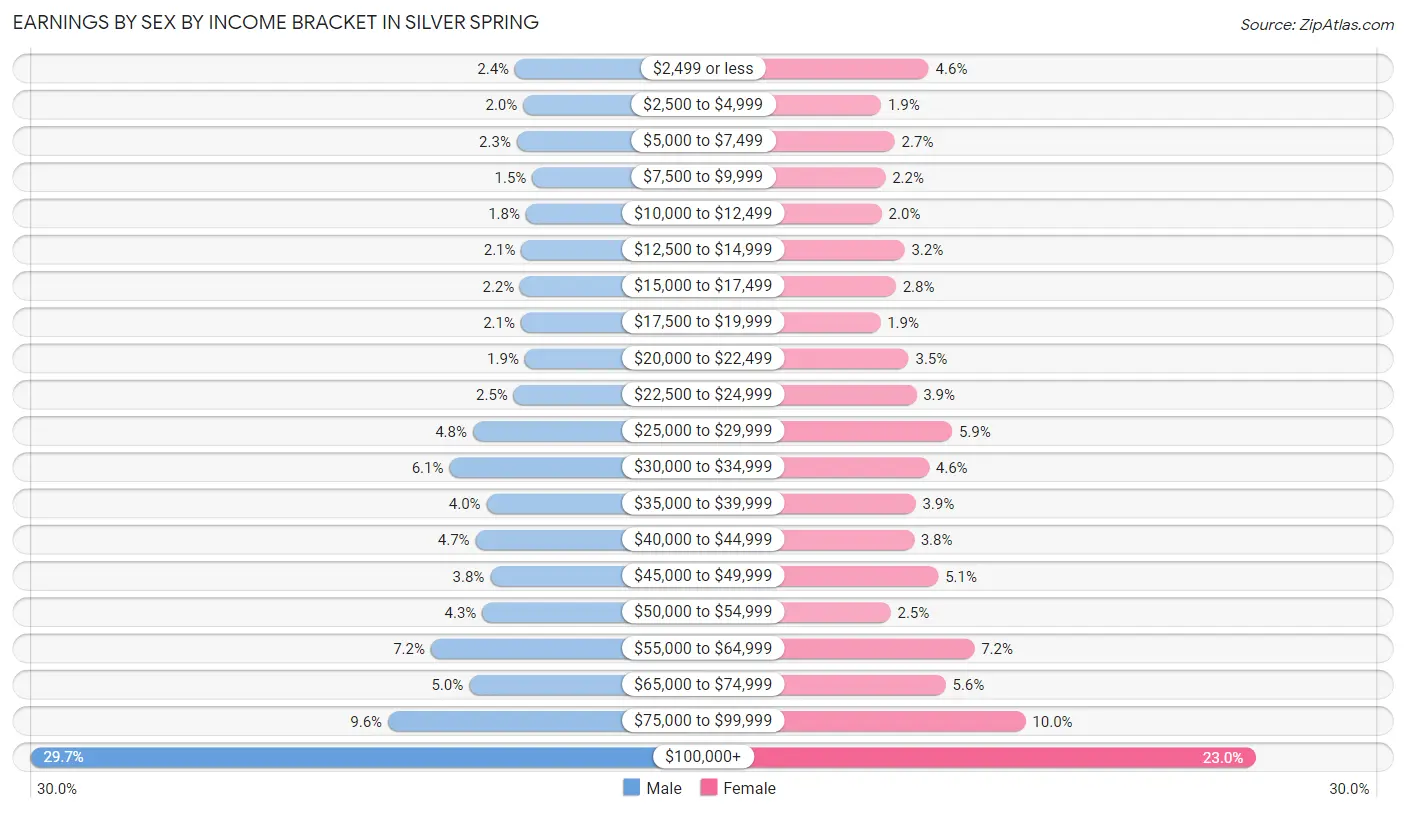
Earnings by Sex by Income Bracket in Silver Spring
The most common earnings brackets in Silver Spring are $100,000+ for men (7,792 | 29.7%) and $100,000+ for women (5,906 | 23.0%).
| Income | Male | Female |
| $2,499 or less | 640 (2.4%) | 1,184 (4.6%) |
| $2,500 to $4,999 | 521 (2.0%) | 495 (1.9%) |
| $5,000 to $7,499 | 615 (2.3%) | 692 (2.7%) |
| $7,500 to $9,999 | 386 (1.5%) | 555 (2.2%) |
| $10,000 to $12,499 | 480 (1.8%) | 505 (2.0%) |
| $12,500 to $14,999 | 546 (2.1%) | 834 (3.2%) |
| $15,000 to $17,499 | 564 (2.1%) | 708 (2.8%) |
| $17,500 to $19,999 | 555 (2.1%) | 484 (1.9%) |
| $20,000 to $22,499 | 497 (1.9%) | 894 (3.5%) |
| $22,500 to $24,999 | 658 (2.5%) | 1,003 (3.9%) |
| $25,000 to $29,999 | 1,264 (4.8%) | 1,520 (5.9%) |
| $30,000 to $34,999 | 1,609 (6.1%) | 1,187 (4.6%) |
| $35,000 to $39,999 | 1,062 (4.0%) | 994 (3.9%) |
| $40,000 to $44,999 | 1,223 (4.7%) | 967 (3.8%) |
| $45,000 to $49,999 | 1,006 (3.8%) | 1,323 (5.1%) |
| $50,000 to $54,999 | 1,125 (4.3%) | 633 (2.5%) |
| $55,000 to $64,999 | 1,882 (7.2%) | 1,843 (7.2%) |
| $65,000 to $74,999 | 1,319 (5.0%) | 1,428 (5.6%) |
| $75,000 to $99,999 | 2,517 (9.6%) | 2,584 (10.0%) |
| $100,000+ | 7,792 (29.7%) | 5,906 (23.0%) |
| Total | 26,261 (100.0%) | 25,739 (100.0%) |
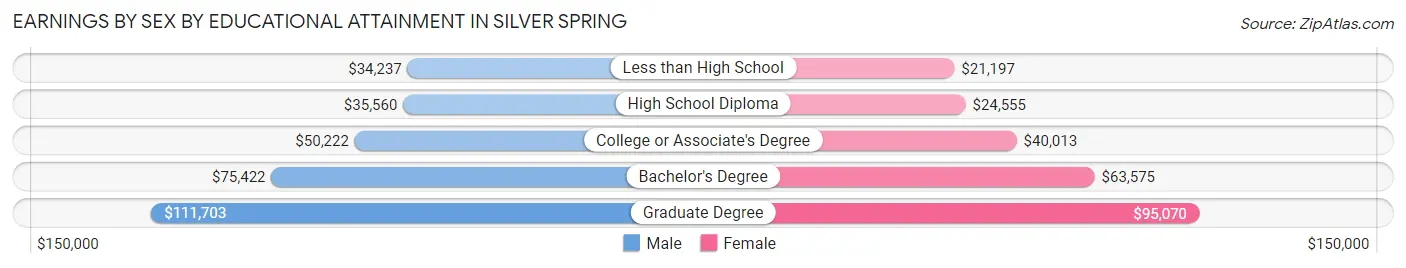
Earnings by Sex by Educational Attainment in Silver Spring
Average earnings in Silver Spring are $63,199 for men and $55,024 for women, a difference of 12.9%. Men with an educational attainment of graduate degree enjoy the highest average annual earnings of $111,703, while those with less than high school education earn the least with $34,237. Women with an educational attainment of graduate degree earn the most with the average annual earnings of $95,070, while those with less than high school education have the smallest earnings of $21,197.
| Educational Attainment | Male Income | Female Income |
| Less than High School | $34,237 | $21,197 |
| High School Diploma | $35,560 | $24,555 |
| College or Associate's Degree | $50,222 | $40,013 |
| Bachelor's Degree | $75,422 | $63,575 |
| Graduate Degree | $111,703 | $95,070 |
| Total | $63,199 | $55,024 |
Family Income in Silver Spring
Family Income Brackets in Silver Spring
According to the Silver Spring family income data, there are 5,134 families falling into the $200,000+ income range, which is the most common income bracket and makes up 27.9% of all families. Conversely, the $10,000 to $14,999 income bracket is the least frequent group with only 74 families (0.4%) belonging to this category.
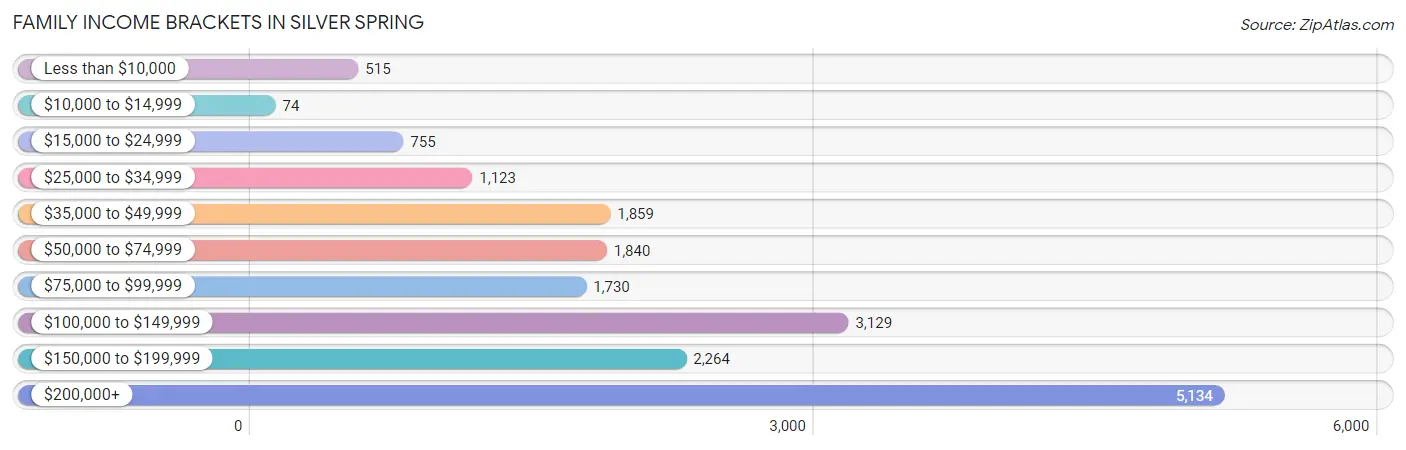
| Income Bracket | # Families | % Families |
| Less than $10,000 | 515 | 2.8% |
| $10,000 to $14,999 | 74 | 0.4% |
| $15,000 to $24,999 | 755 | 4.1% |
| $25,000 to $34,999 | 1,123 | 6.1% |
| $35,000 to $49,999 | 1,859 | 10.1% |
| $50,000 to $74,999 | 1,840 | 10.0% |
| $75,000 to $99,999 | 1,730 | 9.4% |
| $100,000 to $149,999 | 3,129 | 17.0% |
| $150,000 to $199,999 | 2,264 | 12.3% |
| $200,000+ | 5,134 | 27.9% |
Family Income by Famaliy Size in Silver Spring
7+ person families (257 | 1.4%) account for the highest median family income in Silver Spring with $158,221 per family, while 2-person families (7,807 | 42.4%) have the highest median income of $61,052 per family member.
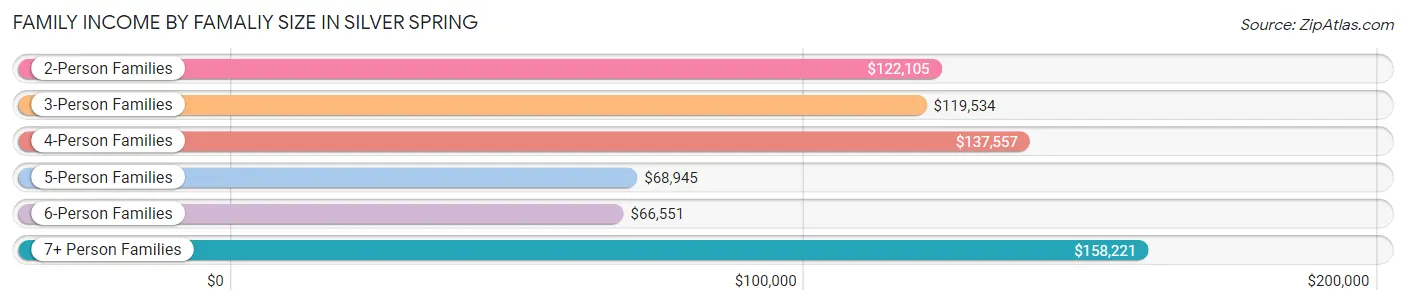
| Income Bracket | # Families | Median Income |
| 2-Person Families | 7,807 (42.4%) | $122,105 |
| 3-Person Families | 4,670 (25.4%) | $119,534 |
| 4-Person Families | 3,383 (18.4%) | $137,557 |
| 5-Person Families | 1,711 (9.3%) | $68,945 |
| 6-Person Families | 575 (3.1%) | $66,551 |
| 7+ Person Families | 257 (1.4%) | $158,221 |
| Total | 18,403 (100.0%) | $118,315 |
Family Income by Number of Earners in Silver Spring
The median family income in Silver Spring is $118,315, with families comprising 2 earners (9,820) having the highest median family income of $154,470, while families with no earners (1,155) have the lowest median family income of $48,384, accounting for 53.4% and 6.3% of families, respectively.
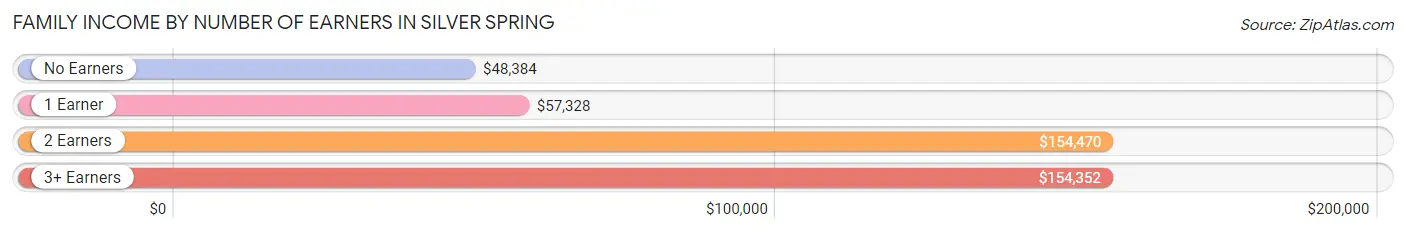
| Number of Earners | # Families | Median Income |
| No Earners | 1,155 (6.3%) | $48,384 |
| 1 Earner | 5,086 (27.6%) | $57,328 |
| 2 Earners | 9,820 (53.4%) | $154,470 |
| 3+ Earners | 2,342 (12.7%) | $154,352 |
| Total | 18,403 (100.0%) | $118,315 |
Household Income in Silver Spring
Household Income Brackets in Silver Spring
With 6,370 households falling in the category, the $200,000+ income range is the most frequent in Silver Spring, accounting for 18.8% of all households. In contrast, only 576 households (1.7%) fall into the $10,000 to $14,999 income bracket, making it the least populous group.
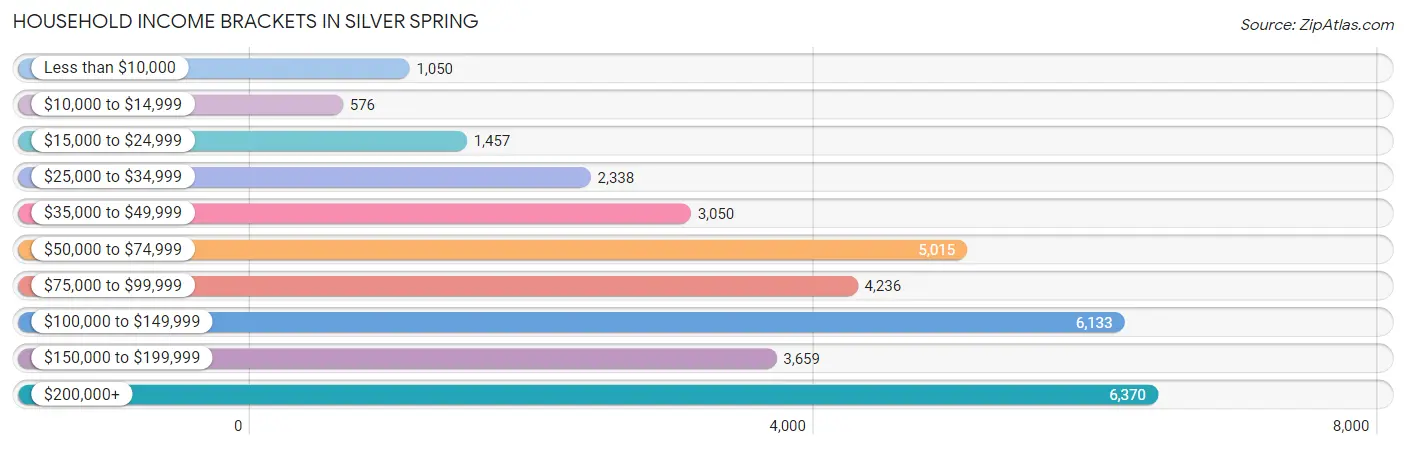
| Income Bracket | # Households | % Households |
| Less than $10,000 | 1,050 | 3.1% |
| $10,000 to $14,999 | 576 | 1.7% |
| $15,000 to $24,999 | 1,457 | 4.3% |
| $25,000 to $34,999 | 2,338 | 6.9% |
| $35,000 to $49,999 | 3,050 | 9.0% |
| $50,000 to $74,999 | 5,015 | 14.8% |
| $75,000 to $99,999 | 4,236 | 12.5% |
| $100,000 to $149,999 | 6,133 | 18.1% |
| $150,000 to $199,999 | 3,659 | 10.8% |
| $200,000+ | 6,370 | 18.8% |
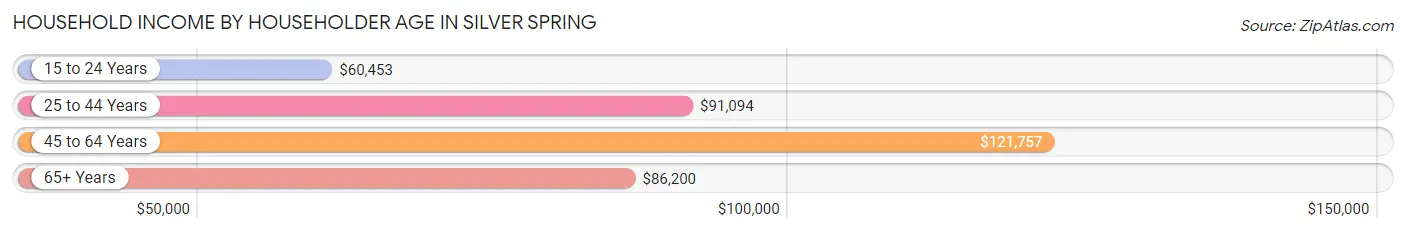
Household Income by Householder Age in Silver Spring
The median household income in Silver Spring is $95,213, with the highest median household income of $121,757 found in the 45 to 64 years age bracket for the primary householder. A total of 10,740 households (31.7%) fall into this category. Meanwhile, the 15 to 24 years age bracket for the primary householder has the lowest median household income of $60,453, with 1,783 households (5.3%) in this group.
| Income Bracket | # Households | Median Income |
| 15 to 24 Years | 1,783 (5.3%) | $60,453 |
| 25 to 44 Years | 15,301 (45.2%) | $91,094 |
| 45 to 64 Years | 10,740 (31.7%) | $121,757 |
| 65+ Years | 6,060 (17.9%) | $86,200 |
| Total | 33,884 (100.0%) | $95,213 |
Poverty in Silver Spring
Income Below Poverty by Sex and Age in Silver Spring
With 8.6% poverty level for males and 12.2% for females among the residents of Silver Spring, under 5 year old males and 12 to 14 year old females are the most vulnerable to poverty, with 451 males (17.1%) and 272 females (23.4%) in their respective age groups living below the poverty level.
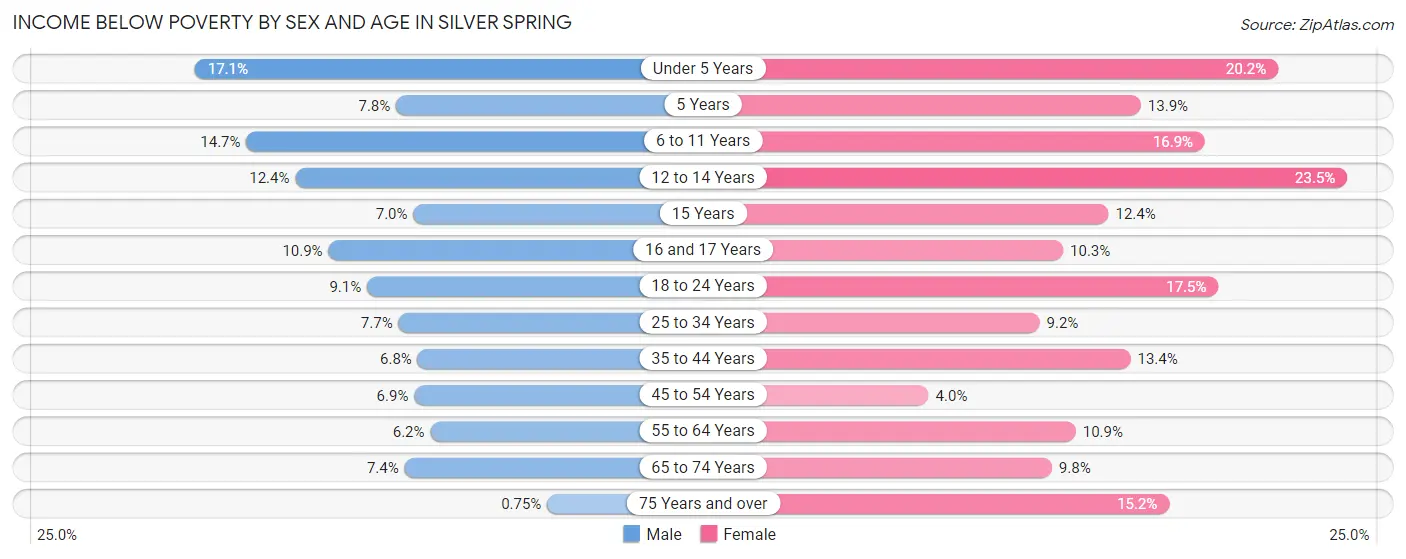
| Age Bracket | Male | Female |
| Under 5 Years | 451 (17.1%) | 536 (20.2%) |
| 5 Years | 47 (7.8%) | 103 (13.9%) |
| 6 to 11 Years | 495 (14.7%) | 479 (16.9%) |
| 12 to 14 Years | 216 (12.4%) | 272 (23.4%) |
| 15 Years | 22 (7.0%) | 64 (12.4%) |
| 16 and 17 Years | 97 (10.9%) | 72 (10.3%) |
| 18 to 24 Years | 297 (9.1%) | 605 (17.5%) |
| 25 to 34 Years | 568 (7.6%) | 764 (9.2%) |
| 35 to 44 Years | 464 (6.8%) | 871 (13.4%) |
| 45 to 54 Years | 322 (6.9%) | 187 (4.0%) |
| 55 to 64 Years | 250 (6.2%) | 475 (10.9%) |
| 65 to 74 Years | 211 (7.4%) | 361 (9.8%) |
| 75 Years and over | 9 (0.7%) | 280 (15.2%) |
| Total | 3,449 (8.6%) | 5,069 (12.2%) |
Income Above Poverty by Sex and Age in Silver Spring
According to the poverty statistics in Silver Spring, males aged 75 years and over and females aged 45 to 54 years are the age groups that are most secure financially, with 99.3% of males and 96.0% of females in these age groups living above the poverty line.
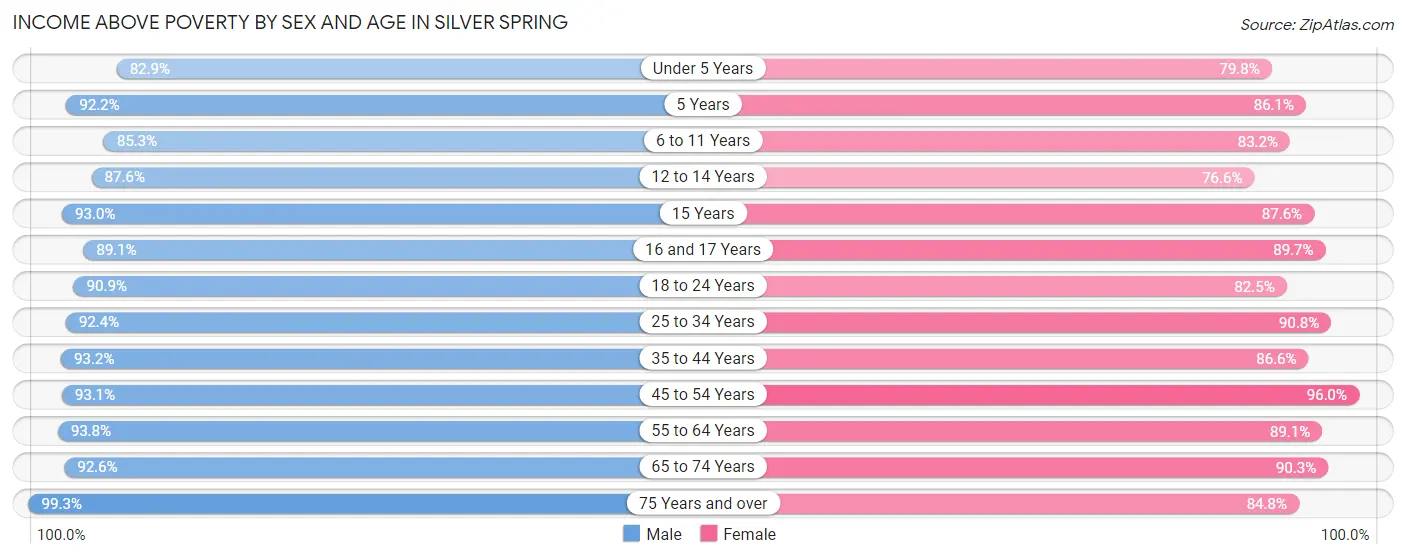
| Age Bracket | Male | Female |
| Under 5 Years | 2,186 (82.9%) | 2,112 (79.8%) |
| 5 Years | 559 (92.2%) | 639 (86.1%) |
| 6 to 11 Years | 2,871 (85.3%) | 2,364 (83.2%) |
| 12 to 14 Years | 1,521 (87.6%) | 888 (76.5%) |
| 15 Years | 294 (93.0%) | 453 (87.6%) |
| 16 and 17 Years | 793 (89.1%) | 629 (89.7%) |
| 18 to 24 Years | 2,962 (90.9%) | 2,859 (82.5%) |
| 25 to 34 Years | 6,853 (92.3%) | 7,562 (90.8%) |
| 35 to 44 Years | 6,404 (93.2%) | 5,631 (86.6%) |
| 45 to 54 Years | 4,330 (93.1%) | 4,448 (96.0%) |
| 55 to 64 Years | 3,803 (93.8%) | 3,900 (89.1%) |
| 65 to 74 Years | 2,651 (92.6%) | 3,340 (90.2%) |
| 75 Years and over | 1,184 (99.3%) | 1,563 (84.8%) |
| Total | 36,411 (91.3%) | 36,388 (87.8%) |
Income Below Poverty Among Married-Couple Families in Silver Spring
The poverty statistics for married-couple families in Silver Spring show that 6.1% or 808 of the total 13,133 families live below the poverty line. Families with 5 or more children have the highest poverty rate of 100.0%, comprising of 12 families. On the other hand, families with no children have the lowest poverty rate of 1.3%, which includes 86 families.
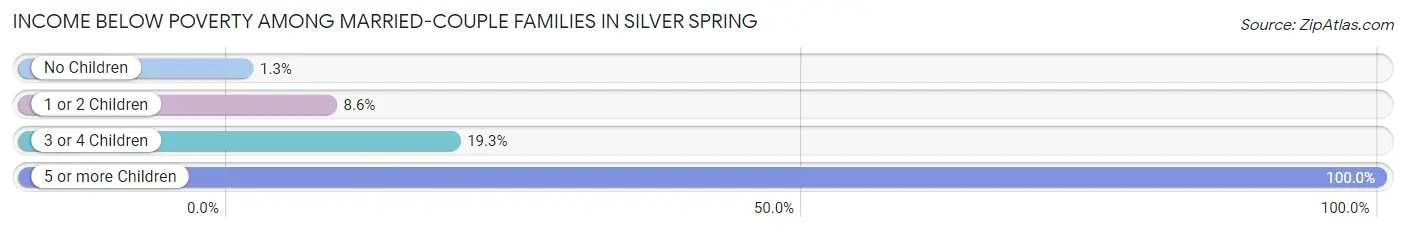
| Children | Above Poverty | Below Poverty |
| No Children | 6,463 (98.7%) | 86 (1.3%) |
| 1 or 2 Children | 4,765 (91.4%) | 447 (8.6%) |
| 3 or 4 Children | 1,097 (80.7%) | 263 (19.3%) |
| 5 or more Children | 0 (0.0%) | 12 (100.0%) |
| Total | 12,325 (93.9%) | 808 (6.1%) |
Income Below Poverty Among Single-Parent Households in Silver Spring
According to the poverty data in Silver Spring, 2.2% or 40 single-father households and 16.8% or 574 single-mother households are living below the poverty line. Among single-father households, those with 1 or 2 children have the highest poverty rate, with 40 households (3.5%) experiencing poverty. Likewise, among single-mother households, those with 5 or more children have the highest poverty rate, with 23 households (100.0%) falling below the poverty line.
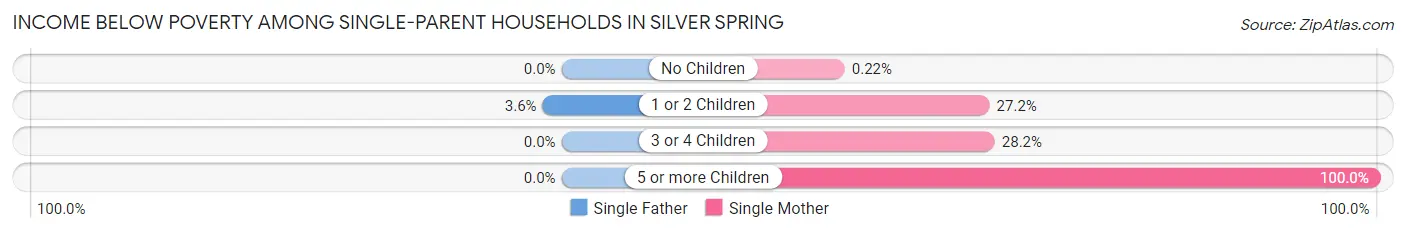
| Children | Single Father | Single Mother |
| No Children | 0 (0.0%) | 3 (0.2%) |
| 1 or 2 Children | 40 (3.5%) | 479 (27.2%) |
| 3 or 4 Children | 0 (0.0%) | 69 (28.2%) |
| 5 or more Children | 0 (0.0%) | 23 (100.0%) |
| Total | 40 (2.2%) | 574 (16.8%) |
Income Below Poverty Among Married-Couple vs Single-Parent Households in Silver Spring
The poverty data for Silver Spring shows that 808 of the married-couple family households (6.1%) and 614 of the single-parent households (11.7%) are living below the poverty level. Within the married-couple family households, those with 5 or more children have the highest poverty rate, with 12 households (100.0%) falling below the poverty line. Among the single-parent households, those with 5 or more children have the highest poverty rate, with 23 household (100.0%) living below poverty.
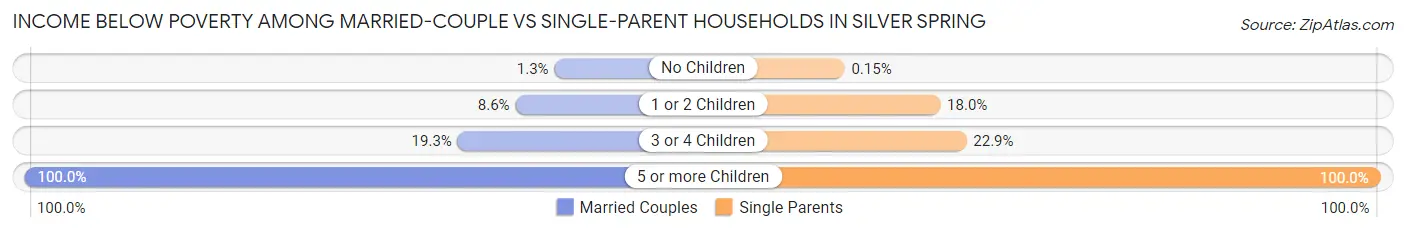
| Children | Married-Couple Families | Single-Parent Households |
| No Children | 86 (1.3%) | 3 (0.2%) |
| 1 or 2 Children | 447 (8.6%) | 519 (18.0%) |
| 3 or 4 Children | 263 (19.3%) | 69 (22.9%) |
| 5 or more Children | 12 (100.0%) | 23 (100.0%) |
| Total | 808 (6.1%) | 614 (11.7%) |
Race in Silver Spring
The most populous races in Silver Spring are White / Caucasian (30,244 | 37.0%), Black / African American (24,320 | 29.7%), and Hispanic or Latino (19,307 | 23.6%).
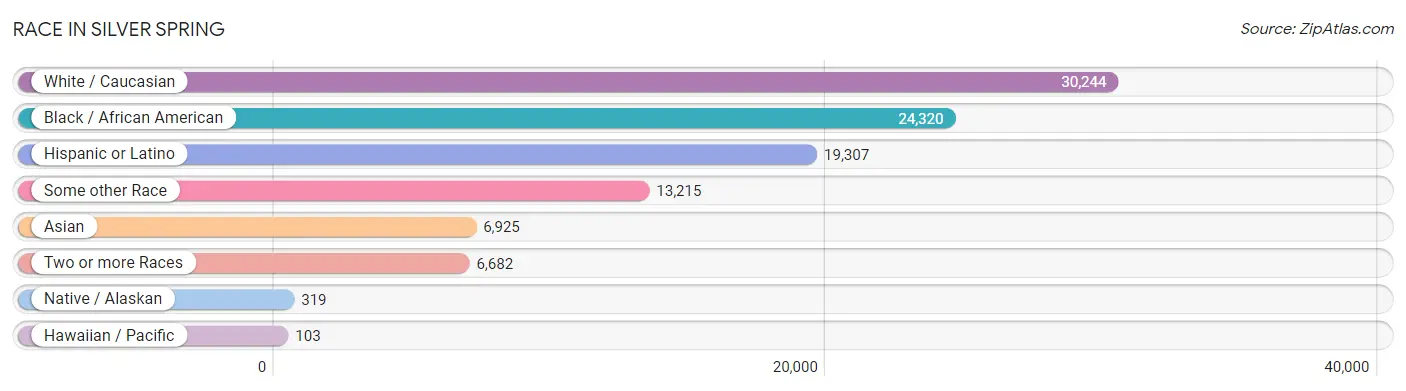
| Race | # Population | % Population |
| Asian | 6,925 | 8.5% |
| Black / African American | 24,320 | 29.7% |
| Hawaiian / Pacific | 103 | 0.1% |
| Hispanic or Latino | 19,307 | 23.6% |
| Native / Alaskan | 319 | 0.4% |
| White / Caucasian | 30,244 | 37.0% |
| Two or more Races | 6,682 | 8.2% |
| Some other Race | 13,215 | 16.2% |
| Total | 81,808 | 100.0% |
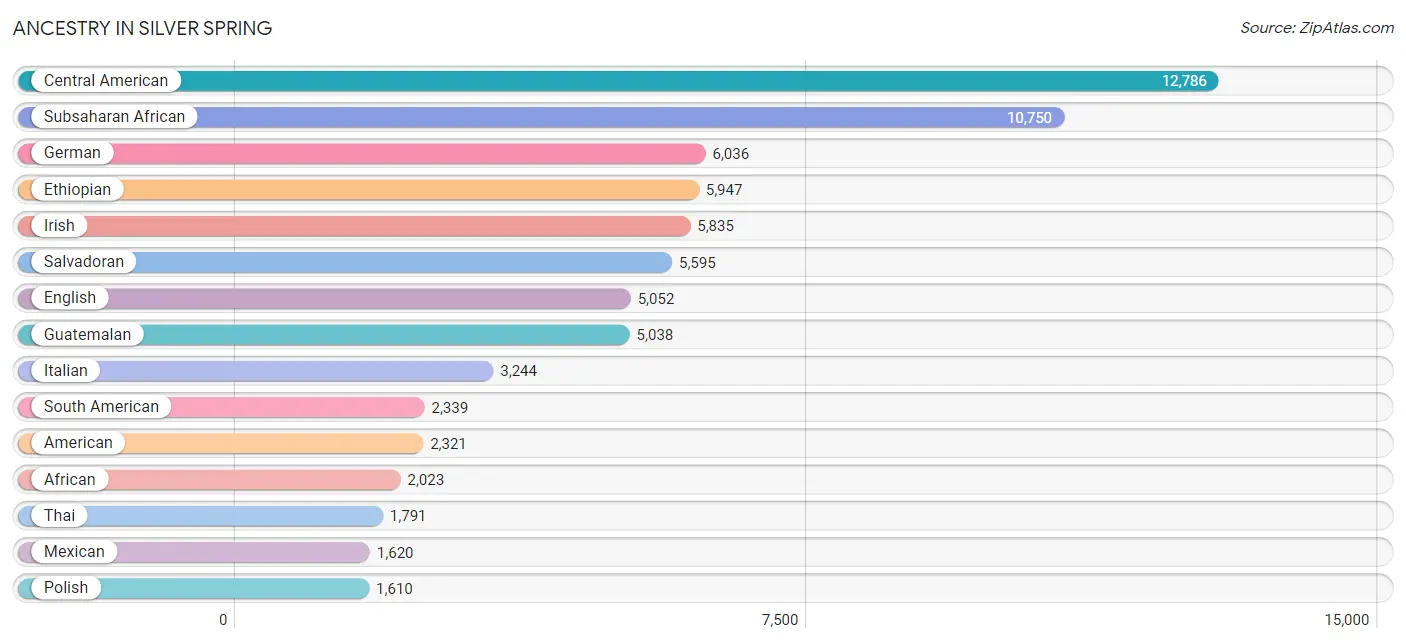
Ancestry in Silver Spring
The most populous ancestries reported in Silver Spring are Central American (12,786 | 15.6%), Subsaharan African (10,750 | 13.1%), German (6,036 | 7.4%), Ethiopian (5,947 | 7.3%), and Irish (5,835 | 7.1%), together accounting for 50.5% of all Silver Spring residents.
| Ancestry | # Population | % Population |
| Afghan | 478 | 0.6% |
| African | 2,023 | 2.5% |
| Albanian | 6 | 0.0% |
| Alsatian | 14 | 0.0% |
| American | 2,321 | 2.8% |
| Arab | 532 | 0.6% |
| Argentinean | 257 | 0.3% |
| Austrian | 387 | 0.5% |
| Bahamian | 27 | 0.0% |
| Barbadian | 92 | 0.1% |
| Belgian | 116 | 0.1% |
| Bhutanese | 739 | 0.9% |
| Blackfeet | 81 | 0.1% |
| Bolivian | 450 | 0.5% |
| Brazilian | 217 | 0.3% |
| British | 765 | 0.9% |
| British West Indian | 101 | 0.1% |
| Bulgarian | 36 | 0.0% |
| Burmese | 1,173 | 1.4% |
| Cajun | 13 | 0.0% |
| Cambodian | 14 | 0.0% |
| Canadian | 117 | 0.1% |
| Cape Verdean | 11 | 0.0% |
| Carpatho Rusyn | 12 | 0.0% |
| Celtic | 23 | 0.0% |
| Central American | 12,786 | 15.6% |
| Central American Indian | 162 | 0.2% |
| Cherokee | 201 | 0.3% |
| Chilean | 126 | 0.2% |
| Chippewa | 22 | 0.0% |
| Colombian | 421 | 0.5% |
| Costa Rican | 49 | 0.1% |
| Croatian | 88 | 0.1% |
| Cuban | 232 | 0.3% |
| Czech | 223 | 0.3% |
| Czechoslovakian | 37 | 0.1% |
| Danish | 266 | 0.3% |
| Dominican | 705 | 0.9% |
| Dutch | 632 | 0.8% |
| Eastern European | 980 | 1.2% |
| Ecuadorian | 249 | 0.3% |
| Egyptian | 41 | 0.1% |
| English | 5,052 | 6.2% |
| Estonian | 8 | 0.0% |
| Ethiopian | 5,947 | 7.3% |
| European | 1,481 | 1.8% |
| Filipino | 112 | 0.1% |
| Finnish | 165 | 0.2% |
| French | 843 | 1.0% |
| French Canadian | 278 | 0.3% |
| German | 6,036 | 7.4% |
| German Russian | 14 | 0.0% |
| Ghanaian | 244 | 0.3% |
| Greek | 361 | 0.4% |
| Guamanian / Chamorro | 26 | 0.0% |
| Guatemalan | 5,038 | 6.2% |
| Guyanese | 218 | 0.3% |
| Haitian | 509 | 0.6% |
| Honduran | 1,281 | 1.6% |
| Hungarian | 362 | 0.4% |
| Indian (Asian) | 1,395 | 1.7% |
| Iranian | 224 | 0.3% |
| Iraqi | 50 | 0.1% |
| Irish | 5,835 | 7.1% |
| Israeli | 57 | 0.1% |
| Italian | 3,244 | 4.0% |
| Jamaican | 1,068 | 1.3% |
| Japanese | 223 | 0.3% |
| Jordanian | 48 | 0.1% |
| Kenyan | 14 | 0.0% |
| Kiowa | 8 | 0.0% |
| Korean | 896 | 1.1% |
| Laotian | 43 | 0.1% |
| Latvian | 166 | 0.2% |
| Lebanese | 98 | 0.1% |
| Liberian | 201 | 0.3% |
| Lithuanian | 321 | 0.4% |
| Luxembourger | 30 | 0.0% |
| Mexican | 1,620 | 2.0% |
| Mexican American Indian | 30 | 0.0% |
| Mongolian | 9 | 0.0% |
| Moroccan | 220 | 0.3% |
| Native Hawaiian | 52 | 0.1% |
| Navajo | 13 | 0.0% |
| Nicaraguan | 786 | 1.0% |
| Nigerian | 800 | 1.0% |
| Northern European | 147 | 0.2% |
| Norwegian | 468 | 0.6% |
| Pakistani | 26 | 0.0% |
| Panamanian | 37 | 0.1% |
| Paraguayan | 24 | 0.0% |
| Pennsylvania German | 6 | 0.0% |
| Peruvian | 789 | 1.0% |
| Polish | 1,610 | 2.0% |
| Portuguese | 195 | 0.2% |
| Puerto Rican | 645 | 0.8% |
| Romanian | 118 | 0.1% |
| Russian | 1,227 | 1.5% |
| Salvadoran | 5,595 | 6.8% |
| Samoan | 95 | 0.1% |
| Scandinavian | 123 | 0.2% |
| Scotch-Irish | 734 | 0.9% |
| Scottish | 1,057 | 1.3% |
| Senegalese | 21 | 0.0% |
| Serbian | 179 | 0.2% |
| Sierra Leonean | 65 | 0.1% |
| Slavic | 19 | 0.0% |
| Slovak | 160 | 0.2% |
| South African | 11 | 0.0% |
| South American | 2,339 | 2.9% |
| South American Indian | 95 | 0.1% |
| Spaniard | 292 | 0.4% |
| Spanish | 124 | 0.2% |
| Spanish American Indian | 40 | 0.1% |
| Sri Lankan | 1,346 | 1.7% |
| Subsaharan African | 10,750 | 13.1% |
| Sudanese | 235 | 0.3% |
| Swedish | 649 | 0.8% |
| Swiss | 305 | 0.4% |
| Syrian | 22 | 0.0% |
| Taiwanese | 19 | 0.0% |
| Thai | 1,791 | 2.2% |
| Trinidadian and Tobagonian | 102 | 0.1% |
| Turkish | 243 | 0.3% |
| Ugandan | 103 | 0.1% |
| Ukrainian | 318 | 0.4% |
| Venezuelan | 23 | 0.0% |
| Vietnamese | 761 | 0.9% |
| Welsh | 278 | 0.3% |
| West Indian | 183 | 0.2% | View All 130 Rows |
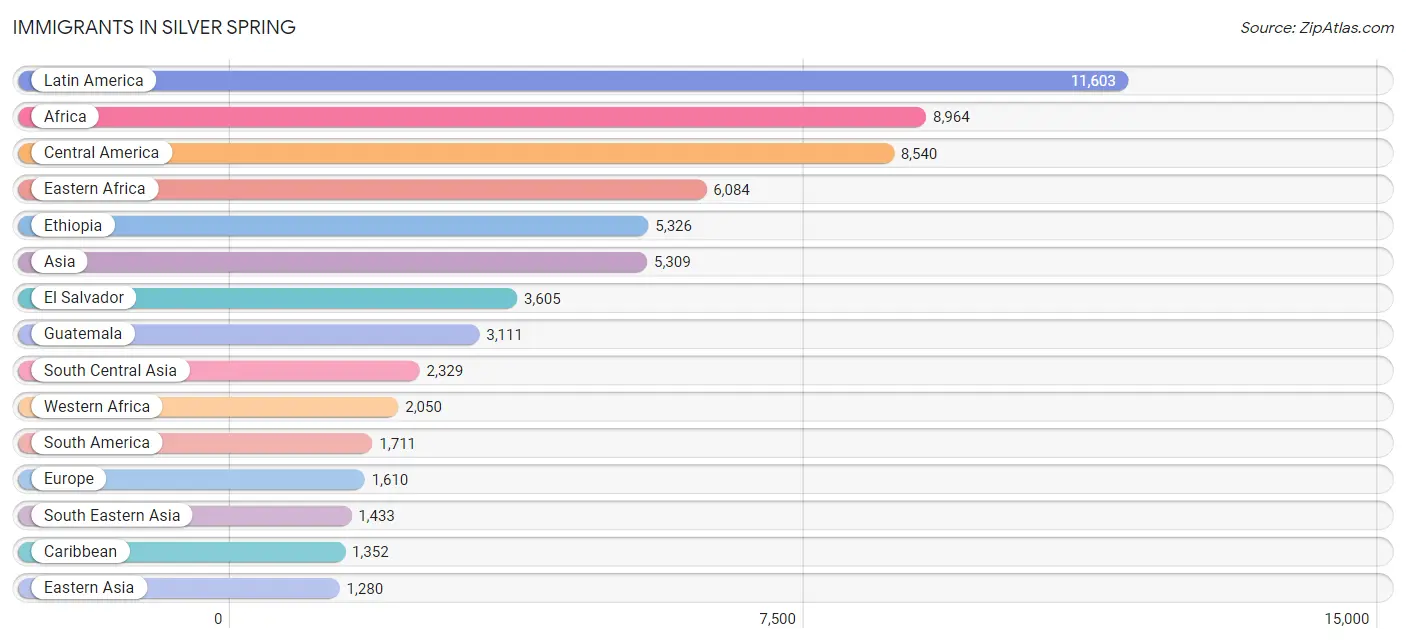
Immigrants in Silver Spring
The most numerous immigrant groups reported in Silver Spring came from Latin America (11,603 | 14.2%), Africa (8,964 | 11.0%), Central America (8,540 | 10.4%), Eastern Africa (6,084 | 7.4%), and Ethiopia (5,326 | 6.5%), together accounting for 49.5% of all Silver Spring residents.
| Immigration Origin | # Population | % Population |
| Afghanistan | 362 | 0.4% |
| Africa | 8,964 | 11.0% |
| Argentina | 45 | 0.1% |
| Asia | 5,309 | 6.5% |
| Australia | 53 | 0.1% |
| Austria | 36 | 0.0% |
| Bahamas | 43 | 0.1% |
| Bangladesh | 860 | 1.1% |
| Bolivia | 291 | 0.4% |
| Brazil | 120 | 0.2% |
| Bulgaria | 18 | 0.0% |
| Cambodia | 29 | 0.0% |
| Cameroon | 535 | 0.6% |
| Canada | 105 | 0.1% |
| Caribbean | 1,352 | 1.7% |
| Central America | 8,540 | 10.4% |
| Chile | 91 | 0.1% |
| China | 484 | 0.6% |
| Colombia | 388 | 0.5% |
| Congo | 32 | 0.0% |
| Costa Rica | 29 | 0.0% |
| Croatia | 11 | 0.0% |
| Cuba | 131 | 0.2% |
| Czechoslovakia | 24 | 0.0% |
| Dominican Republic | 356 | 0.4% |
| Eastern Africa | 6,084 | 7.4% |
| Eastern Asia | 1,280 | 1.6% |
| Eastern Europe | 568 | 0.7% |
| Ecuador | 108 | 0.1% |
| El Salvador | 3,605 | 4.4% |
| England | 81 | 0.1% |
| Eritrea | 271 | 0.3% |
| Ethiopia | 5,326 | 6.5% |
| Europe | 1,610 | 2.0% |
| Fiji | 103 | 0.1% |
| France | 131 | 0.2% |
| Germany | 148 | 0.2% |
| Ghana | 667 | 0.8% |
| Greece | 40 | 0.1% |
| Grenada | 45 | 0.1% |
| Guatemala | 3,111 | 3.8% |
| Guyana | 160 | 0.2% |
| Haiti | 226 | 0.3% |
| Honduras | 846 | 1.0% |
| Hong Kong | 23 | 0.0% |
| Hungary | 55 | 0.1% |
| India | 746 | 0.9% |
| Indonesia | 43 | 0.1% |
| Iran | 152 | 0.2% |
| Iraq | 12 | 0.0% |
| Ireland | 36 | 0.0% |
| Israel | 55 | 0.1% |
| Italy | 88 | 0.1% |
| Jamaica | 392 | 0.5% |
| Japan | 264 | 0.3% |
| Jordan | 48 | 0.1% |
| Kenya | 101 | 0.1% |
| Korea | 532 | 0.6% |
| Kuwait | 71 | 0.1% |
| Latin America | 11,603 | 14.2% |
| Latvia | 140 | 0.2% |
| Liberia | 152 | 0.2% |
| Lithuania | 11 | 0.0% |
| Mexico | 479 | 0.6% |
| Middle Africa | 658 | 0.8% |
| Nicaragua | 443 | 0.5% |
| Nigeria | 367 | 0.4% |
| Northern Africa | 27 | 0.0% |
| Northern Europe | 425 | 0.5% |
| Oceania | 156 | 0.2% |
| Pakistan | 137 | 0.2% |
| Panama | 27 | 0.0% |
| Peru | 508 | 0.6% |
| Philippines | 361 | 0.4% |
| Poland | 26 | 0.0% |
| Romania | 111 | 0.1% |
| Russia | 120 | 0.2% |
| Scotland | 13 | 0.0% |
| Senegal | 49 | 0.1% |
| Serbia | 26 | 0.0% |
| Sierra Leone | 87 | 0.1% |
| Somalia | 101 | 0.1% |
| South Africa | 11 | 0.0% |
| South America | 1,711 | 2.1% |
| South Central Asia | 2,329 | 2.9% |
| South Eastern Asia | 1,433 | 1.8% |
| Southern Europe | 276 | 0.3% |
| Spain | 132 | 0.2% |
| Sri Lanka | 62 | 0.1% |
| Sudan | 27 | 0.0% |
| Switzerland | 26 | 0.0% |
| Taiwan | 64 | 0.1% |
| Thailand | 42 | 0.1% |
| Trinidad and Tobago | 96 | 0.1% |
| Turkey | 17 | 0.0% |
| Uganda | 173 | 0.2% |
| Ukraine | 16 | 0.0% |
| Uzbekistan | 10 | 0.0% |
| Vietnam | 958 | 1.2% |
| Western Africa | 2,050 | 2.5% |
| Western Asia | 267 | 0.3% |
| Western Europe | 341 | 0.4% |
| Zaire | 26 | 0.0% | View All 103 Rows |
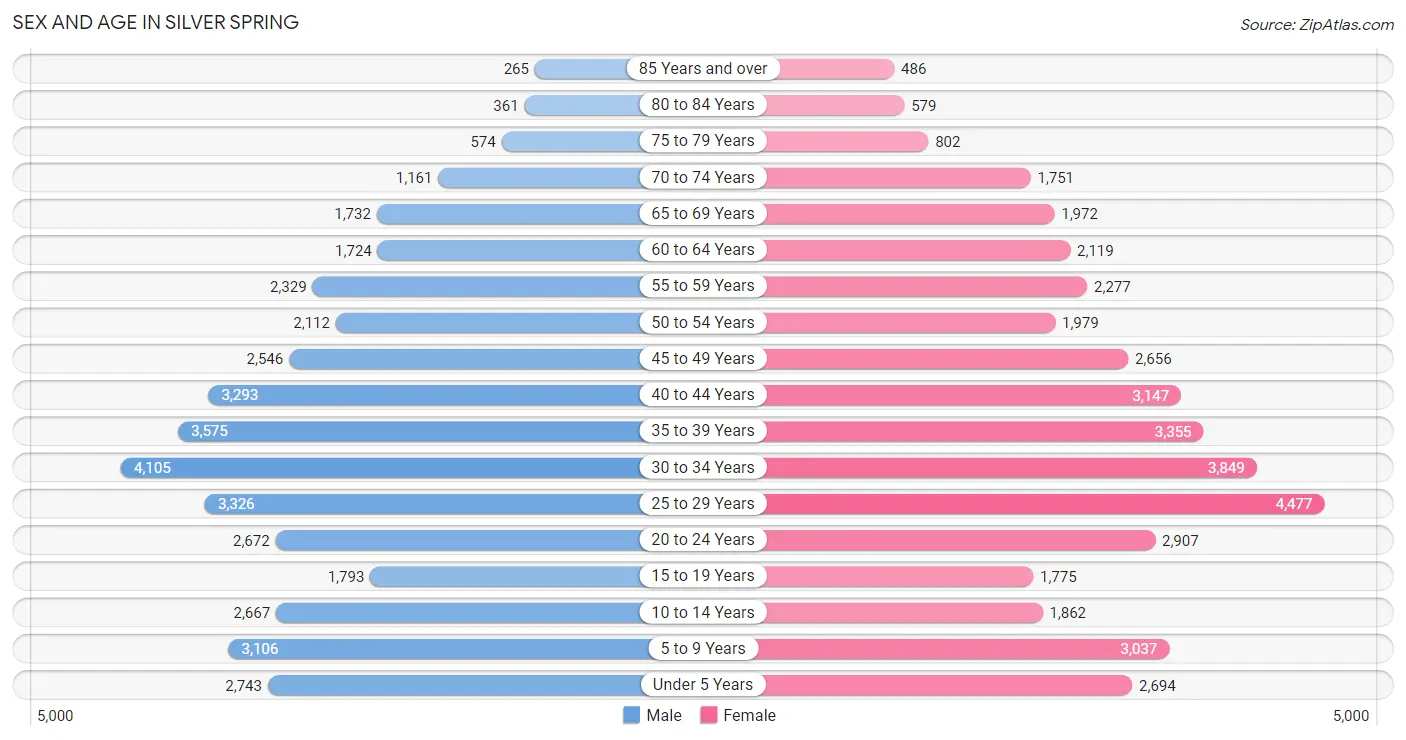
Sex and Age in Silver Spring
Sex and Age in Silver Spring
The most populous age groups in Silver Spring are 30 to 34 Years (4,105 | 10.2%) for men and 25 to 29 Years (4,477 | 10.7%) for women.
| Age Bracket | Male | Female |
| Under 5 Years | 2,743 (6.8%) | 2,694 (6.5%) |
| 5 to 9 Years | 3,106 (7.7%) | 3,037 (7.3%) |
| 10 to 14 Years | 2,667 (6.7%) | 1,862 (4.5%) |
| 15 to 19 Years | 1,793 (4.5%) | 1,775 (4.3%) |
| 20 to 24 Years | 2,672 (6.7%) | 2,907 (7.0%) |
| 25 to 29 Years | 3,326 (8.3%) | 4,477 (10.7%) |
| 30 to 34 Years | 4,105 (10.2%) | 3,849 (9.2%) |
| 35 to 39 Years | 3,575 (8.9%) | 3,355 (8.0%) |
| 40 to 44 Years | 3,293 (8.2%) | 3,147 (7.5%) |
| 45 to 49 Years | 2,546 (6.4%) | 2,656 (6.4%) |
| 50 to 54 Years | 2,112 (5.3%) | 1,979 (4.7%) |
| 55 to 59 Years | 2,329 (5.8%) | 2,277 (5.5%) |
| 60 to 64 Years | 1,724 (4.3%) | 2,119 (5.1%) |
| 65 to 69 Years | 1,732 (4.3%) | 1,972 (4.7%) |
| 70 to 74 Years | 1,161 (2.9%) | 1,751 (4.2%) |
| 75 to 79 Years | 574 (1.4%) | 802 (1.9%) |
| 80 to 84 Years | 361 (0.9%) | 579 (1.4%) |
| 85 Years and over | 265 (0.7%) | 486 (1.2%) |
| Total | 40,084 (100.0%) | 41,724 (100.0%) |
Families and Households in Silver Spring
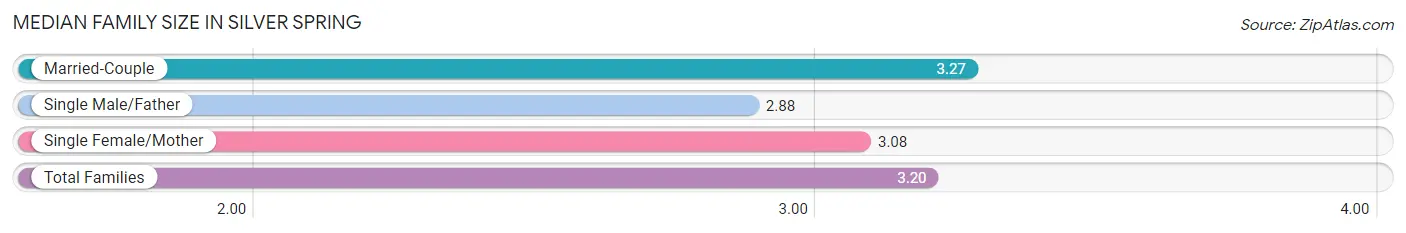
Median Family Size in Silver Spring
The median family size in Silver Spring is 3.20 persons per family, with married-couple families (13,133 | 71.4%) accounting for the largest median family size of 3.27 persons per family. On the other hand, single male/father families (1,856 | 10.1%) represent the smallest median family size with 2.88 persons per family.
| Family Type | # Families | Family Size |
| Married-Couple | 13,133 (71.4%) | 3.27 |
| Single Male/Father | 1,856 (10.1%) | 2.88 |
| Single Female/Mother | 3,414 (18.5%) | 3.08 |
| Total Families | 18,403 (100.0%) | 3.20 |
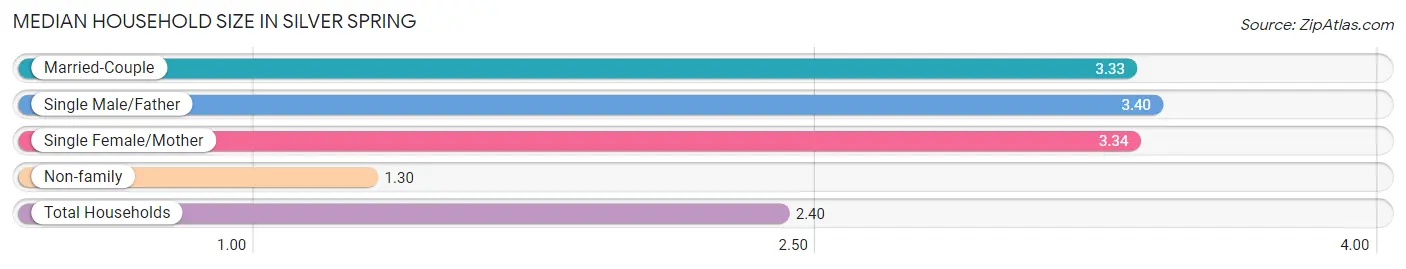
Median Household Size in Silver Spring
The median household size in Silver Spring is 2.40 persons per household, with single male/father households (1,856 | 5.5%) accounting for the largest median household size of 3.4 persons per household. non-family households (15,481 | 45.7%) represent the smallest median household size with 1.30 persons per household.
| Household Type | # Households | Household Size |
| Married-Couple | 13,133 (38.8%) | 3.33 |
| Single Male/Father | 1,856 (5.5%) | 3.40 |
| Single Female/Mother | 3,414 (10.1%) | 3.34 |
| Non-family | 15,481 (45.7%) | 1.30 |
| Total Households | 33,884 (100.0%) | 2.40 |
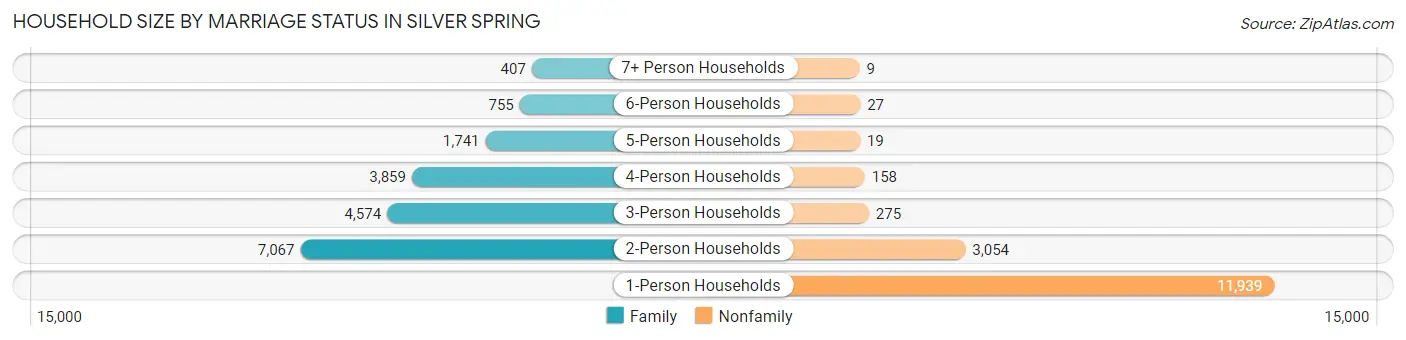
Household Size by Marriage Status in Silver Spring
Out of a total of 33,884 households in Silver Spring, 18,403 (54.3%) are family households, while 15,481 (45.7%) are nonfamily households. The most numerous type of family households are 2-person households, comprising 7,067, and the most common type of nonfamily households are 1-person households, comprising 11,939.
| Household Size | Family Households | Nonfamily Households |
| 1-Person Households | - | 11,939 (35.2%) |
| 2-Person Households | 7,067 (20.9%) | 3,054 (9.0%) |
| 3-Person Households | 4,574 (13.5%) | 275 (0.8%) |
| 4-Person Households | 3,859 (11.4%) | 158 (0.5%) |
| 5-Person Households | 1,741 (5.1%) | 19 (0.1%) |
| 6-Person Households | 755 (2.2%) | 27 (0.1%) |
| 7+ Person Households | 407 (1.2%) | 9 (0.0%) |
| Total | 18,403 (54.3%) | 15,481 (45.7%) |
Female Fertility in Silver Spring
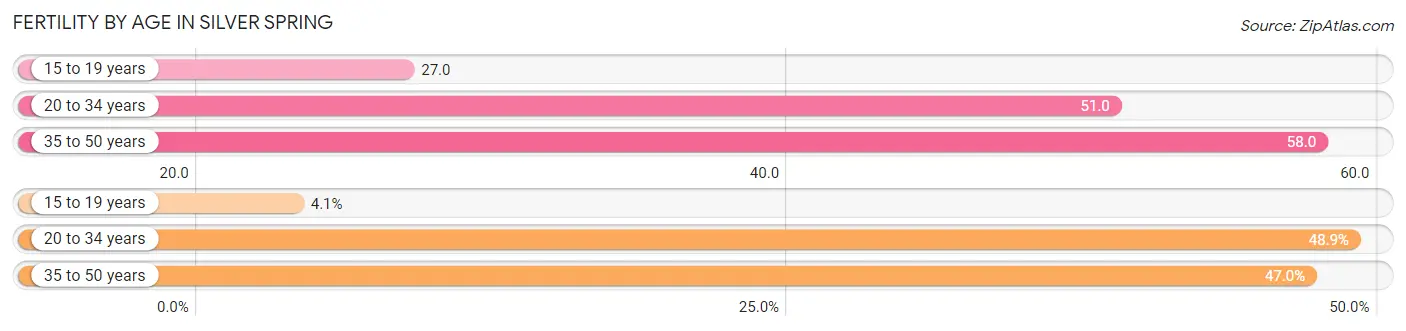
Fertility by Age in Silver Spring
Average fertility rate in Silver Spring is 52.0 births per 1,000 women. Women in the age bracket of 35 to 50 years have the highest fertility rate with 58.0 births per 1,000 women. Women in the age bracket of 20 to 34 years acount for 48.9% of all women with births.
| Age Bracket | Women with Births | Births / 1,000 Women |
| 15 to 19 years | 48 (4.1%) | 27.0 |
| 20 to 34 years | 578 (48.9%) | 51.0 |
| 35 to 50 years | 556 (47.0%) | 58.0 |
| Total | 1,182 (100.0%) | 52.0 |
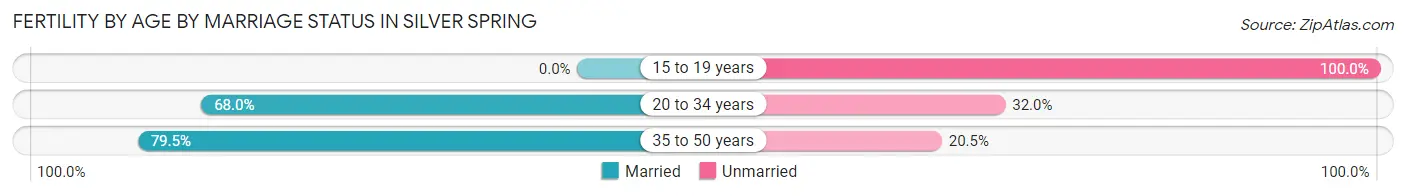
Fertility by Age by Marriage Status in Silver Spring
70.6% of women with births (1,182) in Silver Spring are married. The highest percentage of unmarried women with births falls into 15 to 19 years age bracket with 100.0% of them unmarried at the time of birth, while the lowest percentage of unmarried women with births belong to 35 to 50 years age bracket with 20.5% of them unmarried.
| Age Bracket | Married | Unmarried |
| 15 to 19 years | 0 (0.0%) | 48 (100.0%) |
| 20 to 34 years | 393 (68.0%) | 185 (32.0%) |
| 35 to 50 years | 442 (79.5%) | 114 (20.5%) |
| Total | 834 (70.6%) | 348 (29.4%) |
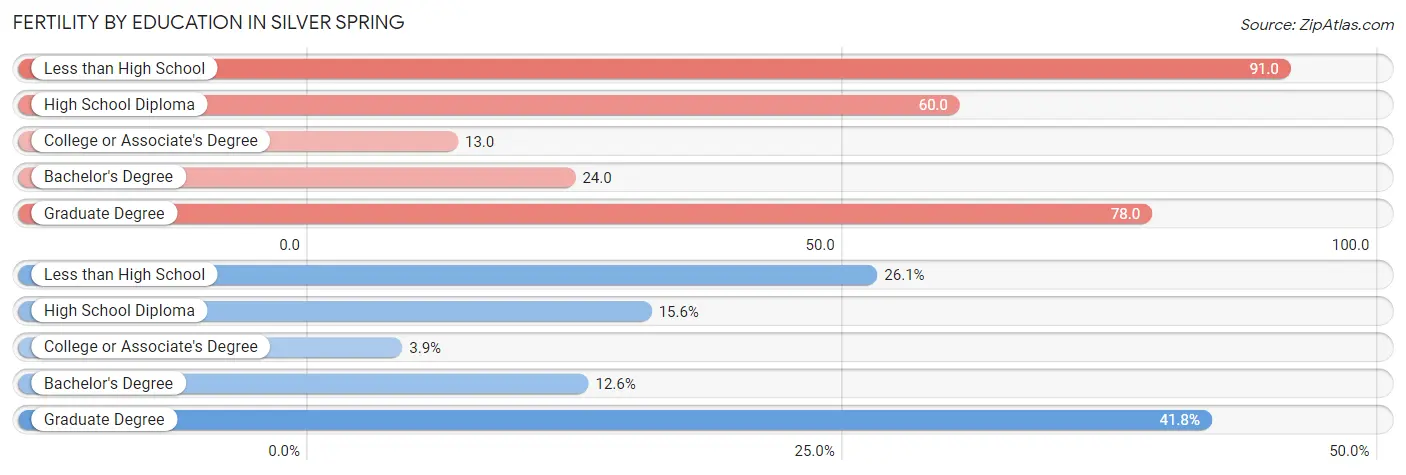
Fertility by Education in Silver Spring
Average fertility rate in Silver Spring is 52.0 births per 1,000 women. Women with the education attainment of less than high school have the highest fertility rate of 91.0 births per 1,000 women, while women with the education attainment of college or associate's degree have the lowest fertility at 13.0 births per 1,000 women. Women with the education attainment of graduate degree represent 41.8% of all women with births.
| Educational Attainment | Women with Births | Births / 1,000 Women |
| Less than High School | 309 (26.1%) | 91.0 |
| High School Diploma | 184 (15.6%) | 60.0 |
| College or Associate's Degree | 46 (3.9%) | 13.0 |
| Bachelor's Degree | 149 (12.6%) | 24.0 |
| Graduate Degree | 494 (41.8%) | 78.0 |
| Total | 1,182 (100.0%) | 52.0 |
Fertility by Education by Marriage Status in Silver Spring
29.4% of women with births in Silver Spring are unmarried. Women with the educational attainment of graduate degree are most likely to be married with 100.0% of them married at childbirth, while women with the educational attainment of high school diploma are least likely to be married with 72.8% of them unmarried at childbirth.
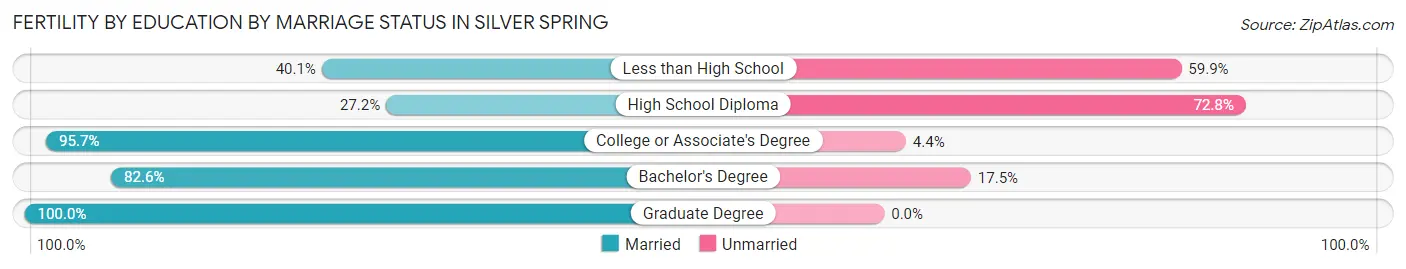
| Educational Attainment | Married | Unmarried |
| Less than High School | 124 (40.1%) | 185 (59.9%) |
| High School Diploma | 50 (27.2%) | 134 (72.8%) |
| College or Associate's Degree | 44 (95.7%) | 2 (4.3%) |
| Bachelor's Degree | 123 (82.6%) | 26 (17.4%) |
| Graduate Degree | 494 (100.0%) | 0 (0.0%) |
| Total | 834 (70.6%) | 348 (29.4%) |
Employment Characteristics in Silver Spring
Employment by Class of Employer in Silver Spring
Among the 47,474 employed individuals in Silver Spring, private company employees (25,176 | 53.0%), not-for-profit organizations (8,145 | 17.2%), and federal government employees (6,650 | 14.0%) make up the most common classes of employment.
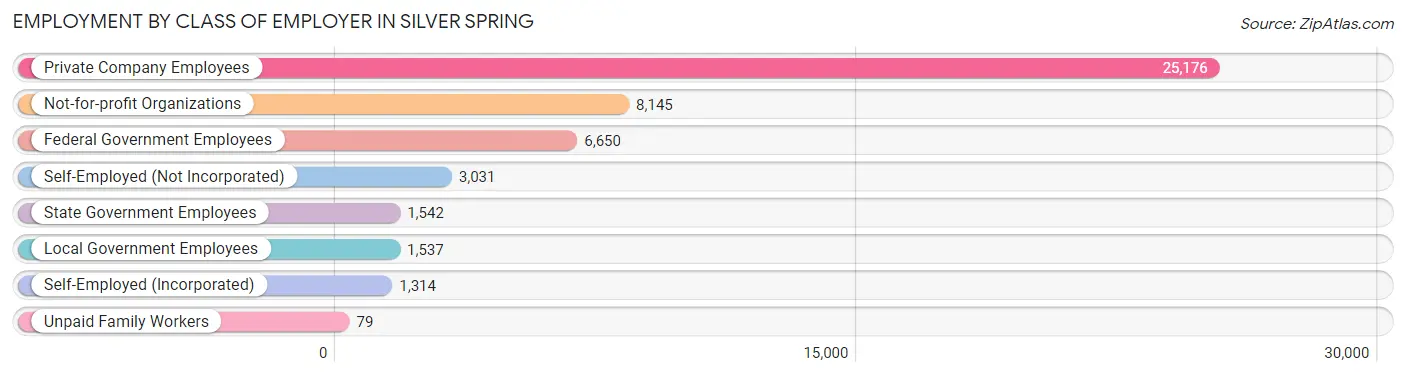
| Employer Class | # Employees | % Employees |
| Private Company Employees | 25,176 | 53.0% |
| Self-Employed (Incorporated) | 1,314 | 2.8% |
| Self-Employed (Not Incorporated) | 3,031 | 6.4% |
| Not-for-profit Organizations | 8,145 | 17.2% |
| Local Government Employees | 1,537 | 3.2% |
| State Government Employees | 1,542 | 3.3% |
| Federal Government Employees | 6,650 | 14.0% |
| Unpaid Family Workers | 79 | 0.2% |
| Total | 47,474 | 100.0% |
Employment Status by Age in Silver Spring
According to the labor force statistics for Silver Spring, out of the total population over 16 years of age (64,866), 79.0% or 51,244 individuals are in the labor force, with 4.7% or 2,408 of them unemployed. The age group with the highest labor force participation rate is 30 to 34 years, with 93.5% or 7,437 individuals in the labor force. Within the labor force, the 16 to 19 years age range has the highest percentage of unemployed individuals, with 12.0% or 106 of them being unemployed.
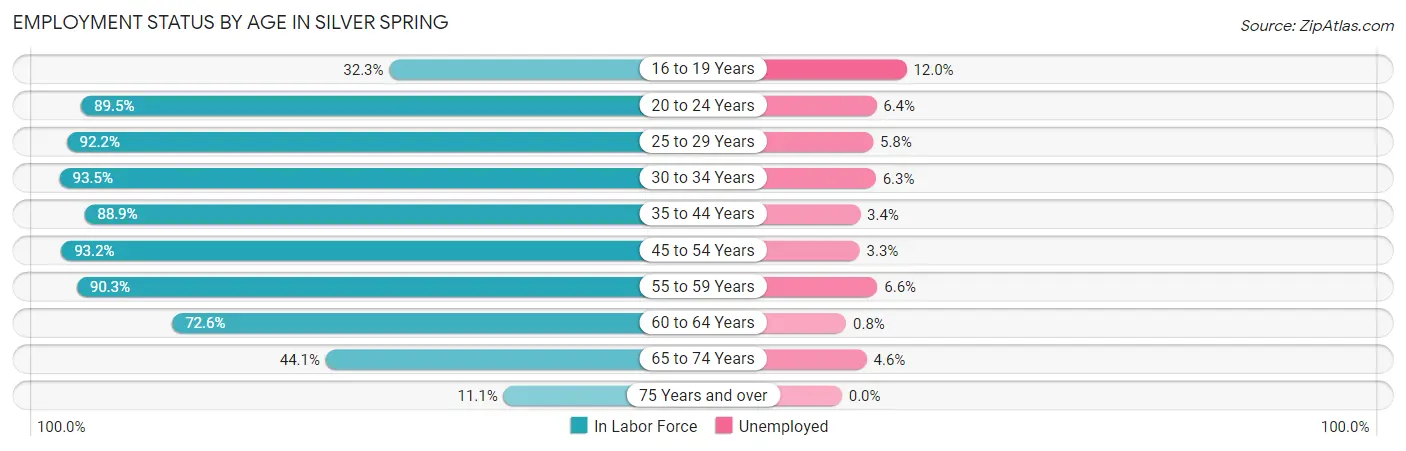
| Age Bracket | In Labor Force | Unemployed |
| 16 to 19 Years | 883 (32.3%) | 106 (12.0%) |
| 20 to 24 Years | 4,993 (89.5%) | 320 (6.4%) |
| 25 to 29 Years | 7,194 (92.2%) | 417 (5.8%) |
| 30 to 34 Years | 7,437 (93.5%) | 469 (6.3%) |
| 35 to 44 Years | 11,886 (88.9%) | 404 (3.4%) |
| 45 to 54 Years | 8,661 (93.2%) | 286 (3.3%) |
| 55 to 59 Years | 4,159 (90.3%) | 274 (6.6%) |
| 60 to 64 Years | 2,790 (72.6%) | 22 (0.8%) |
| 65 to 74 Years | 2,918 (44.1%) | 134 (4.6%) |
| 75 Years and over | 340 (11.1%) | 0 (0.0%) |
| Total | 51,244 (79.0%) | 2,408 (4.7%) |
Employment Status by Educational Attainment in Silver Spring
According to labor force statistics for Silver Spring, 89.9% of individuals (42,135) out of the total population between 25 and 64 years of age (46,869) are in the labor force, with 4.4% or 1,854 of them being unemployed. The group with the highest labor force participation rate are those with the educational attainment of bachelor's degree or higher, with 94.1% or 26,545 individuals in the labor force. Within the labor force, individuals with less than high school education have the highest percentage of unemployment, with 8.4% or 387 of them being unemployed.
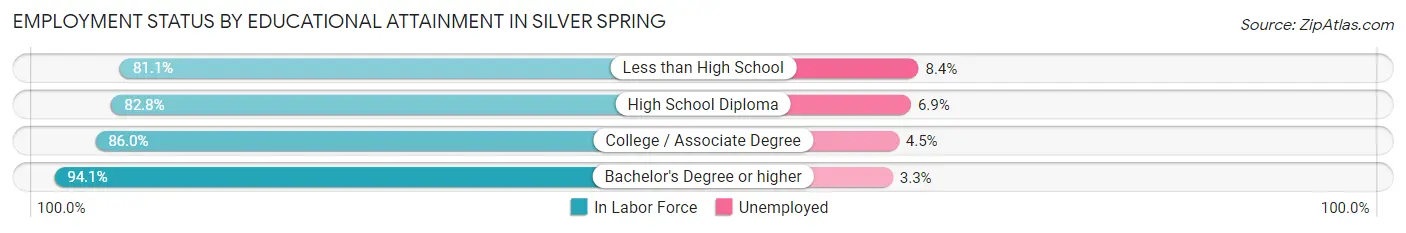
| Educational Attainment | In Labor Force | Unemployed |
| Less than High School | 4,609 (81.1%) | 477 (8.4%) |
| High School Diploma | 5,134 (82.8%) | 428 (6.9%) |
| College / Associate Degree | 5,828 (86.0%) | 305 (4.5%) |
| Bachelor's Degree or higher | 26,545 (94.1%) | 931 (3.3%) |
| Total | 42,135 (89.9%) | 2,062 (4.4%) |
Employment Occupations by Sex in Silver Spring
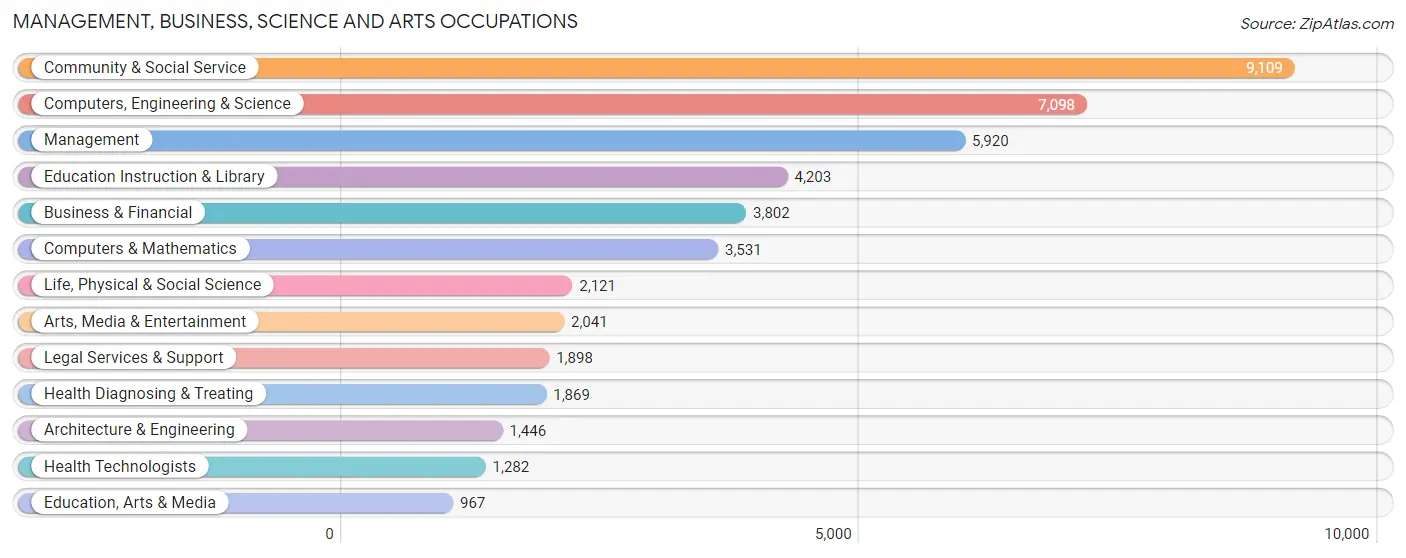
Management, Business, Science and Arts Occupations
The most common Management, Business, Science and Arts occupations in Silver Spring are Community & Social Service (9,109 | 18.7%), Computers, Engineering & Science (7,098 | 14.6%), Management (5,920 | 12.2%), Education Instruction & Library (4,203 | 8.6%), and Business & Financial (3,802 | 7.8%).
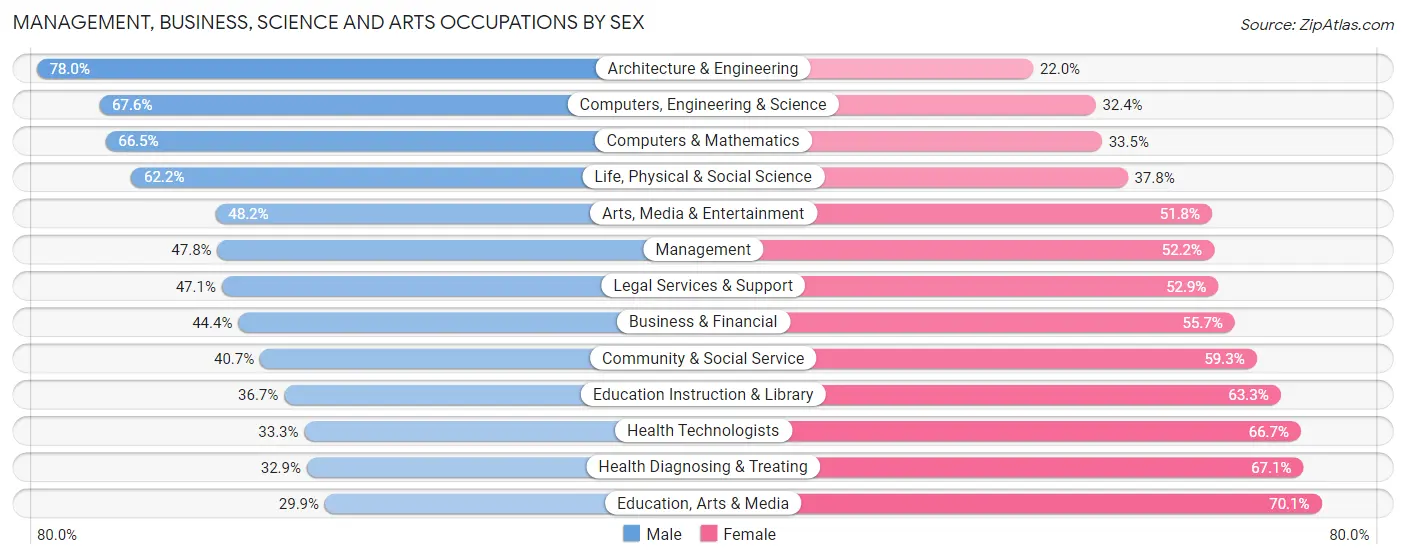
Management, Business, Science and Arts Occupations by Sex
Within the Management, Business, Science and Arts occupations in Silver Spring, the most male-oriented occupations are Architecture & Engineering (78.0%), Computers, Engineering & Science (67.6%), and Computers & Mathematics (66.5%), while the most female-oriented occupations are Education, Arts & Media (70.1%), Health Diagnosing & Treating (67.1%), and Health Technologists (66.7%).
| Occupation | Male | Female |
| Management | 2,831 (47.8%) | 3,089 (52.2%) |
| Business & Financial | 1,686 (44.4%) | 2,116 (55.6%) |
| Computers, Engineering & Science | 4,797 (67.6%) | 2,301 (32.4%) |
| Computers & Mathematics | 2,349 (66.5%) | 1,182 (33.5%) |
| Architecture & Engineering | 1,128 (78.0%) | 318 (22.0%) |
| Life, Physical & Social Science | 1,320 (62.2%) | 801 (37.8%) |
| Community & Social Service | 3,708 (40.7%) | 5,401 (59.3%) |
| Education, Arts & Media | 289 (29.9%) | 678 (70.1%) |
| Legal Services & Support | 894 (47.1%) | 1,004 (52.9%) |
| Education Instruction & Library | 1,542 (36.7%) | 2,661 (63.3%) |
| Arts, Media & Entertainment | 983 (48.2%) | 1,058 (51.8%) |
| Health Diagnosing & Treating | 615 (32.9%) | 1,254 (67.1%) |
| Health Technologists | 427 (33.3%) | 855 (66.7%) |
| Total (Category) | 13,637 (49.1%) | 14,161 (50.9%) |
| Total (Overall) | 24,921 (51.2%) | 23,702 (48.7%) |
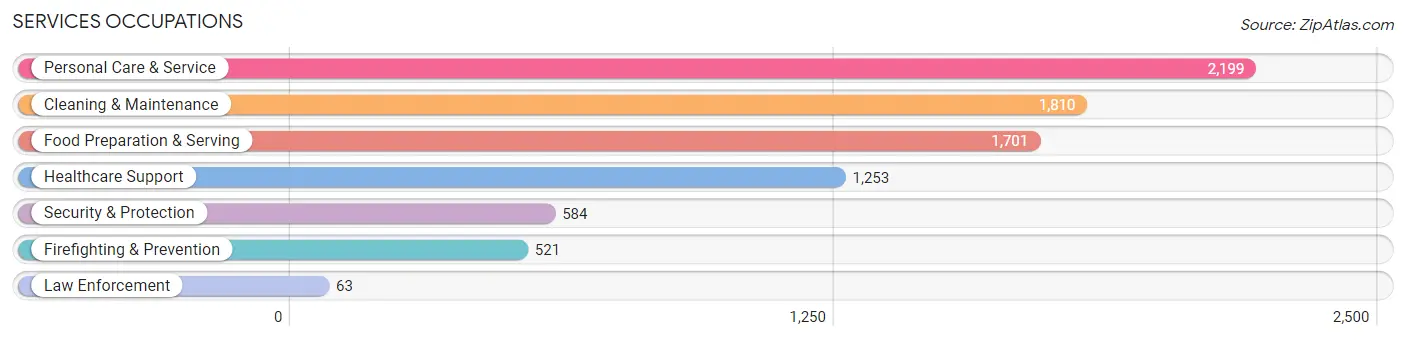
Services Occupations
The most common Services occupations in Silver Spring are Personal Care & Service (2,199 | 4.5%), Cleaning & Maintenance (1,810 | 3.7%), Food Preparation & Serving (1,701 | 3.5%), Healthcare Support (1,253 | 2.6%), and Security & Protection (584 | 1.2%).
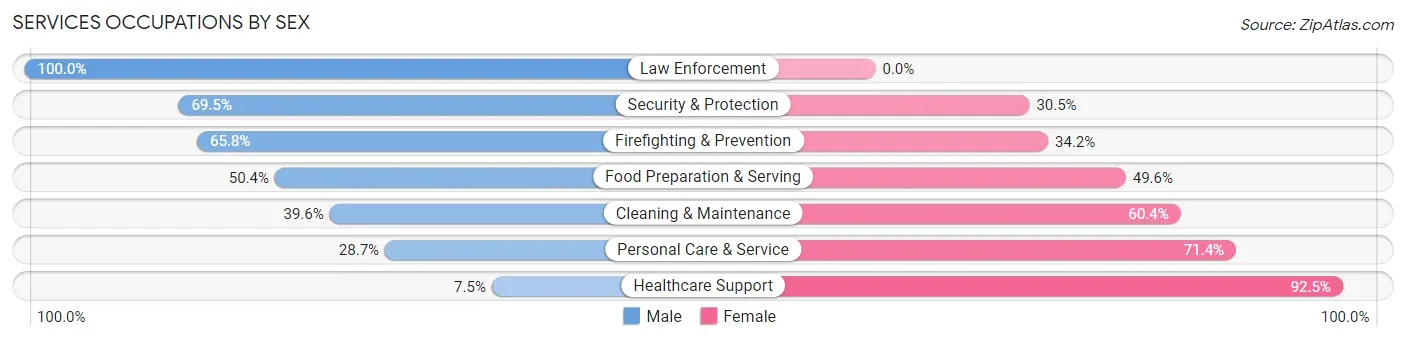
Services Occupations by Sex
Within the Services occupations in Silver Spring, the most male-oriented occupations are Law Enforcement (100.0%), Security & Protection (69.5%), and Firefighting & Prevention (65.8%), while the most female-oriented occupations are Healthcare Support (92.5%), Personal Care & Service (71.4%), and Cleaning & Maintenance (60.4%).
| Occupation | Male | Female |
| Healthcare Support | 94 (7.5%) | 1,159 (92.5%) |
| Security & Protection | 406 (69.5%) | 178 (30.5%) |
| Firefighting & Prevention | 343 (65.8%) | 178 (34.2%) |
| Law Enforcement | 63 (100.0%) | 0 (0.0%) |
| Food Preparation & Serving | 858 (50.4%) | 843 (49.6%) |
| Cleaning & Maintenance | 717 (39.6%) | 1,093 (60.4%) |
| Personal Care & Service | 630 (28.6%) | 1,569 (71.4%) |
| Total (Category) | 2,705 (35.8%) | 4,842 (64.2%) |
| Total (Overall) | 24,921 (51.2%) | 23,702 (48.7%) |
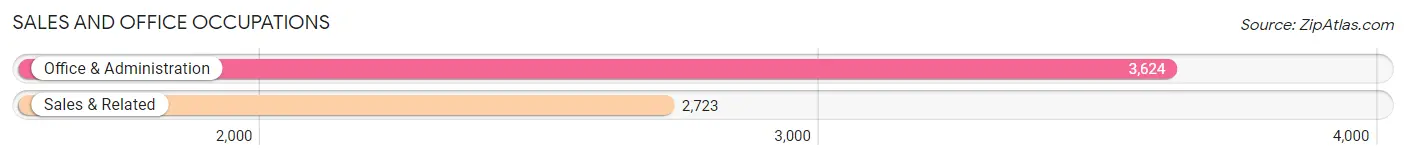
Sales and Office Occupations
The most common Sales and Office occupations in Silver Spring are Office & Administration (3,624 | 7.4%), and Sales & Related (2,723 | 5.6%).
Sales and Office Occupations by Sex
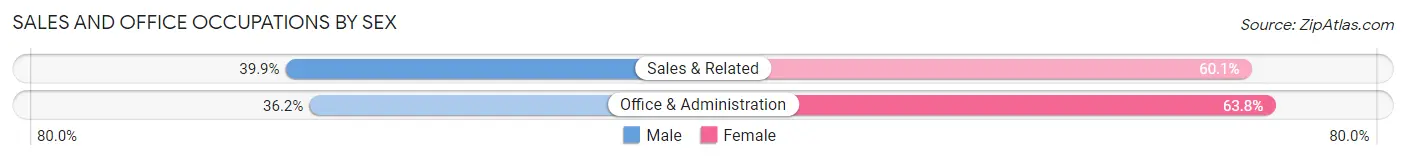
| Occupation | Male | Female |
| Sales & Related | 1,086 (39.9%) | 1,637 (60.1%) |
| Office & Administration | 1,313 (36.2%) | 2,311 (63.8%) |
| Total (Category) | 2,399 (37.8%) | 3,948 (62.2%) |
| Total (Overall) | 24,921 (51.2%) | 23,702 (48.7%) |
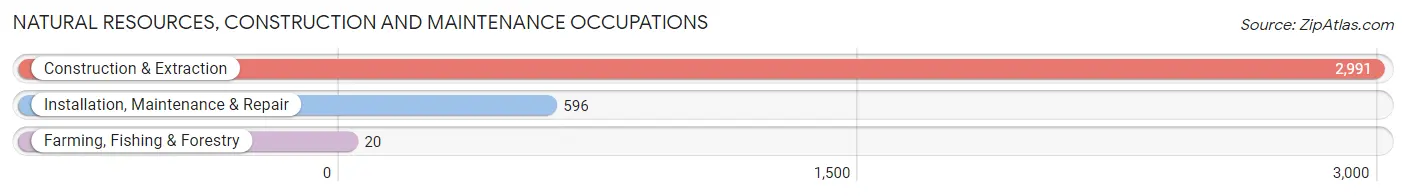
Natural Resources, Construction and Maintenance Occupations
The most common Natural Resources, Construction and Maintenance occupations in Silver Spring are Construction & Extraction (2,991 | 6.1%), Installation, Maintenance & Repair (596 | 1.2%), and Farming, Fishing & Forestry (20 | 0.0%).
Natural Resources, Construction and Maintenance Occupations by Sex
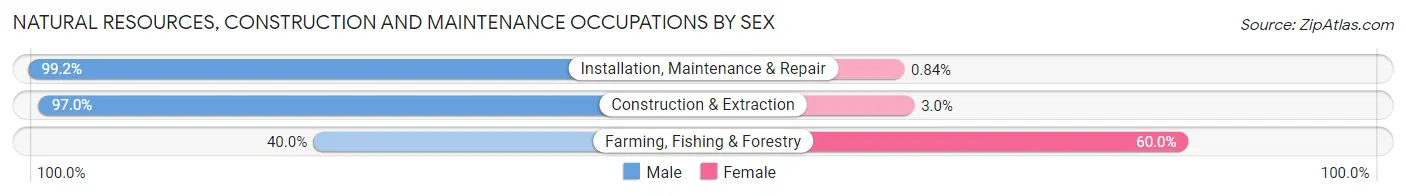
| Occupation | Male | Female |
| Farming, Fishing & Forestry | 8 (40.0%) | 12 (60.0%) |
| Construction & Extraction | 2,902 (97.0%) | 89 (3.0%) |
| Installation, Maintenance & Repair | 591 (99.2%) | 5 (0.8%) |
| Total (Category) | 3,501 (97.1%) | 106 (2.9%) |
| Total (Overall) | 24,921 (51.2%) | 23,702 (48.7%) |
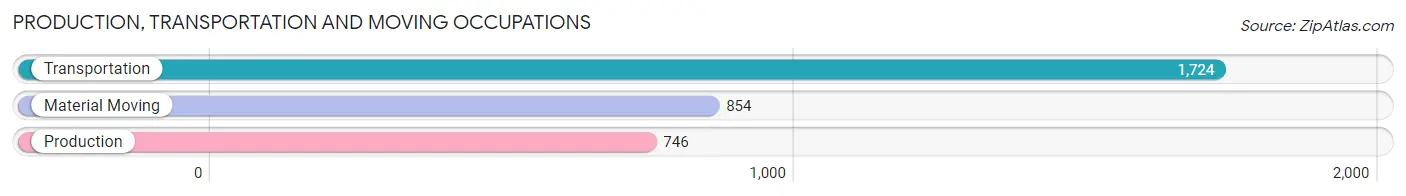
Production, Transportation and Moving Occupations
The most common Production, Transportation and Moving occupations in Silver Spring are Transportation (1,724 | 3.5%), Material Moving (854 | 1.8%), and Production (746 | 1.5%).
Production, Transportation and Moving Occupations by Sex
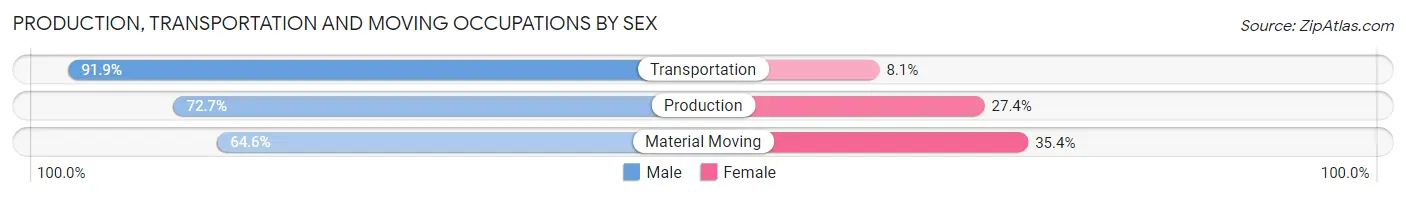
| Occupation | Male | Female |
| Production | 542 (72.7%) | 204 (27.4%) |
| Transportation | 1,585 (91.9%) | 139 (8.1%) |
| Material Moving | 552 (64.6%) | 302 (35.4%) |
| Total (Category) | 2,679 (80.6%) | 645 (19.4%) |
| Total (Overall) | 24,921 (51.2%) | 23,702 (48.7%) |
Employment Industries by Sex in Silver Spring
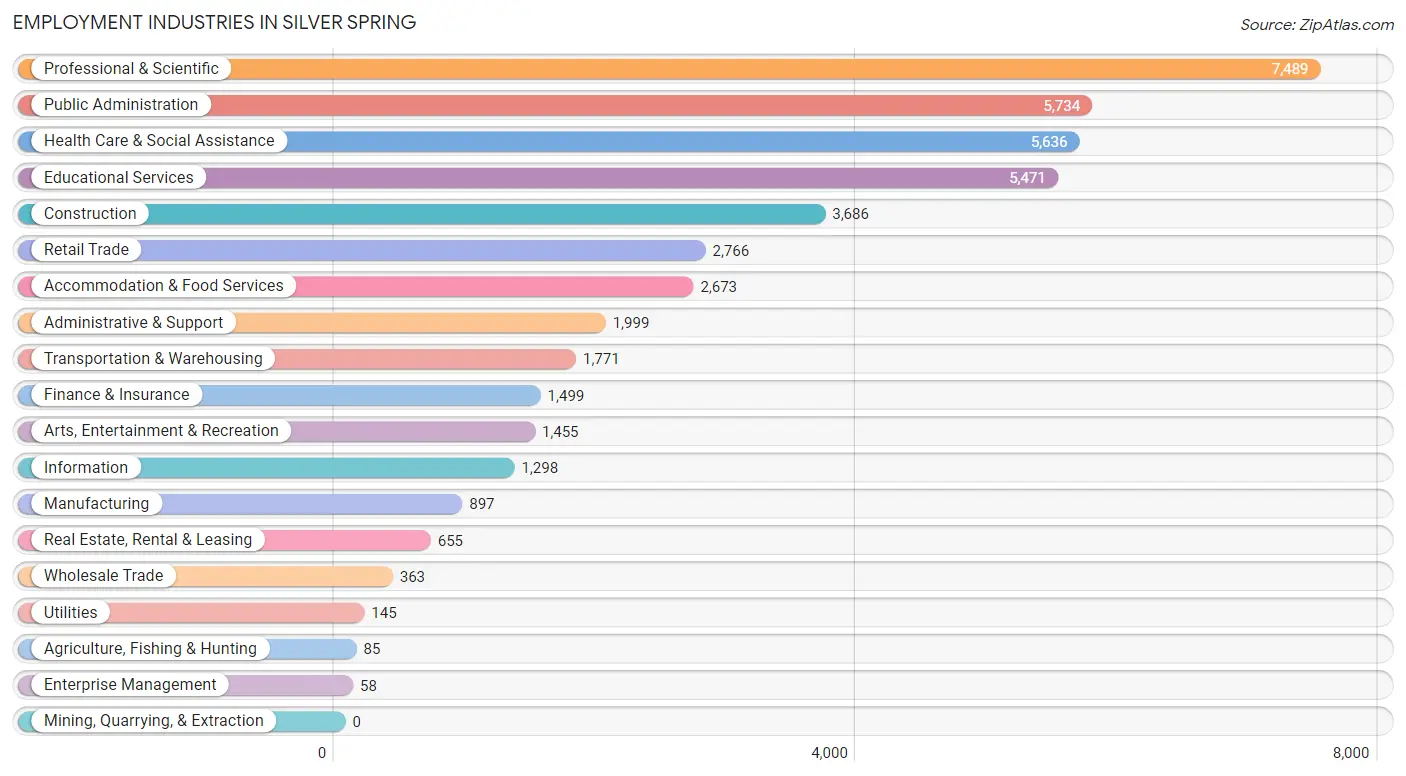
Employment Industries in Silver Spring
The major employment industries in Silver Spring include Professional & Scientific (7,489 | 15.4%), Public Administration (5,734 | 11.8%), Health Care & Social Assistance (5,636 | 11.6%), Educational Services (5,471 | 11.3%), and Construction (3,686 | 7.6%).
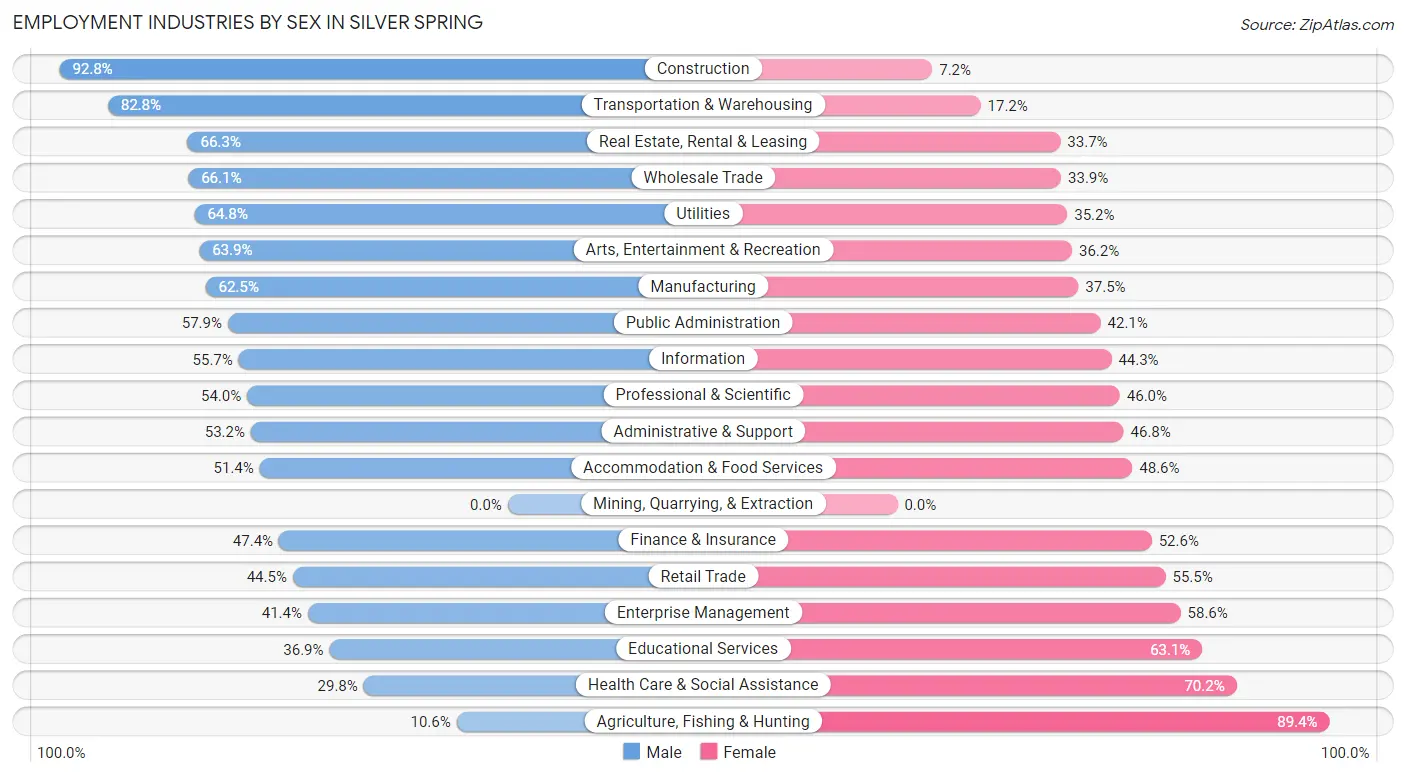
Employment Industries by Sex in Silver Spring
The Silver Spring industries that see more men than women are Construction (92.8%), Transportation & Warehousing (82.8%), and Real Estate, Rental & Leasing (66.3%), whereas the industries that tend to have a higher number of women are Agriculture, Fishing & Hunting (89.4%), Health Care & Social Assistance (70.2%), and Educational Services (63.1%).
| Industry | Male | Female |
| Agriculture, Fishing & Hunting | 9 (10.6%) | 76 (89.4%) |
| Mining, Quarrying, & Extraction | 0 (0.0%) | 0 (0.0%) |
| Construction | 3,420 (92.8%) | 266 (7.2%) |
| Manufacturing | 561 (62.5%) | 336 (37.5%) |
| Wholesale Trade | 240 (66.1%) | 123 (33.9%) |
| Retail Trade | 1,231 (44.5%) | 1,535 (55.5%) |
| Transportation & Warehousing | 1,466 (82.8%) | 305 (17.2%) |
| Utilities | 94 (64.8%) | 51 (35.2%) |
| Information | 723 (55.7%) | 575 (44.3%) |
| Finance & Insurance | 710 (47.4%) | 789 (52.6%) |
| Real Estate, Rental & Leasing | 434 (66.3%) | 221 (33.7%) |
| Professional & Scientific | 4,041 (54.0%) | 3,448 (46.0%) |
| Enterprise Management | 24 (41.4%) | 34 (58.6%) |
| Administrative & Support | 1,063 (53.2%) | 936 (46.8%) |
| Educational Services | 2,020 (36.9%) | 3,451 (63.1%) |
| Health Care & Social Assistance | 1,681 (29.8%) | 3,955 (70.2%) |
| Arts, Entertainment & Recreation | 929 (63.8%) | 526 (36.1%) |
| Accommodation & Food Services | 1,373 (51.4%) | 1,300 (48.6%) |
| Public Administration | 3,322 (57.9%) | 2,412 (42.1%) |
| Total | 24,921 (51.2%) | 23,702 (48.7%) |
Education in Silver Spring
School Enrollment in Silver Spring
The most common levels of schooling among the 19,548 students in Silver Spring are elementary school (4,434 | 22.7%), middle school (3,610 | 18.5%), and high school (3,286 | 16.8%).
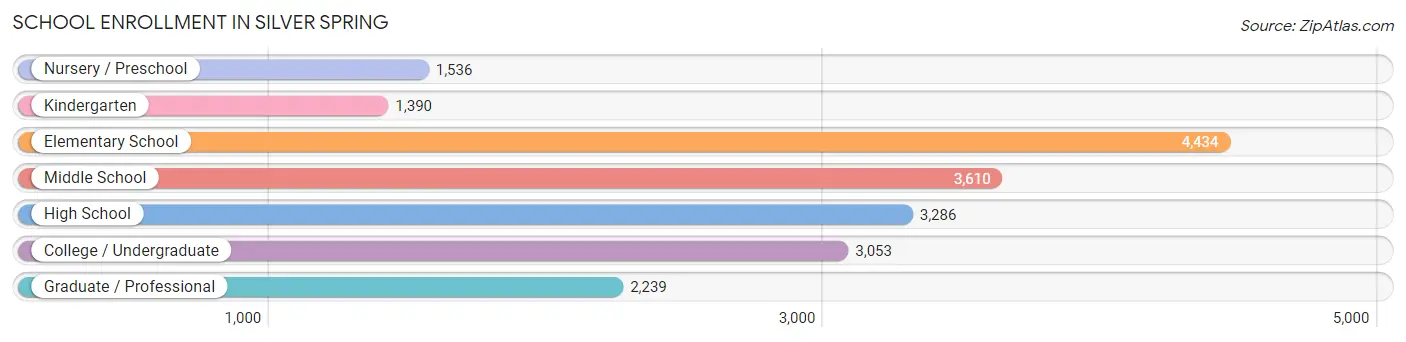
| School Level | # Students | % Students |
| Nursery / Preschool | 1,536 | 7.9% |
| Kindergarten | 1,390 | 7.1% |
| Elementary School | 4,434 | 22.7% |
| Middle School | 3,610 | 18.5% |
| High School | 3,286 | 16.8% |
| College / Undergraduate | 3,053 | 15.6% |
| Graduate / Professional | 2,239 | 11.5% |
| Total | 19,548 | 100.0% |
School Enrollment by Age by Funding Source in Silver Spring
Out of a total of 19,548 students who are enrolled in schools in Silver Spring, 3,538 (18.1%) attend a private institution, while the remaining 16,010 (81.9%) are enrolled in public schools. The age group of 35 years and over has the highest likelihood of being enrolled in private schools, with 533 (48.4% in the age bracket) enrolled. Conversely, the age group of 10 to 14 year olds has the lowest likelihood of being enrolled in a private school, with 4,061 (91.8% in the age bracket) attending a public institution.
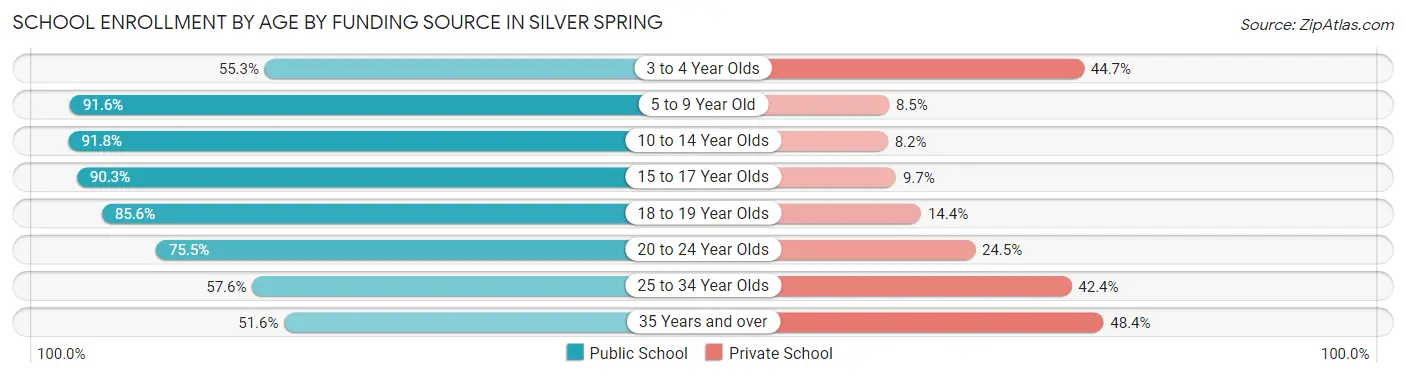
| Age Bracket | Public School | Private School |
| 3 to 4 Year Olds | 615 (55.3%) | 498 (44.7%) |
| 5 to 9 Year Old | 5,431 (91.5%) | 501 (8.5%) |
| 10 to 14 Year Olds | 4,061 (91.8%) | 363 (8.2%) |
| 15 to 17 Year Olds | 2,150 (90.3%) | 232 (9.7%) |
| 18 to 19 Year Olds | 618 (85.6%) | 104 (14.4%) |
| 20 to 24 Year Olds | 1,438 (75.5%) | 466 (24.5%) |
| 25 to 34 Year Olds | 1,134 (57.6%) | 835 (42.4%) |
| 35 Years and over | 569 (51.6%) | 533 (48.4%) |
| Total | 16,010 (81.9%) | 3,538 (18.1%) |
Educational Attainment by Field of Study in Silver Spring
Social sciences (7,200 | 19.0%), business (4,094 | 10.8%), literature & languages (3,307 | 8.7%), bio, nature & agricultural (2,769 | 7.3%), and engineering (2,619 | 6.9%) are the most common fields of study among 37,832 individuals in Silver Spring who have obtained a bachelor's degree or higher.
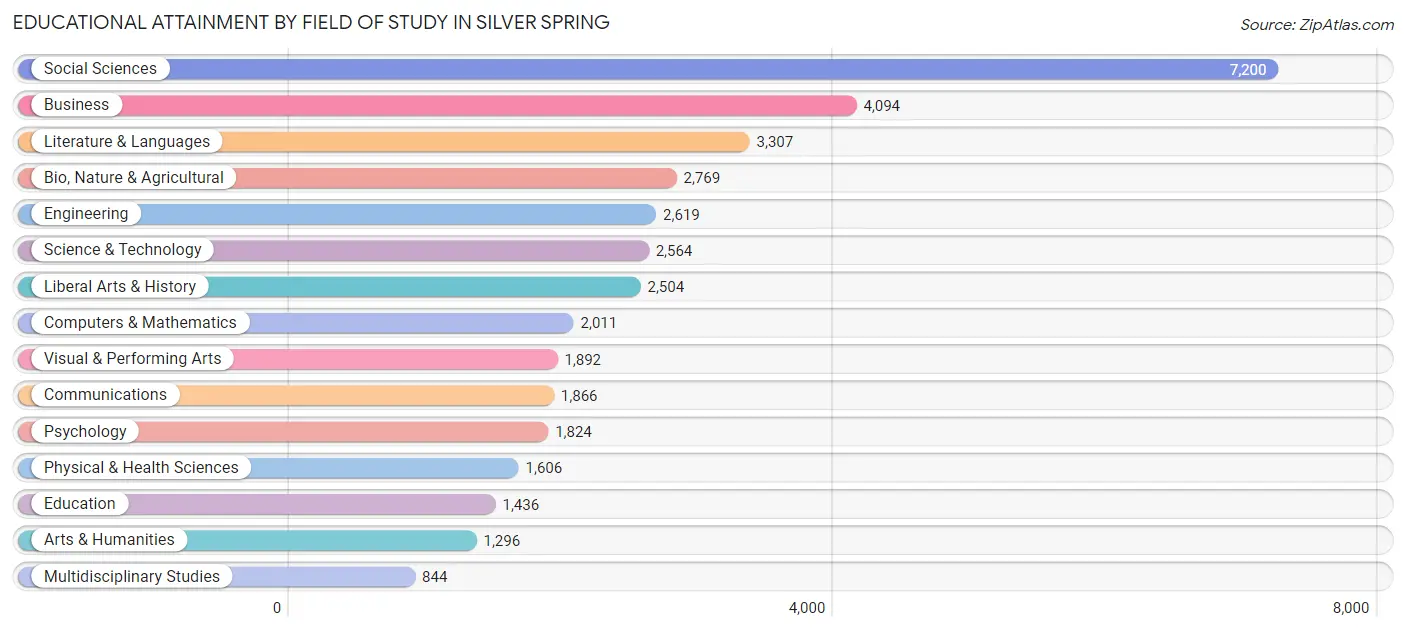
| Field of Study | # Graduates | % Graduates |
| Computers & Mathematics | 2,011 | 5.3% |
| Bio, Nature & Agricultural | 2,769 | 7.3% |
| Physical & Health Sciences | 1,606 | 4.3% |
| Psychology | 1,824 | 4.8% |
| Social Sciences | 7,200 | 19.0% |
| Engineering | 2,619 | 6.9% |
| Multidisciplinary Studies | 844 | 2.2% |
| Science & Technology | 2,564 | 6.8% |
| Business | 4,094 | 10.8% |
| Education | 1,436 | 3.8% |
| Literature & Languages | 3,307 | 8.7% |
| Liberal Arts & History | 2,504 | 6.6% |
| Visual & Performing Arts | 1,892 | 5.0% |
| Communications | 1,866 | 4.9% |
| Arts & Humanities | 1,296 | 3.4% |
| Total | 37,832 | 100.0% |
Transportation & Commute in Silver Spring
Vehicle Availability by Sex in Silver Spring
The most prevalent vehicle ownership categories in Silver Spring are males with 2 vehicles (9,254, accounting for 38.0%) and females with 2 vehicles (7,703, making up 40.1%).
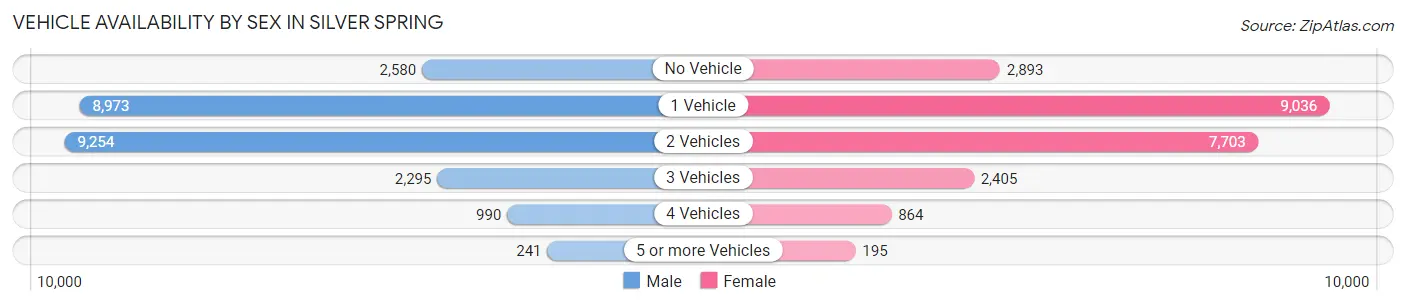
| Vehicles Available | Male | Female |
| No Vehicle | 2,580 (10.6%) | 2,893 (12.5%) |
| 1 Vehicle | 8,973 (36.9%) | 9,036 (39.1%) |
| 2 Vehicles | 9,254 (38.0%) | 7,703 (33.4%) |
| 3 Vehicles | 2,295 (9.4%) | 2,405 (10.4%) |
| 4 Vehicles | 990 (4.1%) | 864 (3.7%) |
| 5 or more Vehicles | 241 (1.0%) | 195 (0.8%) |
| Total | 24,333 (100.0%) | 23,096 (100.0%) |
Commute Time in Silver Spring
The most frequently occuring commute durations in Silver Spring are 30 to 34 minutes (7,639 commuters, 20.1%), 45 to 59 minutes (5,805 commuters, 15.2%), and 20 to 24 minutes (4,032 commuters, 10.6%).
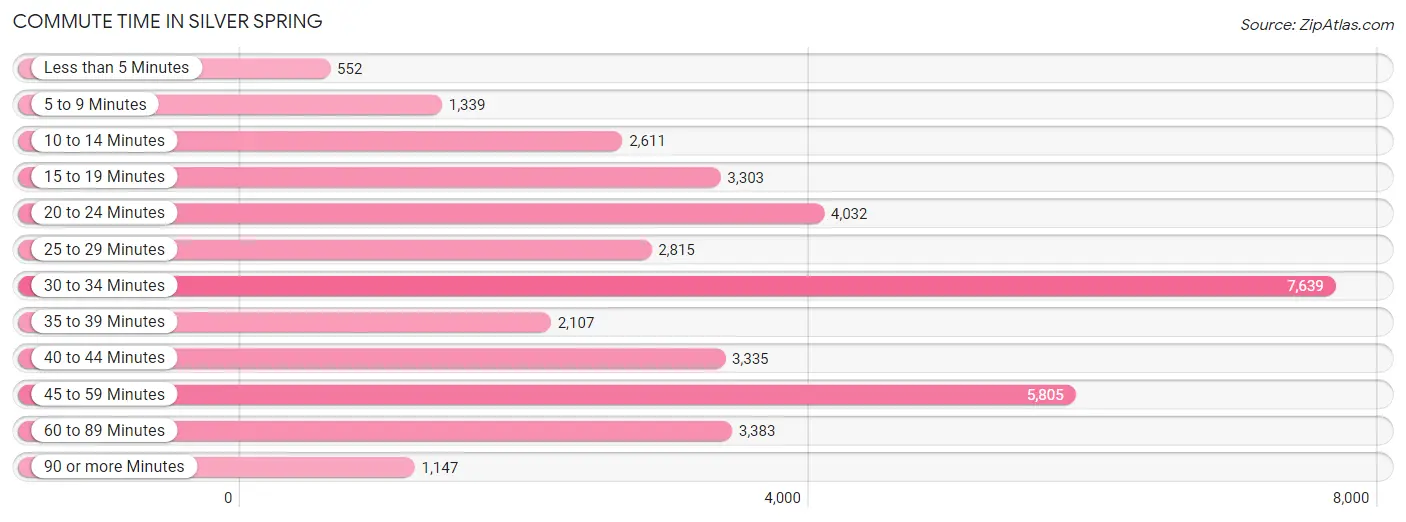
| Commute Time | # Commuters | % Commuters |
| Less than 5 Minutes | 552 | 1.5% |
| 5 to 9 Minutes | 1,339 | 3.5% |
| 10 to 14 Minutes | 2,611 | 6.9% |
| 15 to 19 Minutes | 3,303 | 8.7% |
| 20 to 24 Minutes | 4,032 | 10.6% |
| 25 to 29 Minutes | 2,815 | 7.4% |
| 30 to 34 Minutes | 7,639 | 20.1% |
| 35 to 39 Minutes | 2,107 | 5.5% |
| 40 to 44 Minutes | 3,335 | 8.8% |
| 45 to 59 Minutes | 5,805 | 15.2% |
| 60 to 89 Minutes | 3,383 | 8.9% |
| 90 or more Minutes | 1,147 | 3.0% |
Commute Time by Sex in Silver Spring
The most common commute times in Silver Spring are 30 to 34 minutes (4,511 commuters, 22.3%) for males and 30 to 34 minutes (3,128 commuters, 17.5%) for females.
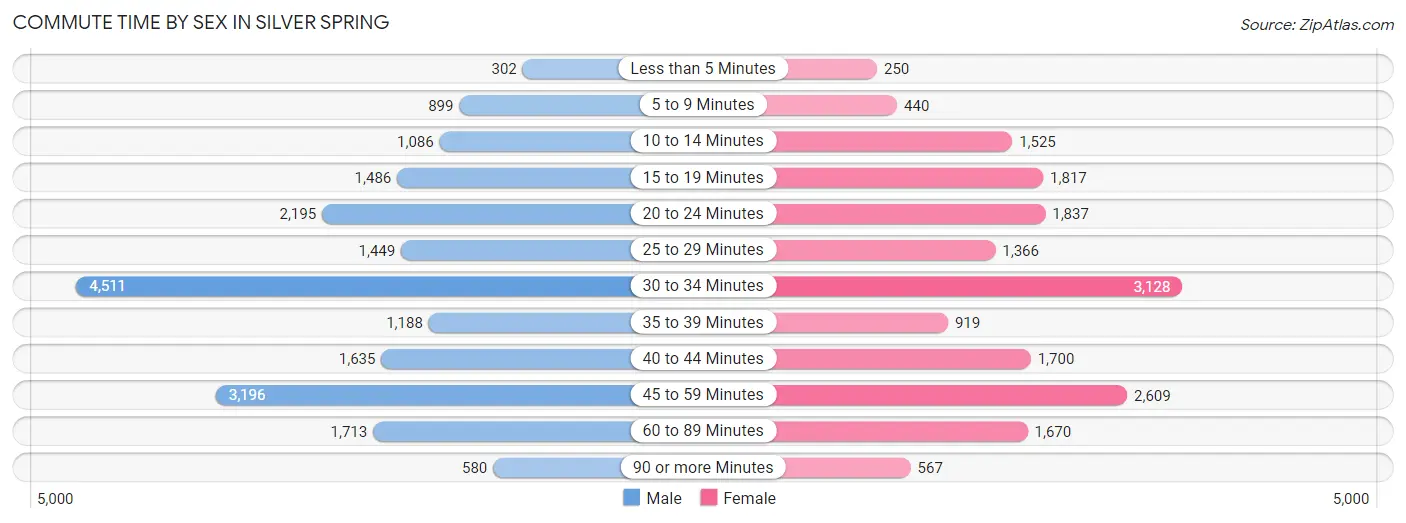
| Commute Time | Male | Female |
| Less than 5 Minutes | 302 (1.5%) | 250 (1.4%) |
| 5 to 9 Minutes | 899 (4.4%) | 440 (2.5%) |
| 10 to 14 Minutes | 1,086 (5.4%) | 1,525 (8.6%) |
| 15 to 19 Minutes | 1,486 (7.3%) | 1,817 (10.2%) |
| 20 to 24 Minutes | 2,195 (10.8%) | 1,837 (10.3%) |
| 25 to 29 Minutes | 1,449 (7.2%) | 1,366 (7.7%) |
| 30 to 34 Minutes | 4,511 (22.3%) | 3,128 (17.5%) |
| 35 to 39 Minutes | 1,188 (5.9%) | 919 (5.1%) |
| 40 to 44 Minutes | 1,635 (8.1%) | 1,700 (9.5%) |
| 45 to 59 Minutes | 3,196 (15.8%) | 2,609 (14.6%) |
| 60 to 89 Minutes | 1,713 (8.5%) | 1,670 (9.4%) |
| 90 or more Minutes | 580 (2.9%) | 567 (3.2%) |
Time of Departure to Work by Sex in Silver Spring
The most frequent times of departure to work in Silver Spring are 8:00 AM to 8:29 AM (3,282, 16.2%) for males and 8:00 AM to 8:29 AM (2,649, 14.9%) for females.
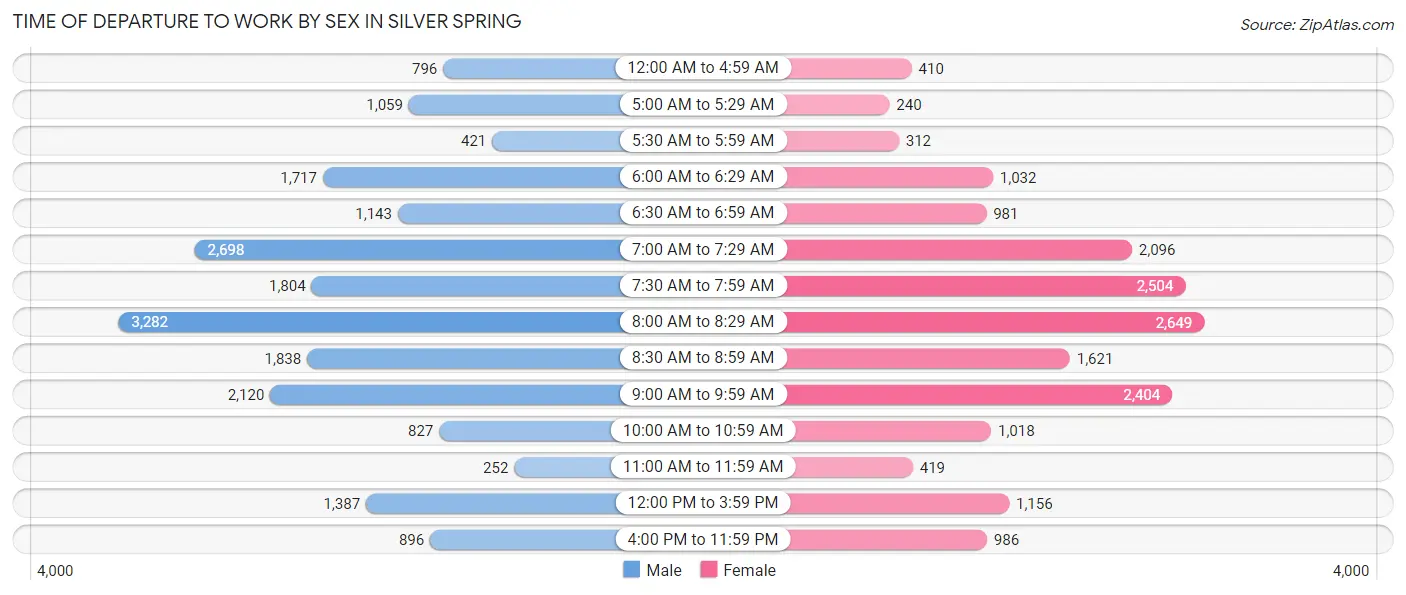
| Time of Departure | Male | Female |
| 12:00 AM to 4:59 AM | 796 (3.9%) | 410 (2.3%) |
| 5:00 AM to 5:29 AM | 1,059 (5.2%) | 240 (1.3%) |
| 5:30 AM to 5:59 AM | 421 (2.1%) | 312 (1.8%) |
| 6:00 AM to 6:29 AM | 1,717 (8.5%) | 1,032 (5.8%) |
| 6:30 AM to 6:59 AM | 1,143 (5.7%) | 981 (5.5%) |
| 7:00 AM to 7:29 AM | 2,698 (13.3%) | 2,096 (11.8%) |
| 7:30 AM to 7:59 AM | 1,804 (8.9%) | 2,504 (14.1%) |
| 8:00 AM to 8:29 AM | 3,282 (16.2%) | 2,649 (14.9%) |
| 8:30 AM to 8:59 AM | 1,838 (9.1%) | 1,621 (9.1%) |
| 9:00 AM to 9:59 AM | 2,120 (10.5%) | 2,404 (13.5%) |
| 10:00 AM to 10:59 AM | 827 (4.1%) | 1,018 (5.7%) |
| 11:00 AM to 11:59 AM | 252 (1.3%) | 419 (2.4%) |
| 12:00 PM to 3:59 PM | 1,387 (6.9%) | 1,156 (6.5%) |
| 4:00 PM to 11:59 PM | 896 (4.4%) | 986 (5.5%) |
| Total | 20,240 (100.0%) | 17,828 (100.0%) |
Housing Occupancy in Silver Spring
Occupancy by Ownership in Silver Spring
Of the total 33,884 dwellings in Silver Spring, owner-occupied units account for 12,787 (37.7%), while renter-occupied units make up 21,097 (62.3%).
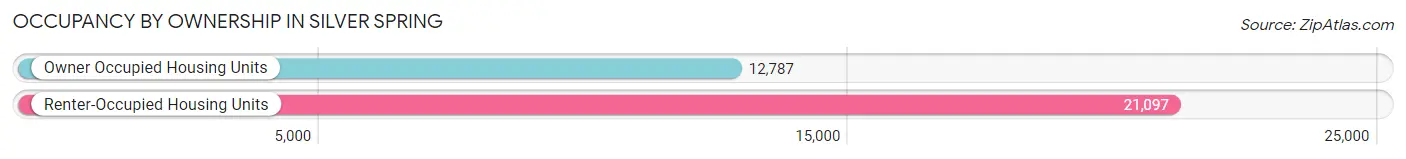
| Occupancy | # Housing Units | % Housing Units |
| Owner Occupied Housing Units | 12,787 | 37.7% |
| Renter-Occupied Housing Units | 21,097 | 62.3% |
| Total Occupied Housing Units | 33,884 | 100.0% |
Occupancy by Household Size in Silver Spring
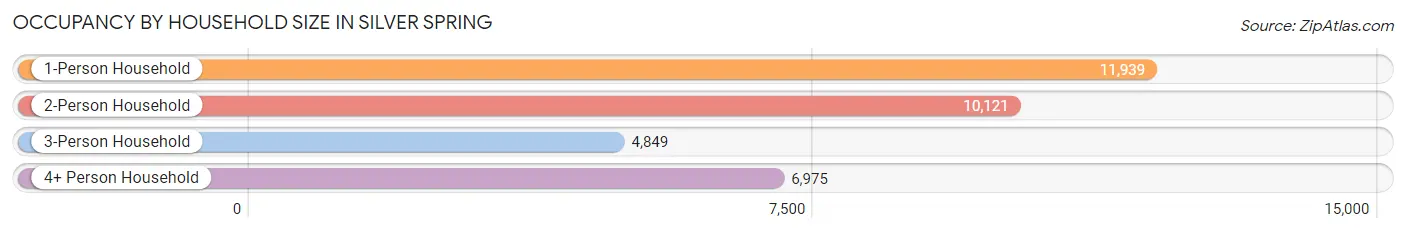
| Household Size | # Housing Units | % Housing Units |
| 1-Person Household | 11,939 | 35.2% |
| 2-Person Household | 10,121 | 29.9% |
| 3-Person Household | 4,849 | 14.3% |
| 4+ Person Household | 6,975 | 20.6% |
| Total Housing Units | 33,884 | 100.0% |
Occupancy by Ownership by Household Size in Silver Spring
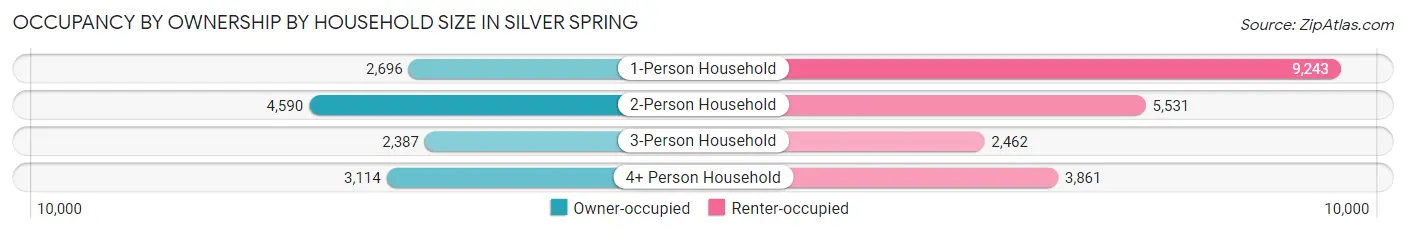
| Household Size | Owner-occupied | Renter-occupied |
| 1-Person Household | 2,696 (22.6%) | 9,243 (77.4%) |
| 2-Person Household | 4,590 (45.4%) | 5,531 (54.6%) |
| 3-Person Household | 2,387 (49.2%) | 2,462 (50.8%) |
| 4+ Person Household | 3,114 (44.7%) | 3,861 (55.3%) |
| Total Housing Units | 12,787 (37.7%) | 21,097 (62.3%) |
Occupancy by Educational Attainment in Silver Spring
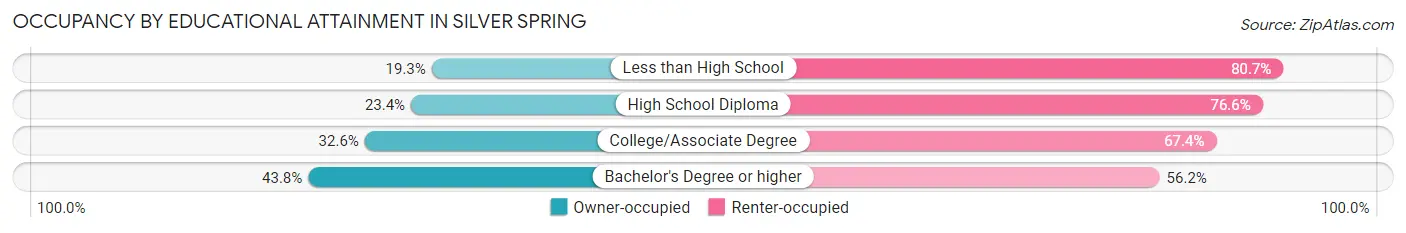
| Household Size | Owner-occupied | Renter-occupied |
| Less than High School | 610 (19.3%) | 2,549 (80.7%) |
| High School Diploma | 838 (23.4%) | 2,743 (76.6%) |
| College/Associate Degree | 1,590 (32.6%) | 3,290 (67.4%) |
| Bachelor's Degree or higher | 9,749 (43.8%) | 12,515 (56.2%) |
Occupancy by Age of Householder in Silver Spring
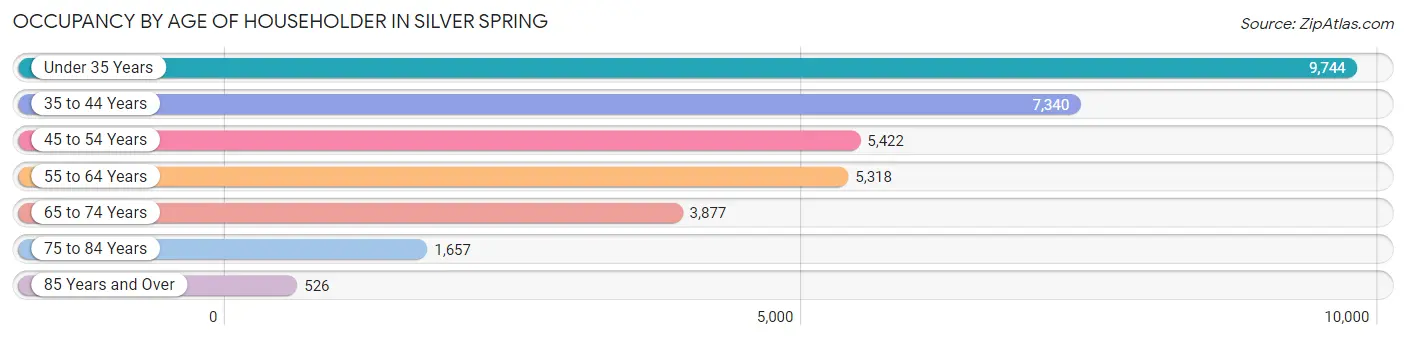
| Age Bracket | # Households | % Households |
| Under 35 Years | 9,744 | 28.8% |
| 35 to 44 Years | 7,340 | 21.7% |
| 45 to 54 Years | 5,422 | 16.0% |
| 55 to 64 Years | 5,318 | 15.7% |
| 65 to 74 Years | 3,877 | 11.4% |
| 75 to 84 Years | 1,657 | 4.9% |
| 85 Years and Over | 526 | 1.5% |
| Total | 33,884 | 100.0% |
Housing Finances in Silver Spring
Median Income by Occupancy in Silver Spring
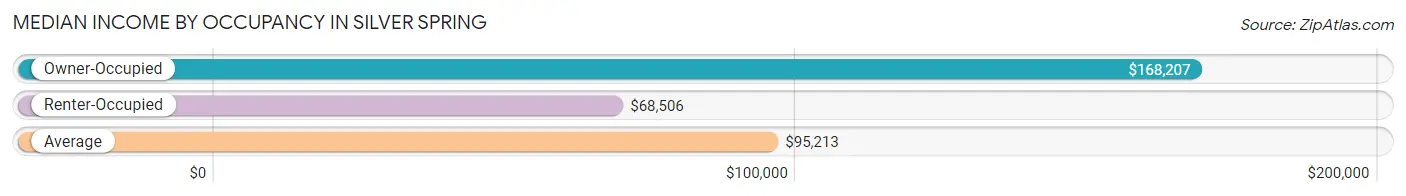
| Occupancy Type | # Households | Median Income |
| Owner-Occupied | 12,787 (37.7%) | $168,207 |
| Renter-Occupied | 21,097 (62.3%) | $68,506 |
| Average | 33,884 (100.0%) | $95,213 |
Occupancy by Householder Income Bracket in Silver Spring
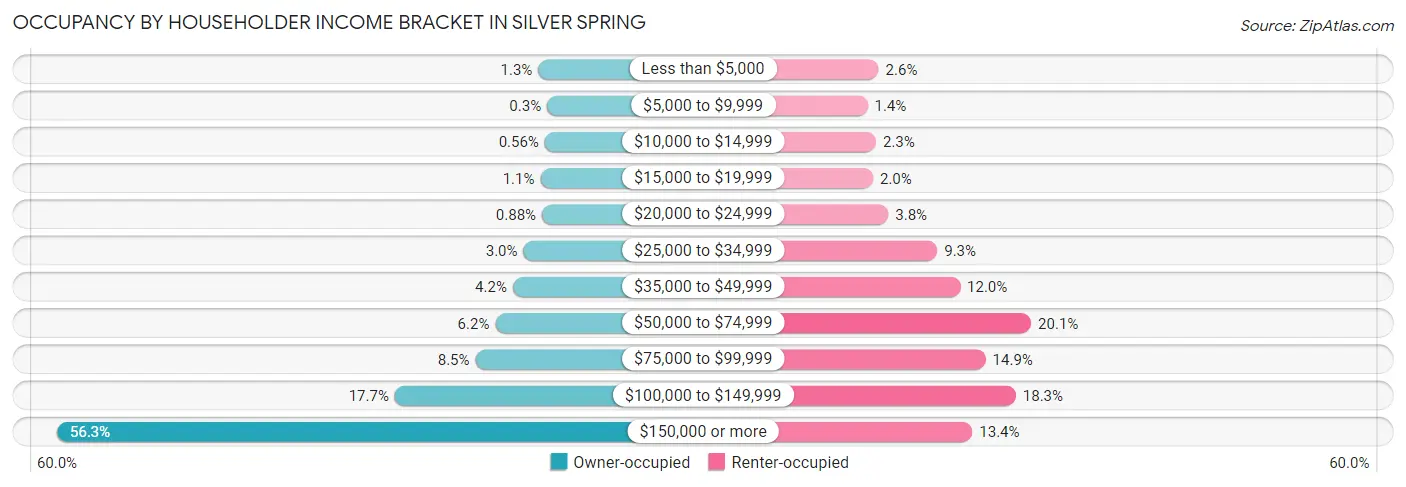
| Income Bracket | Owner-occupied | Renter-occupied |
| Less than $5,000 | 167 (1.3%) | 557 (2.6%) |
| $5,000 to $9,999 | 39 (0.3%) | 290 (1.4%) |
| $10,000 to $14,999 | 71 (0.6%) | 493 (2.3%) |
| $15,000 to $19,999 | 135 (1.1%) | 422 (2.0%) |
| $20,000 to $24,999 | 113 (0.9%) | 792 (3.7%) |
| $25,000 to $34,999 | 383 (3.0%) | 1,970 (9.3%) |
| $35,000 to $49,999 | 538 (4.2%) | 2,521 (11.9%) |
| $50,000 to $74,999 | 794 (6.2%) | 4,234 (20.1%) |
| $75,000 to $99,999 | 1,084 (8.5%) | 3,138 (14.9%) |
| $100,000 to $149,999 | 2,263 (17.7%) | 3,864 (18.3%) |
| $150,000 or more | 7,200 (56.3%) | 2,816 (13.4%) |
| Total | 12,787 (100.0%) | 21,097 (100.0%) |
Monthly Housing Cost Tiers in Silver Spring
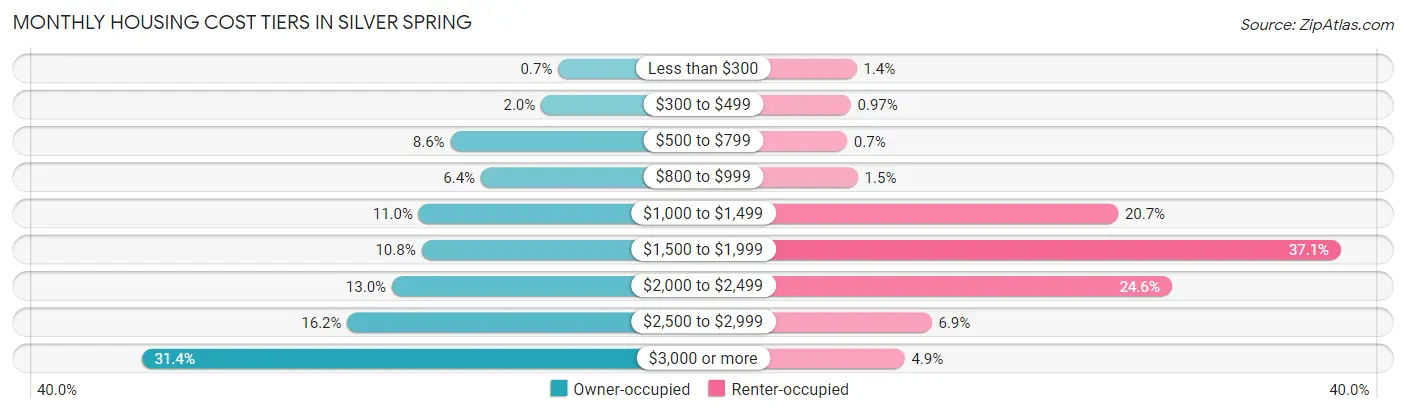
| Monthly Cost | Owner-occupied | Renter-occupied |
| Less than $300 | 89 (0.7%) | 295 (1.4%) |
| $300 to $499 | 251 (2.0%) | 205 (1.0%) |
| $500 to $799 | 1,105 (8.6%) | 147 (0.7%) |
| $800 to $999 | 817 (6.4%) | 314 (1.5%) |
| $1,000 to $1,499 | 1,403 (11.0%) | 4,359 (20.7%) |
| $1,500 to $1,999 | 1,377 (10.8%) | 7,823 (37.1%) |
| $2,000 to $2,499 | 1,656 (13.0%) | 5,195 (24.6%) |
| $2,500 to $2,999 | 2,075 (16.2%) | 1,461 (6.9%) |
| $3,000 or more | 4,014 (31.4%) | 1,043 (4.9%) |
| Total | 12,787 (100.0%) | 21,097 (100.0%) |
Physical Housing Characteristics in Silver Spring
Housing Structures in Silver Spring
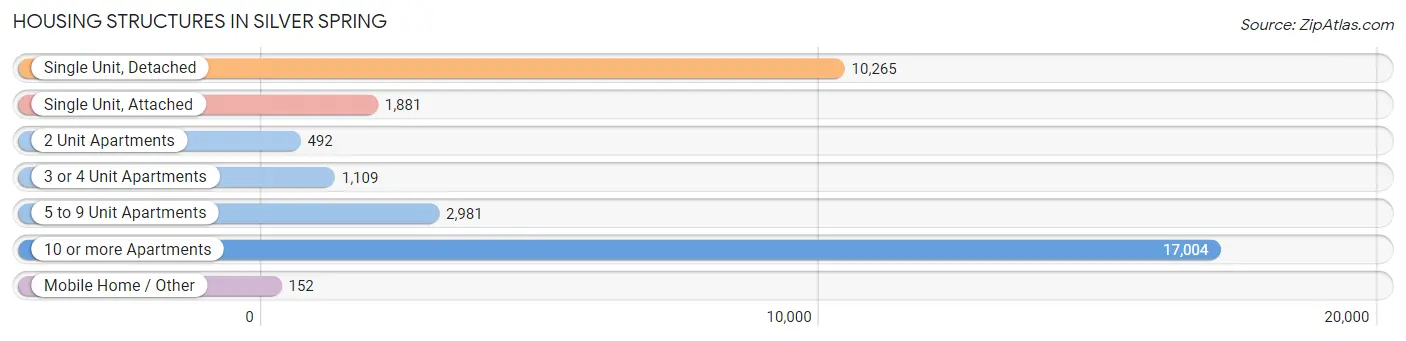
| Structure Type | # Housing Units | % Housing Units |
| Single Unit, Detached | 10,265 | 30.3% |
| Single Unit, Attached | 1,881 | 5.6% |
| 2 Unit Apartments | 492 | 1.5% |
| 3 or 4 Unit Apartments | 1,109 | 3.3% |
| 5 to 9 Unit Apartments | 2,981 | 8.8% |
| 10 or more Apartments | 17,004 | 50.2% |
| Mobile Home / Other | 152 | 0.4% |
| Total | 33,884 | 100.0% |
Housing Structures by Occupancy in Silver Spring
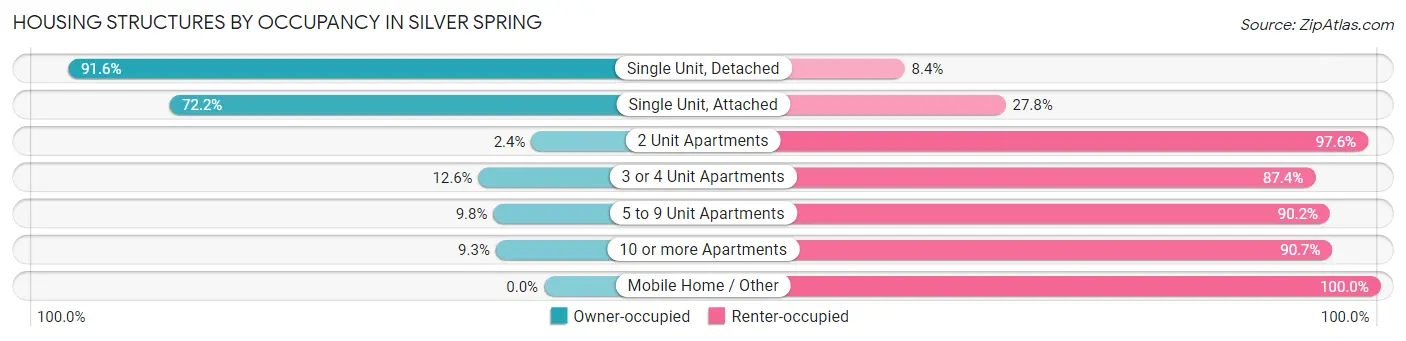
| Structure Type | Owner-occupied | Renter-occupied |
| Single Unit, Detached | 9,407 (91.6%) | 858 (8.4%) |
| Single Unit, Attached | 1,358 (72.2%) | 523 (27.8%) |
| 2 Unit Apartments | 12 (2.4%) | 480 (97.6%) |
| 3 or 4 Unit Apartments | 140 (12.6%) | 969 (87.4%) |
| 5 to 9 Unit Apartments | 291 (9.8%) | 2,690 (90.2%) |
| 10 or more Apartments | 1,579 (9.3%) | 15,425 (90.7%) |
| Mobile Home / Other | 0 (0.0%) | 152 (100.0%) |
| Total | 12,787 (37.7%) | 21,097 (62.3%) |
Housing Structures by Number of Rooms in Silver Spring
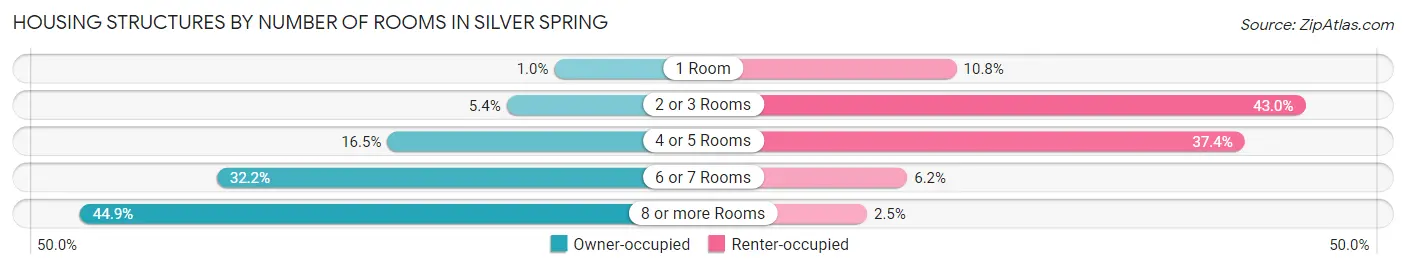
| Number of Rooms | Owner-occupied | Renter-occupied |
| 1 Room | 129 (1.0%) | 2,276 (10.8%) |
| 2 or 3 Rooms | 694 (5.4%) | 9,081 (43.0%) |
| 4 or 5 Rooms | 2,105 (16.5%) | 7,895 (37.4%) |
| 6 or 7 Rooms | 4,120 (32.2%) | 1,315 (6.2%) |
| 8 or more Rooms | 5,739 (44.9%) | 530 (2.5%) |
| Total | 12,787 (100.0%) | 21,097 (100.0%) |
Housing Structure by Heating Type in Silver Spring
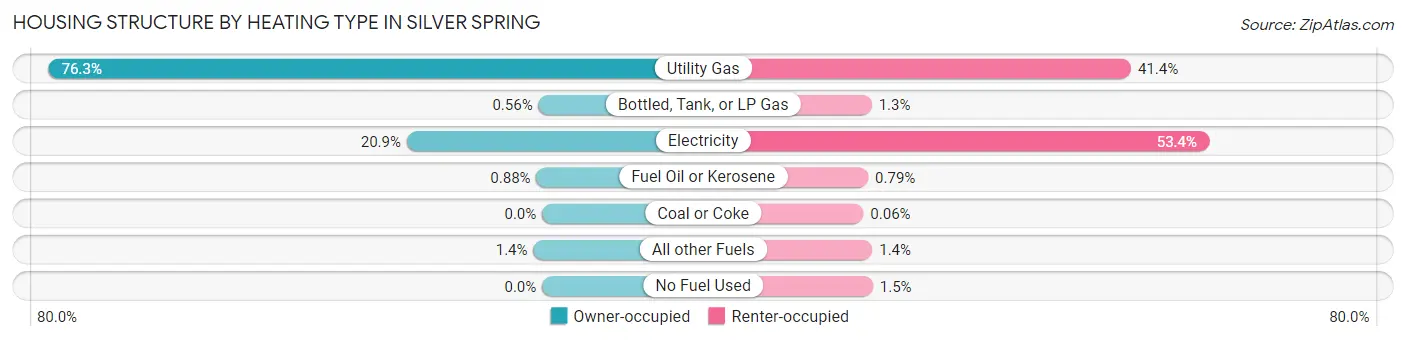
| Heating Type | Owner-occupied | Renter-occupied |
| Utility Gas | 9,755 (76.3%) | 8,741 (41.4%) |
| Bottled, Tank, or LP Gas | 71 (0.6%) | 282 (1.3%) |
| Electricity | 2,675 (20.9%) | 11,275 (53.4%) |
| Fuel Oil or Kerosene | 113 (0.9%) | 166 (0.8%) |
| Coal or Coke | 0 (0.0%) | 13 (0.1%) |
| All other Fuels | 173 (1.3%) | 301 (1.4%) |
| No Fuel Used | 0 (0.0%) | 319 (1.5%) |
| Total | 12,787 (100.0%) | 21,097 (100.0%) |
Household Vehicle Usage in Silver Spring
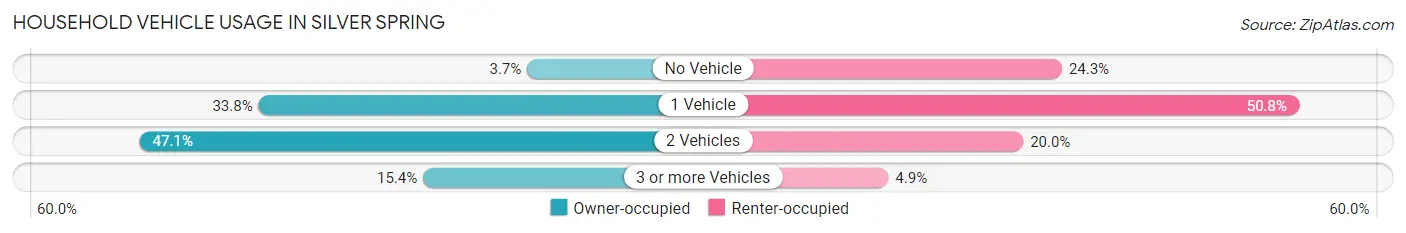
| Vehicles per Household | Owner-occupied | Renter-occupied |
| No Vehicle | 475 (3.7%) | 5,129 (24.3%) |
| 1 Vehicle | 4,322 (33.8%) | 10,726 (50.8%) |
| 2 Vehicles | 6,024 (47.1%) | 4,214 (20.0%) |
| 3 or more Vehicles | 1,966 (15.4%) | 1,028 (4.9%) |
| Total | 12,787 (100.0%) | 21,097 (100.0%) |
Real Estate & Mortgages in Silver Spring
Real Estate and Mortgage Overview in Silver Spring
| Characteristic | Without Mortgage | With Mortgage |
| Housing Units | 3,035 | 9,752 |
| Median Property Value | $571,400 | $617,000 |
| Median Household Income | $119,387 | $6,032 |
| Monthly Housing Costs | $832 | $4,014 |
| Real Estate Taxes | $4,864 | $115 |
Property Value by Mortgage Status in Silver Spring
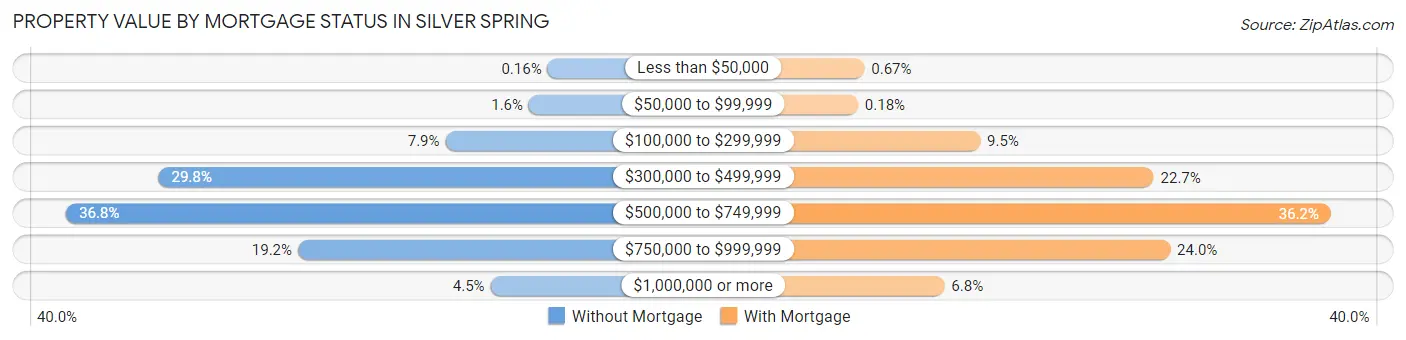
| Property Value | Without Mortgage | With Mortgage |
| Less than $50,000 | 5 (0.2%) | 65 (0.7%) |
| $50,000 to $99,999 | 48 (1.6%) | 18 (0.2%) |
| $100,000 to $299,999 | 241 (7.9%) | 925 (9.5%) |
| $300,000 to $499,999 | 904 (29.8%) | 2,215 (22.7%) |
| $500,000 to $749,999 | 1,118 (36.8%) | 3,531 (36.2%) |
| $750,000 to $999,999 | 582 (19.2%) | 2,338 (24.0%) |
| $1,000,000 or more | 137 (4.5%) | 660 (6.8%) |
| Total | 3,035 (100.0%) | 9,752 (100.0%) |
Household Income by Mortgage Status in Silver Spring
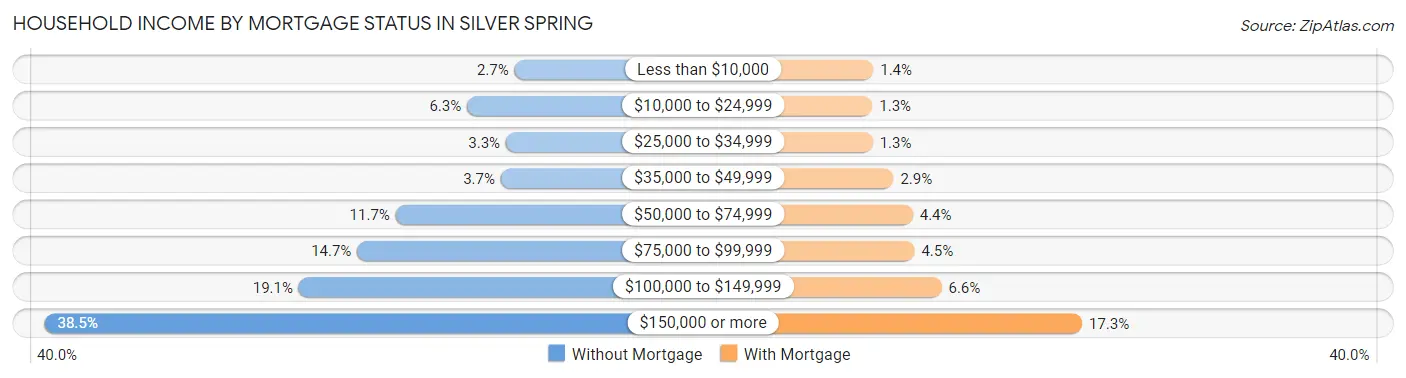
| Household Income | Without Mortgage | With Mortgage |
| Less than $10,000 | 81 (2.7%) | 132 (1.3%) |
| $10,000 to $24,999 | 191 (6.3%) | 125 (1.3%) |
| $25,000 to $34,999 | 101 (3.3%) | 128 (1.3%) |
| $35,000 to $49,999 | 113 (3.7%) | 282 (2.9%) |
| $50,000 to $74,999 | 356 (11.7%) | 425 (4.4%) |
| $75,000 to $99,999 | 445 (14.7%) | 438 (4.5%) |
| $100,000 to $149,999 | 580 (19.1%) | 639 (6.6%) |
| $150,000 or more | 1,168 (38.5%) | 1,683 (17.3%) |
| Total | 3,035 (100.0%) | 9,752 (100.0%) |
Property Value to Household Income Ratio in Silver Spring
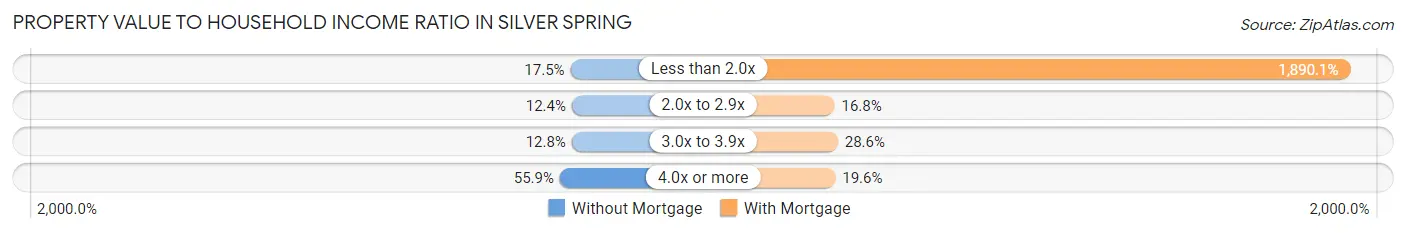
| Value-to-Income Ratio | Without Mortgage | With Mortgage |
| Less than 2.0x | 531 (17.5%) | 184,318 (1,890.1%) |
| 2.0x to 2.9x | 377 (12.4%) | 1,641 (16.8%) |
| 3.0x to 3.9x | 389 (12.8%) | 2,790 (28.6%) |
| 4.0x or more | 1,697 (55.9%) | 1,907 (19.6%) |
| Total | 3,035 (100.0%) | 9,752 (100.0%) |
Real Estate Taxes by Mortgage Status in Silver Spring
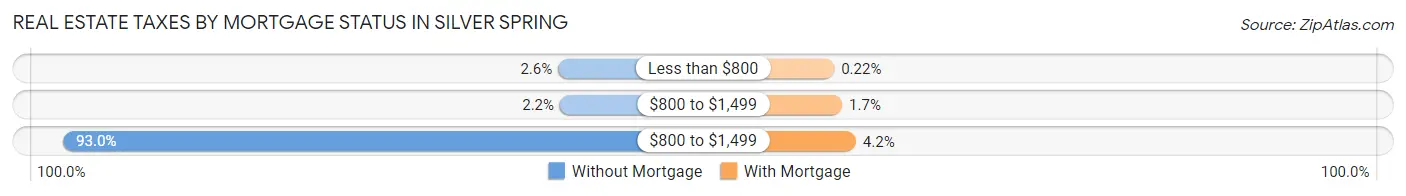
| Property Taxes | Without Mortgage | With Mortgage |
| Less than $800 | 78 (2.6%) | 21 (0.2%) |
| $800 to $1,499 | 68 (2.2%) | 162 (1.7%) |
| $800 to $1,499 | 2,821 (92.9%) | 408 (4.2%) |
| Total | 3,035 (100.0%) | 9,752 (100.0%) |
Health & Disability in Silver Spring
Health Insurance Coverage by Age in Silver Spring
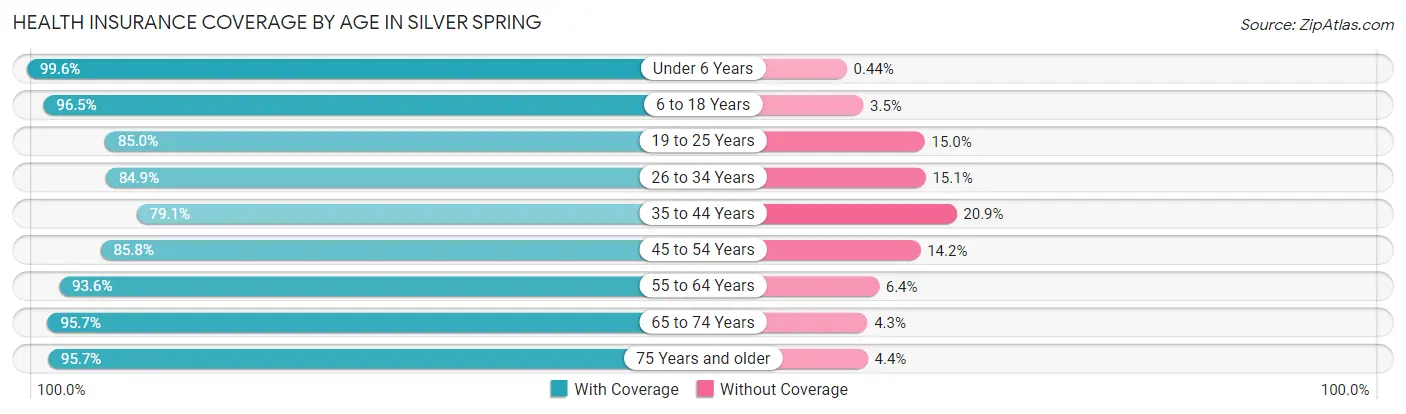
| Age Bracket | With Coverage | Without Coverage |
| Under 6 Years | 6,816 (99.6%) | 30 (0.4%) |
| 6 to 18 Years | 11,726 (96.5%) | 427 (3.5%) |
| 19 to 25 Years | 6,794 (85.0%) | 1,196 (15.0%) |
| 26 to 34 Years | 11,792 (84.9%) | 2,104 (15.1%) |
| 35 to 44 Years | 10,522 (79.1%) | 2,780 (20.9%) |
| 45 to 54 Years | 7,954 (85.8%) | 1,312 (14.2%) |
| 55 to 64 Years | 7,886 (93.6%) | 542 (6.4%) |
| 65 to 74 Years | 6,283 (95.7%) | 280 (4.3%) |
| 75 Years and older | 2,904 (95.7%) | 132 (4.3%) |
| Total | 72,677 (89.2%) | 8,803 (10.8%) |
Health Insurance Coverage by Citizenship Status in Silver Spring
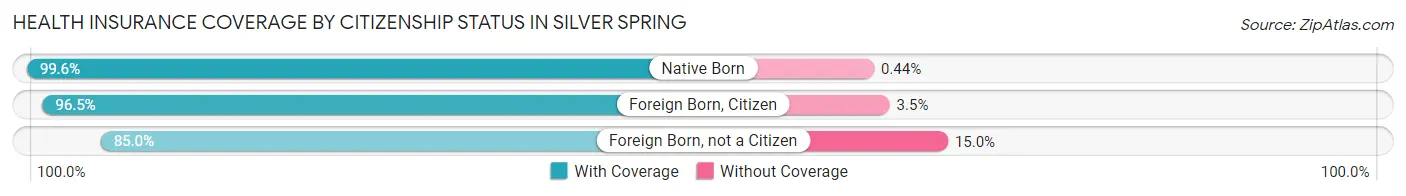
| Citizenship Status | With Coverage | Without Coverage |
| Native Born | 6,816 (99.6%) | 30 (0.4%) |
| Foreign Born, Citizen | 11,726 (96.5%) | 427 (3.5%) |
| Foreign Born, not a Citizen | 6,794 (85.0%) | 1,196 (15.0%) |
Health Insurance Coverage by Household Income in Silver Spring
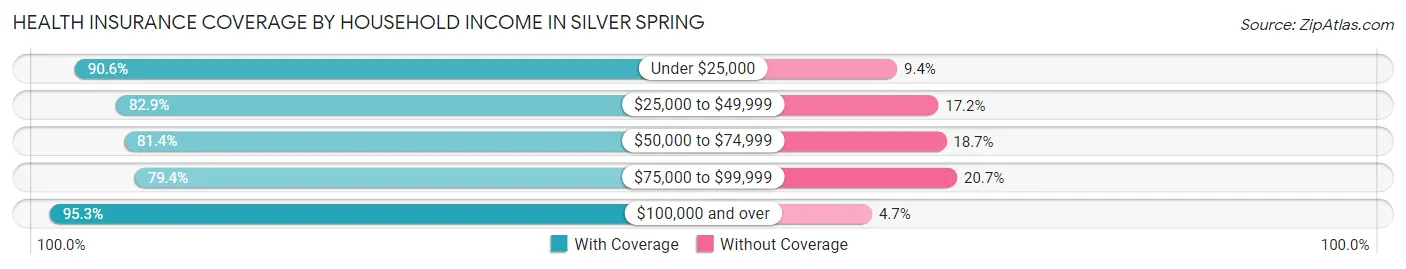
| Household Income | With Coverage | Without Coverage |
| Under $25,000 | 4,700 (90.6%) | 489 (9.4%) |
| $25,000 to $49,999 | 11,159 (82.9%) | 2,310 (17.2%) |
| $50,000 to $74,999 | 8,421 (81.4%) | 1,930 (18.6%) |
| $75,000 to $99,999 | 7,986 (79.3%) | 2,078 (20.6%) |
| $100,000 and over | 40,213 (95.3%) | 1,994 (4.7%) |
Public vs Private Health Insurance Coverage by Age in Silver Spring
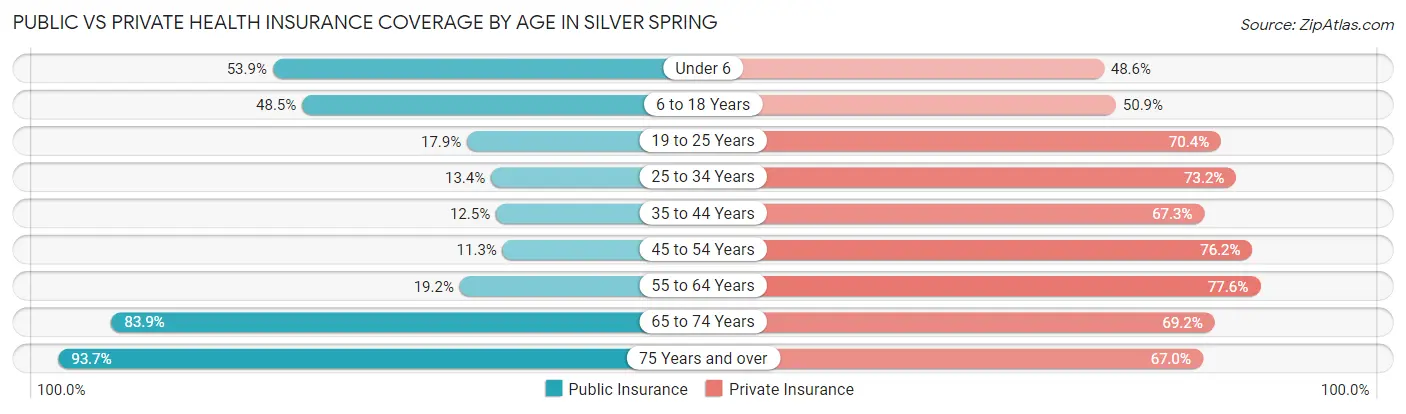
| Age Bracket | Public Insurance | Private Insurance |
| Under 6 | 3,693 (53.9%) | 3,329 (48.6%) |
| 6 to 18 Years | 5,893 (48.5%) | 6,182 (50.9%) |
| 19 to 25 Years | 1,429 (17.9%) | 5,623 (70.4%) |
| 25 to 34 Years | 1,865 (13.4%) | 10,172 (73.2%) |
| 35 to 44 Years | 1,663 (12.5%) | 8,948 (67.3%) |
| 45 to 54 Years | 1,044 (11.3%) | 7,061 (76.2%) |
| 55 to 64 Years | 1,621 (19.2%) | 6,542 (77.6%) |
| 65 to 74 Years | 5,505 (83.9%) | 4,540 (69.2%) |
| 75 Years and over | 2,846 (93.7%) | 2,034 (67.0%) |
| Total | 25,559 (31.4%) | 54,431 (66.8%) |
Disability Status by Sex by Age in Silver Spring
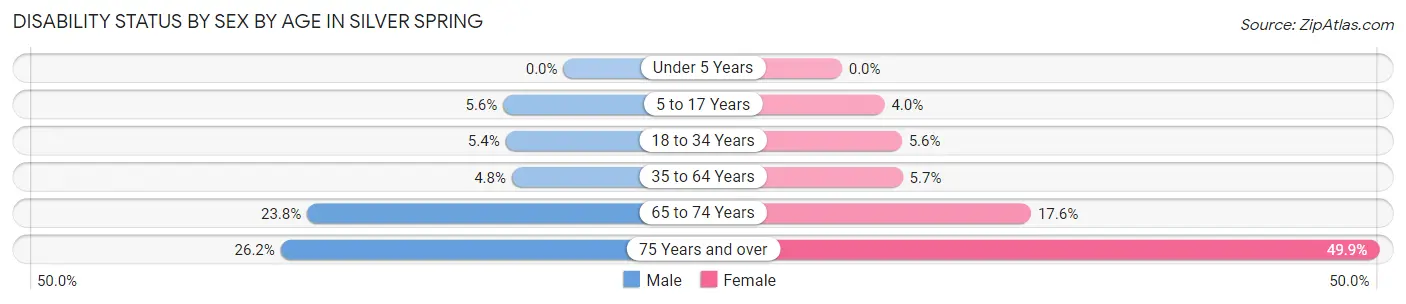
| Age Bracket | Male | Female |
| Under 5 Years | 0 (0.0%) | 0 (0.0%) |
| 5 to 17 Years | 390 (5.6%) | 242 (4.0%) |
| 18 to 34 Years | 567 (5.4%) | 656 (5.6%) |
| 35 to 64 Years | 742 (4.8%) | 874 (5.7%) |
| 65 to 74 Years | 681 (23.8%) | 650 (17.6%) |
| 75 Years and over | 313 (26.2%) | 919 (49.9%) |
Disability Class by Sex by Age in Silver Spring
Disability Class: Hearing Difficulty
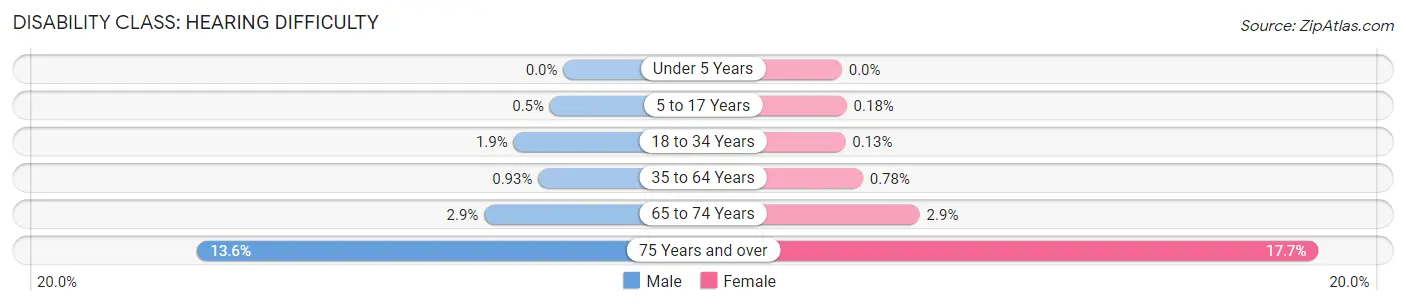
| Age Bracket | Male | Female |
| Under 5 Years | 0 (0.0%) | 0 (0.0%) |
| 5 to 17 Years | 35 (0.5%) | 11 (0.2%) |
| 18 to 34 Years | 195 (1.8%) | 15 (0.1%) |
| 35 to 64 Years | 145 (0.9%) | 120 (0.8%) |
| 65 to 74 Years | 84 (2.9%) | 107 (2.9%) |
| 75 Years and over | 162 (13.6%) | 326 (17.7%) |
Disability Class: Vision Difficulty
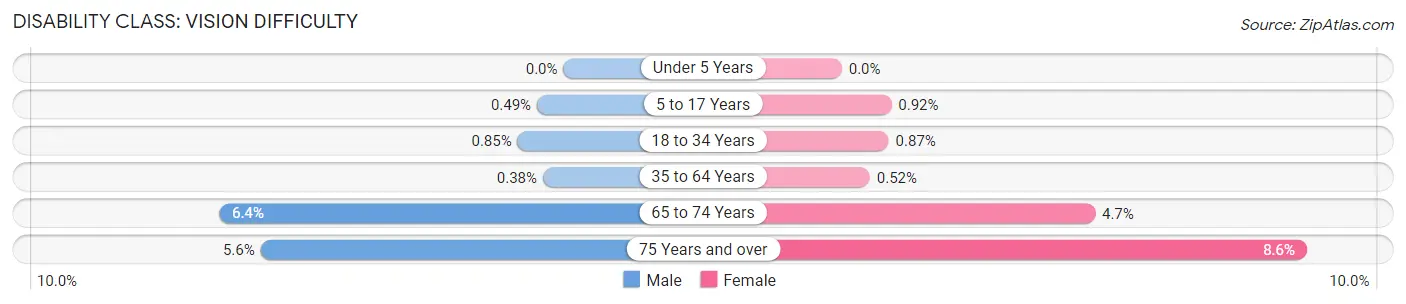
| Age Bracket | Male | Female |
| Under 5 Years | 0 (0.0%) | 0 (0.0%) |
| 5 to 17 Years | 34 (0.5%) | 56 (0.9%) |
| 18 to 34 Years | 90 (0.9%) | 102 (0.9%) |
| 35 to 64 Years | 59 (0.4%) | 81 (0.5%) |
| 65 to 74 Years | 183 (6.4%) | 174 (4.7%) |
| 75 Years and over | 67 (5.6%) | 159 (8.6%) |
Disability Class: Cognitive Difficulty
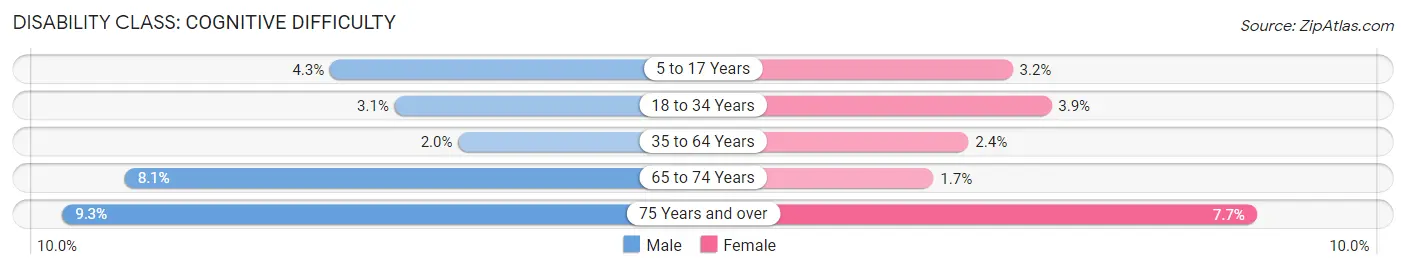
| Age Bracket | Male | Female |
| 5 to 17 Years | 302 (4.3%) | 194 (3.2%) |
| 18 to 34 Years | 331 (3.1%) | 459 (3.9%) |
| 35 to 64 Years | 303 (1.9%) | 363 (2.4%) |
| 65 to 74 Years | 233 (8.1%) | 63 (1.7%) |
| 75 Years and over | 111 (9.3%) | 142 (7.7%) |
Disability Class: Ambulatory Difficulty
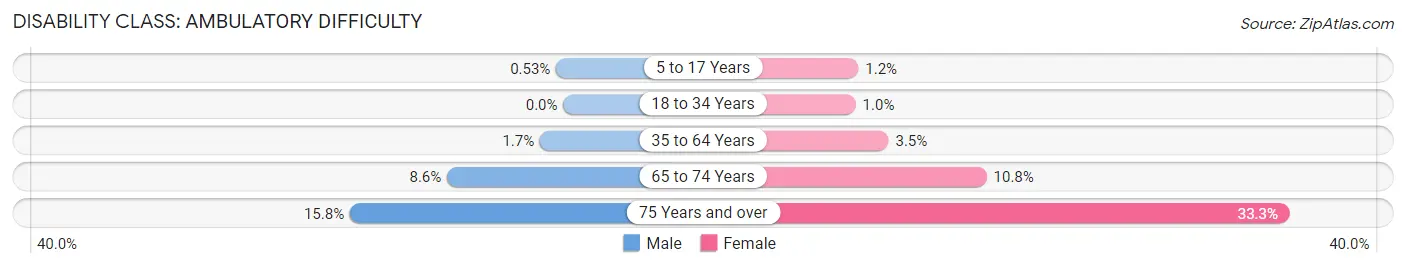
| Age Bracket | Male | Female |
| 5 to 17 Years | 37 (0.5%) | 75 (1.2%) |
| 18 to 34 Years | 0 (0.0%) | 122 (1.0%) |
| 35 to 64 Years | 269 (1.7%) | 536 (3.5%) |
| 65 to 74 Years | 247 (8.6%) | 398 (10.7%) |
| 75 Years and over | 189 (15.8%) | 613 (33.3%) |
Disability Class: Self-Care Difficulty
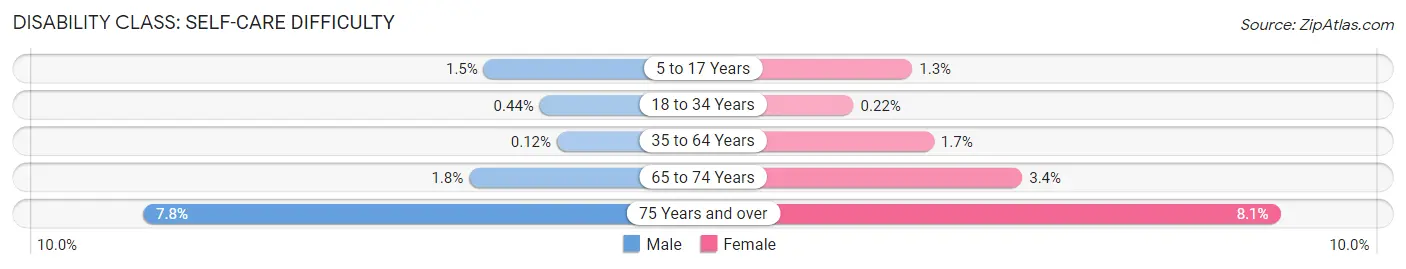
| Age Bracket | Male | Female |
| 5 to 17 Years | 103 (1.5%) | 80 (1.3%) |
| 18 to 34 Years | 47 (0.4%) | 26 (0.2%) |
| 35 to 64 Years | 19 (0.1%) | 264 (1.7%) |
| 65 to 74 Years | 50 (1.8%) | 124 (3.4%) |
| 75 Years and over | 93 (7.8%) | 150 (8.1%) |
Technology Access in Silver Spring
Computing Device Access in Silver Spring
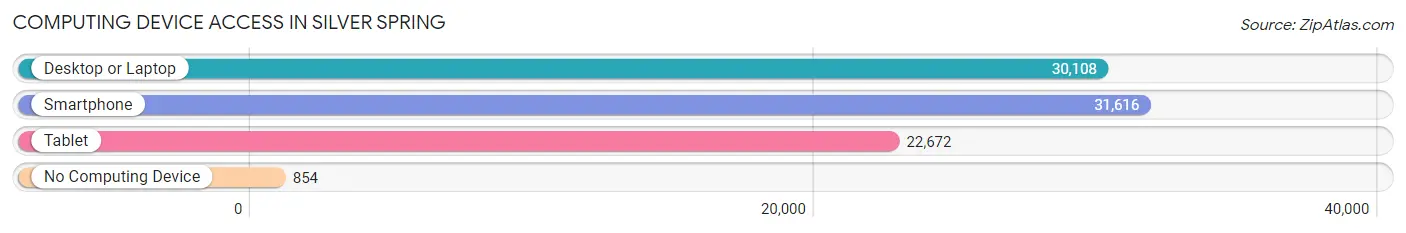
| Device Type | # Households | % Households |
| Desktop or Laptop | 30,108 | 88.9% |
| Smartphone | 31,616 | 93.3% |
| Tablet | 22,672 | 66.9% |
| No Computing Device | 854 | 2.5% |
| Total | 33,884 | 100.0% |
Internet Access in Silver Spring
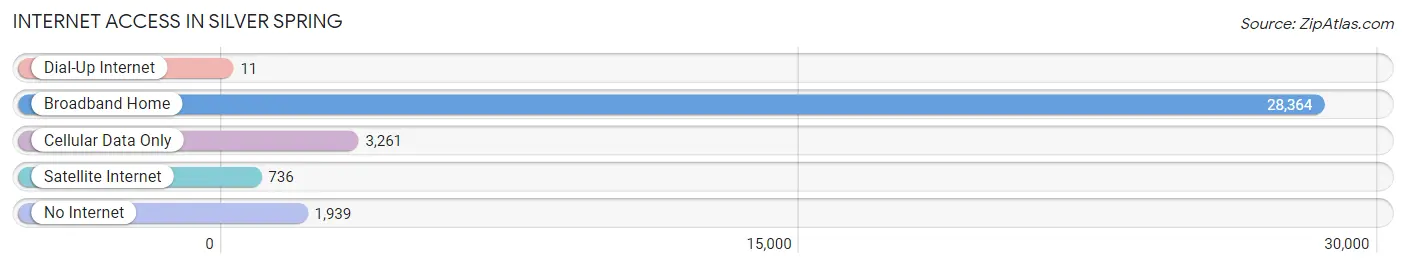
| Internet Type | # Households | % Households |
| Dial-Up Internet | 11 | 0.0% |
| Broadband Home | 28,364 | 83.7% |
| Cellular Data Only | 3,261 | 9.6% |
| Satellite Internet | 736 | 2.2% |
| No Internet | 1,939 | 5.7% |
| Total | 33,884 | 100.0% |
Silver Spring Summary
Spring, MD is a census-designated place (CDP) located in Montgomery County, Maryland, United States. It is situated just north of Washington, D.C. and is part of the Washington metropolitan area. As of the 2010 census, the population of Silver Spring was 71,452.
History
Silver Spring was first settled in the early 19th century by Francis Preston Blair, a newspaper editor and politician. He named the area after a mica-flecked spring discovered there by his daughter, Frances. The area was developed as a residential suburb of Washington, D.C. in the late 19th century.
In the early 20th century, Silver Spring became a major center for the motion picture industry. The area was home to many movie studios, including the first Vitagraph Studios, which opened in 1906. The area was also home to the first television station in the United States, WTTG, which began broadcasting in 1947.
Geography
Silver Spring is located at 39°2′N 77°1′W (39.03, -77.02). It is situated in the Piedmont region of Maryland, at an elevation of approximately 500 feet (152 m). The area is bounded by the Northwest Branch of the Anacostia River to the east, the Patuxent River to the south, and the Rock Creek Park to the west.
Economy
Silver Spring is a major economic center in the Washington metropolitan area. The area is home to many corporate headquarters, including Discovery Communications, the American Nurses Association, and the National Oceanic and Atmospheric Administration. The area is also home to many government agencies, including the Food and Drug Administration, the National Institutes of Health, and the National Institute of Standards and Technology.
Demographics
As of the 2010 census, the population of Silver Spring was 71,452. The racial makeup of the area was 54.3% White, 24.2% African American, 0.3% Native American, 11.7% Asian, 0.1% Pacific Islander, 5.2% from other races, and 4.2% from two or more races. Hispanic or Latino of any race were 13.4% of the population.
The median household income in Silver Spring was $76,711 in 2010. The per capita income was $37,890. About 11.3% of families and 15.5% of the population were below the poverty line, including 22.7% of those under age 18 and 8.1% of those age 65 or over.
Common Questions
What is Per Capita Income in Silver Spring?
Per Capita income in Silver Spring is $54,095.
What is the Median Family Income in Silver Spring?
Median Family Income in Silver Spring is $118,315.
What is the Median Household income in Silver Spring?
Median Household Income in Silver Spring is $95,213.
What is Income or Wage Gap in Silver Spring?
Income or Wage Gap in Silver Spring is 17.4%.
Women in Silver Spring earn 82.6 cents for every dollar earned by a man.
What is Inequality or Gini Index in Silver Spring?
Inequality or Gini Index in Silver Spring is 0.45.
What is the Total Population of Silver Spring?
Total Population of Silver Spring is 81,808.
What is the Total Male Population of Silver Spring?
Total Male Population of Silver Spring is 40,084.
What is the Total Female Population of Silver Spring?
Total Female Population of Silver Spring is 41,724.
What is the Ratio of Males per 100 Females in Silver Spring?
There are 96.07 Males per 100 Females in Silver Spring.
What is the Ratio of Females per 100 Males in Silver Spring?
There are 104.09 Females per 100 Males in Silver Spring.
What is the Median Population Age in Silver Spring?
Median Population Age in Silver Spring is 34.9 Years.
What is the Average Family Size in Silver Spring
Average Family Size in Silver Spring is 3.2 People.
What is the Average Household Size in Silver Spring
Average Household Size in Silver Spring is 2.4 People.
How Large is the Labor Force in Silver Spring?
There are 51,244 People in the Labor Forcein in Silver Spring.
What is the Percentage of People in the Labor Force in Silver Spring?
79.0% of People are in the Labor Force in Silver Spring.
What is the Unemployment Rate in Silver Spring?
Unemployment Rate in Silver Spring is 4.7%.