North Bethesda, MD Map & Demographics
North Bethesda Map
North Bethesda Overview
$78,300
PER CAPITA INCOME
$172,839
AVG FAMILY INCOME
$131,142
AVG HOUSEHOLD INCOME
26.9%
WAGE / INCOME GAP [ % ]
73.1¢/ $1
WAGE / INCOME GAP [ $ ]
0.46
INEQUALITY / GINI INDEX
49,763
TOTAL POPULATION
24,432
MALE POPULATION
25,331
FEMALE POPULATION
96.45
MALES / 100 FEMALES
103.68
FEMALES / 100 MALES
40.2
MEDIAN AGE
3.0
AVG FAMILY SIZE
2.2
AVG HOUSEHOLD SIZE
28,856
LABOR FORCE [ PEOPLE ]
69.6%
PERCENT IN LABOR FORCE
3.2%
UNEMPLOYMENT RATE
Income in North Bethesda
Income Overview in North Bethesda
Per Capita Income in North Bethesda is $78,300, while median incomes of families and households are $172,839 and $131,142 respectively.
| Characteristic | Number | Measure |
| Per Capita Income | 49,763 | $78,300 |
| Median Family Income | 11,699 | $172,839 |
| Mean Family Income | 11,699 | $221,255 |
| Median Household Income | 21,714 | $131,142 |
| Mean Household Income | 21,714 | $175,206 |
| Income Deficit | 11,699 | $0 |
| Wage / Income Gap (%) | 49,763 | 26.85% |
| Wage / Income Gap ($) | 49,763 | 73.15¢ per $1 |
| Gini / Inequality Index | 49,763 | 0.46 |
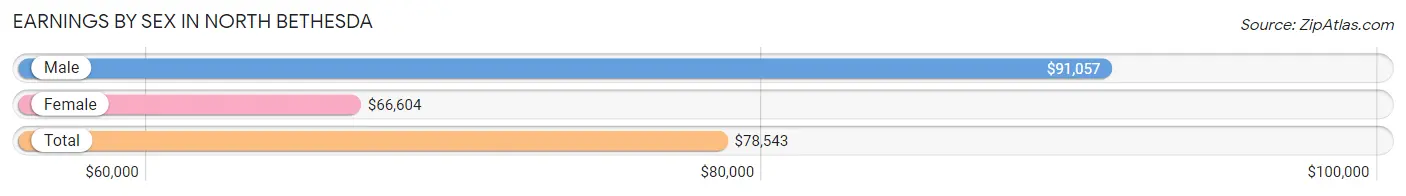
Earnings by Sex in North Bethesda
Average Earnings in North Bethesda are $78,543, $91,057 for men and $66,604 for women, a difference of 26.9%.
| Sex | Number | Average Earnings |
| Male | 15,363 (51.0%) | $91,057 |
| Female | 14,757 (49.0%) | $66,604 |
| Total | 30,120 (100.0%) | $78,543 |
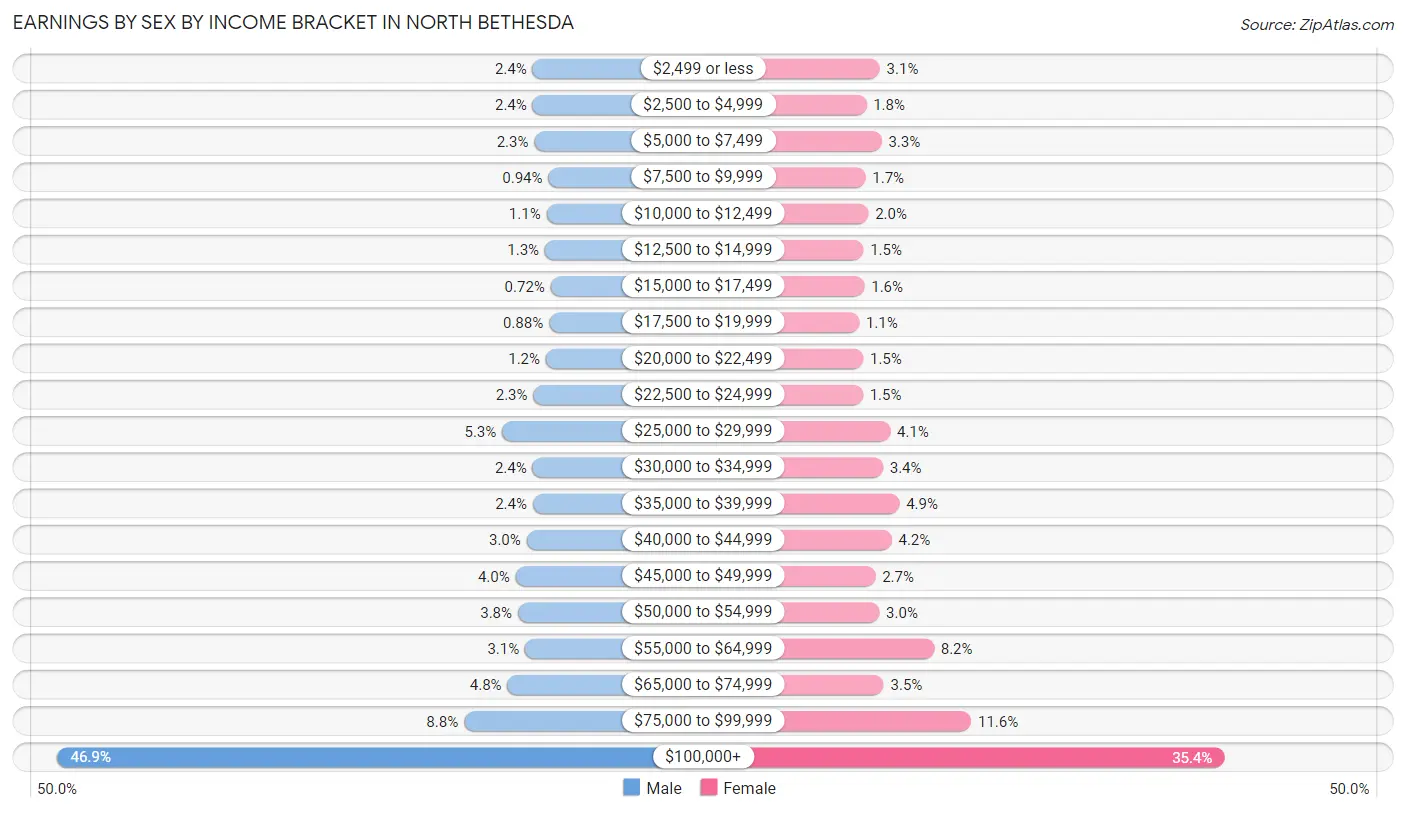
Earnings by Sex by Income Bracket in North Bethesda
The most common earnings brackets in North Bethesda are $100,000+ for men (7,207 | 46.9%) and $100,000+ for women (5,216 | 35.3%).
| Income | Male | Female |
| $2,499 or less | 372 (2.4%) | 455 (3.1%) |
| $2,500 to $4,999 | 370 (2.4%) | 268 (1.8%) |
| $5,000 to $7,499 | 346 (2.2%) | 479 (3.3%) |
| $7,500 to $9,999 | 144 (0.9%) | 257 (1.7%) |
| $10,000 to $12,499 | 170 (1.1%) | 296 (2.0%) |
| $12,500 to $14,999 | 194 (1.3%) | 227 (1.5%) |
| $15,000 to $17,499 | 111 (0.7%) | 242 (1.6%) |
| $17,500 to $19,999 | 135 (0.9%) | 168 (1.1%) |
| $20,000 to $22,499 | 179 (1.2%) | 224 (1.5%) |
| $22,500 to $24,999 | 360 (2.3%) | 220 (1.5%) |
| $25,000 to $29,999 | 810 (5.3%) | 597 (4.1%) |
| $30,000 to $34,999 | 372 (2.4%) | 498 (3.4%) |
| $35,000 to $39,999 | 367 (2.4%) | 725 (4.9%) |
| $40,000 to $44,999 | 457 (3.0%) | 618 (4.2%) |
| $45,000 to $49,999 | 616 (4.0%) | 392 (2.7%) |
| $50,000 to $54,999 | 583 (3.8%) | 447 (3.0%) |
| $55,000 to $64,999 | 479 (3.1%) | 1,202 (8.2%) |
| $65,000 to $74,999 | 733 (4.8%) | 509 (3.5%) |
| $75,000 to $99,999 | 1,358 (8.8%) | 1,717 (11.6%) |
| $100,000+ | 7,207 (46.9%) | 5,216 (35.3%) |
| Total | 15,363 (100.0%) | 14,757 (100.0%) |
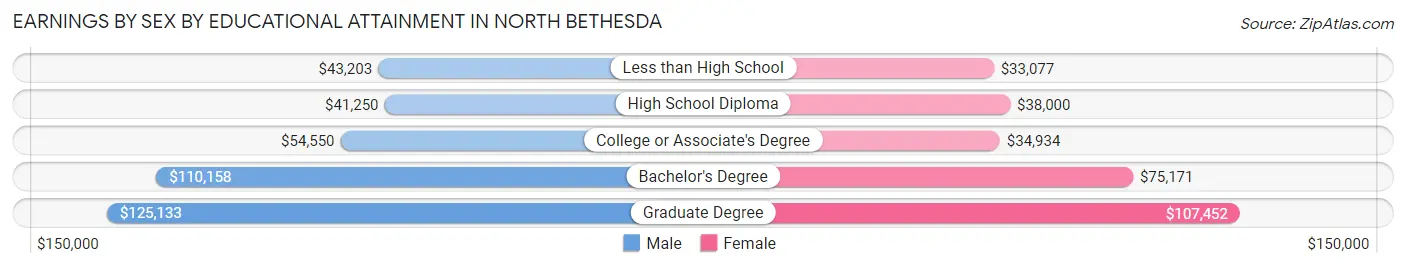
Earnings by Sex by Educational Attainment in North Bethesda
Average earnings in North Bethesda are $102,923 for men and $77,382 for women, a difference of 24.8%. Men with an educational attainment of graduate degree enjoy the highest average annual earnings of $125,133, while those with high school diploma education earn the least with $41,250. Women with an educational attainment of graduate degree earn the most with the average annual earnings of $107,452, while those with less than high school education have the smallest earnings of $33,077.
| Educational Attainment | Male Income | Female Income |
| Less than High School | $43,203 | $33,077 |
| High School Diploma | $41,250 | $38,000 |
| College or Associate's Degree | $54,550 | $34,934 |
| Bachelor's Degree | $110,158 | $75,171 |
| Graduate Degree | $125,133 | $107,452 |
| Total | $102,923 | $77,382 |
Family Income in North Bethesda
Family Income Brackets in North Bethesda
According to the North Bethesda family income data, there are 4,960 families falling into the $200,000+ income range, which is the most common income bracket and makes up 42.4% of all families. Conversely, the $10,000 to $14,999 income bracket is the least frequent group with only 82 families (0.7%) belonging to this category.
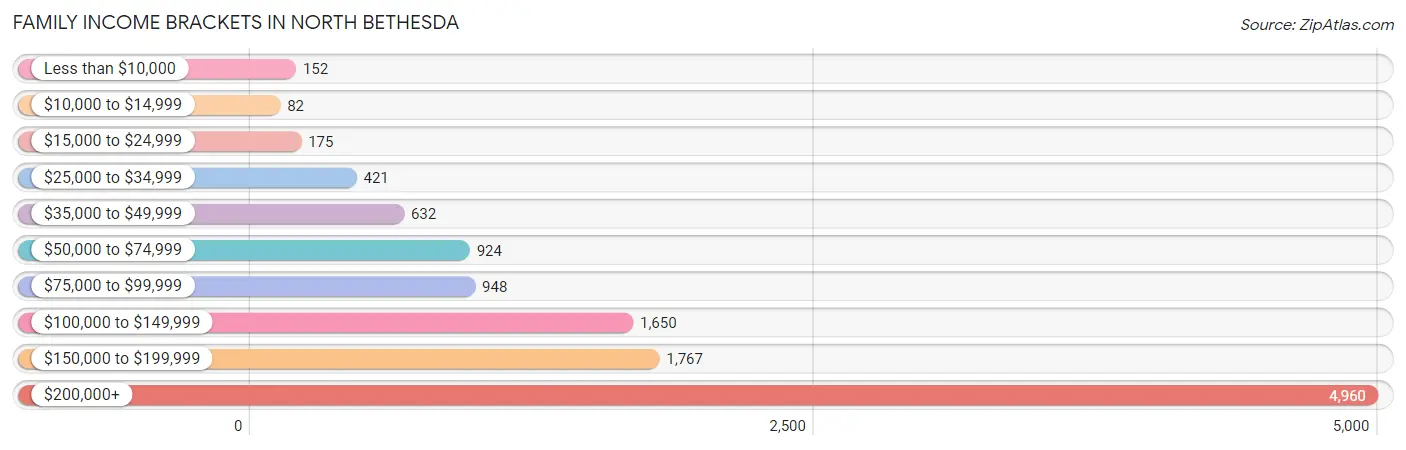
| Income Bracket | # Families | % Families |
| Less than $10,000 | 152 | 1.3% |
| $10,000 to $14,999 | 82 | 0.7% |
| $15,000 to $24,999 | 175 | 1.5% |
| $25,000 to $34,999 | 421 | 3.6% |
| $35,000 to $49,999 | 632 | 5.4% |
| $50,000 to $74,999 | 924 | 7.9% |
| $75,000 to $99,999 | 948 | 8.1% |
| $100,000 to $149,999 | 1,650 | 14.1% |
| $150,000 to $199,999 | 1,767 | 15.1% |
| $200,000+ | 4,960 | 42.4% |
Family Income by Famaliy Size in North Bethesda
5-person families (556 | 4.8%) account for the highest median family income in North Bethesda with $250,001 per family, while 2-person families (5,717 | 48.9%) have the highest median income of $79,032 per family member.
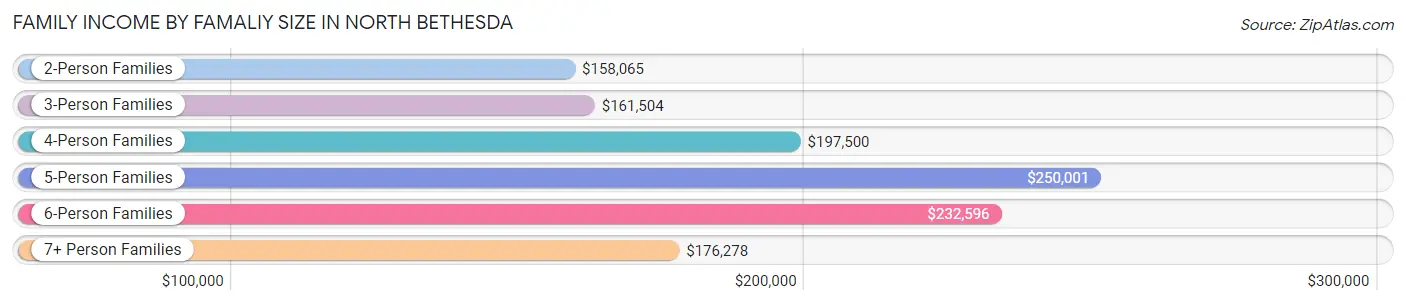
| Income Bracket | # Families | Median Income |
| 2-Person Families | 5,717 (48.9%) | $158,065 |
| 3-Person Families | 2,555 (21.8%) | $161,504 |
| 4-Person Families | 2,606 (22.3%) | $197,500 |
| 5-Person Families | 556 (4.8%) | $250,001 |
| 6-Person Families | 177 (1.5%) | $232,596 |
| 7+ Person Families | 88 (0.7%) | $176,278 |
| Total | 11,699 (100.0%) | $172,839 |
Family Income by Number of Earners in North Bethesda
The median family income in North Bethesda is $172,839, with families comprising 3+ earners (1,017) having the highest median family income of $250,001, while families with no earners (1,213) have the lowest median family income of $104,766, accounting for 8.7% and 10.4% of families, respectively.
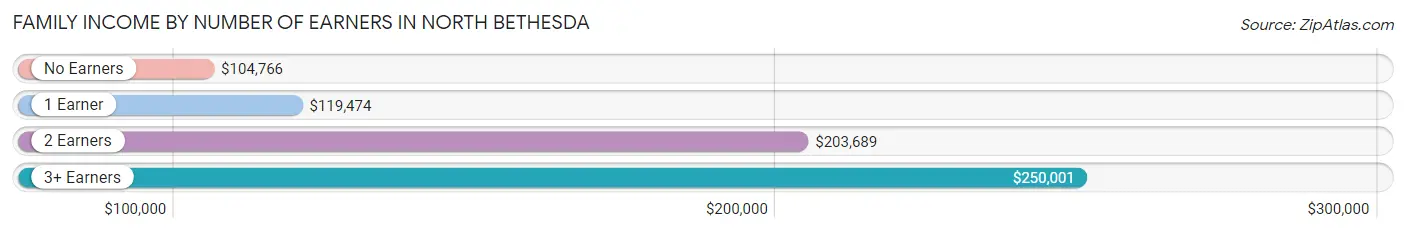
| Number of Earners | # Families | Median Income |
| No Earners | 1,213 (10.4%) | $104,766 |
| 1 Earner | 3,885 (33.2%) | $119,474 |
| 2 Earners | 5,584 (47.7%) | $203,689 |
| 3+ Earners | 1,017 (8.7%) | $250,001 |
| Total | 11,699 (100.0%) | $172,839 |
Household Income in North Bethesda
Household Income Brackets in North Bethesda
With 6,319 households falling in the category, the $200,000+ income range is the most frequent in North Bethesda, accounting for 29.1% of all households. In contrast, only 413 households (1.9%) fall into the $10,000 to $14,999 income bracket, making it the least populous group.
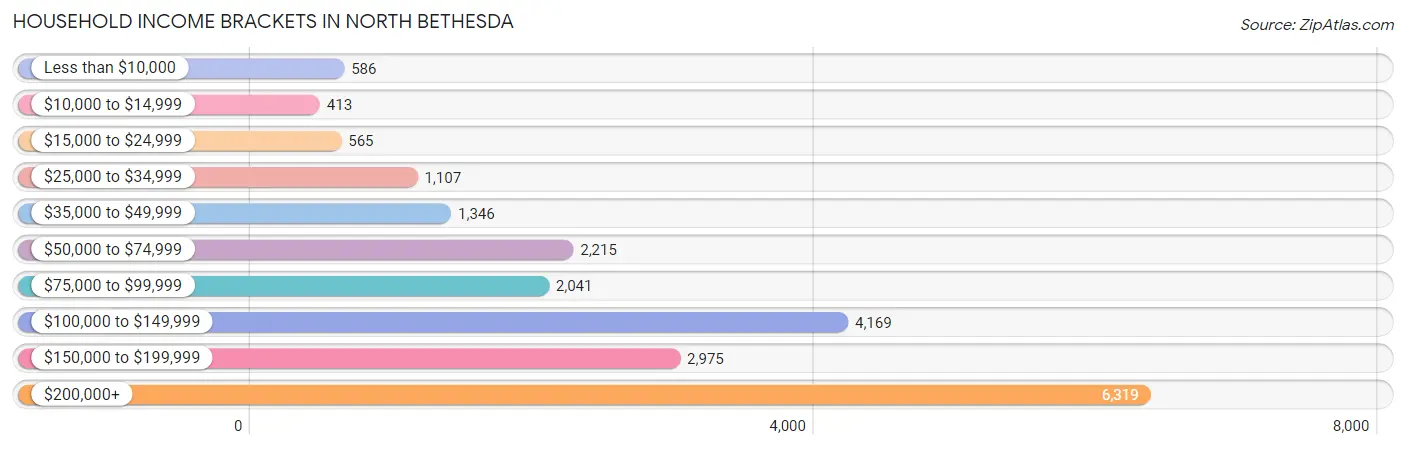
| Income Bracket | # Households | % Households |
| Less than $10,000 | 586 | 2.7% |
| $10,000 to $14,999 | 413 | 1.9% |
| $15,000 to $24,999 | 565 | 2.6% |
| $25,000 to $34,999 | 1,107 | 5.1% |
| $35,000 to $49,999 | 1,346 | 6.2% |
| $50,000 to $74,999 | 2,215 | 10.2% |
| $75,000 to $99,999 | 2,041 | 9.4% |
| $100,000 to $149,999 | 4,169 | 19.2% |
| $150,000 to $199,999 | 2,975 | 13.7% |
| $200,000+ | 6,319 | 29.1% |
Household Income by Householder Age in North Bethesda
The median household income in North Bethesda is $131,142, with the highest median household income of $165,045 found in the 45 to 64 years age bracket for the primary householder. A total of 7,672 households (35.3%) fall into this category. Meanwhile, the 15 to 24 years age bracket for the primary householder has the lowest median household income of $54,375, with 609 households (2.8%) in this group.
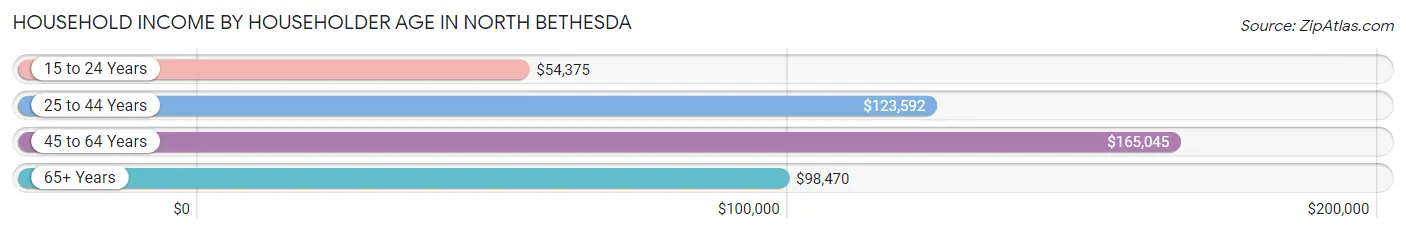
| Income Bracket | # Households | Median Income |
| 15 to 24 Years | 609 (2.8%) | $54,375 |
| 25 to 44 Years | 8,419 (38.8%) | $123,592 |
| 45 to 64 Years | 7,672 (35.3%) | $165,045 |
| 65+ Years | 5,014 (23.1%) | $98,470 |
| Total | 21,714 (100.0%) | $131,142 |
Poverty in North Bethesda
Income Below Poverty by Sex and Age in North Bethesda
With 4.6% poverty level for males and 6.6% for females among the residents of North Bethesda, 18 to 24 year old males and 18 to 24 year old females are the most vulnerable to poverty, with 181 males (11.0%) and 246 females (12.5%) in their respective age groups living below the poverty level.
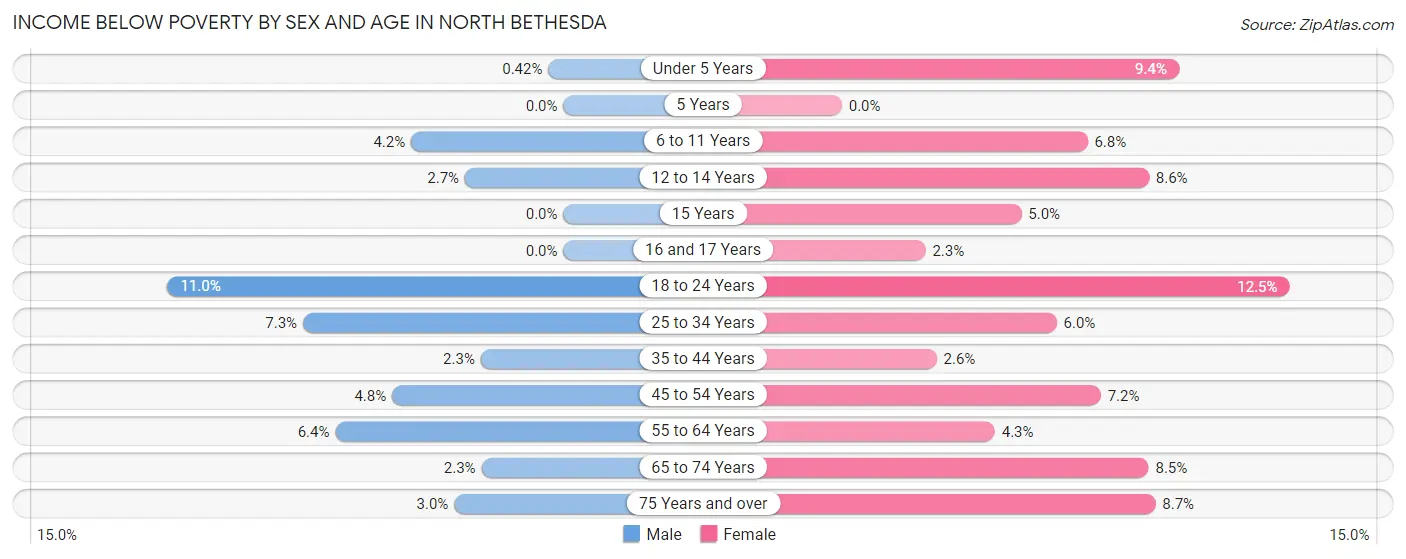
| Age Bracket | Male | Female |
| Under 5 Years | 5 (0.4%) | 89 (9.4%) |
| 5 Years | 0 (0.0%) | 0 (0.0%) |
| 6 to 11 Years | 87 (4.2%) | 97 (6.8%) |
| 12 to 14 Years | 23 (2.7%) | 74 (8.6%) |
| 15 Years | 0 (0.0%) | 11 (5.0%) |
| 16 and 17 Years | 0 (0.0%) | 9 (2.3%) |
| 18 to 24 Years | 181 (11.0%) | 246 (12.5%) |
| 25 to 34 Years | 268 (7.2%) | 240 (6.0%) |
| 35 to 44 Years | 81 (2.3%) | 100 (2.6%) |
| 45 to 54 Years | 169 (4.8%) | 236 (7.2%) |
| 55 to 64 Years | 197 (6.4%) | 135 (4.3%) |
| 65 to 74 Years | 39 (2.3%) | 200 (8.5%) |
| 75 Years and over | 45 (3.0%) | 189 (8.7%) |
| Total | 1,095 (4.6%) | 1,626 (6.6%) |
Income Above Poverty by Sex and Age in North Bethesda
According to the poverty statistics in North Bethesda, males aged 5 years and females aged 5 years are the age groups that are most secure financially, with 100.0% of males and 100.0% of females in these age groups living above the poverty line.
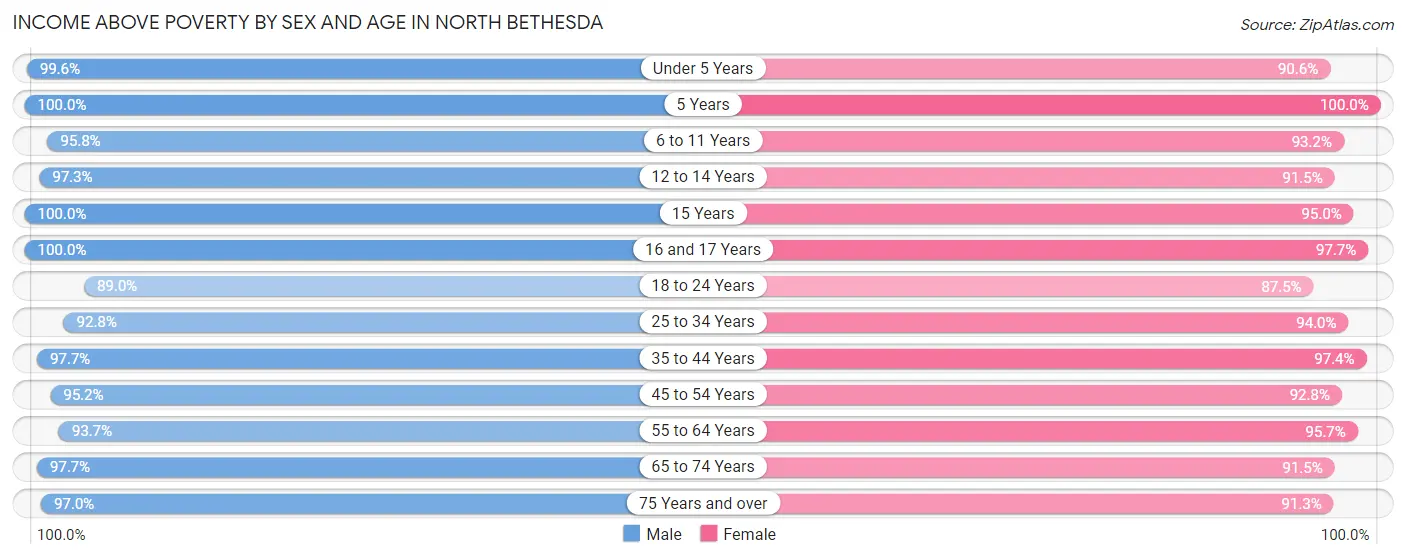
| Age Bracket | Male | Female |
| Under 5 Years | 1,191 (99.6%) | 860 (90.6%) |
| 5 Years | 226 (100.0%) | 228 (100.0%) |
| 6 to 11 Years | 1,966 (95.8%) | 1,321 (93.2%) |
| 12 to 14 Years | 817 (97.3%) | 792 (91.4%) |
| 15 Years | 291 (100.0%) | 209 (95.0%) |
| 16 and 17 Years | 685 (100.0%) | 378 (97.7%) |
| 18 to 24 Years | 1,462 (89.0%) | 1,729 (87.5%) |
| 25 to 34 Years | 3,428 (92.7%) | 3,775 (94.0%) |
| 35 to 44 Years | 3,445 (97.7%) | 3,684 (97.4%) |
| 45 to 54 Years | 3,375 (95.2%) | 3,038 (92.8%) |
| 55 to 64 Years | 2,903 (93.6%) | 3,033 (95.7%) |
| 65 to 74 Years | 1,672 (97.7%) | 2,142 (91.5%) |
| 75 Years and over | 1,436 (97.0%) | 1,976 (91.3%) |
| Total | 22,897 (95.4%) | 23,165 (93.4%) |
Income Below Poverty Among Married-Couple Families in North Bethesda
The poverty statistics for married-couple families in North Bethesda show that 2.3% or 216 of the total 9,434 families live below the poverty line. Families with no children have the highest poverty rate of 2.5%, comprising of 130 families. On the other hand, families with 3 or 4 children have the lowest poverty rate of 0.0%, which includes 0 families.
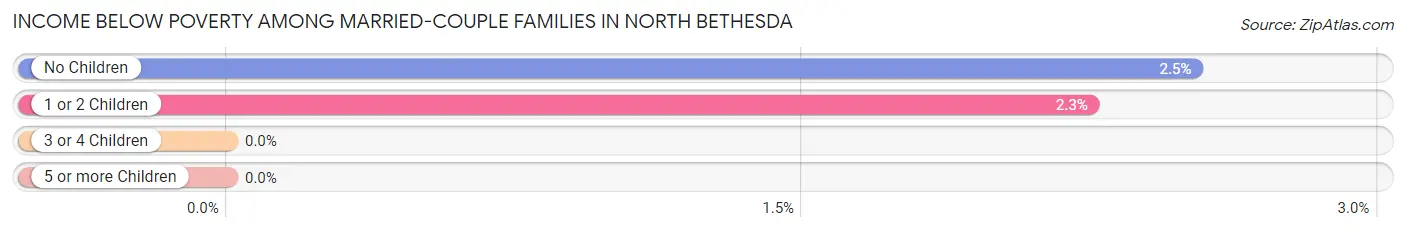
| Children | Above Poverty | Below Poverty |
| No Children | 5,028 (97.5%) | 130 (2.5%) |
| 1 or 2 Children | 3,728 (97.8%) | 86 (2.2%) |
| 3 or 4 Children | 462 (100.0%) | 0 (0.0%) |
| 5 or more Children | 0 (0.0%) | 0 (0.0%) |
| Total | 9,218 (97.7%) | 216 (2.3%) |
Income Below Poverty Among Single-Parent Households in North Bethesda
According to the poverty data in North Bethesda, 1.6% or 9 single-father households and 9.2% or 157 single-mother households are living below the poverty line. Among single-father households, those with 1 or 2 children have the highest poverty rate, with 9 households (2.3%) experiencing poverty. Likewise, among single-mother households, those with 3 or 4 children have the highest poverty rate, with 30 households (100.0%) falling below the poverty line.
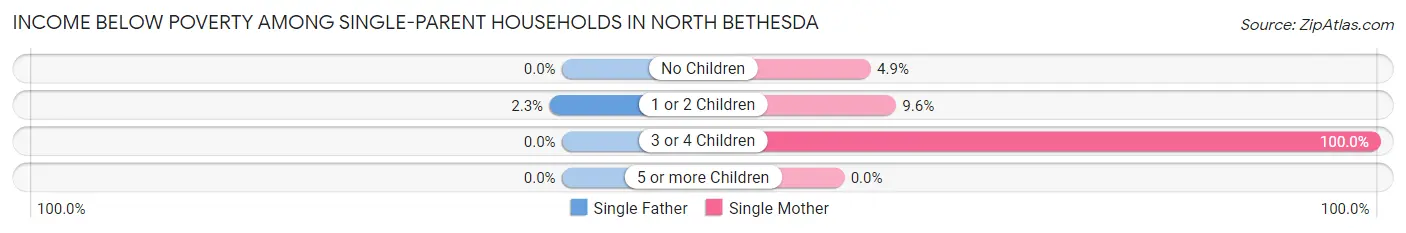
| Children | Single Father | Single Mother |
| No Children | 0 (0.0%) | 34 (4.9%) |
| 1 or 2 Children | 9 (2.3%) | 93 (9.6%) |
| 3 or 4 Children | 0 (0.0%) | 30 (100.0%) |
| 5 or more Children | 0 (0.0%) | 0 (0.0%) |
| Total | 9 (1.6%) | 157 (9.2%) |
Income Below Poverty Among Married-Couple vs Single-Parent Households in North Bethesda
The poverty data for North Bethesda shows that 216 of the married-couple family households (2.3%) and 166 of the single-parent households (7.3%) are living below the poverty level. Within the married-couple family households, those with no children have the highest poverty rate, with 130 households (2.5%) falling below the poverty line. Among the single-parent households, those with 3 or 4 children have the highest poverty rate, with 30 household (75.0%) living below poverty.
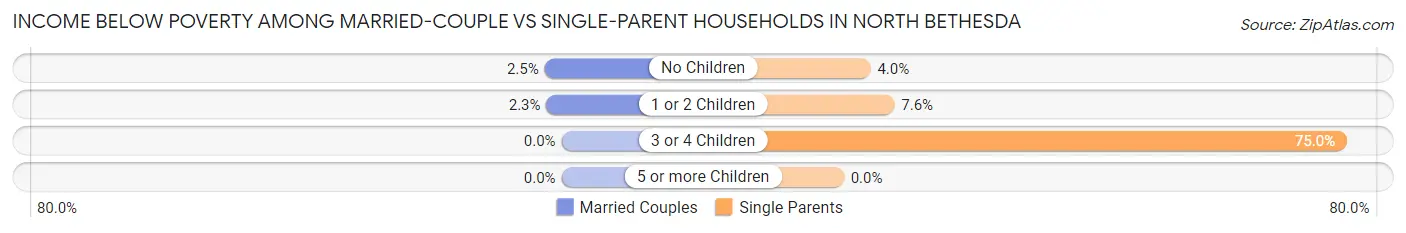
| Children | Married-Couple Families | Single-Parent Households |
| No Children | 130 (2.5%) | 34 (4.0%) |
| 1 or 2 Children | 86 (2.2%) | 102 (7.5%) |
| 3 or 4 Children | 0 (0.0%) | 30 (75.0%) |
| 5 or more Children | 0 (0.0%) | 0 (0.0%) |
| Total | 216 (2.3%) | 166 (7.3%) |
Race in North Bethesda
The most populous races in North Bethesda are White / Caucasian (29,021 | 58.3%), Asian (7,894 | 15.9%), and Hispanic or Latino (7,774 | 15.6%).
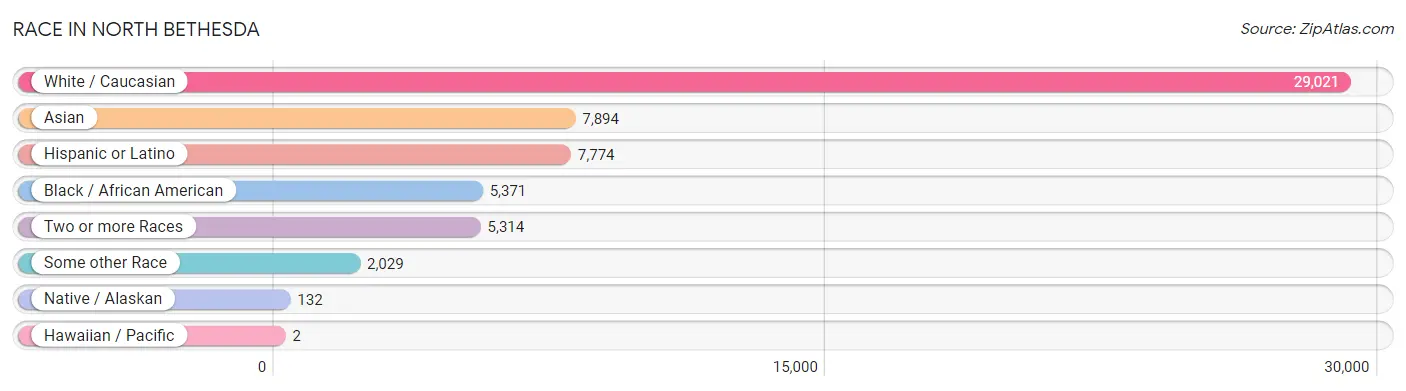
| Race | # Population | % Population |
| Asian | 7,894 | 15.9% |
| Black / African American | 5,371 | 10.8% |
| Hawaiian / Pacific | 2 | 0.0% |
| Hispanic or Latino | 7,774 | 15.6% |
| Native / Alaskan | 132 | 0.3% |
| White / Caucasian | 29,021 | 58.3% |
| Two or more Races | 5,314 | 10.7% |
| Some other Race | 2,029 | 4.1% |
| Total | 49,763 | 100.0% |
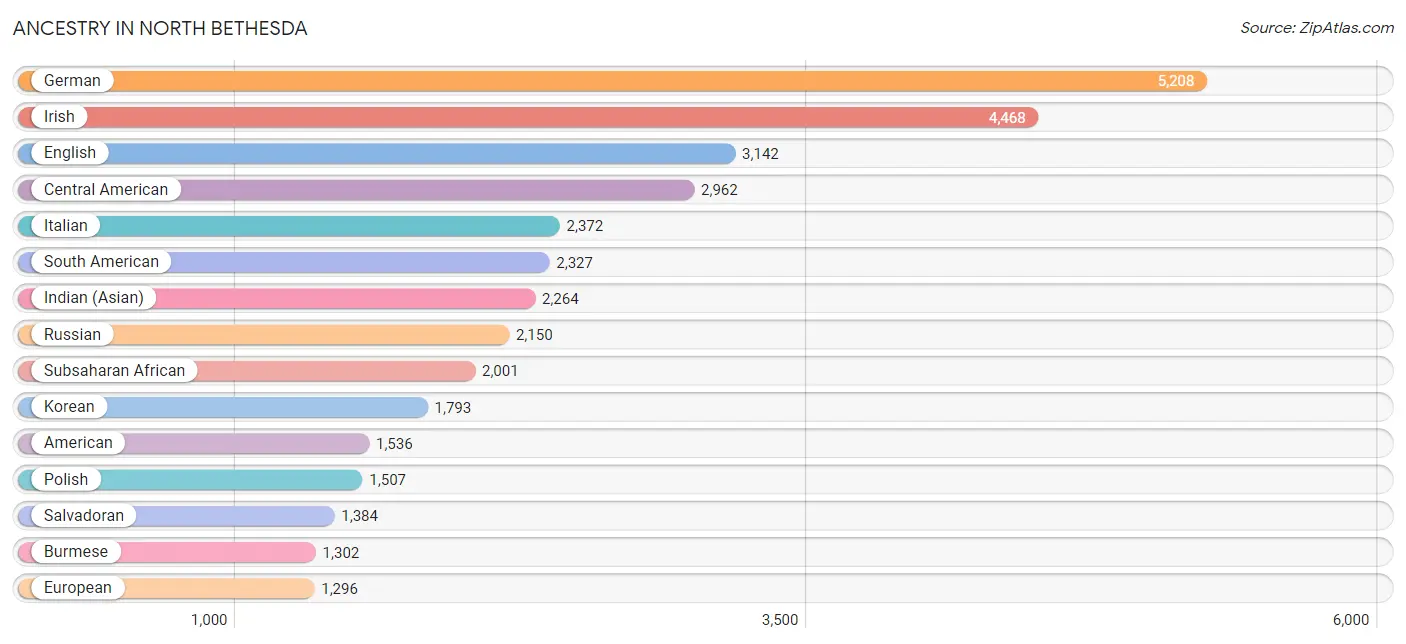
Ancestry in North Bethesda
The most populous ancestries reported in North Bethesda are German (5,208 | 10.5%), Irish (4,468 | 9.0%), English (3,142 | 6.3%), Central American (2,962 | 5.9%), and Italian (2,372 | 4.8%), together accounting for 36.5% of all North Bethesda residents.
| Ancestry | # Population | % Population |
| African | 732 | 1.5% |
| Albanian | 8 | 0.0% |
| American | 1,536 | 3.1% |
| Arab | 1,002 | 2.0% |
| Argentinean | 227 | 0.5% |
| Armenian | 190 | 0.4% |
| Austrian | 386 | 0.8% |
| Bahamian | 7 | 0.0% |
| Bangladeshi | 2 | 0.0% |
| Barbadian | 7 | 0.0% |
| Basque | 10 | 0.0% |
| Belgian | 43 | 0.1% |
| Bhutanese | 1,044 | 2.1% |
| Bolivian | 414 | 0.8% |
| Brazilian | 411 | 0.8% |
| British | 371 | 0.7% |
| Bulgarian | 156 | 0.3% |
| Burmese | 1,302 | 2.6% |
| Canadian | 11 | 0.0% |
| Central American | 2,962 | 5.9% |
| Central American Indian | 73 | 0.2% |
| Cherokee | 51 | 0.1% |
| Chilean | 29 | 0.1% |
| Choctaw | 27 | 0.1% |
| Colombian | 945 | 1.9% |
| Costa Rican | 282 | 0.6% |
| Croatian | 92 | 0.2% |
| Cuban | 93 | 0.2% |
| Czech | 48 | 0.1% |
| Czechoslovakian | 13 | 0.0% |
| Danish | 85 | 0.2% |
| Dominican | 194 | 0.4% |
| Dutch | 216 | 0.4% |
| Eastern European | 673 | 1.3% |
| Ecuadorian | 61 | 0.1% |
| Egyptian | 112 | 0.2% |
| English | 3,142 | 6.3% |
| Estonian | 56 | 0.1% |
| Ethiopian | 419 | 0.8% |
| European | 1,296 | 2.6% |
| Filipino | 330 | 0.7% |
| Finnish | 214 | 0.4% |
| French | 843 | 1.7% |
| French Canadian | 110 | 0.2% |
| German | 5,208 | 10.5% |
| Ghanaian | 46 | 0.1% |
| Greek | 418 | 0.8% |
| Guamanian / Chamorro | 2 | 0.0% |
| Guatemalan | 228 | 0.5% |
| Guyanese | 19 | 0.0% |
| Haitian | 151 | 0.3% |
| Honduran | 795 | 1.6% |
| Hungarian | 455 | 0.9% |
| Indian (Asian) | 2,264 | 4.5% |
| Indonesian | 111 | 0.2% |
| Iranian | 853 | 1.7% |
| Iraqi | 58 | 0.1% |
| Irish | 4,468 | 9.0% |
| Israeli | 128 | 0.3% |
| Italian | 2,372 | 4.8% |
| Jamaican | 248 | 0.5% |
| Japanese | 14 | 0.0% |
| Jordanian | 94 | 0.2% |
| Kenyan | 8 | 0.0% |
| Korean | 1,793 | 3.6% |
| Laotian | 48 | 0.1% |
| Latvian | 115 | 0.2% |
| Lebanese | 332 | 0.7% |
| Liberian | 3 | 0.0% |
| Lithuanian | 260 | 0.5% |
| Malaysian | 115 | 0.2% |
| Maltese | 8 | 0.0% |
| Mexican | 864 | 1.7% |
| Mexican American Indian | 37 | 0.1% |
| Mongolian | 14 | 0.0% |
| Moroccan | 105 | 0.2% |
| Nicaraguan | 163 | 0.3% |
| Nigerian | 302 | 0.6% |
| Northern European | 139 | 0.3% |
| Norwegian | 348 | 0.7% |
| Pakistani | 91 | 0.2% |
| Palestinian | 21 | 0.0% |
| Panamanian | 110 | 0.2% |
| Peruvian | 523 | 1.1% |
| Polish | 1,507 | 3.0% |
| Portuguese | 278 | 0.6% |
| Puerto Rican | 507 | 1.0% |
| Puget Sound Salish | 7 | 0.0% |
| Romanian | 252 | 0.5% |
| Russian | 2,150 | 4.3% |
| Salvadoran | 1,384 | 2.8% |
| Scandinavian | 149 | 0.3% |
| Scotch-Irish | 367 | 0.7% |
| Scottish | 817 | 1.6% |
| Senegalese | 8 | 0.0% |
| Serbian | 104 | 0.2% |
| Sierra Leonean | 7 | 0.0% |
| Slavic | 15 | 0.0% |
| Slovak | 337 | 0.7% |
| South American | 2,327 | 4.7% |
| South American Indian | 25 | 0.1% |
| Spaniard | 369 | 0.7% |
| Spanish | 256 | 0.5% |
| Sri Lankan | 509 | 1.0% |
| Subsaharan African | 2,001 | 4.0% |
| Sudanese | 54 | 0.1% |
| Swedish | 362 | 0.7% |
| Swiss | 91 | 0.2% |
| Syrian | 16 | 0.0% |
| Thai | 1,275 | 2.6% |
| Trinidadian and Tobagonian | 121 | 0.2% |
| Turkish | 84 | 0.2% |
| U.S. Virgin Islander | 9 | 0.0% |
| Ugandan | 3 | 0.0% |
| Ukrainian | 412 | 0.8% |
| Uruguayan | 20 | 0.0% |
| Venezuelan | 102 | 0.2% |
| Vietnamese | 95 | 0.2% |
| Welsh | 164 | 0.3% |
| West Indian | 21 | 0.0% |
| Zimbabwean | 16 | 0.0% | View All 121 Rows |
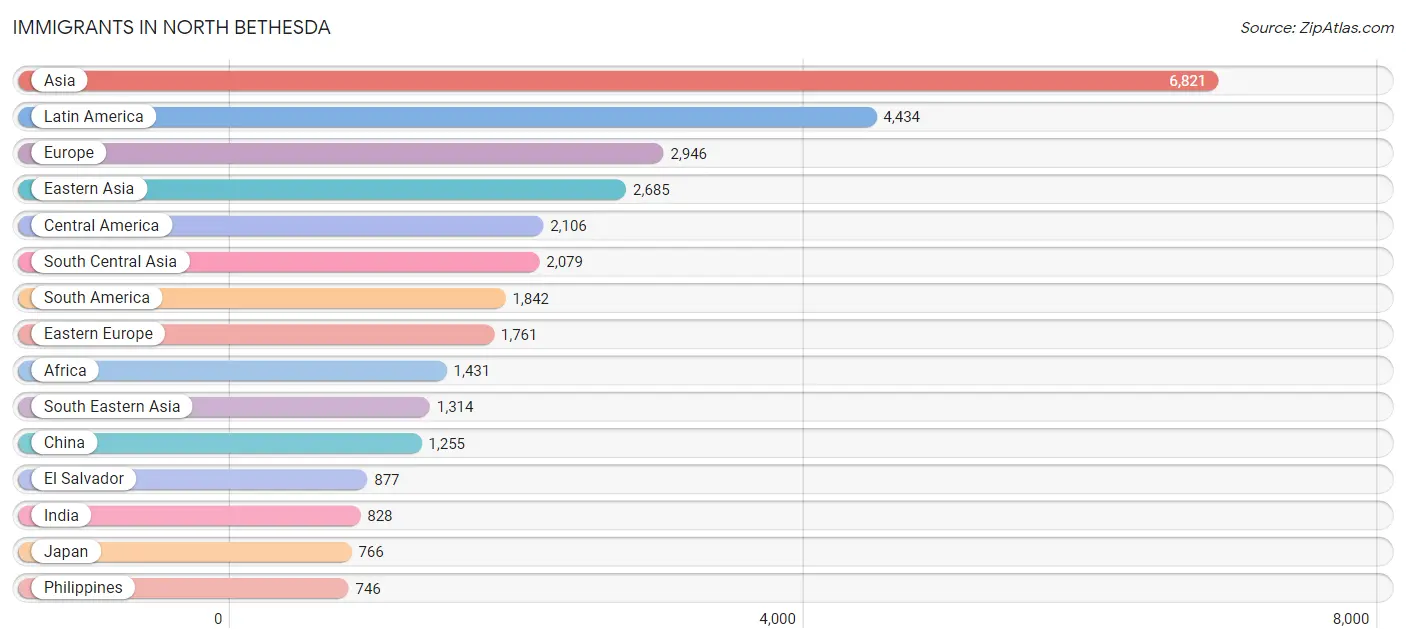
Immigrants in North Bethesda
The most numerous immigrant groups reported in North Bethesda came from Asia (6,821 | 13.7%), Latin America (4,434 | 8.9%), Europe (2,946 | 5.9%), Eastern Asia (2,685 | 5.4%), and Central America (2,106 | 4.2%), together accounting for 38.2% of all North Bethesda residents.
| Immigration Origin | # Population | % Population |
| Africa | 1,431 | 2.9% |
| Albania | 9 | 0.0% |
| Argentina | 164 | 0.3% |
| Armenia | 85 | 0.2% |
| Asia | 6,821 | 13.7% |
| Austria | 25 | 0.1% |
| Bahamas | 7 | 0.0% |
| Bangladesh | 185 | 0.4% |
| Belgium | 14 | 0.0% |
| Bolivia | 355 | 0.7% |
| Brazil | 449 | 0.9% |
| Bulgaria | 95 | 0.2% |
| Cambodia | 30 | 0.1% |
| Cameroon | 133 | 0.3% |
| Canada | 72 | 0.1% |
| Caribbean | 486 | 1.0% |
| Central America | 2,106 | 4.2% |
| Chile | 16 | 0.0% |
| China | 1,255 | 2.5% |
| Colombia | 286 | 0.6% |
| Congo | 10 | 0.0% |
| Costa Rica | 434 | 0.9% |
| Cuba | 98 | 0.2% |
| Czechoslovakia | 104 | 0.2% |
| Dominica | 10 | 0.0% |
| Dominican Republic | 66 | 0.1% |
| Eastern Africa | 376 | 0.8% |
| Eastern Asia | 2,685 | 5.4% |
| Eastern Europe | 1,761 | 3.5% |
| Egypt | 85 | 0.2% |
| El Salvador | 877 | 1.8% |
| England | 28 | 0.1% |
| Eritrea | 23 | 0.1% |
| Ethiopia | 275 | 0.5% |
| Europe | 2,946 | 5.9% |
| France | 277 | 0.6% |
| Germany | 274 | 0.5% |
| Ghana | 144 | 0.3% |
| Greece | 13 | 0.0% |
| Guatemala | 87 | 0.2% |
| Guyana | 8 | 0.0% |
| Haiti | 107 | 0.2% |
| Honduras | 351 | 0.7% |
| Hong Kong | 91 | 0.2% |
| Hungary | 16 | 0.0% |
| India | 828 | 1.7% |
| Indonesia | 35 | 0.1% |
| Iran | 608 | 1.2% |
| Iraq | 58 | 0.1% |
| Ireland | 39 | 0.1% |
| Israel | 113 | 0.2% |
| Italy | 89 | 0.2% |
| Jamaica | 85 | 0.2% |
| Japan | 766 | 1.5% |
| Jordan | 65 | 0.1% |
| Kazakhstan | 30 | 0.1% |
| Kenya | 36 | 0.1% |
| Korea | 664 | 1.3% |
| Kuwait | 18 | 0.0% |
| Laos | 54 | 0.1% |
| Latin America | 4,434 | 8.9% |
| Latvia | 24 | 0.1% |
| Lebanon | 111 | 0.2% |
| Liberia | 10 | 0.0% |
| Malaysia | 28 | 0.1% |
| Mexico | 209 | 0.4% |
| Middle Africa | 156 | 0.3% |
| Moldova | 232 | 0.5% |
| Morocco | 98 | 0.2% |
| Nepal | 29 | 0.1% |
| Netherlands | 73 | 0.2% |
| Nicaragua | 113 | 0.2% |
| Nigeria | 193 | 0.4% |
| Northern Africa | 301 | 0.6% |
| Northern Europe | 250 | 0.5% |
| Norway | 30 | 0.1% |
| Pakistan | 129 | 0.3% |
| Panama | 35 | 0.1% |
| Peru | 461 | 0.9% |
| Philippines | 746 | 1.5% |
| Poland | 32 | 0.1% |
| Portugal | 58 | 0.1% |
| Romania | 20 | 0.0% |
| Russia | 545 | 1.1% |
| Saudi Arabia | 19 | 0.0% |
| Senegal | 92 | 0.2% |
| Serbia | 106 | 0.2% |
| Sierra Leone | 7 | 0.0% |
| South Africa | 22 | 0.0% |
| South America | 1,842 | 3.7% |
| South Central Asia | 2,079 | 4.2% |
| South Eastern Asia | 1,314 | 2.6% |
| Southern Europe | 247 | 0.5% |
| Spain | 75 | 0.2% |
| Sri Lanka | 90 | 0.2% |
| Sudan | 59 | 0.1% |
| Sweden | 22 | 0.0% |
| Switzerland | 25 | 0.1% |
| Syria | 8 | 0.0% |
| Taiwan | 408 | 0.8% |
| Thailand | 20 | 0.0% |
| Trinidad and Tobago | 113 | 0.2% |
| Turkey | 72 | 0.1% |
| Uganda | 3 | 0.0% |
| Ukraine | 301 | 0.6% |
| Uruguay | 15 | 0.0% |
| Uzbekistan | 2 | 0.0% |
| Venezuela | 88 | 0.2% |
| Vietnam | 328 | 0.7% |
| Western Africa | 541 | 1.1% |
| Western Asia | 693 | 1.4% |
| Western Europe | 688 | 1.4% |
| Zimbabwe | 32 | 0.1% | View All 113 Rows |
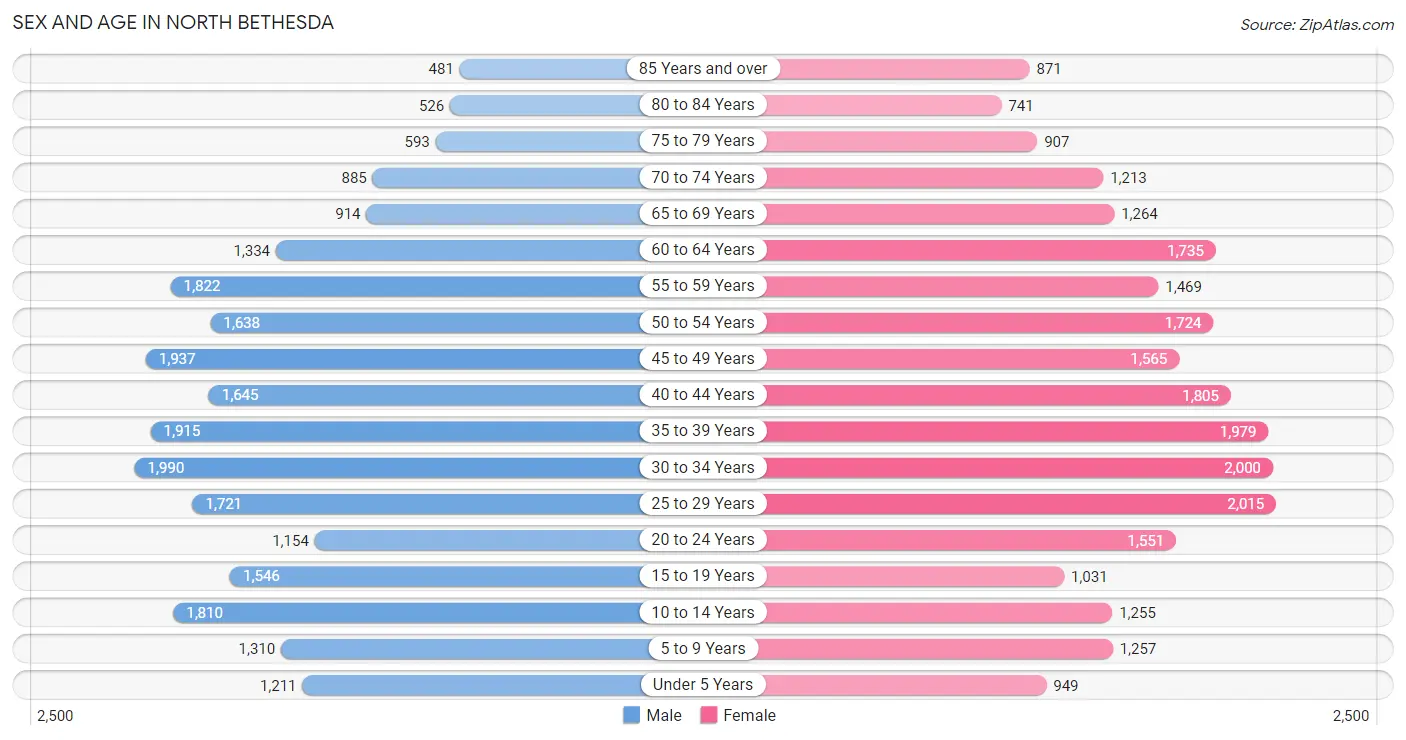
Sex and Age in North Bethesda
Sex and Age in North Bethesda
The most populous age groups in North Bethesda are 30 to 34 Years (1,990 | 8.2%) for men and 25 to 29 Years (2,015 | 8.0%) for women.
| Age Bracket | Male | Female |
| Under 5 Years | 1,211 (5.0%) | 949 (3.7%) |
| 5 to 9 Years | 1,310 (5.4%) | 1,257 (5.0%) |
| 10 to 14 Years | 1,810 (7.4%) | 1,255 (5.0%) |
| 15 to 19 Years | 1,546 (6.3%) | 1,031 (4.1%) |
| 20 to 24 Years | 1,154 (4.7%) | 1,551 (6.1%) |
| 25 to 29 Years | 1,721 (7.0%) | 2,015 (8.0%) |
| 30 to 34 Years | 1,990 (8.2%) | 2,000 (7.9%) |
| 35 to 39 Years | 1,915 (7.8%) | 1,979 (7.8%) |
| 40 to 44 Years | 1,645 (6.7%) | 1,805 (7.1%) |
| 45 to 49 Years | 1,937 (7.9%) | 1,565 (6.2%) |
| 50 to 54 Years | 1,638 (6.7%) | 1,724 (6.8%) |
| 55 to 59 Years | 1,822 (7.5%) | 1,469 (5.8%) |
| 60 to 64 Years | 1,334 (5.5%) | 1,735 (6.9%) |
| 65 to 69 Years | 914 (3.7%) | 1,264 (5.0%) |
| 70 to 74 Years | 885 (3.6%) | 1,213 (4.8%) |
| 75 to 79 Years | 593 (2.4%) | 907 (3.6%) |
| 80 to 84 Years | 526 (2.1%) | 741 (2.9%) |
| 85 Years and over | 481 (2.0%) | 871 (3.4%) |
| Total | 24,432 (100.0%) | 25,331 (100.0%) |
Families and Households in North Bethesda
Median Family Size in North Bethesda
The median family size in North Bethesda is 2.99 persons per family, with married-couple families (9,434 | 80.6%) accounting for the largest median family size of 3.05 persons per family. On the other hand, single male/father families (559 | 4.8%) represent the smallest median family size with 2.36 persons per family.

| Family Type | # Families | Family Size |
| Married-Couple | 9,434 (80.6%) | 3.05 |
| Single Male/Father | 559 (4.8%) | 2.36 |
| Single Female/Mother | 1,706 (14.6%) | 2.87 |
| Total Families | 11,699 (100.0%) | 2.99 |
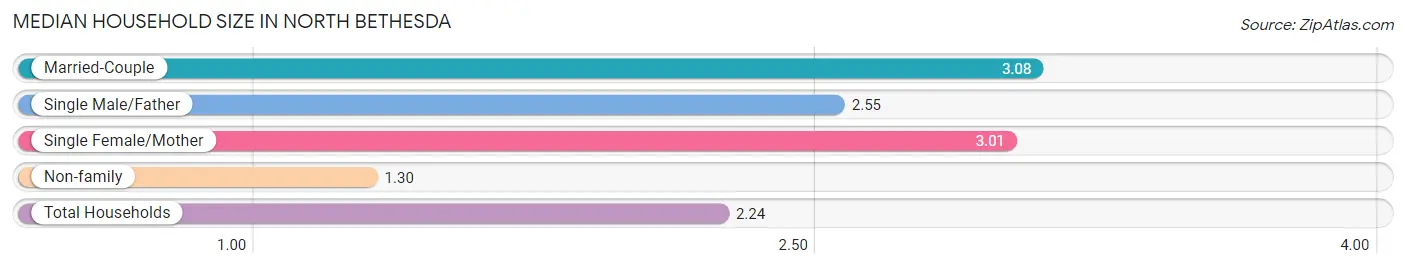
Median Household Size in North Bethesda
The median household size in North Bethesda is 2.24 persons per household, with married-couple households (9,434 | 43.4%) accounting for the largest median household size of 3.08 persons per household. non-family households (10,015 | 46.1%) represent the smallest median household size with 1.30 persons per household.
| Household Type | # Households | Household Size |
| Married-Couple | 9,434 (43.4%) | 3.08 |
| Single Male/Father | 559 (2.6%) | 2.55 |
| Single Female/Mother | 1,706 (7.9%) | 3.01 |
| Non-family | 10,015 (46.1%) | 1.30 |
| Total Households | 21,714 (100.0%) | 2.24 |
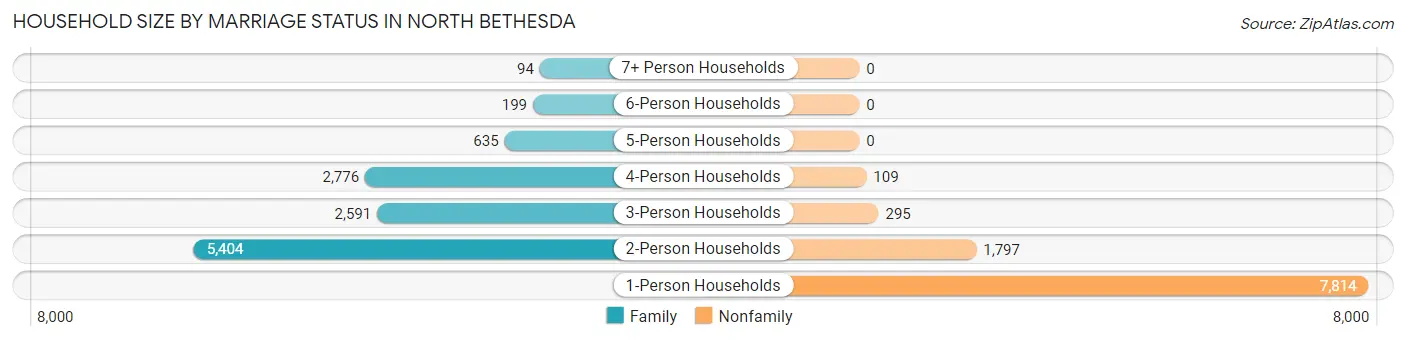
Household Size by Marriage Status in North Bethesda
Out of a total of 21,714 households in North Bethesda, 11,699 (53.9%) are family households, while 10,015 (46.1%) are nonfamily households. The most numerous type of family households are 2-person households, comprising 5,404, and the most common type of nonfamily households are 1-person households, comprising 7,814.
| Household Size | Family Households | Nonfamily Households |
| 1-Person Households | - | 7,814 (36.0%) |
| 2-Person Households | 5,404 (24.9%) | 1,797 (8.3%) |
| 3-Person Households | 2,591 (11.9%) | 295 (1.4%) |
| 4-Person Households | 2,776 (12.8%) | 109 (0.5%) |
| 5-Person Households | 635 (2.9%) | 0 (0.0%) |
| 6-Person Households | 199 (0.9%) | 0 (0.0%) |
| 7+ Person Households | 94 (0.4%) | 0 (0.0%) |
| Total | 11,699 (53.9%) | 10,015 (46.1%) |
Female Fertility in North Bethesda
Fertility by Age in North Bethesda
Average fertility rate in North Bethesda is 42.0 births per 1,000 women. Women in the age bracket of 35 to 50 years have the highest fertility rate with 46.0 births per 1,000 women. Women in the age bracket of 35 to 50 years acount for 51.0% of all women with births.
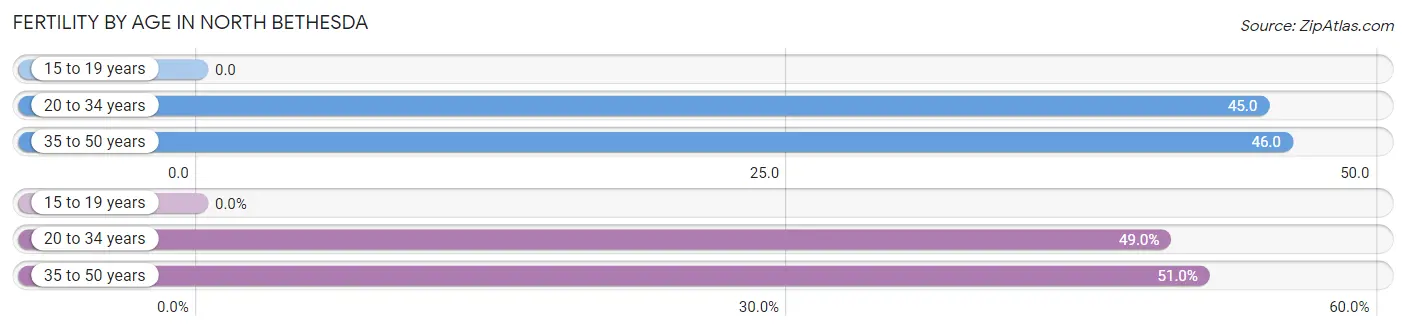
| Age Bracket | Women with Births | Births / 1,000 Women |
| 15 to 19 years | 0 (0.0%) | 0.0 |
| 20 to 34 years | 251 (49.0%) | 45.0 |
| 35 to 50 years | 261 (51.0%) | 46.0 |
| Total | 512 (100.0%) | 42.0 |
Fertility by Age by Marriage Status in North Bethesda
80.3% of women with births (512) in North Bethesda are married. The highest percentage of unmarried women with births falls into 35 to 50 years age bracket with 20.7% of them unmarried at the time of birth, while the lowest percentage of unmarried women with births belong to 20 to 34 years age bracket with 18.7% of them unmarried.
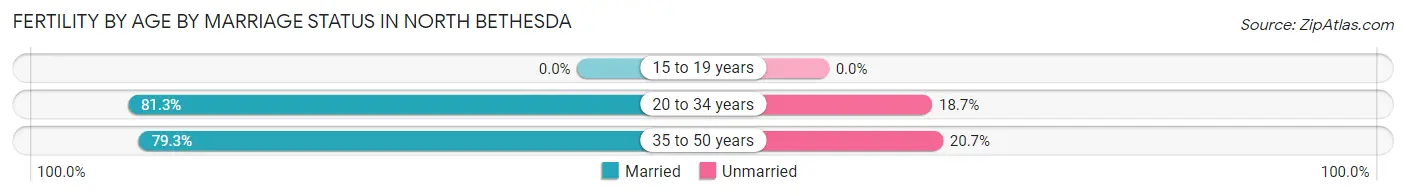
| Age Bracket | Married | Unmarried |
| 15 to 19 years | 0 (0.0%) | 0 (0.0%) |
| 20 to 34 years | 204 (81.3%) | 47 (18.7%) |
| 35 to 50 years | 207 (79.3%) | 54 (20.7%) |
| Total | 411 (80.3%) | 101 (19.7%) |
Fertility by Education in North Bethesda
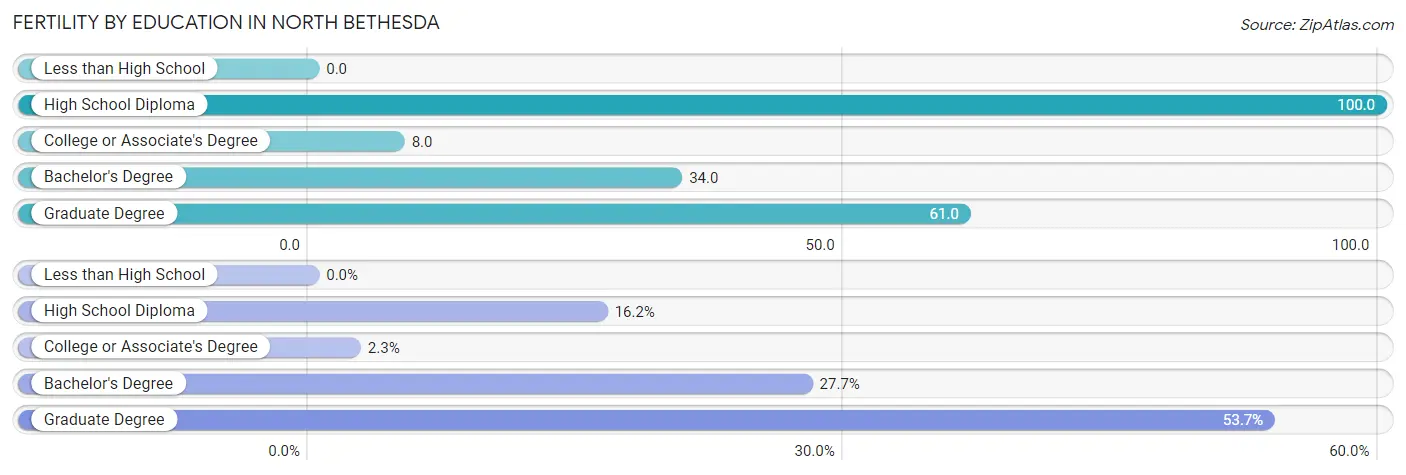
| Educational Attainment | Women with Births | Births / 1,000 Women |
| Less than High School | 0 (0.0%) | 0.0 |
| High School Diploma | 83 (16.2%) | 100.0 |
| College or Associate's Degree | 12 (2.3%) | 8.0 |
| Bachelor's Degree | 142 (27.7%) | 34.0 |
| Graduate Degree | 275 (53.7%) | 61.0 |
| Total | 512 (100.0%) | 42.0 |
Fertility by Education by Marriage Status in North Bethesda
19.7% of women with births in North Bethesda are unmarried. Women with the educational attainment of bachelor's degree are most likely to be married with 100.0% of them married at childbirth, while women with the educational attainment of college or associate's degree are least likely to be married with 100.0% of them unmarried at childbirth.
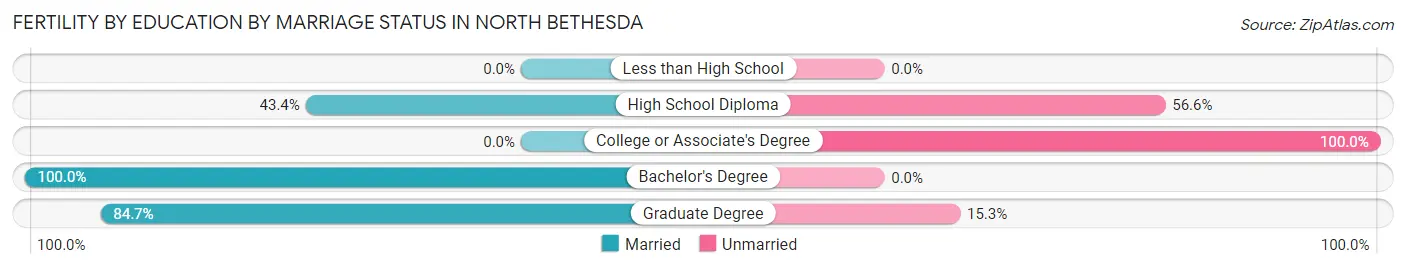
| Educational Attainment | Married | Unmarried |
| Less than High School | 0 (0.0%) | 0 (0.0%) |
| High School Diploma | 36 (43.4%) | 47 (56.6%) |
| College or Associate's Degree | 0 (0.0%) | 12 (100.0%) |
| Bachelor's Degree | 142 (100.0%) | 0 (0.0%) |
| Graduate Degree | 233 (84.7%) | 42 (15.3%) |
| Total | 411 (80.3%) | 101 (19.7%) |
Employment Characteristics in North Bethesda
Employment by Class of Employer in North Bethesda
Among the 27,576 employed individuals in North Bethesda, private company employees (13,524 | 49.0%), federal government employees (5,335 | 19.4%), and not-for-profit organizations (3,965 | 14.4%) make up the most common classes of employment.
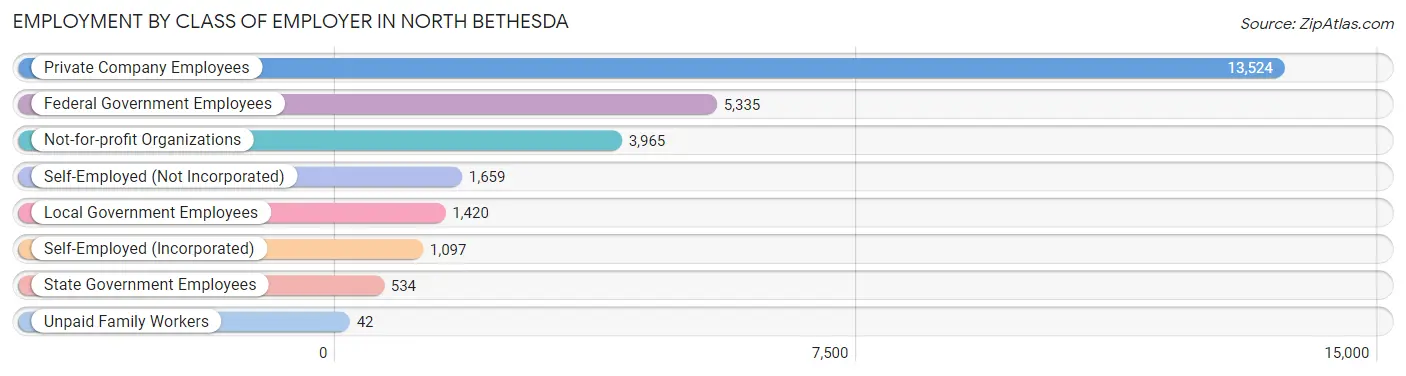
| Employer Class | # Employees | % Employees |
| Private Company Employees | 13,524 | 49.0% |
| Self-Employed (Incorporated) | 1,097 | 4.0% |
| Self-Employed (Not Incorporated) | 1,659 | 6.0% |
| Not-for-profit Organizations | 3,965 | 14.4% |
| Local Government Employees | 1,420 | 5.1% |
| State Government Employees | 534 | 1.9% |
| Federal Government Employees | 5,335 | 19.4% |
| Unpaid Family Workers | 42 | 0.2% |
| Total | 27,576 | 100.0% |
Employment Status by Age in North Bethesda
According to the labor force statistics for North Bethesda, out of the total population over 16 years of age (41,460), 69.6% or 28,856 individuals are in the labor force, with 3.2% or 923 of them unemployed. The age group with the highest labor force participation rate is 45 to 54 years, with 91.5% or 6,281 individuals in the labor force. Within the labor force, the 16 to 19 years age range has the highest percentage of unemployed individuals, with 26.1% or 121 of them being unemployed.
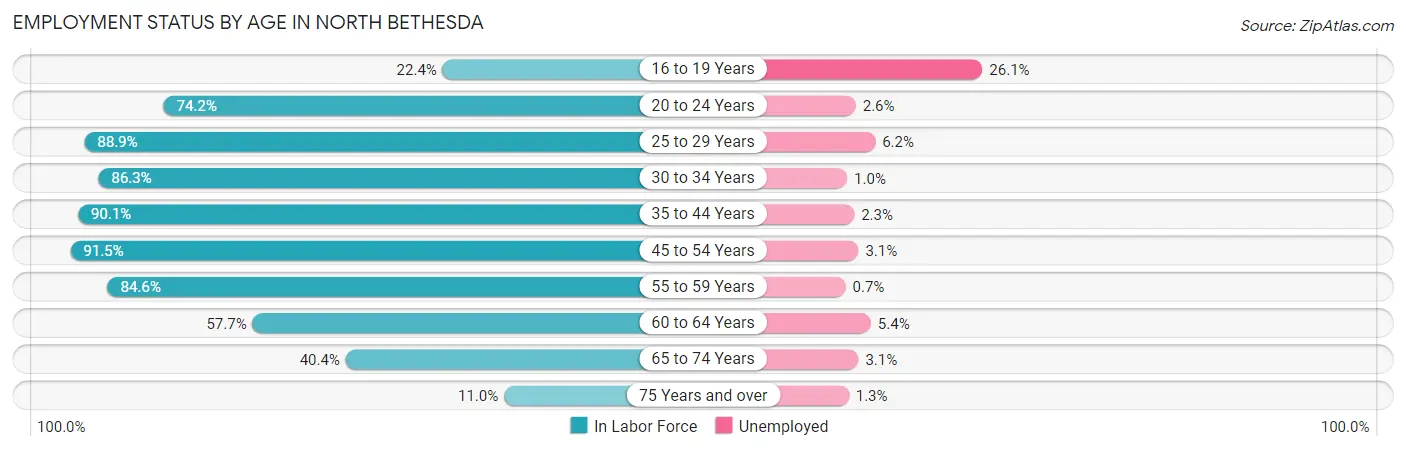
| Age Bracket | In Labor Force | Unemployed |
| 16 to 19 Years | 463 (22.4%) | 121 (26.1%) |
| 20 to 24 Years | 2,007 (74.2%) | 52 (2.6%) |
| 25 to 29 Years | 3,321 (88.9%) | 206 (6.2%) |
| 30 to 34 Years | 3,443 (86.3%) | 34 (1.0%) |
| 35 to 44 Years | 6,617 (90.1%) | 152 (2.3%) |
| 45 to 54 Years | 6,281 (91.5%) | 195 (3.1%) |
| 55 to 59 Years | 2,784 (84.6%) | 19 (0.7%) |
| 60 to 64 Years | 1,771 (57.7%) | 96 (5.4%) |
| 65 to 74 Years | 1,728 (40.4%) | 54 (3.1%) |
| 75 Years and over | 453 (11.0%) | 6 (1.3%) |
| Total | 28,856 (69.6%) | 923 (3.2%) |
Employment Status by Educational Attainment in North Bethesda
According to labor force statistics for North Bethesda, 85.6% of individuals (24,220) out of the total population between 25 and 64 years of age (28,294) are in the labor force, with 2.9% or 702 of them being unemployed. The group with the highest labor force participation rate are those with the educational attainment of bachelor's degree or higher, with 88.4% or 18,427 individuals in the labor force. Within the labor force, individuals with less than high school education have the highest percentage of unemployment, with 5.0% or 74 of them being unemployed.
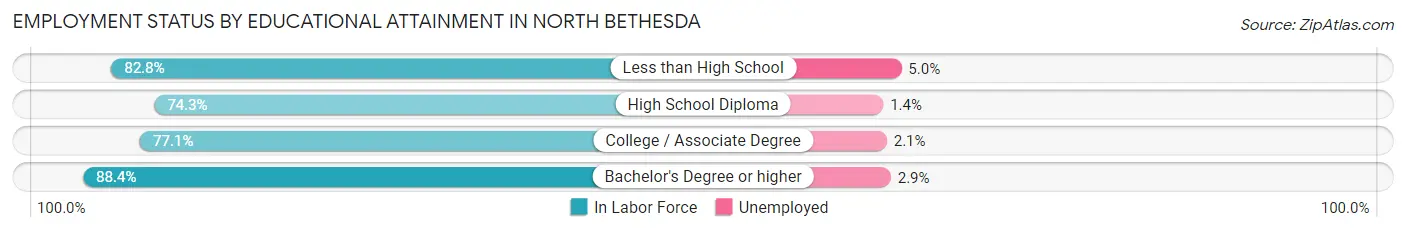
| Educational Attainment | In Labor Force | Unemployed |
| Less than High School | 1,489 (82.8%) | 90 (5.0%) |
| High School Diploma | 1,601 (74.3%) | 30 (1.4%) |
| College / Associate Degree | 2,695 (77.1%) | 73 (2.1%) |
| Bachelor's Degree or higher | 18,427 (88.4%) | 605 (2.9%) |
| Total | 24,220 (85.6%) | 821 (2.9%) |
Employment Occupations by Sex in North Bethesda
Management, Business, Science and Arts Occupations
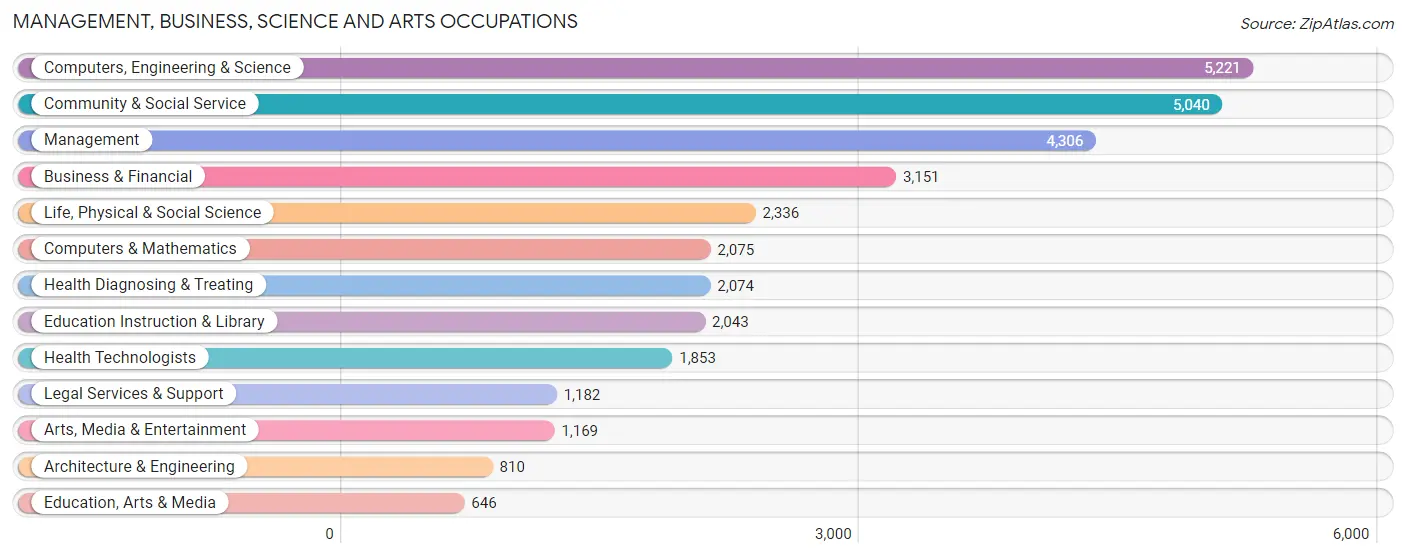
The most common Management, Business, Science and Arts occupations in North Bethesda are Computers, Engineering & Science (5,221 | 18.9%), Community & Social Service (5,040 | 18.3%), Management (4,306 | 15.6%), Business & Financial (3,151 | 11.4%), and Life, Physical & Social Science (2,336 | 8.5%).
Management, Business, Science and Arts Occupations by Sex
Within the Management, Business, Science and Arts occupations in North Bethesda, the most male-oriented occupations are Architecture & Engineering (80.4%), Computers & Mathematics (69.6%), and Computers, Engineering & Science (60.3%), while the most female-oriented occupations are Education, Arts & Media (71.7%), Education Instruction & Library (70.3%), and Health Technologists (69.2%).
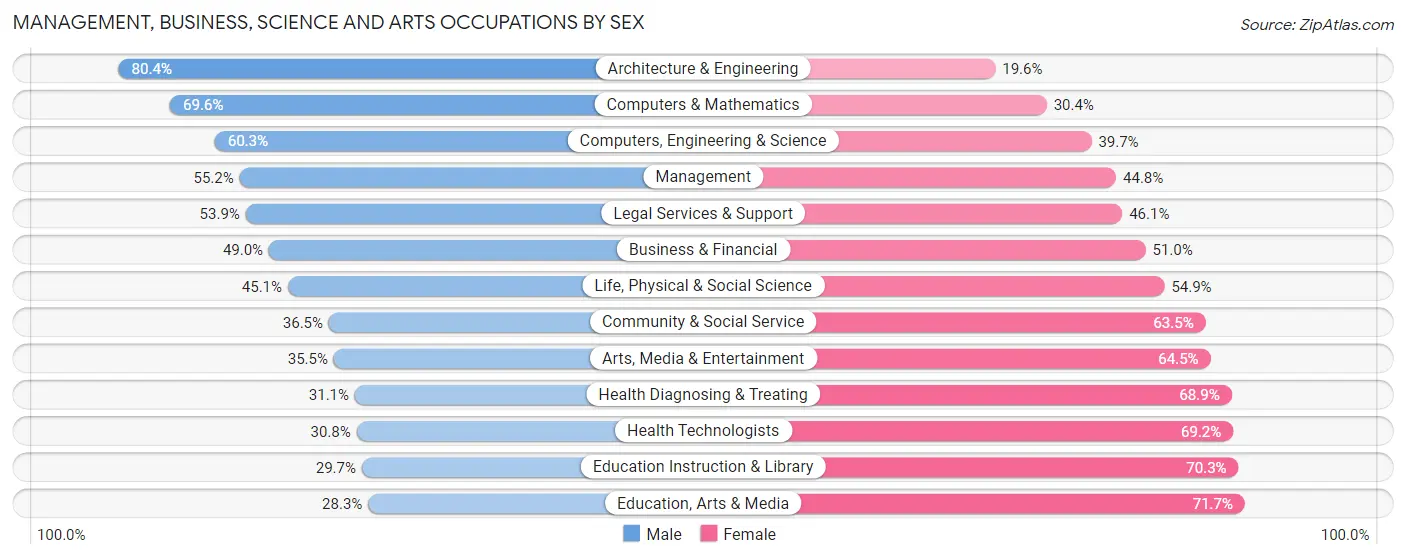
| Occupation | Male | Female |
| Management | 2,375 (55.2%) | 1,931 (44.8%) |
| Business & Financial | 1,545 (49.0%) | 1,606 (51.0%) |
| Computers, Engineering & Science | 3,149 (60.3%) | 2,072 (39.7%) |
| Computers & Mathematics | 1,445 (69.6%) | 630 (30.4%) |
| Architecture & Engineering | 651 (80.4%) | 159 (19.6%) |
| Life, Physical & Social Science | 1,053 (45.1%) | 1,283 (54.9%) |
| Community & Social Service | 1,841 (36.5%) | 3,199 (63.5%) |
| Education, Arts & Media | 183 (28.3%) | 463 (71.7%) |
| Legal Services & Support | 637 (53.9%) | 545 (46.1%) |
| Education Instruction & Library | 606 (29.7%) | 1,437 (70.3%) |
| Arts, Media & Entertainment | 415 (35.5%) | 754 (64.5%) |
| Health Diagnosing & Treating | 645 (31.1%) | 1,429 (68.9%) |
| Health Technologists | 570 (30.8%) | 1,283 (69.2%) |
| Total (Category) | 9,555 (48.3%) | 10,237 (51.7%) |
| Total (Overall) | 14,056 (50.9%) | 13,542 (49.1%) |
Services Occupations
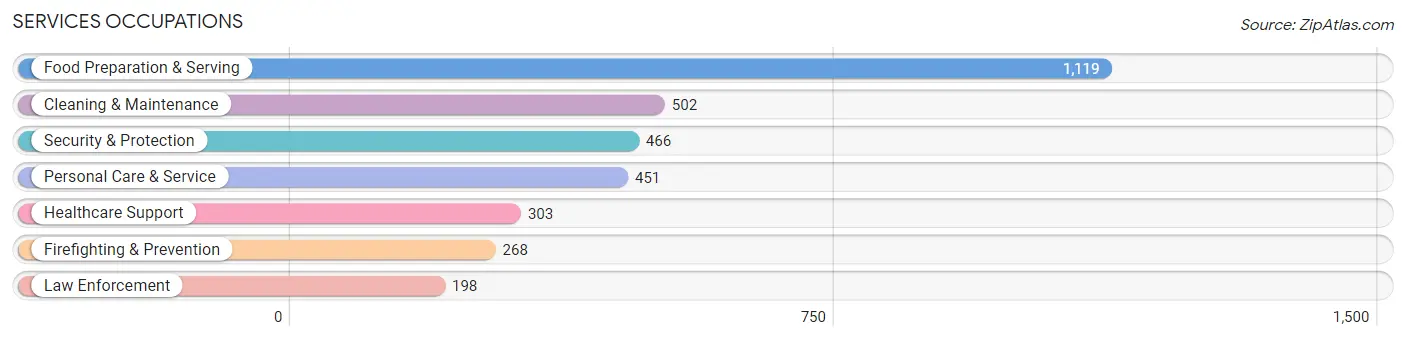
The most common Services occupations in North Bethesda are Food Preparation & Serving (1,119 | 4.1%), Cleaning & Maintenance (502 | 1.8%), Security & Protection (466 | 1.7%), Personal Care & Service (451 | 1.6%), and Healthcare Support (303 | 1.1%).
Services Occupations by Sex
Within the Services occupations in North Bethesda, the most male-oriented occupations are Law Enforcement (71.7%), Security & Protection (63.5%), and Food Preparation & Serving (62.1%), while the most female-oriented occupations are Healthcare Support (77.6%), Cleaning & Maintenance (71.9%), and Personal Care & Service (66.7%).
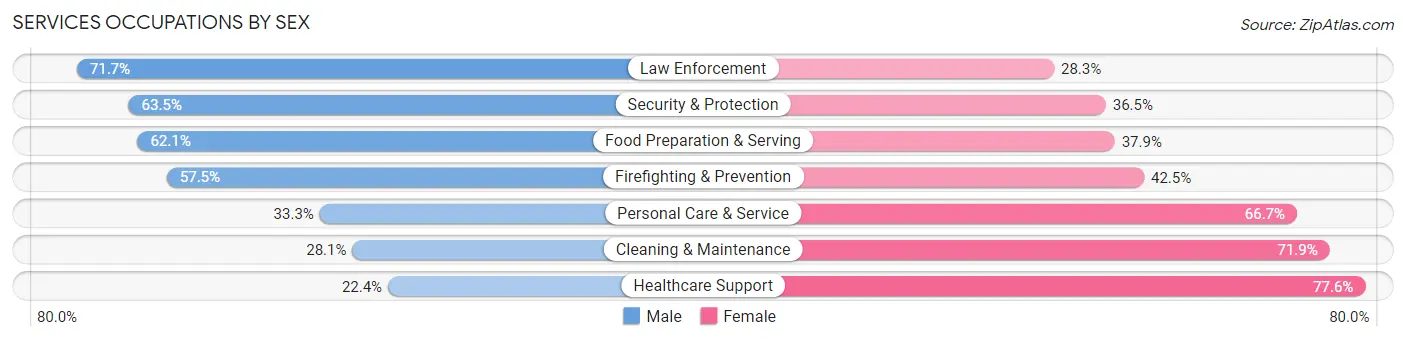
| Occupation | Male | Female |
| Healthcare Support | 68 (22.4%) | 235 (77.6%) |
| Security & Protection | 296 (63.5%) | 170 (36.5%) |
| Firefighting & Prevention | 154 (57.5%) | 114 (42.5%) |
| Law Enforcement | 142 (71.7%) | 56 (28.3%) |
| Food Preparation & Serving | 695 (62.1%) | 424 (37.9%) |
| Cleaning & Maintenance | 141 (28.1%) | 361 (71.9%) |
| Personal Care & Service | 150 (33.3%) | 301 (66.7%) |
| Total (Category) | 1,350 (47.5%) | 1,491 (52.5%) |
| Total (Overall) | 14,056 (50.9%) | 13,542 (49.1%) |
Sales and Office Occupations
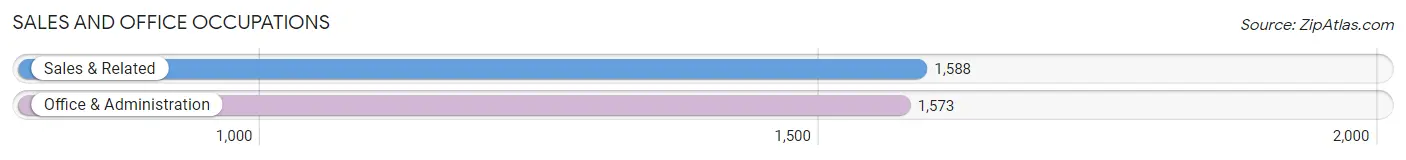
The most common Sales and Office occupations in North Bethesda are Sales & Related (1,588 | 5.8%), and Office & Administration (1,573 | 5.7%).
Sales and Office Occupations by Sex
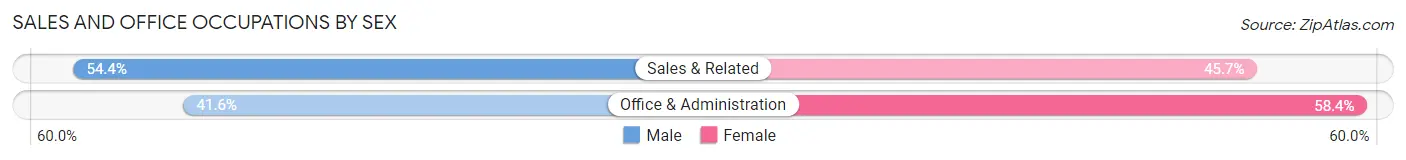
| Occupation | Male | Female |
| Sales & Related | 863 (54.3%) | 725 (45.7%) |
| Office & Administration | 655 (41.6%) | 918 (58.4%) |
| Total (Category) | 1,518 (48.0%) | 1,643 (52.0%) |
| Total (Overall) | 14,056 (50.9%) | 13,542 (49.1%) |
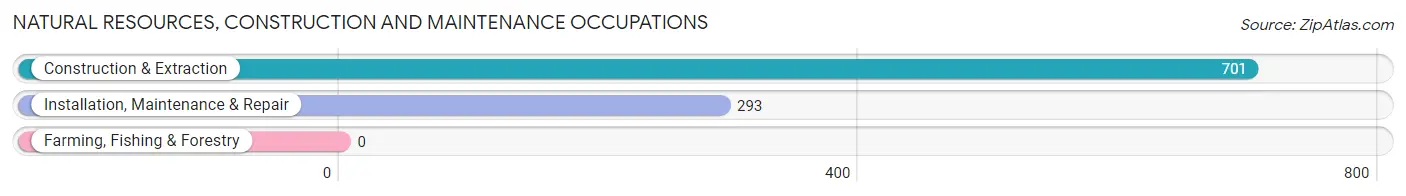
Natural Resources, Construction and Maintenance Occupations
The most common Natural Resources, Construction and Maintenance occupations in North Bethesda are Construction & Extraction (701 | 2.5%), and Installation, Maintenance & Repair (293 | 1.1%).
Natural Resources, Construction and Maintenance Occupations by Sex
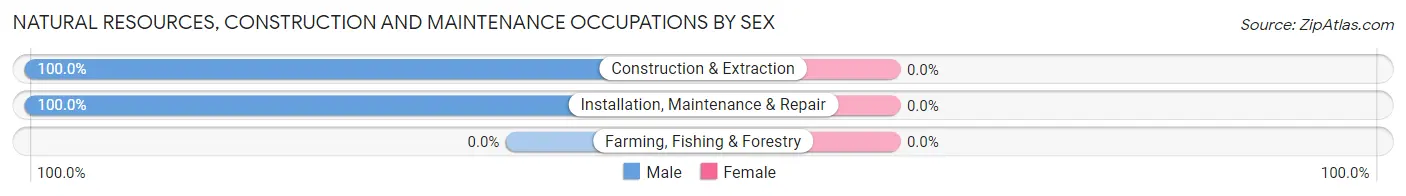
| Occupation | Male | Female |
| Farming, Fishing & Forestry | 0 (0.0%) | 0 (0.0%) |
| Construction & Extraction | 701 (100.0%) | 0 (0.0%) |
| Installation, Maintenance & Repair | 293 (100.0%) | 0 (0.0%) |
| Total (Category) | 994 (100.0%) | 0 (0.0%) |
| Total (Overall) | 14,056 (50.9%) | 13,542 (49.1%) |
Production, Transportation and Moving Occupations
The most common Production, Transportation and Moving occupations in North Bethesda are Production (388 | 1.4%), Transportation (371 | 1.3%), and Material Moving (51 | 0.2%).

Production, Transportation and Moving Occupations by Sex
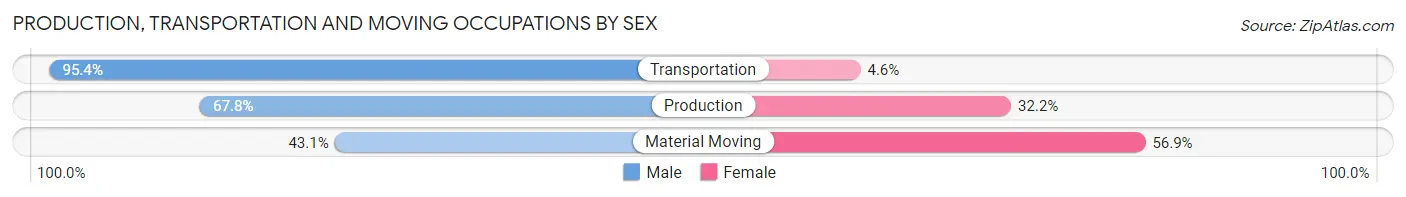
| Occupation | Male | Female |
| Production | 263 (67.8%) | 125 (32.2%) |
| Transportation | 354 (95.4%) | 17 (4.6%) |
| Material Moving | 22 (43.1%) | 29 (56.9%) |
| Total (Category) | 639 (78.9%) | 171 (21.1%) |
| Total (Overall) | 14,056 (50.9%) | 13,542 (49.1%) |
Employment Industries by Sex in North Bethesda
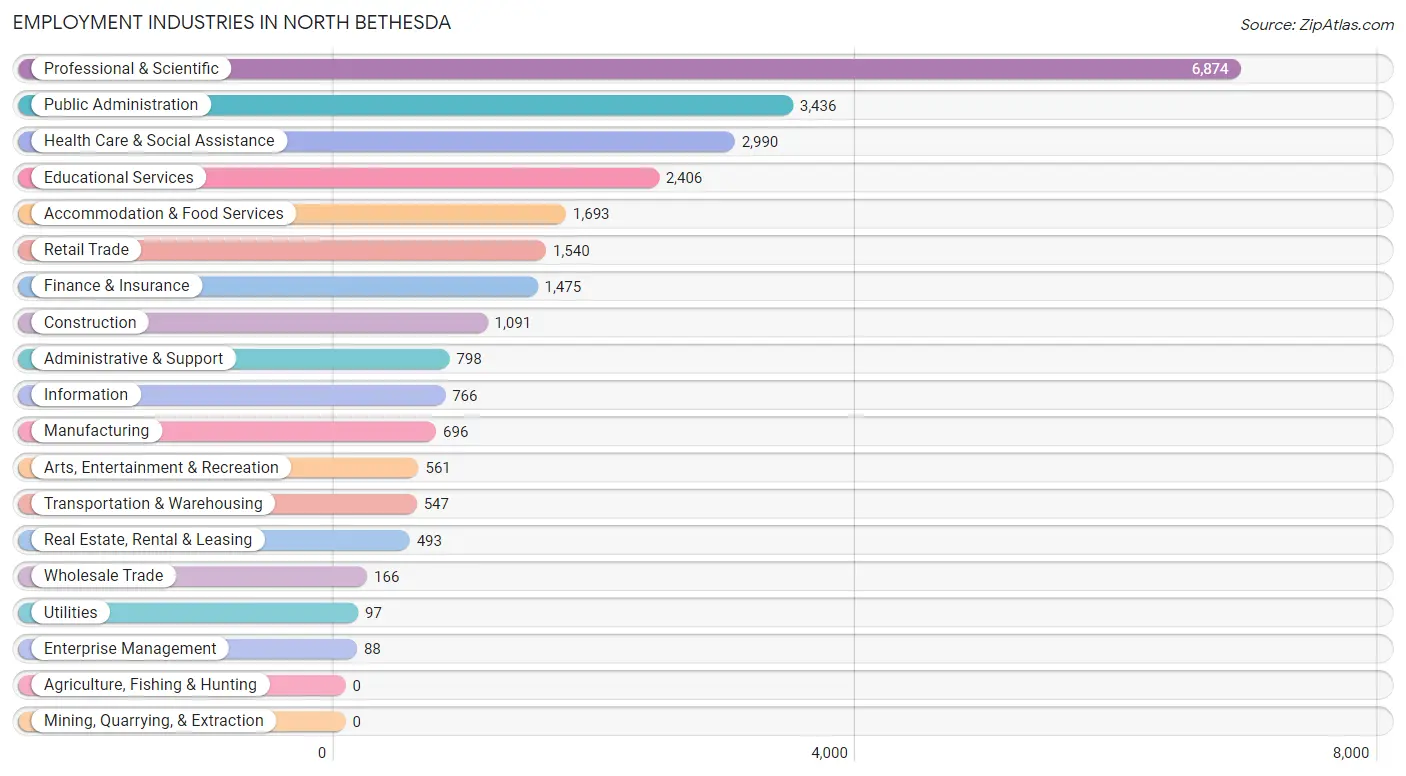
Employment Industries in North Bethesda
The major employment industries in North Bethesda include Professional & Scientific (6,874 | 24.9%), Public Administration (3,436 | 12.4%), Health Care & Social Assistance (2,990 | 10.8%), Educational Services (2,406 | 8.7%), and Accommodation & Food Services (1,693 | 6.1%).
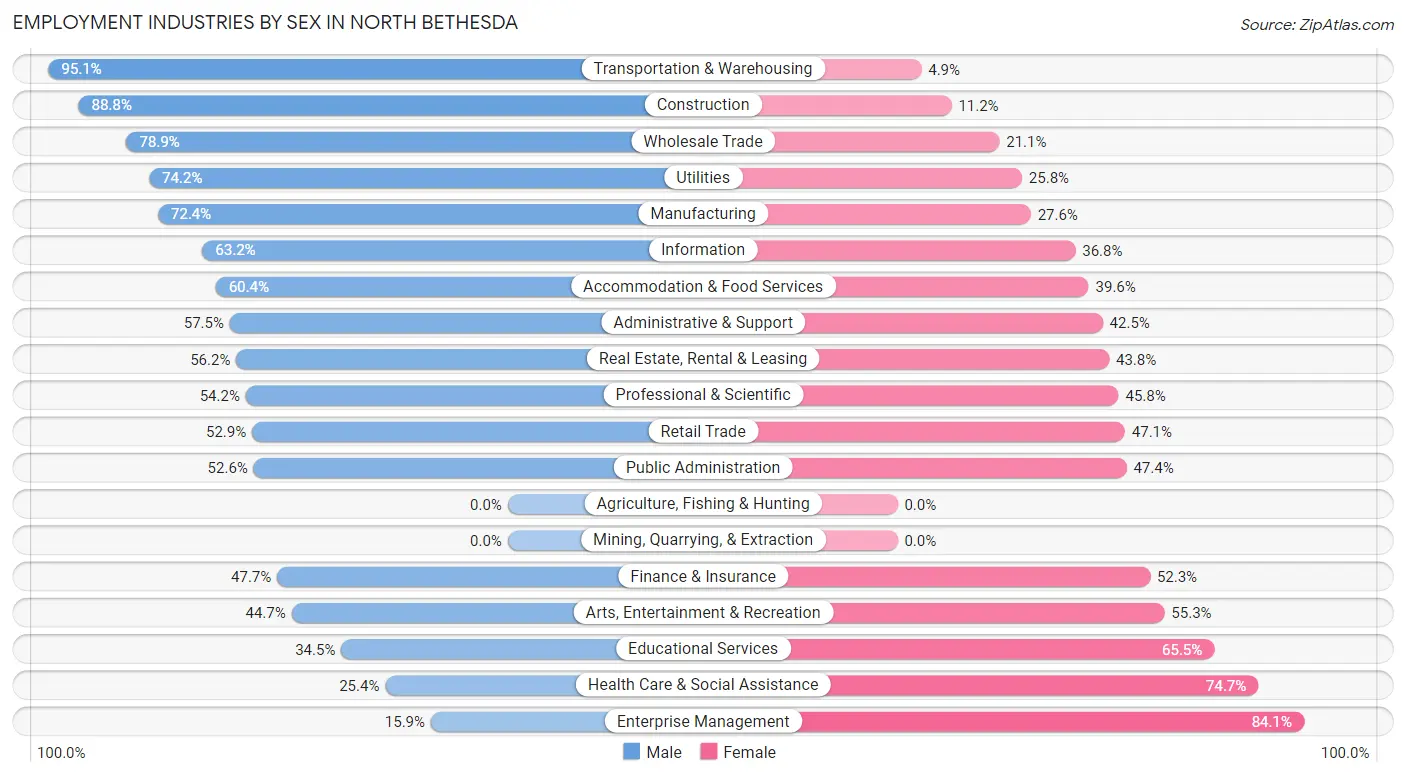
Employment Industries by Sex in North Bethesda
The North Bethesda industries that see more men than women are Transportation & Warehousing (95.1%), Construction (88.8%), and Wholesale Trade (78.9%), whereas the industries that tend to have a higher number of women are Enterprise Management (84.1%), Health Care & Social Assistance (74.7%), and Educational Services (65.5%).
| Industry | Male | Female |
| Agriculture, Fishing & Hunting | 0 (0.0%) | 0 (0.0%) |
| Mining, Quarrying, & Extraction | 0 (0.0%) | 0 (0.0%) |
| Construction | 969 (88.8%) | 122 (11.2%) |
| Manufacturing | 504 (72.4%) | 192 (27.6%) |
| Wholesale Trade | 131 (78.9%) | 35 (21.1%) |
| Retail Trade | 815 (52.9%) | 725 (47.1%) |
| Transportation & Warehousing | 520 (95.1%) | 27 (4.9%) |
| Utilities | 72 (74.2%) | 25 (25.8%) |
| Information | 484 (63.2%) | 282 (36.8%) |
| Finance & Insurance | 704 (47.7%) | 771 (52.3%) |
| Real Estate, Rental & Leasing | 277 (56.2%) | 216 (43.8%) |
| Professional & Scientific | 3,728 (54.2%) | 3,146 (45.8%) |
| Enterprise Management | 14 (15.9%) | 74 (84.1%) |
| Administrative & Support | 459 (57.5%) | 339 (42.5%) |
| Educational Services | 829 (34.5%) | 1,577 (65.5%) |
| Health Care & Social Assistance | 758 (25.4%) | 2,232 (74.7%) |
| Arts, Entertainment & Recreation | 251 (44.7%) | 310 (55.3%) |
| Accommodation & Food Services | 1,023 (60.4%) | 670 (39.6%) |
| Public Administration | 1,807 (52.6%) | 1,629 (47.4%) |
| Total | 14,056 (50.9%) | 13,542 (49.1%) |
Education in North Bethesda
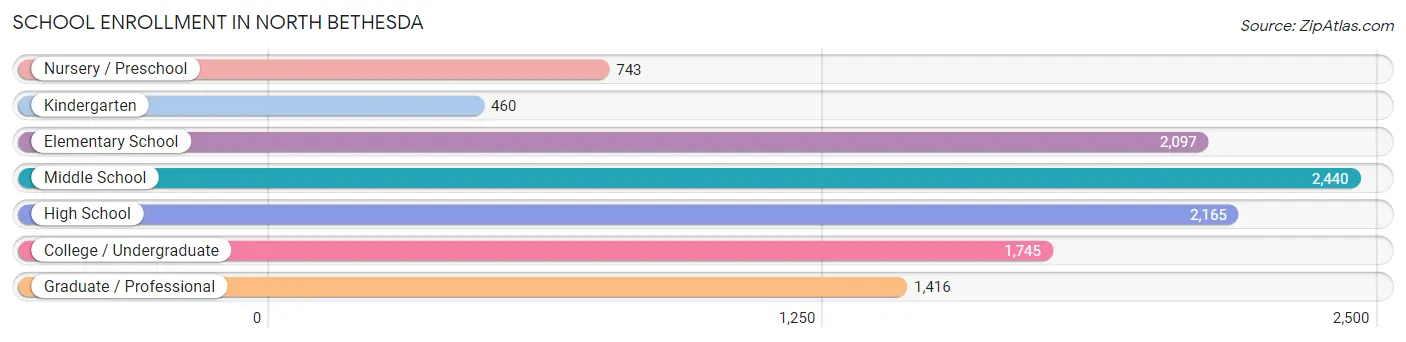
School Enrollment in North Bethesda
The most common levels of schooling among the 11,066 students in North Bethesda are middle school (2,440 | 22.1%), high school (2,165 | 19.6%), and elementary school (2,097 | 19.0%).
| School Level | # Students | % Students |
| Nursery / Preschool | 743 | 6.7% |
| Kindergarten | 460 | 4.2% |
| Elementary School | 2,097 | 19.0% |
| Middle School | 2,440 | 22.1% |
| High School | 2,165 | 19.6% |
| College / Undergraduate | 1,745 | 15.8% |
| Graduate / Professional | 1,416 | 12.8% |
| Total | 11,066 | 100.0% |
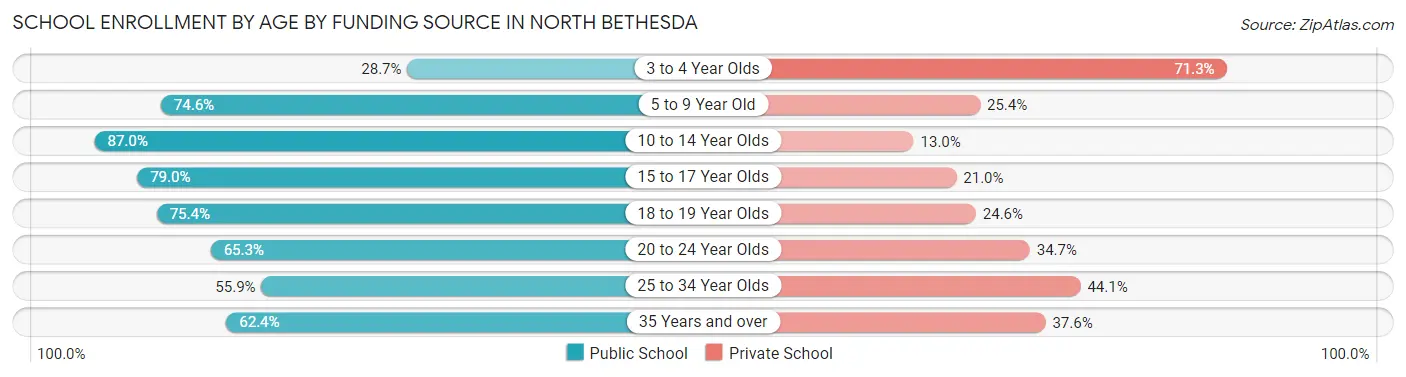
School Enrollment by Age by Funding Source in North Bethesda
Out of a total of 11,066 students who are enrolled in schools in North Bethesda, 2,977 (26.9%) attend a private institution, while the remaining 8,089 (73.1%) are enrolled in public schools. The age group of 3 to 4 year olds has the highest likelihood of being enrolled in private schools, with 365 (71.3% in the age bracket) enrolled. Conversely, the age group of 10 to 14 year olds has the lowest likelihood of being enrolled in a private school, with 2,556 (87.0% in the age bracket) attending a public institution.
| Age Bracket | Public School | Private School |
| 3 to 4 Year Olds | 147 (28.7%) | 365 (71.3%) |
| 5 to 9 Year Old | 1,797 (74.6%) | 612 (25.4%) |
| 10 to 14 Year Olds | 2,556 (87.0%) | 383 (13.0%) |
| 15 to 17 Year Olds | 1,246 (79.0%) | 331 (21.0%) |
| 18 to 19 Year Olds | 695 (75.4%) | 227 (24.6%) |
| 20 to 24 Year Olds | 603 (65.3%) | 320 (34.7%) |
| 25 to 34 Year Olds | 612 (55.9%) | 483 (44.1%) |
| 35 Years and over | 430 (62.4%) | 259 (37.6%) |
| Total | 8,089 (73.1%) | 2,977 (26.9%) |
Educational Attainment by Field of Study in North Bethesda
Social sciences (4,636 | 15.8%), business (3,952 | 13.5%), bio, nature & agricultural (2,855 | 9.7%), engineering (2,821 | 9.6%), and science & technology (2,049 | 7.0%) are the most common fields of study among 29,328 individuals in North Bethesda who have obtained a bachelor's degree or higher.
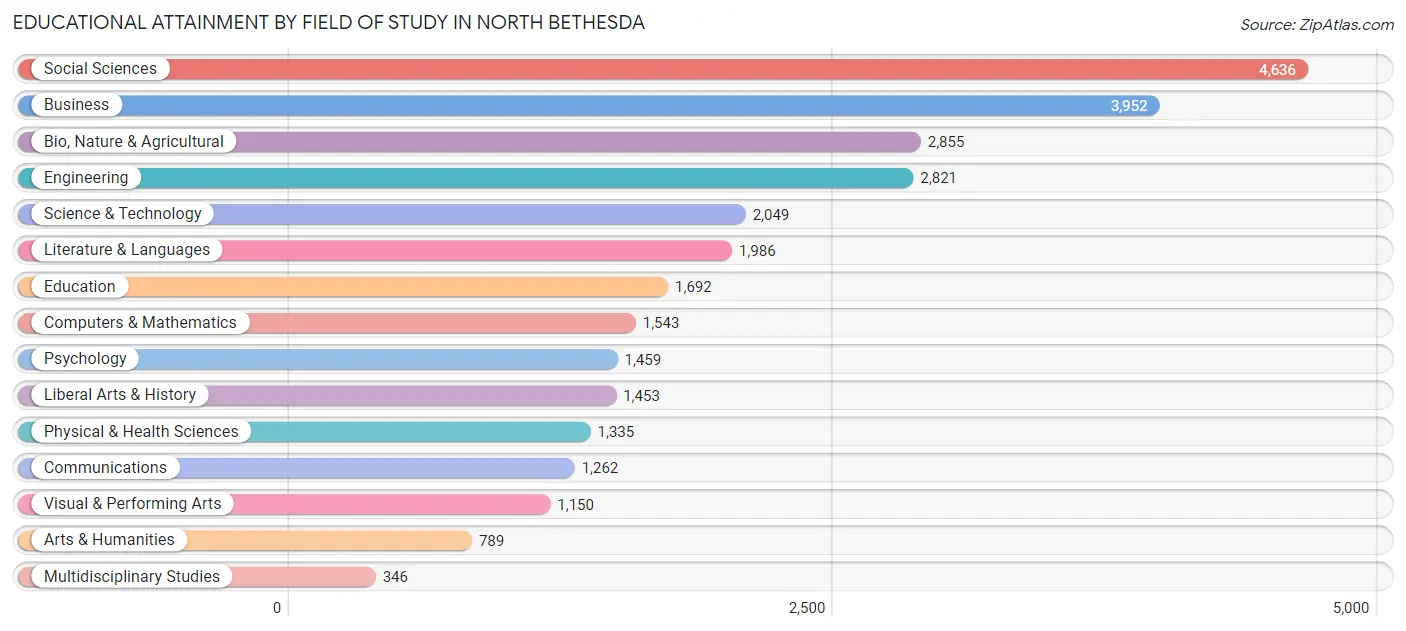
| Field of Study | # Graduates | % Graduates |
| Computers & Mathematics | 1,543 | 5.3% |
| Bio, Nature & Agricultural | 2,855 | 9.7% |
| Physical & Health Sciences | 1,335 | 4.5% |
| Psychology | 1,459 | 5.0% |
| Social Sciences | 4,636 | 15.8% |
| Engineering | 2,821 | 9.6% |
| Multidisciplinary Studies | 346 | 1.2% |
| Science & Technology | 2,049 | 7.0% |
| Business | 3,952 | 13.5% |
| Education | 1,692 | 5.8% |
| Literature & Languages | 1,986 | 6.8% |
| Liberal Arts & History | 1,453 | 5.0% |
| Visual & Performing Arts | 1,150 | 3.9% |
| Communications | 1,262 | 4.3% |
| Arts & Humanities | 789 | 2.7% |
| Total | 29,328 | 100.0% |
Transportation & Commute in North Bethesda
Vehicle Availability by Sex in North Bethesda
The most prevalent vehicle ownership categories in North Bethesda are males with 2 vehicles (5,941, accounting for 42.1%) and females with 2 vehicles (5,784, making up 44.2%).
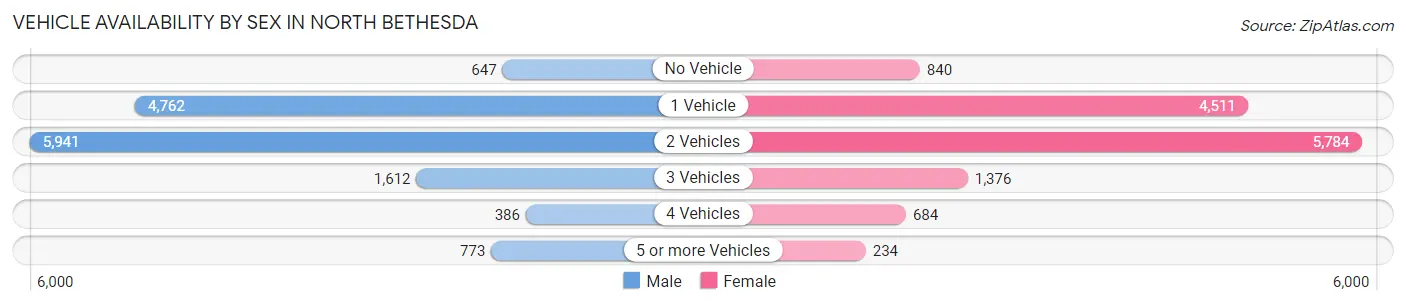
| Vehicles Available | Male | Female |
| No Vehicle | 647 (4.6%) | 840 (6.3%) |
| 1 Vehicle | 4,762 (33.7%) | 4,511 (33.6%) |
| 2 Vehicles | 5,941 (42.1%) | 5,784 (43.1%) |
| 3 Vehicles | 1,612 (11.4%) | 1,376 (10.2%) |
| 4 Vehicles | 386 (2.7%) | 684 (5.1%) |
| 5 or more Vehicles | 773 (5.5%) | 234 (1.7%) |
| Total | 14,121 (100.0%) | 13,429 (100.0%) |
Commute Time in North Bethesda
The most frequently occuring commute durations in North Bethesda are 15 to 19 minutes (2,996 commuters, 15.3%), 30 to 34 minutes (2,650 commuters, 13.5%), and 45 to 59 minutes (2,557 commuters, 13.0%).
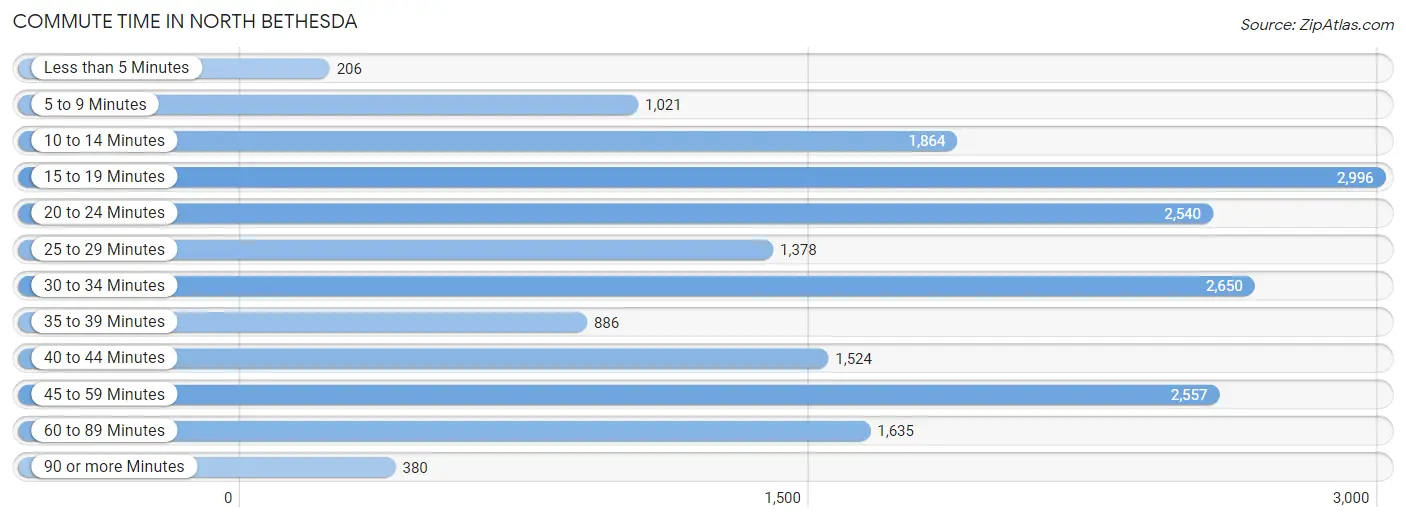
| Commute Time | # Commuters | % Commuters |
| Less than 5 Minutes | 206 | 1.1% |
| 5 to 9 Minutes | 1,021 | 5.2% |
| 10 to 14 Minutes | 1,864 | 9.5% |
| 15 to 19 Minutes | 2,996 | 15.3% |
| 20 to 24 Minutes | 2,540 | 12.9% |
| 25 to 29 Minutes | 1,378 | 7.0% |
| 30 to 34 Minutes | 2,650 | 13.5% |
| 35 to 39 Minutes | 886 | 4.5% |
| 40 to 44 Minutes | 1,524 | 7.8% |
| 45 to 59 Minutes | 2,557 | 13.0% |
| 60 to 89 Minutes | 1,635 | 8.3% |
| 90 or more Minutes | 380 | 1.9% |
Commute Time by Sex in North Bethesda
The most common commute times in North Bethesda are 30 to 34 minutes (1,494 commuters, 14.9%) for males and 15 to 19 minutes (1,613 commuters, 16.8%) for females.
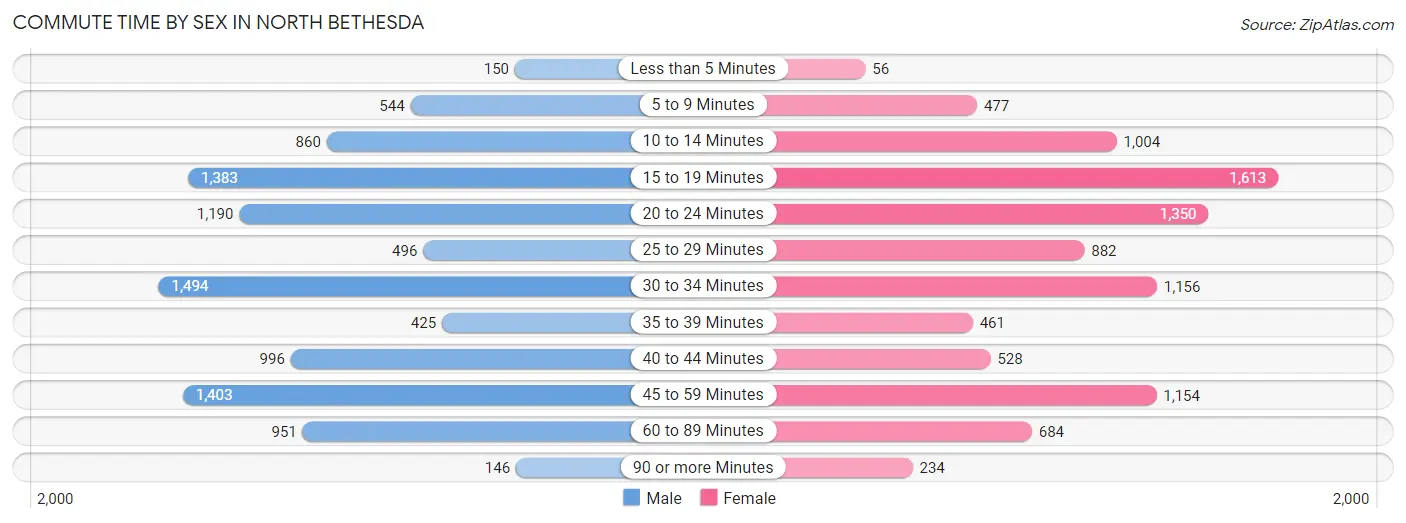
| Commute Time | Male | Female |
| Less than 5 Minutes | 150 (1.5%) | 56 (0.6%) |
| 5 to 9 Minutes | 544 (5.4%) | 477 (5.0%) |
| 10 to 14 Minutes | 860 (8.6%) | 1,004 (10.5%) |
| 15 to 19 Minutes | 1,383 (13.8%) | 1,613 (16.8%) |
| 20 to 24 Minutes | 1,190 (11.8%) | 1,350 (14.1%) |
| 25 to 29 Minutes | 496 (4.9%) | 882 (9.2%) |
| 30 to 34 Minutes | 1,494 (14.9%) | 1,156 (12.0%) |
| 35 to 39 Minutes | 425 (4.2%) | 461 (4.8%) |
| 40 to 44 Minutes | 996 (9.9%) | 528 (5.5%) |
| 45 to 59 Minutes | 1,403 (14.0%) | 1,154 (12.0%) |
| 60 to 89 Minutes | 951 (9.5%) | 684 (7.1%) |
| 90 or more Minutes | 146 (1.5%) | 234 (2.4%) |
Time of Departure to Work by Sex in North Bethesda
The most frequent times of departure to work in North Bethesda are 8:00 AM to 8:29 AM (1,759, 17.5%) for males and 8:00 AM to 8:29 AM (1,501, 15.6%) for females.
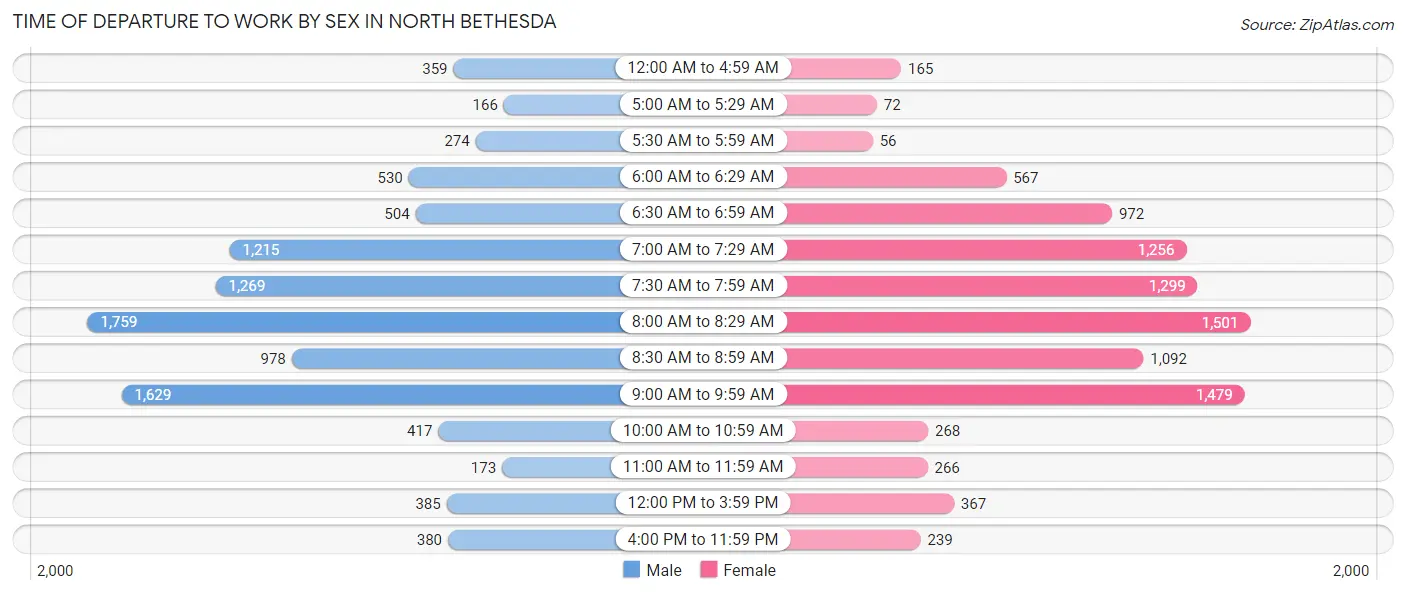
| Time of Departure | Male | Female |
| 12:00 AM to 4:59 AM | 359 (3.6%) | 165 (1.7%) |
| 5:00 AM to 5:29 AM | 166 (1.7%) | 72 (0.7%) |
| 5:30 AM to 5:59 AM | 274 (2.7%) | 56 (0.6%) |
| 6:00 AM to 6:29 AM | 530 (5.3%) | 567 (5.9%) |
| 6:30 AM to 6:59 AM | 504 (5.0%) | 972 (10.1%) |
| 7:00 AM to 7:29 AM | 1,215 (12.1%) | 1,256 (13.1%) |
| 7:30 AM to 7:59 AM | 1,269 (12.6%) | 1,299 (13.5%) |
| 8:00 AM to 8:29 AM | 1,759 (17.5%) | 1,501 (15.6%) |
| 8:30 AM to 8:59 AM | 978 (9.7%) | 1,092 (11.4%) |
| 9:00 AM to 9:59 AM | 1,629 (16.2%) | 1,479 (15.4%) |
| 10:00 AM to 10:59 AM | 417 (4.2%) | 268 (2.8%) |
| 11:00 AM to 11:59 AM | 173 (1.7%) | 266 (2.8%) |
| 12:00 PM to 3:59 PM | 385 (3.8%) | 367 (3.8%) |
| 4:00 PM to 11:59 PM | 380 (3.8%) | 239 (2.5%) |
| Total | 10,038 (100.0%) | 9,599 (100.0%) |
Housing Occupancy in North Bethesda
Occupancy by Ownership in North Bethesda
Of the total 21,714 dwellings in North Bethesda, owner-occupied units account for 10,685 (49.2%), while renter-occupied units make up 11,029 (50.8%).
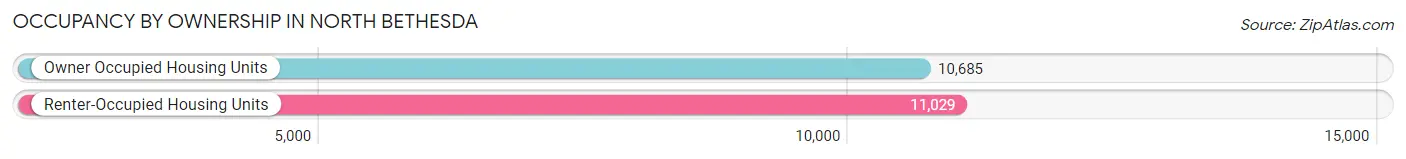
| Occupancy | # Housing Units | % Housing Units |
| Owner Occupied Housing Units | 10,685 | 49.2% |
| Renter-Occupied Housing Units | 11,029 | 50.8% |
| Total Occupied Housing Units | 21,714 | 100.0% |
Occupancy by Household Size in North Bethesda
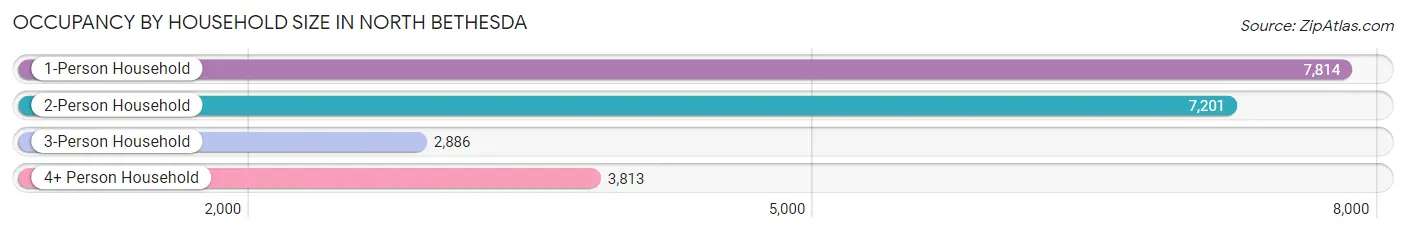
| Household Size | # Housing Units | % Housing Units |
| 1-Person Household | 7,814 | 36.0% |
| 2-Person Household | 7,201 | 33.2% |
| 3-Person Household | 2,886 | 13.3% |
| 4+ Person Household | 3,813 | 17.6% |
| Total Housing Units | 21,714 | 100.0% |
Occupancy by Ownership by Household Size in North Bethesda
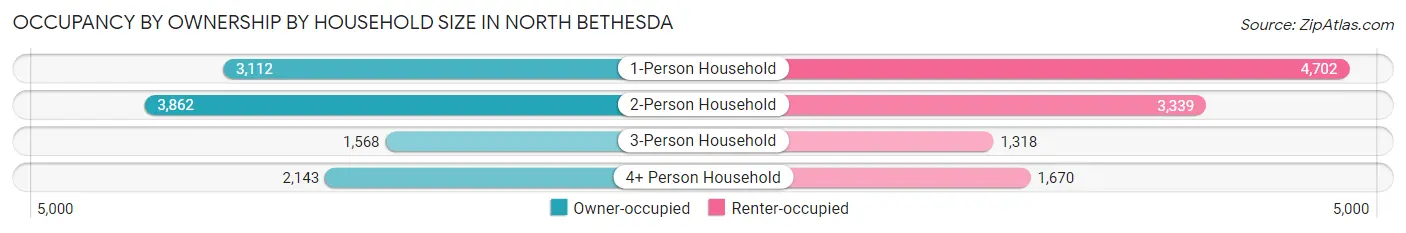
| Household Size | Owner-occupied | Renter-occupied |
| 1-Person Household | 3,112 (39.8%) | 4,702 (60.2%) |
| 2-Person Household | 3,862 (53.6%) | 3,339 (46.4%) |
| 3-Person Household | 1,568 (54.3%) | 1,318 (45.7%) |
| 4+ Person Household | 2,143 (56.2%) | 1,670 (43.8%) |
| Total Housing Units | 10,685 (49.2%) | 11,029 (50.8%) |
Occupancy by Educational Attainment in North Bethesda
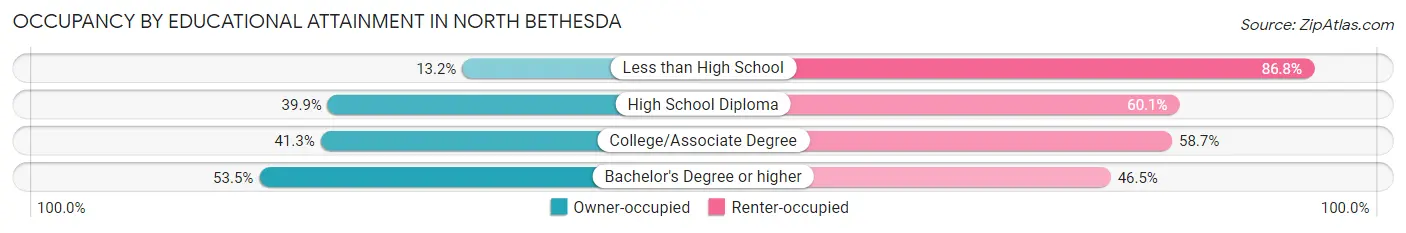
| Household Size | Owner-occupied | Renter-occupied |
| Less than High School | 152 (13.2%) | 996 (86.8%) |
| High School Diploma | 429 (39.9%) | 646 (60.1%) |
| College/Associate Degree | 1,102 (41.3%) | 1,564 (58.7%) |
| Bachelor's Degree or higher | 9,002 (53.5%) | 7,823 (46.5%) |
Occupancy by Age of Householder in North Bethesda
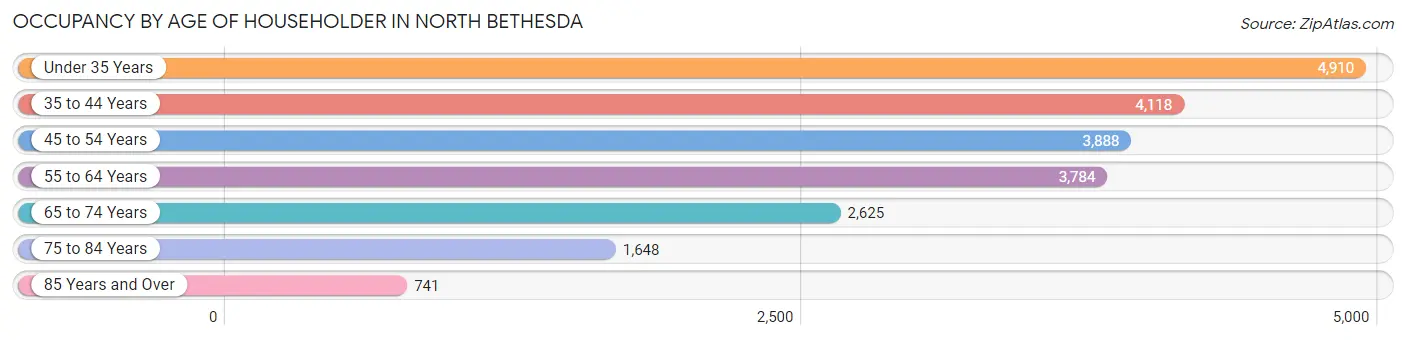
| Age Bracket | # Households | % Households |
| Under 35 Years | 4,910 | 22.6% |
| 35 to 44 Years | 4,118 | 19.0% |
| 45 to 54 Years | 3,888 | 17.9% |
| 55 to 64 Years | 3,784 | 17.4% |
| 65 to 74 Years | 2,625 | 12.1% |
| 75 to 84 Years | 1,648 | 7.6% |
| 85 Years and Over | 741 | 3.4% |
| Total | 21,714 | 100.0% |
Housing Finances in North Bethesda
Median Income by Occupancy in North Bethesda
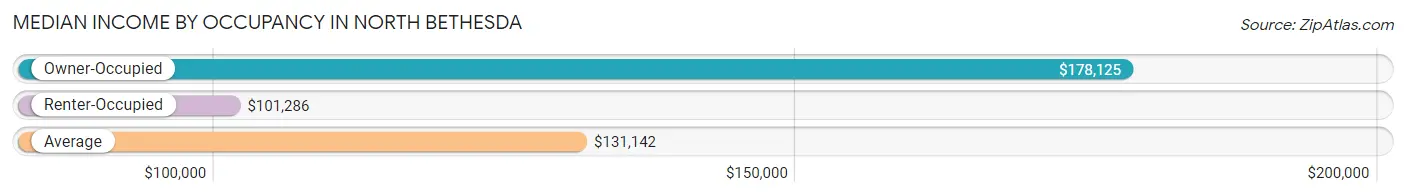
| Occupancy Type | # Households | Median Income |
| Owner-Occupied | 10,685 (49.2%) | $178,125 |
| Renter-Occupied | 11,029 (50.8%) | $101,286 |
| Average | 21,714 (100.0%) | $131,142 |
Occupancy by Householder Income Bracket in North Bethesda
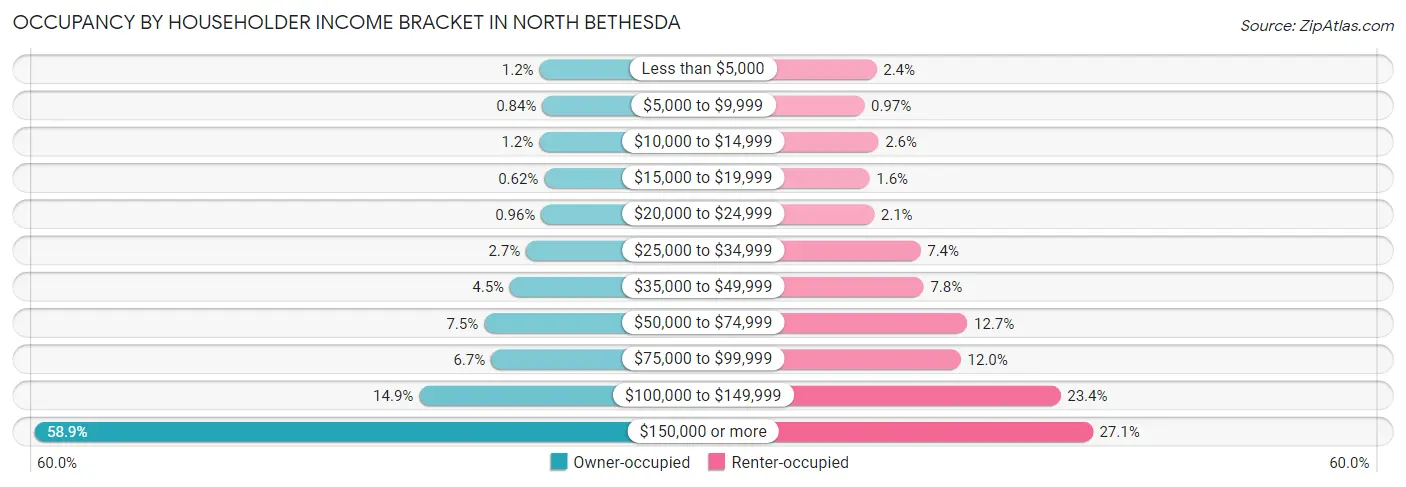
| Income Bracket | Owner-occupied | Renter-occupied |
| Less than $5,000 | 124 (1.2%) | 261 (2.4%) |
| $5,000 to $9,999 | 90 (0.8%) | 107 (1.0%) |
| $10,000 to $14,999 | 128 (1.2%) | 287 (2.6%) |
| $15,000 to $19,999 | 66 (0.6%) | 174 (1.6%) |
| $20,000 to $24,999 | 103 (1.0%) | 230 (2.1%) |
| $25,000 to $34,999 | 287 (2.7%) | 816 (7.4%) |
| $35,000 to $49,999 | 484 (4.5%) | 856 (7.8%) |
| $50,000 to $74,999 | 800 (7.5%) | 1,405 (12.7%) |
| $75,000 to $99,999 | 715 (6.7%) | 1,325 (12.0%) |
| $100,000 to $149,999 | 1,593 (14.9%) | 2,581 (23.4%) |
| $150,000 or more | 6,295 (58.9%) | 2,987 (27.1%) |
| Total | 10,685 (100.0%) | 11,029 (100.0%) |
Monthly Housing Cost Tiers in North Bethesda
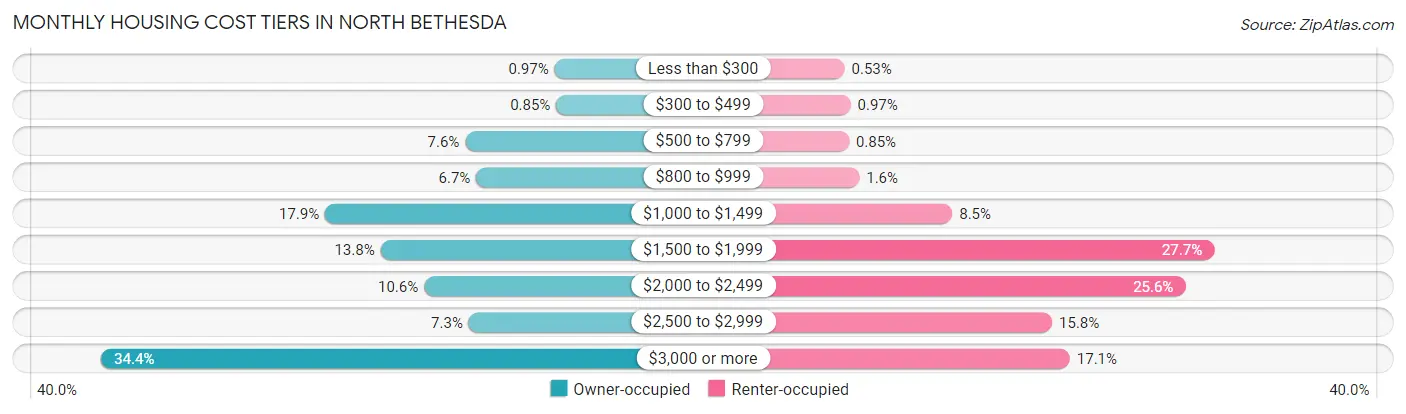
| Monthly Cost | Owner-occupied | Renter-occupied |
| Less than $300 | 104 (1.0%) | 58 (0.5%) |
| $300 to $499 | 91 (0.9%) | 107 (1.0%) |
| $500 to $799 | 807 (7.5%) | 94 (0.9%) |
| $800 to $999 | 720 (6.7%) | 178 (1.6%) |
| $1,000 to $1,499 | 1,909 (17.9%) | 933 (8.5%) |
| $1,500 to $1,999 | 1,473 (13.8%) | 3,058 (27.7%) |
| $2,000 to $2,499 | 1,131 (10.6%) | 2,824 (25.6%) |
| $2,500 to $2,999 | 779 (7.3%) | 1,744 (15.8%) |
| $3,000 or more | 3,671 (34.4%) | 1,888 (17.1%) |
| Total | 10,685 (100.0%) | 11,029 (100.0%) |
Physical Housing Characteristics in North Bethesda
Housing Structures in North Bethesda
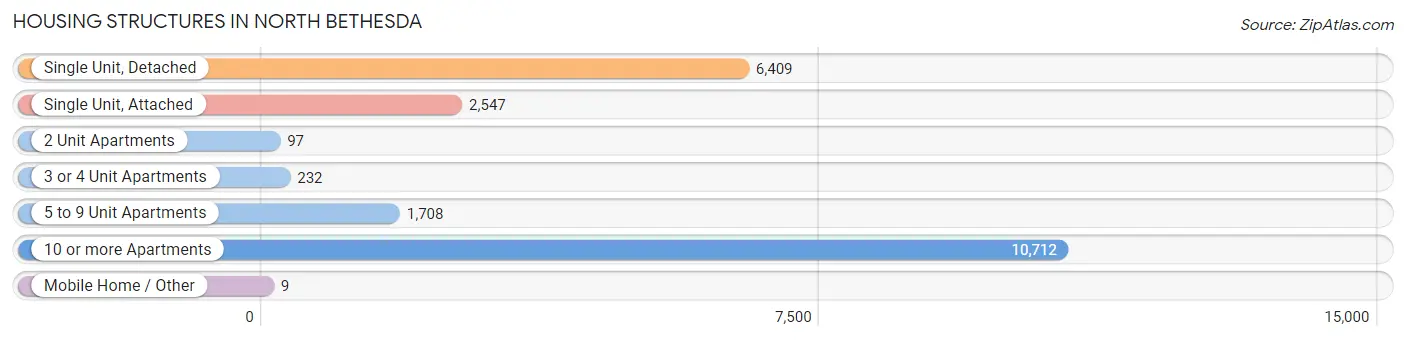
| Structure Type | # Housing Units | % Housing Units |
| Single Unit, Detached | 6,409 | 29.5% |
| Single Unit, Attached | 2,547 | 11.7% |
| 2 Unit Apartments | 97 | 0.4% |
| 3 or 4 Unit Apartments | 232 | 1.1% |
| 5 to 9 Unit Apartments | 1,708 | 7.9% |
| 10 or more Apartments | 10,712 | 49.3% |
| Mobile Home / Other | 9 | 0.0% |
| Total | 21,714 | 100.0% |
Housing Structures by Occupancy in North Bethesda
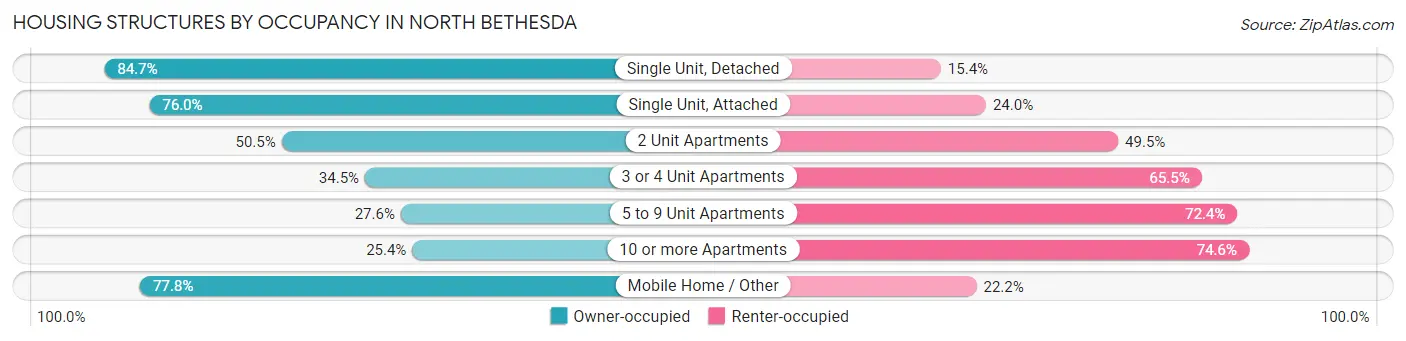
| Structure Type | Owner-occupied | Renter-occupied |
| Single Unit, Detached | 5,425 (84.7%) | 984 (15.3%) |
| Single Unit, Attached | 1,935 (76.0%) | 612 (24.0%) |
| 2 Unit Apartments | 49 (50.5%) | 48 (49.5%) |
| 3 or 4 Unit Apartments | 80 (34.5%) | 152 (65.5%) |
| 5 to 9 Unit Apartments | 471 (27.6%) | 1,237 (72.4%) |
| 10 or more Apartments | 2,718 (25.4%) | 7,994 (74.6%) |
| Mobile Home / Other | 7 (77.8%) | 2 (22.2%) |
| Total | 10,685 (49.2%) | 11,029 (50.8%) |
Housing Structures by Number of Rooms in North Bethesda
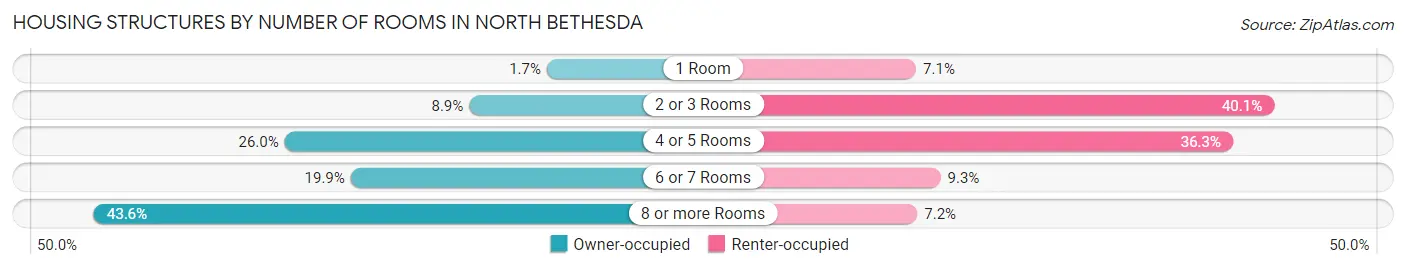
| Number of Rooms | Owner-occupied | Renter-occupied |
| 1 Room | 182 (1.7%) | 778 (7.0%) |
| 2 or 3 Rooms | 950 (8.9%) | 4,427 (40.1%) |
| 4 or 5 Rooms | 2,774 (26.0%) | 4,007 (36.3%) |
| 6 or 7 Rooms | 2,121 (19.9%) | 1,027 (9.3%) |
| 8 or more Rooms | 4,658 (43.6%) | 790 (7.2%) |
| Total | 10,685 (100.0%) | 11,029 (100.0%) |
Housing Structure by Heating Type in North Bethesda
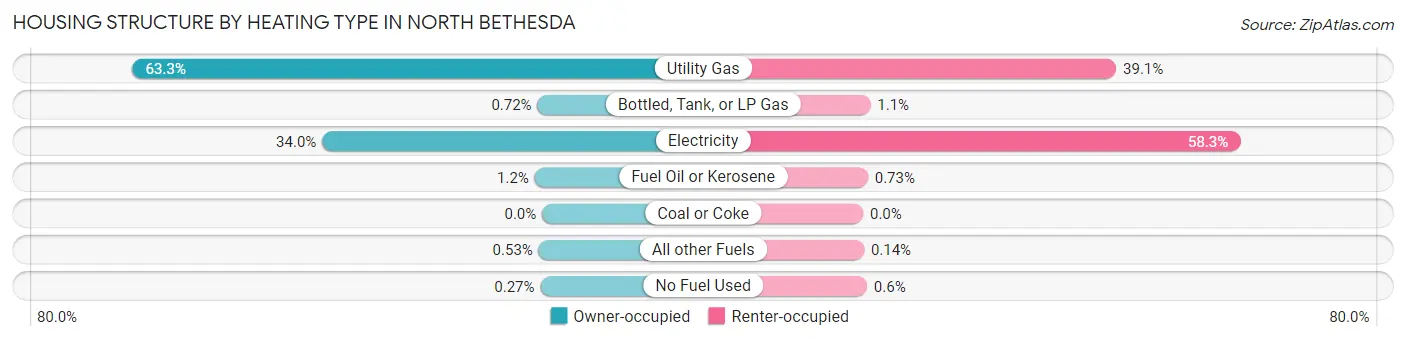
| Heating Type | Owner-occupied | Renter-occupied |
| Utility Gas | 6,766 (63.3%) | 4,315 (39.1%) |
| Bottled, Tank, or LP Gas | 77 (0.7%) | 125 (1.1%) |
| Electricity | 3,633 (34.0%) | 6,427 (58.3%) |
| Fuel Oil or Kerosene | 123 (1.1%) | 81 (0.7%) |
| Coal or Coke | 0 (0.0%) | 0 (0.0%) |
| All other Fuels | 57 (0.5%) | 15 (0.1%) |
| No Fuel Used | 29 (0.3%) | 66 (0.6%) |
| Total | 10,685 (100.0%) | 11,029 (100.0%) |
Household Vehicle Usage in North Bethesda
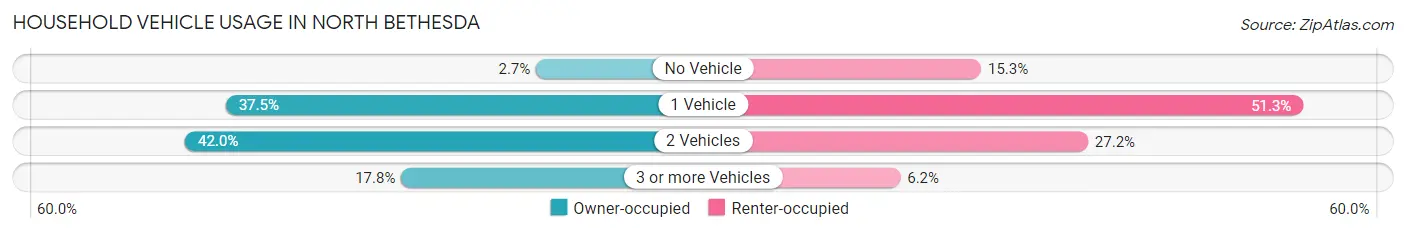
| Vehicles per Household | Owner-occupied | Renter-occupied |
| No Vehicle | 288 (2.7%) | 1,682 (15.2%) |
| 1 Vehicle | 4,004 (37.5%) | 5,661 (51.3%) |
| 2 Vehicles | 4,490 (42.0%) | 3,002 (27.2%) |
| 3 or more Vehicles | 1,903 (17.8%) | 684 (6.2%) |
| Total | 10,685 (100.0%) | 11,029 (100.0%) |
Real Estate & Mortgages in North Bethesda
Real Estate and Mortgage Overview in North Bethesda
| Characteristic | Without Mortgage | With Mortgage |
| Housing Units | 4,000 | 6,685 |
| Median Property Value | $723,600 | $707,000 |
| Median Household Income | $144,000 | $4,374 |
| Monthly Housing Costs | $1,116 | $3,623 |
| Real Estate Taxes | $6,792 | $115 |
Property Value by Mortgage Status in North Bethesda
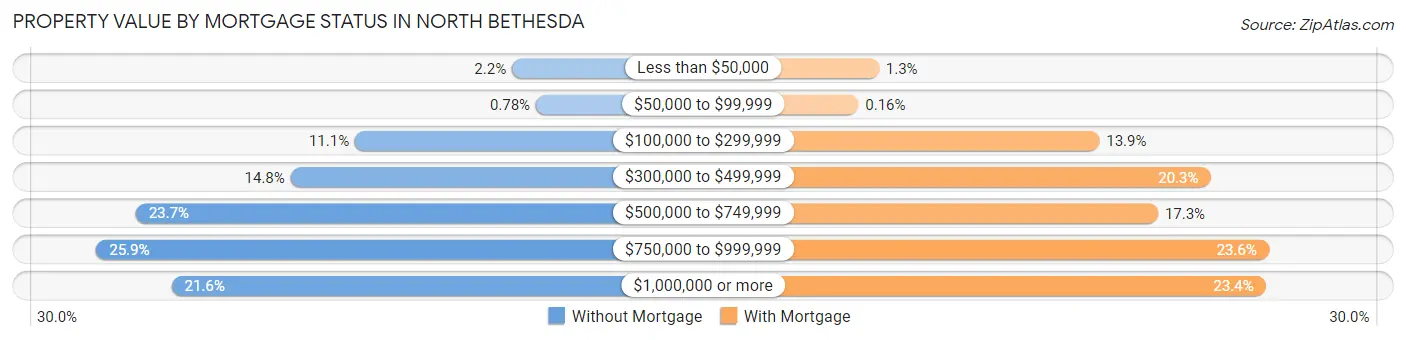
| Property Value | Without Mortgage | With Mortgage |
| Less than $50,000 | 86 (2.1%) | 89 (1.3%) |
| $50,000 to $99,999 | 31 (0.8%) | 11 (0.2%) |
| $100,000 to $299,999 | 445 (11.1%) | 931 (13.9%) |
| $300,000 to $499,999 | 592 (14.8%) | 1,355 (20.3%) |
| $500,000 to $749,999 | 946 (23.6%) | 1,155 (17.3%) |
| $750,000 to $999,999 | 1,036 (25.9%) | 1,578 (23.6%) |
| $1,000,000 or more | 864 (21.6%) | 1,566 (23.4%) |
| Total | 4,000 (100.0%) | 6,685 (100.0%) |
Household Income by Mortgage Status in North Bethesda
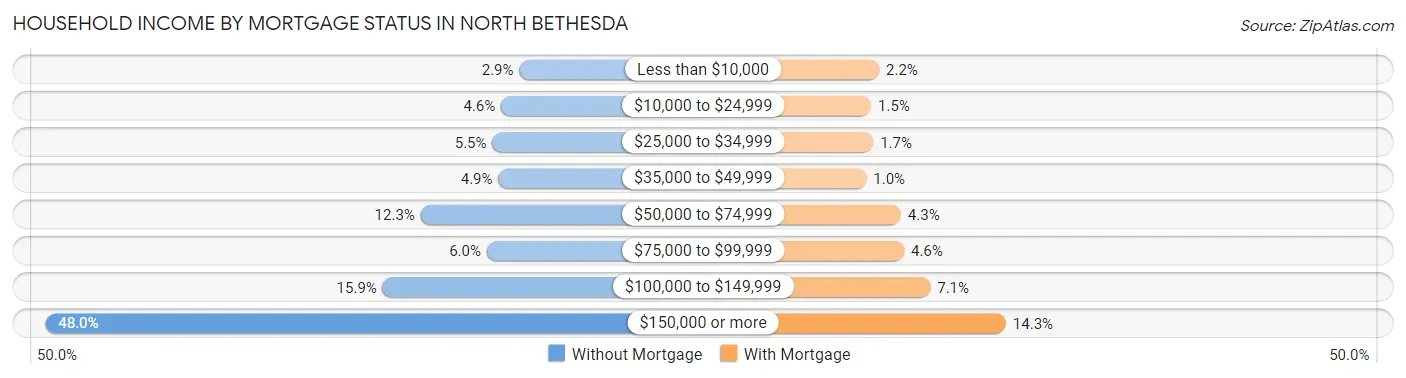
| Household Income | Without Mortgage | With Mortgage |
| Less than $10,000 | 115 (2.9%) | 150 (2.2%) |
| $10,000 to $24,999 | 185 (4.6%) | 99 (1.5%) |
| $25,000 to $34,999 | 218 (5.4%) | 112 (1.7%) |
| $35,000 to $49,999 | 195 (4.9%) | 69 (1.0%) |
| $50,000 to $74,999 | 491 (12.3%) | 289 (4.3%) |
| $75,000 to $99,999 | 239 (6.0%) | 309 (4.6%) |
| $100,000 to $149,999 | 636 (15.9%) | 476 (7.1%) |
| $150,000 or more | 1,921 (48.0%) | 957 (14.3%) |
| Total | 4,000 (100.0%) | 6,685 (100.0%) |
Property Value to Household Income Ratio in North Bethesda
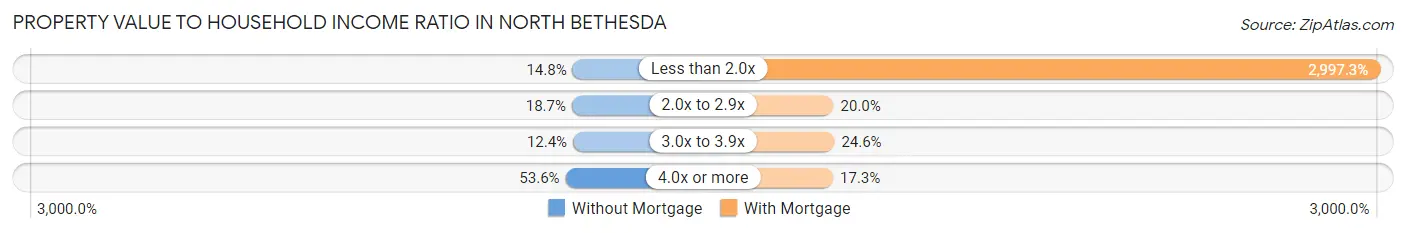
| Value-to-Income Ratio | Without Mortgage | With Mortgage |
| Less than 2.0x | 592 (14.8%) | 200,370 (2,997.3%) |
| 2.0x to 2.9x | 746 (18.6%) | 1,338 (20.0%) |
| 3.0x to 3.9x | 494 (12.3%) | 1,647 (24.6%) |
| 4.0x or more | 2,144 (53.6%) | 1,155 (17.3%) |
| Total | 4,000 (100.0%) | 6,685 (100.0%) |
Real Estate Taxes by Mortgage Status in North Bethesda
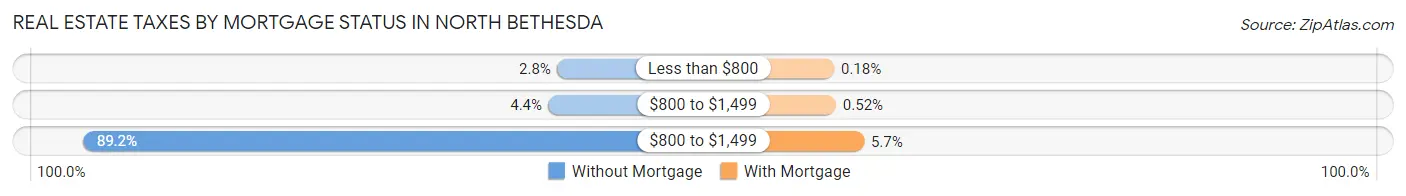
| Property Taxes | Without Mortgage | With Mortgage |
| Less than $800 | 113 (2.8%) | 12 (0.2%) |
| $800 to $1,499 | 177 (4.4%) | 35 (0.5%) |
| $800 to $1,499 | 3,567 (89.2%) | 378 (5.7%) |
| Total | 4,000 (100.0%) | 6,685 (100.0%) |
Health & Disability in North Bethesda
Health Insurance Coverage by Age in North Bethesda
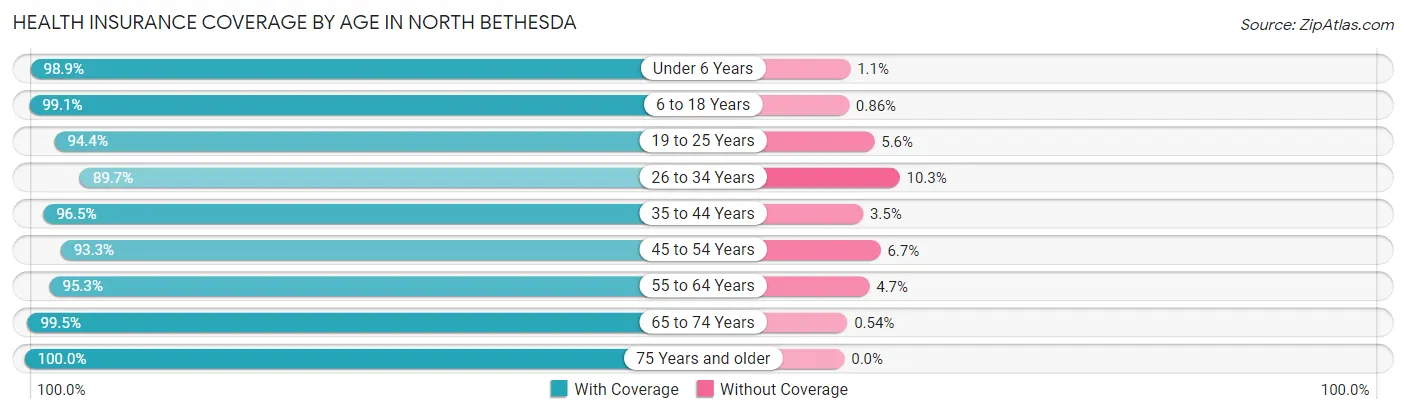
| Age Bracket | With Coverage | Without Coverage |
| Under 6 Years | 2,585 (98.9%) | 29 (1.1%) |
| 6 to 18 Years | 7,188 (99.1%) | 62 (0.9%) |
| 19 to 25 Years | 3,769 (94.4%) | 223 (5.6%) |
| 26 to 34 Years | 5,940 (89.7%) | 683 (10.3%) |
| 35 to 44 Years | 6,979 (96.5%) | 252 (3.5%) |
| 45 to 54 Years | 6,335 (93.3%) | 458 (6.7%) |
| 55 to 64 Years | 5,976 (95.3%) | 292 (4.7%) |
| 65 to 74 Years | 4,031 (99.5%) | 22 (0.5%) |
| 75 Years and older | 3,646 (100.0%) | 0 (0.0%) |
| Total | 46,449 (95.8%) | 2,021 (4.2%) |
Health Insurance Coverage by Citizenship Status in North Bethesda
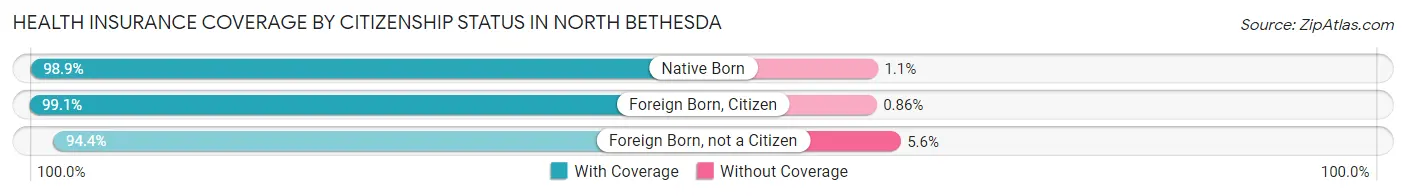
| Citizenship Status | With Coverage | Without Coverage |
| Native Born | 2,585 (98.9%) | 29 (1.1%) |
| Foreign Born, Citizen | 7,188 (99.1%) | 62 (0.9%) |
| Foreign Born, not a Citizen | 3,769 (94.4%) | 223 (5.6%) |
Health Insurance Coverage by Household Income in North Bethesda
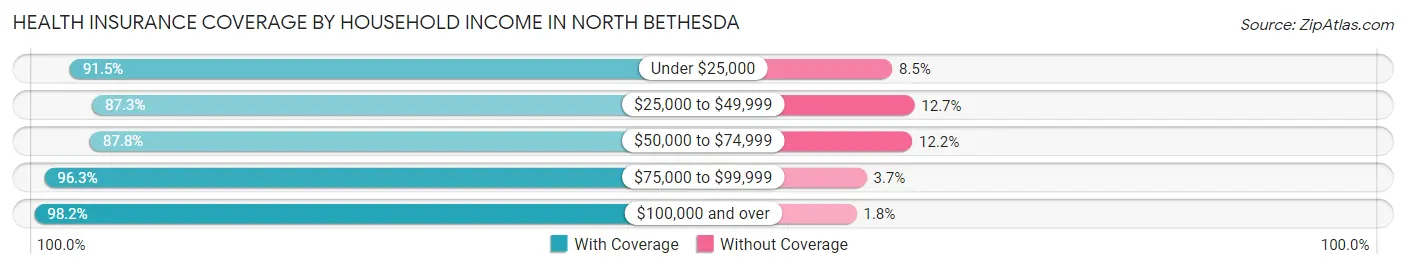
| Household Income | With Coverage | Without Coverage |
| Under $25,000 | 2,037 (91.5%) | 189 (8.5%) |
| $25,000 to $49,999 | 4,104 (87.3%) | 595 (12.7%) |
| $50,000 to $74,999 | 3,269 (87.8%) | 456 (12.2%) |
| $75,000 to $99,999 | 3,904 (96.3%) | 150 (3.7%) |
| $100,000 and over | 32,976 (98.2%) | 610 (1.8%) |
Public vs Private Health Insurance Coverage by Age in North Bethesda
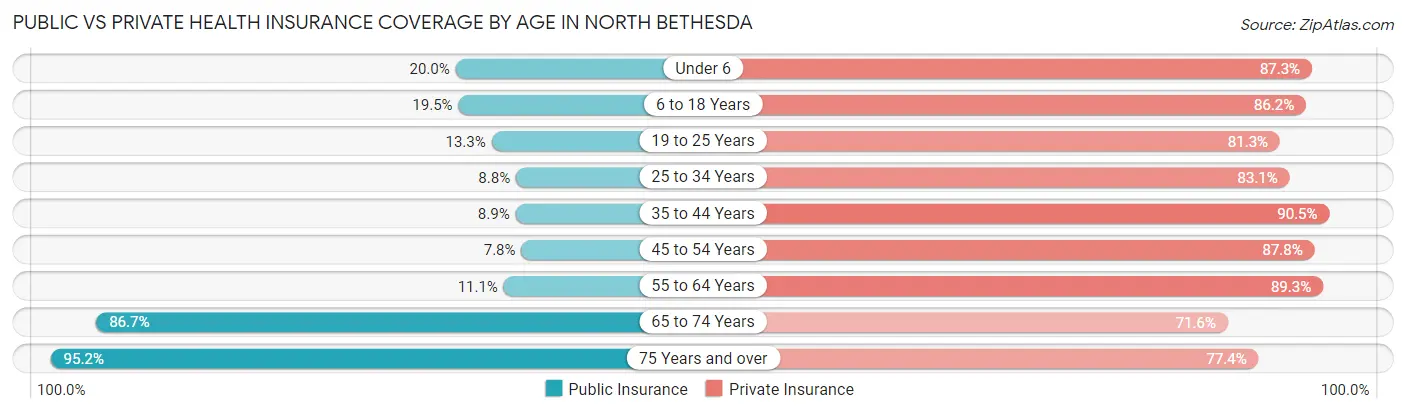
| Age Bracket | Public Insurance | Private Insurance |
| Under 6 | 523 (20.0%) | 2,281 (87.3%) |
| 6 to 18 Years | 1,412 (19.5%) | 6,247 (86.2%) |
| 19 to 25 Years | 532 (13.3%) | 3,246 (81.3%) |
| 25 to 34 Years | 582 (8.8%) | 5,505 (83.1%) |
| 35 to 44 Years | 642 (8.9%) | 6,543 (90.5%) |
| 45 to 54 Years | 529 (7.8%) | 5,961 (87.7%) |
| 55 to 64 Years | 694 (11.1%) | 5,598 (89.3%) |
| 65 to 74 Years | 3,514 (86.7%) | 2,903 (71.6%) |
| 75 Years and over | 3,470 (95.2%) | 2,820 (77.3%) |
| Total | 11,898 (24.5%) | 41,104 (84.8%) |
Disability Status by Sex by Age in North Bethesda
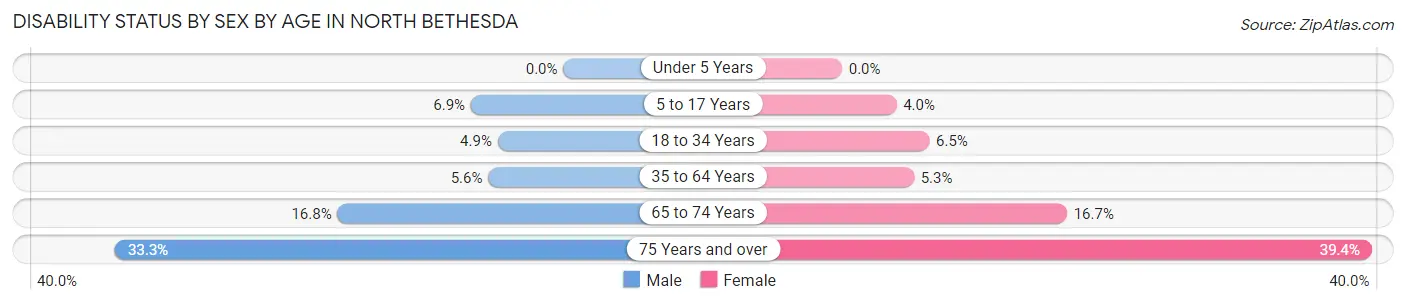
| Age Bracket | Male | Female |
| Under 5 Years | 0 (0.0%) | 0 (0.0%) |
| 5 to 17 Years | 281 (6.9%) | 126 (4.0%) |
| 18 to 34 Years | 257 (4.9%) | 378 (6.5%) |
| 35 to 64 Years | 561 (5.6%) | 546 (5.3%) |
| 65 to 74 Years | 287 (16.8%) | 391 (16.7%) |
| 75 Years and over | 493 (33.3%) | 852 (39.4%) |
Disability Class by Sex by Age in North Bethesda
Disability Class: Hearing Difficulty
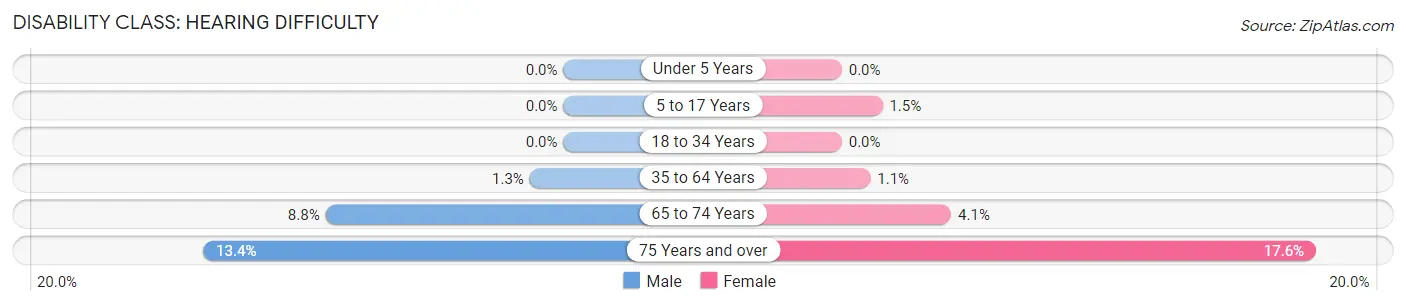
| Age Bracket | Male | Female |
| Under 5 Years | 0 (0.0%) | 0 (0.0%) |
| 5 to 17 Years | 0 (0.0%) | 47 (1.5%) |
| 18 to 34 Years | 0 (0.0%) | 0 (0.0%) |
| 35 to 64 Years | 126 (1.3%) | 108 (1.1%) |
| 65 to 74 Years | 151 (8.8%) | 95 (4.1%) |
| 75 Years and over | 198 (13.4%) | 381 (17.6%) |
Disability Class: Vision Difficulty
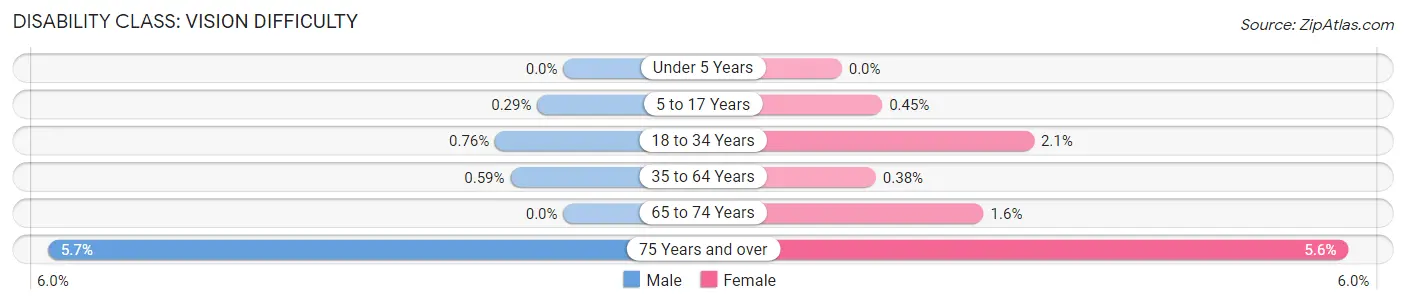
| Age Bracket | Male | Female |
| Under 5 Years | 0 (0.0%) | 0 (0.0%) |
| 5 to 17 Years | 12 (0.3%) | 14 (0.4%) |
| 18 to 34 Years | 40 (0.8%) | 125 (2.1%) |
| 35 to 64 Years | 59 (0.6%) | 39 (0.4%) |
| 65 to 74 Years | 0 (0.0%) | 37 (1.6%) |
| 75 Years and over | 85 (5.7%) | 122 (5.6%) |
Disability Class: Cognitive Difficulty
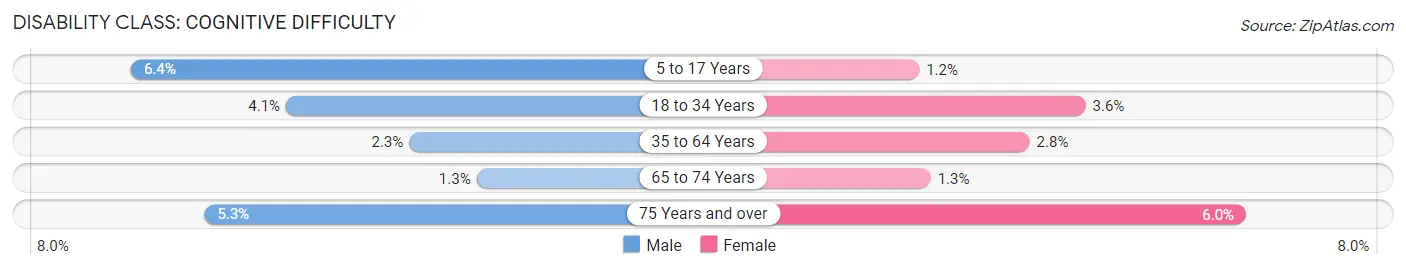
| Age Bracket | Male | Female |
| 5 to 17 Years | 263 (6.4%) | 36 (1.1%) |
| 18 to 34 Years | 217 (4.1%) | 211 (3.6%) |
| 35 to 64 Years | 231 (2.3%) | 285 (2.8%) |
| 65 to 74 Years | 22 (1.3%) | 31 (1.3%) |
| 75 Years and over | 79 (5.3%) | 130 (6.0%) |
Disability Class: Ambulatory Difficulty
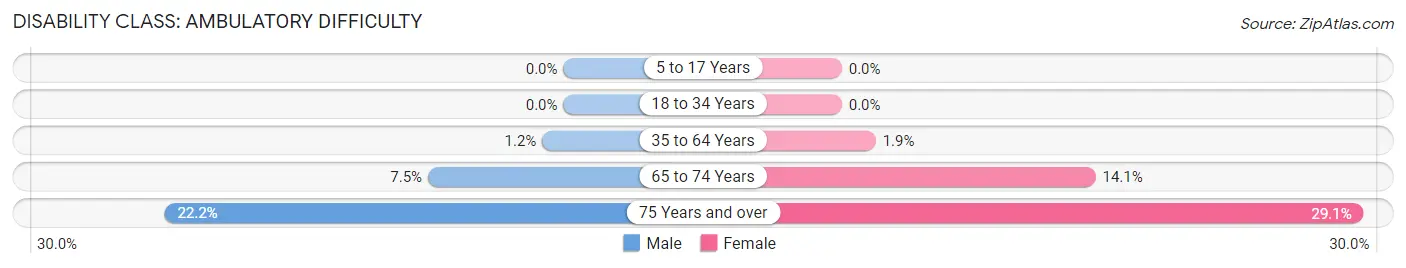
| Age Bracket | Male | Female |
| 5 to 17 Years | 0 (0.0%) | 0 (0.0%) |
| 18 to 34 Years | 0 (0.0%) | 0 (0.0%) |
| 35 to 64 Years | 119 (1.2%) | 193 (1.9%) |
| 65 to 74 Years | 129 (7.5%) | 331 (14.1%) |
| 75 Years and over | 329 (22.2%) | 629 (29.0%) |
Disability Class: Self-Care Difficulty
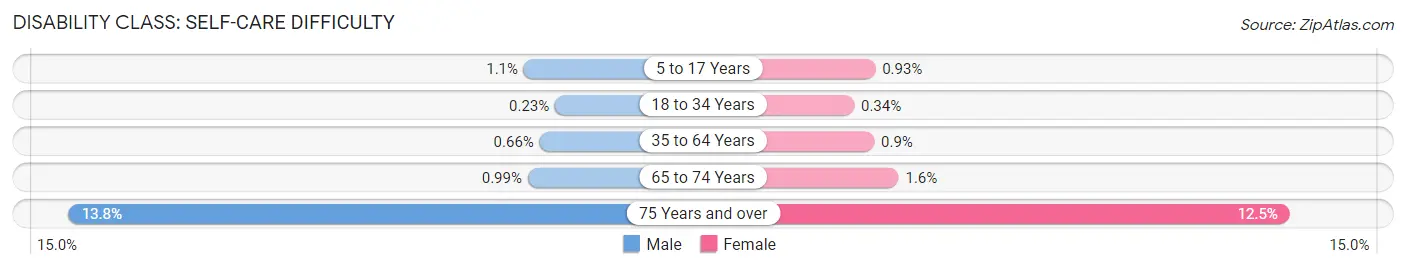
| Age Bracket | Male | Female |
| 5 to 17 Years | 45 (1.1%) | 29 (0.9%) |
| 18 to 34 Years | 12 (0.2%) | 20 (0.3%) |
| 35 to 64 Years | 66 (0.7%) | 92 (0.9%) |
| 65 to 74 Years | 17 (1.0%) | 37 (1.6%) |
| 75 Years and over | 204 (13.8%) | 270 (12.5%) |
Technology Access in North Bethesda
Computing Device Access in North Bethesda
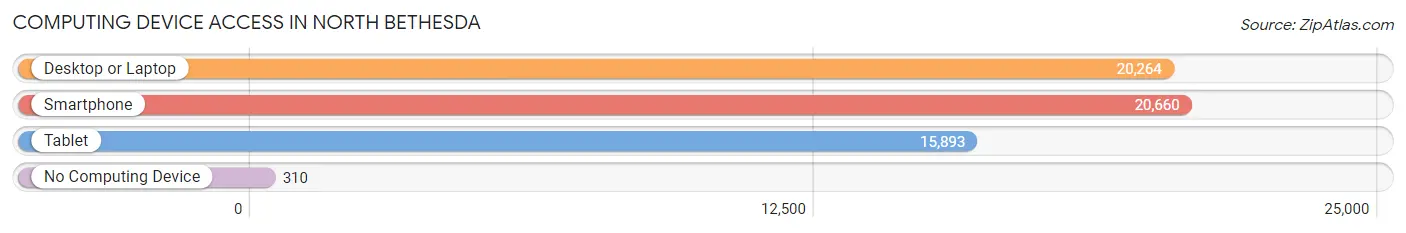
| Device Type | # Households | % Households |
| Desktop or Laptop | 20,264 | 93.3% |
| Smartphone | 20,660 | 95.2% |
| Tablet | 15,893 | 73.2% |
| No Computing Device | 310 | 1.4% |
| Total | 21,714 | 100.0% |
Internet Access in North Bethesda
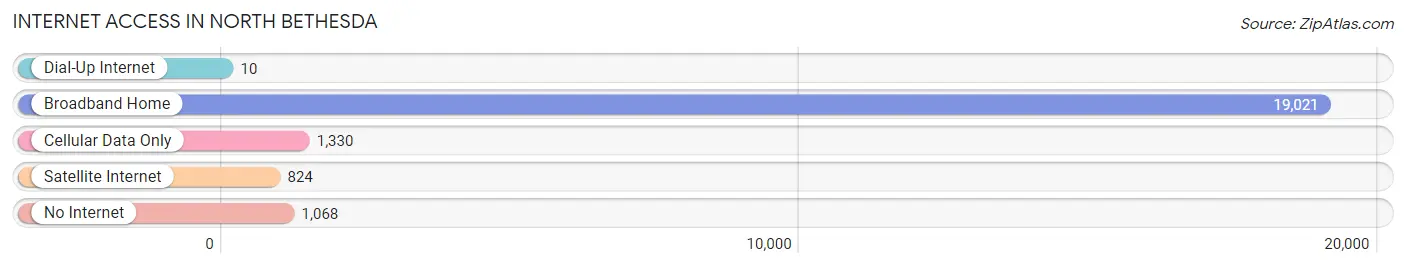
| Internet Type | # Households | % Households |
| Dial-Up Internet | 10 | 0.1% |
| Broadband Home | 19,021 | 87.6% |
| Cellular Data Only | 1,330 | 6.1% |
| Satellite Internet | 824 | 3.8% |
| No Internet | 1,068 | 4.9% |
| Total | 21,714 | 100.0% |
North Bethesda Summary
North Bethesda is a census-designated place (CDP) located in Montgomery County, Maryland, United States. It is a suburb of Washington, D.C., located just north of the city. As of the 2010 United States Census, the population of North Bethesda was 43,868.
History
The area now known as North Bethesda was originally inhabited by the Piscataway tribe of Native Americans. The first European settlers arrived in the area in the late 1700s, and the area was officially established as a town in 1873. The town was originally called Norwood, but the name was changed to North Bethesda in 1938.
The area experienced rapid growth in the 1950s and 1960s, as the population of Washington, D.C. increased and many people moved to the suburbs. In the 1970s, the area was annexed by Montgomery County, and the population continued to grow.
Geography
North Bethesda is located at 39°2′N 77°7′W (39.03, -77.12). According to the United States Census Bureau, the CDP has a total area of 8.2 square miles (21.2 km2), of which 8.1 square miles (21.0 km2) is land and 0.1 square miles (0.2 km2) (1.17%) is water.
The area is bordered by the city of Rockville to the north, the city of Bethesda to the south, and the city of Potomac to the west. The area is located in the Piedmont region of Maryland, and is characterized by rolling hills and valleys.
Economy
North Bethesda is home to a number of major employers, including Marriott International, Lockheed Martin, and the National Institutes of Health. The area is also home to a number of shopping centers, including White Flint Mall and Pike & Rose.
Demographics
As of the 2010 United States Census, there were 43,868 people, 17,945 households, and 11,845 families living in North Bethesda. The population density was 5,400 people per square mile (2,093/km2). The racial makeup of the CDP was 68.2% White, 14.3% African American, 0.3% Native American, 11.7% Asian, 0.1% Pacific Islander, 3.2% from other races, and 2.3% from two or more races. Hispanic or Latino of any race were 8.2% of the population.
The median income for a household in the CDP was $99,945, and the median income for a family was $117,845. The per capita income for the CDP was $50,945. About 3.2% of families and 5.2% of the population were below the poverty line, including 5.7% of those under age 18 and 4.2% of those age 65 or over.
Common Questions
What is Per Capita Income in North Bethesda?
Per Capita income in North Bethesda is $78,300.
What is the Median Family Income in North Bethesda?
Median Family Income in North Bethesda is $172,839.
What is the Median Household income in North Bethesda?
Median Household Income in North Bethesda is $131,142.
What is Income or Wage Gap in North Bethesda?
Income or Wage Gap in North Bethesda is 26.9%.
Women in North Bethesda earn 73.1 cents for every dollar earned by a man.
What is Inequality or Gini Index in North Bethesda?
Inequality or Gini Index in North Bethesda is 0.46.
What is the Total Population of North Bethesda?
Total Population of North Bethesda is 49,763.
What is the Total Male Population of North Bethesda?
Total Male Population of North Bethesda is 24,432.
What is the Total Female Population of North Bethesda?
Total Female Population of North Bethesda is 25,331.
What is the Ratio of Males per 100 Females in North Bethesda?
There are 96.45 Males per 100 Females in North Bethesda.
What is the Ratio of Females per 100 Males in North Bethesda?
There are 103.68 Females per 100 Males in North Bethesda.
What is the Median Population Age in North Bethesda?
Median Population Age in North Bethesda is 40.2 Years.
What is the Average Family Size in North Bethesda
Average Family Size in North Bethesda is 3.0 People.
What is the Average Household Size in North Bethesda
Average Household Size in North Bethesda is 2.2 People.
How Large is the Labor Force in North Bethesda?
There are 28,856 People in the Labor Forcein in North Bethesda.
What is the Percentage of People in the Labor Force in North Bethesda?
69.6% of People are in the Labor Force in North Bethesda.
What is the Unemployment Rate in North Bethesda?
Unemployment Rate in North Bethesda is 3.2%.