Urbana, MD Map & Demographics
Urbana Map
Urbana Overview
$61,822
PER CAPITA INCOME
$186,356
AVG FAMILY INCOME
$179,409
AVG HOUSEHOLD INCOME
37.7%
WAGE / INCOME GAP [ % ]
62.3¢/ $1
WAGE / INCOME GAP [ $ ]
0.32
INEQUALITY / GINI INDEX
13,373
TOTAL POPULATION
6,927
MALE POPULATION
6,446
FEMALE POPULATION
107.46
MALES / 100 FEMALES
93.06
FEMALES / 100 MALES
36.6
MEDIAN AGE
3.6
AVG FAMILY SIZE
3.3
AVG HOUSEHOLD SIZE
7,179
LABOR FORCE [ PEOPLE ]
78.2%
PERCENT IN LABOR FORCE
4.3%
UNEMPLOYMENT RATE
Income in Urbana
Income Overview in Urbana
Per Capita Income in Urbana is $61,822, while median incomes of families and households are $186,356 and $179,409 respectively.
| Characteristic | Number | Measure |
| Per Capita Income | 13,373 | $61,822 |
| Median Family Income | 3,427 | $186,356 |
| Mean Family Income | 3,427 | $207,633 |
| Median Household Income | 4,052 | $179,409 |
| Mean Household Income | 4,052 | $198,196 |
| Income Deficit | 3,427 | $0 |
| Wage / Income Gap (%) | 13,373 | 37.69% |
| Wage / Income Gap ($) | 13,373 | 62.31¢ per $1 |
| Gini / Inequality Index | 13,373 | 0.32 |
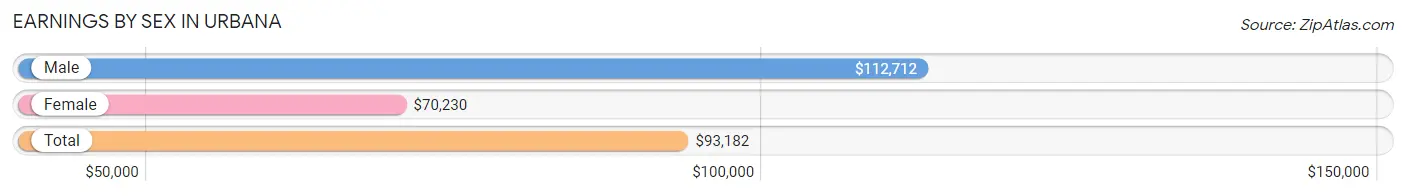
Earnings by Sex in Urbana
Average Earnings in Urbana are $93,182, $112,712 for men and $70,230 for women, a difference of 37.7%.
| Sex | Number | Average Earnings |
| Male | 3,843 (52.2%) | $112,712 |
| Female | 3,515 (47.8%) | $70,230 |
| Total | 7,358 (100.0%) | $93,182 |
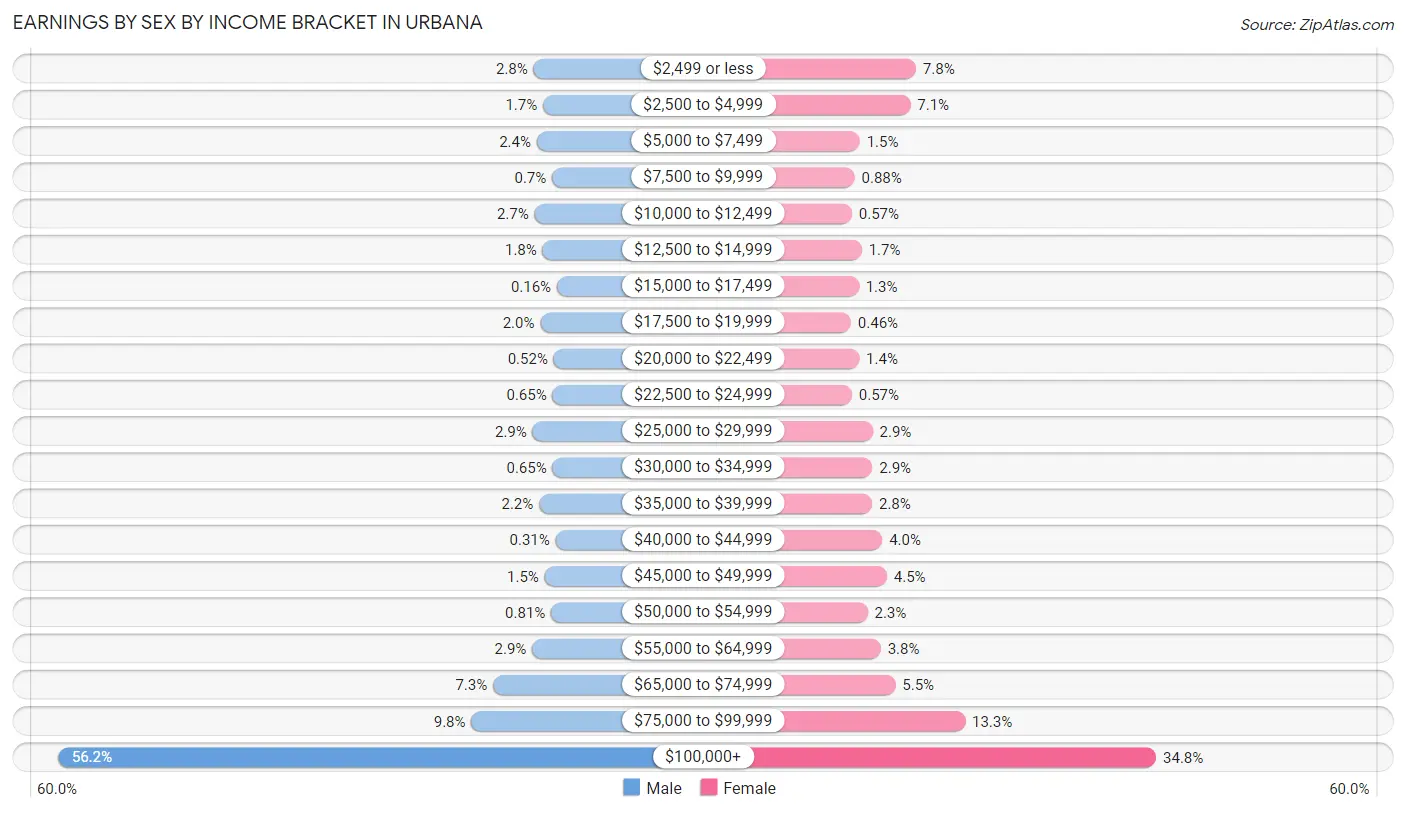
Earnings by Sex by Income Bracket in Urbana
The most common earnings brackets in Urbana are $100,000+ for men (2,158 | 56.1%) and $100,000+ for women (1,222 | 34.8%).
| Income | Male | Female |
| $2,499 or less | 107 (2.8%) | 273 (7.8%) |
| $2,500 to $4,999 | 66 (1.7%) | 251 (7.1%) |
| $5,000 to $7,499 | 93 (2.4%) | 51 (1.5%) |
| $7,500 to $9,999 | 27 (0.7%) | 31 (0.9%) |
| $10,000 to $12,499 | 103 (2.7%) | 20 (0.6%) |
| $12,500 to $14,999 | 68 (1.8%) | 59 (1.7%) |
| $15,000 to $17,499 | 6 (0.2%) | 47 (1.3%) |
| $17,500 to $19,999 | 78 (2.0%) | 16 (0.5%) |
| $20,000 to $22,499 | 20 (0.5%) | 49 (1.4%) |
| $22,500 to $24,999 | 25 (0.6%) | 20 (0.6%) |
| $25,000 to $29,999 | 111 (2.9%) | 102 (2.9%) |
| $30,000 to $34,999 | 25 (0.6%) | 101 (2.9%) |
| $35,000 to $39,999 | 83 (2.2%) | 100 (2.8%) |
| $40,000 to $44,999 | 12 (0.3%) | 140 (4.0%) |
| $45,000 to $49,999 | 59 (1.5%) | 158 (4.5%) |
| $50,000 to $54,999 | 31 (0.8%) | 82 (2.3%) |
| $55,000 to $64,999 | 113 (2.9%) | 134 (3.8%) |
| $65,000 to $74,999 | 282 (7.3%) | 192 (5.5%) |
| $75,000 to $99,999 | 376 (9.8%) | 467 (13.3%) |
| $100,000+ | 2,158 (56.1%) | 1,222 (34.8%) |
| Total | 3,843 (100.0%) | 3,515 (100.0%) |
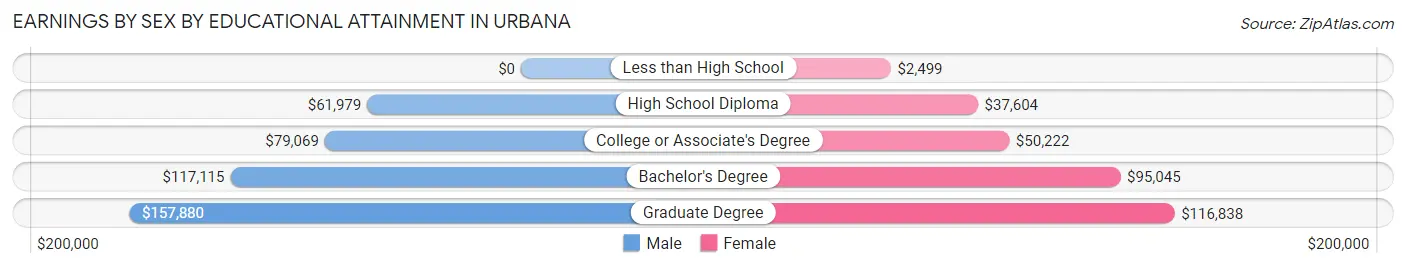
Earnings by Sex by Educational Attainment in Urbana
Average earnings in Urbana are $118,723 for men and $81,237 for women, a difference of 31.6%. Men with an educational attainment of graduate degree enjoy the highest average annual earnings of $157,880, while those with high school diploma education earn the least with $61,979. Women with an educational attainment of graduate degree earn the most with the average annual earnings of $116,838, while those with less than high school education have the smallest earnings of $2,499.
| Educational Attainment | Male Income | Female Income |
| Less than High School | - | - |
| High School Diploma | $61,979 | $37,604 |
| College or Associate's Degree | $79,069 | $50,222 |
| Bachelor's Degree | $117,115 | $95,045 |
| Graduate Degree | $157,880 | $116,838 |
| Total | $118,723 | $81,237 |
Family Income in Urbana
Family Income Brackets in Urbana
According to the Urbana family income data, there are 1,501 families falling into the $200,000+ income range, which is the most common income bracket and makes up 43.8% of all families.
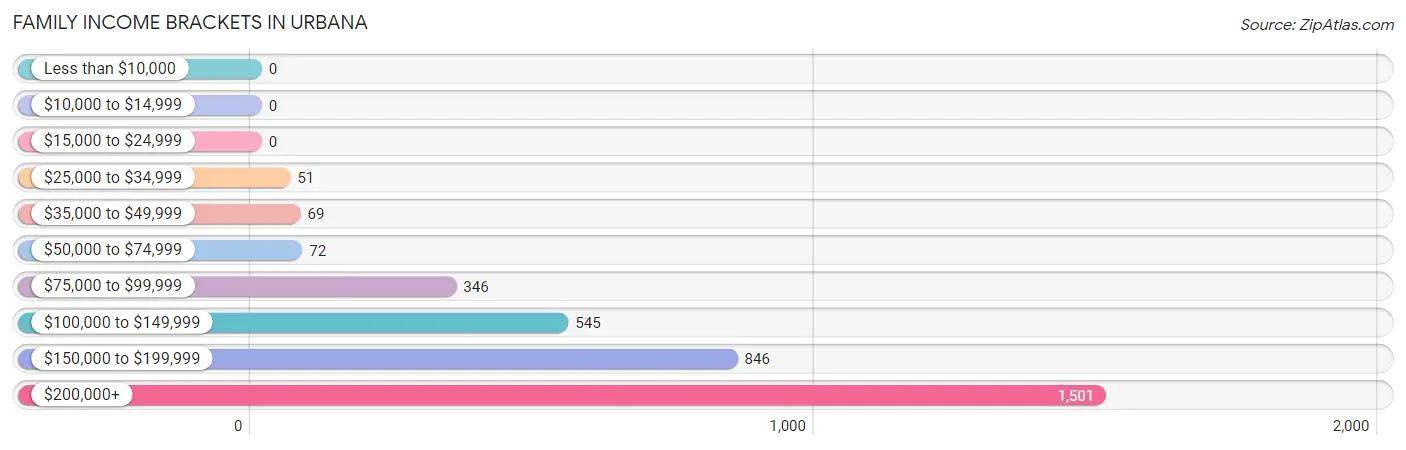
| Income Bracket | # Families | % Families |
| Less than $10,000 | 0 | 0.0% |
| $10,000 to $14,999 | 0 | 0.0% |
| $15,000 to $24,999 | 0 | 0.0% |
| $25,000 to $34,999 | 51 | 1.5% |
| $35,000 to $49,999 | 69 | 2.0% |
| $50,000 to $74,999 | 72 | 2.1% |
| $75,000 to $99,999 | 346 | 10.1% |
| $100,000 to $149,999 | 545 | 15.9% |
| $150,000 to $199,999 | 846 | 24.7% |
| $200,000+ | 1,501 | 43.8% |
Family Income by Famaliy Size in Urbana
4-person families (1,239 | 36.1%) account for the highest median family income in Urbana with $214,145 per family, while 2-person families (719 | 21.0%) have the highest median income of $92,292 per family member.
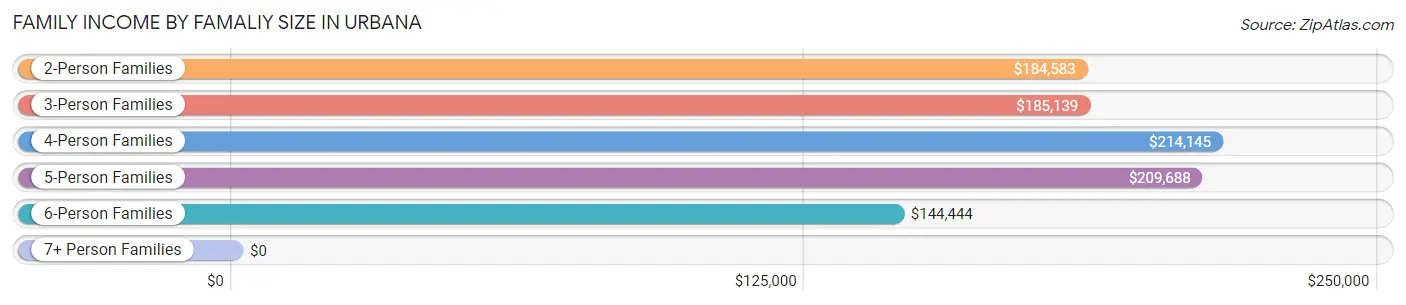
| Income Bracket | # Families | Median Income |
| 2-Person Families | 719 (21.0%) | $184,583 |
| 3-Person Families | 907 (26.5%) | $185,139 |
| 4-Person Families | 1,239 (36.1%) | $214,145 |
| 5-Person Families | 354 (10.3%) | $209,688 |
| 6-Person Families | 186 (5.4%) | $144,444 |
| 7+ Person Families | 22 (0.6%) | $0 |
| Total | 3,427 (100.0%) | $186,356 |
Family Income by Number of Earners in Urbana
The median family income in Urbana is $186,356, with families comprising 2 earners (1,919) having the highest median family income of $218,405, while families with no earners (93) have the lowest median family income of $97,614, accounting for 56.0% and 2.7% of families, respectively.
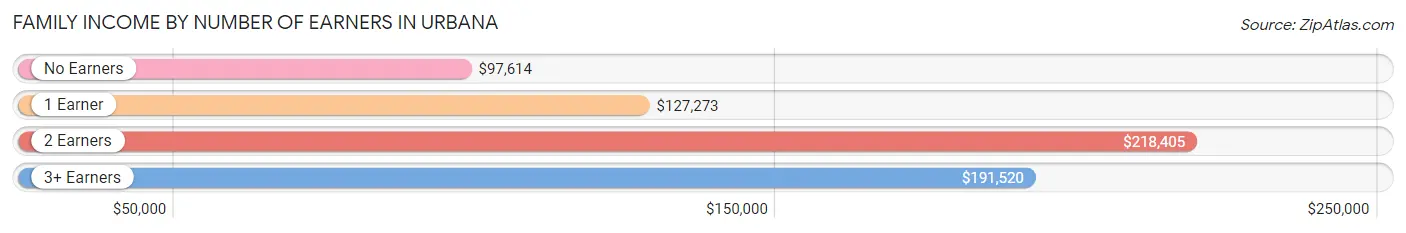
| Number of Earners | # Families | Median Income |
| No Earners | 93 (2.7%) | $97,614 |
| 1 Earner | 880 (25.7%) | $127,273 |
| 2 Earners | 1,919 (56.0%) | $218,405 |
| 3+ Earners | 535 (15.6%) | $191,520 |
| Total | 3,427 (100.0%) | $186,356 |
Household Income in Urbana
Household Income Brackets in Urbana
With 1,690 households falling in the category, the $200,000+ income range is the most frequent in Urbana, accounting for 41.7% of all households.
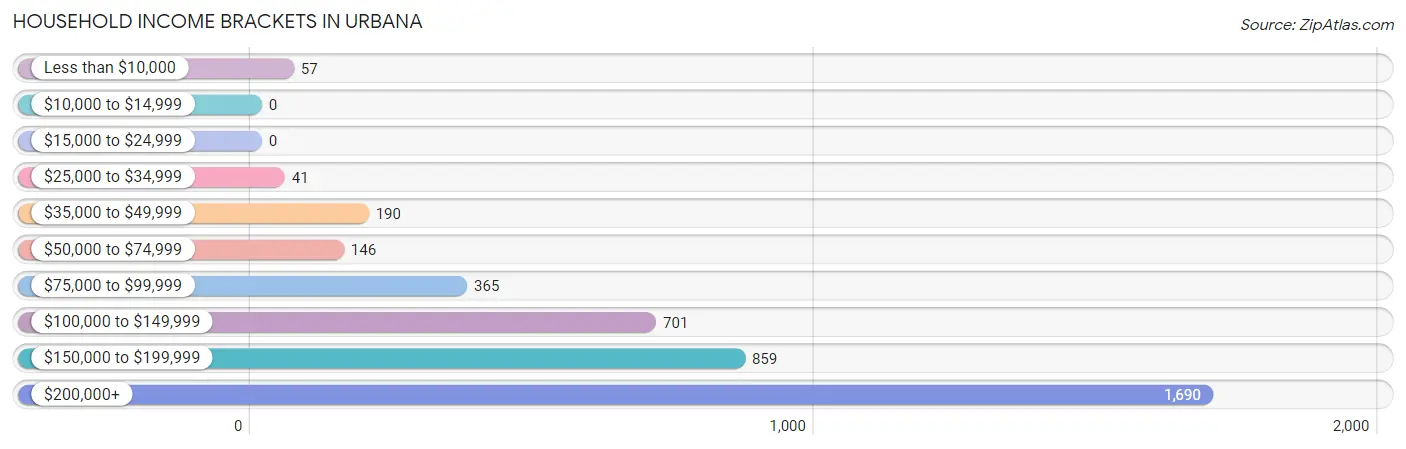
| Income Bracket | # Households | % Households |
| Less than $10,000 | 57 | 1.4% |
| $10,000 to $14,999 | 0 | 0.0% |
| $15,000 to $24,999 | 0 | 0.0% |
| $25,000 to $34,999 | 41 | 1.0% |
| $35,000 to $49,999 | 190 | 4.7% |
| $50,000 to $74,999 | 146 | 3.6% |
| $75,000 to $99,999 | 365 | 9.0% |
| $100,000 to $149,999 | 701 | 17.3% |
| $150,000 to $199,999 | 859 | 21.2% |
| $200,000+ | 1,690 | 41.7% |
Household Income by Householder Age in Urbana
The median household income in Urbana is $179,409, with the highest median household income of $198,561 found in the 45 to 64 years age bracket for the primary householder. A total of 2,063 households (50.9%) fall into this category.
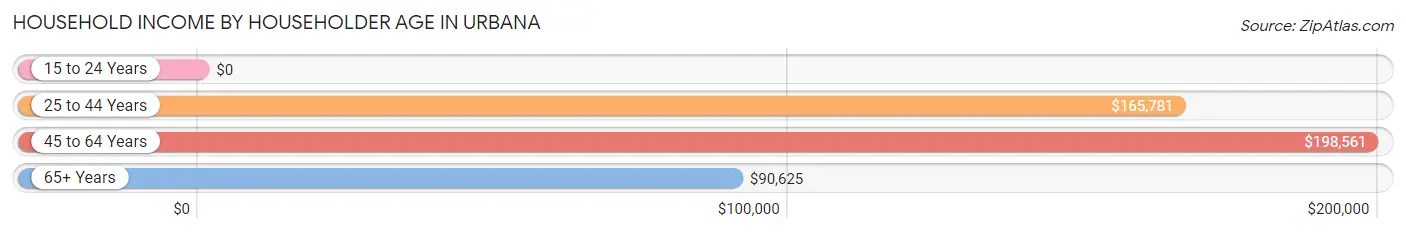
| Income Bracket | # Households | Median Income |
| 15 to 24 Years | 0 (0.0%) | $0 |
| 25 to 44 Years | 1,601 (39.5%) | $165,781 |
| 45 to 64 Years | 2,063 (50.9%) | $198,561 |
| 65+ Years | 388 (9.6%) | $90,625 |
| Total | 4,052 (100.0%) | $179,409 |
Poverty in Urbana
Income Below Poverty by Sex and Age in Urbana
With 1.0% poverty level for males and 1.6% for females among the residents of Urbana, 25 to 34 year old males and 18 to 24 year old females are the most vulnerable to poverty, with 33 males (8.3%) and 53 females (18.0%) in their respective age groups living below the poverty level.
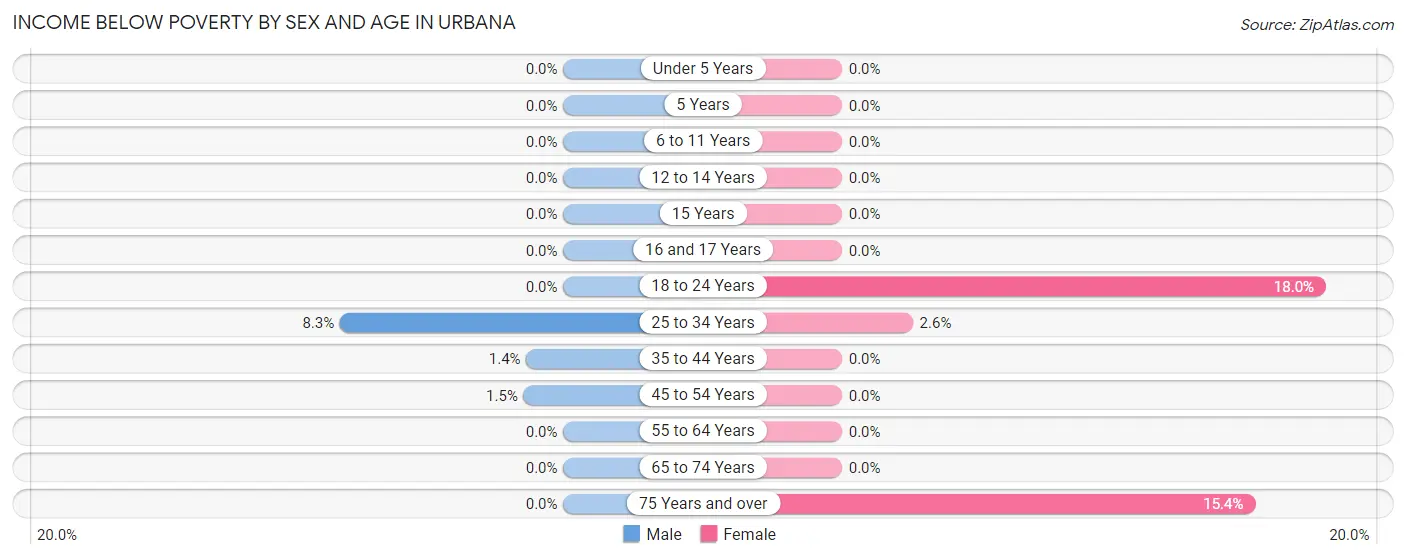
| Age Bracket | Male | Female |
| Under 5 Years | 0 (0.0%) | 0 (0.0%) |
| 5 Years | 0 (0.0%) | 0 (0.0%) |
| 6 to 11 Years | 0 (0.0%) | 0 (0.0%) |
| 12 to 14 Years | 0 (0.0%) | 0 (0.0%) |
| 15 Years | 0 (0.0%) | 0 (0.0%) |
| 16 and 17 Years | 0 (0.0%) | 0 (0.0%) |
| 18 to 24 Years | 0 (0.0%) | 53 (18.0%) |
| 25 to 34 Years | 33 (8.3%) | 13 (2.6%) |
| 35 to 44 Years | 16 (1.4%) | 0 (0.0%) |
| 45 to 54 Years | 20 (1.5%) | 0 (0.0%) |
| 55 to 64 Years | 0 (0.0%) | 0 (0.0%) |
| 65 to 74 Years | 0 (0.0%) | 0 (0.0%) |
| 75 Years and over | 0 (0.0%) | 35 (15.3%) |
| Total | 69 (1.0%) | 101 (1.6%) |
Income Above Poverty by Sex and Age in Urbana
According to the poverty statistics in Urbana, males aged under 5 years and females aged under 5 years are the age groups that are most secure financially, with 100.0% of males and 100.0% of females in these age groups living above the poverty line.
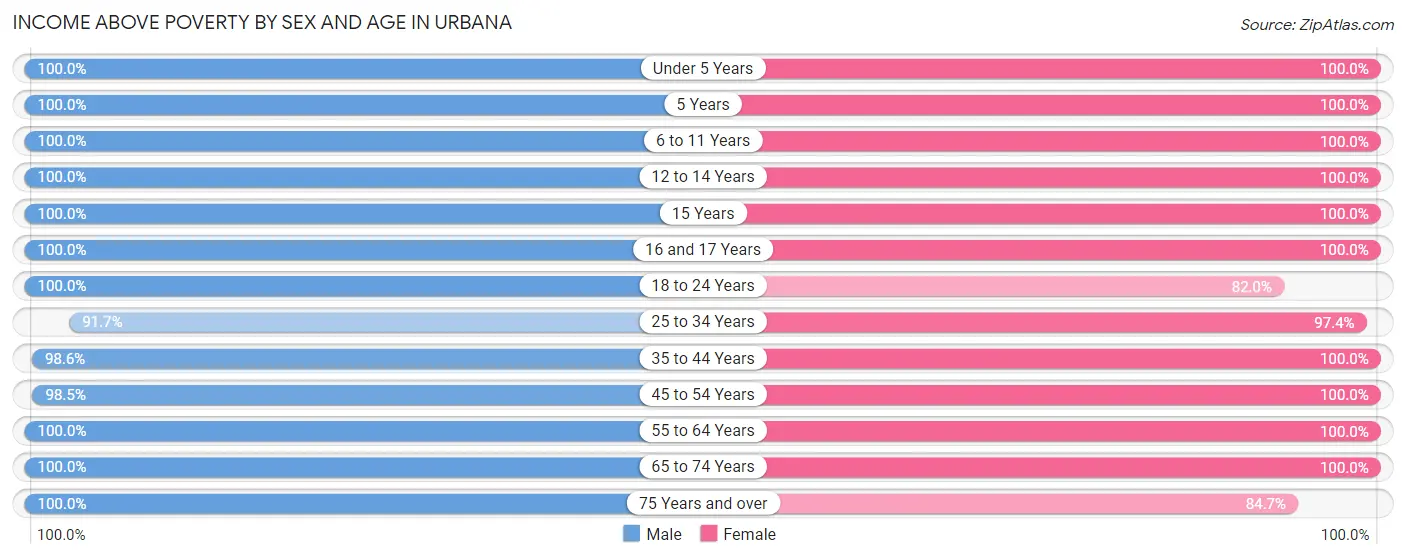
| Age Bracket | Male | Female |
| Under 5 Years | 607 (100.0%) | 346 (100.0%) |
| 5 Years | 55 (100.0%) | 74 (100.0%) |
| 6 to 11 Years | 1,092 (100.0%) | 737 (100.0%) |
| 12 to 14 Years | 388 (100.0%) | 520 (100.0%) |
| 15 Years | 242 (100.0%) | 132 (100.0%) |
| 16 and 17 Years | 291 (100.0%) | 332 (100.0%) |
| 18 to 24 Years | 389 (100.0%) | 242 (82.0%) |
| 25 to 34 Years | 365 (91.7%) | 482 (97.4%) |
| 35 to 44 Years | 1,150 (98.6%) | 1,310 (100.0%) |
| 45 to 54 Years | 1,344 (98.5%) | 1,123 (100.0%) |
| 55 to 64 Years | 579 (100.0%) | 505 (100.0%) |
| 65 to 74 Years | 295 (100.0%) | 349 (100.0%) |
| 75 Years and over | 61 (100.0%) | 193 (84.7%) |
| Total | 6,858 (99.0%) | 6,345 (98.4%) |
Income Below Poverty Among Married-Couple Families in Urbana
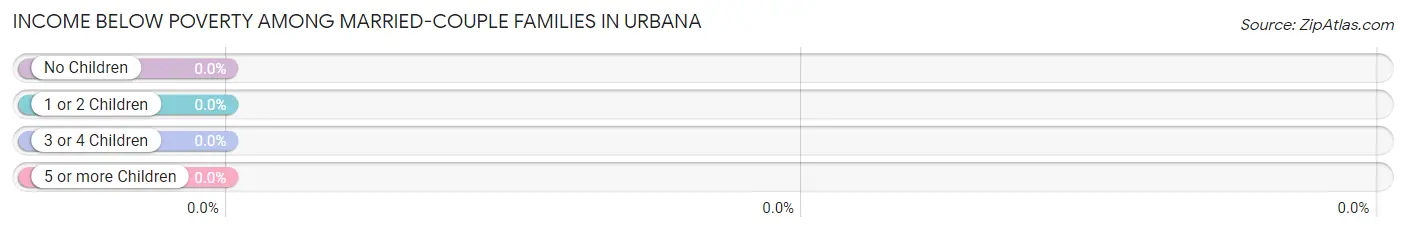
| Children | Above Poverty | Below Poverty |
| No Children | 815 (100.0%) | 0 (0.0%) |
| 1 or 2 Children | 1,596 (100.0%) | 0 (0.0%) |
| 3 or 4 Children | 431 (100.0%) | 0 (0.0%) |
| 5 or more Children | 0 (0.0%) | 0 (0.0%) |
| Total | 2,842 (100.0%) | 0 (0.0%) |
Income Below Poverty Among Single-Parent Households in Urbana
| Children | Single Father | Single Mother |
| No Children | 0 (0.0%) | 0 (0.0%) |
| 1 or 2 Children | 0 (0.0%) | 0 (0.0%) |
| 3 or 4 Children | 0 (0.0%) | 0 (0.0%) |
| 5 or more Children | 0 (0.0%) | 0 (0.0%) |
| Total | 0 (0.0%) | 0 (0.0%) |
Income Below Poverty Among Married-Couple vs Single-Parent Households in Urbana
| Children | Married-Couple Families | Single-Parent Households |
| No Children | 0 (0.0%) | 0 (0.0%) |
| 1 or 2 Children | 0 (0.0%) | 0 (0.0%) |
| 3 or 4 Children | 0 (0.0%) | 0 (0.0%) |
| 5 or more Children | 0 (0.0%) | 0 (0.0%) |
| Total | 0 (0.0%) | 0 (0.0%) |
Race in Urbana
The most populous races in Urbana are White / Caucasian (7,095 | 53.0%), Asian (2,358 | 17.6%), and Hispanic or Latino (2,185 | 16.3%).
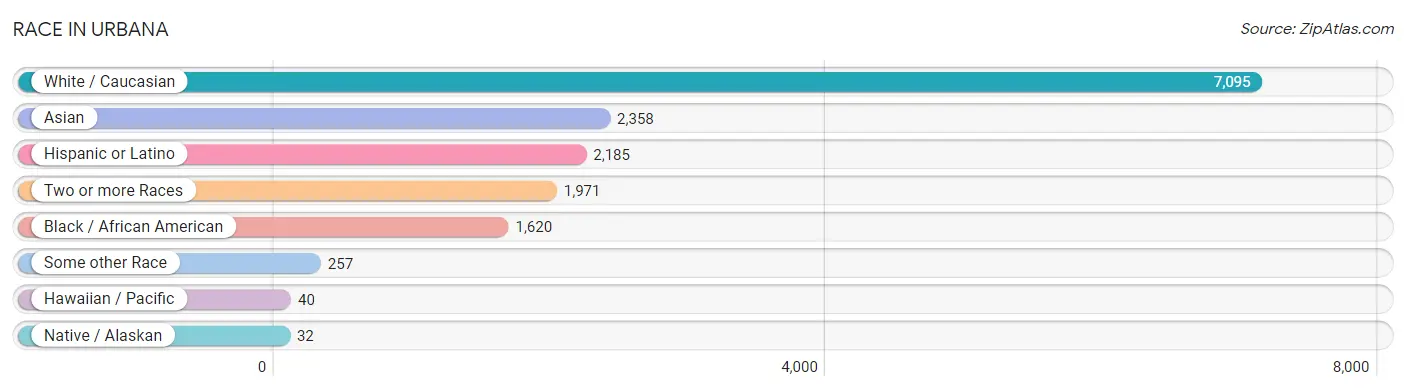
| Race | # Population | % Population |
| Asian | 2,358 | 17.6% |
| Black / African American | 1,620 | 12.1% |
| Hawaiian / Pacific | 40 | 0.3% |
| Hispanic or Latino | 2,185 | 16.3% |
| Native / Alaskan | 32 | 0.2% |
| White / Caucasian | 7,095 | 53.0% |
| Two or more Races | 1,971 | 14.7% |
| Some other Race | 257 | 1.9% |
| Total | 13,373 | 100.0% |
Ancestry in Urbana
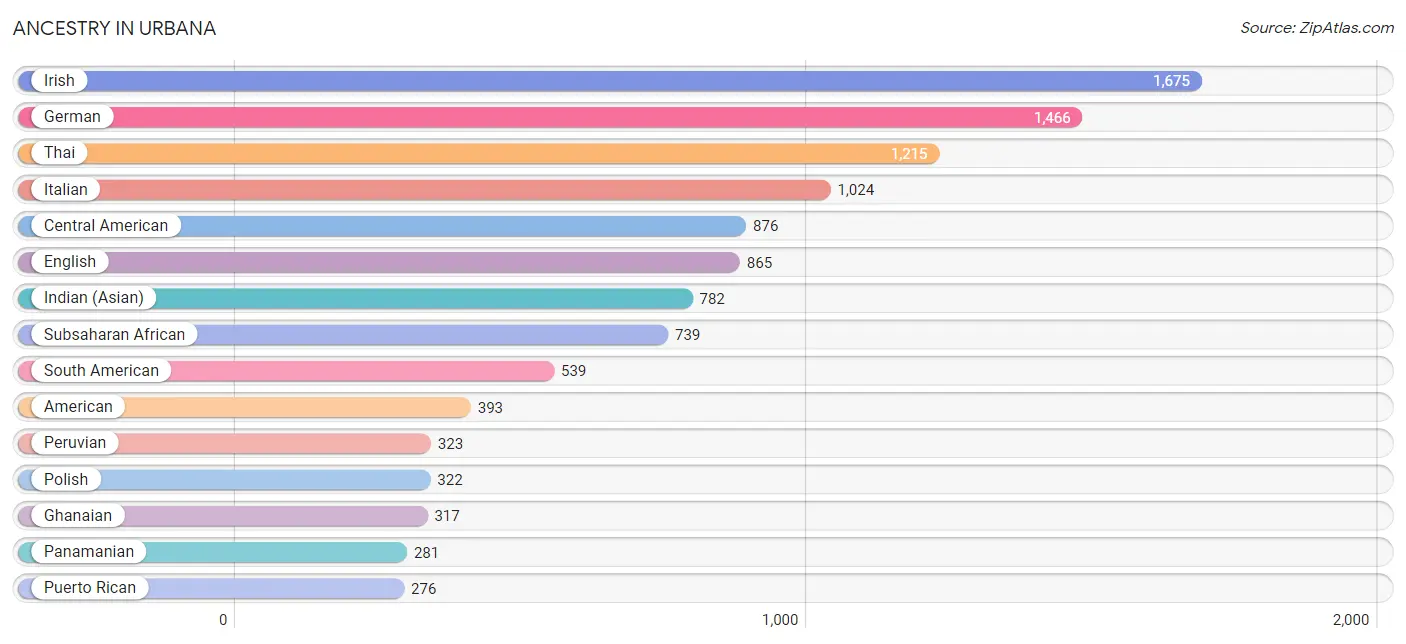
The most populous ancestries reported in Urbana are Irish (1,675 | 12.5%), German (1,466 | 11.0%), Thai (1,215 | 9.1%), Italian (1,024 | 7.7%), and Central American (876 | 6.6%), together accounting for 46.8% of all Urbana residents.
| Ancestry | # Population | % Population |
| Afghan | 31 | 0.2% |
| African | 204 | 1.5% |
| American | 393 | 2.9% |
| Arab | 32 | 0.2% |
| Australian | 11 | 0.1% |
| Austrian | 11 | 0.1% |
| Bhutanese | 115 | 0.9% |
| Bolivian | 19 | 0.1% |
| British | 112 | 0.8% |
| British West Indian | 35 | 0.3% |
| Bulgarian | 37 | 0.3% |
| Burmese | 112 | 0.8% |
| Celtic | 11 | 0.1% |
| Central American | 876 | 6.6% |
| Central American Indian | 125 | 0.9% |
| Cherokee | 40 | 0.3% |
| Colombian | 144 | 1.1% |
| Costa Rican | 19 | 0.1% |
| Cuban | 26 | 0.2% |
| Czech | 49 | 0.4% |
| Czechoslovakian | 8 | 0.1% |
| Danish | 8 | 0.1% |
| Dutch | 84 | 0.6% |
| Eastern European | 5 | 0.0% |
| Ecuadorian | 13 | 0.1% |
| Egyptian | 8 | 0.1% |
| English | 865 | 6.5% |
| European | 215 | 1.6% |
| Filipino | 64 | 0.5% |
| French | 243 | 1.8% |
| German | 1,466 | 11.0% |
| Ghanaian | 317 | 2.4% |
| Guamanian / Chamorro | 20 | 0.2% |
| Guatemalan | 55 | 0.4% |
| Honduran | 139 | 1.0% |
| Hungarian | 39 | 0.3% |
| Indian (Asian) | 782 | 5.9% |
| Irish | 1,675 | 12.5% |
| Israeli | 46 | 0.3% |
| Italian | 1,024 | 7.7% |
| Japanese | 62 | 0.5% |
| Korean | 97 | 0.7% |
| Latvian | 11 | 0.1% |
| Lithuanian | 45 | 0.3% |
| Luxembourger | 10 | 0.1% |
| Mexican | 200 | 1.5% |
| Moroccan | 24 | 0.2% |
| Native Hawaiian | 7 | 0.1% |
| Nicaraguan | 207 | 1.5% |
| Northern European | 9 | 0.1% |
| Norwegian | 40 | 0.3% |
| Pakistani | 142 | 1.1% |
| Panamanian | 281 | 2.1% |
| Peruvian | 323 | 2.4% |
| Polish | 322 | 2.4% |
| Pueblo | 5 | 0.0% |
| Puerto Rican | 276 | 2.1% |
| Russian | 89 | 0.7% |
| Salvadoran | 175 | 1.3% |
| Scandinavian | 41 | 0.3% |
| Scotch-Irish | 22 | 0.2% |
| Scottish | 246 | 1.8% |
| Slovak | 56 | 0.4% |
| Somali | 51 | 0.4% |
| South American | 539 | 4.0% |
| Spaniard | 88 | 0.7% |
| Spanish American Indian | 10 | 0.1% |
| Sri Lankan | 114 | 0.9% |
| Subsaharan African | 739 | 5.5% |
| Swedish | 42 | 0.3% |
| Swiss | 38 | 0.3% |
| Thai | 1,215 | 9.1% |
| Trinidadian and Tobagonian | 181 | 1.3% |
| Turkish | 82 | 0.6% |
| U.S. Virgin Islander | 47 | 0.4% |
| Ukrainian | 132 | 1.0% |
| Venezuelan | 40 | 0.3% |
| Welsh | 92 | 0.7% |
| Yugoslavian | 13 | 0.1% |
| Yuman | 78 | 0.6% | View All 80 Rows |
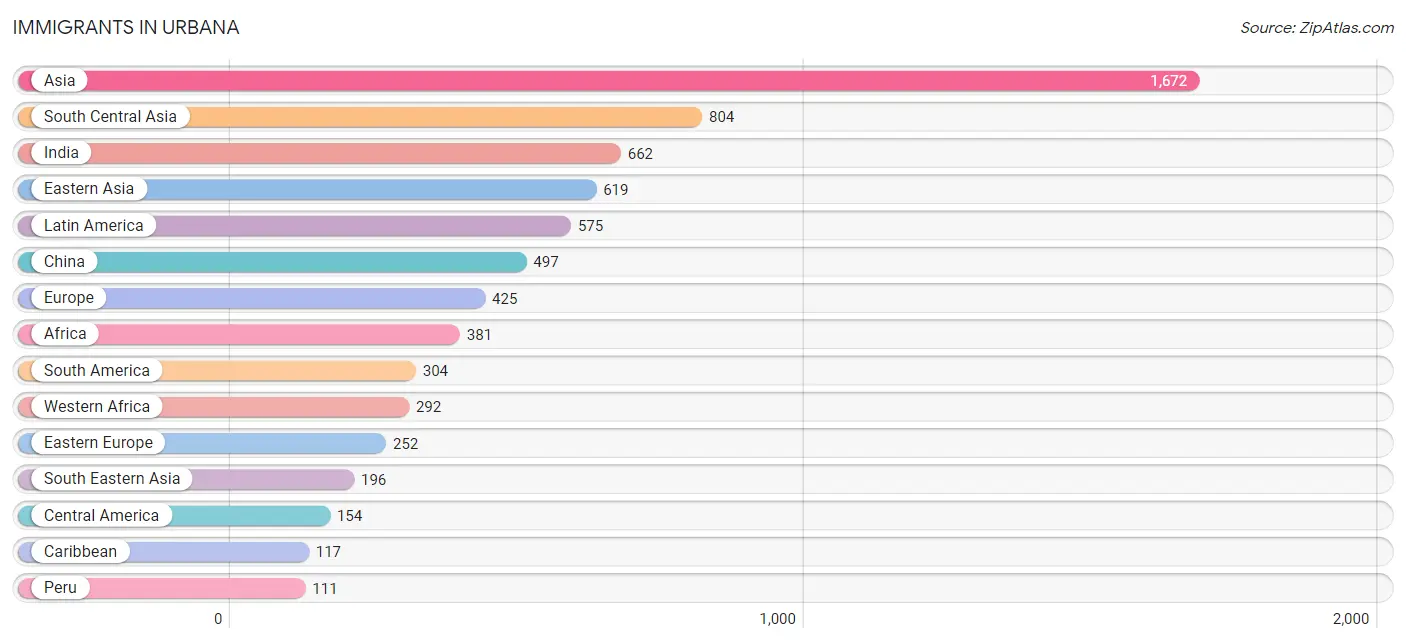
Immigrants in Urbana
The most numerous immigrant groups reported in Urbana came from Asia (1,672 | 12.5%), South Central Asia (804 | 6.0%), India (662 | 5.0%), Eastern Asia (619 | 4.6%), and Latin America (575 | 4.3%), together accounting for 32.4% of all Urbana residents.
| Immigration Origin | # Population | % Population |
| Afghanistan | 31 | 0.2% |
| Africa | 381 | 2.9% |
| Asia | 1,672 | 12.5% |
| Australia | 38 | 0.3% |
| Bolivia | 19 | 0.1% |
| Bosnia and Herzegovina | 13 | 0.1% |
| Brazil | 26 | 0.2% |
| Bulgaria | 19 | 0.1% |
| Cambodia | 15 | 0.1% |
| Cameroon | 9 | 0.1% |
| Canada | 36 | 0.3% |
| Caribbean | 117 | 0.9% |
| Central America | 154 | 1.1% |
| China | 497 | 3.7% |
| Colombia | 88 | 0.7% |
| Cuba | 15 | 0.1% |
| Eastern Africa | 49 | 0.4% |
| Eastern Asia | 619 | 4.6% |
| Eastern Europe | 252 | 1.9% |
| Ecuador | 13 | 0.1% |
| Egypt | 8 | 0.1% |
| El Salvador | 8 | 0.1% |
| Europe | 425 | 3.2% |
| France | 50 | 0.4% |
| Germany | 24 | 0.2% |
| Ghana | 108 | 0.8% |
| Guatemala | 28 | 0.2% |
| Guyana | 17 | 0.1% |
| Honduras | 40 | 0.3% |
| Hong Kong | 13 | 0.1% |
| Hungary | 4 | 0.0% |
| India | 662 | 5.0% |
| Israel | 12 | 0.1% |
| Jamaica | 18 | 0.1% |
| Japan | 32 | 0.2% |
| Korea | 90 | 0.7% |
| Latin America | 575 | 4.3% |
| Lebanon | 10 | 0.1% |
| Middle Africa | 9 | 0.1% |
| Morocco | 12 | 0.1% |
| Nepal | 33 | 0.3% |
| Netherlands | 12 | 0.1% |
| Nicaragua | 10 | 0.1% |
| Nigeria | 74 | 0.5% |
| Northern Africa | 20 | 0.2% |
| Northern Europe | 66 | 0.5% |
| Oceania | 38 | 0.3% |
| Pakistan | 78 | 0.6% |
| Panama | 68 | 0.5% |
| Peru | 111 | 0.8% |
| Philippines | 11 | 0.1% |
| Poland | 71 | 0.5% |
| Russia | 39 | 0.3% |
| Senegal | 44 | 0.3% |
| Sierra Leone | 12 | 0.1% |
| Somalia | 31 | 0.2% |
| South Africa | 11 | 0.1% |
| South America | 304 | 2.3% |
| South Central Asia | 804 | 6.0% |
| South Eastern Asia | 196 | 1.5% |
| Southern Europe | 21 | 0.2% |
| Spain | 21 | 0.2% |
| Sweden | 3 | 0.0% |
| Taiwan | 33 | 0.3% |
| Thailand | 91 | 0.7% |
| Trinidad and Tobago | 75 | 0.6% |
| Turkey | 31 | 0.2% |
| Ukraine | 106 | 0.8% |
| Venezuela | 30 | 0.2% |
| Vietnam | 79 | 0.6% |
| Western Africa | 292 | 2.2% |
| Western Asia | 53 | 0.4% |
| Western Europe | 86 | 0.6% | View All 73 Rows |
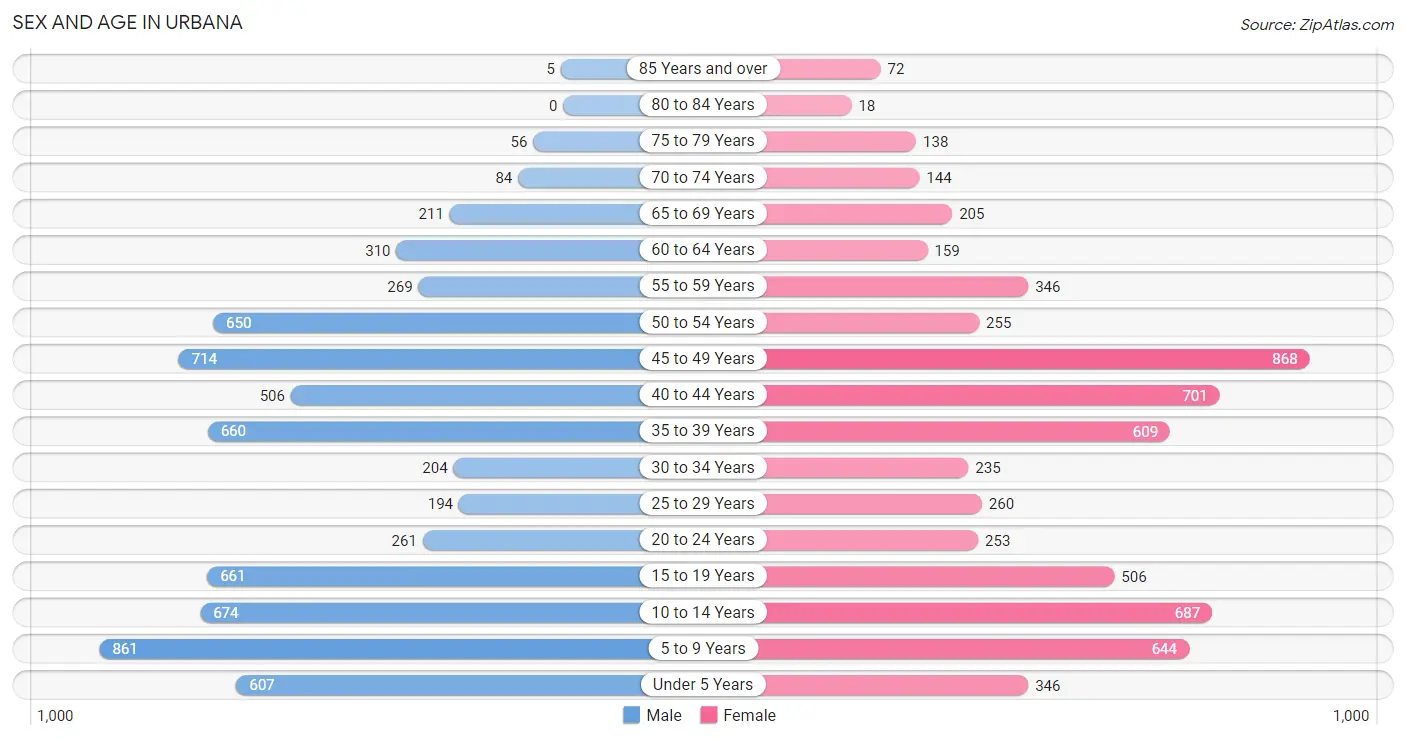
Sex and Age in Urbana
Sex and Age in Urbana
The most populous age groups in Urbana are 5 to 9 Years (861 | 12.4%) for men and 45 to 49 Years (868 | 13.5%) for women.
| Age Bracket | Male | Female |
| Under 5 Years | 607 (8.8%) | 346 (5.4%) |
| 5 to 9 Years | 861 (12.4%) | 644 (10.0%) |
| 10 to 14 Years | 674 (9.7%) | 687 (10.7%) |
| 15 to 19 Years | 661 (9.5%) | 506 (7.9%) |
| 20 to 24 Years | 261 (3.8%) | 253 (3.9%) |
| 25 to 29 Years | 194 (2.8%) | 260 (4.0%) |
| 30 to 34 Years | 204 (2.9%) | 235 (3.6%) |
| 35 to 39 Years | 660 (9.5%) | 609 (9.5%) |
| 40 to 44 Years | 506 (7.3%) | 701 (10.9%) |
| 45 to 49 Years | 714 (10.3%) | 868 (13.5%) |
| 50 to 54 Years | 650 (9.4%) | 255 (4.0%) |
| 55 to 59 Years | 269 (3.9%) | 346 (5.4%) |
| 60 to 64 Years | 310 (4.5%) | 159 (2.5%) |
| 65 to 69 Years | 211 (3.0%) | 205 (3.2%) |
| 70 to 74 Years | 84 (1.2%) | 144 (2.2%) |
| 75 to 79 Years | 56 (0.8%) | 138 (2.1%) |
| 80 to 84 Years | 0 (0.0%) | 18 (0.3%) |
| 85 Years and over | 5 (0.1%) | 72 (1.1%) |
| Total | 6,927 (100.0%) | 6,446 (100.0%) |
Families and Households in Urbana
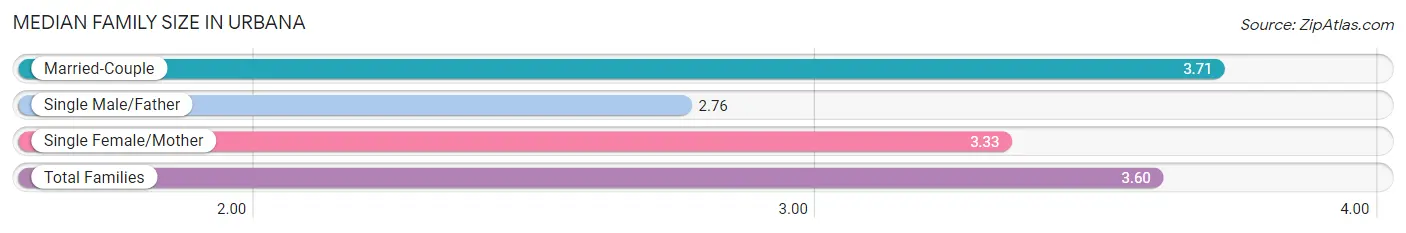
Median Family Size in Urbana
The median family size in Urbana is 3.60 persons per family, with married-couple families (2,842 | 82.9%) accounting for the largest median family size of 3.71 persons per family. On the other hand, single male/father families (259 | 7.6%) represent the smallest median family size with 2.76 persons per family.
| Family Type | # Families | Family Size |
| Married-Couple | 2,842 (82.9%) | 3.71 |
| Single Male/Father | 259 (7.6%) | 2.76 |
| Single Female/Mother | 326 (9.5%) | 3.33 |
| Total Families | 3,427 (100.0%) | 3.60 |
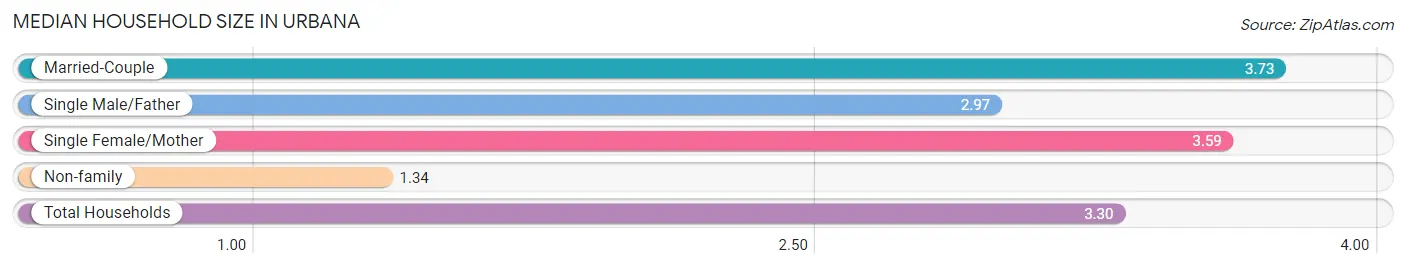
Median Household Size in Urbana
The median household size in Urbana is 3.30 persons per household, with married-couple households (2,842 | 70.1%) accounting for the largest median household size of 3.73 persons per household. non-family households (625 | 15.4%) represent the smallest median household size with 1.34 persons per household.
| Household Type | # Households | Household Size |
| Married-Couple | 2,842 (70.1%) | 3.73 |
| Single Male/Father | 259 (6.4%) | 2.97 |
| Single Female/Mother | 326 (8.1%) | 3.59 |
| Non-family | 625 (15.4%) | 1.34 |
| Total Households | 4,052 (100.0%) | 3.30 |
Household Size by Marriage Status in Urbana
Out of a total of 4,052 households in Urbana, 3,427 (84.6%) are family households, while 625 (15.4%) are nonfamily households. The most numerous type of family households are 4-person households, comprising 1,289, and the most common type of nonfamily households are 1-person households, comprising 471.
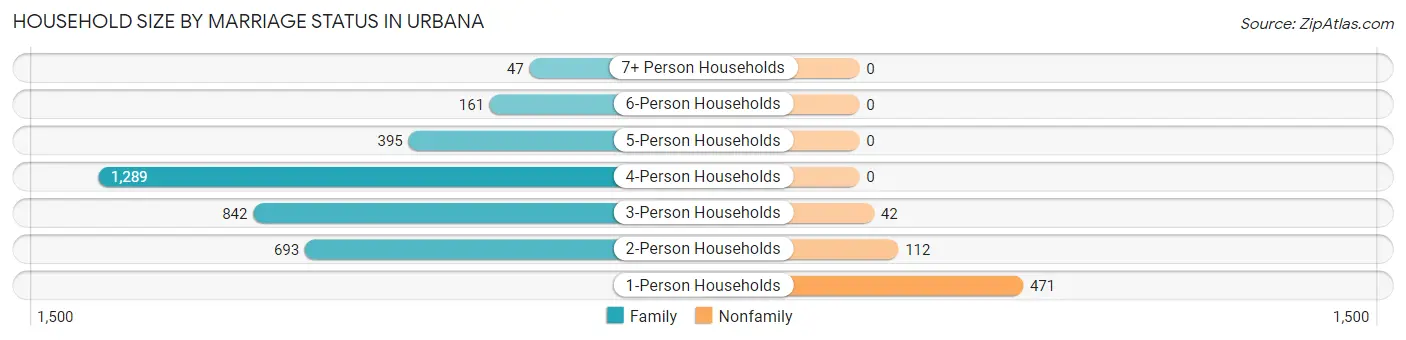
| Household Size | Family Households | Nonfamily Households |
| 1-Person Households | - | 471 (11.6%) |
| 2-Person Households | 693 (17.1%) | 112 (2.8%) |
| 3-Person Households | 842 (20.8%) | 42 (1.0%) |
| 4-Person Households | 1,289 (31.8%) | 0 (0.0%) |
| 5-Person Households | 395 (9.8%) | 0 (0.0%) |
| 6-Person Households | 161 (4.0%) | 0 (0.0%) |
| 7+ Person Households | 47 (1.2%) | 0 (0.0%) |
| Total | 3,427 (84.6%) | 625 (15.4%) |
Female Fertility in Urbana
Fertility by Age in Urbana
Average fertility rate in Urbana is 69.0 births per 1,000 women. Women in the age bracket of 20 to 34 years have the highest fertility rate with 265.0 births per 1,000 women. Women in the age bracket of 20 to 34 years acount for 81.5% of all women with births.
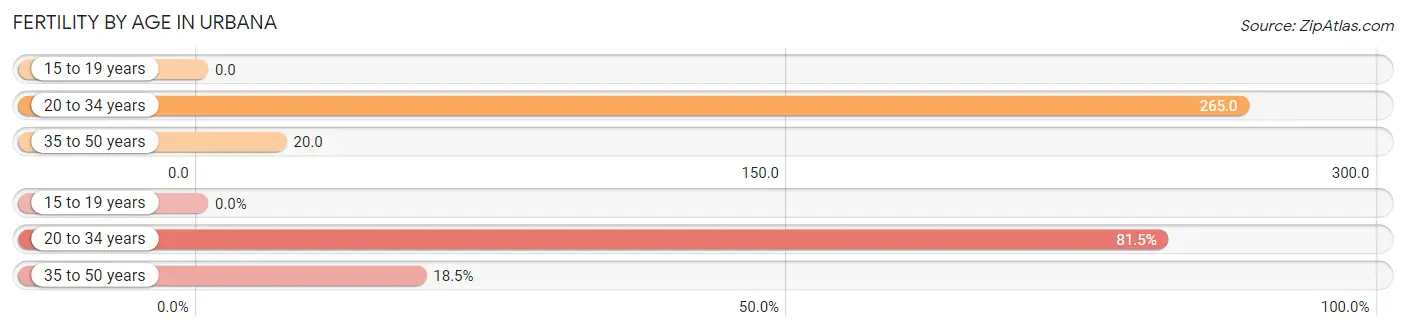
| Age Bracket | Women with Births | Births / 1,000 Women |
| 15 to 19 years | 0 (0.0%) | 0.0 |
| 20 to 34 years | 198 (81.5%) | 265.0 |
| 35 to 50 years | 45 (18.5%) | 20.0 |
| Total | 243 (100.0%) | 69.0 |
Fertility by Age by Marriage Status in Urbana
70.8% of women with births (243) in Urbana are married. The highest percentage of unmarried women with births falls into 20 to 34 years age bracket with 35.9% of them unmarried at the time of birth, while the lowest percentage of unmarried women with births belong to 35 to 50 years age bracket with 0.0% of them unmarried.
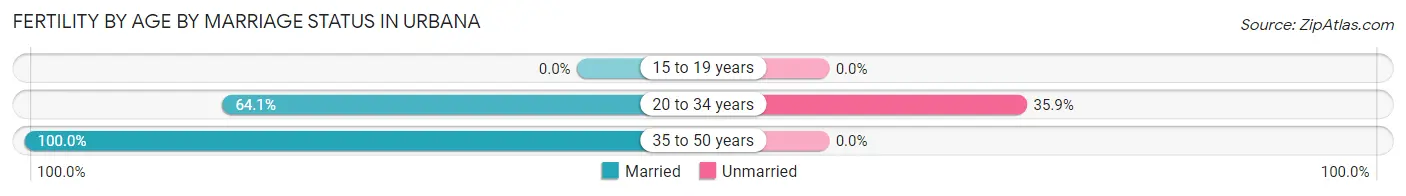
| Age Bracket | Married | Unmarried |
| 15 to 19 years | 0 (0.0%) | 0 (0.0%) |
| 20 to 34 years | 127 (64.1%) | 71 (35.9%) |
| 35 to 50 years | 45 (100.0%) | 0 (0.0%) |
| Total | 172 (70.8%) | 71 (29.2%) |
Fertility by Education in Urbana
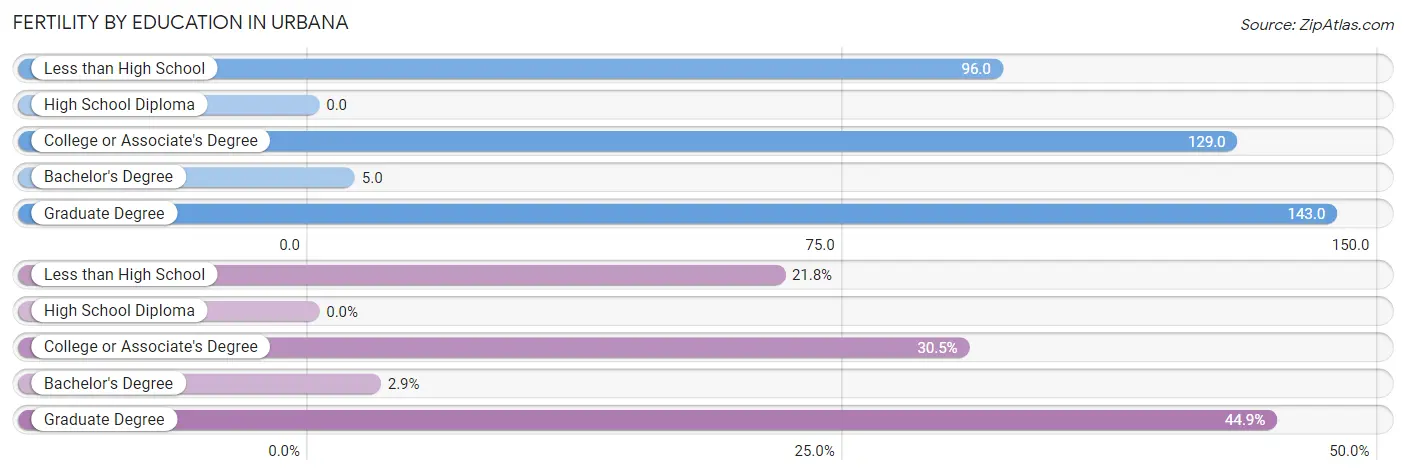
| Educational Attainment | Women with Births | Births / 1,000 Women |
| Less than High School | 53 (21.8%) | 96.0 |
| High School Diploma | 0 (0.0%) | 0.0 |
| College or Associate's Degree | 74 (30.4%) | 129.0 |
| Bachelor's Degree | 7 (2.9%) | 5.0 |
| Graduate Degree | 109 (44.9%) | 143.0 |
| Total | 243 (100.0%) | 69.0 |
Fertility by Education by Marriage Status in Urbana
29.2% of women with births in Urbana are unmarried. Women with the educational attainment of bachelor's degree are most likely to be married with 100.0% of them married at childbirth, while women with the educational attainment of less than high school are least likely to be married with 100.0% of them unmarried at childbirth.
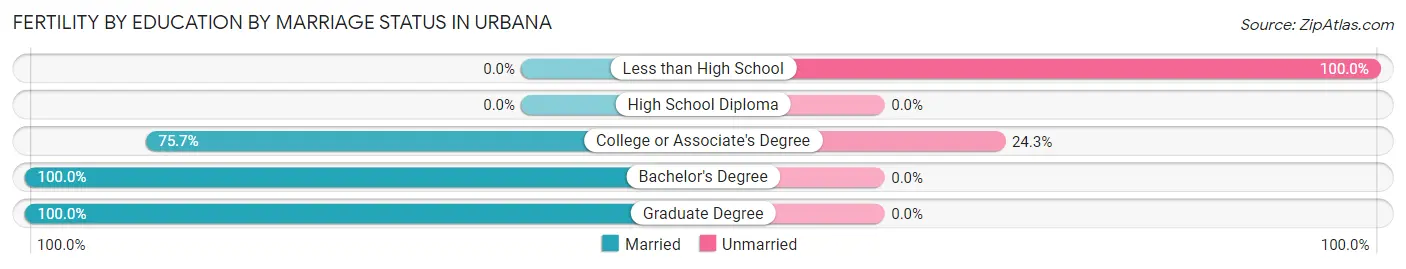
| Educational Attainment | Married | Unmarried |
| Less than High School | 0 (0.0%) | 53 (100.0%) |
| High School Diploma | 0 (0.0%) | 0 (0.0%) |
| College or Associate's Degree | 56 (75.7%) | 18 (24.3%) |
| Bachelor's Degree | 7 (100.0%) | 0 (0.0%) |
| Graduate Degree | 109 (100.0%) | 0 (0.0%) |
| Total | 172 (70.8%) | 71 (29.2%) |
Employment Characteristics in Urbana
Employment by Class of Employer in Urbana
Among the 6,752 employed individuals in Urbana, private company employees (4,144 | 61.4%), federal government employees (774 | 11.5%), and not-for-profit organizations (611 | 9.0%) make up the most common classes of employment.
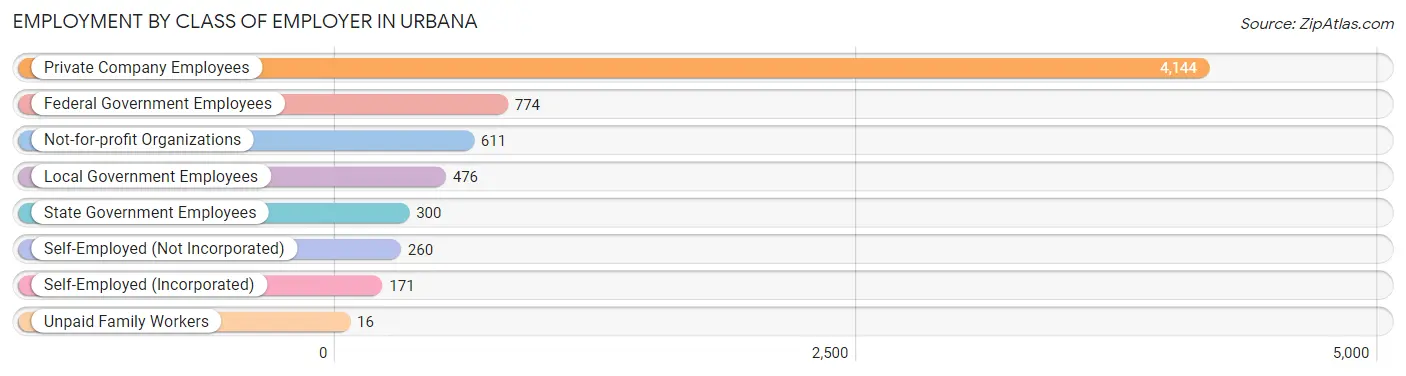
| Employer Class | # Employees | % Employees |
| Private Company Employees | 4,144 | 61.4% |
| Self-Employed (Incorporated) | 171 | 2.5% |
| Self-Employed (Not Incorporated) | 260 | 3.8% |
| Not-for-profit Organizations | 611 | 9.0% |
| Local Government Employees | 476 | 7.0% |
| State Government Employees | 300 | 4.4% |
| Federal Government Employees | 774 | 11.5% |
| Unpaid Family Workers | 16 | 0.2% |
| Total | 6,752 | 100.0% |
Employment Status by Age in Urbana
According to the labor force statistics for Urbana, out of the total population over 16 years of age (9,180), 78.2% or 7,179 individuals are in the labor force, with 4.3% or 309 of them unemployed. The age group with the highest labor force participation rate is 45 to 54 years, with 94.2% or 2,343 individuals in the labor force. Within the labor force, the 16 to 19 years age range has the highest percentage of unemployed individuals, with 37.4% or 101 of them being unemployed.
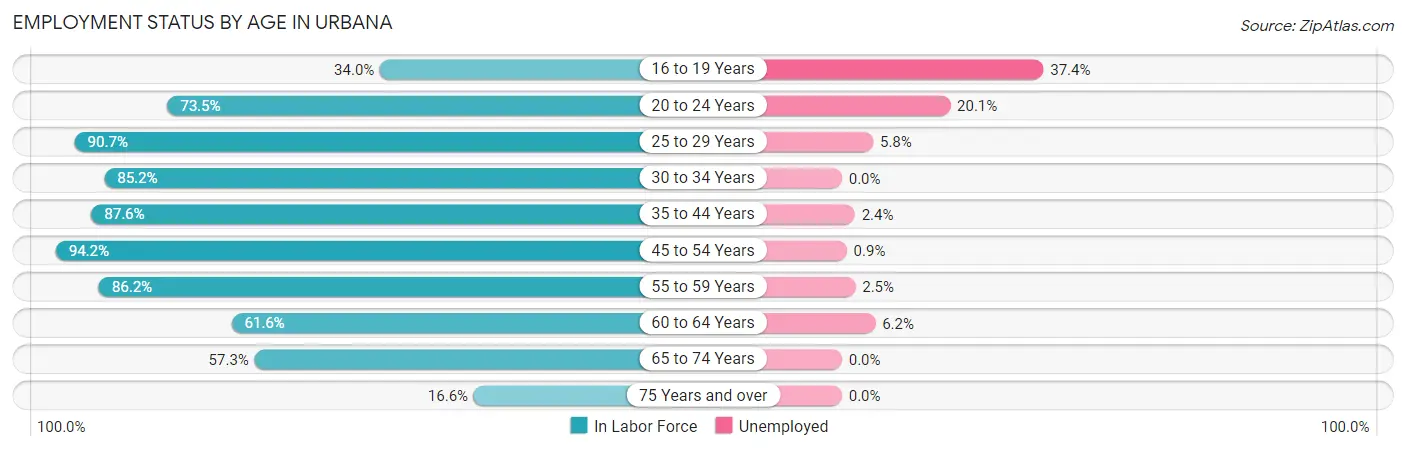
| Age Bracket | In Labor Force | Unemployed |
| 16 to 19 Years | 270 (34.0%) | 101 (37.4%) |
| 20 to 24 Years | 378 (73.5%) | 76 (20.1%) |
| 25 to 29 Years | 412 (90.7%) | 24 (5.8%) |
| 30 to 34 Years | 374 (85.2%) | 0 (0.0%) |
| 35 to 44 Years | 2,169 (87.6%) | 52 (2.4%) |
| 45 to 54 Years | 2,343 (94.2%) | 21 (0.9%) |
| 55 to 59 Years | 530 (86.2%) | 13 (2.5%) |
| 60 to 64 Years | 289 (61.6%) | 18 (6.2%) |
| 65 to 74 Years | 369 (57.3%) | 0 (0.0%) |
| 75 Years and over | 48 (16.6%) | 0 (0.0%) |
| Total | 7,179 (78.2%) | 309 (4.3%) |
Employment Status by Educational Attainment in Urbana
According to labor force statistics for Urbana, 88.1% of individuals (6,114) out of the total population between 25 and 64 years of age (6,940) are in the labor force, with 2.1% or 128 of them being unemployed. The group with the highest labor force participation rate are those with the educational attainment of less than high school, with 100.0% or 130 individuals in the labor force. Within the labor force, individuals with less than high school education have the highest percentage of unemployment, with 5.4% or 7 of them being unemployed.
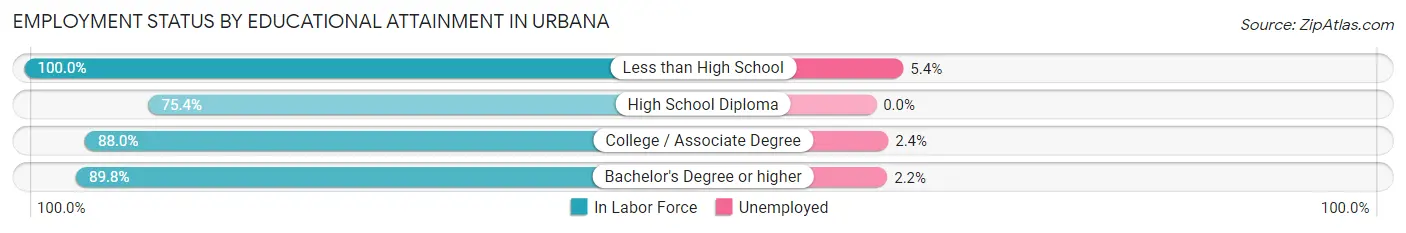
| Educational Attainment | In Labor Force | Unemployed |
| Less than High School | 130 (100.0%) | 7 (5.4%) |
| High School Diploma | 564 (75.4%) | 0 (0.0%) |
| College / Associate Degree | 1,104 (88.0%) | 30 (2.4%) |
| Bachelor's Degree or higher | 4,317 (89.8%) | 106 (2.2%) |
| Total | 6,114 (88.1%) | 146 (2.1%) |
Employment Occupations by Sex in Urbana
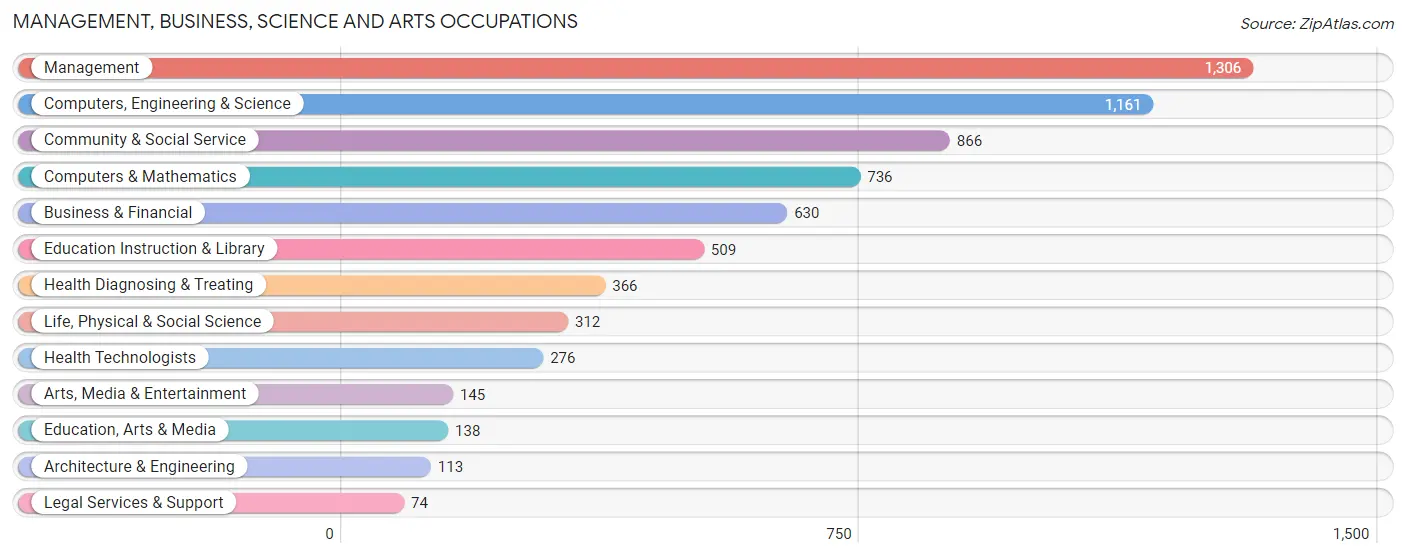
Management, Business, Science and Arts Occupations
The most common Management, Business, Science and Arts occupations in Urbana are Management (1,306 | 19.3%), Computers, Engineering & Science (1,161 | 17.1%), Community & Social Service (866 | 12.8%), Computers & Mathematics (736 | 10.9%), and Business & Financial (630 | 9.3%).
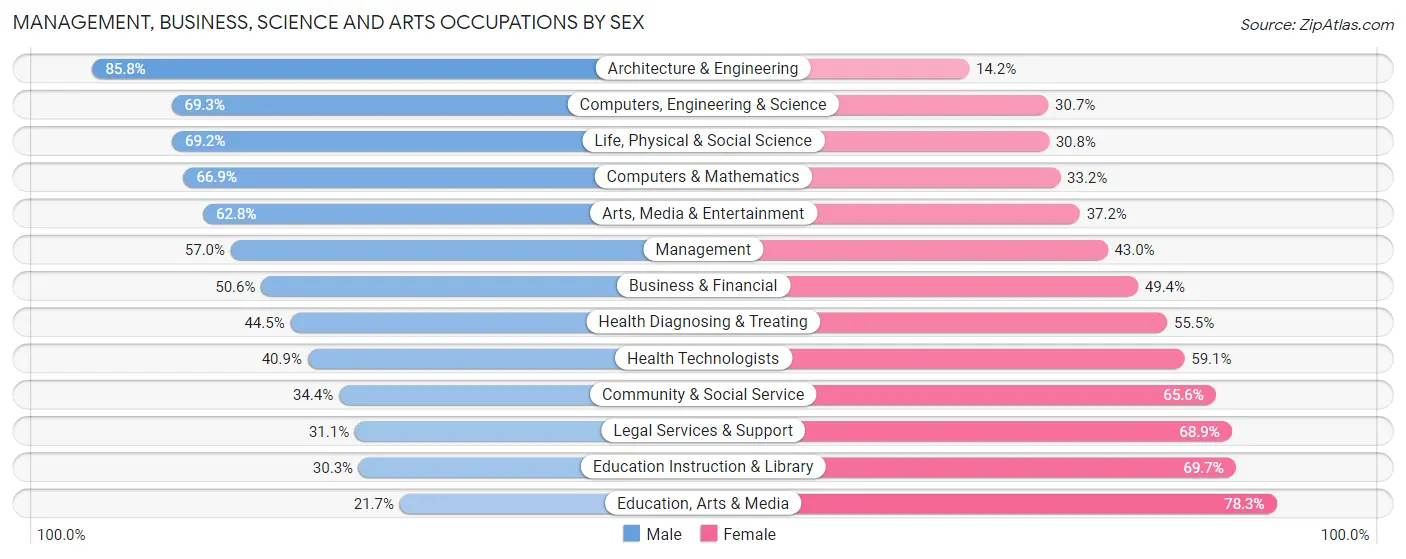
Management, Business, Science and Arts Occupations by Sex
Within the Management, Business, Science and Arts occupations in Urbana, the most male-oriented occupations are Architecture & Engineering (85.8%), Computers, Engineering & Science (69.3%), and Life, Physical & Social Science (69.2%), while the most female-oriented occupations are Education, Arts & Media (78.3%), Education Instruction & Library (69.7%), and Legal Services & Support (68.9%).
| Occupation | Male | Female |
| Management | 744 (57.0%) | 562 (43.0%) |
| Business & Financial | 319 (50.6%) | 311 (49.4%) |
| Computers, Engineering & Science | 805 (69.3%) | 356 (30.7%) |
| Computers & Mathematics | 492 (66.8%) | 244 (33.2%) |
| Architecture & Engineering | 97 (85.8%) | 16 (14.2%) |
| Life, Physical & Social Science | 216 (69.2%) | 96 (30.8%) |
| Community & Social Service | 298 (34.4%) | 568 (65.6%) |
| Education, Arts & Media | 30 (21.7%) | 108 (78.3%) |
| Legal Services & Support | 23 (31.1%) | 51 (68.9%) |
| Education Instruction & Library | 154 (30.3%) | 355 (69.7%) |
| Arts, Media & Entertainment | 91 (62.8%) | 54 (37.2%) |
| Health Diagnosing & Treating | 163 (44.5%) | 203 (55.5%) |
| Health Technologists | 113 (40.9%) | 163 (59.1%) |
| Total (Category) | 2,329 (53.8%) | 2,000 (46.2%) |
| Total (Overall) | 3,615 (53.4%) | 3,160 (46.6%) |
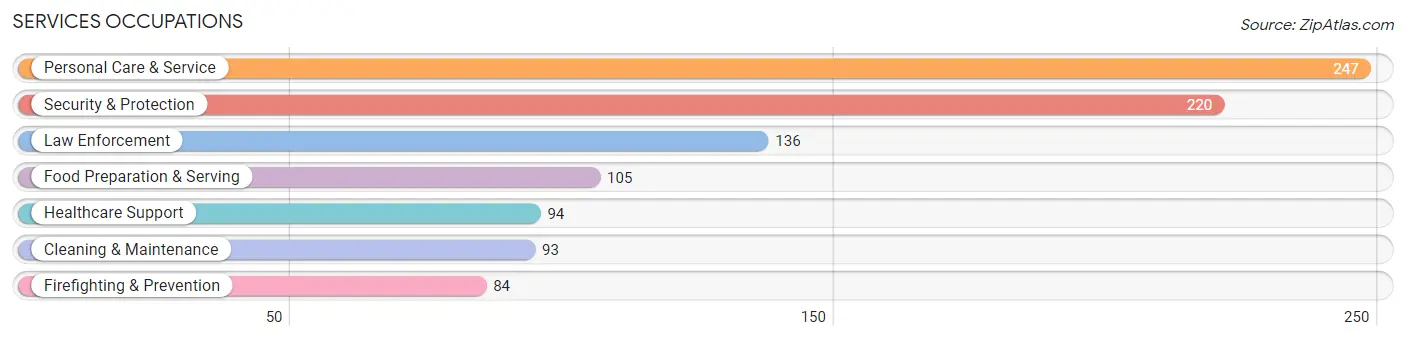
Services Occupations
The most common Services occupations in Urbana are Personal Care & Service (247 | 3.6%), Security & Protection (220 | 3.3%), Law Enforcement (136 | 2.0%), Food Preparation & Serving (105 | 1.5%), and Healthcare Support (94 | 1.4%).
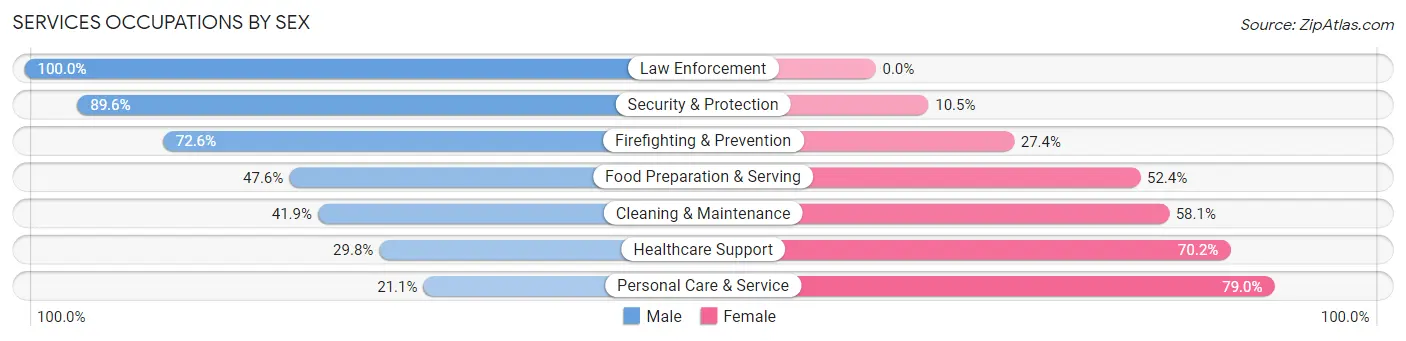
Services Occupations by Sex
Within the Services occupations in Urbana, the most male-oriented occupations are Law Enforcement (100.0%), Security & Protection (89.5%), and Firefighting & Prevention (72.6%), while the most female-oriented occupations are Personal Care & Service (78.9%), Healthcare Support (70.2%), and Cleaning & Maintenance (58.1%).
| Occupation | Male | Female |
| Healthcare Support | 28 (29.8%) | 66 (70.2%) |
| Security & Protection | 197 (89.5%) | 23 (10.4%) |
| Firefighting & Prevention | 61 (72.6%) | 23 (27.4%) |
| Law Enforcement | 136 (100.0%) | 0 (0.0%) |
| Food Preparation & Serving | 50 (47.6%) | 55 (52.4%) |
| Cleaning & Maintenance | 39 (41.9%) | 54 (58.1%) |
| Personal Care & Service | 52 (21.0%) | 195 (78.9%) |
| Total (Category) | 366 (48.2%) | 393 (51.8%) |
| Total (Overall) | 3,615 (53.4%) | 3,160 (46.6%) |
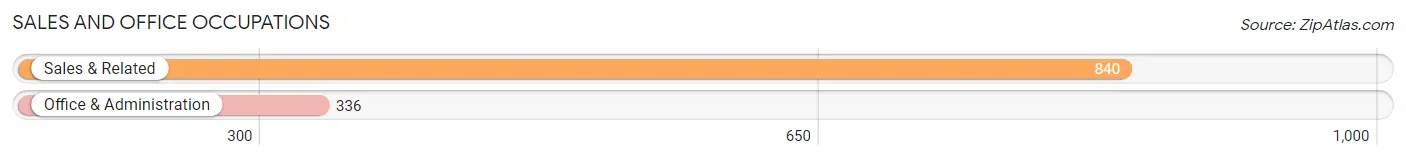
Sales and Office Occupations
The most common Sales and Office occupations in Urbana are Sales & Related (840 | 12.4%), and Office & Administration (336 | 5.0%).
Sales and Office Occupations by Sex
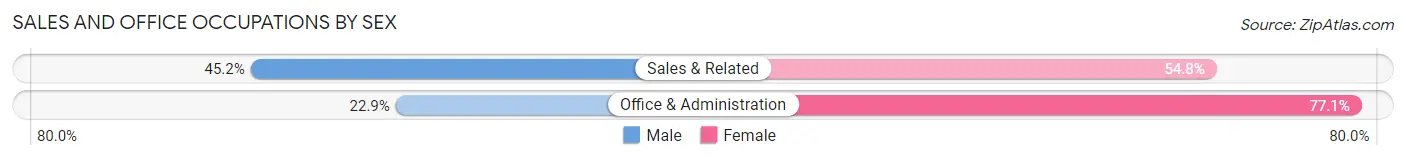
| Occupation | Male | Female |
| Sales & Related | 380 (45.2%) | 460 (54.8%) |
| Office & Administration | 77 (22.9%) | 259 (77.1%) |
| Total (Category) | 457 (38.9%) | 719 (61.1%) |
| Total (Overall) | 3,615 (53.4%) | 3,160 (46.6%) |
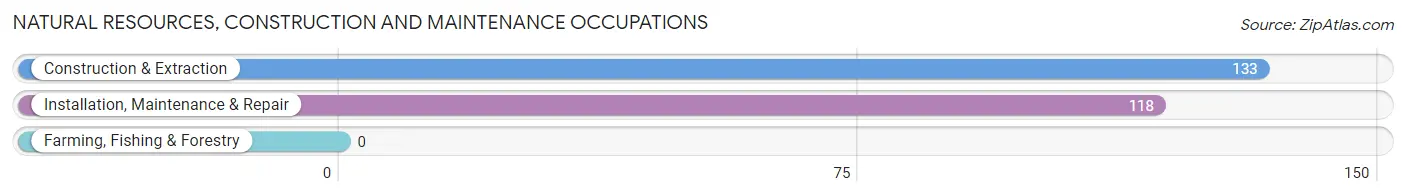
Natural Resources, Construction and Maintenance Occupations
The most common Natural Resources, Construction and Maintenance occupations in Urbana are Construction & Extraction (133 | 2.0%), and Installation, Maintenance & Repair (118 | 1.7%).
Natural Resources, Construction and Maintenance Occupations by Sex
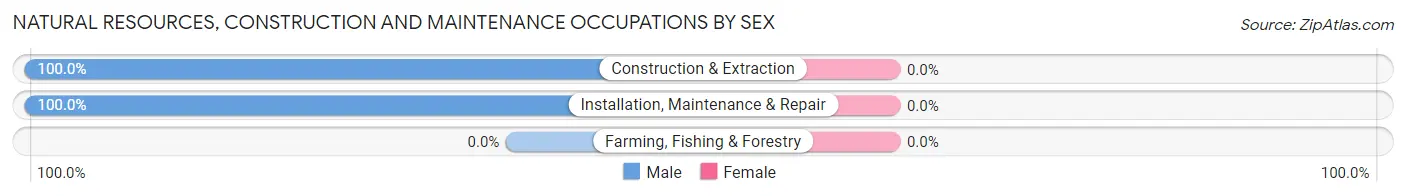
| Occupation | Male | Female |
| Farming, Fishing & Forestry | 0 (0.0%) | 0 (0.0%) |
| Construction & Extraction | 133 (100.0%) | 0 (0.0%) |
| Installation, Maintenance & Repair | 118 (100.0%) | 0 (0.0%) |
| Total (Category) | 251 (100.0%) | 0 (0.0%) |
| Total (Overall) | 3,615 (53.4%) | 3,160 (46.6%) |
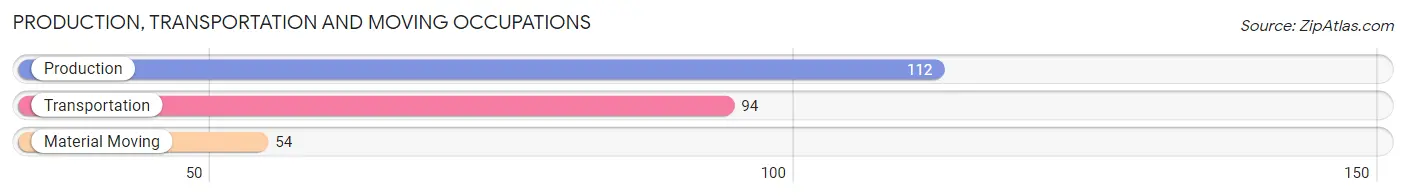
Production, Transportation and Moving Occupations
The most common Production, Transportation and Moving occupations in Urbana are Production (112 | 1.7%), Transportation (94 | 1.4%), and Material Moving (54 | 0.8%).
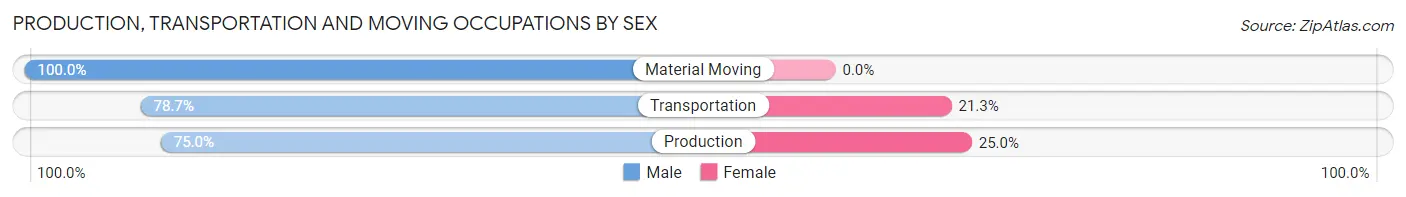
Production, Transportation and Moving Occupations by Sex
| Occupation | Male | Female |
| Production | 84 (75.0%) | 28 (25.0%) |
| Transportation | 74 (78.7%) | 20 (21.3%) |
| Material Moving | 54 (100.0%) | 0 (0.0%) |
| Total (Category) | 212 (81.5%) | 48 (18.5%) |
| Total (Overall) | 3,615 (53.4%) | 3,160 (46.6%) |
Employment Industries by Sex in Urbana
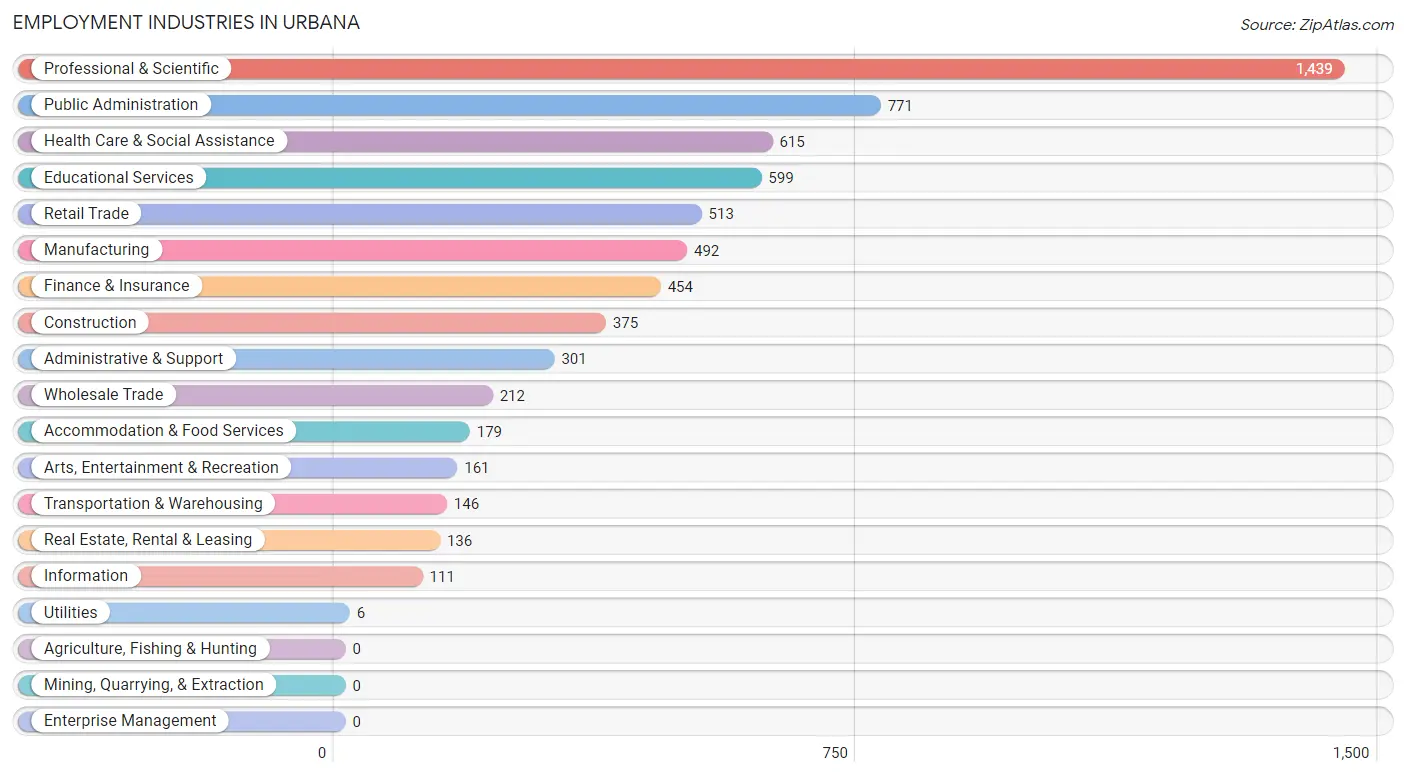
Employment Industries in Urbana
The major employment industries in Urbana include Professional & Scientific (1,439 | 21.2%), Public Administration (771 | 11.4%), Health Care & Social Assistance (615 | 9.1%), Educational Services (599 | 8.8%), and Retail Trade (513 | 7.6%).
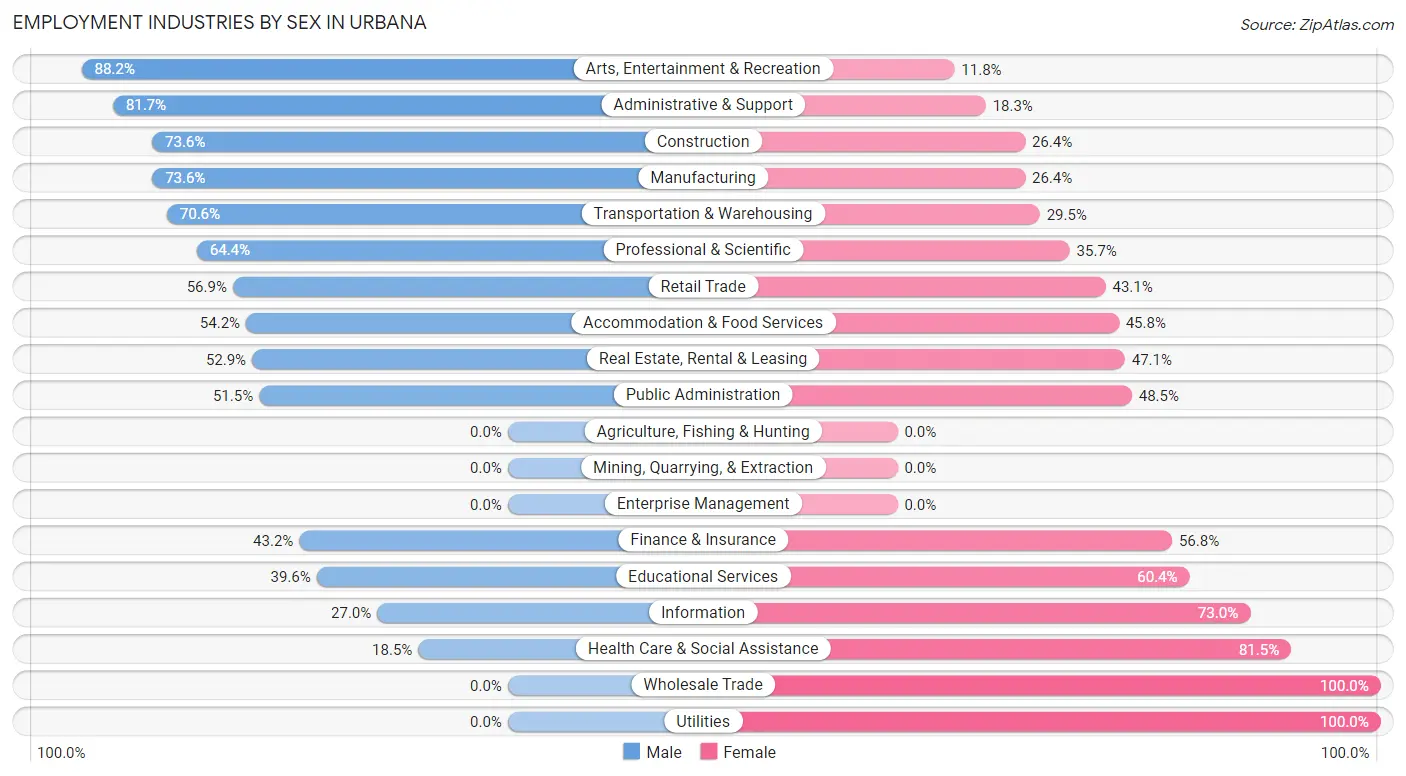
Employment Industries by Sex in Urbana
The Urbana industries that see more men than women are Arts, Entertainment & Recreation (88.2%), Administrative & Support (81.7%), and Construction (73.6%), whereas the industries that tend to have a higher number of women are Wholesale Trade (100.0%), Utilities (100.0%), and Health Care & Social Assistance (81.5%).
| Industry | Male | Female |
| Agriculture, Fishing & Hunting | 0 (0.0%) | 0 (0.0%) |
| Mining, Quarrying, & Extraction | 0 (0.0%) | 0 (0.0%) |
| Construction | 276 (73.6%) | 99 (26.4%) |
| Manufacturing | 362 (73.6%) | 130 (26.4%) |
| Wholesale Trade | 0 (0.0%) | 212 (100.0%) |
| Retail Trade | 292 (56.9%) | 221 (43.1%) |
| Transportation & Warehousing | 103 (70.6%) | 43 (29.4%) |
| Utilities | 0 (0.0%) | 6 (100.0%) |
| Information | 30 (27.0%) | 81 (73.0%) |
| Finance & Insurance | 196 (43.2%) | 258 (56.8%) |
| Real Estate, Rental & Leasing | 72 (52.9%) | 64 (47.1%) |
| Professional & Scientific | 926 (64.3%) | 513 (35.6%) |
| Enterprise Management | 0 (0.0%) | 0 (0.0%) |
| Administrative & Support | 246 (81.7%) | 55 (18.3%) |
| Educational Services | 237 (39.6%) | 362 (60.4%) |
| Health Care & Social Assistance | 114 (18.5%) | 501 (81.5%) |
| Arts, Entertainment & Recreation | 142 (88.2%) | 19 (11.8%) |
| Accommodation & Food Services | 97 (54.2%) | 82 (45.8%) |
| Public Administration | 397 (51.5%) | 374 (48.5%) |
| Total | 3,615 (53.4%) | 3,160 (46.6%) |
Education in Urbana
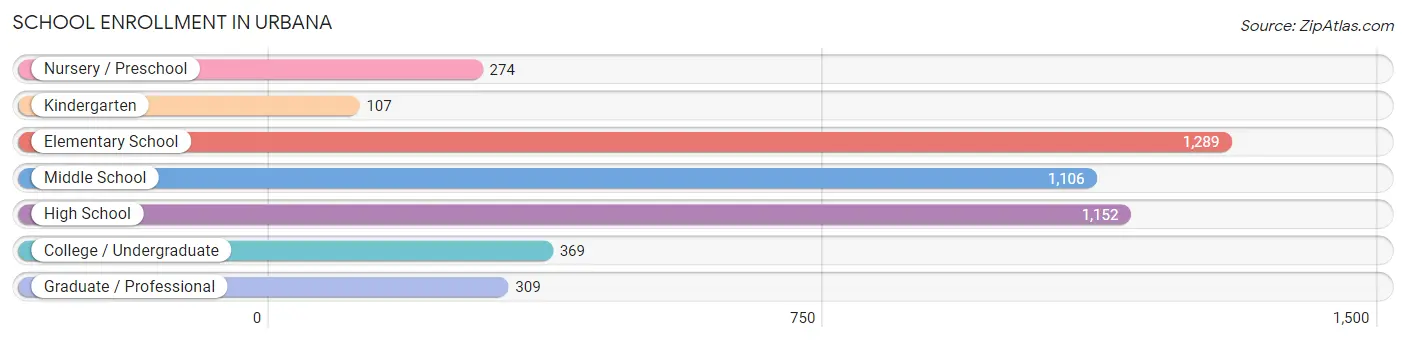
School Enrollment in Urbana
The most common levels of schooling among the 4,606 students in Urbana are elementary school (1,289 | 28.0%), high school (1,152 | 25.0%), and middle school (1,106 | 24.0%).
| School Level | # Students | % Students |
| Nursery / Preschool | 274 | 5.9% |
| Kindergarten | 107 | 2.3% |
| Elementary School | 1,289 | 28.0% |
| Middle School | 1,106 | 24.0% |
| High School | 1,152 | 25.0% |
| College / Undergraduate | 369 | 8.0% |
| Graduate / Professional | 309 | 6.7% |
| Total | 4,606 | 100.0% |
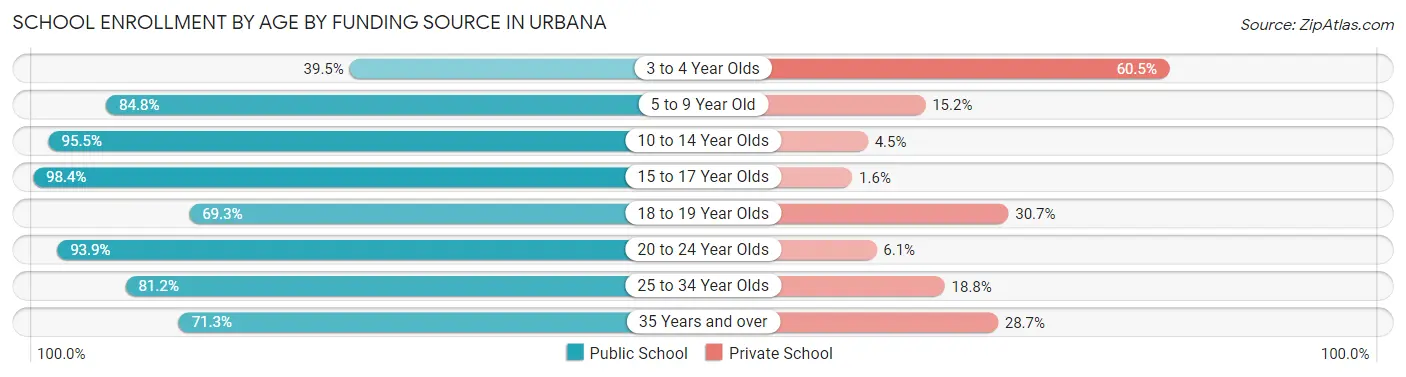
School Enrollment by Age by Funding Source in Urbana
Out of a total of 4,606 students who are enrolled in schools in Urbana, 544 (11.8%) attend a private institution, while the remaining 4,062 (88.2%) are enrolled in public schools. The age group of 3 to 4 year olds has the highest likelihood of being enrolled in private schools, with 112 (60.5% in the age bracket) enrolled. Conversely, the age group of 15 to 17 year olds has the lowest likelihood of being enrolled in a private school, with 935 (98.4% in the age bracket) attending a public institution.
| Age Bracket | Public School | Private School |
| 3 to 4 Year Olds | 73 (39.5%) | 112 (60.5%) |
| 5 to 9 Year Old | 1,206 (84.8%) | 216 (15.2%) |
| 10 to 14 Year Olds | 1,258 (95.5%) | 59 (4.5%) |
| 15 to 17 Year Olds | 935 (98.4%) | 15 (1.6%) |
| 18 to 19 Year Olds | 104 (69.3%) | 46 (30.7%) |
| 20 to 24 Year Olds | 247 (93.9%) | 16 (6.1%) |
| 25 to 34 Year Olds | 95 (81.2%) | 22 (18.8%) |
| 35 Years and over | 144 (71.3%) | 58 (28.7%) |
| Total | 4,062 (88.2%) | 544 (11.8%) |
Educational Attainment by Field of Study in Urbana
Business (997 | 17.7%), social sciences (682 | 12.1%), engineering (679 | 12.1%), bio, nature & agricultural (483 | 8.6%), and science & technology (409 | 7.3%) are the most common fields of study among 5,627 individuals in Urbana who have obtained a bachelor's degree or higher.
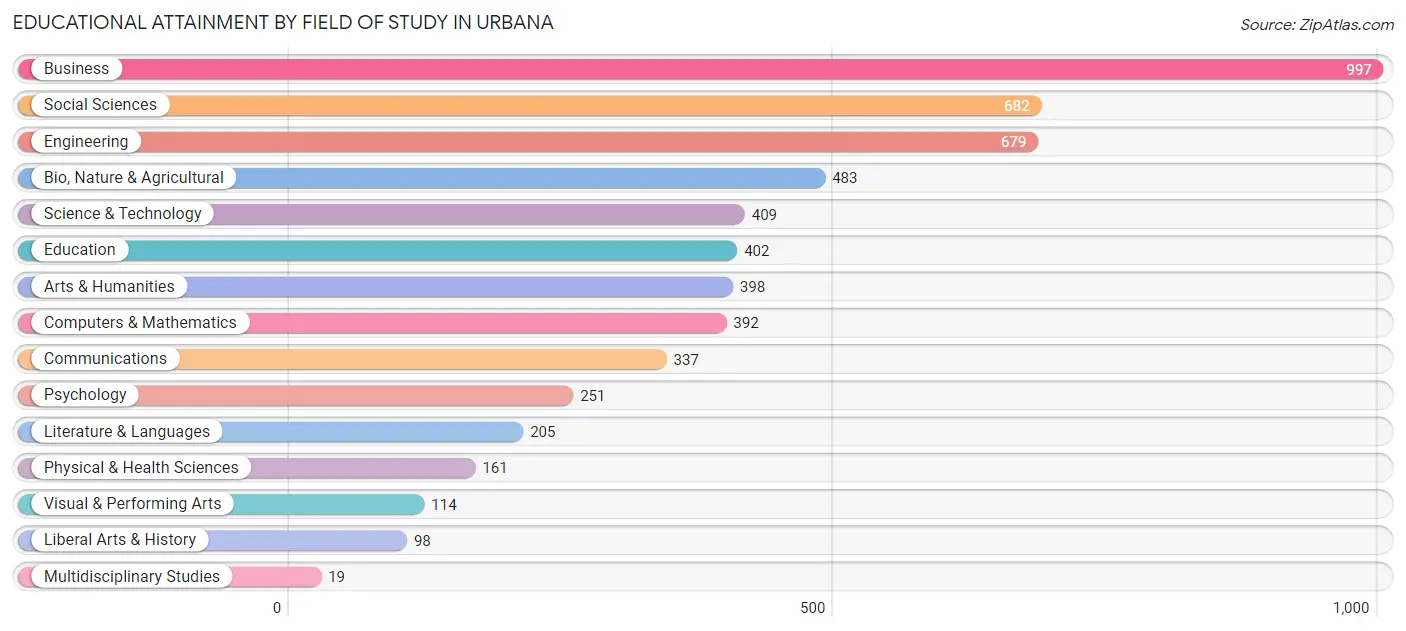
| Field of Study | # Graduates | % Graduates |
| Computers & Mathematics | 392 | 7.0% |
| Bio, Nature & Agricultural | 483 | 8.6% |
| Physical & Health Sciences | 161 | 2.9% |
| Psychology | 251 | 4.5% |
| Social Sciences | 682 | 12.1% |
| Engineering | 679 | 12.1% |
| Multidisciplinary Studies | 19 | 0.3% |
| Science & Technology | 409 | 7.3% |
| Business | 997 | 17.7% |
| Education | 402 | 7.1% |
| Literature & Languages | 205 | 3.6% |
| Liberal Arts & History | 98 | 1.7% |
| Visual & Performing Arts | 114 | 2.0% |
| Communications | 337 | 6.0% |
| Arts & Humanities | 398 | 7.1% |
| Total | 5,627 | 100.0% |
Transportation & Commute in Urbana
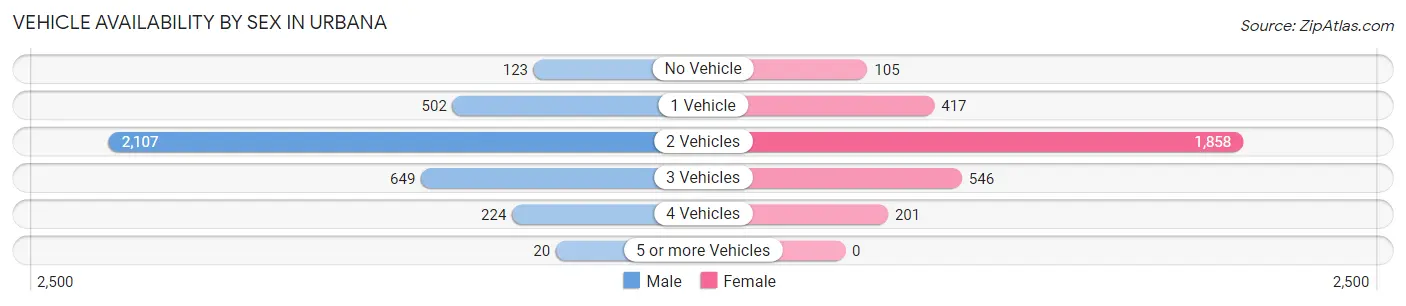
Vehicle Availability by Sex in Urbana
The most prevalent vehicle ownership categories in Urbana are males with 2 vehicles (2,107, accounting for 58.1%) and females with 2 vehicles (1,858, making up 67.4%).
| Vehicles Available | Male | Female |
| No Vehicle | 123 (3.4%) | 105 (3.4%) |
| 1 Vehicle | 502 (13.9%) | 417 (13.3%) |
| 2 Vehicles | 2,107 (58.1%) | 1,858 (59.4%) |
| 3 Vehicles | 649 (17.9%) | 546 (17.5%) |
| 4 Vehicles | 224 (6.2%) | 201 (6.4%) |
| 5 or more Vehicles | 20 (0.5%) | 0 (0.0%) |
| Total | 3,625 (100.0%) | 3,127 (100.0%) |
Commute Time in Urbana
The most frequently occuring commute durations in Urbana are 45 to 59 minutes (868 commuters, 16.8%), 60 to 89 minutes (656 commuters, 12.7%), and 10 to 14 minutes (609 commuters, 11.8%).
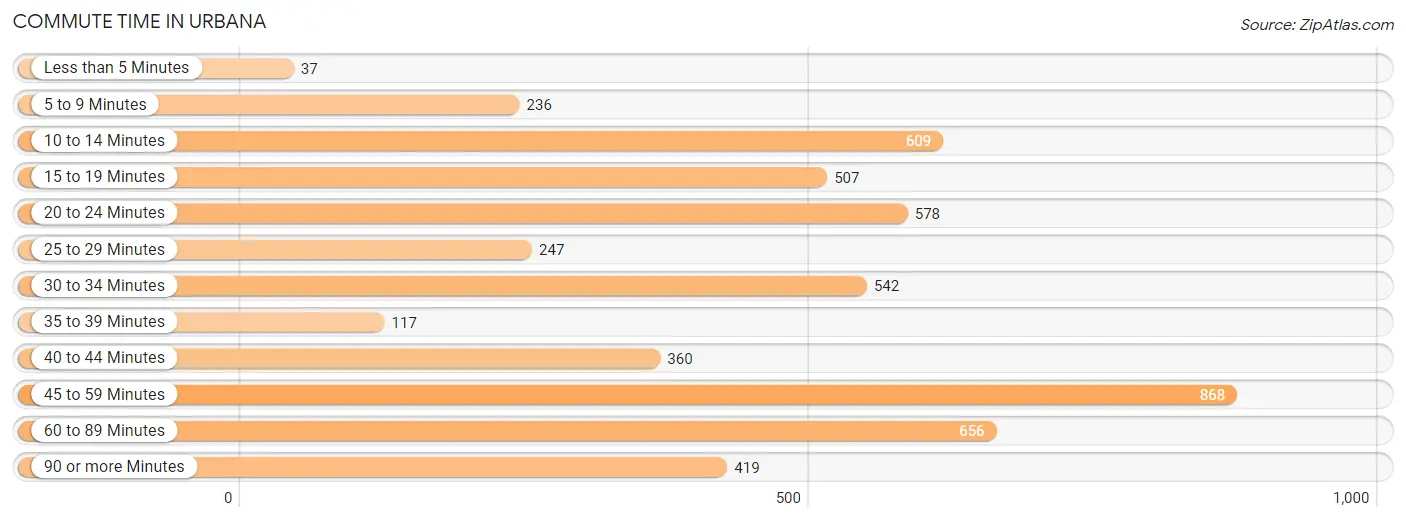
| Commute Time | # Commuters | % Commuters |
| Less than 5 Minutes | 37 | 0.7% |
| 5 to 9 Minutes | 236 | 4.6% |
| 10 to 14 Minutes | 609 | 11.8% |
| 15 to 19 Minutes | 507 | 9.8% |
| 20 to 24 Minutes | 578 | 11.2% |
| 25 to 29 Minutes | 247 | 4.8% |
| 30 to 34 Minutes | 542 | 10.5% |
| 35 to 39 Minutes | 117 | 2.3% |
| 40 to 44 Minutes | 360 | 7.0% |
| 45 to 59 Minutes | 868 | 16.8% |
| 60 to 89 Minutes | 656 | 12.7% |
| 90 or more Minutes | 419 | 8.1% |
Commute Time by Sex in Urbana
The most common commute times in Urbana are 45 to 59 minutes (447 commuters, 15.3%) for males and 45 to 59 minutes (421 commuters, 18.7%) for females.
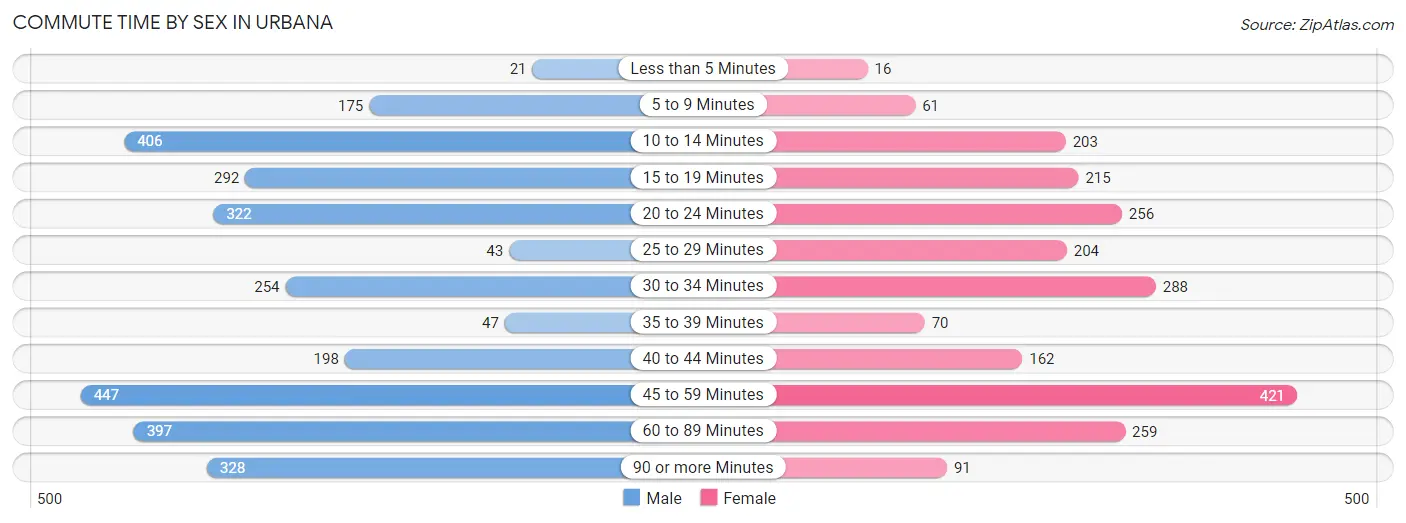
| Commute Time | Male | Female |
| Less than 5 Minutes | 21 (0.7%) | 16 (0.7%) |
| 5 to 9 Minutes | 175 (6.0%) | 61 (2.7%) |
| 10 to 14 Minutes | 406 (13.9%) | 203 (9.0%) |
| 15 to 19 Minutes | 292 (10.0%) | 215 (9.6%) |
| 20 to 24 Minutes | 322 (11.0%) | 256 (11.4%) |
| 25 to 29 Minutes | 43 (1.5%) | 204 (9.1%) |
| 30 to 34 Minutes | 254 (8.7%) | 288 (12.8%) |
| 35 to 39 Minutes | 47 (1.6%) | 70 (3.1%) |
| 40 to 44 Minutes | 198 (6.8%) | 162 (7.2%) |
| 45 to 59 Minutes | 447 (15.3%) | 421 (18.7%) |
| 60 to 89 Minutes | 397 (13.6%) | 259 (11.5%) |
| 90 or more Minutes | 328 (11.2%) | 91 (4.1%) |
Time of Departure to Work by Sex in Urbana
The most frequent times of departure to work in Urbana are 8:00 AM to 8:29 AM (510, 17.4%) for males and 7:00 AM to 7:29 AM (407, 18.1%) for females.
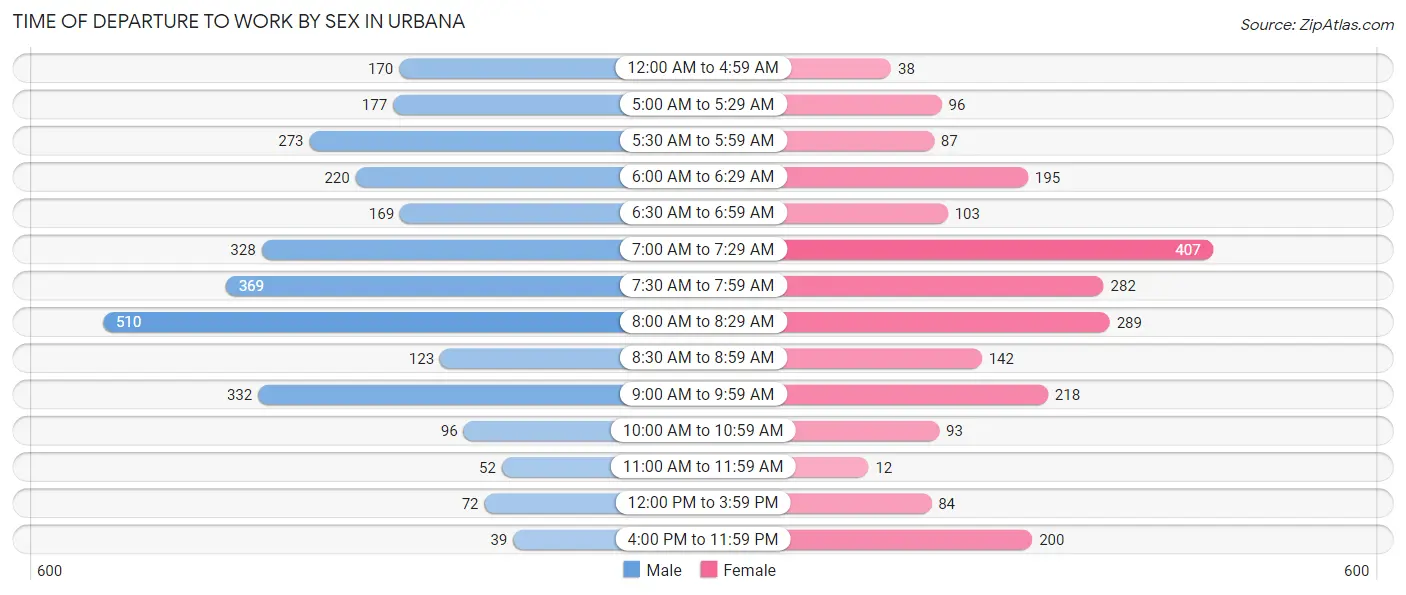
| Time of Departure | Male | Female |
| 12:00 AM to 4:59 AM | 170 (5.8%) | 38 (1.7%) |
| 5:00 AM to 5:29 AM | 177 (6.0%) | 96 (4.3%) |
| 5:30 AM to 5:59 AM | 273 (9.3%) | 87 (3.9%) |
| 6:00 AM to 6:29 AM | 220 (7.5%) | 195 (8.7%) |
| 6:30 AM to 6:59 AM | 169 (5.8%) | 103 (4.6%) |
| 7:00 AM to 7:29 AM | 328 (11.2%) | 407 (18.1%) |
| 7:30 AM to 7:59 AM | 369 (12.6%) | 282 (12.6%) |
| 8:00 AM to 8:29 AM | 510 (17.4%) | 289 (12.9%) |
| 8:30 AM to 8:59 AM | 123 (4.2%) | 142 (6.3%) |
| 9:00 AM to 9:59 AM | 332 (11.3%) | 218 (9.7%) |
| 10:00 AM to 10:59 AM | 96 (3.3%) | 93 (4.1%) |
| 11:00 AM to 11:59 AM | 52 (1.8%) | 12 (0.5%) |
| 12:00 PM to 3:59 PM | 72 (2.5%) | 84 (3.7%) |
| 4:00 PM to 11:59 PM | 39 (1.3%) | 200 (8.9%) |
| Total | 2,930 (100.0%) | 2,246 (100.0%) |
Housing Occupancy in Urbana
Occupancy by Ownership in Urbana
Of the total 4,052 dwellings in Urbana, owner-occupied units account for 3,194 (78.8%), while renter-occupied units make up 858 (21.2%).
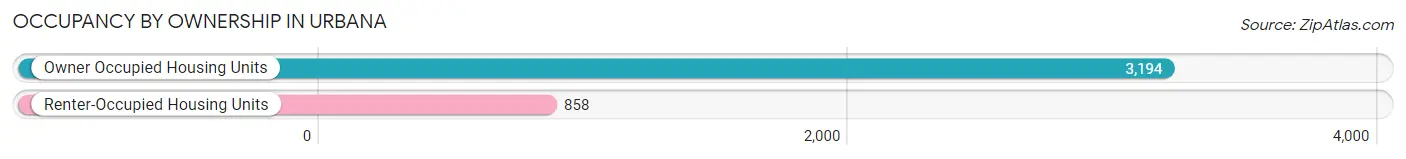
| Occupancy | # Housing Units | % Housing Units |
| Owner Occupied Housing Units | 3,194 | 78.8% |
| Renter-Occupied Housing Units | 858 | 21.2% |
| Total Occupied Housing Units | 4,052 | 100.0% |
Occupancy by Household Size in Urbana
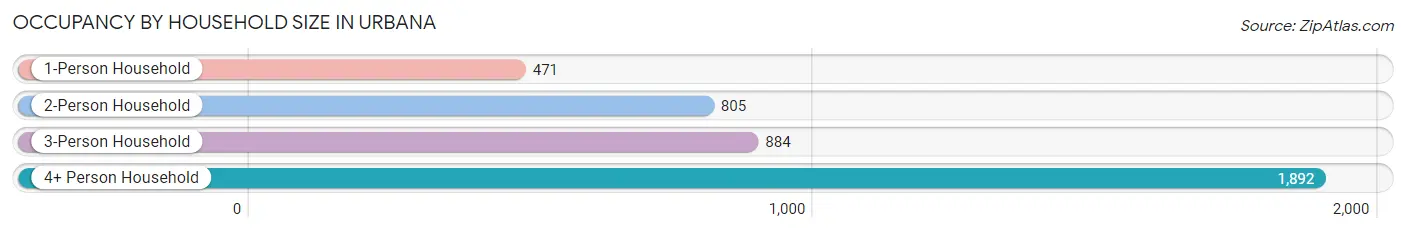
| Household Size | # Housing Units | % Housing Units |
| 1-Person Household | 471 | 11.6% |
| 2-Person Household | 805 | 19.9% |
| 3-Person Household | 884 | 21.8% |
| 4+ Person Household | 1,892 | 46.7% |
| Total Housing Units | 4,052 | 100.0% |
Occupancy by Ownership by Household Size in Urbana
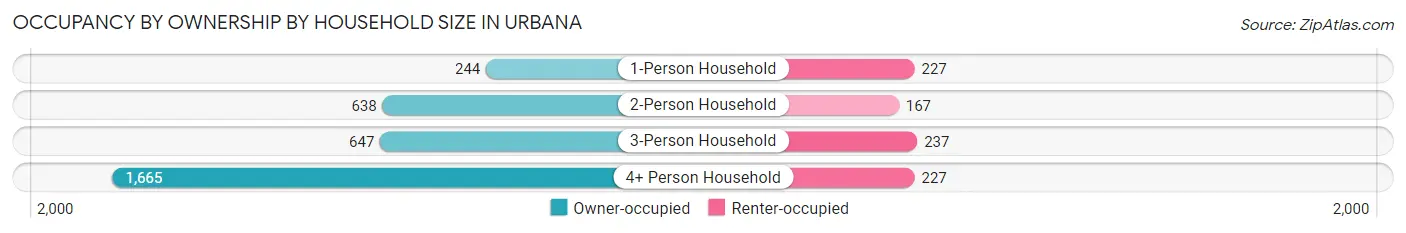
| Household Size | Owner-occupied | Renter-occupied |
| 1-Person Household | 244 (51.8%) | 227 (48.2%) |
| 2-Person Household | 638 (79.2%) | 167 (20.7%) |
| 3-Person Household | 647 (73.2%) | 237 (26.8%) |
| 4+ Person Household | 1,665 (88.0%) | 227 (12.0%) |
| Total Housing Units | 3,194 (78.8%) | 858 (21.2%) |
Occupancy by Educational Attainment in Urbana
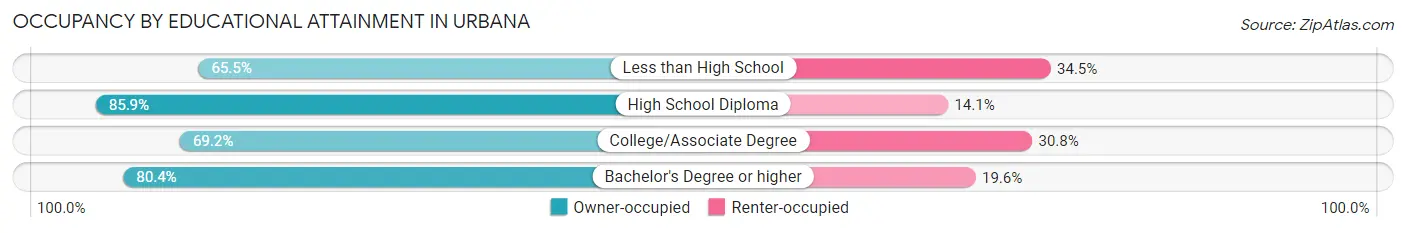
| Household Size | Owner-occupied | Renter-occupied |
| Less than High School | 19 (65.5%) | 10 (34.5%) |
| High School Diploma | 346 (85.9%) | 57 (14.1%) |
| College/Associate Degree | 503 (69.2%) | 224 (30.8%) |
| Bachelor's Degree or higher | 2,326 (80.4%) | 567 (19.6%) |
Occupancy by Age of Householder in Urbana
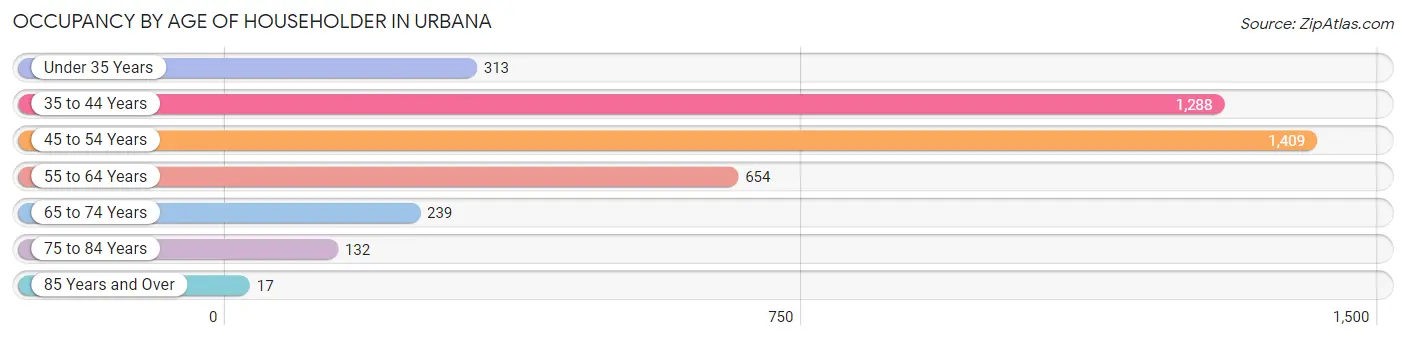
| Age Bracket | # Households | % Households |
| Under 35 Years | 313 | 7.7% |
| 35 to 44 Years | 1,288 | 31.8% |
| 45 to 54 Years | 1,409 | 34.8% |
| 55 to 64 Years | 654 | 16.1% |
| 65 to 74 Years | 239 | 5.9% |
| 75 to 84 Years | 132 | 3.3% |
| 85 Years and Over | 17 | 0.4% |
| Total | 4,052 | 100.0% |
Housing Finances in Urbana
Median Income by Occupancy in Urbana
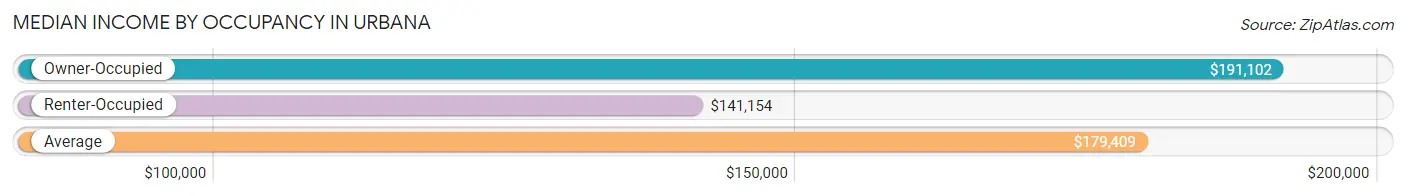
| Occupancy Type | # Households | Median Income |
| Owner-Occupied | 3,194 (78.8%) | $191,102 |
| Renter-Occupied | 858 (21.2%) | $141,154 |
| Average | 4,052 (100.0%) | $179,409 |
Occupancy by Householder Income Bracket in Urbana
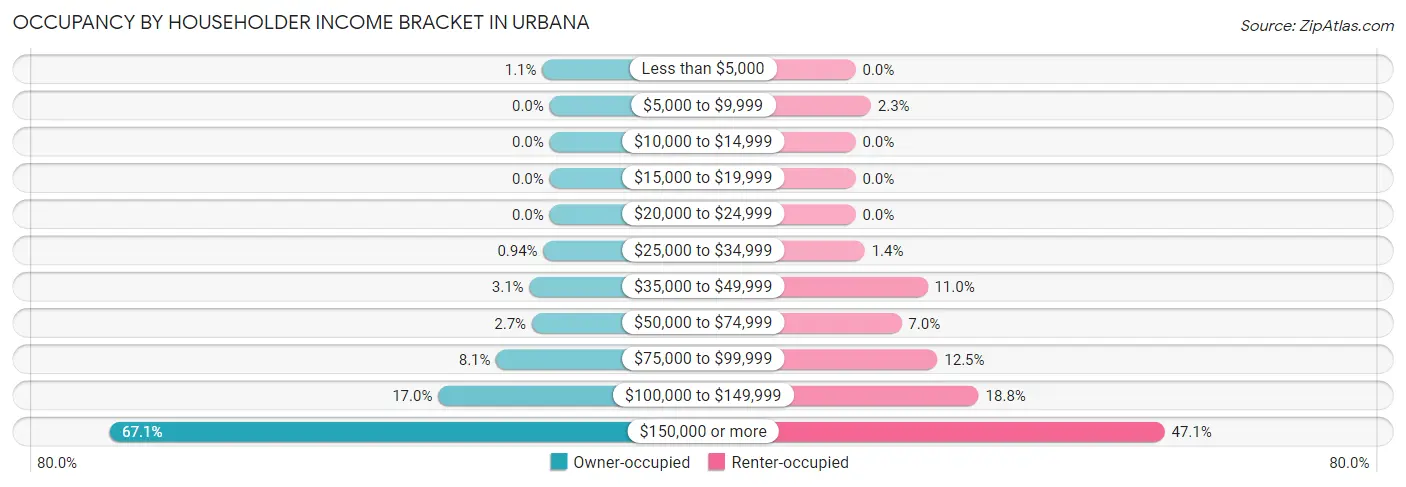
| Income Bracket | Owner-occupied | Renter-occupied |
| Less than $5,000 | 35 (1.1%) | 0 (0.0%) |
| $5,000 to $9,999 | 0 (0.0%) | 20 (2.3%) |
| $10,000 to $14,999 | 0 (0.0%) | 0 (0.0%) |
| $15,000 to $19,999 | 0 (0.0%) | 0 (0.0%) |
| $20,000 to $24,999 | 0 (0.0%) | 0 (0.0%) |
| $25,000 to $34,999 | 30 (0.9%) | 12 (1.4%) |
| $35,000 to $49,999 | 98 (3.1%) | 94 (11.0%) |
| $50,000 to $74,999 | 86 (2.7%) | 60 (7.0%) |
| $75,000 to $99,999 | 259 (8.1%) | 107 (12.5%) |
| $100,000 to $149,999 | 542 (17.0%) | 161 (18.8%) |
| $150,000 or more | 2,144 (67.1%) | 404 (47.1%) |
| Total | 3,194 (100.0%) | 858 (100.0%) |
Monthly Housing Cost Tiers in Urbana
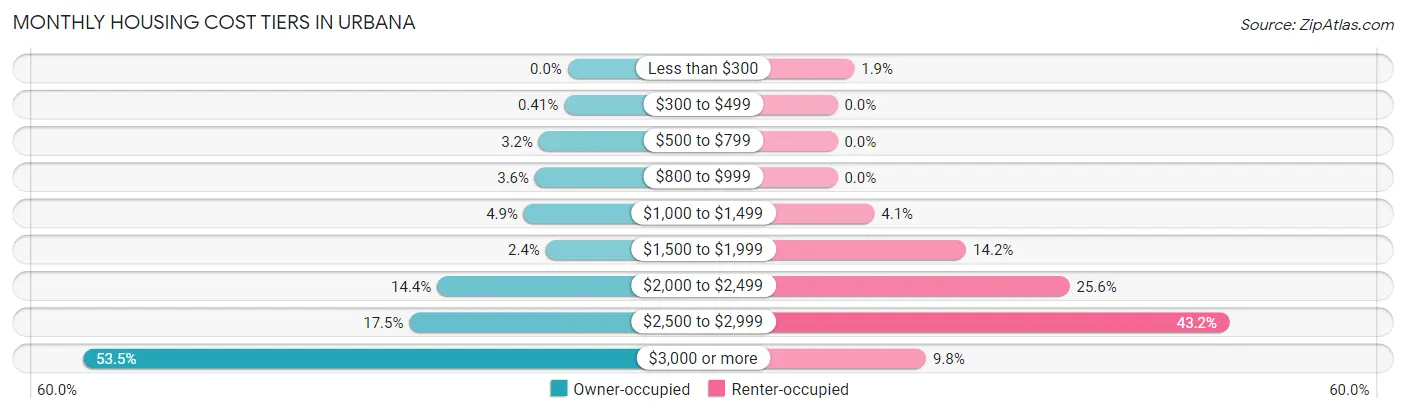
| Monthly Cost | Owner-occupied | Renter-occupied |
| Less than $300 | 0 (0.0%) | 16 (1.9%) |
| $300 to $499 | 13 (0.4%) | 0 (0.0%) |
| $500 to $799 | 102 (3.2%) | 0 (0.0%) |
| $800 to $999 | 116 (3.6%) | 0 (0.0%) |
| $1,000 to $1,499 | 155 (4.9%) | 35 (4.1%) |
| $1,500 to $1,999 | 78 (2.4%) | 122 (14.2%) |
| $2,000 to $2,499 | 461 (14.4%) | 220 (25.6%) |
| $2,500 to $2,999 | 559 (17.5%) | 371 (43.2%) |
| $3,000 or more | 1,710 (53.5%) | 84 (9.8%) |
| Total | 3,194 (100.0%) | 858 (100.0%) |
Physical Housing Characteristics in Urbana
Housing Structures in Urbana
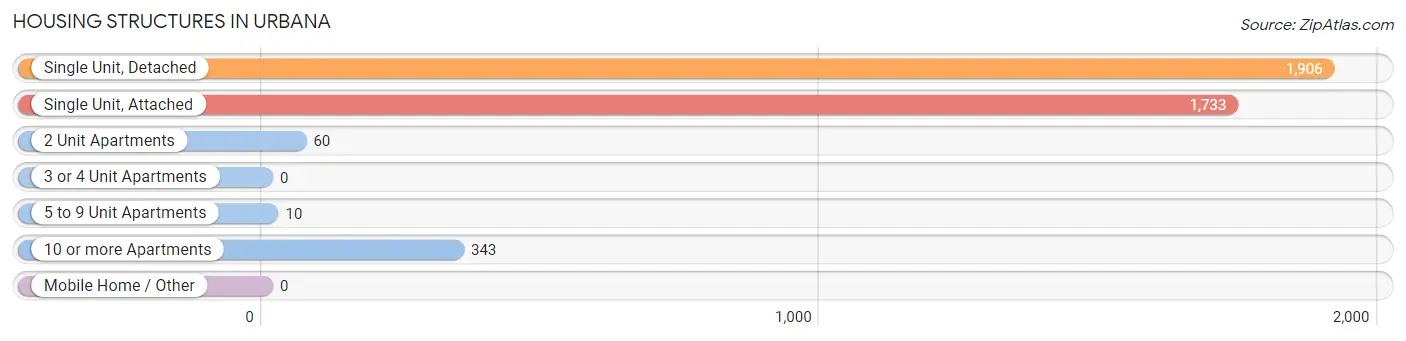
| Structure Type | # Housing Units | % Housing Units |
| Single Unit, Detached | 1,906 | 47.0% |
| Single Unit, Attached | 1,733 | 42.8% |
| 2 Unit Apartments | 60 | 1.5% |
| 3 or 4 Unit Apartments | 0 | 0.0% |
| 5 to 9 Unit Apartments | 10 | 0.3% |
| 10 or more Apartments | 343 | 8.5% |
| Mobile Home / Other | 0 | 0.0% |
| Total | 4,052 | 100.0% |
Housing Structures by Occupancy in Urbana
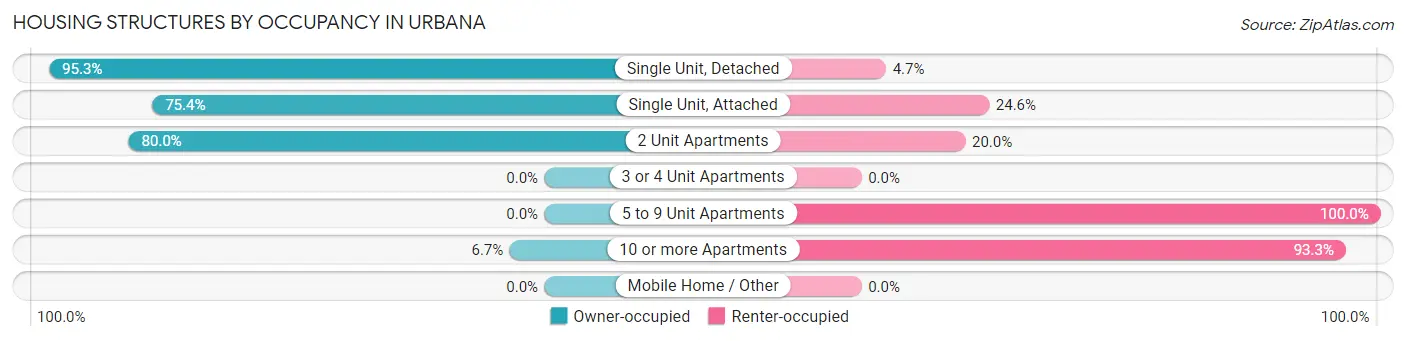
| Structure Type | Owner-occupied | Renter-occupied |
| Single Unit, Detached | 1,816 (95.3%) | 90 (4.7%) |
| Single Unit, Attached | 1,307 (75.4%) | 426 (24.6%) |
| 2 Unit Apartments | 48 (80.0%) | 12 (20.0%) |
| 3 or 4 Unit Apartments | 0 (0.0%) | 0 (0.0%) |
| 5 to 9 Unit Apartments | 0 (0.0%) | 10 (100.0%) |
| 10 or more Apartments | 23 (6.7%) | 320 (93.3%) |
| Mobile Home / Other | 0 (0.0%) | 0 (0.0%) |
| Total | 3,194 (78.8%) | 858 (21.2%) |
Housing Structures by Number of Rooms in Urbana
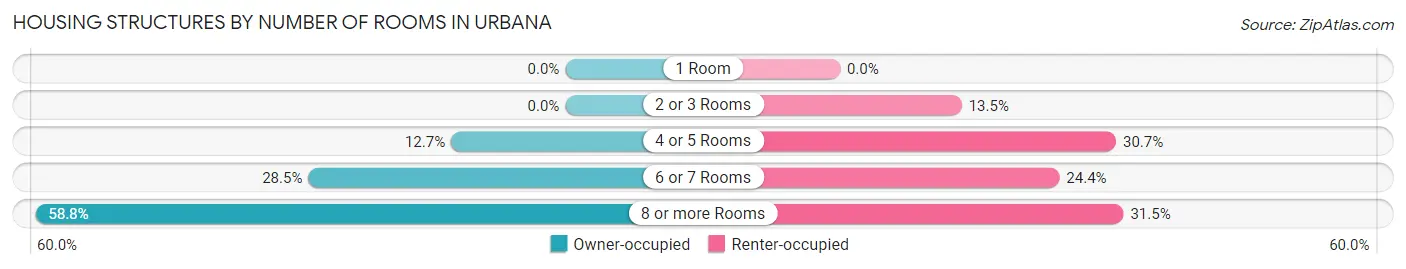
| Number of Rooms | Owner-occupied | Renter-occupied |
| 1 Room | 0 (0.0%) | 0 (0.0%) |
| 2 or 3 Rooms | 0 (0.0%) | 116 (13.5%) |
| 4 or 5 Rooms | 405 (12.7%) | 263 (30.6%) |
| 6 or 7 Rooms | 911 (28.5%) | 209 (24.4%) |
| 8 or more Rooms | 1,878 (58.8%) | 270 (31.5%) |
| Total | 3,194 (100.0%) | 858 (100.0%) |
Housing Structure by Heating Type in Urbana
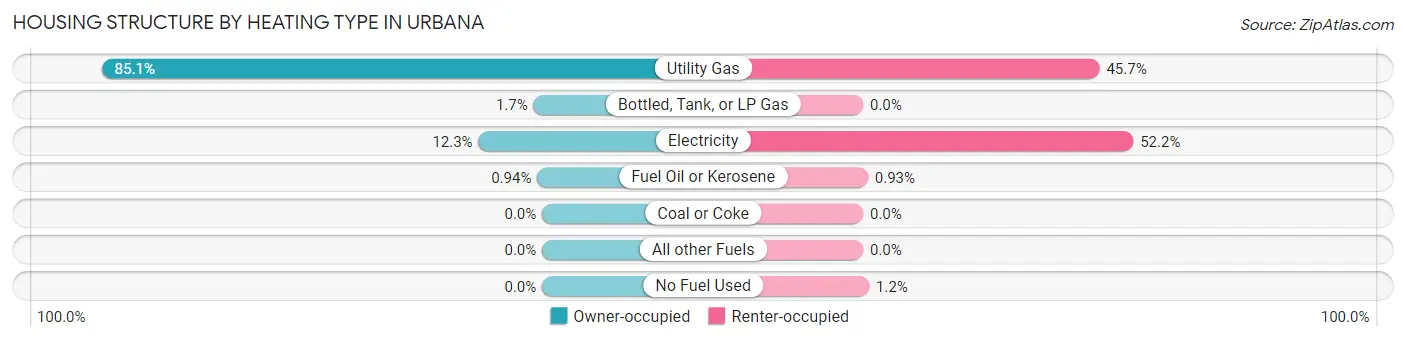
| Heating Type | Owner-occupied | Renter-occupied |
| Utility Gas | 2,718 (85.1%) | 392 (45.7%) |
| Bottled, Tank, or LP Gas | 53 (1.7%) | 0 (0.0%) |
| Electricity | 393 (12.3%) | 448 (52.2%) |
| Fuel Oil or Kerosene | 30 (0.9%) | 8 (0.9%) |
| Coal or Coke | 0 (0.0%) | 0 (0.0%) |
| All other Fuels | 0 (0.0%) | 0 (0.0%) |
| No Fuel Used | 0 (0.0%) | 10 (1.2%) |
| Total | 3,194 (100.0%) | 858 (100.0%) |
Household Vehicle Usage in Urbana
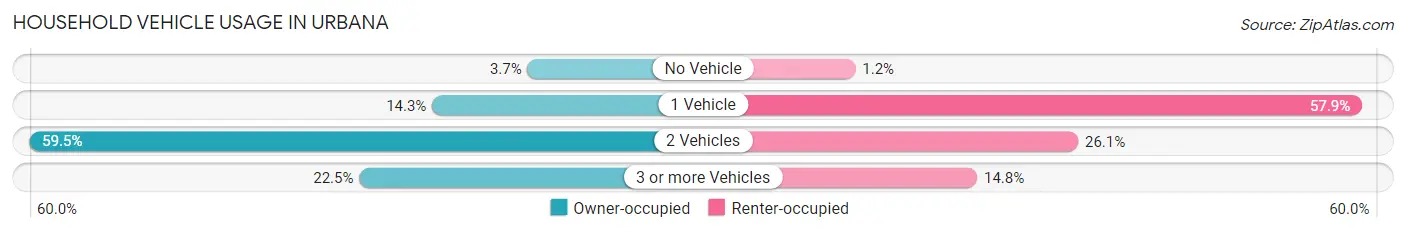
| Vehicles per Household | Owner-occupied | Renter-occupied |
| No Vehicle | 117 (3.7%) | 10 (1.2%) |
| 1 Vehicle | 458 (14.3%) | 497 (57.9%) |
| 2 Vehicles | 1,900 (59.5%) | 224 (26.1%) |
| 3 or more Vehicles | 719 (22.5%) | 127 (14.8%) |
| Total | 3,194 (100.0%) | 858 (100.0%) |
Real Estate & Mortgages in Urbana
Real Estate and Mortgage Overview in Urbana
| Characteristic | Without Mortgage | With Mortgage |
| Housing Units | 382 | 2,812 |
| Median Property Value | $588,900 | $573,400 |
| Median Household Income | $172,115 | $1,926 |
| Monthly Housing Costs | $964 | $1,710 |
| Real Estate Taxes | $6,393 | $13 |
Property Value by Mortgage Status in Urbana
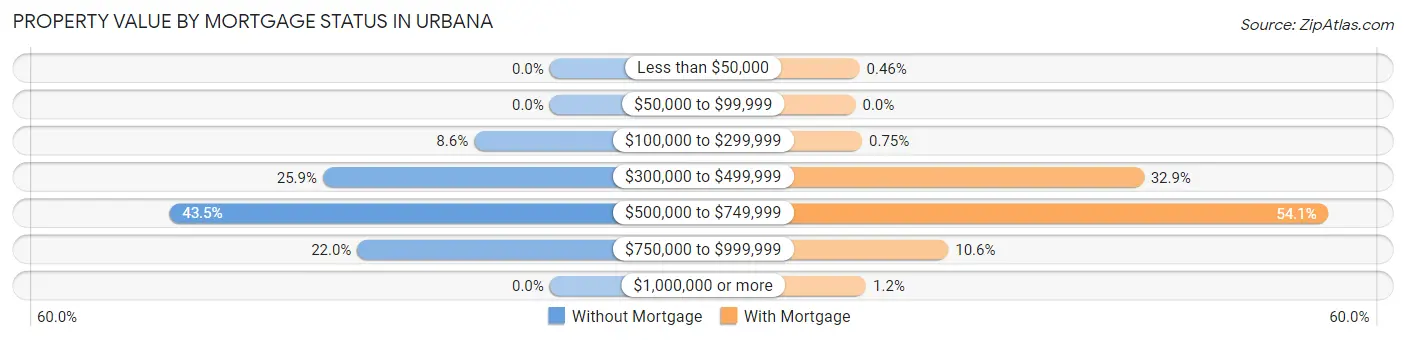
| Property Value | Without Mortgage | With Mortgage |
| Less than $50,000 | 0 (0.0%) | 13 (0.5%) |
| $50,000 to $99,999 | 0 (0.0%) | 0 (0.0%) |
| $100,000 to $299,999 | 33 (8.6%) | 21 (0.7%) |
| $300,000 to $499,999 | 99 (25.9%) | 926 (32.9%) |
| $500,000 to $749,999 | 166 (43.5%) | 1,520 (54.0%) |
| $750,000 to $999,999 | 84 (22.0%) | 298 (10.6%) |
| $1,000,000 or more | 0 (0.0%) | 34 (1.2%) |
| Total | 382 (100.0%) | 2,812 (100.0%) |
Household Income by Mortgage Status in Urbana
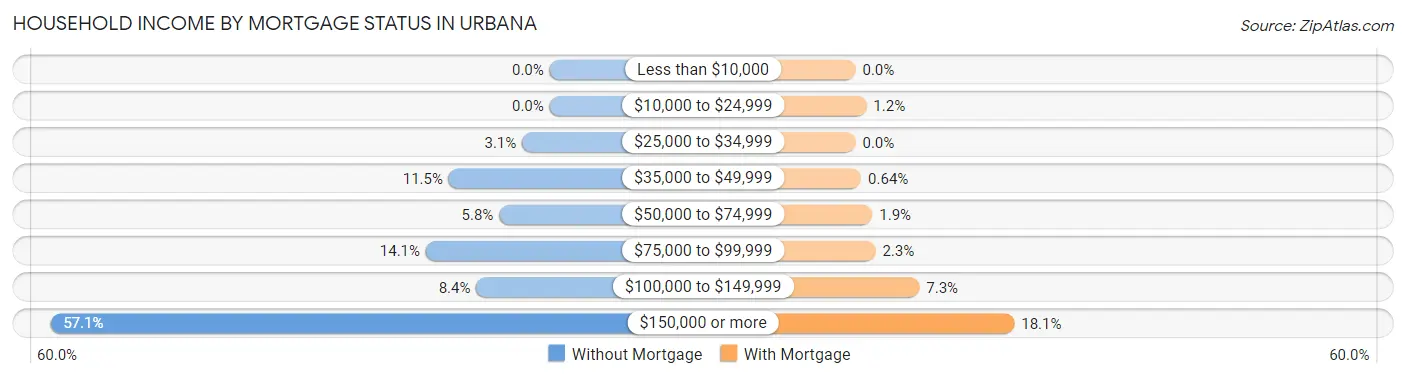
| Household Income | Without Mortgage | With Mortgage |
| Less than $10,000 | 0 (0.0%) | 0 (0.0%) |
| $10,000 to $24,999 | 0 (0.0%) | 35 (1.2%) |
| $25,000 to $34,999 | 12 (3.1%) | 0 (0.0%) |
| $35,000 to $49,999 | 44 (11.5%) | 18 (0.6%) |
| $50,000 to $74,999 | 22 (5.8%) | 54 (1.9%) |
| $75,000 to $99,999 | 54 (14.1%) | 64 (2.3%) |
| $100,000 to $149,999 | 32 (8.4%) | 205 (7.3%) |
| $150,000 or more | 218 (57.1%) | 510 (18.1%) |
| Total | 382 (100.0%) | 2,812 (100.0%) |
Property Value to Household Income Ratio in Urbana
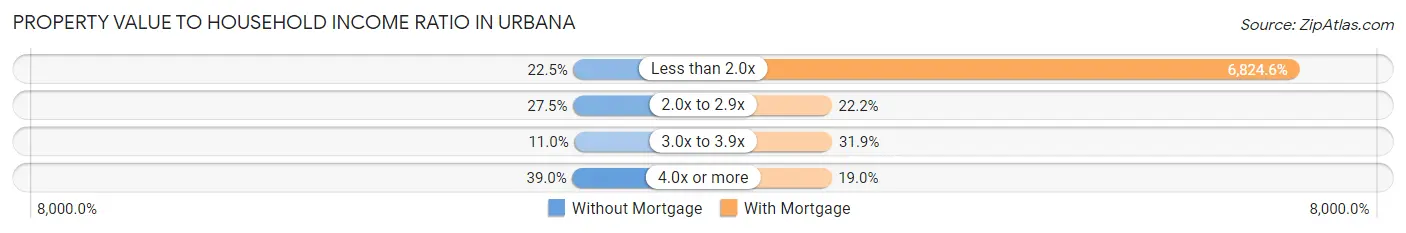
| Value-to-Income Ratio | Without Mortgage | With Mortgage |
| Less than 2.0x | 86 (22.5%) | 191,907 (6,824.6%) |
| 2.0x to 2.9x | 105 (27.5%) | 624 (22.2%) |
| 3.0x to 3.9x | 42 (11.0%) | 898 (31.9%) |
| 4.0x or more | 149 (39.0%) | 533 (19.0%) |
| Total | 382 (100.0%) | 2,812 (100.0%) |
Real Estate Taxes by Mortgage Status in Urbana
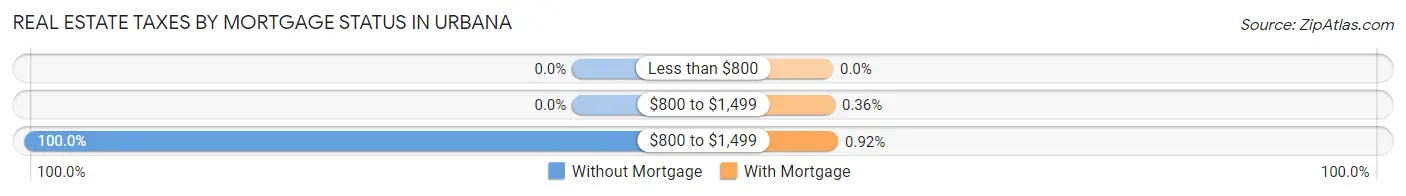
| Property Taxes | Without Mortgage | With Mortgage |
| Less than $800 | 0 (0.0%) | 0 (0.0%) |
| $800 to $1,499 | 0 (0.0%) | 10 (0.4%) |
| $800 to $1,499 | 382 (100.0%) | 26 (0.9%) |
| Total | 382 (100.0%) | 2,812 (100.0%) |
Health & Disability in Urbana
Health Insurance Coverage by Age in Urbana
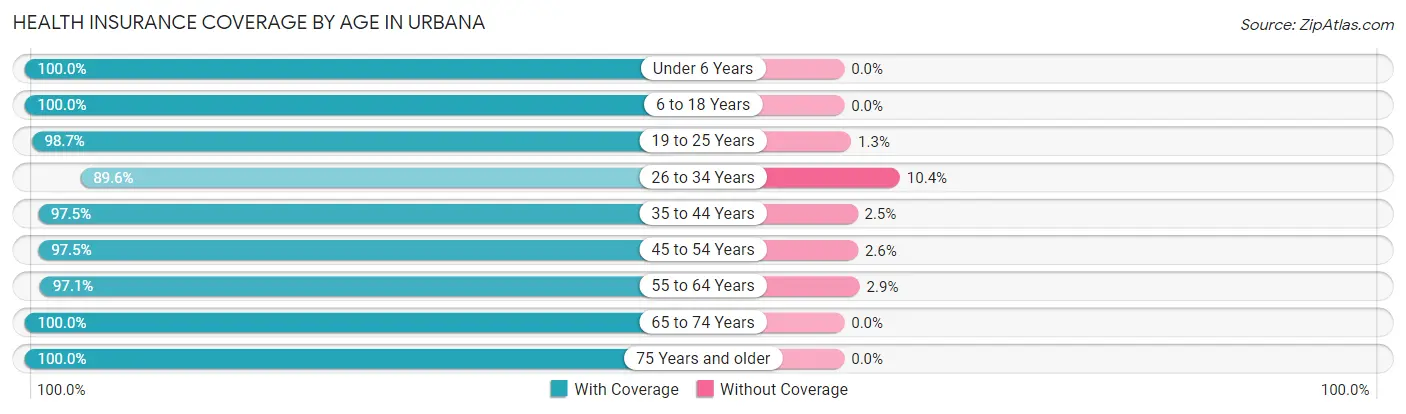
| Age Bracket | With Coverage | Without Coverage |
| Under 6 Years | 1,082 (100.0%) | 0 (0.0%) |
| 6 to 18 Years | 3,788 (100.0%) | 0 (0.0%) |
| 19 to 25 Years | 694 (98.7%) | 9 (1.3%) |
| 26 to 34 Years | 735 (89.6%) | 85 (10.4%) |
| 35 to 44 Years | 2,369 (97.5%) | 60 (2.5%) |
| 45 to 54 Years | 2,369 (97.5%) | 62 (2.5%) |
| 55 to 64 Years | 1,053 (97.1%) | 31 (2.9%) |
| 65 to 74 Years | 644 (100.0%) | 0 (0.0%) |
| 75 Years and older | 289 (100.0%) | 0 (0.0%) |
| Total | 13,023 (98.1%) | 247 (1.9%) |
Health Insurance Coverage by Citizenship Status in Urbana
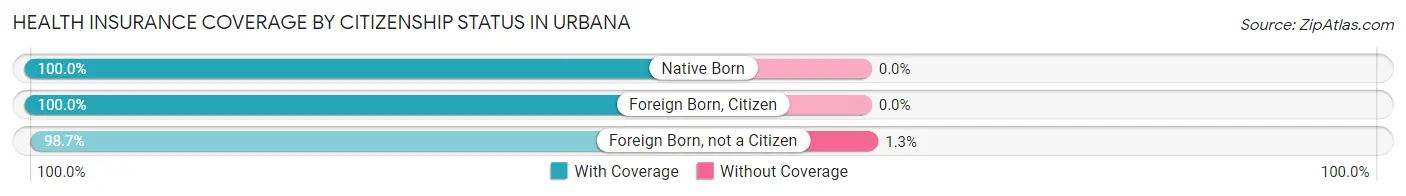
| Citizenship Status | With Coverage | Without Coverage |
| Native Born | 1,082 (100.0%) | 0 (0.0%) |
| Foreign Born, Citizen | 3,788 (100.0%) | 0 (0.0%) |
| Foreign Born, not a Citizen | 694 (98.7%) | 9 (1.3%) |
Health Insurance Coverage by Household Income in Urbana
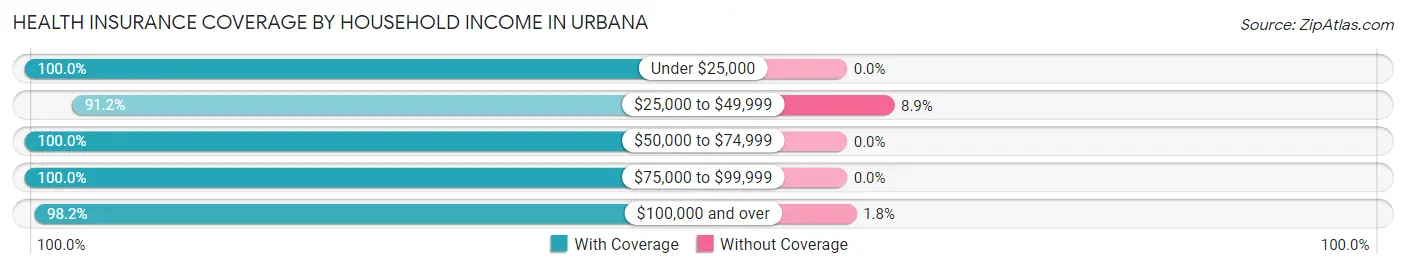
| Household Income | With Coverage | Without Coverage |
| Under $25,000 | 55 (100.0%) | 0 (0.0%) |
| $25,000 to $49,999 | 525 (91.1%) | 51 (8.8%) |
| $50,000 to $74,999 | 391 (100.0%) | 0 (0.0%) |
| $75,000 to $99,999 | 1,199 (100.0%) | 0 (0.0%) |
| $100,000 and over | 10,853 (98.2%) | 196 (1.8%) |
Public vs Private Health Insurance Coverage by Age in Urbana
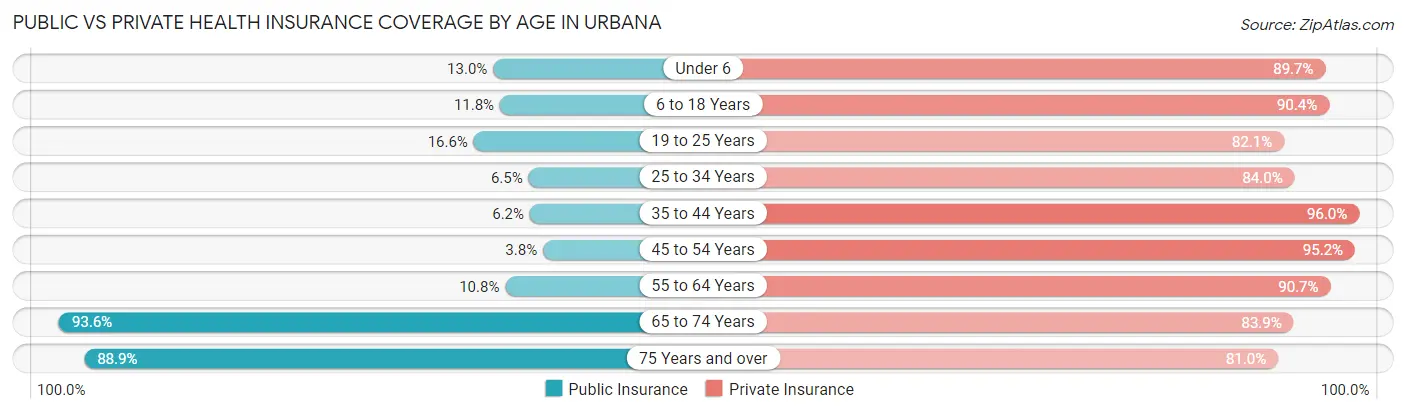
| Age Bracket | Public Insurance | Private Insurance |
| Under 6 | 141 (13.0%) | 971 (89.7%) |
| 6 to 18 Years | 446 (11.8%) | 3,426 (90.4%) |
| 19 to 25 Years | 117 (16.6%) | 577 (82.1%) |
| 25 to 34 Years | 53 (6.5%) | 689 (84.0%) |
| 35 to 44 Years | 151 (6.2%) | 2,332 (96.0%) |
| 45 to 54 Years | 92 (3.8%) | 2,315 (95.2%) |
| 55 to 64 Years | 117 (10.8%) | 983 (90.7%) |
| 65 to 74 Years | 603 (93.6%) | 540 (83.9%) |
| 75 Years and over | 257 (88.9%) | 234 (81.0%) |
| Total | 1,977 (14.9%) | 12,067 (90.9%) |
Disability Status by Sex by Age in Urbana
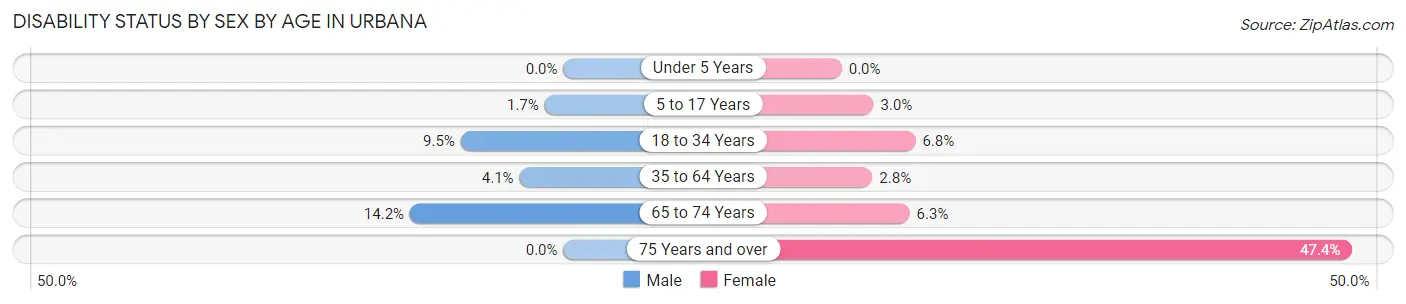
| Age Bracket | Male | Female |
| Under 5 Years | 0 (0.0%) | 0 (0.0%) |
| 5 to 17 Years | 36 (1.7%) | 53 (2.9%) |
| 18 to 34 Years | 75 (9.5%) | 54 (6.8%) |
| 35 to 64 Years | 123 (4.1%) | 83 (2.8%) |
| 65 to 74 Years | 42 (14.2%) | 22 (6.3%) |
| 75 Years and over | 0 (0.0%) | 108 (47.4%) |
Disability Class by Sex by Age in Urbana
Disability Class: Hearing Difficulty
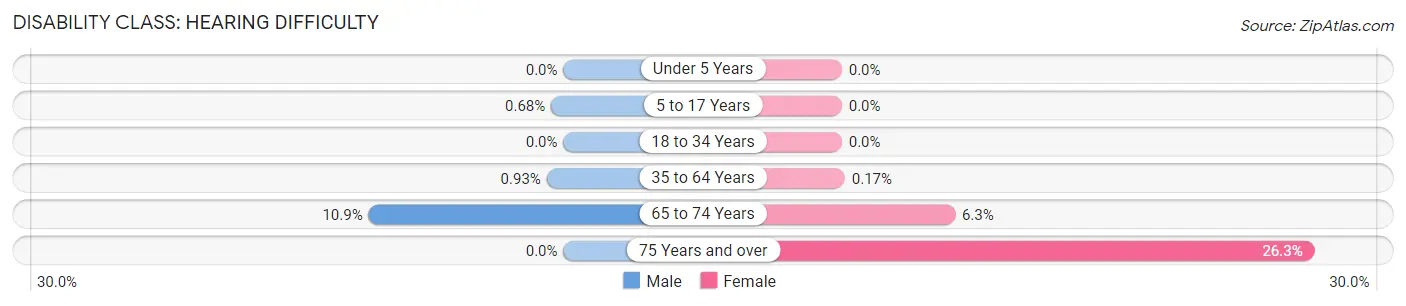
| Age Bracket | Male | Female |
| Under 5 Years | 0 (0.0%) | 0 (0.0%) |
| 5 to 17 Years | 14 (0.7%) | 0 (0.0%) |
| 18 to 34 Years | 0 (0.0%) | 0 (0.0%) |
| 35 to 64 Years | 28 (0.9%) | 5 (0.2%) |
| 65 to 74 Years | 32 (10.8%) | 22 (6.3%) |
| 75 Years and over | 0 (0.0%) | 60 (26.3%) |
Disability Class: Vision Difficulty
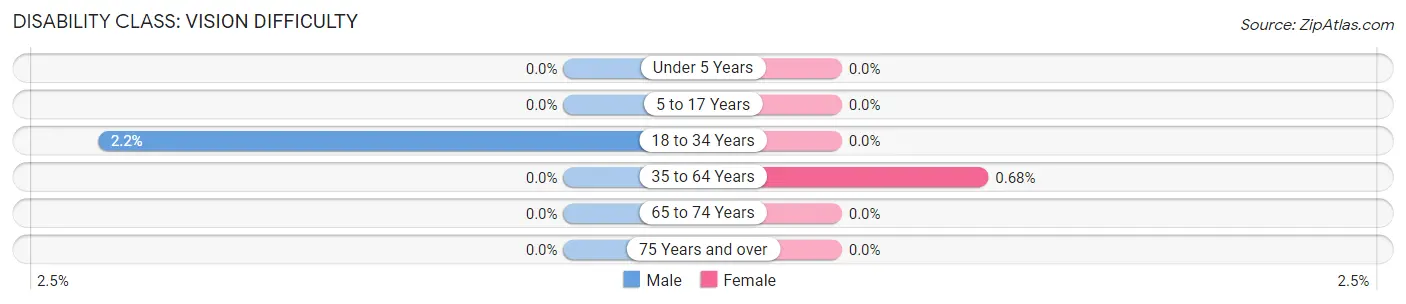
| Age Bracket | Male | Female |
| Under 5 Years | 0 (0.0%) | 0 (0.0%) |
| 5 to 17 Years | 0 (0.0%) | 0 (0.0%) |
| 18 to 34 Years | 17 (2.2%) | 0 (0.0%) |
| 35 to 64 Years | 0 (0.0%) | 20 (0.7%) |
| 65 to 74 Years | 0 (0.0%) | 0 (0.0%) |
| 75 Years and over | 0 (0.0%) | 0 (0.0%) |
Disability Class: Cognitive Difficulty
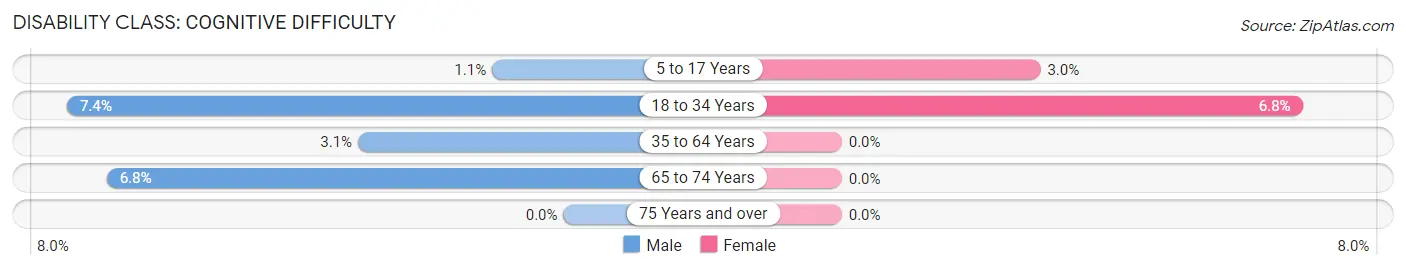
| Age Bracket | Male | Female |
| 5 to 17 Years | 22 (1.1%) | 53 (2.9%) |
| 18 to 34 Years | 58 (7.4%) | 54 (6.8%) |
| 35 to 64 Years | 92 (3.0%) | 0 (0.0%) |
| 65 to 74 Years | 20 (6.8%) | 0 (0.0%) |
| 75 Years and over | 0 (0.0%) | 0 (0.0%) |
Disability Class: Ambulatory Difficulty
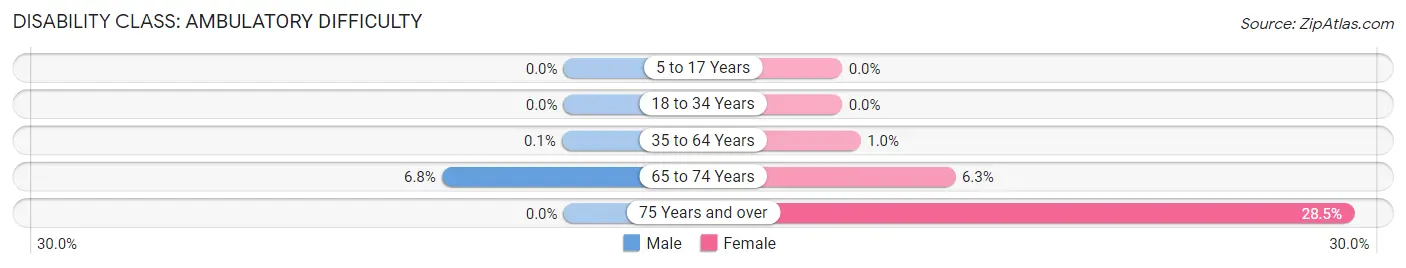
| Age Bracket | Male | Female |
| 5 to 17 Years | 0 (0.0%) | 0 (0.0%) |
| 18 to 34 Years | 0 (0.0%) | 0 (0.0%) |
| 35 to 64 Years | 3 (0.1%) | 30 (1.0%) |
| 65 to 74 Years | 20 (6.8%) | 22 (6.3%) |
| 75 Years and over | 0 (0.0%) | 65 (28.5%) |
Disability Class: Self-Care Difficulty
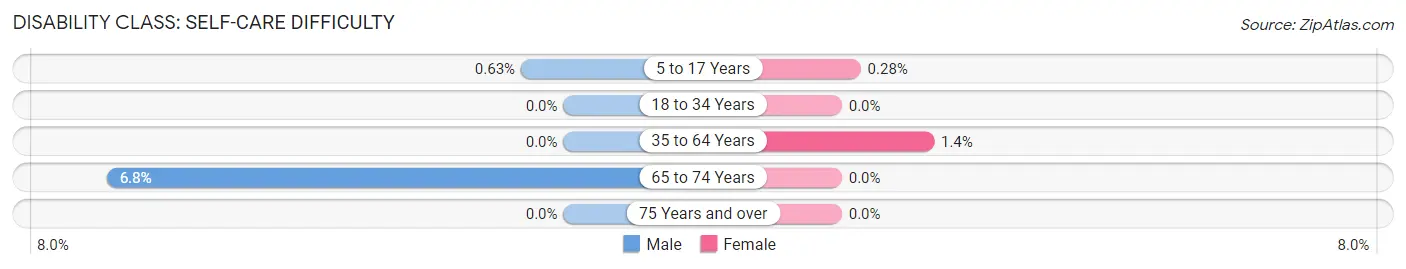
| Age Bracket | Male | Female |
| 5 to 17 Years | 13 (0.6%) | 5 (0.3%) |
| 18 to 34 Years | 0 (0.0%) | 0 (0.0%) |
| 35 to 64 Years | 0 (0.0%) | 40 (1.4%) |
| 65 to 74 Years | 20 (6.8%) | 0 (0.0%) |
| 75 Years and over | 0 (0.0%) | 0 (0.0%) |
Technology Access in Urbana
Computing Device Access in Urbana
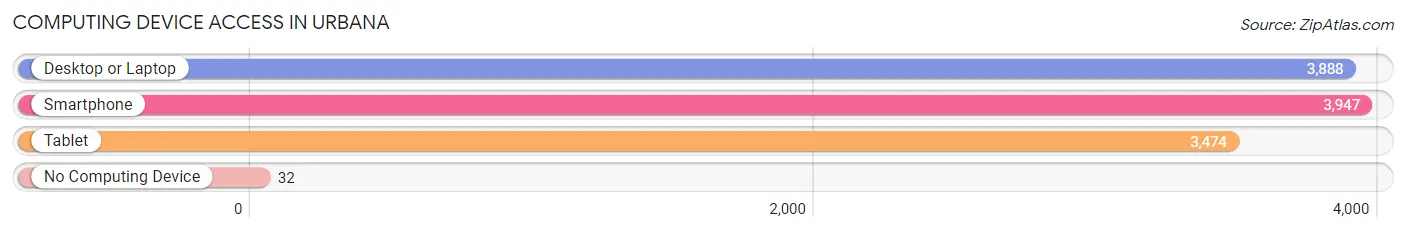
| Device Type | # Households | % Households |
| Desktop or Laptop | 3,888 | 96.0% |
| Smartphone | 3,947 | 97.4% |
| Tablet | 3,474 | 85.7% |
| No Computing Device | 32 | 0.8% |
| Total | 4,052 | 100.0% |
Internet Access in Urbana
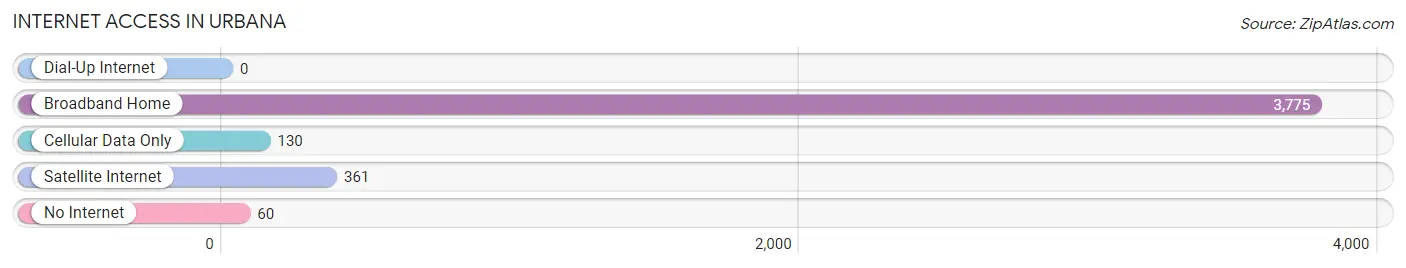
| Internet Type | # Households | % Households |
| Dial-Up Internet | 0 | 0.0% |
| Broadband Home | 3,775 | 93.2% |
| Cellular Data Only | 130 | 3.2% |
| Satellite Internet | 361 | 8.9% |
| No Internet | 60 | 1.5% |
| Total | 4,052 | 100.0% |
Urbana Summary
Urbana, Maryland is a small town located in Frederick County, Maryland. It is situated in the northern part of the state, about 30 miles northwest of Washington, D.C. The town is bordered by I-270 to the east, I-70 to the north, and the Catoctin Mountains to the west. The population of Urbana was 8,945 as of the 2010 census.
History
The area that is now Urbana was first settled in the late 1700s by German immigrants. The town was originally known as “Mechanicsville” and was officially incorporated in 1808. The town was renamed “Urbana” in 1820, after the Latin word for “city”.
The town was a major stop on the Baltimore and Ohio Railroad, which ran through the town from 1831 to 1971. The railroad was a major factor in the growth of the town, as it allowed for the transportation of goods and people.
The town was also home to a number of mills, including a paper mill, a flour mill, and a sawmill. These mills provided employment for many of the town’s residents.
Geography
Urbana is located in northern Maryland, about 30 miles northwest of Washington, D.C. The town is bordered by I-270 to the east, I-70 to the north, and the Catoctin Mountains to the west.
The town is situated in the Piedmont region of Maryland, which is characterized by rolling hills and valleys. The terrain is mostly flat, with some areas of higher elevation.
The climate in Urbana is humid subtropical, with hot, humid summers and cold, wet winters. The average annual temperature is around 54°F, with an average high of around 79°F in the summer and an average low of around 28°F in the winter.
Economy
The economy of Urbana is largely based on the service industry. The town is home to a number of restaurants, retail stores, and other businesses.
The town is also home to a number of technology companies, including a software development firm and a data center.
The town is also home to a number of government agencies, including the National Institutes of Health and the National Institute of Standards and Technology.
Demographics
As of the 2010 census, the population of Urbana was 8,945. The racial makeup of the town was 79.3% White, 11.2% African American, 4.2% Asian, and 5.3% Hispanic or Latino.
The median household income in Urbana was $90,845, and the median family income was $103,945. The per capita income was $37,945.
The town is home to a number of educational institutions, including Urbana High School, Urbana Middle School, and Urbana Elementary School. The town is also home to a number of private schools, including St. John’s Catholic School and Urbana Christian Academy.
Common Questions
What is Per Capita Income in Urbana?
Per Capita income in Urbana is $61,822.
What is the Median Family Income in Urbana?
Median Family Income in Urbana is $186,356.
What is the Median Household income in Urbana?
Median Household Income in Urbana is $179,409.
What is Income or Wage Gap in Urbana?
Income or Wage Gap in Urbana is 37.7%.
Women in Urbana earn 62.3 cents for every dollar earned by a man.
What is Inequality or Gini Index in Urbana?
Inequality or Gini Index in Urbana is 0.32.
What is the Total Population of Urbana?
Total Population of Urbana is 13,373.
What is the Total Male Population of Urbana?
Total Male Population of Urbana is 6,927.
What is the Total Female Population of Urbana?
Total Female Population of Urbana is 6,446.
What is the Ratio of Males per 100 Females in Urbana?
There are 107.46 Males per 100 Females in Urbana.
What is the Ratio of Females per 100 Males in Urbana?
There are 93.06 Females per 100 Males in Urbana.
What is the Median Population Age in Urbana?
Median Population Age in Urbana is 36.6 Years.
What is the Average Family Size in Urbana
Average Family Size in Urbana is 3.6 People.
What is the Average Household Size in Urbana
Average Household Size in Urbana is 3.3 People.
How Large is the Labor Force in Urbana?
There are 7,179 People in the Labor Forcein in Urbana.
What is the Percentage of People in the Labor Force in Urbana?
78.2% of People are in the Labor Force in Urbana.
What is the Unemployment Rate in Urbana?
Unemployment Rate in Urbana is 4.3%.