Dunkirk, MD Map & Demographics
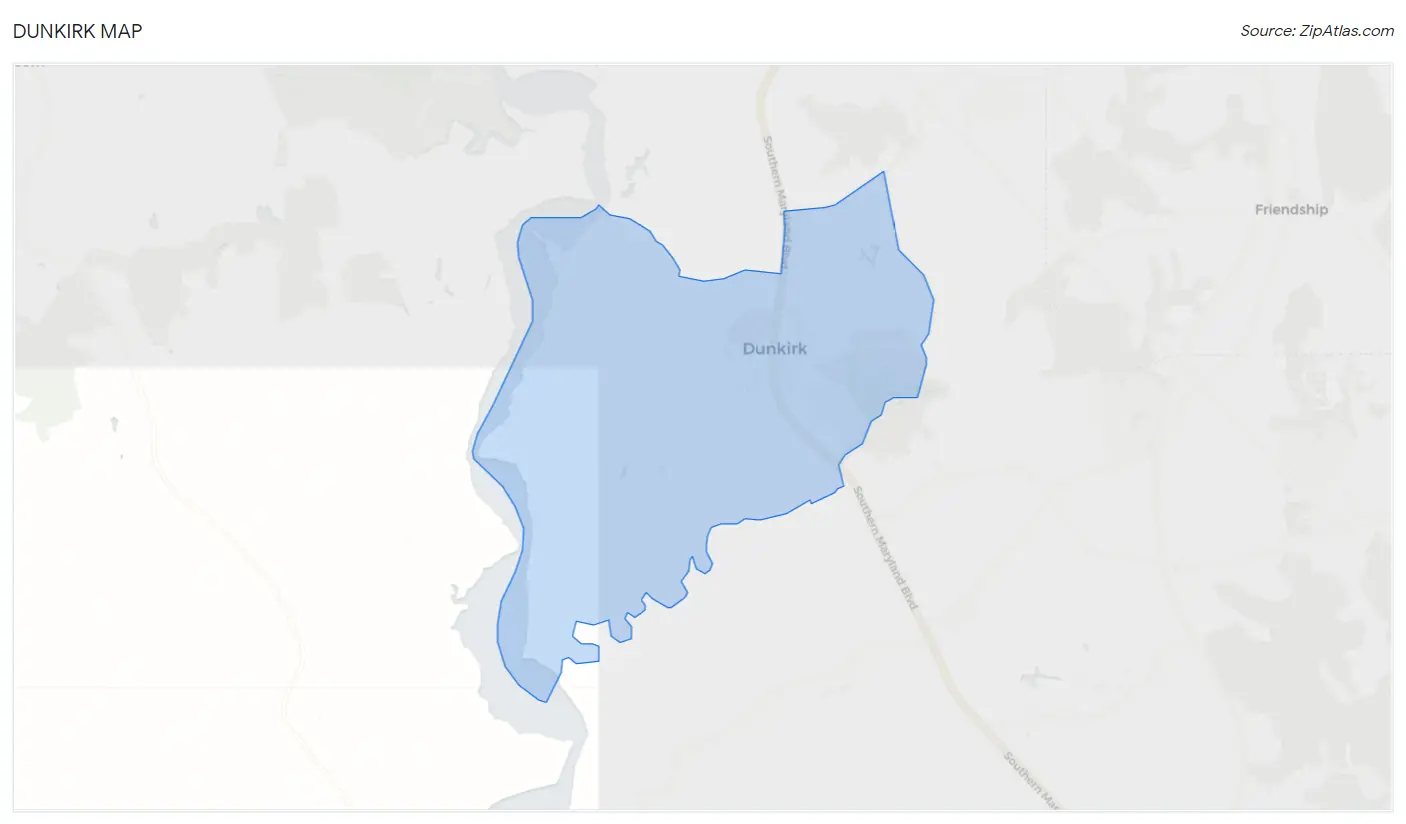
Dunkirk Map
Dunkirk Overview
$64,176
PER CAPITA INCOME
$180,708
AVG FAMILY INCOME
$159,167
AVG HOUSEHOLD INCOME
7.2%
WAGE / INCOME GAP [ % ]
92.8¢/ $1
WAGE / INCOME GAP [ $ ]
0.31
INEQUALITY / GINI INDEX
2,277
TOTAL POPULATION
1,271
MALE POPULATION
1,006
FEMALE POPULATION
126.34
MALES / 100 FEMALES
79.15
FEMALES / 100 MALES
41.8
MEDIAN AGE
3.2
AVG FAMILY SIZE
2.9
AVG HOUSEHOLD SIZE
1,261
LABOR FORCE [ PEOPLE ]
67.6%
PERCENT IN LABOR FORCE
0.7%
UNEMPLOYMENT RATE
Dunkirk Zip Codes
Income in Dunkirk
Income Overview in Dunkirk
Per Capita Income in Dunkirk is $64,176, while median incomes of families and households are $180,708 and $159,167 respectively.
| Characteristic | Number | Measure |
| Per Capita Income | 2,277 | $64,176 |
| Median Family Income | 655 | $180,708 |
| Mean Family Income | 655 | $199,306 |
| Median Household Income | 776 | $159,167 |
| Mean Household Income | 776 | $181,418 |
| Income Deficit | 655 | $0 |
| Wage / Income Gap (%) | 2,277 | 7.22% |
| Wage / Income Gap ($) | 2,277 | 92.78¢ per $1 |
| Gini / Inequality Index | 2,277 | 0.31 |
Earnings by Sex in Dunkirk
Average Earnings in Dunkirk are $82,041, $81,760 for men and $88,125 for women, a difference of 7.2%.
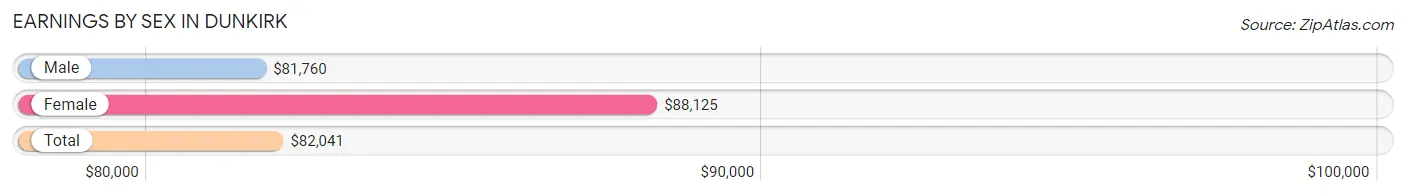
| Sex | Number | Average Earnings |
| Male | 827 (60.6%) | $81,760 |
| Female | 537 (39.4%) | $88,125 |
| Total | 1,364 (100.0%) | $82,041 |
Earnings by Sex by Income Bracket in Dunkirk
The most common earnings brackets in Dunkirk are $100,000+ for men (321 | 38.8%) and $100,000+ for women (204 | 38.0%).
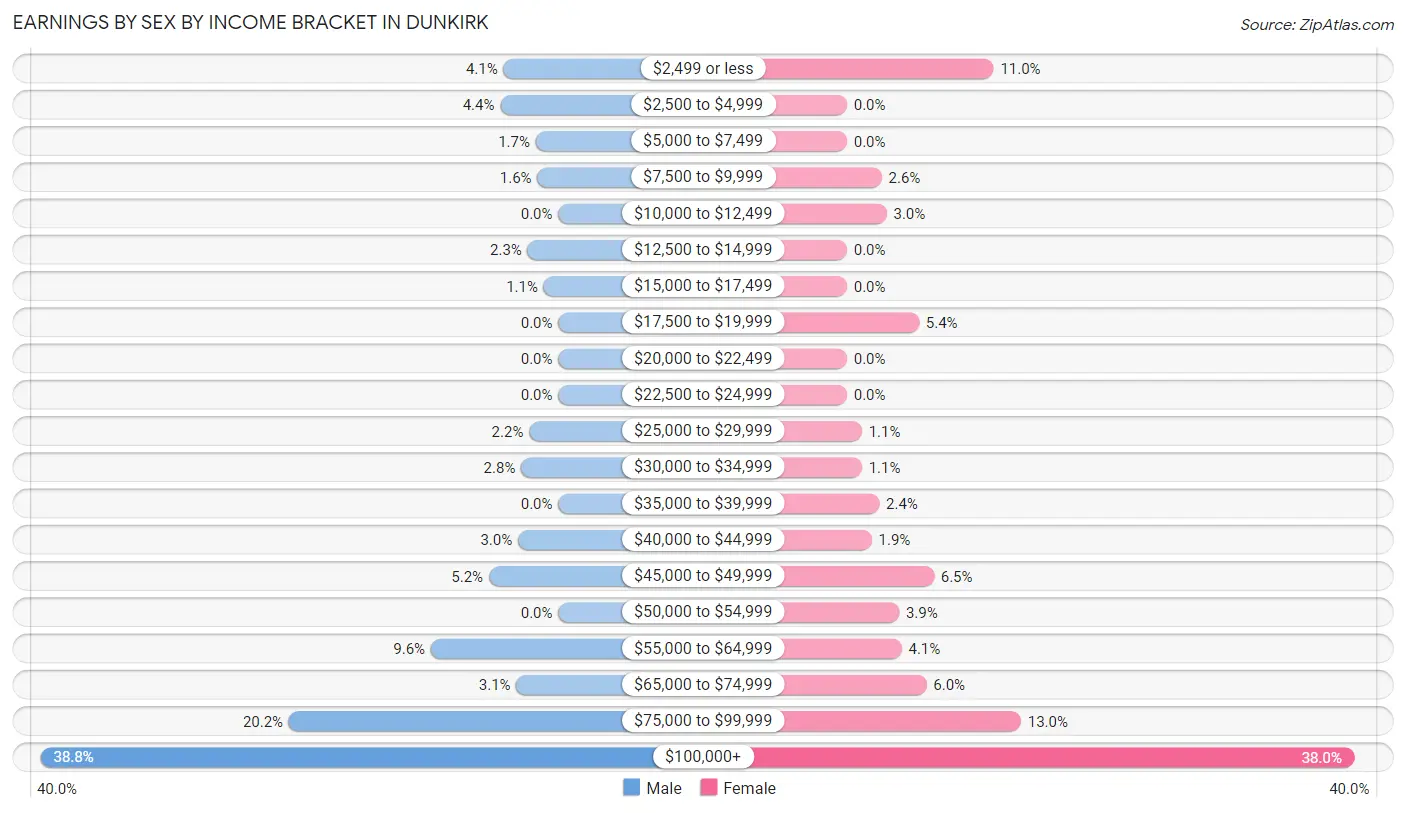
| Income | Male | Female |
| $2,499 or less | 34 (4.1%) | 59 (11.0%) |
| $2,500 to $4,999 | 36 (4.3%) | 0 (0.0%) |
| $5,000 to $7,499 | 14 (1.7%) | 0 (0.0%) |
| $7,500 to $9,999 | 13 (1.6%) | 14 (2.6%) |
| $10,000 to $12,499 | 0 (0.0%) | 16 (3.0%) |
| $12,500 to $14,999 | 19 (2.3%) | 0 (0.0%) |
| $15,000 to $17,499 | 9 (1.1%) | 0 (0.0%) |
| $17,500 to $19,999 | 0 (0.0%) | 29 (5.4%) |
| $20,000 to $22,499 | 0 (0.0%) | 0 (0.0%) |
| $22,500 to $24,999 | 0 (0.0%) | 0 (0.0%) |
| $25,000 to $29,999 | 18 (2.2%) | 6 (1.1%) |
| $30,000 to $34,999 | 23 (2.8%) | 6 (1.1%) |
| $35,000 to $39,999 | 0 (0.0%) | 13 (2.4%) |
| $40,000 to $44,999 | 25 (3.0%) | 10 (1.9%) |
| $45,000 to $49,999 | 43 (5.2%) | 35 (6.5%) |
| $50,000 to $54,999 | 0 (0.0%) | 21 (3.9%) |
| $55,000 to $64,999 | 79 (9.6%) | 22 (4.1%) |
| $65,000 to $74,999 | 26 (3.1%) | 32 (6.0%) |
| $75,000 to $99,999 | 167 (20.2%) | 70 (13.0%) |
| $100,000+ | 321 (38.8%) | 204 (38.0%) |
| Total | 827 (100.0%) | 537 (100.0%) |
Earnings by Sex by Educational Attainment in Dunkirk
Average earnings in Dunkirk are $90,769 for men and $92,212 for women, a difference of 1.6%. Men with an educational attainment of graduate degree enjoy the highest average annual earnings of $116,435, while those with high school diploma education earn the least with $68,173. Women with an educational attainment of high school diploma earn the most with the average annual earnings of $107,411, while those with bachelor's degree education have the smallest earnings of $53,942.
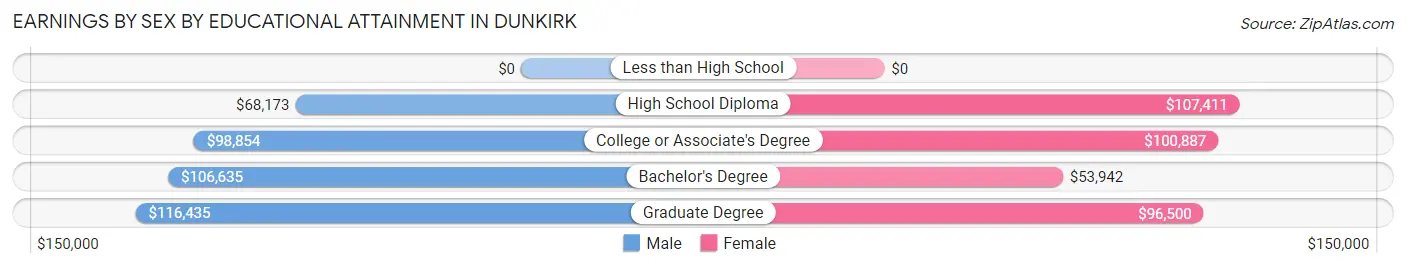
| Educational Attainment | Male Income | Female Income |
| Less than High School | - | - |
| High School Diploma | $68,173 | $107,411 |
| College or Associate's Degree | $98,854 | $100,887 |
| Bachelor's Degree | $106,635 | $53,942 |
| Graduate Degree | $116,435 | $96,500 |
| Total | $90,769 | $92,212 |
Family Income in Dunkirk
Family Income Brackets in Dunkirk
According to the Dunkirk family income data, there are 285 families falling into the $200,000+ income range, which is the most common income bracket and makes up 43.5% of all families.
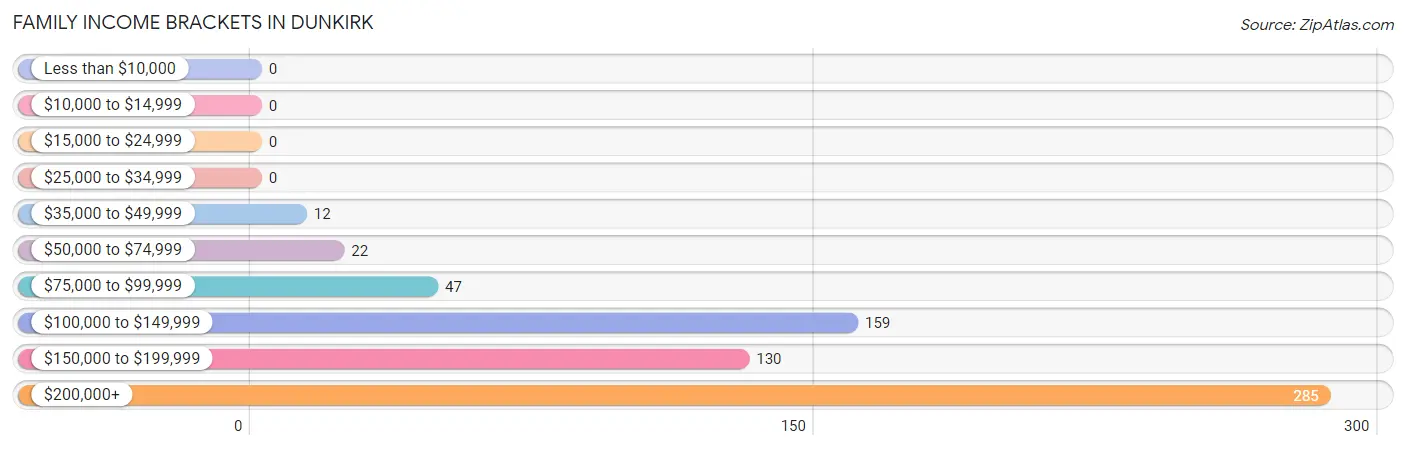
| Income Bracket | # Families | % Families |
| Less than $10,000 | 0 | 0.0% |
| $10,000 to $14,999 | 0 | 0.0% |
| $15,000 to $24,999 | 0 | 0.0% |
| $25,000 to $34,999 | 0 | 0.0% |
| $35,000 to $49,999 | 12 | 1.8% |
| $50,000 to $74,999 | 22 | 3.4% |
| $75,000 to $99,999 | 47 | 7.2% |
| $100,000 to $149,999 | 159 | 24.3% |
| $150,000 to $199,999 | 130 | 19.8% |
| $200,000+ | 285 | 43.5% |
Family Income by Famaliy Size in Dunkirk
5-person families (80 | 12.2%) account for the highest median family income in Dunkirk with $250,001 per family, while 3-person families (118 | 18.0%) have the highest median income of $74,125 per family member.
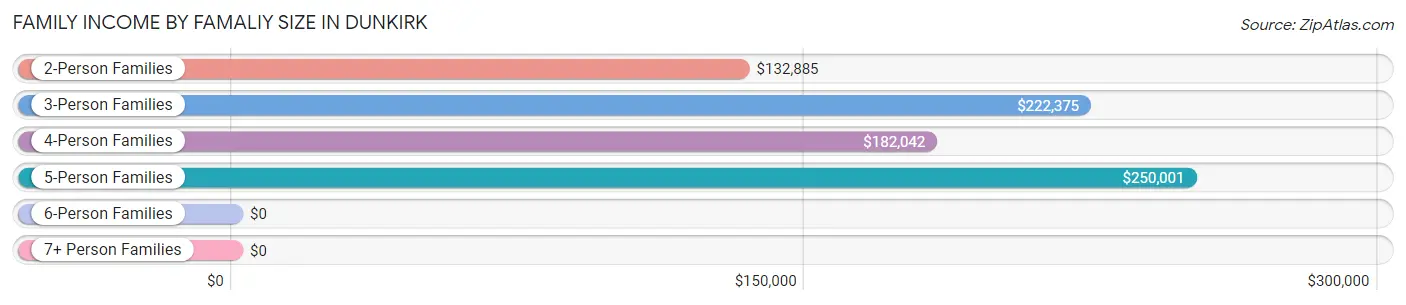
| Income Bracket | # Families | Median Income |
| 2-Person Families | 254 (38.8%) | $132,885 |
| 3-Person Families | 118 (18.0%) | $222,375 |
| 4-Person Families | 187 (28.5%) | $182,042 |
| 5-Person Families | 80 (12.2%) | $250,001 |
| 6-Person Families | 16 (2.4%) | $0 |
| 7+ Person Families | 0 (0.0%) | $0 |
| Total | 655 (100.0%) | $180,708 |
Family Income by Number of Earners in Dunkirk
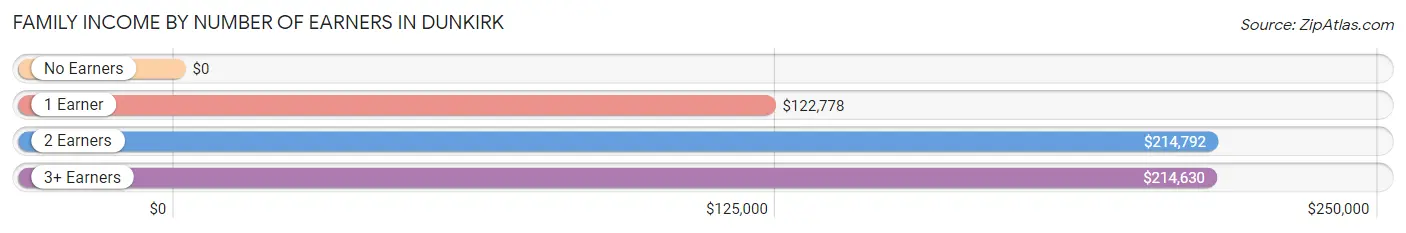
| Number of Earners | # Families | Median Income |
| No Earners | 57 (8.7%) | $0 |
| 1 Earner | 152 (23.2%) | $122,778 |
| 2 Earners | 306 (46.7%) | $214,792 |
| 3+ Earners | 140 (21.4%) | $214,630 |
| Total | 655 (100.0%) | $180,708 |
Household Income in Dunkirk
Household Income Brackets in Dunkirk
With 285 households falling in the category, the $200,000+ income range is the most frequent in Dunkirk, accounting for 36.7% of all households.
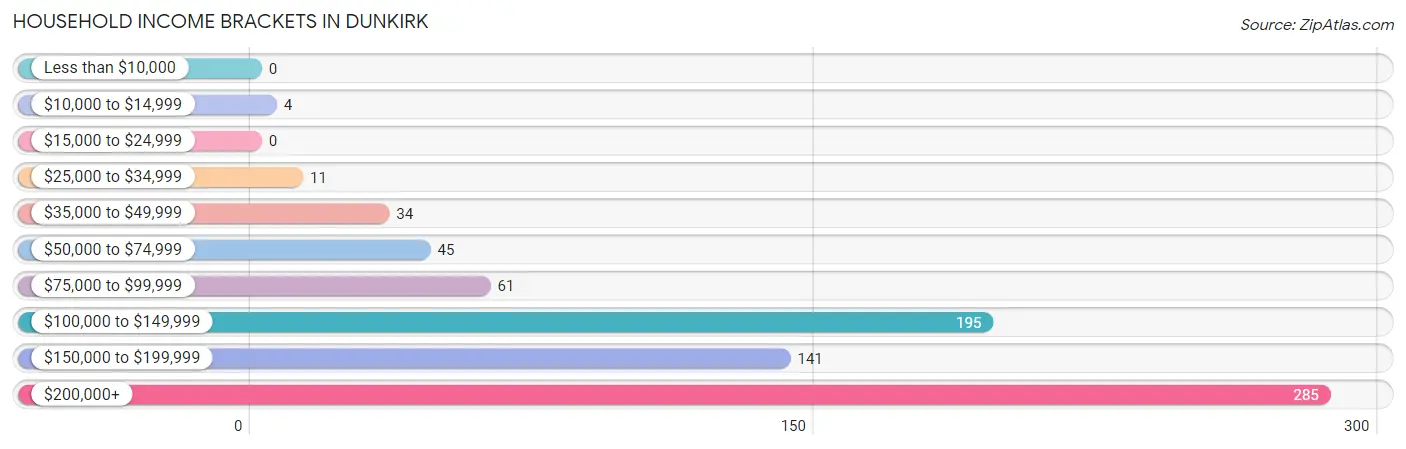
| Income Bracket | # Households | % Households |
| Less than $10,000 | 0 | 0.0% |
| $10,000 to $14,999 | 4 | 0.5% |
| $15,000 to $24,999 | 0 | 0.0% |
| $25,000 to $34,999 | 11 | 1.4% |
| $35,000 to $49,999 | 34 | 4.4% |
| $50,000 to $74,999 | 45 | 5.8% |
| $75,000 to $99,999 | 61 | 7.9% |
| $100,000 to $149,999 | 195 | 25.1% |
| $150,000 to $199,999 | 141 | 18.2% |
| $200,000+ | 285 | 36.7% |
Household Income by Householder Age in Dunkirk
The median household income in Dunkirk is $159,167, with the highest median household income of $197,667 found in the 45 to 64 years age bracket for the primary householder. A total of 350 households (45.1%) fall into this category.
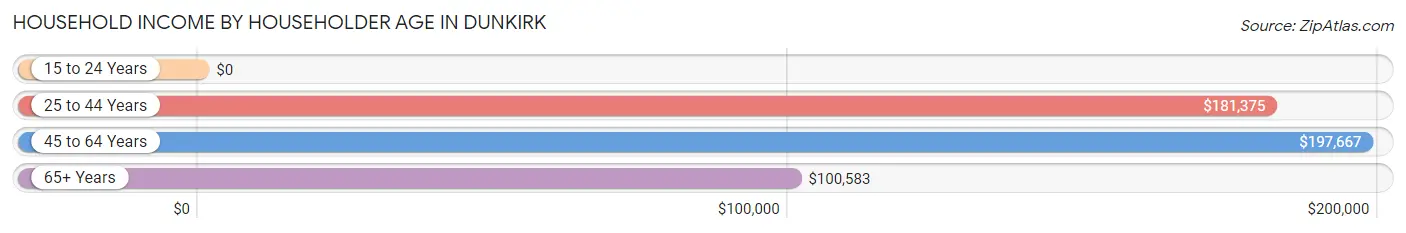
| Income Bracket | # Households | Median Income |
| 15 to 24 Years | 0 (0.0%) | $0 |
| 25 to 44 Years | 221 (28.5%) | $181,375 |
| 45 to 64 Years | 350 (45.1%) | $197,667 |
| 65+ Years | 205 (26.4%) | $100,583 |
| Total | 776 (100.0%) | $159,167 |
Poverty in Dunkirk
Income Below Poverty by Sex and Age in Dunkirk
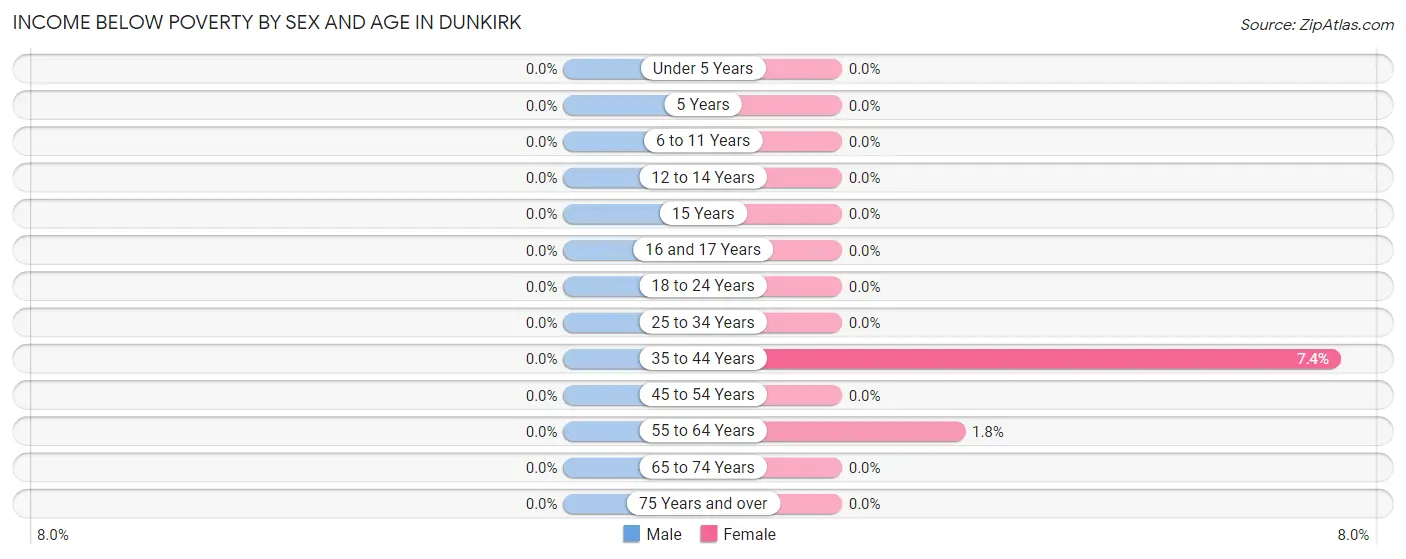
| Age Bracket | Male | Female |
| Under 5 Years | 0 (0.0%) | 0 (0.0%) |
| 5 Years | 0 (0.0%) | 0 (0.0%) |
| 6 to 11 Years | 0 (0.0%) | 0 (0.0%) |
| 12 to 14 Years | 0 (0.0%) | 0 (0.0%) |
| 15 Years | 0 (0.0%) | 0 (0.0%) |
| 16 and 17 Years | 0 (0.0%) | 0 (0.0%) |
| 18 to 24 Years | 0 (0.0%) | 0 (0.0%) |
| 25 to 34 Years | 0 (0.0%) | 0 (0.0%) |
| 35 to 44 Years | 0 (0.0%) | 12 (7.4%) |
| 45 to 54 Years | 0 (0.0%) | 0 (0.0%) |
| 55 to 64 Years | 0 (0.0%) | 4 (1.8%) |
| 65 to 74 Years | 0 (0.0%) | 0 (0.0%) |
| 75 Years and over | 0 (0.0%) | 0 (0.0%) |
| Total | 0 (0.0%) | 16 (1.6%) |
Income Above Poverty by Sex and Age in Dunkirk
According to the poverty statistics in Dunkirk, males aged under 5 years and females aged under 5 years are the age groups that are most secure financially, with 100.0% of males and 100.0% of females in these age groups living above the poverty line.
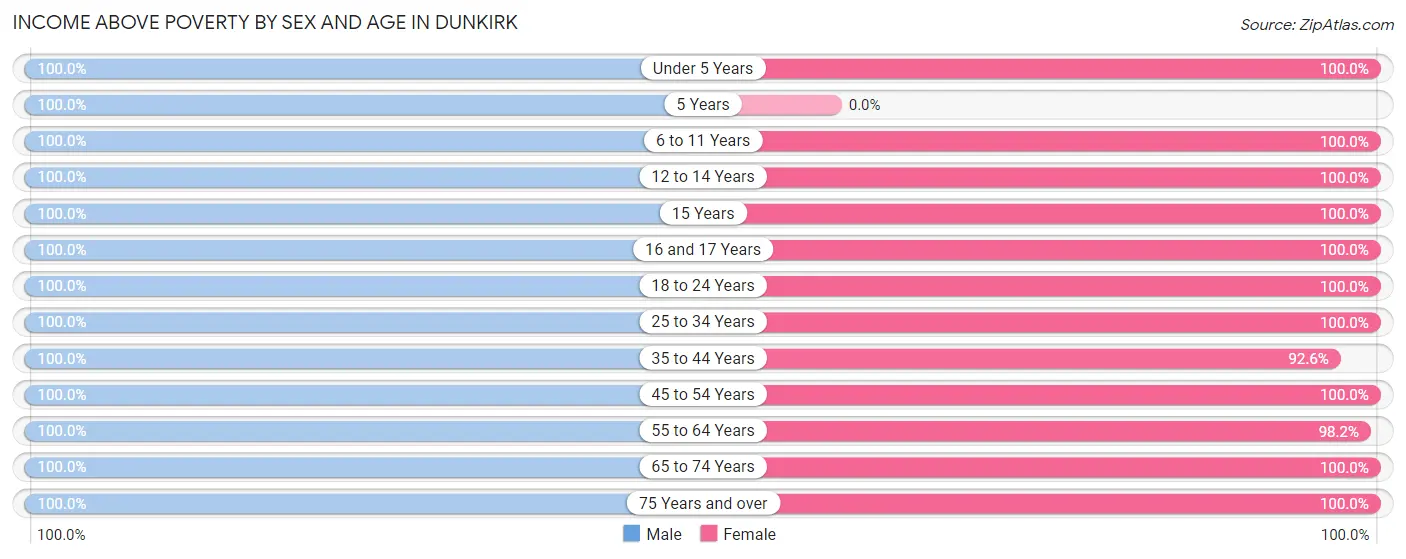
| Age Bracket | Male | Female |
| Under 5 Years | 20 (100.0%) | 62 (100.0%) |
| 5 Years | 14 (100.0%) | 0 (0.0%) |
| 6 to 11 Years | 110 (100.0%) | 63 (100.0%) |
| 12 to 14 Years | 12 (100.0%) | 53 (100.0%) |
| 15 Years | 53 (100.0%) | 25 (100.0%) |
| 16 and 17 Years | 31 (100.0%) | 17 (100.0%) |
| 18 to 24 Years | 120 (100.0%) | 79 (100.0%) |
| 25 to 34 Years | 182 (100.0%) | 78 (100.0%) |
| 35 to 44 Years | 142 (100.0%) | 150 (92.6%) |
| 45 to 54 Years | 203 (100.0%) | 121 (100.0%) |
| 55 to 64 Years | 152 (100.0%) | 214 (98.2%) |
| 65 to 74 Years | 164 (100.0%) | 62 (100.0%) |
| 75 Years and over | 68 (100.0%) | 64 (100.0%) |
| Total | 1,271 (100.0%) | 988 (98.4%) |
Income Below Poverty Among Married-Couple Families in Dunkirk
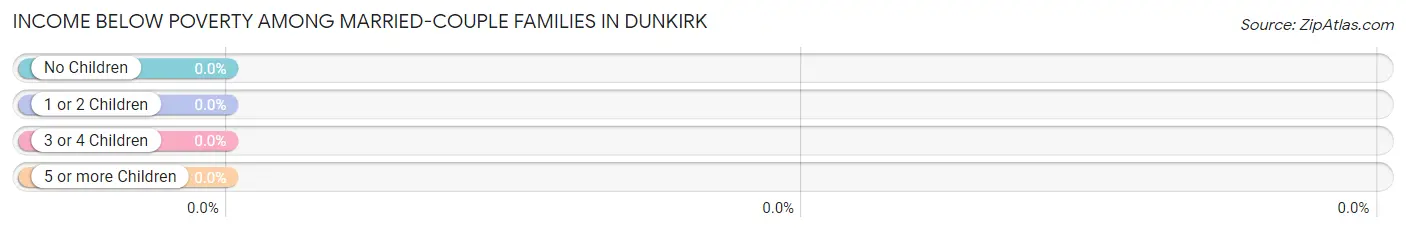
| Children | Above Poverty | Below Poverty |
| No Children | 325 (100.0%) | 0 (0.0%) |
| 1 or 2 Children | 220 (100.0%) | 0 (0.0%) |
| 3 or 4 Children | 63 (100.0%) | 0 (0.0%) |
| 5 or more Children | 0 (0.0%) | 0 (0.0%) |
| Total | 608 (100.0%) | 0 (0.0%) |
Income Below Poverty Among Single-Parent Households in Dunkirk
| Children | Single Father | Single Mother |
| No Children | 0 (0.0%) | 0 (0.0%) |
| 1 or 2 Children | 0 (0.0%) | 0 (0.0%) |
| 3 or 4 Children | 0 (0.0%) | 0 (0.0%) |
| 5 or more Children | 0 (0.0%) | 0 (0.0%) |
| Total | 0 (0.0%) | 0 (0.0%) |
Income Below Poverty Among Married-Couple vs Single-Parent Households in Dunkirk
| Children | Married-Couple Families | Single-Parent Households |
| No Children | 0 (0.0%) | 0 (0.0%) |
| 1 or 2 Children | 0 (0.0%) | 0 (0.0%) |
| 3 or 4 Children | 0 (0.0%) | 0 (0.0%) |
| 5 or more Children | 0 (0.0%) | 0 (0.0%) |
| Total | 0 (0.0%) | 0 (0.0%) |
Race in Dunkirk
The most populous races in Dunkirk are White / Caucasian (2,011 | 88.3%), Hispanic or Latino (214 | 9.4%), and Two or more Races (178 | 7.8%).
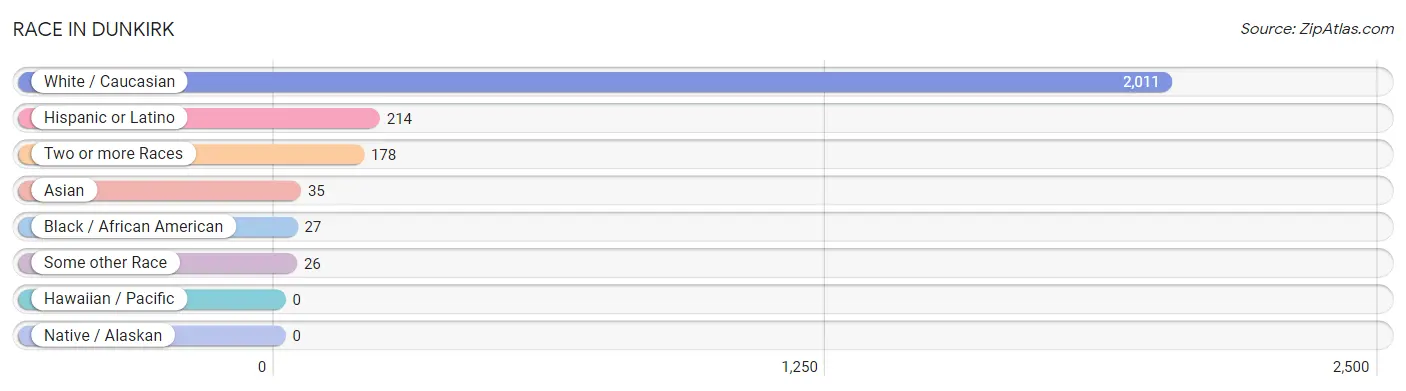
| Race | # Population | % Population |
| Asian | 35 | 1.5% |
| Black / African American | 27 | 1.2% |
| Hawaiian / Pacific | 0 | 0.0% |
| Hispanic or Latino | 214 | 9.4% |
| Native / Alaskan | 0 | 0.0% |
| White / Caucasian | 2,011 | 88.3% |
| Two or more Races | 178 | 7.8% |
| Some other Race | 26 | 1.1% |
| Total | 2,277 | 100.0% |
Ancestry in Dunkirk
The most populous ancestries reported in Dunkirk are German (334 | 14.7%), English (325 | 14.3%), Italian (298 | 13.1%), Irish (284 | 12.5%), and American (236 | 10.4%), together accounting for 64.9% of all Dunkirk residents.
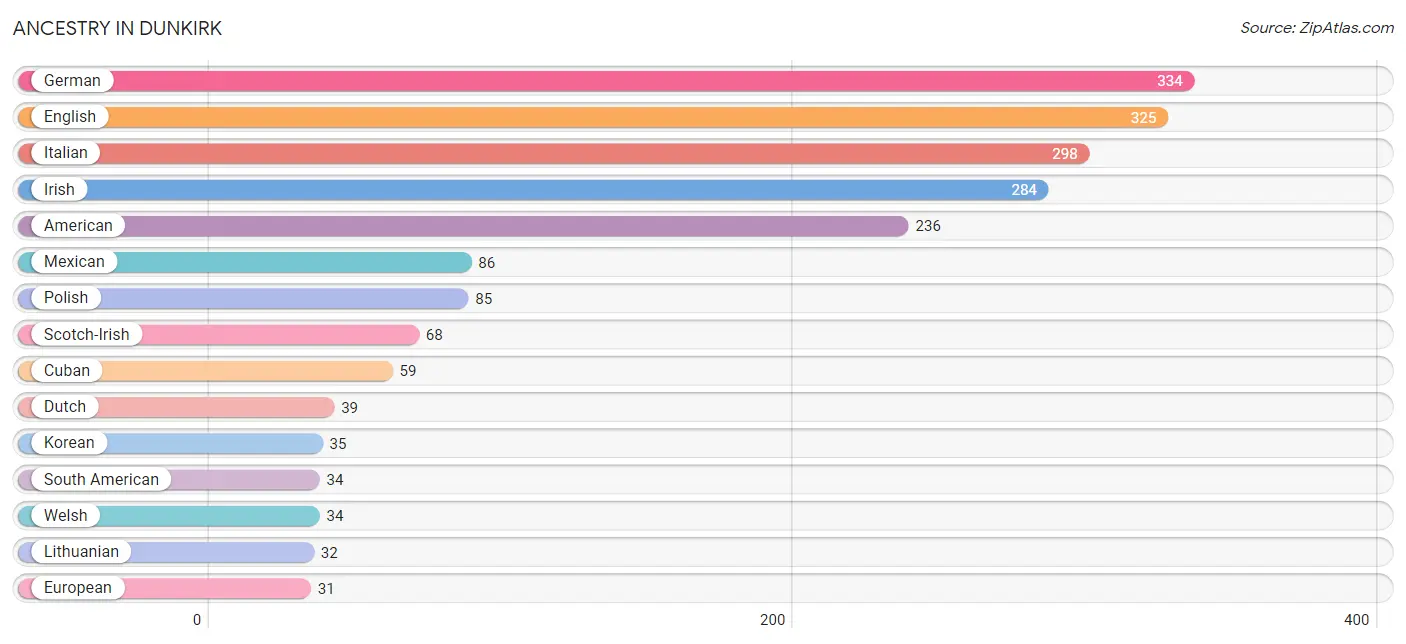
| Ancestry | # Population | % Population |
| African | 7 | 0.3% |
| American | 236 | 10.4% |
| Bhutanese | 18 | 0.8% |
| British | 20 | 0.9% |
| Canadian | 23 | 1.0% |
| Cuban | 59 | 2.6% |
| Czech | 20 | 0.9% |
| Czechoslovakian | 15 | 0.7% |
| Dutch | 39 | 1.7% |
| English | 325 | 14.3% |
| European | 31 | 1.4% |
| French | 13 | 0.6% |
| French Canadian | 25 | 1.1% |
| German | 334 | 14.7% |
| Greek | 11 | 0.5% |
| Hungarian | 10 | 0.4% |
| Irish | 284 | 12.5% |
| Italian | 298 | 13.1% |
| Korean | 35 | 1.5% |
| Lithuanian | 32 | 1.4% |
| Mexican | 86 | 3.8% |
| Norwegian | 8 | 0.4% |
| Polish | 85 | 3.7% |
| Puerto Rican | 10 | 0.4% |
| Scotch-Irish | 68 | 3.0% |
| Slovak | 12 | 0.5% |
| South American | 34 | 1.5% |
| Spaniard | 25 | 1.1% |
| Subsaharan African | 7 | 0.3% |
| Swedish | 13 | 0.6% |
| Welsh | 34 | 1.5% |
| West Indian | 7 | 0.3% | View All 32 Rows |
Immigrants in Dunkirk
The most numerous immigrant groups reported in Dunkirk came from Europe (79 | 3.5%), Eastern Europe (59 | 2.6%), Russia (59 | 2.6%), Asia (44 | 1.9%), and Philippines (35 | 1.5%), together accounting for 12.1% of all Dunkirk residents.
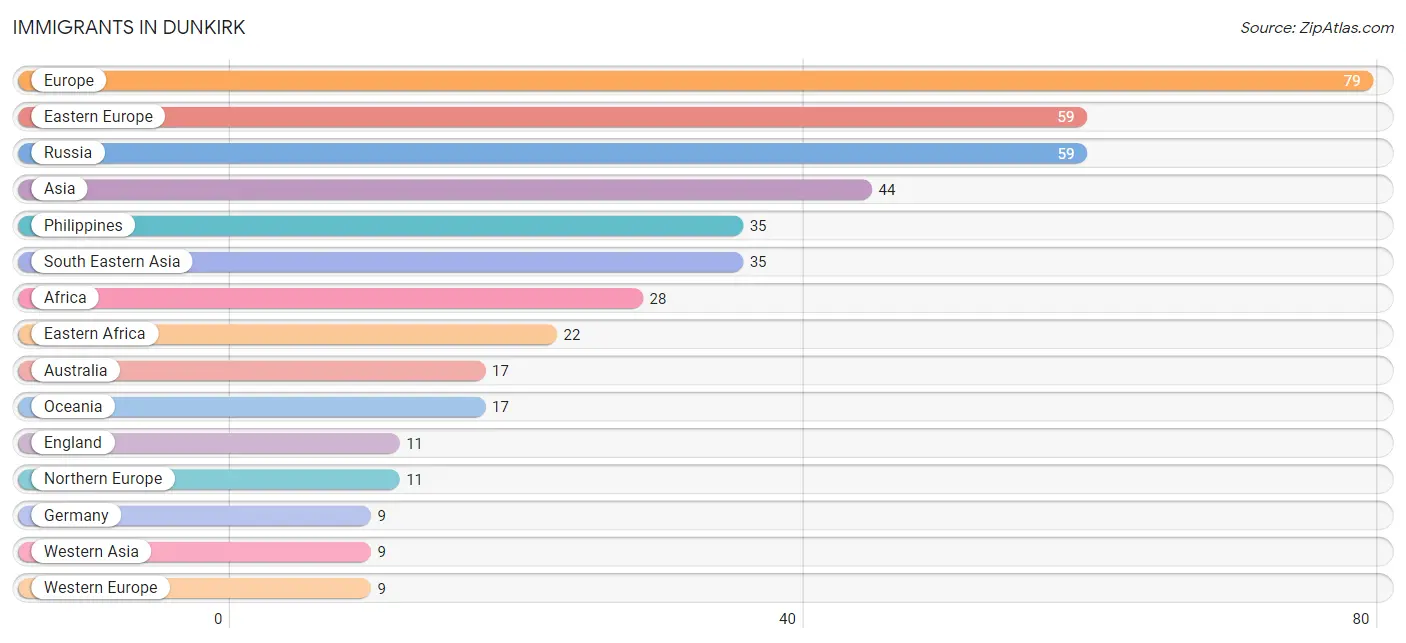
| Immigration Origin | # Population | % Population |
| Africa | 28 | 1.2% |
| Asia | 44 | 1.9% |
| Australia | 17 | 0.7% |
| Central America | 7 | 0.3% |
| Eastern Africa | 22 | 1.0% |
| Eastern Europe | 59 | 2.6% |
| England | 11 | 0.5% |
| Europe | 79 | 3.5% |
| Germany | 9 | 0.4% |
| Latin America | 7 | 0.3% |
| Mexico | 7 | 0.3% |
| Northern Africa | 6 | 0.3% |
| Northern Europe | 11 | 0.5% |
| Oceania | 17 | 0.7% |
| Philippines | 35 | 1.5% |
| Russia | 59 | 2.6% |
| South Eastern Asia | 35 | 1.5% |
| Western Asia | 9 | 0.4% |
| Western Europe | 9 | 0.4% | View All 19 Rows |
Sex and Age in Dunkirk
Sex and Age in Dunkirk
The most populous age groups in Dunkirk are 15 to 19 Years (158 | 12.4%) for men and 55 to 59 Years (132 | 13.1%) for women.
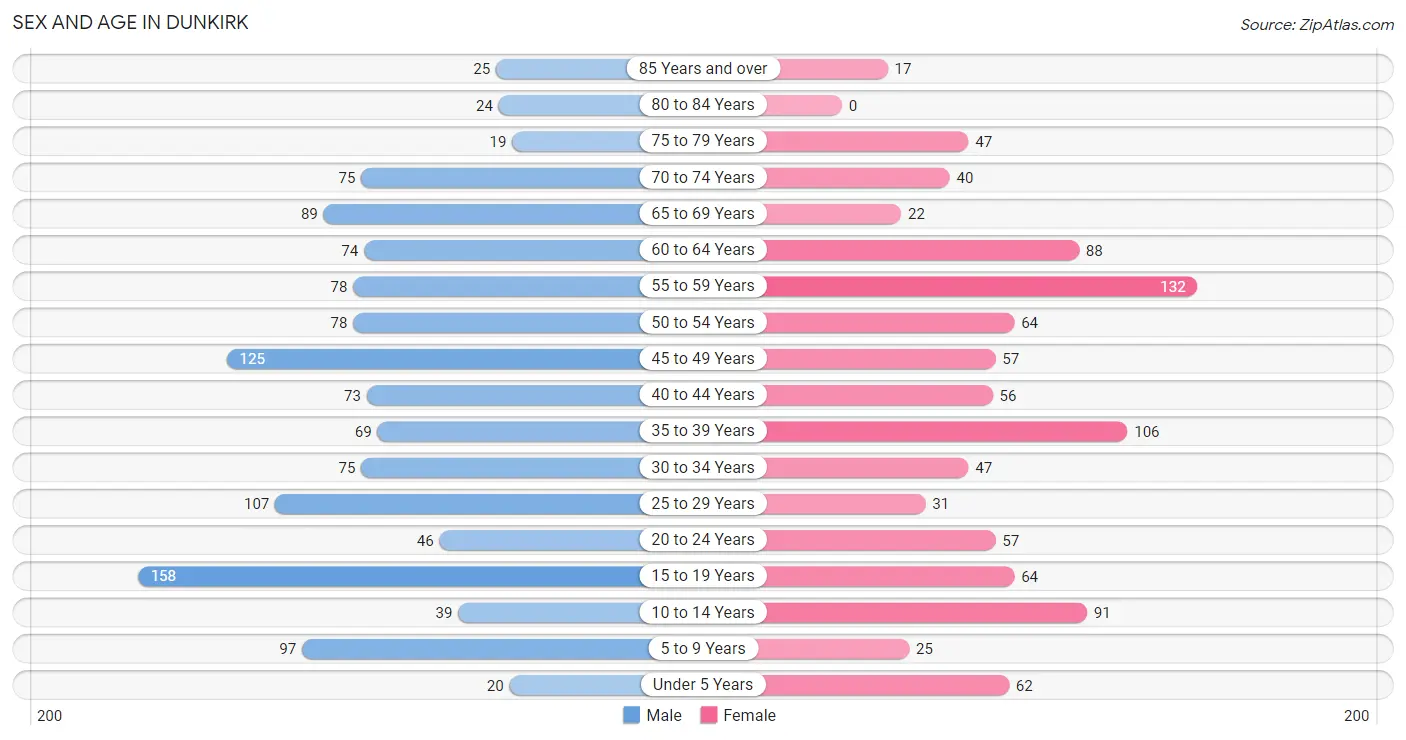
| Age Bracket | Male | Female |
| Under 5 Years | 20 (1.6%) | 62 (6.2%) |
| 5 to 9 Years | 97 (7.6%) | 25 (2.5%) |
| 10 to 14 Years | 39 (3.1%) | 91 (9.0%) |
| 15 to 19 Years | 158 (12.4%) | 64 (6.4%) |
| 20 to 24 Years | 46 (3.6%) | 57 (5.7%) |
| 25 to 29 Years | 107 (8.4%) | 31 (3.1%) |
| 30 to 34 Years | 75 (5.9%) | 47 (4.7%) |
| 35 to 39 Years | 69 (5.4%) | 106 (10.5%) |
| 40 to 44 Years | 73 (5.7%) | 56 (5.6%) |
| 45 to 49 Years | 125 (9.8%) | 57 (5.7%) |
| 50 to 54 Years | 78 (6.1%) | 64 (6.4%) |
| 55 to 59 Years | 78 (6.1%) | 132 (13.1%) |
| 60 to 64 Years | 74 (5.8%) | 88 (8.7%) |
| 65 to 69 Years | 89 (7.0%) | 22 (2.2%) |
| 70 to 74 Years | 75 (5.9%) | 40 (4.0%) |
| 75 to 79 Years | 19 (1.5%) | 47 (4.7%) |
| 80 to 84 Years | 24 (1.9%) | 0 (0.0%) |
| 85 Years and over | 25 (2.0%) | 17 (1.7%) |
| Total | 1,271 (100.0%) | 1,006 (100.0%) |
Families and Households in Dunkirk
Median Family Size in Dunkirk
The median family size in Dunkirk is 3.23 persons per family, with single female/mother families (17 | 2.6%) accounting for the largest median family size of 4.24 persons per family. On the other hand, single male/father families (30 | 4.6%) represent the smallest median family size with 2.43 persons per family.
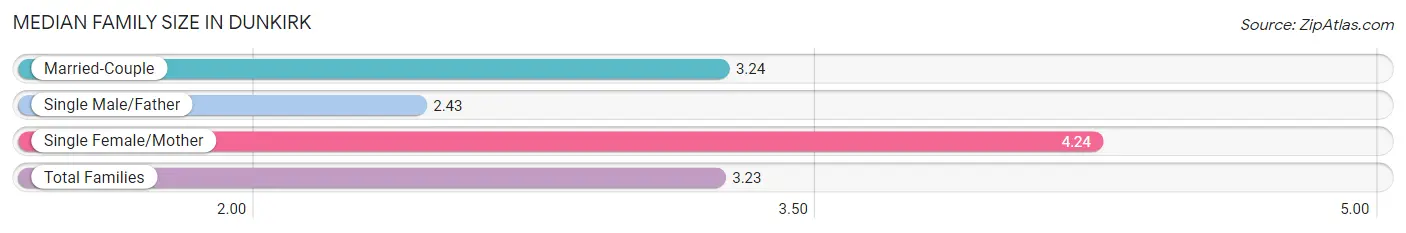
| Family Type | # Families | Family Size |
| Married-Couple | 608 (92.8%) | 3.24 |
| Single Male/Father | 30 (4.6%) | 2.43 |
| Single Female/Mother | 17 (2.6%) | 4.24 |
| Total Families | 655 (100.0%) | 3.23 |
Median Household Size in Dunkirk
The median household size in Dunkirk is 2.93 persons per household, with single female/mother households (17 | 2.2%) accounting for the largest median household size of 4.24 persons per household. non-family households (121 | 15.6%) represent the smallest median household size with 1.12 persons per household.
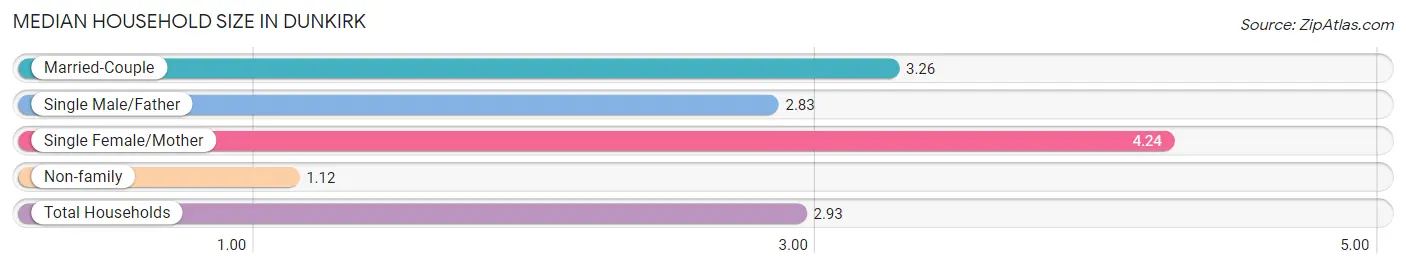
| Household Type | # Households | Household Size |
| Married-Couple | 608 (78.3%) | 3.26 |
| Single Male/Father | 30 (3.9%) | 2.83 |
| Single Female/Mother | 17 (2.2%) | 4.24 |
| Non-family | 121 (15.6%) | 1.12 |
| Total Households | 776 (100.0%) | 2.93 |
Household Size by Marriage Status in Dunkirk
Out of a total of 776 households in Dunkirk, 655 (84.4%) are family households, while 121 (15.6%) are nonfamily households. The most numerous type of family households are 2-person households, comprising 243, and the most common type of nonfamily households are 1-person households, comprising 108.
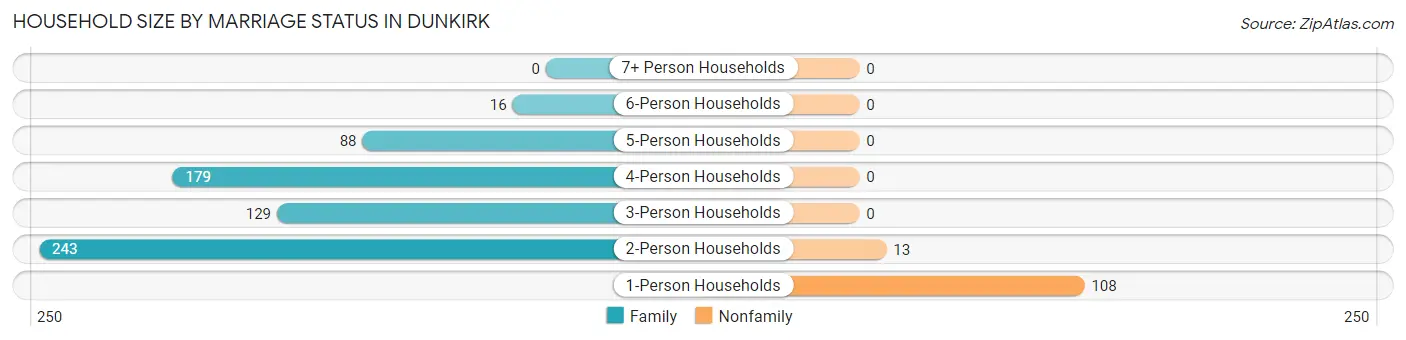
| Household Size | Family Households | Nonfamily Households |
| 1-Person Households | - | 108 (13.9%) |
| 2-Person Households | 243 (31.3%) | 13 (1.7%) |
| 3-Person Households | 129 (16.6%) | 0 (0.0%) |
| 4-Person Households | 179 (23.1%) | 0 (0.0%) |
| 5-Person Households | 88 (11.3%) | 0 (0.0%) |
| 6-Person Households | 16 (2.1%) | 0 (0.0%) |
| 7+ Person Households | 0 (0.0%) | 0 (0.0%) |
| Total | 655 (84.4%) | 121 (15.6%) |
Female Fertility in Dunkirk
Fertility by Age in Dunkirk
Average fertility rate in Dunkirk is 21.0 births per 1,000 women. Women in the age bracket of 20 to 34 years have the highest fertility rate with 67.0 births per 1,000 women. Women in the age bracket of 20 to 34 years acount for 100.0% of all women with births.
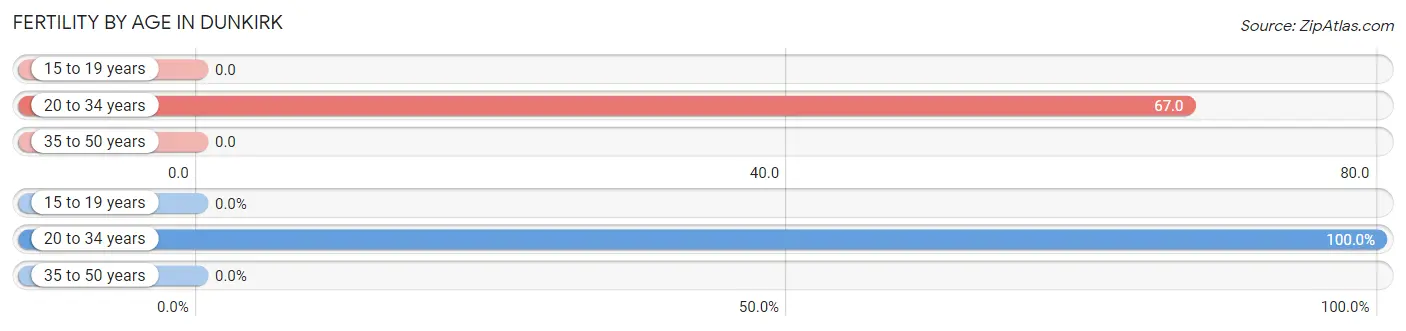
| Age Bracket | Women with Births | Births / 1,000 Women |
| 15 to 19 years | 0 (0.0%) | 0.0 |
| 20 to 34 years | 9 (100.0%) | 67.0 |
| 35 to 50 years | 0 (0.0%) | 0.0 |
| Total | 9 (100.0%) | 21.0 |
Fertility by Age by Marriage Status in Dunkirk
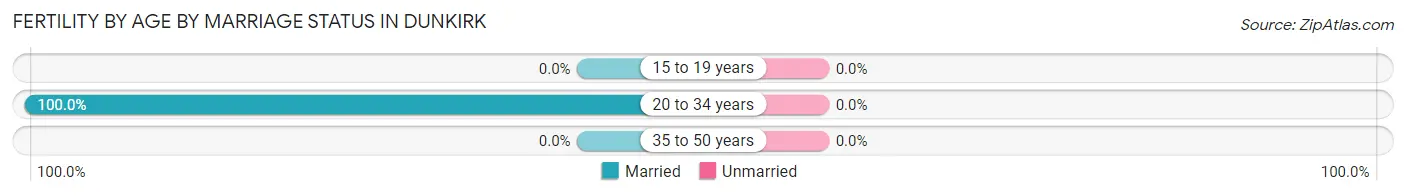
| Age Bracket | Married | Unmarried |
| 15 to 19 years | 0 (0.0%) | 0 (0.0%) |
| 20 to 34 years | 9 (100.0%) | 0 (0.0%) |
| 35 to 50 years | 0 (0.0%) | 0 (0.0%) |
| Total | 9 (100.0%) | 0 (0.0%) |
Fertility by Education in Dunkirk
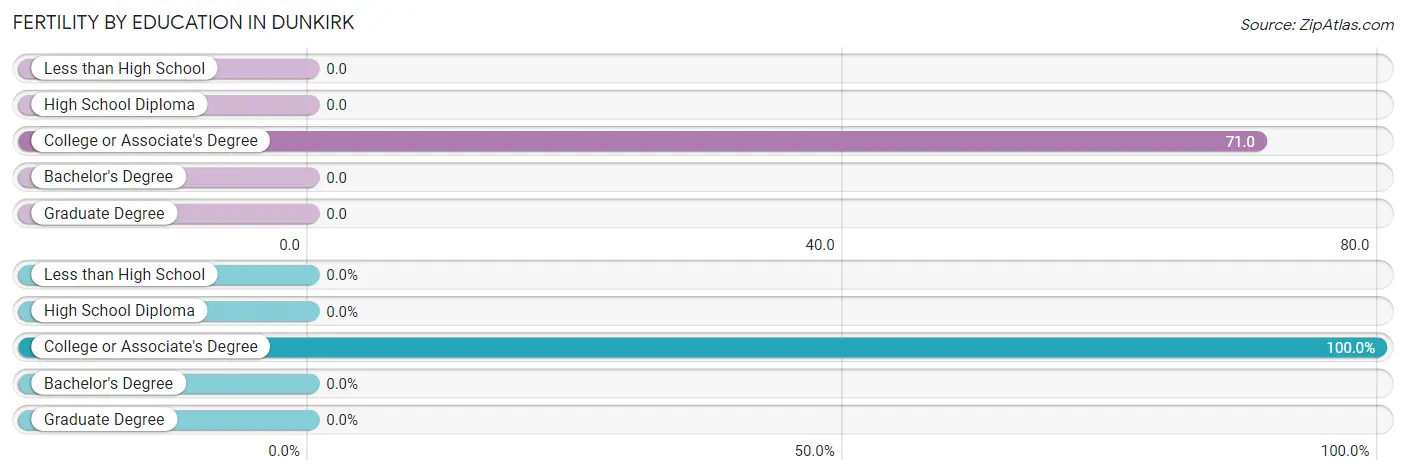
| Educational Attainment | Women with Births | Births / 1,000 Women |
| Less than High School | 0 (0.0%) | 0.0 |
| High School Diploma | 0 (0.0%) | 0.0 |
| College or Associate's Degree | 9 (100.0%) | 71.0 |
| Bachelor's Degree | 0 (0.0%) | 0.0 |
| Graduate Degree | 0 (0.0%) | 0.0 |
| Total | 9 (100.0%) | 21.0 |
Fertility by Education by Marriage Status in Dunkirk
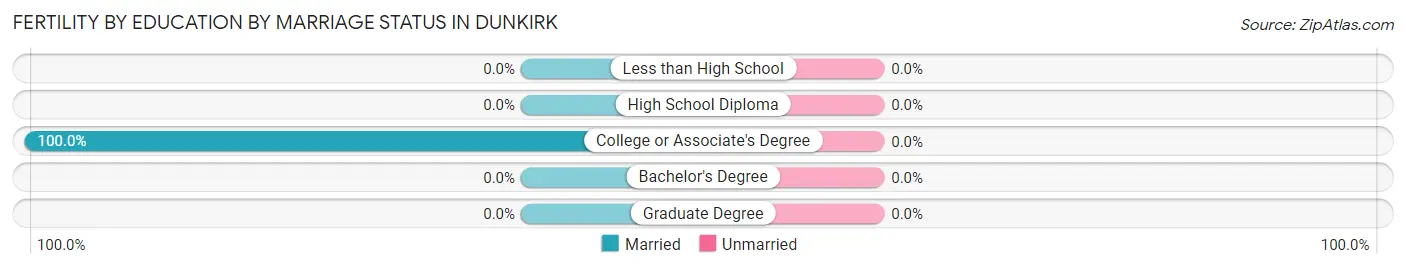
| Educational Attainment | Married | Unmarried |
| Less than High School | 0 (0.0%) | 0 (0.0%) |
| High School Diploma | 0 (0.0%) | 0 (0.0%) |
| College or Associate's Degree | 9 (100.0%) | 0 (0.0%) |
| Bachelor's Degree | 0 (0.0%) | 0 (0.0%) |
| Graduate Degree | 0 (0.0%) | 0 (0.0%) |
| Total | 9 (100.0%) | 0 (0.0%) |
Employment Characteristics in Dunkirk
Employment by Class of Employer in Dunkirk
Among the 1,240 employed individuals in Dunkirk, private company employees (627 | 50.6%), federal government employees (316 | 25.5%), and not-for-profit organizations (119 | 9.6%) make up the most common classes of employment.
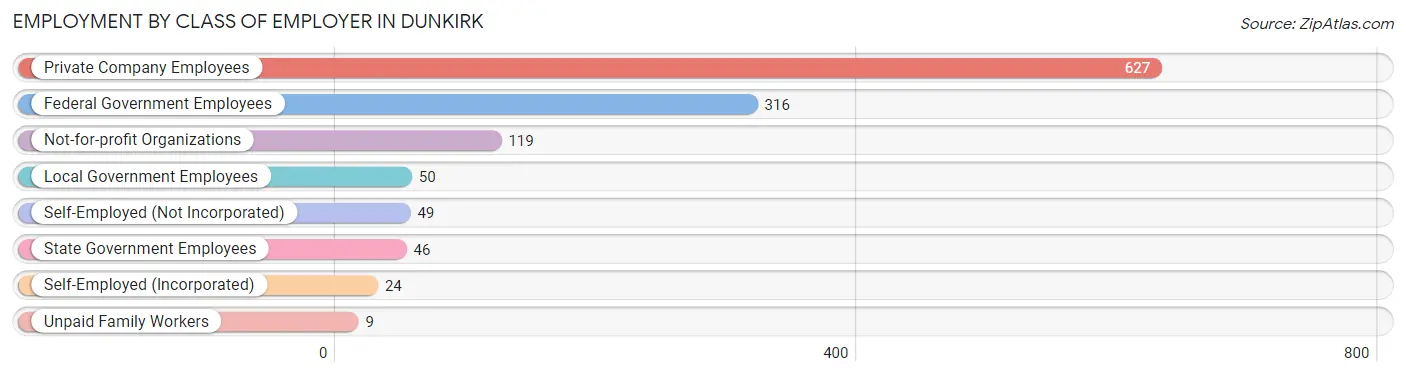
| Employer Class | # Employees | % Employees |
| Private Company Employees | 627 | 50.6% |
| Self-Employed (Incorporated) | 24 | 1.9% |
| Self-Employed (Not Incorporated) | 49 | 4.0% |
| Not-for-profit Organizations | 119 | 9.6% |
| Local Government Employees | 50 | 4.0% |
| State Government Employees | 46 | 3.7% |
| Federal Government Employees | 316 | 25.5% |
| Unpaid Family Workers | 9 | 0.7% |
| Total | 1,240 | 100.0% |
Employment Status by Age in Dunkirk
According to the labor force statistics for Dunkirk, out of the total population over 16 years of age (1,865), 67.6% or 1,261 individuals are in the labor force, with 0.7% or 9 of them unemployed. The age group with the highest labor force participation rate is 20 to 24 years, with 100.0% or 103 individuals in the labor force. Within the labor force, the 16 to 19 years age range has the highest percentage of unemployed individuals, with 20.0% or 9 of them being unemployed.
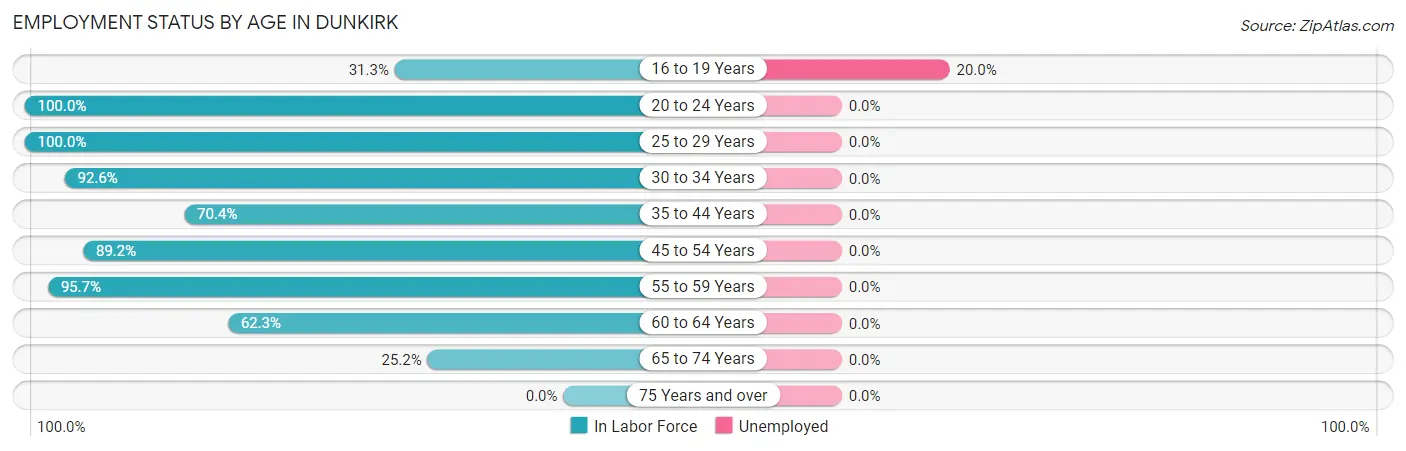
| Age Bracket | In Labor Force | Unemployed |
| 16 to 19 Years | 45 (31.3%) | 9 (20.0%) |
| 20 to 24 Years | 103 (100.0%) | 0 (0.0%) |
| 25 to 29 Years | 138 (100.0%) | 0 (0.0%) |
| 30 to 34 Years | 113 (92.6%) | 0 (0.0%) |
| 35 to 44 Years | 214 (70.4%) | 0 (0.0%) |
| 45 to 54 Years | 289 (89.2%) | 0 (0.0%) |
| 55 to 59 Years | 201 (95.7%) | 0 (0.0%) |
| 60 to 64 Years | 101 (62.3%) | 0 (0.0%) |
| 65 to 74 Years | 57 (25.2%) | 0 (0.0%) |
| 75 Years and over | 0 (0.0%) | 0 (0.0%) |
| Total | 1,261 (67.6%) | 9 (0.7%) |
Employment Status by Educational Attainment in Dunkirk
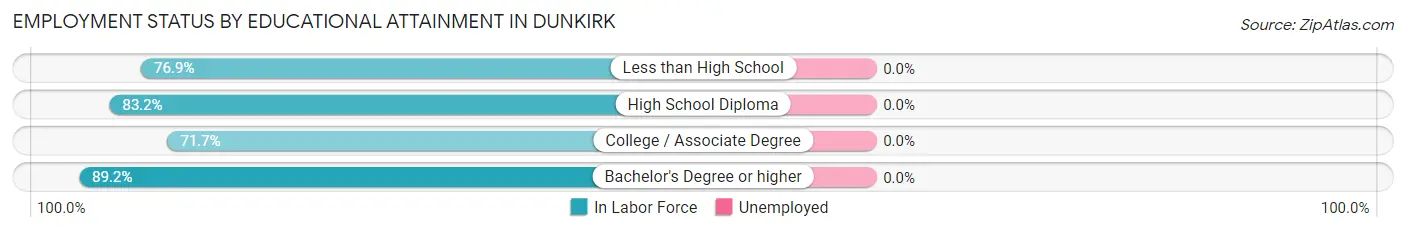
| Educational Attainment | In Labor Force | Unemployed |
| Less than High School | 30 (76.9%) | 0 (0.0%) |
| High School Diploma | 163 (83.2%) | 0 (0.0%) |
| College / Associate Degree | 210 (71.7%) | 0 (0.0%) |
| Bachelor's Degree or higher | 653 (89.2%) | 0 (0.0%) |
| Total | 1,056 (83.8%) | 0 (0.0%) |
Employment Occupations by Sex in Dunkirk
Management, Business, Science and Arts Occupations
The most common Management, Business, Science and Arts occupations in Dunkirk are Computers, Engineering & Science (177 | 14.6%), Community & Social Service (141 | 11.6%), Management (139 | 11.5%), Education Instruction & Library (129 | 10.6%), and Business & Financial (113 | 9.3%).
Management, Business, Science and Arts Occupations by Sex
Within the Management, Business, Science and Arts occupations in Dunkirk, the most male-oriented occupations are Architecture & Engineering (100.0%), Computers & Mathematics (89.3%), and Computers, Engineering & Science (79.1%), while the most female-oriented occupations are Education, Arts & Media (100.0%), Community & Social Service (92.2%), and Education Instruction & Library (91.5%).
| Occupation | Male | Female |
| Management | 73 (52.5%) | 66 (47.5%) |
| Business & Financial | 61 (54.0%) | 52 (46.0%) |
| Computers, Engineering & Science | 140 (79.1%) | 37 (20.9%) |
| Computers & Mathematics | 67 (89.3%) | 8 (10.7%) |
| Architecture & Engineering | 10 (100.0%) | 0 (0.0%) |
| Life, Physical & Social Science | 63 (68.5%) | 29 (31.5%) |
| Community & Social Service | 11 (7.8%) | 130 (92.2%) |
| Education, Arts & Media | 0 (0.0%) | 12 (100.0%) |
| Legal Services & Support | 0 (0.0%) | 0 (0.0%) |
| Education Instruction & Library | 11 (8.5%) | 118 (91.5%) |
| Arts, Media & Entertainment | 0 (0.0%) | 0 (0.0%) |
| Health Diagnosing & Treating | 40 (71.4%) | 16 (28.6%) |
| Health Technologists | 40 (71.4%) | 16 (28.6%) |
| Total (Category) | 325 (51.9%) | 301 (48.1%) |
| Total (Overall) | 689 (56.9%) | 523 (43.1%) |
Services Occupations
The most common Services occupations in Dunkirk are Food Preparation & Serving (71 | 5.9%), Personal Care & Service (62 | 5.1%), Security & Protection (37 | 3.0%), Firefighting & Prevention (37 | 3.0%), and Healthcare Support (21 | 1.7%).
Services Occupations by Sex
Within the Services occupations in Dunkirk, the most male-oriented occupations are Security & Protection (100.0%), Firefighting & Prevention (100.0%), and Food Preparation & Serving (53.5%), while the most female-oriented occupations are Healthcare Support (100.0%), Personal Care & Service (100.0%), and Food Preparation & Serving (46.5%).
| Occupation | Male | Female |
| Healthcare Support | 0 (0.0%) | 21 (100.0%) |
| Security & Protection | 37 (100.0%) | 0 (0.0%) |
| Firefighting & Prevention | 37 (100.0%) | 0 (0.0%) |
| Law Enforcement | 0 (0.0%) | 0 (0.0%) |
| Food Preparation & Serving | 38 (53.5%) | 33 (46.5%) |
| Cleaning & Maintenance | 0 (0.0%) | 0 (0.0%) |
| Personal Care & Service | 0 (0.0%) | 62 (100.0%) |
| Total (Category) | 75 (39.3%) | 116 (60.7%) |
| Total (Overall) | 689 (56.9%) | 523 (43.1%) |
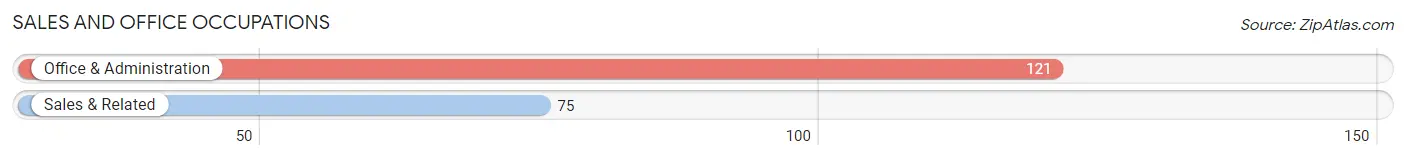
Sales and Office Occupations
The most common Sales and Office occupations in Dunkirk are Office & Administration (121 | 10.0%), and Sales & Related (75 | 6.2%).
Sales and Office Occupations by Sex
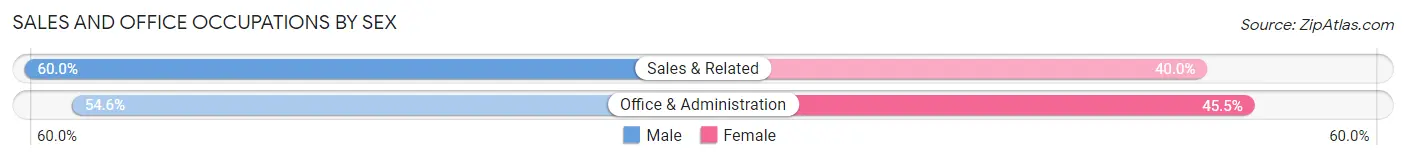
| Occupation | Male | Female |
| Sales & Related | 45 (60.0%) | 30 (40.0%) |
| Office & Administration | 66 (54.5%) | 55 (45.5%) |
| Total (Category) | 111 (56.6%) | 85 (43.4%) |
| Total (Overall) | 689 (56.9%) | 523 (43.1%) |
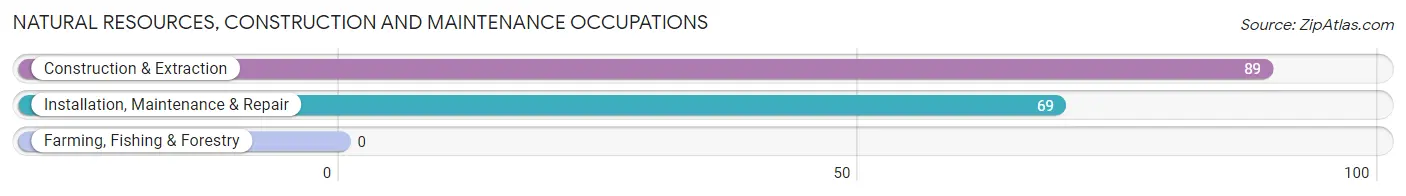
Natural Resources, Construction and Maintenance Occupations
The most common Natural Resources, Construction and Maintenance occupations in Dunkirk are Construction & Extraction (89 | 7.3%), and Installation, Maintenance & Repair (69 | 5.7%).
Natural Resources, Construction and Maintenance Occupations by Sex
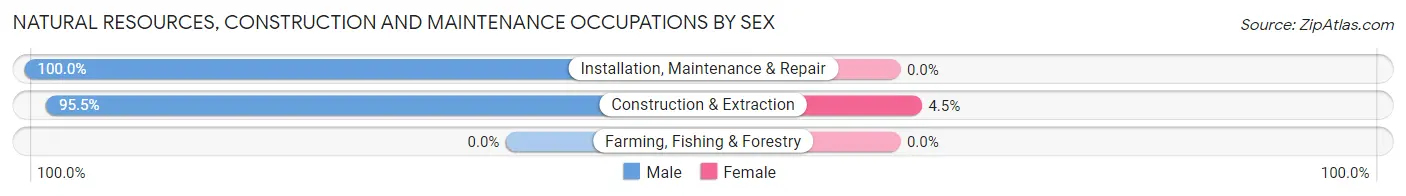
| Occupation | Male | Female |
| Farming, Fishing & Forestry | 0 (0.0%) | 0 (0.0%) |
| Construction & Extraction | 85 (95.5%) | 4 (4.5%) |
| Installation, Maintenance & Repair | 69 (100.0%) | 0 (0.0%) |
| Total (Category) | 154 (97.5%) | 4 (2.5%) |
| Total (Overall) | 689 (56.9%) | 523 (43.1%) |
Production, Transportation and Moving Occupations
The most common Production, Transportation and Moving occupations in Dunkirk are Production (28 | 2.3%), and Transportation (13 | 1.1%).
Production, Transportation and Moving Occupations by Sex
| Occupation | Male | Female |
| Production | 11 (39.3%) | 17 (60.7%) |
| Transportation | 13 (100.0%) | 0 (0.0%) |
| Material Moving | 0 (0.0%) | 0 (0.0%) |
| Total (Category) | 24 (58.5%) | 17 (41.5%) |
| Total (Overall) | 689 (56.9%) | 523 (43.1%) |
Employment Industries by Sex in Dunkirk
Employment Industries in Dunkirk
The major employment industries in Dunkirk include Public Administration (267 | 22.0%), Health Care & Social Assistance (204 | 16.8%), Professional & Scientific (136 | 11.2%), Educational Services (123 | 10.2%), and Accommodation & Food Services (80 | 6.6%).
Employment Industries by Sex in Dunkirk
The Dunkirk industries that see more men than women are Construction (100.0%), Transportation & Warehousing (100.0%), and Utilities (100.0%), whereas the industries that tend to have a higher number of women are Information (100.0%), Administrative & Support (81.5%), and Educational Services (78.0%).
| Industry | Male | Female |
| Agriculture, Fishing & Hunting | 0 (0.0%) | 0 (0.0%) |
| Mining, Quarrying, & Extraction | 0 (0.0%) | 0 (0.0%) |
| Construction | 62 (100.0%) | 0 (0.0%) |
| Manufacturing | 30 (71.4%) | 12 (28.6%) |
| Wholesale Trade | 4 (28.6%) | 10 (71.4%) |
| Retail Trade | 48 (84.2%) | 9 (15.8%) |
| Transportation & Warehousing | 59 (100.0%) | 0 (0.0%) |
| Utilities | 23 (100.0%) | 0 (0.0%) |
| Information | 0 (0.0%) | 11 (100.0%) |
| Finance & Insurance | 13 (54.2%) | 11 (45.8%) |
| Real Estate, Rental & Leasing | 0 (0.0%) | 0 (0.0%) |
| Professional & Scientific | 90 (66.2%) | 46 (33.8%) |
| Enterprise Management | 0 (0.0%) | 0 (0.0%) |
| Administrative & Support | 5 (18.5%) | 22 (81.5%) |
| Educational Services | 27 (22.0%) | 96 (78.0%) |
| Health Care & Social Assistance | 69 (33.8%) | 135 (66.2%) |
| Arts, Entertainment & Recreation | 0 (0.0%) | 0 (0.0%) |
| Accommodation & Food Services | 47 (58.8%) | 33 (41.2%) |
| Public Administration | 165 (61.8%) | 102 (38.2%) |
| Total | 689 (56.9%) | 523 (43.1%) |
Education in Dunkirk
School Enrollment in Dunkirk
The most common levels of schooling among the 637 students in Dunkirk are high school (214 | 33.6%), college / undergraduate (156 | 24.5%), and elementary school (123 | 19.3%).
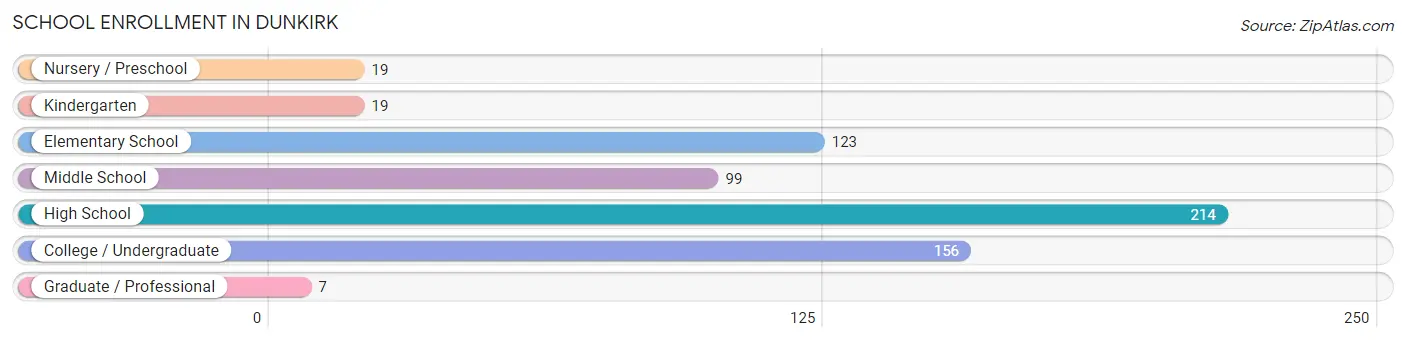
| School Level | # Students | % Students |
| Nursery / Preschool | 19 | 3.0% |
| Kindergarten | 19 | 3.0% |
| Elementary School | 123 | 19.3% |
| Middle School | 99 | 15.5% |
| High School | 214 | 33.6% |
| College / Undergraduate | 156 | 24.5% |
| Graduate / Professional | 7 | 1.1% |
| Total | 637 | 100.0% |
School Enrollment by Age by Funding Source in Dunkirk
Out of a total of 637 students who are enrolled in schools in Dunkirk, 70 (11.0%) attend a private institution, while the remaining 567 (89.0%) are enrolled in public schools. The age group of 3 to 4 year olds has the highest likelihood of being enrolled in private schools, with 10 (52.6% in the age bracket) enrolled. Conversely, the age group of 18 to 19 year olds has the lowest likelihood of being enrolled in a private school, with 96 (100.0% in the age bracket) attending a public institution.
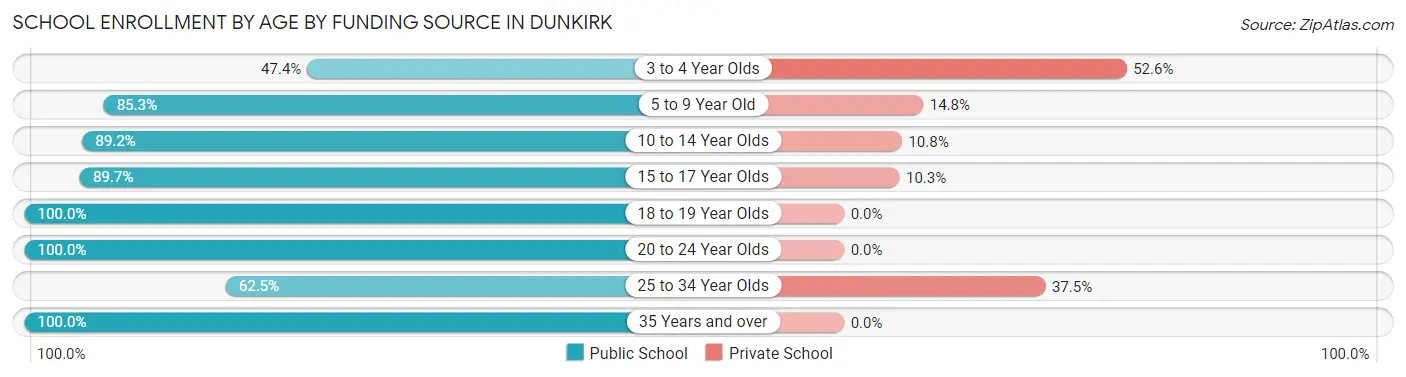
| Age Bracket | Public School | Private School |
| 3 to 4 Year Olds | 9 (47.4%) | 10 (52.6%) |
| 5 to 9 Year Old | 104 (85.3%) | 18 (14.7%) |
| 10 to 14 Year Olds | 116 (89.2%) | 14 (10.8%) |
| 15 to 17 Year Olds | 113 (89.7%) | 13 (10.3%) |
| 18 to 19 Year Olds | 96 (100.0%) | 0 (0.0%) |
| 20 to 24 Year Olds | 79 (100.0%) | 0 (0.0%) |
| 25 to 34 Year Olds | 25 (62.5%) | 15 (37.5%) |
| 35 Years and over | 25 (100.0%) | 0 (0.0%) |
| Total | 567 (89.0%) | 70 (11.0%) |
Educational Attainment by Field of Study in Dunkirk
Business (232 | 26.4%), social sciences (117 | 13.3%), computers & mathematics (88 | 10.0%), science & technology (84 | 9.6%), and physical & health sciences (80 | 9.1%) are the most common fields of study among 879 individuals in Dunkirk who have obtained a bachelor's degree or higher.
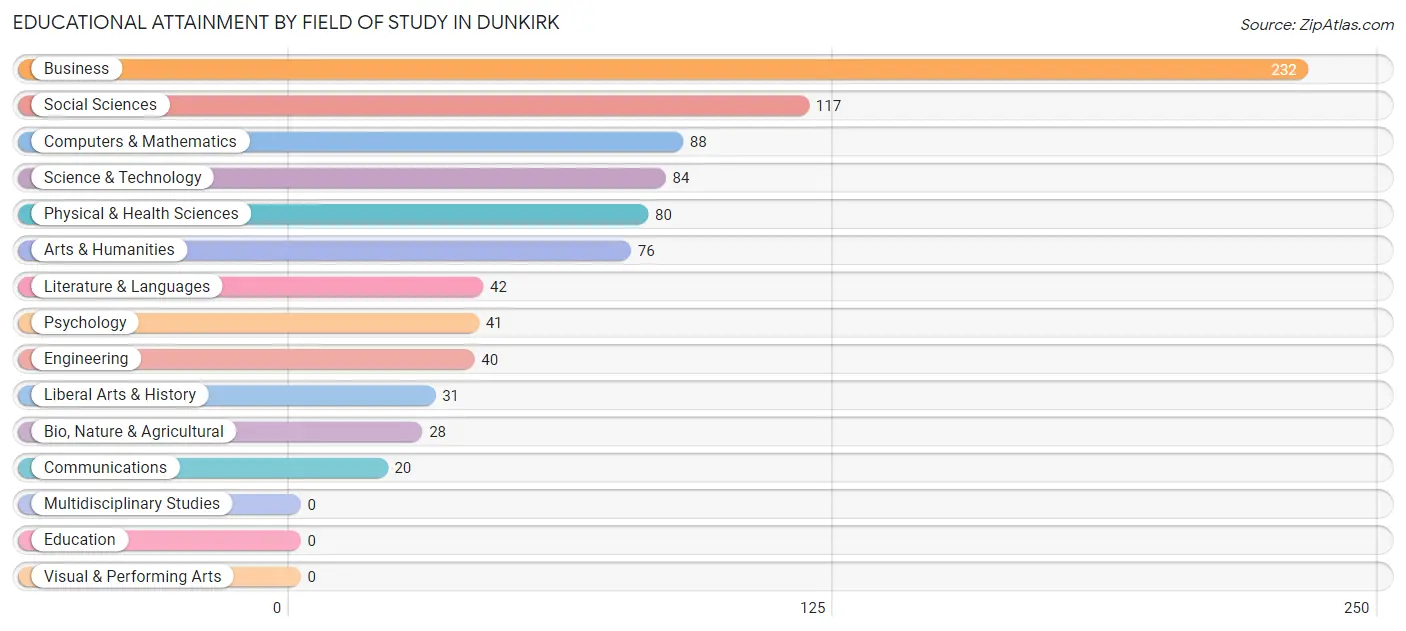
| Field of Study | # Graduates | % Graduates |
| Computers & Mathematics | 88 | 10.0% |
| Bio, Nature & Agricultural | 28 | 3.2% |
| Physical & Health Sciences | 80 | 9.1% |
| Psychology | 41 | 4.7% |
| Social Sciences | 117 | 13.3% |
| Engineering | 40 | 4.5% |
| Multidisciplinary Studies | 0 | 0.0% |
| Science & Technology | 84 | 9.6% |
| Business | 232 | 26.4% |
| Education | 0 | 0.0% |
| Literature & Languages | 42 | 4.8% |
| Liberal Arts & History | 31 | 3.5% |
| Visual & Performing Arts | 0 | 0.0% |
| Communications | 20 | 2.3% |
| Arts & Humanities | 76 | 8.6% |
| Total | 879 | 100.0% |
Transportation & Commute in Dunkirk
Vehicle Availability by Sex in Dunkirk
The most prevalent vehicle ownership categories in Dunkirk are males with 2 vehicles (220, accounting for 30.8%) and females with 2 vehicles (181, making up 41.9%).
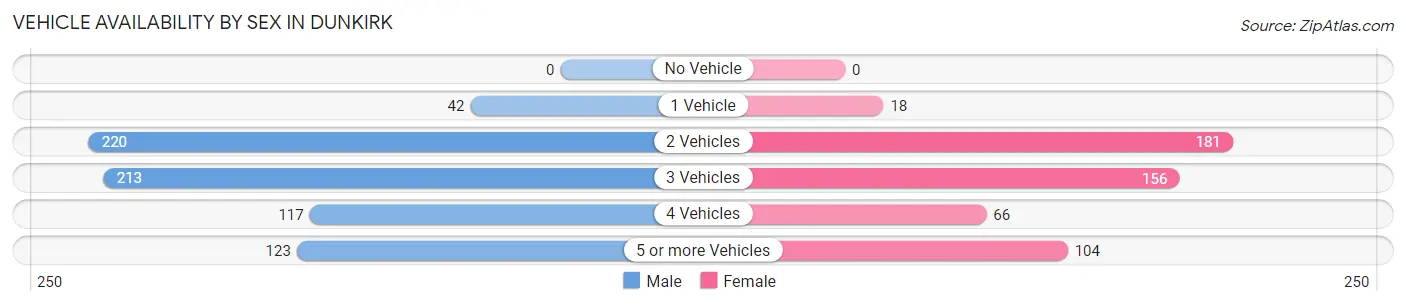
| Vehicles Available | Male | Female |
| No Vehicle | 0 (0.0%) | 0 (0.0%) |
| 1 Vehicle | 42 (5.9%) | 18 (3.4%) |
| 2 Vehicles | 220 (30.8%) | 181 (34.5%) |
| 3 Vehicles | 213 (29.8%) | 156 (29.7%) |
| 4 Vehicles | 117 (16.4%) | 66 (12.6%) |
| 5 or more Vehicles | 123 (17.2%) | 104 (19.8%) |
| Total | 715 (100.0%) | 525 (100.0%) |
Commute Time in Dunkirk
The most frequently occuring commute durations in Dunkirk are 45 to 59 minutes (223 commuters, 20.6%), 60 to 89 minutes (189 commuters, 17.4%), and 20 to 24 minutes (128 commuters, 11.8%).
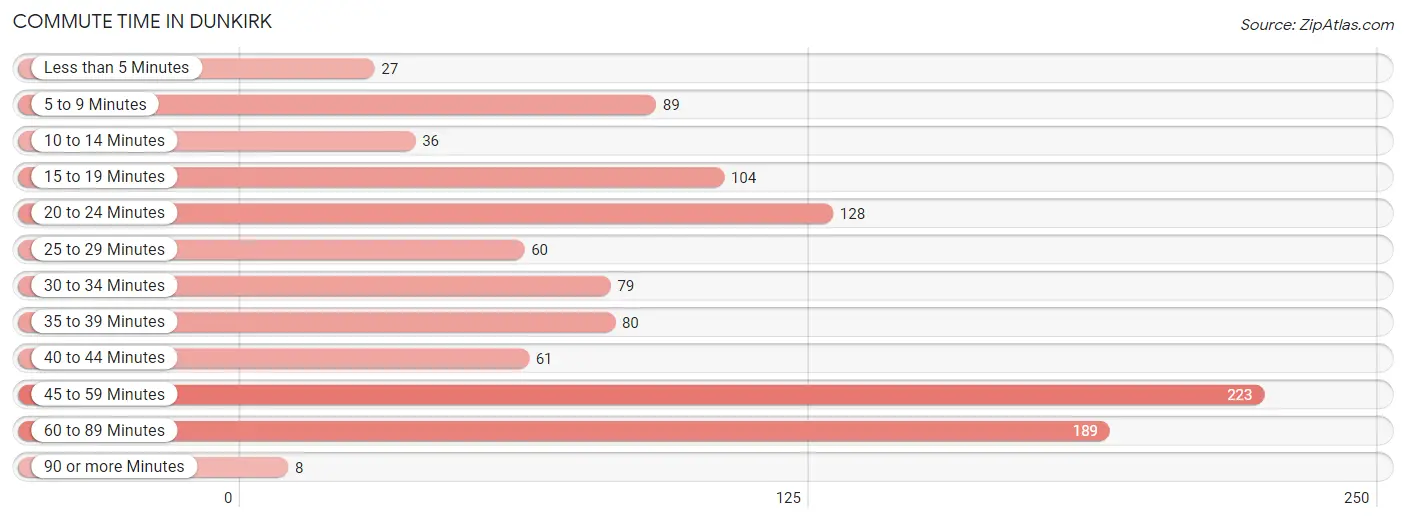
| Commute Time | # Commuters | % Commuters |
| Less than 5 Minutes | 27 | 2.5% |
| 5 to 9 Minutes | 89 | 8.2% |
| 10 to 14 Minutes | 36 | 3.3% |
| 15 to 19 Minutes | 104 | 9.6% |
| 20 to 24 Minutes | 128 | 11.8% |
| 25 to 29 Minutes | 60 | 5.5% |
| 30 to 34 Minutes | 79 | 7.3% |
| 35 to 39 Minutes | 80 | 7.4% |
| 40 to 44 Minutes | 61 | 5.6% |
| 45 to 59 Minutes | 223 | 20.6% |
| 60 to 89 Minutes | 189 | 17.4% |
| 90 or more Minutes | 8 | 0.7% |
Commute Time by Sex in Dunkirk
The most common commute times in Dunkirk are 45 to 59 minutes (155 commuters, 24.2%) for males and 15 to 19 minutes (77 commuters, 17.4%) for females.
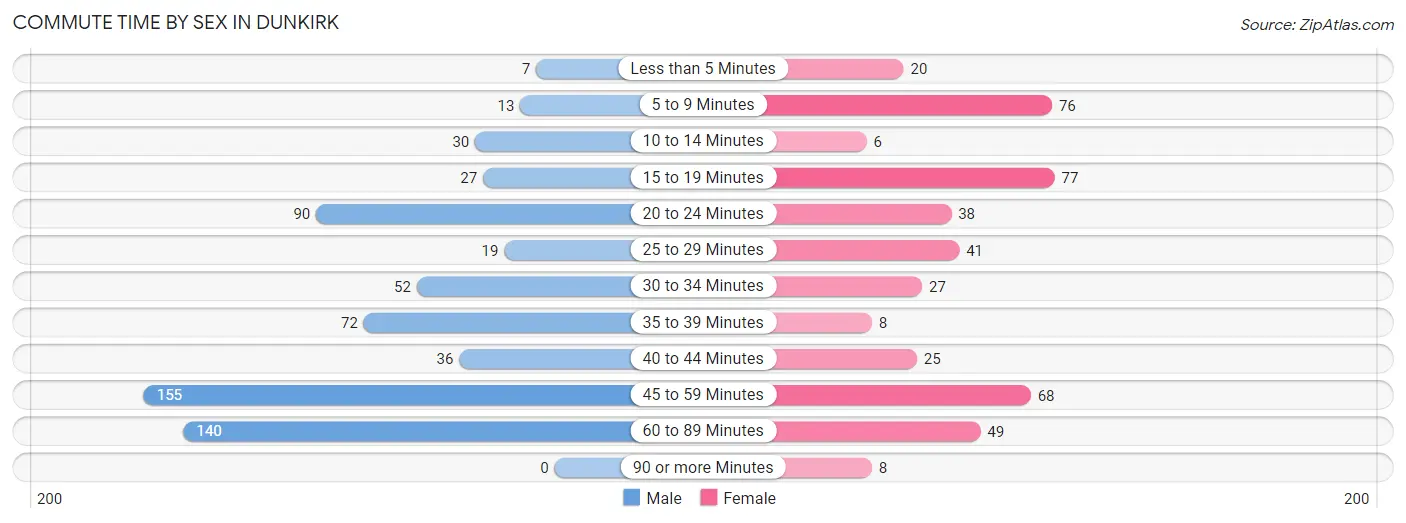
| Commute Time | Male | Female |
| Less than 5 Minutes | 7 (1.1%) | 20 (4.5%) |
| 5 to 9 Minutes | 13 (2.0%) | 76 (17.2%) |
| 10 to 14 Minutes | 30 (4.7%) | 6 (1.3%) |
| 15 to 19 Minutes | 27 (4.2%) | 77 (17.4%) |
| 20 to 24 Minutes | 90 (14.0%) | 38 (8.6%) |
| 25 to 29 Minutes | 19 (3.0%) | 41 (9.3%) |
| 30 to 34 Minutes | 52 (8.1%) | 27 (6.1%) |
| 35 to 39 Minutes | 72 (11.2%) | 8 (1.8%) |
| 40 to 44 Minutes | 36 (5.6%) | 25 (5.6%) |
| 45 to 59 Minutes | 155 (24.2%) | 68 (15.3%) |
| 60 to 89 Minutes | 140 (21.8%) | 49 (11.1%) |
| 90 or more Minutes | 0 (0.0%) | 8 (1.8%) |
Time of Departure to Work by Sex in Dunkirk
The most frequent times of departure to work in Dunkirk are 5:00 AM to 5:29 AM (118, 18.4%) for males and 7:00 AM to 7:29 AM (101, 22.8%) for females.
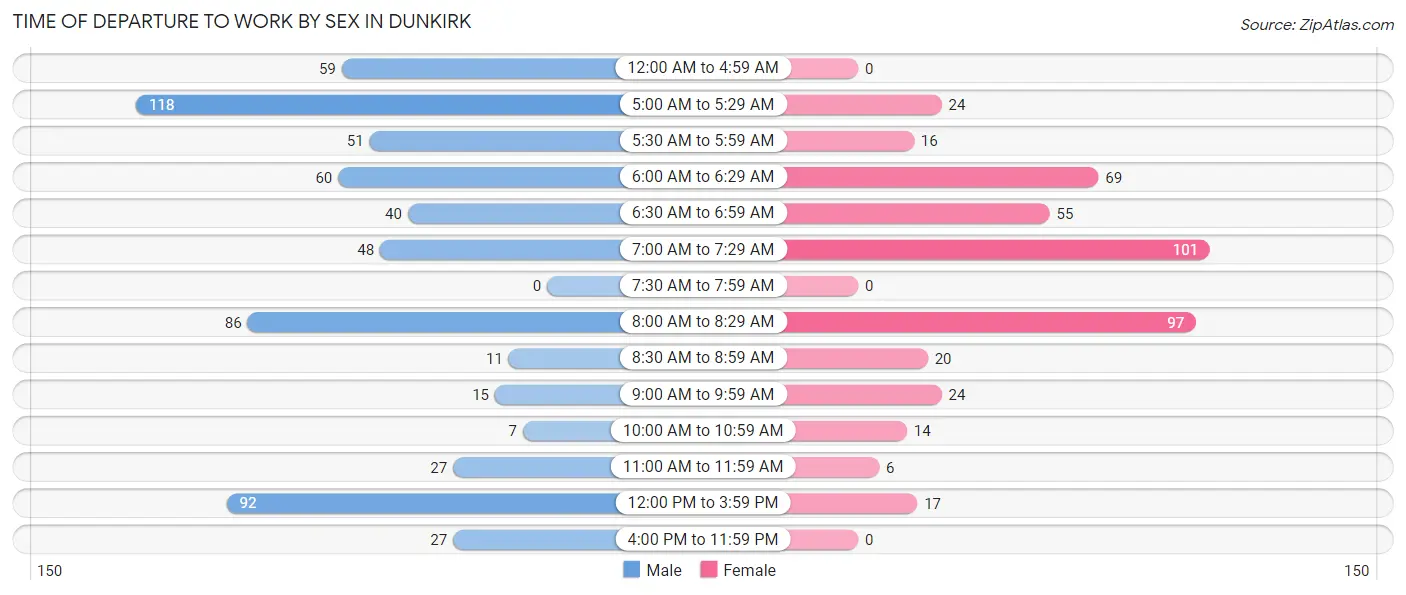
| Time of Departure | Male | Female |
| 12:00 AM to 4:59 AM | 59 (9.2%) | 0 (0.0%) |
| 5:00 AM to 5:29 AM | 118 (18.4%) | 24 (5.4%) |
| 5:30 AM to 5:59 AM | 51 (8.0%) | 16 (3.6%) |
| 6:00 AM to 6:29 AM | 60 (9.4%) | 69 (15.6%) |
| 6:30 AM to 6:59 AM | 40 (6.2%) | 55 (12.4%) |
| 7:00 AM to 7:29 AM | 48 (7.5%) | 101 (22.8%) |
| 7:30 AM to 7:59 AM | 0 (0.0%) | 0 (0.0%) |
| 8:00 AM to 8:29 AM | 86 (13.4%) | 97 (21.9%) |
| 8:30 AM to 8:59 AM | 11 (1.7%) | 20 (4.5%) |
| 9:00 AM to 9:59 AM | 15 (2.3%) | 24 (5.4%) |
| 10:00 AM to 10:59 AM | 7 (1.1%) | 14 (3.2%) |
| 11:00 AM to 11:59 AM | 27 (4.2%) | 6 (1.3%) |
| 12:00 PM to 3:59 PM | 92 (14.3%) | 17 (3.8%) |
| 4:00 PM to 11:59 PM | 27 (4.2%) | 0 (0.0%) |
| Total | 641 (100.0%) | 443 (100.0%) |
Housing Occupancy in Dunkirk
Occupancy by Ownership in Dunkirk
Of the total 776 dwellings in Dunkirk, owner-occupied units account for 753 (97.0%), while renter-occupied units make up 23 (3.0%).
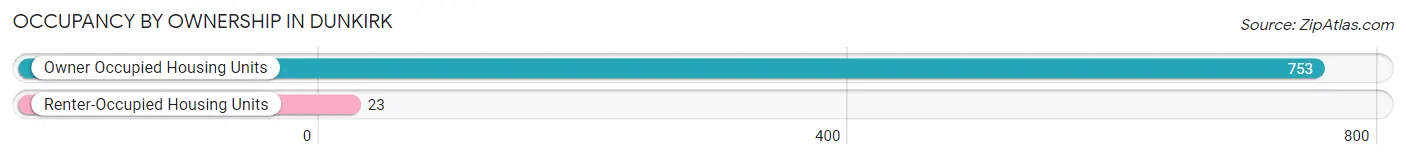
| Occupancy | # Housing Units | % Housing Units |
| Owner Occupied Housing Units | 753 | 97.0% |
| Renter-Occupied Housing Units | 23 | 3.0% |
| Total Occupied Housing Units | 776 | 100.0% |
Occupancy by Household Size in Dunkirk
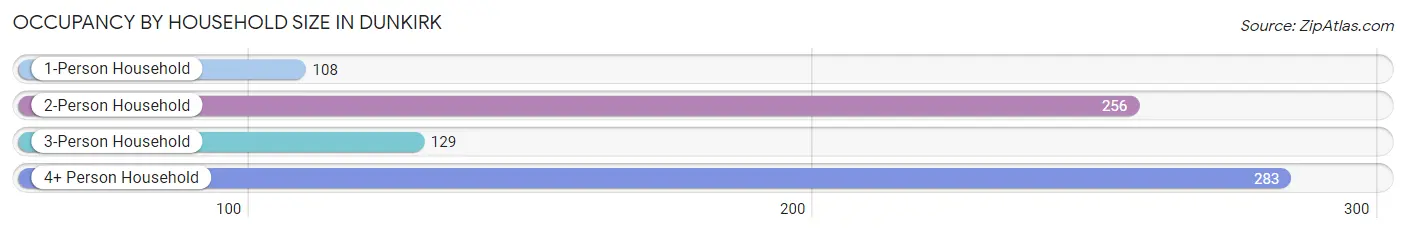
| Household Size | # Housing Units | % Housing Units |
| 1-Person Household | 108 | 13.9% |
| 2-Person Household | 256 | 33.0% |
| 3-Person Household | 129 | 16.6% |
| 4+ Person Household | 283 | 36.5% |
| Total Housing Units | 776 | 100.0% |
Occupancy by Ownership by Household Size in Dunkirk
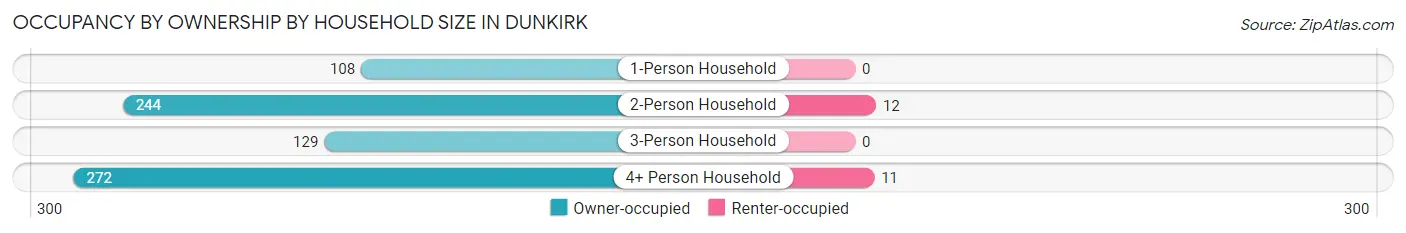
| Household Size | Owner-occupied | Renter-occupied |
| 1-Person Household | 108 (100.0%) | 0 (0.0%) |
| 2-Person Household | 244 (95.3%) | 12 (4.7%) |
| 3-Person Household | 129 (100.0%) | 0 (0.0%) |
| 4+ Person Household | 272 (96.1%) | 11 (3.9%) |
| Total Housing Units | 753 (97.0%) | 23 (3.0%) |
Occupancy by Educational Attainment in Dunkirk
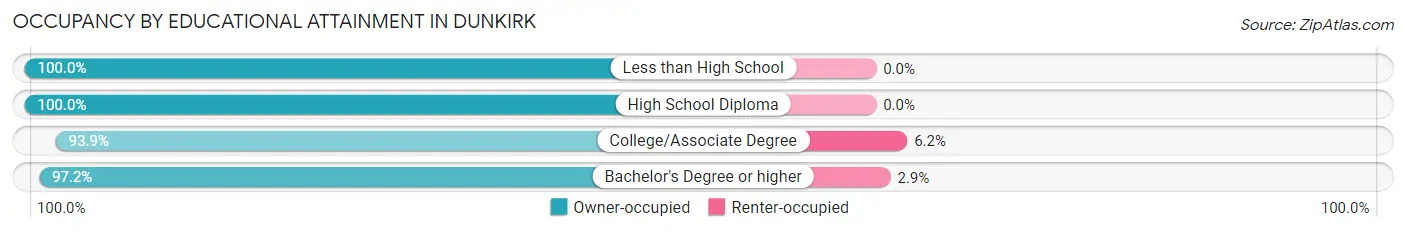
| Household Size | Owner-occupied | Renter-occupied |
| Less than High School | 13 (100.0%) | 0 (0.0%) |
| High School Diploma | 182 (100.0%) | 0 (0.0%) |
| College/Associate Degree | 183 (93.9%) | 12 (6.1%) |
| Bachelor's Degree or higher | 375 (97.2%) | 11 (2.9%) |
Occupancy by Age of Householder in Dunkirk
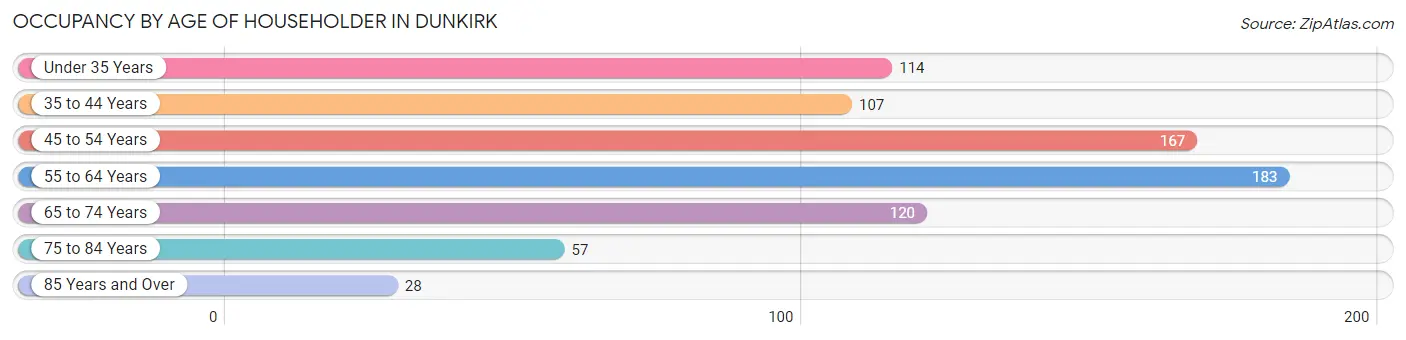
| Age Bracket | # Households | % Households |
| Under 35 Years | 114 | 14.7% |
| 35 to 44 Years | 107 | 13.8% |
| 45 to 54 Years | 167 | 21.5% |
| 55 to 64 Years | 183 | 23.6% |
| 65 to 74 Years | 120 | 15.5% |
| 75 to 84 Years | 57 | 7.3% |
| 85 Years and Over | 28 | 3.6% |
| Total | 776 | 100.0% |
Housing Finances in Dunkirk
Median Income by Occupancy in Dunkirk
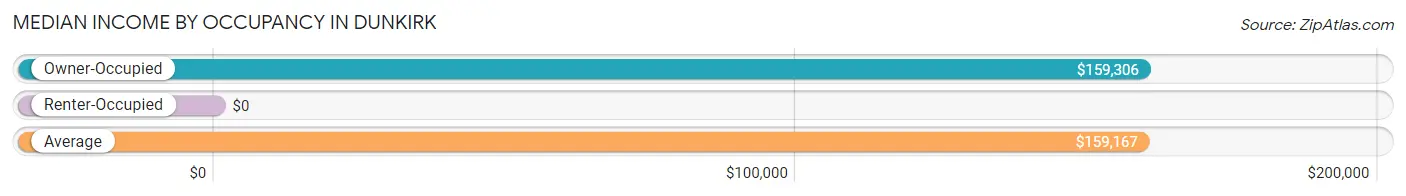
| Occupancy Type | # Households | Median Income |
| Owner-Occupied | 753 (97.0%) | $159,306 |
| Renter-Occupied | 23 (3.0%) | $0 |
| Average | 776 (100.0%) | $159,167 |
Occupancy by Householder Income Bracket in Dunkirk
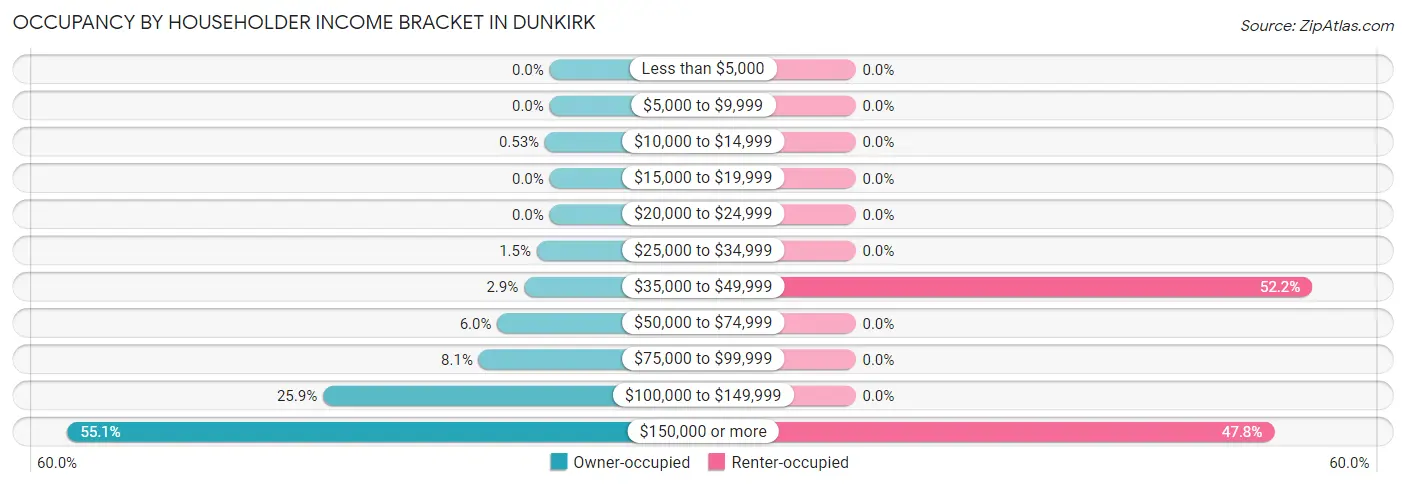
| Income Bracket | Owner-occupied | Renter-occupied |
| Less than $5,000 | 0 (0.0%) | 0 (0.0%) |
| $5,000 to $9,999 | 0 (0.0%) | 0 (0.0%) |
| $10,000 to $14,999 | 4 (0.5%) | 0 (0.0%) |
| $15,000 to $19,999 | 0 (0.0%) | 0 (0.0%) |
| $20,000 to $24,999 | 0 (0.0%) | 0 (0.0%) |
| $25,000 to $34,999 | 11 (1.5%) | 0 (0.0%) |
| $35,000 to $49,999 | 22 (2.9%) | 12 (52.2%) |
| $50,000 to $74,999 | 45 (6.0%) | 0 (0.0%) |
| $75,000 to $99,999 | 61 (8.1%) | 0 (0.0%) |
| $100,000 to $149,999 | 195 (25.9%) | 0 (0.0%) |
| $150,000 or more | 415 (55.1%) | 11 (47.8%) |
| Total | 753 (100.0%) | 23 (100.0%) |
Monthly Housing Cost Tiers in Dunkirk
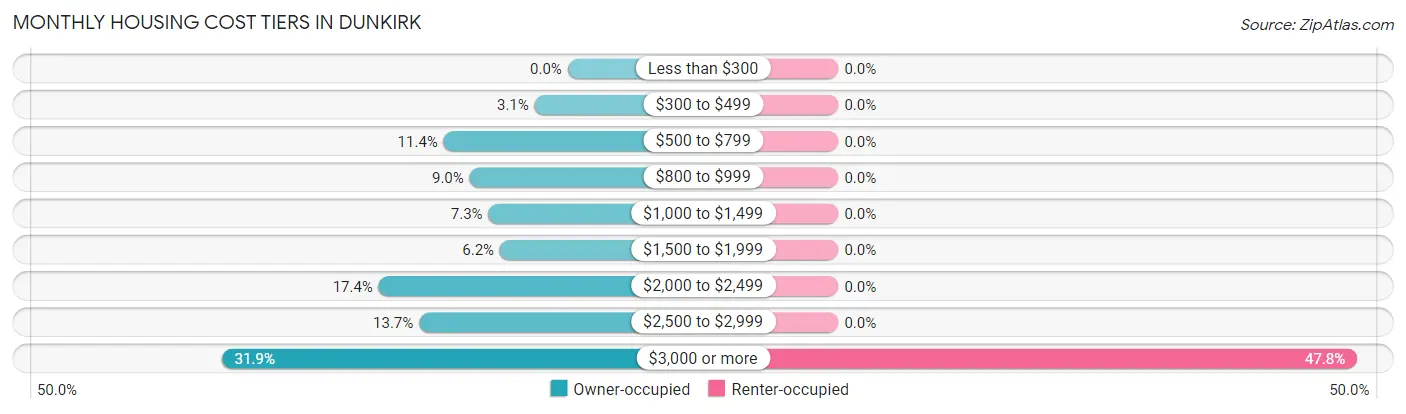
| Monthly Cost | Owner-occupied | Renter-occupied |
| Less than $300 | 0 (0.0%) | 0 (0.0%) |
| $300 to $499 | 23 (3.0%) | 0 (0.0%) |
| $500 to $799 | 86 (11.4%) | 0 (0.0%) |
| $800 to $999 | 68 (9.0%) | 0 (0.0%) |
| $1,000 to $1,499 | 55 (7.3%) | 0 (0.0%) |
| $1,500 to $1,999 | 47 (6.2%) | 0 (0.0%) |
| $2,000 to $2,499 | 131 (17.4%) | 0 (0.0%) |
| $2,500 to $2,999 | 103 (13.7%) | 0 (0.0%) |
| $3,000 or more | 240 (31.9%) | 11 (47.8%) |
| Total | 753 (100.0%) | 23 (100.0%) |
Physical Housing Characteristics in Dunkirk
Housing Structures in Dunkirk
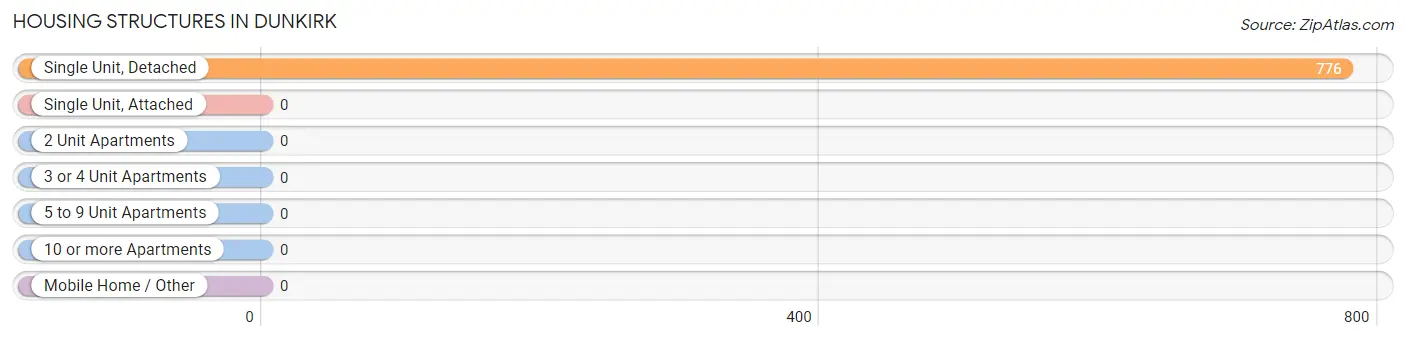
| Structure Type | # Housing Units | % Housing Units |
| Single Unit, Detached | 776 | 100.0% |
| Single Unit, Attached | 0 | 0.0% |
| 2 Unit Apartments | 0 | 0.0% |
| 3 or 4 Unit Apartments | 0 | 0.0% |
| 5 to 9 Unit Apartments | 0 | 0.0% |
| 10 or more Apartments | 0 | 0.0% |
| Mobile Home / Other | 0 | 0.0% |
| Total | 776 | 100.0% |
Housing Structures by Occupancy in Dunkirk
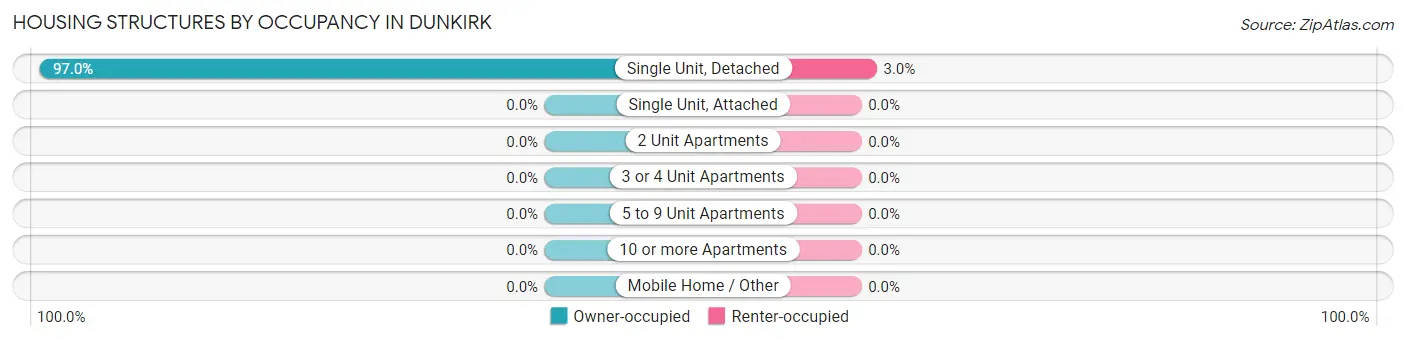
| Structure Type | Owner-occupied | Renter-occupied |
| Single Unit, Detached | 753 (97.0%) | 23 (3.0%) |
| Single Unit, Attached | 0 (0.0%) | 0 (0.0%) |
| 2 Unit Apartments | 0 (0.0%) | 0 (0.0%) |
| 3 or 4 Unit Apartments | 0 (0.0%) | 0 (0.0%) |
| 5 to 9 Unit Apartments | 0 (0.0%) | 0 (0.0%) |
| 10 or more Apartments | 0 (0.0%) | 0 (0.0%) |
| Mobile Home / Other | 0 (0.0%) | 0 (0.0%) |
| Total | 753 (97.0%) | 23 (3.0%) |
Housing Structures by Number of Rooms in Dunkirk
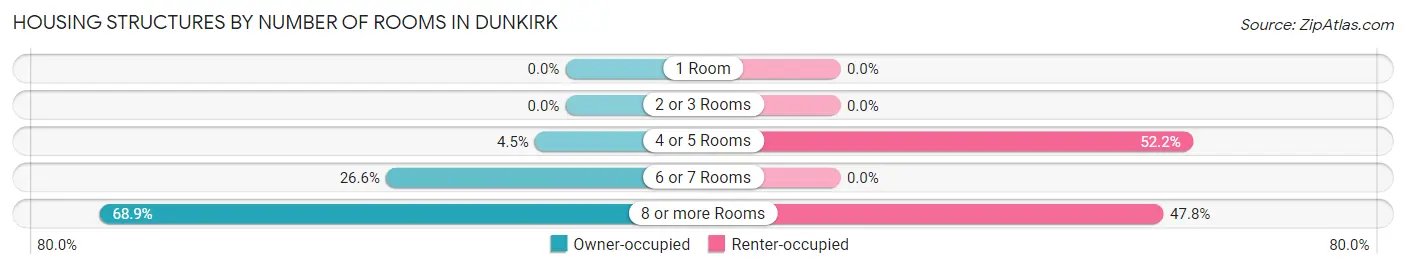
| Number of Rooms | Owner-occupied | Renter-occupied |
| 1 Room | 0 (0.0%) | 0 (0.0%) |
| 2 or 3 Rooms | 0 (0.0%) | 0 (0.0%) |
| 4 or 5 Rooms | 34 (4.5%) | 12 (52.2%) |
| 6 or 7 Rooms | 200 (26.6%) | 0 (0.0%) |
| 8 or more Rooms | 519 (68.9%) | 11 (47.8%) |
| Total | 753 (100.0%) | 23 (100.0%) |
Housing Structure by Heating Type in Dunkirk
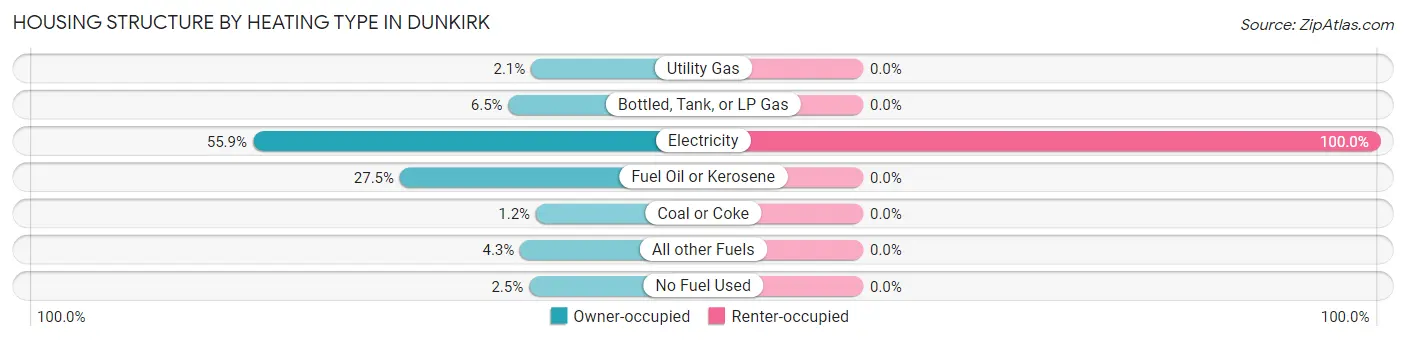
| Heating Type | Owner-occupied | Renter-occupied |
| Utility Gas | 16 (2.1%) | 0 (0.0%) |
| Bottled, Tank, or LP Gas | 49 (6.5%) | 0 (0.0%) |
| Electricity | 421 (55.9%) | 23 (100.0%) |
| Fuel Oil or Kerosene | 207 (27.5%) | 0 (0.0%) |
| Coal or Coke | 9 (1.2%) | 0 (0.0%) |
| All other Fuels | 32 (4.3%) | 0 (0.0%) |
| No Fuel Used | 19 (2.5%) | 0 (0.0%) |
| Total | 753 (100.0%) | 23 (100.0%) |
Household Vehicle Usage in Dunkirk
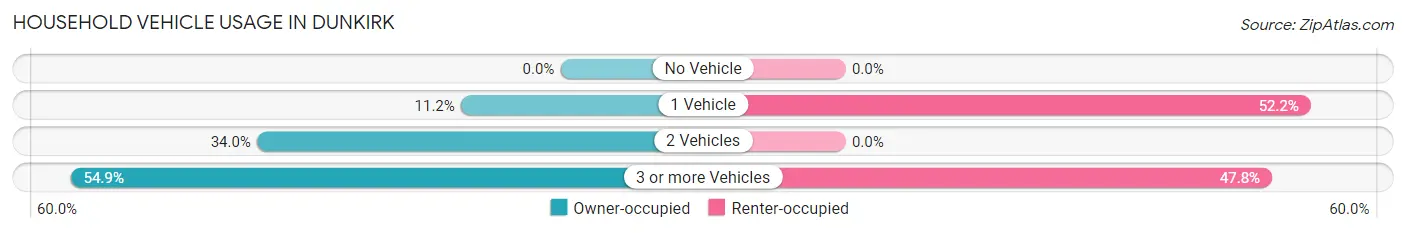
| Vehicles per Household | Owner-occupied | Renter-occupied |
| No Vehicle | 0 (0.0%) | 0 (0.0%) |
| 1 Vehicle | 84 (11.2%) | 12 (52.2%) |
| 2 Vehicles | 256 (34.0%) | 0 (0.0%) |
| 3 or more Vehicles | 413 (54.8%) | 11 (47.8%) |
| Total | 753 (100.0%) | 23 (100.0%) |
Real Estate & Mortgages in Dunkirk
Real Estate and Mortgage Overview in Dunkirk
| Characteristic | Without Mortgage | With Mortgage |
| Housing Units | 182 | 571 |
| Median Property Value | $429,100 | $584,800 |
| Median Household Income | $81,786 | $387 |
| Monthly Housing Costs | $714 | $240 |
| Real Estate Taxes | $4,385 | $0 |
Property Value by Mortgage Status in Dunkirk
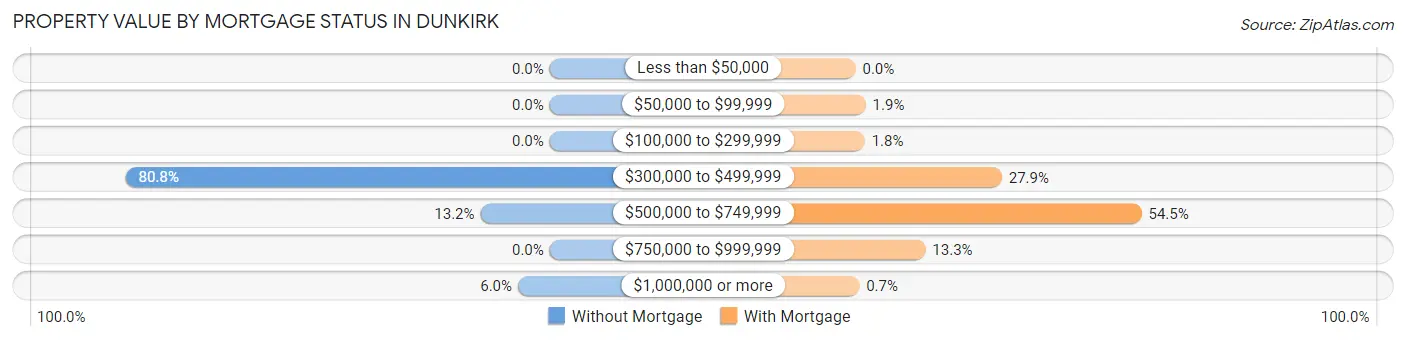
| Property Value | Without Mortgage | With Mortgage |
| Less than $50,000 | 0 (0.0%) | 0 (0.0%) |
| $50,000 to $99,999 | 0 (0.0%) | 11 (1.9%) |
| $100,000 to $299,999 | 0 (0.0%) | 10 (1.8%) |
| $300,000 to $499,999 | 147 (80.8%) | 159 (27.9%) |
| $500,000 to $749,999 | 24 (13.2%) | 311 (54.5%) |
| $750,000 to $999,999 | 0 (0.0%) | 76 (13.3%) |
| $1,000,000 or more | 11 (6.0%) | 4 (0.7%) |
| Total | 182 (100.0%) | 571 (100.0%) |
Household Income by Mortgage Status in Dunkirk
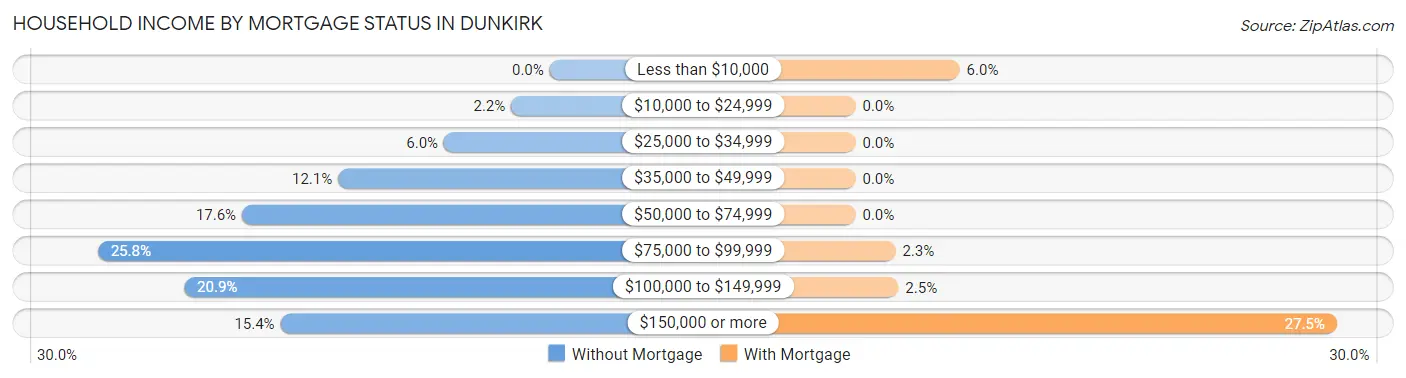
| Household Income | Without Mortgage | With Mortgage |
| Less than $10,000 | 0 (0.0%) | 34 (5.9%) |
| $10,000 to $24,999 | 4 (2.2%) | 0 (0.0%) |
| $25,000 to $34,999 | 11 (6.0%) | 0 (0.0%) |
| $35,000 to $49,999 | 22 (12.1%) | 0 (0.0%) |
| $50,000 to $74,999 | 32 (17.6%) | 0 (0.0%) |
| $75,000 to $99,999 | 47 (25.8%) | 13 (2.3%) |
| $100,000 to $149,999 | 38 (20.9%) | 14 (2.5%) |
| $150,000 or more | 28 (15.4%) | 157 (27.5%) |
| Total | 182 (100.0%) | 571 (100.0%) |
Property Value to Household Income Ratio in Dunkirk
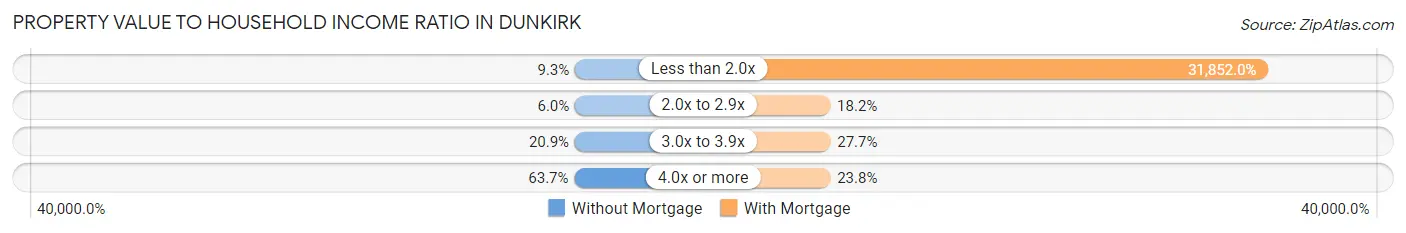
| Value-to-Income Ratio | Without Mortgage | With Mortgage |
| Less than 2.0x | 17 (9.3%) | 181,875 (31,852.0%) |
| 2.0x to 2.9x | 11 (6.0%) | 104 (18.2%) |
| 3.0x to 3.9x | 38 (20.9%) | 158 (27.7%) |
| 4.0x or more | 116 (63.7%) | 136 (23.8%) |
| Total | 182 (100.0%) | 571 (100.0%) |
Real Estate Taxes by Mortgage Status in Dunkirk
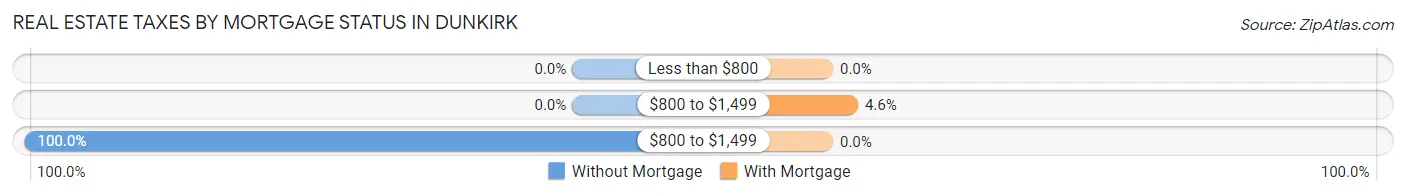
| Property Taxes | Without Mortgage | With Mortgage |
| Less than $800 | 0 (0.0%) | 0 (0.0%) |
| $800 to $1,499 | 0 (0.0%) | 26 (4.5%) |
| $800 to $1,499 | 182 (100.0%) | 0 (0.0%) |
| Total | 182 (100.0%) | 571 (100.0%) |
Health & Disability in Dunkirk
Health Insurance Coverage by Age in Dunkirk
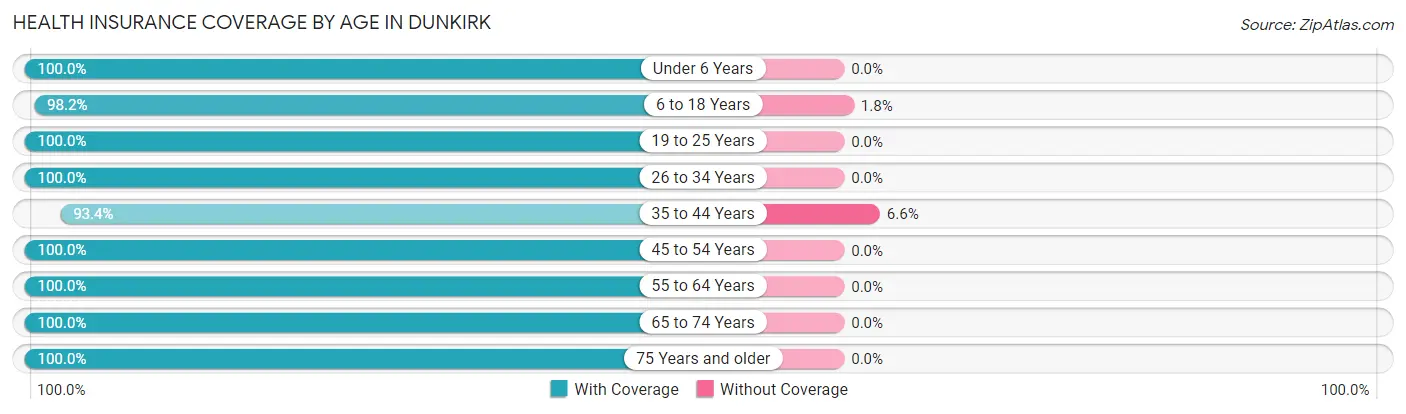
| Age Bracket | With Coverage | Without Coverage |
| Under 6 Years | 96 (100.0%) | 0 (0.0%) |
| 6 to 18 Years | 438 (98.2%) | 8 (1.8%) |
| 19 to 25 Years | 154 (100.0%) | 0 (0.0%) |
| 26 to 34 Years | 208 (100.0%) | 0 (0.0%) |
| 35 to 44 Years | 267 (93.4%) | 19 (6.6%) |
| 45 to 54 Years | 324 (100.0%) | 0 (0.0%) |
| 55 to 64 Years | 363 (100.0%) | 0 (0.0%) |
| 65 to 74 Years | 226 (100.0%) | 0 (0.0%) |
| 75 Years and older | 132 (100.0%) | 0 (0.0%) |
| Total | 2,208 (98.8%) | 27 (1.2%) |
Health Insurance Coverage by Citizenship Status in Dunkirk
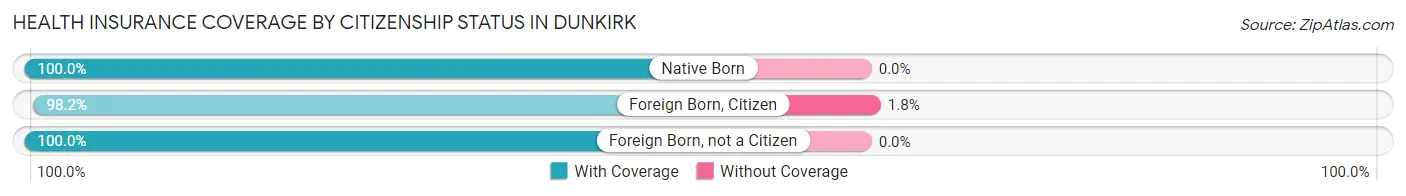
| Citizenship Status | With Coverage | Without Coverage |
| Native Born | 96 (100.0%) | 0 (0.0%) |
| Foreign Born, Citizen | 438 (98.2%) | 8 (1.8%) |
| Foreign Born, not a Citizen | 154 (100.0%) | 0 (0.0%) |
Health Insurance Coverage by Household Income in Dunkirk
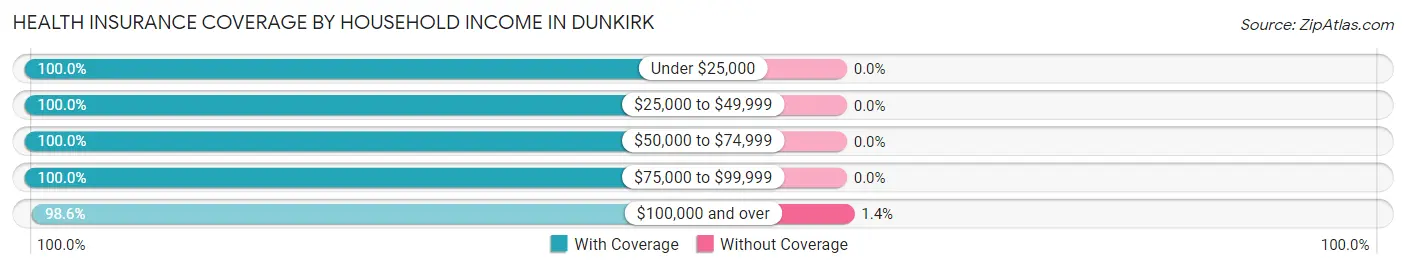
| Household Income | With Coverage | Without Coverage |
| Under $25,000 | 4 (100.0%) | 0 (0.0%) |
| $25,000 to $49,999 | 71 (100.0%) | 0 (0.0%) |
| $50,000 to $74,999 | 67 (100.0%) | 0 (0.0%) |
| $75,000 to $99,999 | 176 (100.0%) | 0 (0.0%) |
| $100,000 and over | 1,890 (98.6%) | 27 (1.4%) |
Public vs Private Health Insurance Coverage by Age in Dunkirk
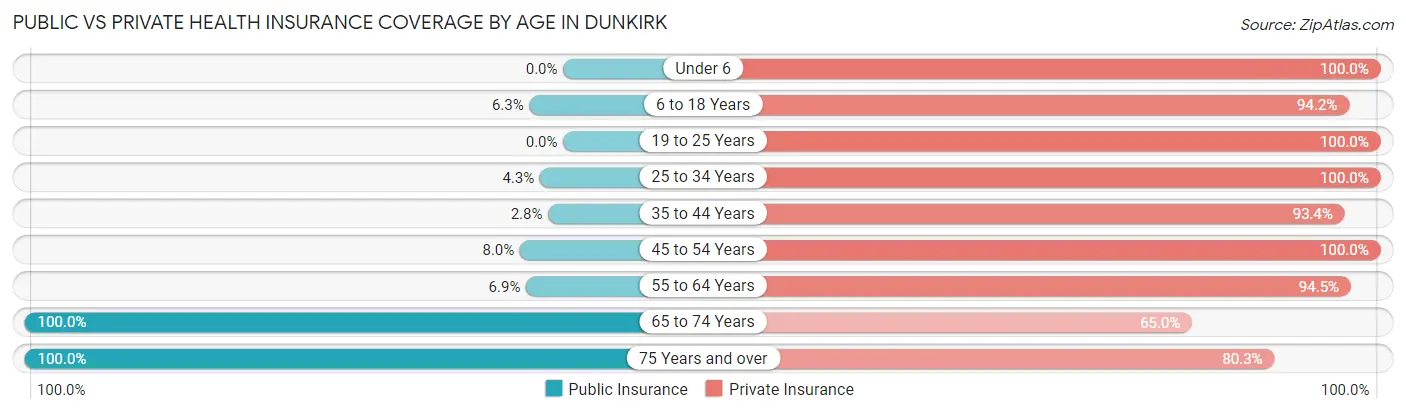
| Age Bracket | Public Insurance | Private Insurance |
| Under 6 | 0 (0.0%) | 96 (100.0%) |
| 6 to 18 Years | 28 (6.3%) | 420 (94.2%) |
| 19 to 25 Years | 0 (0.0%) | 154 (100.0%) |
| 25 to 34 Years | 9 (4.3%) | 208 (100.0%) |
| 35 to 44 Years | 8 (2.8%) | 267 (93.4%) |
| 45 to 54 Years | 26 (8.0%) | 324 (100.0%) |
| 55 to 64 Years | 25 (6.9%) | 343 (94.5%) |
| 65 to 74 Years | 226 (100.0%) | 147 (65.0%) |
| 75 Years and over | 132 (100.0%) | 106 (80.3%) |
| Total | 454 (20.3%) | 2,065 (92.4%) |
Disability Status by Sex by Age in Dunkirk
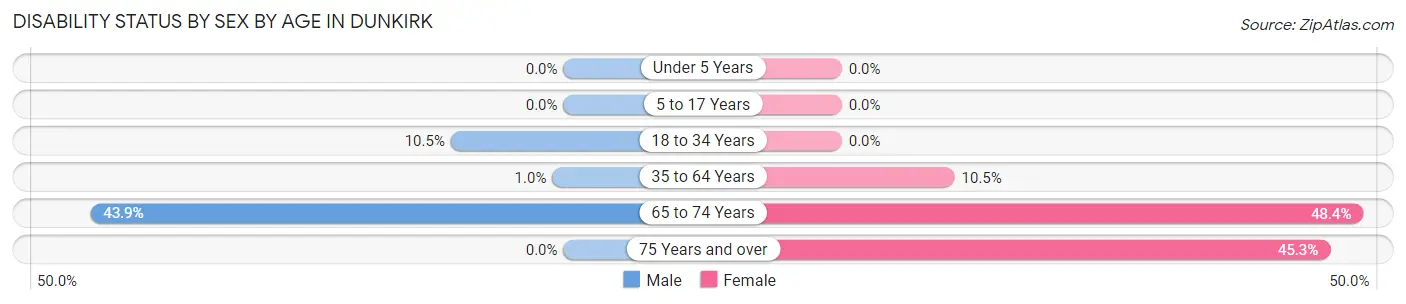
| Age Bracket | Male | Female |
| Under 5 Years | 0 (0.0%) | 0 (0.0%) |
| 5 to 17 Years | 0 (0.0%) | 0 (0.0%) |
| 18 to 34 Years | 30 (10.4%) | 0 (0.0%) |
| 35 to 64 Years | 5 (1.0%) | 51 (10.5%) |
| 65 to 74 Years | 72 (43.9%) | 30 (48.4%) |
| 75 Years and over | 0 (0.0%) | 29 (45.3%) |
Disability Class by Sex by Age in Dunkirk
Disability Class: Hearing Difficulty
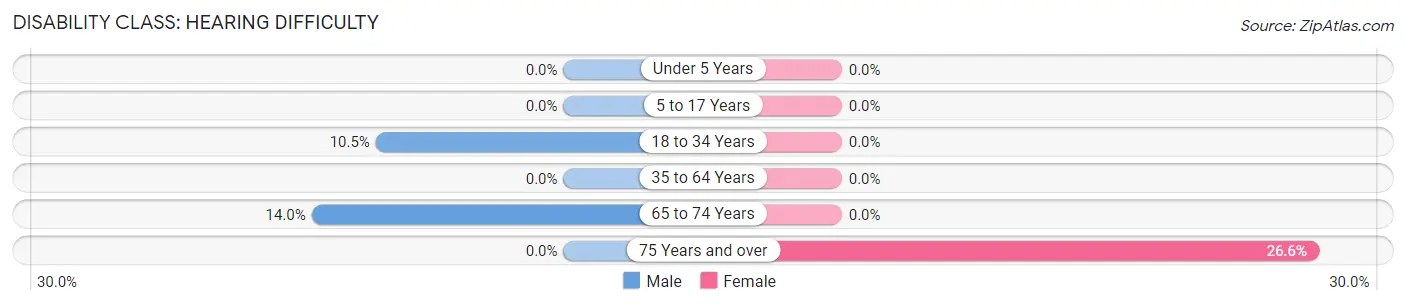
| Age Bracket | Male | Female |
| Under 5 Years | 0 (0.0%) | 0 (0.0%) |
| 5 to 17 Years | 0 (0.0%) | 0 (0.0%) |
| 18 to 34 Years | 30 (10.4%) | 0 (0.0%) |
| 35 to 64 Years | 0 (0.0%) | 0 (0.0%) |
| 65 to 74 Years | 23 (14.0%) | 0 (0.0%) |
| 75 Years and over | 0 (0.0%) | 17 (26.6%) |
Disability Class: Vision Difficulty
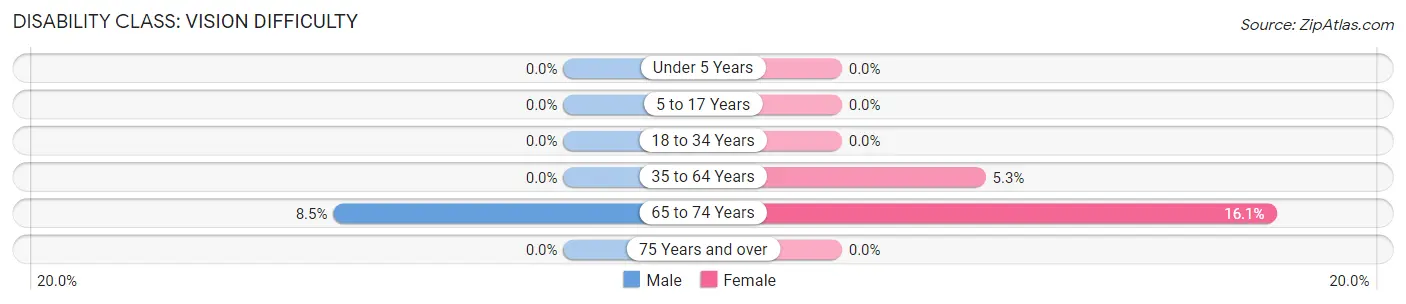
| Age Bracket | Male | Female |
| Under 5 Years | 0 (0.0%) | 0 (0.0%) |
| 5 to 17 Years | 0 (0.0%) | 0 (0.0%) |
| 18 to 34 Years | 0 (0.0%) | 0 (0.0%) |
| 35 to 64 Years | 0 (0.0%) | 26 (5.3%) |
| 65 to 74 Years | 14 (8.5%) | 10 (16.1%) |
| 75 Years and over | 0 (0.0%) | 0 (0.0%) |
Disability Class: Cognitive Difficulty
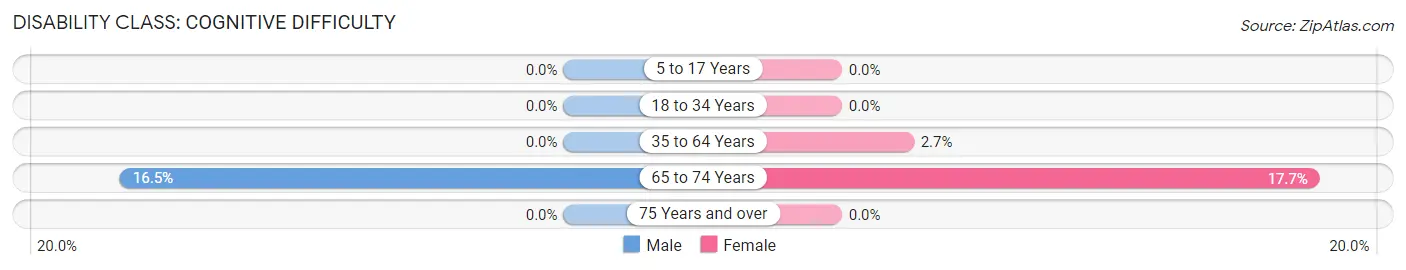
| Age Bracket | Male | Female |
| 5 to 17 Years | 0 (0.0%) | 0 (0.0%) |
| 18 to 34 Years | 0 (0.0%) | 0 (0.0%) |
| 35 to 64 Years | 0 (0.0%) | 13 (2.7%) |
| 65 to 74 Years | 27 (16.5%) | 11 (17.7%) |
| 75 Years and over | 0 (0.0%) | 0 (0.0%) |
Disability Class: Ambulatory Difficulty
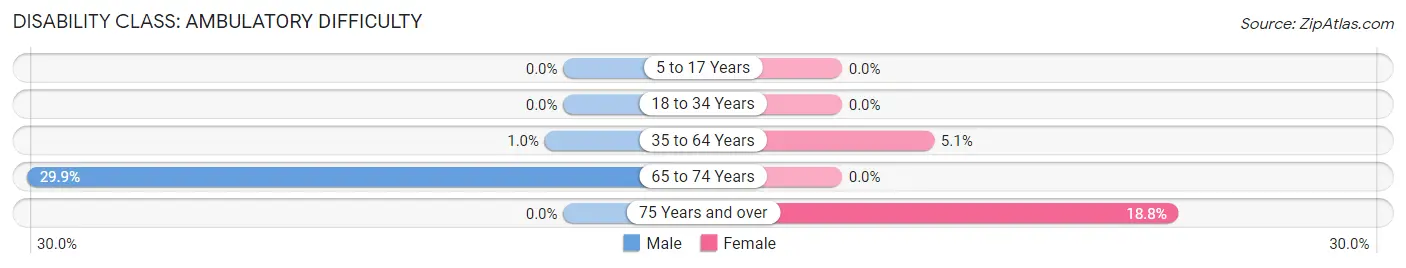
| Age Bracket | Male | Female |
| 5 to 17 Years | 0 (0.0%) | 0 (0.0%) |
| 18 to 34 Years | 0 (0.0%) | 0 (0.0%) |
| 35 to 64 Years | 5 (1.0%) | 25 (5.1%) |
| 65 to 74 Years | 49 (29.9%) | 0 (0.0%) |
| 75 Years and over | 0 (0.0%) | 12 (18.8%) |
Disability Class: Self-Care Difficulty
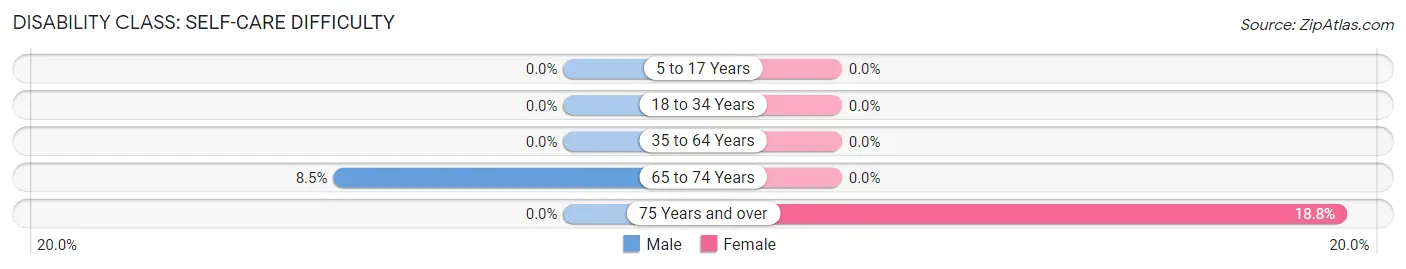
| Age Bracket | Male | Female |
| 5 to 17 Years | 0 (0.0%) | 0 (0.0%) |
| 18 to 34 Years | 0 (0.0%) | 0 (0.0%) |
| 35 to 64 Years | 0 (0.0%) | 0 (0.0%) |
| 65 to 74 Years | 14 (8.5%) | 0 (0.0%) |
| 75 Years and over | 0 (0.0%) | 12 (18.8%) |
Technology Access in Dunkirk
Computing Device Access in Dunkirk
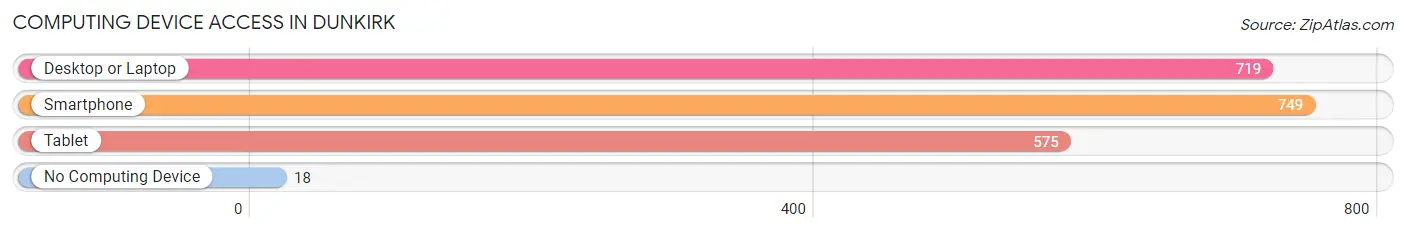
| Device Type | # Households | % Households |
| Desktop or Laptop | 719 | 92.6% |
| Smartphone | 749 | 96.5% |
| Tablet | 575 | 74.1% |
| No Computing Device | 18 | 2.3% |
| Total | 776 | 100.0% |
Internet Access in Dunkirk
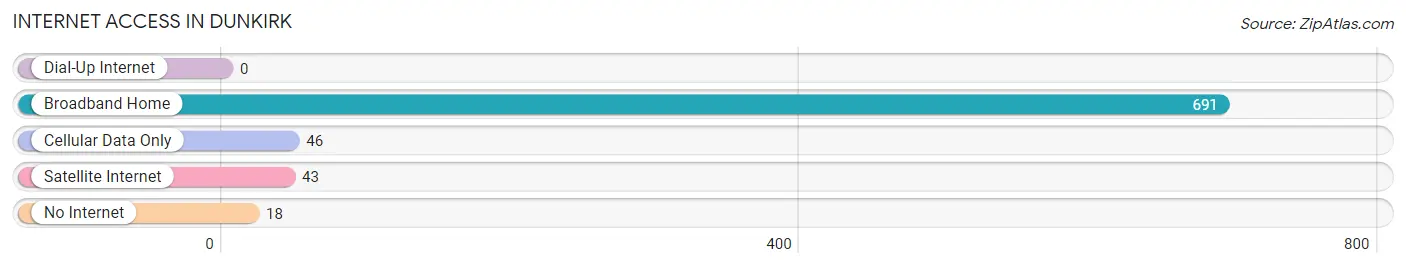
| Internet Type | # Households | % Households |
| Dial-Up Internet | 0 | 0.0% |
| Broadband Home | 691 | 89.0% |
| Cellular Data Only | 46 | 5.9% |
| Satellite Internet | 43 | 5.5% |
| No Internet | 18 | 2.3% |
| Total | 776 | 100.0% |
Dunkirk Summary
Dunkirk is a small town located in Calvert County, Maryland, United States. It is situated on the western shore of the Chesapeake Bay, approximately 25 miles south of Washington, D.C. The town has a population of approximately 4,000 people and is part of the Washington-Arlington-Alexandria metropolitan area.
History
The area that is now Dunkirk was first settled in the early 1700s by English colonists. The town was originally known as “Dunkirk” after the town of Dunkirk in France. The town was officially incorporated in 1883.
In the late 1800s, Dunkirk was a popular summer resort for wealthy Washingtonians. The town was home to several large hotels, including the Hotel Dunkirk and the Hotel Calvert. The town also had a large amusement park, known as the Dunkirk Amusement Park.
In the early 1900s, the town began to decline in popularity as a resort destination. The amusement park closed in the 1920s and the hotels were eventually demolished.
Geography
Dunkirk is located in Calvert County, Maryland, on the western shore of the Chesapeake Bay. The town is situated on a peninsula, with the Chesapeake Bay to the east and the Patuxent River to the west. The town is bordered by the towns of Huntingtown to the north, Chesapeake Beach to the south, and North Beach to the west.
The town has a total area of 2.2 square miles, all of which is land. The town is located at an elevation of 10 feet above sea level.
Economy
The economy of Dunkirk is largely based on tourism and the service industry. The town is home to several restaurants, bars, and shops. The town also has a marina, which provides boat rentals and other services.
The town is also home to several small businesses, including a grocery store, a hardware store, and a pharmacy.
Demographics
As of the 2010 census, the population of Dunkirk was 4,039. The racial makeup of the town was 87.3% White, 8.2% African American, 0.7% Asian, 0.3% Native American, 0.1% Pacific Islander, and 2.4% from other races. Hispanic or Latino of any race were 3.2% of the population.
The median household income in Dunkirk was $68,750, and the median family income was $76,250. The per capita income for the town was $30,945. About 5.2% of families and 6.7% of the population were below the poverty line, including 8.2% of those under age 18 and 5.2% of those age 65 or over.
The town is served by the Calvert County Public Schools system. The town is home to one elementary school, one middle school, and one high school.
Common Questions
What is Per Capita Income in Dunkirk?
Per Capita income in Dunkirk is $64,176.
What is the Median Family Income in Dunkirk?
Median Family Income in Dunkirk is $180,708.
What is the Median Household income in Dunkirk?
Median Household Income in Dunkirk is $159,167.
What is Income or Wage Gap in Dunkirk?
Income or Wage Gap in Dunkirk is 7.2%.
Women in Dunkirk earn 92.8 cents for every dollar earned by a man.
What is Inequality or Gini Index in Dunkirk?
Inequality or Gini Index in Dunkirk is 0.31.
What is the Total Population of Dunkirk?
Total Population of Dunkirk is 2,277.
What is the Total Male Population of Dunkirk?
Total Male Population of Dunkirk is 1,271.
What is the Total Female Population of Dunkirk?
Total Female Population of Dunkirk is 1,006.
What is the Ratio of Males per 100 Females in Dunkirk?
There are 126.34 Males per 100 Females in Dunkirk.
What is the Ratio of Females per 100 Males in Dunkirk?
There are 79.15 Females per 100 Males in Dunkirk.
What is the Median Population Age in Dunkirk?
Median Population Age in Dunkirk is 41.8 Years.
What is the Average Family Size in Dunkirk
Average Family Size in Dunkirk is 3.2 People.
What is the Average Household Size in Dunkirk
Average Household Size in Dunkirk is 2.9 People.
How Large is the Labor Force in Dunkirk?
There are 1,261 People in the Labor Forcein in Dunkirk.
What is the Percentage of People in the Labor Force in Dunkirk?
67.6% of People are in the Labor Force in Dunkirk.
What is the Unemployment Rate in Dunkirk?
Unemployment Rate in Dunkirk is 0.7%.