Darnestown, MD Map & Demographics
Darnestown Map
Darnestown Overview
$103,750
PER CAPITA INCOME
$250,001
AVG FAMILY INCOME
$250,001
AVG HOUSEHOLD INCOME
63.5%
WAGE / INCOME GAP [ % ]
36.5¢/ $1
WAGE / INCOME GAP [ $ ]
0.42
INEQUALITY / GINI INDEX
6,672
TOTAL POPULATION
3,144
MALE POPULATION
3,528
FEMALE POPULATION
89.12
MALES / 100 FEMALES
112.21
FEMALES / 100 MALES
47.7
MEDIAN AGE
3.0
AVG FAMILY SIZE
2.9
AVG HOUSEHOLD SIZE
3,900
LABOR FORCE [ PEOPLE ]
71.5%
PERCENT IN LABOR FORCE
3.1%
UNEMPLOYMENT RATE
Income in Darnestown
Income Overview in Darnestown
Per Capita Income in Darnestown is $103,750, while median incomes of families and households are $250,001 and $250,001 respectively.
| Characteristic | Number | Measure |
| Per Capita Income | 6,672 | $103,750 |
| Median Family Income | 2,081 | $250,001 |
| Mean Family Income | 2,081 | $314,422 |
| Median Household Income | 2,288 | $250,001 |
| Mean Household Income | 2,288 | $298,916 |
| Income Deficit | 2,081 | $0 |
| Wage / Income Gap (%) | 6,672 | 63.47% |
| Wage / Income Gap ($) | 6,672 | 36.53¢ per $1 |
| Gini / Inequality Index | 6,672 | 0.42 |
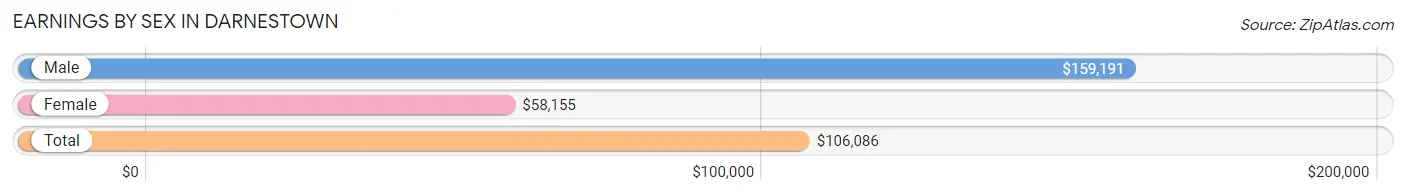
Earnings by Sex in Darnestown
Average Earnings in Darnestown are $106,086, $159,191 for men and $58,155 for women, a difference of 63.5%.
| Sex | Number | Average Earnings |
| Male | 1,993 (48.5%) | $159,191 |
| Female | 2,118 (51.5%) | $58,155 |
| Total | 4,111 (100.0%) | $106,086 |
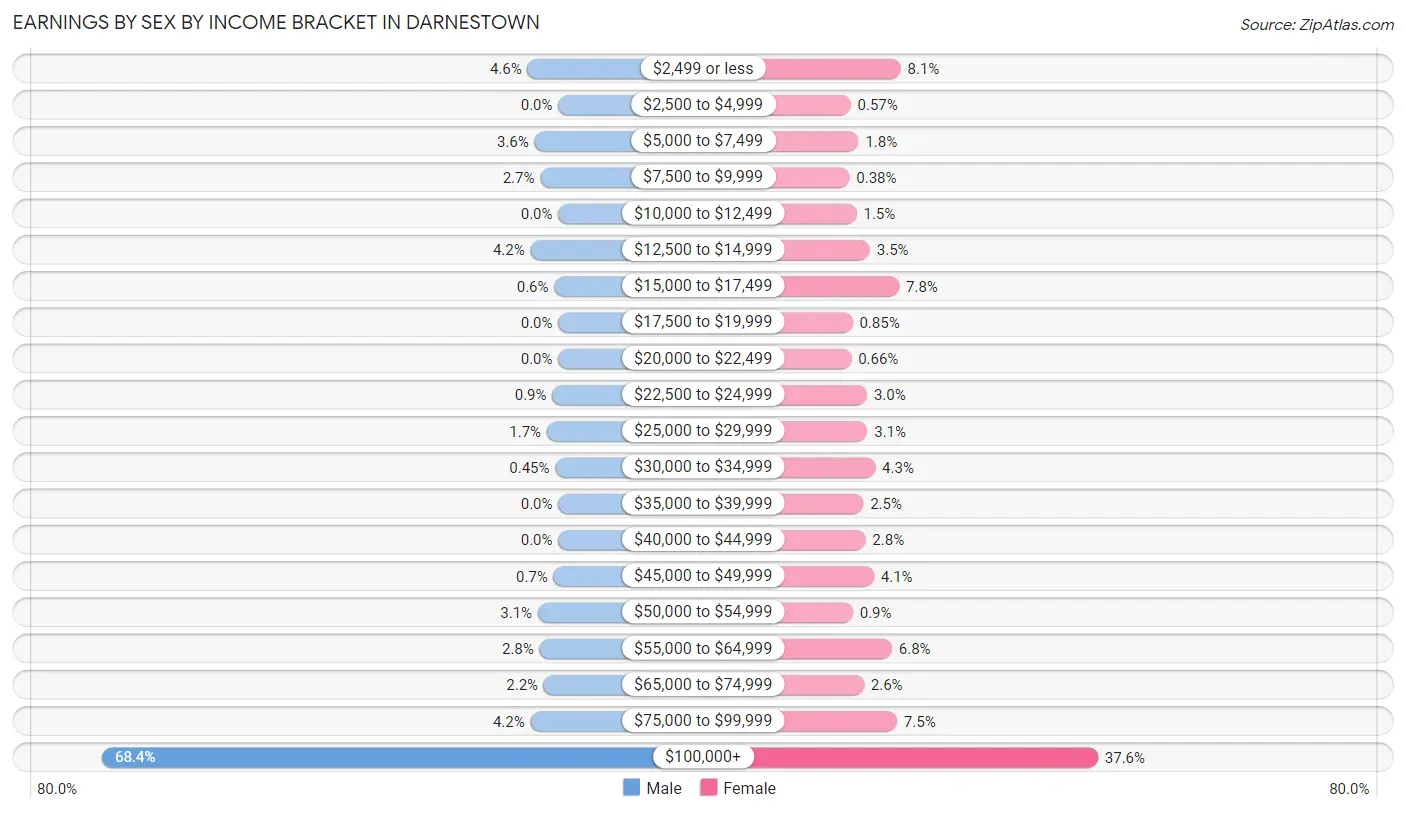
Earnings by Sex by Income Bracket in Darnestown
The most common earnings brackets in Darnestown are $100,000+ for men (1,363 | 68.4%) and $100,000+ for women (797 | 37.6%).
| Income | Male | Female |
| $2,499 or less | 92 (4.6%) | 171 (8.1%) |
| $2,500 to $4,999 | 0 (0.0%) | 12 (0.6%) |
| $5,000 to $7,499 | 71 (3.6%) | 37 (1.8%) |
| $7,500 to $9,999 | 54 (2.7%) | 8 (0.4%) |
| $10,000 to $12,499 | 0 (0.0%) | 31 (1.5%) |
| $12,500 to $14,999 | 83 (4.2%) | 73 (3.5%) |
| $15,000 to $17,499 | 12 (0.6%) | 166 (7.8%) |
| $17,500 to $19,999 | 0 (0.0%) | 18 (0.9%) |
| $20,000 to $22,499 | 0 (0.0%) | 14 (0.7%) |
| $22,500 to $24,999 | 18 (0.9%) | 64 (3.0%) |
| $25,000 to $29,999 | 34 (1.7%) | 65 (3.1%) |
| $30,000 to $34,999 | 9 (0.4%) | 90 (4.3%) |
| $35,000 to $39,999 | 0 (0.0%) | 52 (2.5%) |
| $40,000 to $44,999 | 0 (0.0%) | 59 (2.8%) |
| $45,000 to $49,999 | 14 (0.7%) | 86 (4.1%) |
| $50,000 to $54,999 | 61 (3.1%) | 19 (0.9%) |
| $55,000 to $64,999 | 56 (2.8%) | 143 (6.8%) |
| $65,000 to $74,999 | 43 (2.2%) | 54 (2.5%) |
| $75,000 to $99,999 | 83 (4.2%) | 159 (7.5%) |
| $100,000+ | 1,363 (68.4%) | 797 (37.6%) |
| Total | 1,993 (100.0%) | 2,118 (100.0%) |
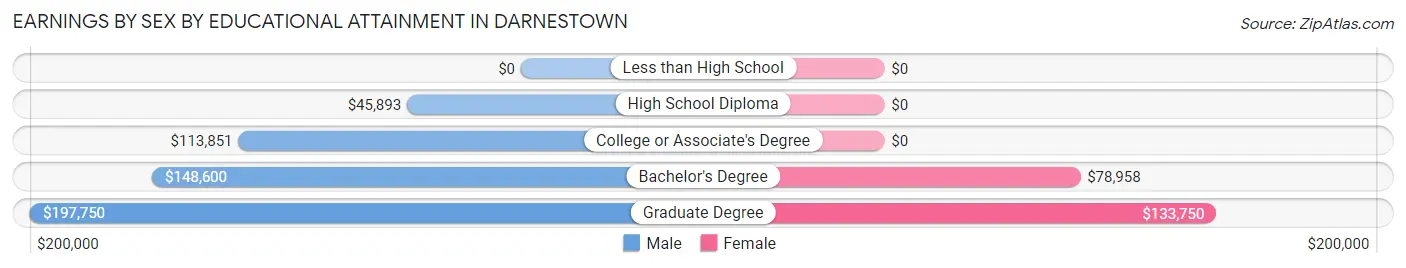
Earnings by Sex by Educational Attainment in Darnestown
Average earnings in Darnestown are $164,741 for men and $84,688 for women, a difference of 48.6%. Men with an educational attainment of graduate degree enjoy the highest average annual earnings of $197,750, while those with high school diploma education earn the least with $45,893. Women with an educational attainment of graduate degree earn the most with the average annual earnings of $133,750, while those with bachelor's degree education have the smallest earnings of $78,958.
| Educational Attainment | Male Income | Female Income |
| Less than High School | - | - |
| High School Diploma | $45,893 | $0 |
| College or Associate's Degree | $113,851 | $0 |
| Bachelor's Degree | $148,600 | $78,958 |
| Graduate Degree | $197,750 | $133,750 |
| Total | $164,741 | $84,688 |
Family Income in Darnestown
Family Income Brackets in Darnestown
According to the Darnestown family income data, there are 1,276 families falling into the $200,000+ income range, which is the most common income bracket and makes up 61.3% of all families.
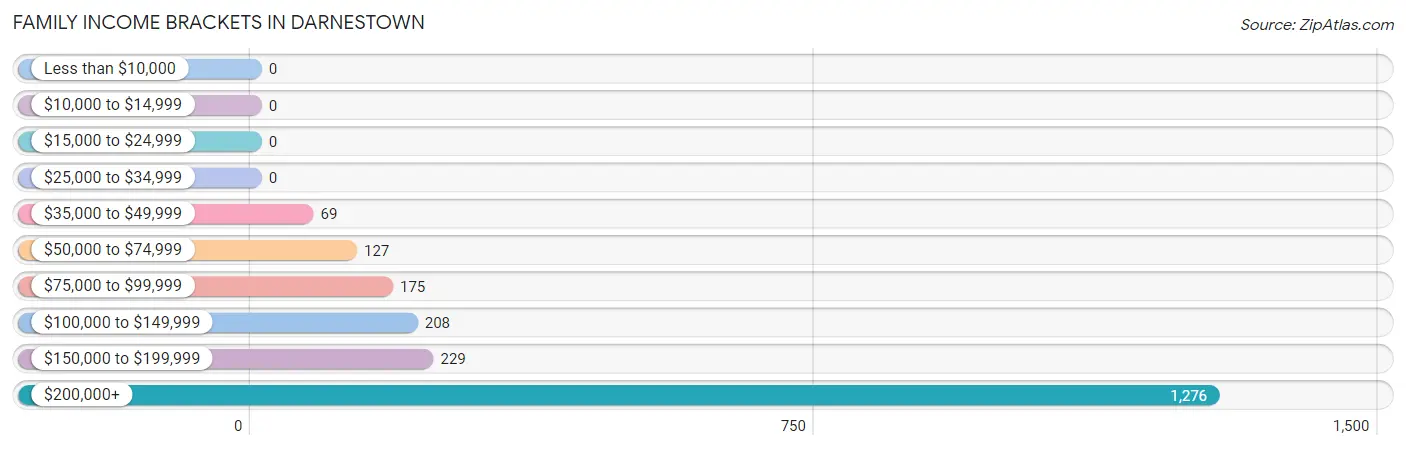
| Income Bracket | # Families | % Families |
| Less than $10,000 | 0 | 0.0% |
| $10,000 to $14,999 | 0 | 0.0% |
| $15,000 to $24,999 | 0 | 0.0% |
| $25,000 to $34,999 | 0 | 0.0% |
| $35,000 to $49,999 | 69 | 3.3% |
| $50,000 to $74,999 | 127 | 6.1% |
| $75,000 to $99,999 | 175 | 8.4% |
| $100,000 to $149,999 | 208 | 10.0% |
| $150,000 to $199,999 | 229 | 11.0% |
| $200,000+ | 1,276 | 61.3% |
Family Income by Famaliy Size in Darnestown
4-person families (520 | 25.0%) account for the highest median family income in Darnestown with $250,001 per family, while 2-person families (976 | 46.9%) have the highest median income of $116,666 per family member.
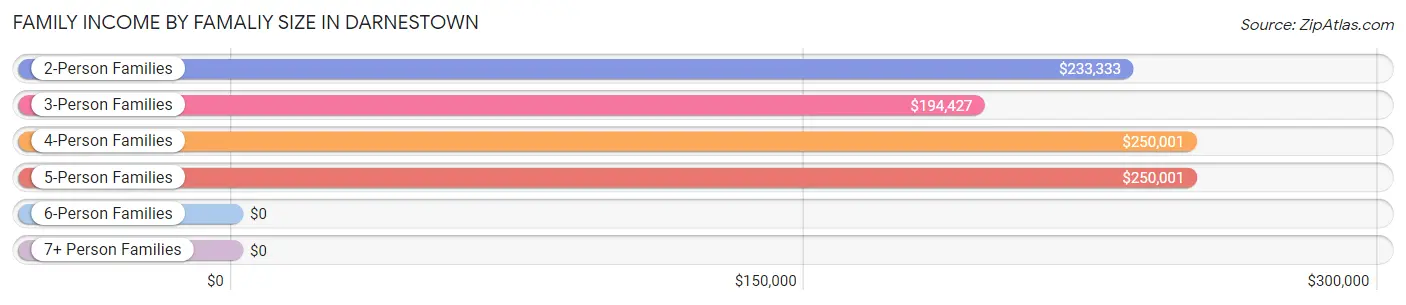
| Income Bracket | # Families | Median Income |
| 2-Person Families | 976 (46.9%) | $233,333 |
| 3-Person Families | 431 (20.7%) | $194,427 |
| 4-Person Families | 520 (25.0%) | $250,001 |
| 5-Person Families | 124 (6.0%) | $250,001 |
| 6-Person Families | 18 (0.9%) | $0 |
| 7+ Person Families | 12 (0.6%) | $0 |
| Total | 2,081 (100.0%) | $250,001 |
Family Income by Number of Earners in Darnestown
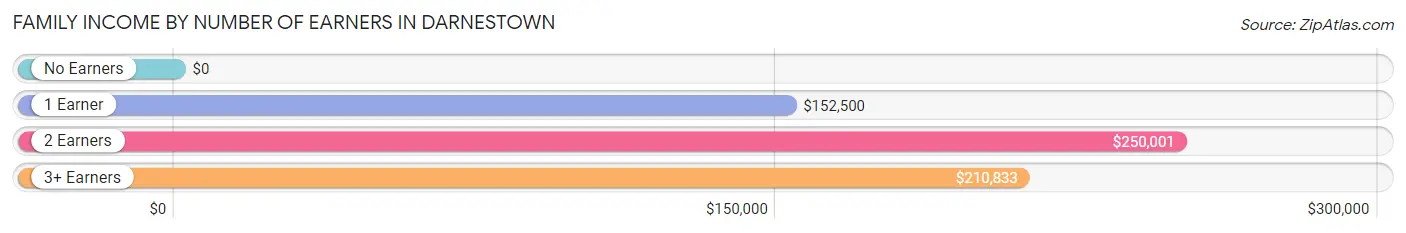
| Number of Earners | # Families | Median Income |
| No Earners | 80 (3.8%) | $0 |
| 1 Earner | 432 (20.8%) | $152,500 |
| 2 Earners | 1,391 (66.8%) | $250,001 |
| 3+ Earners | 178 (8.6%) | $210,833 |
| Total | 2,081 (100.0%) | $250,001 |
Household Income in Darnestown
Household Income Brackets in Darnestown
With 1,290 households falling in the category, the $200,000+ income range is the most frequent in Darnestown, accounting for 56.4% of all households.
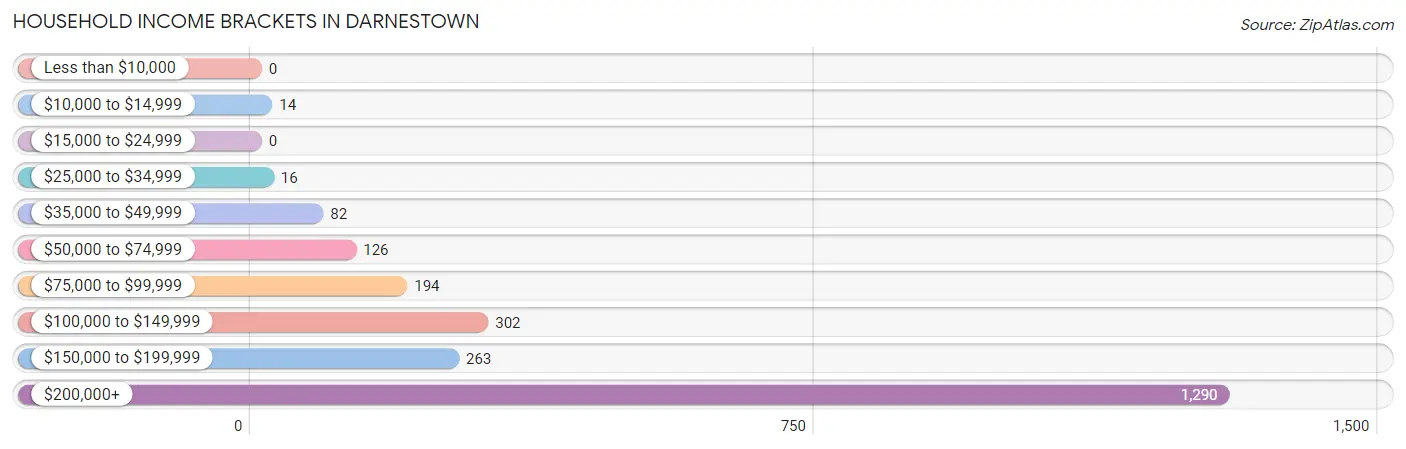
| Income Bracket | # Households | % Households |
| Less than $10,000 | 0 | 0.0% |
| $10,000 to $14,999 | 14 | 0.6% |
| $15,000 to $24,999 | 0 | 0.0% |
| $25,000 to $34,999 | 16 | 0.7% |
| $35,000 to $49,999 | 82 | 3.6% |
| $50,000 to $74,999 | 126 | 5.5% |
| $75,000 to $99,999 | 194 | 8.5% |
| $100,000 to $149,999 | 302 | 13.2% |
| $150,000 to $199,999 | 263 | 11.5% |
| $200,000+ | 1,290 | 56.4% |
Household Income by Householder Age in Darnestown
The median household income in Darnestown is $250,001, with the highest median household income of $250,001 found in the 25 to 44 years age bracket for the primary householder. A total of 388 households (17.0%) fall into this category.
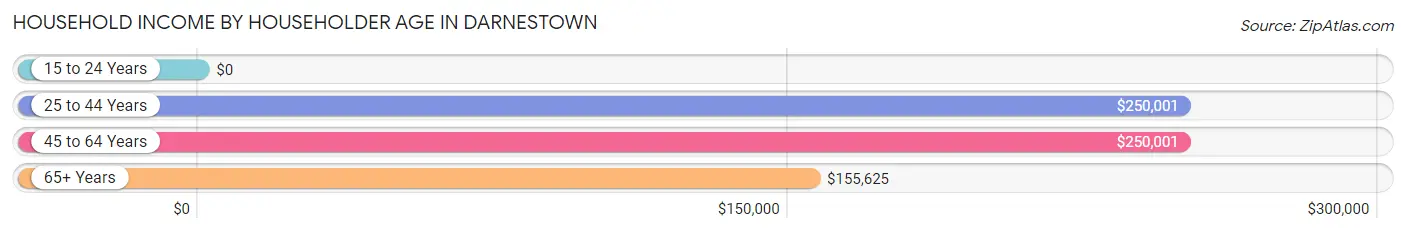
| Income Bracket | # Households | Median Income |
| 15 to 24 Years | 0 (0.0%) | $0 |
| 25 to 44 Years | 388 (17.0%) | $250,001 |
| 45 to 64 Years | 1,268 (55.4%) | $250,001 |
| 65+ Years | 632 (27.6%) | $155,625 |
| Total | 2,288 (100.0%) | $250,001 |
Poverty in Darnestown
Income Below Poverty by Sex and Age in Darnestown
With 1.2% poverty level for males and 0.6% for females among the residents of Darnestown, 18 to 24 year old males and 16 and 17 year old females are the most vulnerable to poverty, with 24 males (17.5%) and 7 females (6.0%) in their respective age groups living below the poverty level.
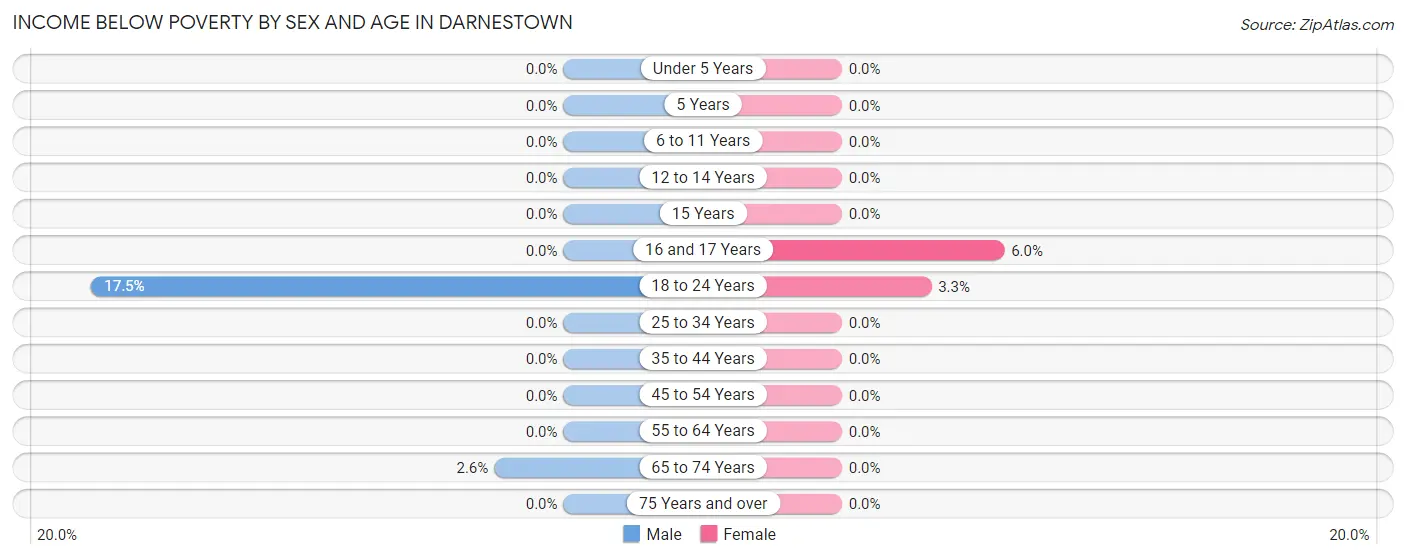
| Age Bracket | Male | Female |
| Under 5 Years | 0 (0.0%) | 0 (0.0%) |
| 5 Years | 0 (0.0%) | 0 (0.0%) |
| 6 to 11 Years | 0 (0.0%) | 0 (0.0%) |
| 12 to 14 Years | 0 (0.0%) | 0 (0.0%) |
| 15 Years | 0 (0.0%) | 0 (0.0%) |
| 16 and 17 Years | 0 (0.0%) | 7 (6.0%) |
| 18 to 24 Years | 24 (17.5%) | 13 (3.3%) |
| 25 to 34 Years | 0 (0.0%) | 0 (0.0%) |
| 35 to 44 Years | 0 (0.0%) | 0 (0.0%) |
| 45 to 54 Years | 0 (0.0%) | 0 (0.0%) |
| 55 to 64 Years | 0 (0.0%) | 0 (0.0%) |
| 65 to 74 Years | 13 (2.6%) | 0 (0.0%) |
| 75 Years and over | 0 (0.0%) | 0 (0.0%) |
| Total | 37 (1.2%) | 20 (0.6%) |
Income Above Poverty by Sex and Age in Darnestown
According to the poverty statistics in Darnestown, males aged under 5 years and females aged under 5 years are the age groups that are most secure financially, with 100.0% of males and 100.0% of females in these age groups living above the poverty line.
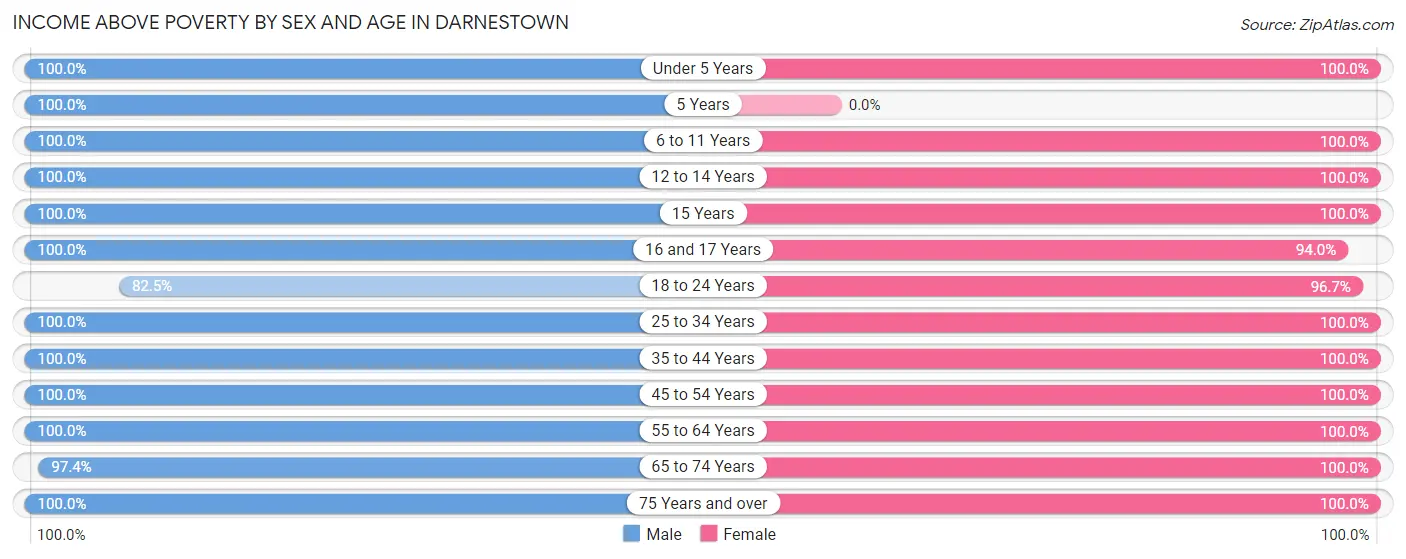
| Age Bracket | Male | Female |
| Under 5 Years | 226 (100.0%) | 117 (100.0%) |
| 5 Years | 70 (100.0%) | 0 (0.0%) |
| 6 to 11 Years | 162 (100.0%) | 282 (100.0%) |
| 12 to 14 Years | 122 (100.0%) | 110 (100.0%) |
| 15 Years | 90 (100.0%) | 25 (100.0%) |
| 16 and 17 Years | 178 (100.0%) | 109 (94.0%) |
| 18 to 24 Years | 113 (82.5%) | 379 (96.7%) |
| 25 to 34 Years | 119 (100.0%) | 190 (100.0%) |
| 35 to 44 Years | 229 (100.0%) | 437 (100.0%) |
| 45 to 54 Years | 516 (100.0%) | 566 (100.0%) |
| 55 to 64 Years | 562 (100.0%) | 753 (100.0%) |
| 65 to 74 Years | 493 (97.4%) | 344 (100.0%) |
| 75 Years and over | 220 (100.0%) | 176 (100.0%) |
| Total | 3,100 (98.8%) | 3,488 (99.4%) |
Income Below Poverty Among Married-Couple Families in Darnestown
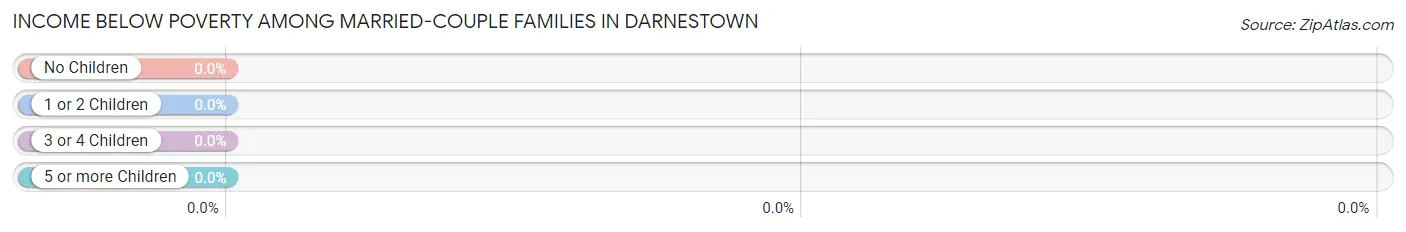
| Children | Above Poverty | Below Poverty |
| No Children | 1,171 (100.0%) | 0 (0.0%) |
| 1 or 2 Children | 583 (100.0%) | 0 (0.0%) |
| 3 or 4 Children | 135 (100.0%) | 0 (0.0%) |
| 5 or more Children | 0 (0.0%) | 0 (0.0%) |
| Total | 1,889 (100.0%) | 0 (0.0%) |
Income Below Poverty Among Single-Parent Households in Darnestown
| Children | Single Father | Single Mother |
| No Children | 0 (0.0%) | 0 (0.0%) |
| 1 or 2 Children | 0 (0.0%) | 0 (0.0%) |
| 3 or 4 Children | 0 (0.0%) | 0 (0.0%) |
| 5 or more Children | 0 (0.0%) | 0 (0.0%) |
| Total | 0 (0.0%) | 0 (0.0%) |
Income Below Poverty Among Married-Couple vs Single-Parent Households in Darnestown
| Children | Married-Couple Families | Single-Parent Households |
| No Children | 0 (0.0%) | 0 (0.0%) |
| 1 or 2 Children | 0 (0.0%) | 0 (0.0%) |
| 3 or 4 Children | 0 (0.0%) | 0 (0.0%) |
| 5 or more Children | 0 (0.0%) | 0 (0.0%) |
| Total | 0 (0.0%) | 0 (0.0%) |
Race in Darnestown
The most populous races in Darnestown are White / Caucasian (4,934 | 74.0%), Asian (1,265 | 19.0%), and Black / African American (216 | 3.2%).
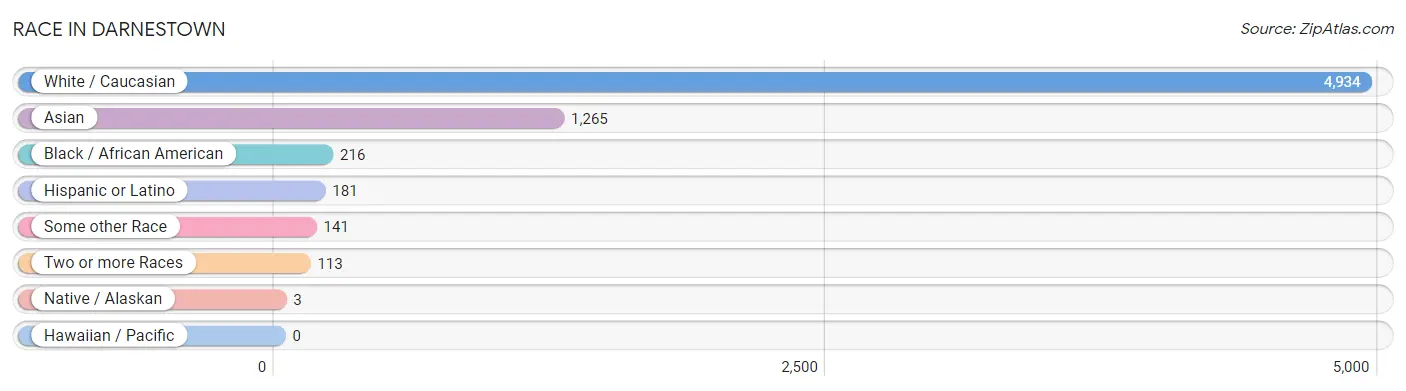
| Race | # Population | % Population |
| Asian | 1,265 | 19.0% |
| Black / African American | 216 | 3.2% |
| Hawaiian / Pacific | 0 | 0.0% |
| Hispanic or Latino | 181 | 2.7% |
| Native / Alaskan | 3 | 0.0% |
| White / Caucasian | 4,934 | 74.0% |
| Two or more Races | 113 | 1.7% |
| Some other Race | 141 | 2.1% |
| Total | 6,672 | 100.0% |
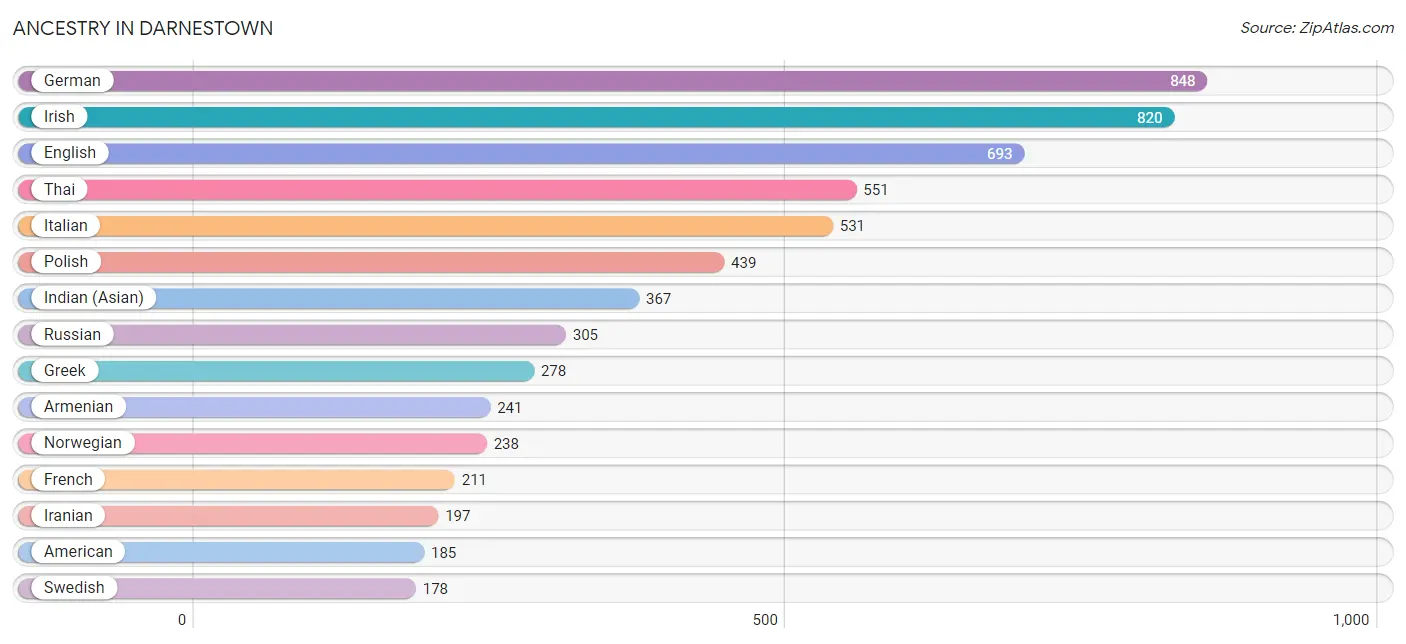
Ancestry in Darnestown
The most populous ancestries reported in Darnestown are German (848 | 12.7%), Irish (820 | 12.3%), English (693 | 10.4%), Thai (551 | 8.3%), and Italian (531 | 8.0%), together accounting for 51.6% of all Darnestown residents.
| Ancestry | # Population | % Population |
| African | 21 | 0.3% |
| American | 185 | 2.8% |
| Arab | 127 | 1.9% |
| Argentinean | 13 | 0.2% |
| Armenian | 241 | 3.6% |
| Austrian | 82 | 1.2% |
| Bolivian | 28 | 0.4% |
| British | 166 | 2.5% |
| Burmese | 70 | 1.1% |
| Canadian | 104 | 1.6% |
| Central American | 39 | 0.6% |
| Croatian | 16 | 0.2% |
| Czech | 14 | 0.2% |
| Czechoslovakian | 18 | 0.3% |
| Danish | 17 | 0.3% |
| Dutch | 73 | 1.1% |
| Eastern European | 94 | 1.4% |
| English | 693 | 10.4% |
| European | 83 | 1.2% |
| Finnish | 18 | 0.3% |
| French | 211 | 3.2% |
| French Canadian | 11 | 0.2% |
| German | 848 | 12.7% |
| Greek | 278 | 4.2% |
| Guatemalan | 3 | 0.0% |
| Guyanese | 8 | 0.1% |
| Hungarian | 93 | 1.4% |
| Indian (Asian) | 367 | 5.5% |
| Iranian | 197 | 2.9% |
| Irish | 820 | 12.3% |
| Italian | 531 | 8.0% |
| Japanese | 8 | 0.1% |
| Korean | 116 | 1.7% |
| Lebanese | 107 | 1.6% |
| Lithuanian | 6 | 0.1% |
| Mexican | 34 | 0.5% |
| New Zealander | 10 | 0.2% |
| Northern European | 49 | 0.7% |
| Norwegian | 238 | 3.6% |
| Peruvian | 18 | 0.3% |
| Polish | 439 | 6.6% |
| Puerto Rican | 48 | 0.7% |
| Romanian | 14 | 0.2% |
| Russian | 305 | 4.6% |
| Salvadoran | 36 | 0.5% |
| Scotch-Irish | 126 | 1.9% |
| Scottish | 65 | 1.0% |
| Serbian | 22 | 0.3% |
| Slovene | 23 | 0.3% |
| South American | 59 | 0.9% |
| Spaniard | 1 | 0.0% |
| Sri Lankan | 137 | 2.1% |
| Subsaharan African | 27 | 0.4% |
| Swedish | 178 | 2.7% |
| Swiss | 36 | 0.5% |
| Thai | 551 | 8.3% |
| Ugandan | 6 | 0.1% |
| Welsh | 46 | 0.7% |
| West Indian | 1 | 0.0% | View All 59 Rows |
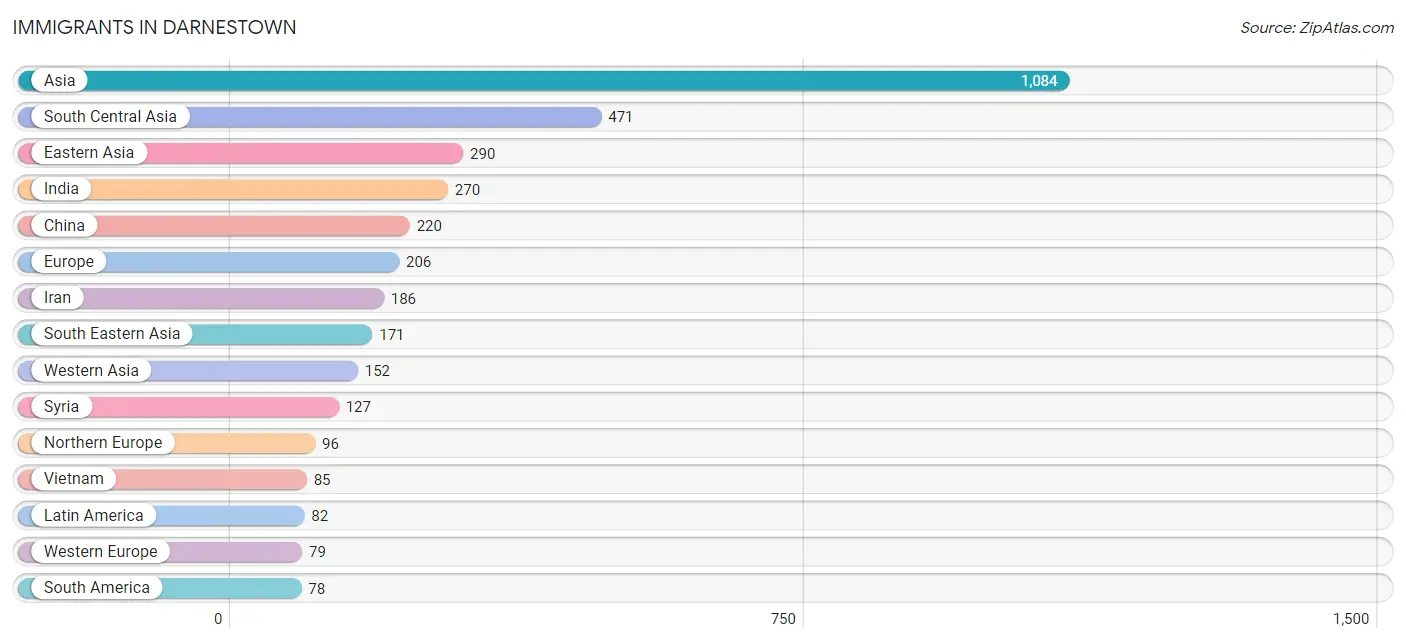
Immigrants in Darnestown
The most numerous immigrant groups reported in Darnestown came from Asia (1,084 | 16.3%), South Central Asia (471 | 7.1%), Eastern Asia (290 | 4.3%), India (270 | 4.1%), and China (220 | 3.3%), together accounting for 35.0% of all Darnestown residents.
| Immigration Origin | # Population | % Population |
| Africa | 21 | 0.3% |
| Argentina | 13 | 0.2% |
| Asia | 1,084 | 16.3% |
| Australia | 16 | 0.2% |
| Bolivia | 28 | 0.4% |
| Cambodia | 17 | 0.3% |
| Canada | 52 | 0.8% |
| Caribbean | 1 | 0.0% |
| Central America | 3 | 0.0% |
| China | 220 | 3.3% |
| Eastern Africa | 21 | 0.3% |
| Eastern Asia | 290 | 4.3% |
| Eastern Europe | 31 | 0.5% |
| England | 33 | 0.5% |
| Europe | 206 | 3.1% |
| France | 16 | 0.2% |
| Germany | 27 | 0.4% |
| Guatemala | 3 | 0.0% |
| Guyana | 19 | 0.3% |
| Hong Kong | 14 | 0.2% |
| India | 270 | 4.1% |
| Iran | 186 | 2.8% |
| Ireland | 1 | 0.0% |
| Kenya | 15 | 0.2% |
| Korea | 70 | 1.1% |
| Latin America | 82 | 1.2% |
| Lebanon | 25 | 0.4% |
| Netherlands | 36 | 0.5% |
| Northern Europe | 96 | 1.4% |
| Oceania | 16 | 0.2% |
| Pakistan | 15 | 0.2% |
| Peru | 18 | 0.3% |
| Philippines | 46 | 0.7% |
| Poland | 16 | 0.2% |
| Russia | 15 | 0.2% |
| Singapore | 23 | 0.3% |
| South America | 78 | 1.2% |
| South Central Asia | 471 | 7.1% |
| South Eastern Asia | 171 | 2.6% |
| Syria | 127 | 1.9% |
| Taiwan | 15 | 0.2% |
| Trinidad and Tobago | 1 | 0.0% |
| Uganda | 6 | 0.1% |
| Vietnam | 85 | 1.3% |
| Western Asia | 152 | 2.3% |
| Western Europe | 79 | 1.2% | View All 46 Rows |
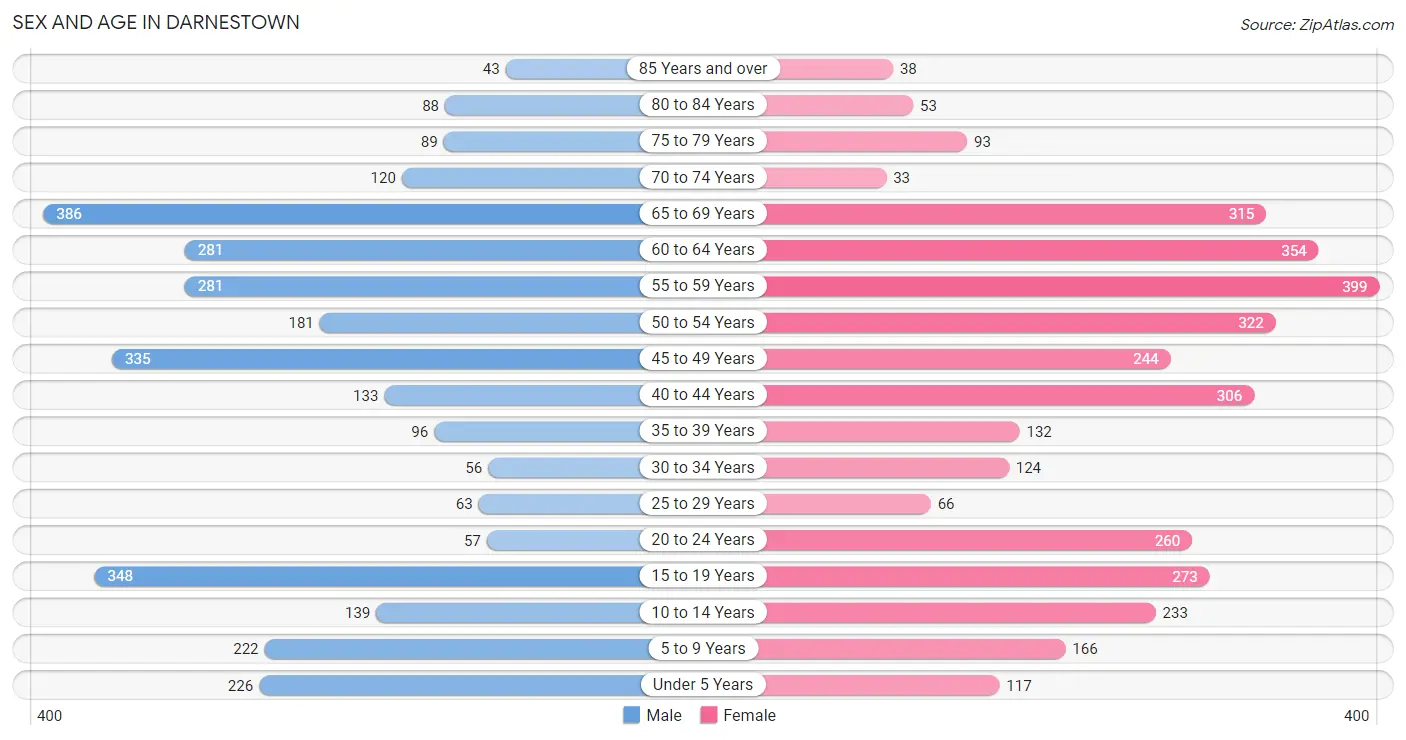
Sex and Age in Darnestown
Sex and Age in Darnestown
The most populous age groups in Darnestown are 65 to 69 Years (386 | 12.3%) for men and 55 to 59 Years (399 | 11.3%) for women.
| Age Bracket | Male | Female |
| Under 5 Years | 226 (7.2%) | 117 (3.3%) |
| 5 to 9 Years | 222 (7.1%) | 166 (4.7%) |
| 10 to 14 Years | 139 (4.4%) | 233 (6.6%) |
| 15 to 19 Years | 348 (11.1%) | 273 (7.7%) |
| 20 to 24 Years | 57 (1.8%) | 260 (7.4%) |
| 25 to 29 Years | 63 (2.0%) | 66 (1.9%) |
| 30 to 34 Years | 56 (1.8%) | 124 (3.5%) |
| 35 to 39 Years | 96 (3.0%) | 132 (3.7%) |
| 40 to 44 Years | 133 (4.2%) | 306 (8.7%) |
| 45 to 49 Years | 335 (10.7%) | 244 (6.9%) |
| 50 to 54 Years | 181 (5.8%) | 322 (9.1%) |
| 55 to 59 Years | 281 (8.9%) | 399 (11.3%) |
| 60 to 64 Years | 281 (8.9%) | 354 (10.0%) |
| 65 to 69 Years | 386 (12.3%) | 315 (8.9%) |
| 70 to 74 Years | 120 (3.8%) | 33 (0.9%) |
| 75 to 79 Years | 89 (2.8%) | 93 (2.6%) |
| 80 to 84 Years | 88 (2.8%) | 53 (1.5%) |
| 85 Years and over | 43 (1.4%) | 38 (1.1%) |
| Total | 3,144 (100.0%) | 3,528 (100.0%) |
Families and Households in Darnestown
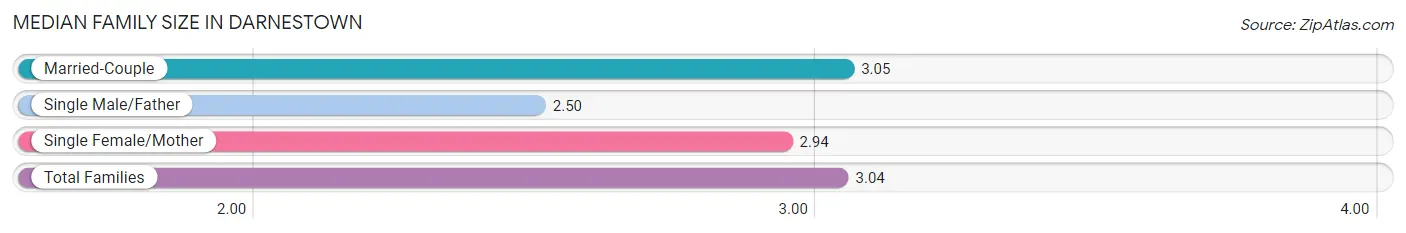
Median Family Size in Darnestown
The median family size in Darnestown is 3.04 persons per family, with married-couple families (1,889 | 90.8%) accounting for the largest median family size of 3.05 persons per family. On the other hand, single male/father families (12 | 0.6%) represent the smallest median family size with 2.50 persons per family.
| Family Type | # Families | Family Size |
| Married-Couple | 1,889 (90.8%) | 3.05 |
| Single Male/Father | 12 (0.6%) | 2.50 |
| Single Female/Mother | 180 (8.6%) | 2.94 |
| Total Families | 2,081 (100.0%) | 3.04 |
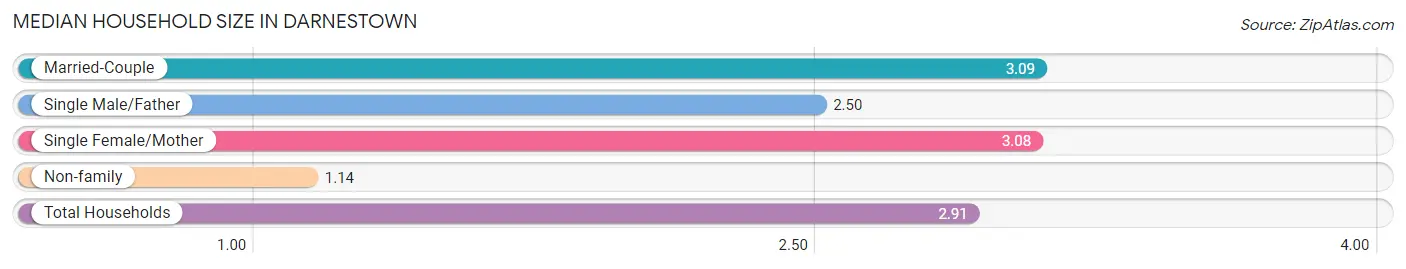
Median Household Size in Darnestown
The median household size in Darnestown is 2.91 persons per household, with married-couple households (1,889 | 82.6%) accounting for the largest median household size of 3.09 persons per household. non-family households (207 | 9.0%) represent the smallest median household size with 1.14 persons per household.
| Household Type | # Households | Household Size |
| Married-Couple | 1,889 (82.6%) | 3.09 |
| Single Male/Father | 12 (0.5%) | 2.50 |
| Single Female/Mother | 180 (7.9%) | 3.08 |
| Non-family | 207 (9.0%) | 1.14 |
| Total Households | 2,288 (100.0%) | 2.91 |
Household Size by Marriage Status in Darnestown
Out of a total of 2,288 households in Darnestown, 2,081 (90.9%) are family households, while 207 (9.0%) are nonfamily households. The most numerous type of family households are 2-person households, comprising 926, and the most common type of nonfamily households are 1-person households, comprising 200.
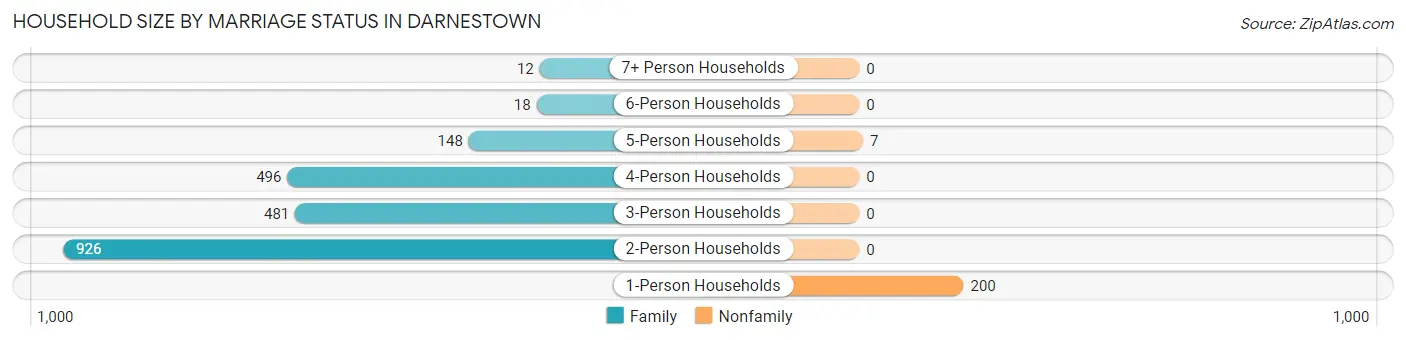
| Household Size | Family Households | Nonfamily Households |
| 1-Person Households | - | 200 (8.7%) |
| 2-Person Households | 926 (40.5%) | 0 (0.0%) |
| 3-Person Households | 481 (21.0%) | 0 (0.0%) |
| 4-Person Households | 496 (21.7%) | 0 (0.0%) |
| 5-Person Households | 148 (6.5%) | 7 (0.3%) |
| 6-Person Households | 18 (0.8%) | 0 (0.0%) |
| 7+ Person Households | 12 (0.5%) | 0 (0.0%) |
| Total | 2,081 (90.9%) | 207 (9.0%) |
Female Fertility in Darnestown
Fertility by Age in Darnestown
Average fertility rate in Darnestown is 32.0 births per 1,000 women. Women in the age bracket of 20 to 34 years have the highest fertility rate with 40.0 births per 1,000 women. Women in the age bracket of 35 to 50 years acount for 60.9% of all women with births.
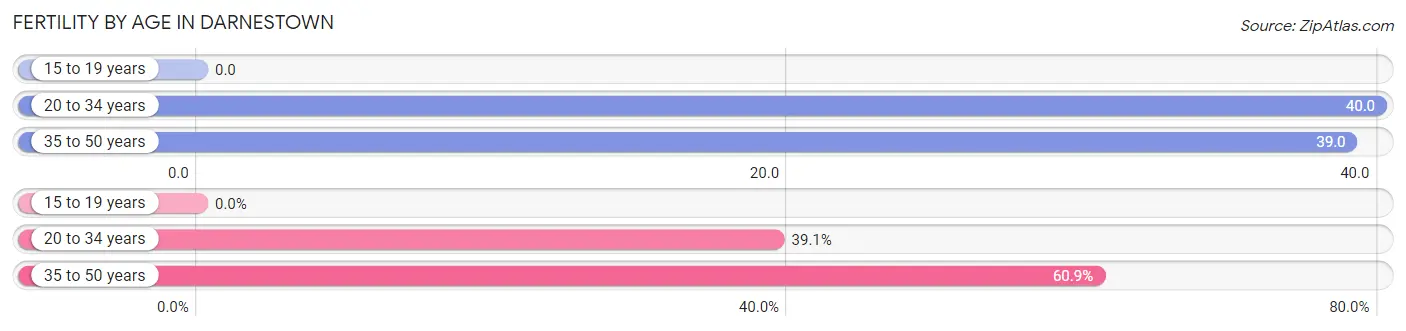
| Age Bracket | Women with Births | Births / 1,000 Women |
| 15 to 19 years | 0 (0.0%) | 0.0 |
| 20 to 34 years | 18 (39.1%) | 40.0 |
| 35 to 50 years | 28 (60.9%) | 39.0 |
| Total | 46 (100.0%) | 32.0 |
Fertility by Age by Marriage Status in Darnestown
60.9% of women with births (46) in Darnestown are married. The highest percentage of unmarried women with births falls into 20 to 34 years age bracket with 100.0% of them unmarried at the time of birth, while the lowest percentage of unmarried women with births belong to 35 to 50 years age bracket with 0.0% of them unmarried.
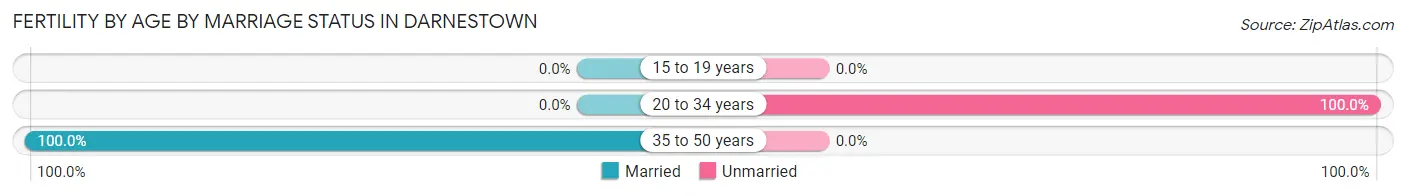
| Age Bracket | Married | Unmarried |
| 15 to 19 years | 0 (0.0%) | 0 (0.0%) |
| 20 to 34 years | 0 (0.0%) | 18 (100.0%) |
| 35 to 50 years | 28 (100.0%) | 0 (0.0%) |
| Total | 28 (60.9%) | 18 (39.1%) |
Fertility by Education in Darnestown
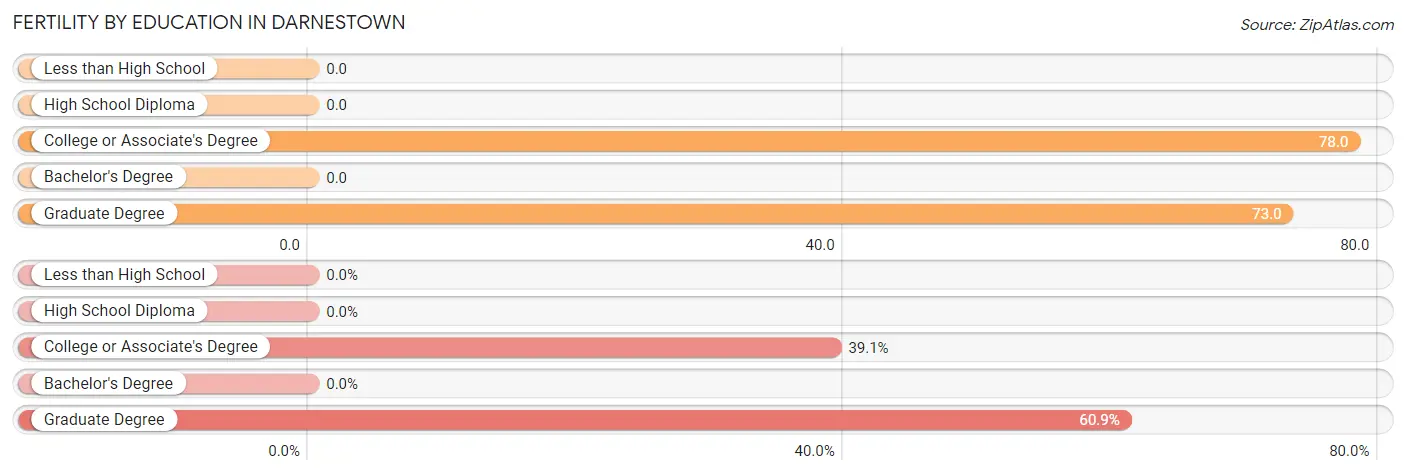
| Educational Attainment | Women with Births | Births / 1,000 Women |
| Less than High School | 0 (0.0%) | 0.0 |
| High School Diploma | 0 (0.0%) | 0.0 |
| College or Associate's Degree | 18 (39.1%) | 78.0 |
| Bachelor's Degree | 0 (0.0%) | 0.0 |
| Graduate Degree | 28 (60.9%) | 73.0 |
| Total | 46 (100.0%) | 32.0 |
Fertility by Education by Marriage Status in Darnestown
39.1% of women with births in Darnestown are unmarried. Women with the educational attainment of graduate degree are most likely to be married with 100.0% of them married at childbirth, while women with the educational attainment of college or associate's degree are least likely to be married with 100.0% of them unmarried at childbirth.
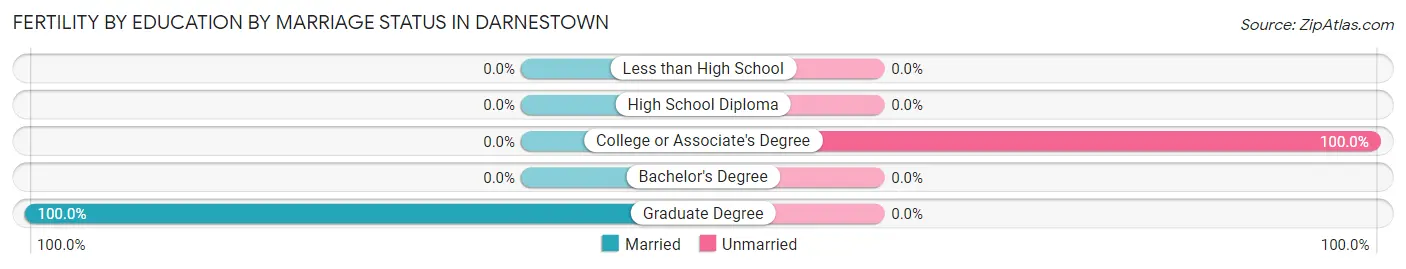
| Educational Attainment | Married | Unmarried |
| Less than High School | 0 (0.0%) | 0 (0.0%) |
| High School Diploma | 0 (0.0%) | 0 (0.0%) |
| College or Associate's Degree | 0 (0.0%) | 18 (100.0%) |
| Bachelor's Degree | 0 (0.0%) | 0 (0.0%) |
| Graduate Degree | 28 (100.0%) | 0 (0.0%) |
| Total | 28 (60.9%) | 18 (39.1%) |
Employment Characteristics in Darnestown
Employment by Class of Employer in Darnestown
Among the 3,689 employed individuals in Darnestown, private company employees (2,305 | 62.5%), federal government employees (482 | 13.1%), and not-for-profit organizations (264 | 7.2%) make up the most common classes of employment.
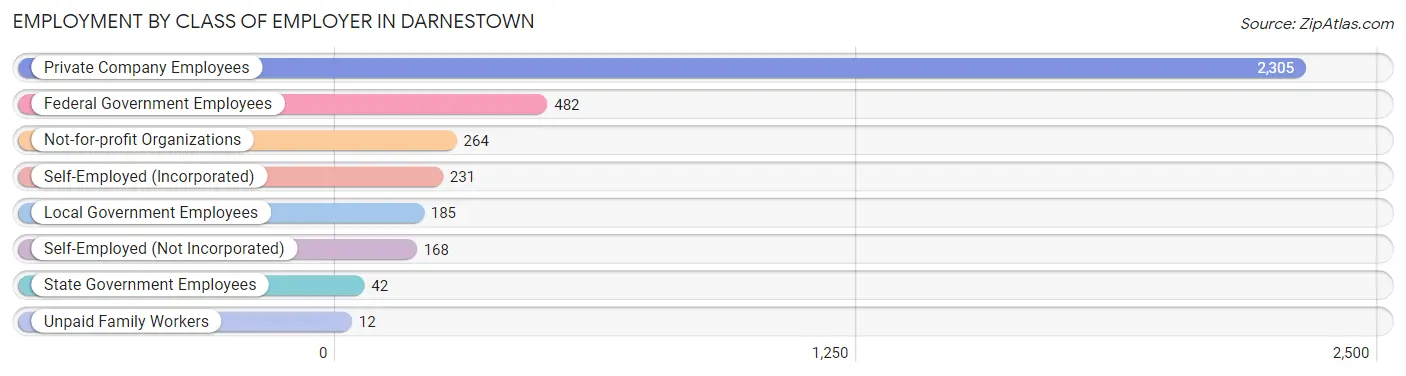
| Employer Class | # Employees | % Employees |
| Private Company Employees | 2,305 | 62.5% |
| Self-Employed (Incorporated) | 231 | 6.3% |
| Self-Employed (Not Incorporated) | 168 | 4.5% |
| Not-for-profit Organizations | 264 | 7.2% |
| Local Government Employees | 185 | 5.0% |
| State Government Employees | 42 | 1.1% |
| Federal Government Employees | 482 | 13.1% |
| Unpaid Family Workers | 12 | 0.3% |
| Total | 3,689 | 100.0% |
Employment Status by Age in Darnestown
According to the labor force statistics for Darnestown, out of the total population over 16 years of age (5,454), 71.5% or 3,900 individuals are in the labor force, with 3.1% or 121 of them unemployed. The age group with the highest labor force participation rate is 20 to 24 years, with 95.0% or 301 individuals in the labor force. Within the labor force, the 25 to 29 years age range has the highest percentage of unemployed individuals, with 18.6% or 19 of them being unemployed.
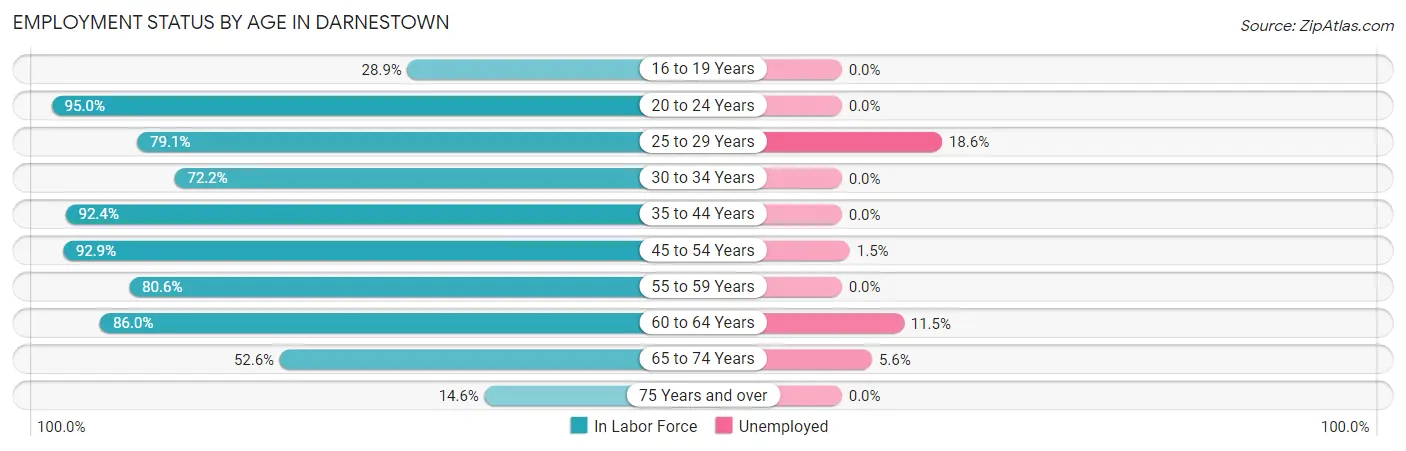
| Age Bracket | In Labor Force | Unemployed |
| 16 to 19 Years | 146 (28.9%) | 0 (0.0%) |
| 20 to 24 Years | 301 (95.0%) | 0 (0.0%) |
| 25 to 29 Years | 102 (79.1%) | 19 (18.6%) |
| 30 to 34 Years | 130 (72.2%) | 0 (0.0%) |
| 35 to 44 Years | 616 (92.4%) | 0 (0.0%) |
| 45 to 54 Years | 1,005 (92.9%) | 15 (1.5%) |
| 55 to 59 Years | 548 (80.6%) | 0 (0.0%) |
| 60 to 64 Years | 546 (86.0%) | 63 (11.5%) |
| 65 to 74 Years | 449 (52.6%) | 25 (5.6%) |
| 75 Years and over | 59 (14.6%) | 0 (0.0%) |
| Total | 3,900 (71.5%) | 121 (3.1%) |
Employment Status by Educational Attainment in Darnestown
According to labor force statistics for Darnestown, 87.4% of individuals (2,948) out of the total population between 25 and 64 years of age (3,373) are in the labor force, with 3.3% or 97 of them being unemployed. The group with the highest labor force participation rate are those with the educational attainment of high school diploma, with 92.7% or 191 individuals in the labor force. Within the labor force, individuals with less than high school education have the highest percentage of unemployment, with 28.2% or 22 of them being unemployed.
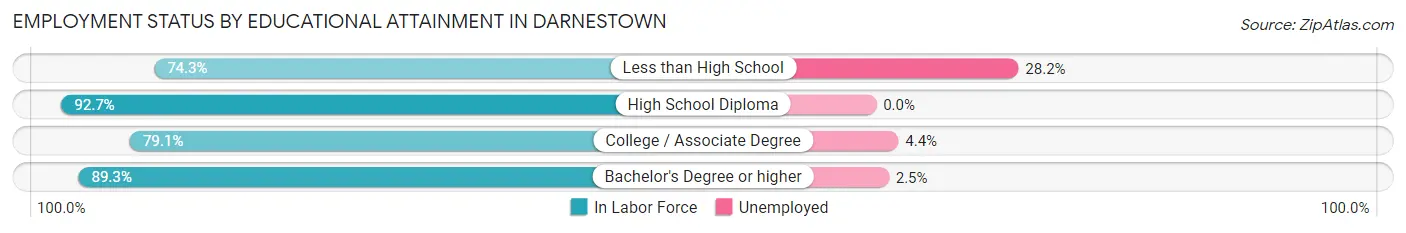
| Educational Attainment | In Labor Force | Unemployed |
| Less than High School | 78 (74.3%) | 30 (28.2%) |
| High School Diploma | 191 (92.7%) | 0 (0.0%) |
| College / Associate Degree | 427 (79.1%) | 24 (4.4%) |
| Bachelor's Degree or higher | 2,252 (89.3%) | 63 (2.5%) |
| Total | 2,948 (87.4%) | 111 (3.3%) |
Employment Occupations by Sex in Darnestown
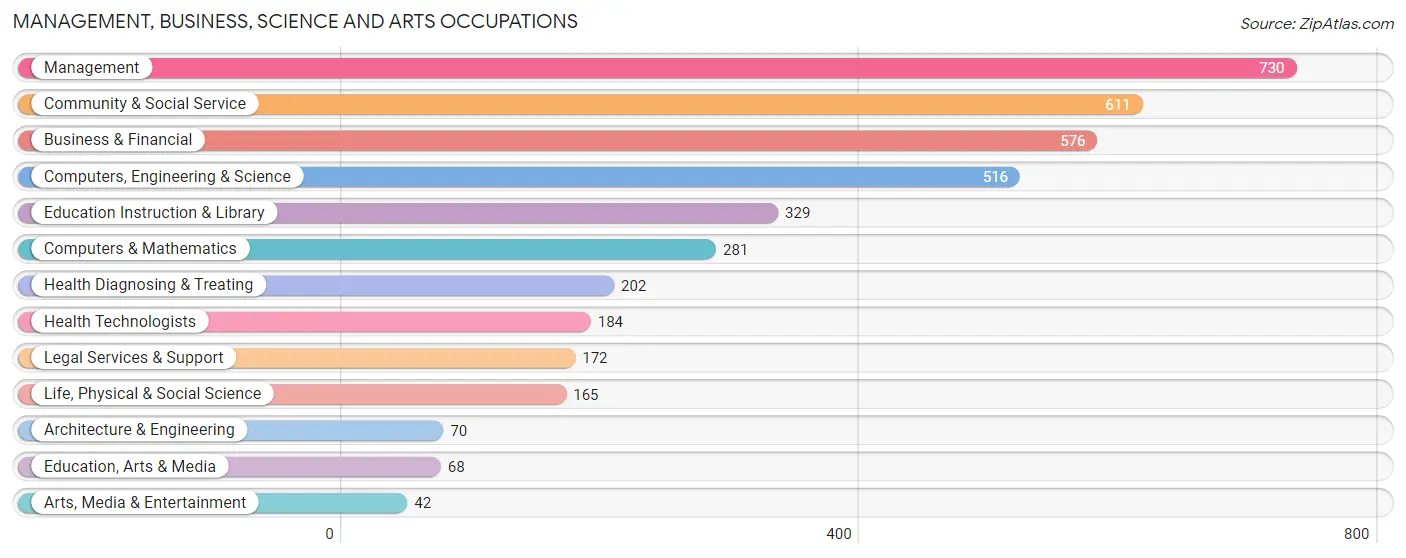
Management, Business, Science and Arts Occupations
The most common Management, Business, Science and Arts occupations in Darnestown are Management (730 | 19.5%), Community & Social Service (611 | 16.3%), Business & Financial (576 | 15.3%), Computers, Engineering & Science (516 | 13.8%), and Education Instruction & Library (329 | 8.8%).
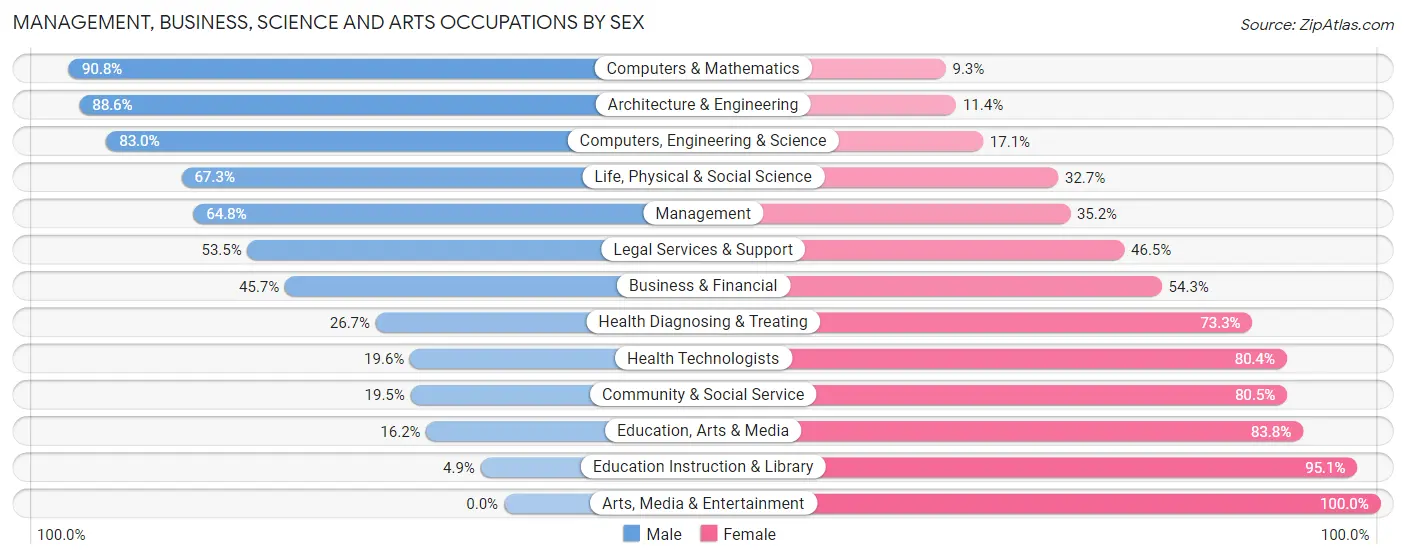
Management, Business, Science and Arts Occupations by Sex
Within the Management, Business, Science and Arts occupations in Darnestown, the most male-oriented occupations are Computers & Mathematics (90.7%), Architecture & Engineering (88.6%), and Computers, Engineering & Science (83.0%), while the most female-oriented occupations are Arts, Media & Entertainment (100.0%), Education Instruction & Library (95.1%), and Education, Arts & Media (83.8%).
| Occupation | Male | Female |
| Management | 473 (64.8%) | 257 (35.2%) |
| Business & Financial | 263 (45.7%) | 313 (54.3%) |
| Computers, Engineering & Science | 428 (83.0%) | 88 (17.1%) |
| Computers & Mathematics | 255 (90.7%) | 26 (9.2%) |
| Architecture & Engineering | 62 (88.6%) | 8 (11.4%) |
| Life, Physical & Social Science | 111 (67.3%) | 54 (32.7%) |
| Community & Social Service | 119 (19.5%) | 492 (80.5%) |
| Education, Arts & Media | 11 (16.2%) | 57 (83.8%) |
| Legal Services & Support | 92 (53.5%) | 80 (46.5%) |
| Education Instruction & Library | 16 (4.9%) | 313 (95.1%) |
| Arts, Media & Entertainment | 0 (0.0%) | 42 (100.0%) |
| Health Diagnosing & Treating | 54 (26.7%) | 148 (73.3%) |
| Health Technologists | 36 (19.6%) | 148 (80.4%) |
| Total (Category) | 1,337 (50.7%) | 1,298 (49.3%) |
| Total (Overall) | 1,717 (45.7%) | 2,037 (54.3%) |
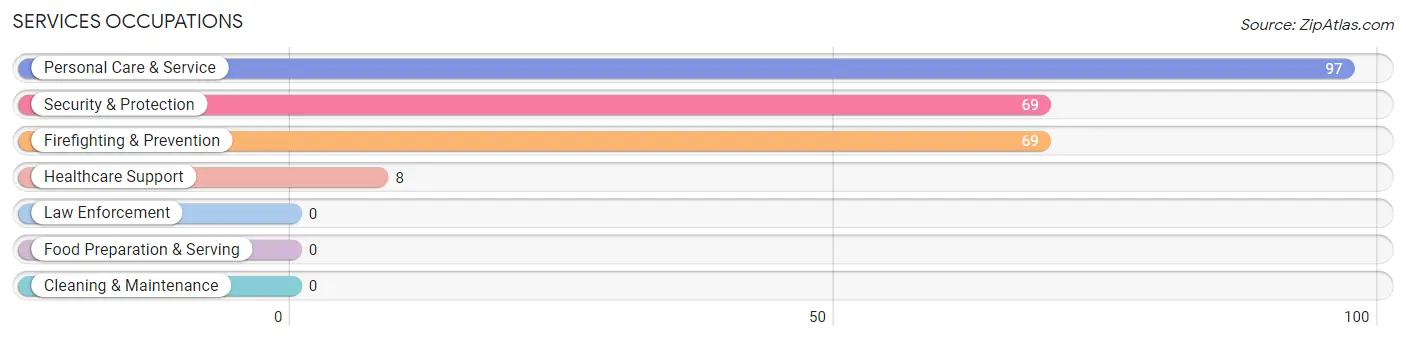
Services Occupations
The most common Services occupations in Darnestown are Personal Care & Service (97 | 2.6%), Security & Protection (69 | 1.8%), Firefighting & Prevention (69 | 1.8%), and Healthcare Support (8 | 0.2%).
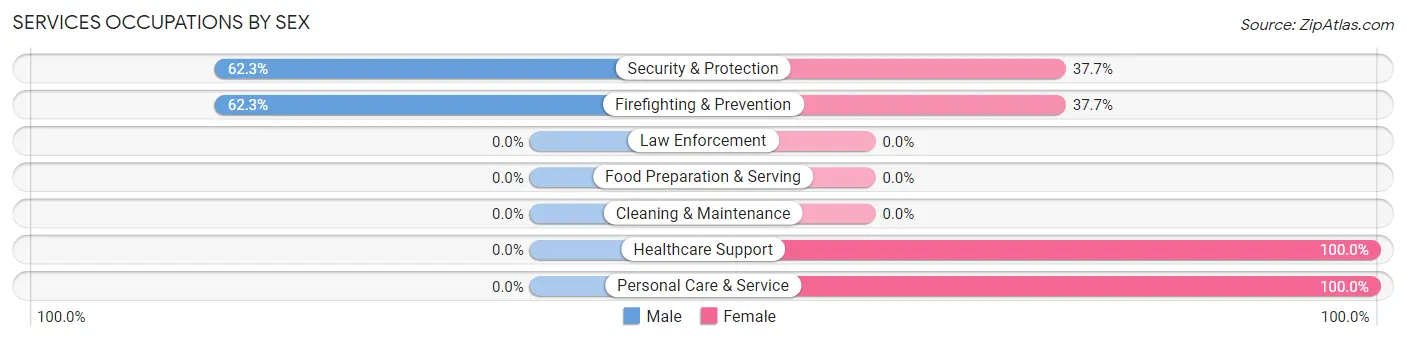
Services Occupations by Sex
Within the Services occupations in Darnestown, the most male-oriented occupations are Security & Protection (62.3%), and Firefighting & Prevention (62.3%), while the most female-oriented occupations are Healthcare Support (100.0%), Personal Care & Service (100.0%), and Security & Protection (37.7%).
| Occupation | Male | Female |
| Healthcare Support | 0 (0.0%) | 8 (100.0%) |
| Security & Protection | 43 (62.3%) | 26 (37.7%) |
| Firefighting & Prevention | 43 (62.3%) | 26 (37.7%) |
| Law Enforcement | 0 (0.0%) | 0 (0.0%) |
| Food Preparation & Serving | 0 (0.0%) | 0 (0.0%) |
| Cleaning & Maintenance | 0 (0.0%) | 0 (0.0%) |
| Personal Care & Service | 0 (0.0%) | 97 (100.0%) |
| Total (Category) | 43 (24.7%) | 131 (75.3%) |
| Total (Overall) | 1,717 (45.7%) | 2,037 (54.3%) |
Sales and Office Occupations
The most common Sales and Office occupations in Darnestown are Sales & Related (494 | 13.2%), and Office & Administration (287 | 7.6%).
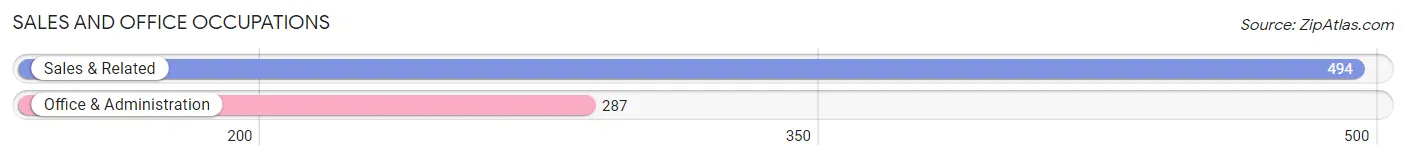
Sales and Office Occupations by Sex
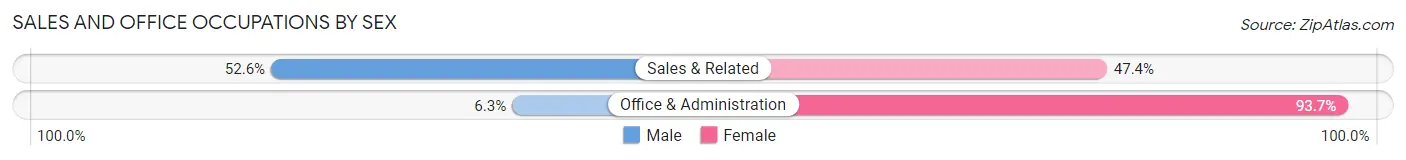
| Occupation | Male | Female |
| Sales & Related | 260 (52.6%) | 234 (47.4%) |
| Office & Administration | 18 (6.3%) | 269 (93.7%) |
| Total (Category) | 278 (35.6%) | 503 (64.4%) |
| Total (Overall) | 1,717 (45.7%) | 2,037 (54.3%) |
Natural Resources, Construction and Maintenance Occupations
The most common Natural Resources, Construction and Maintenance occupations in Darnestown are , and Construction & Extraction (18 | 0.5%).
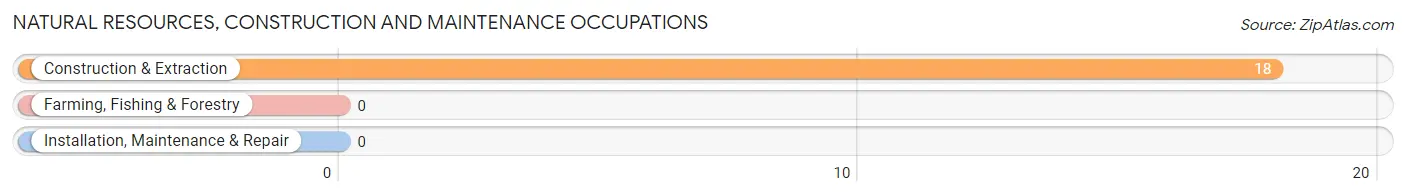
Natural Resources, Construction and Maintenance Occupations by Sex
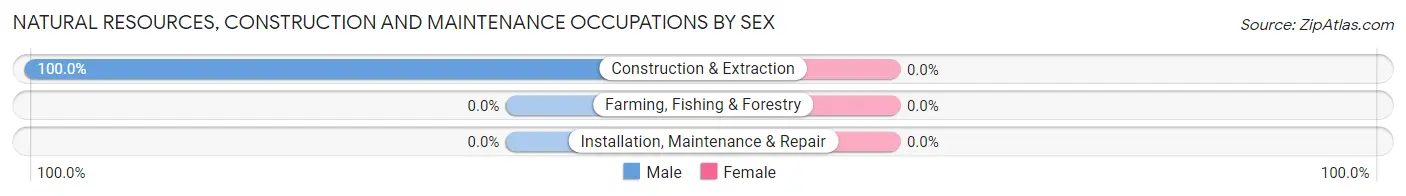
| Occupation | Male | Female |
| Farming, Fishing & Forestry | 0 (0.0%) | 0 (0.0%) |
| Construction & Extraction | 18 (100.0%) | 0 (0.0%) |
| Installation, Maintenance & Repair | 0 (0.0%) | 0 (0.0%) |
| Total (Category) | 18 (100.0%) | 0 (0.0%) |
| Total (Overall) | 1,717 (45.7%) | 2,037 (54.3%) |
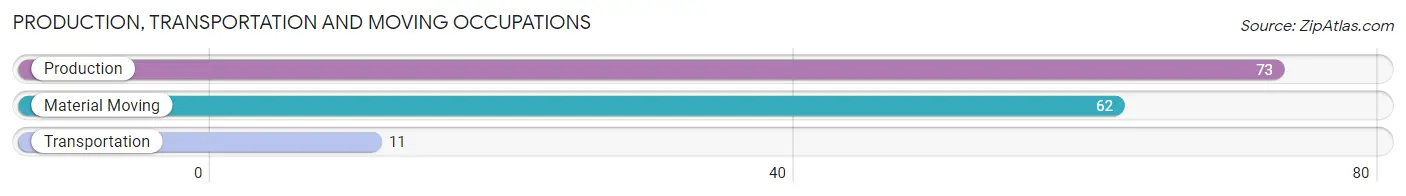
Production, Transportation and Moving Occupations
The most common Production, Transportation and Moving occupations in Darnestown are Production (73 | 1.9%), Material Moving (62 | 1.7%), and Transportation (11 | 0.3%).
Production, Transportation and Moving Occupations by Sex
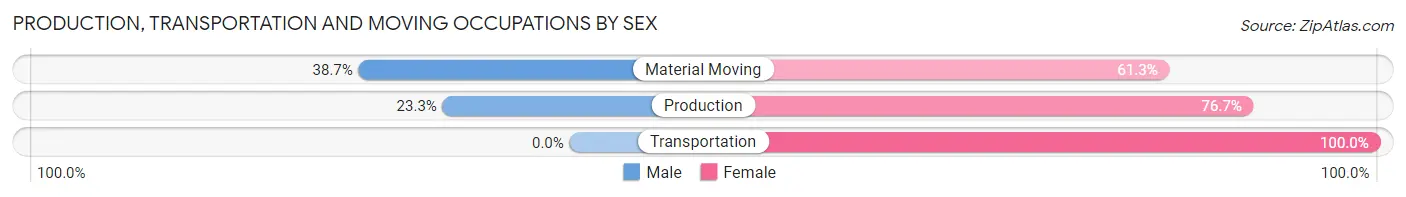
| Occupation | Male | Female |
| Production | 17 (23.3%) | 56 (76.7%) |
| Transportation | 0 (0.0%) | 11 (100.0%) |
| Material Moving | 24 (38.7%) | 38 (61.3%) |
| Total (Category) | 41 (28.1%) | 105 (71.9%) |
| Total (Overall) | 1,717 (45.7%) | 2,037 (54.3%) |
Employment Industries by Sex in Darnestown
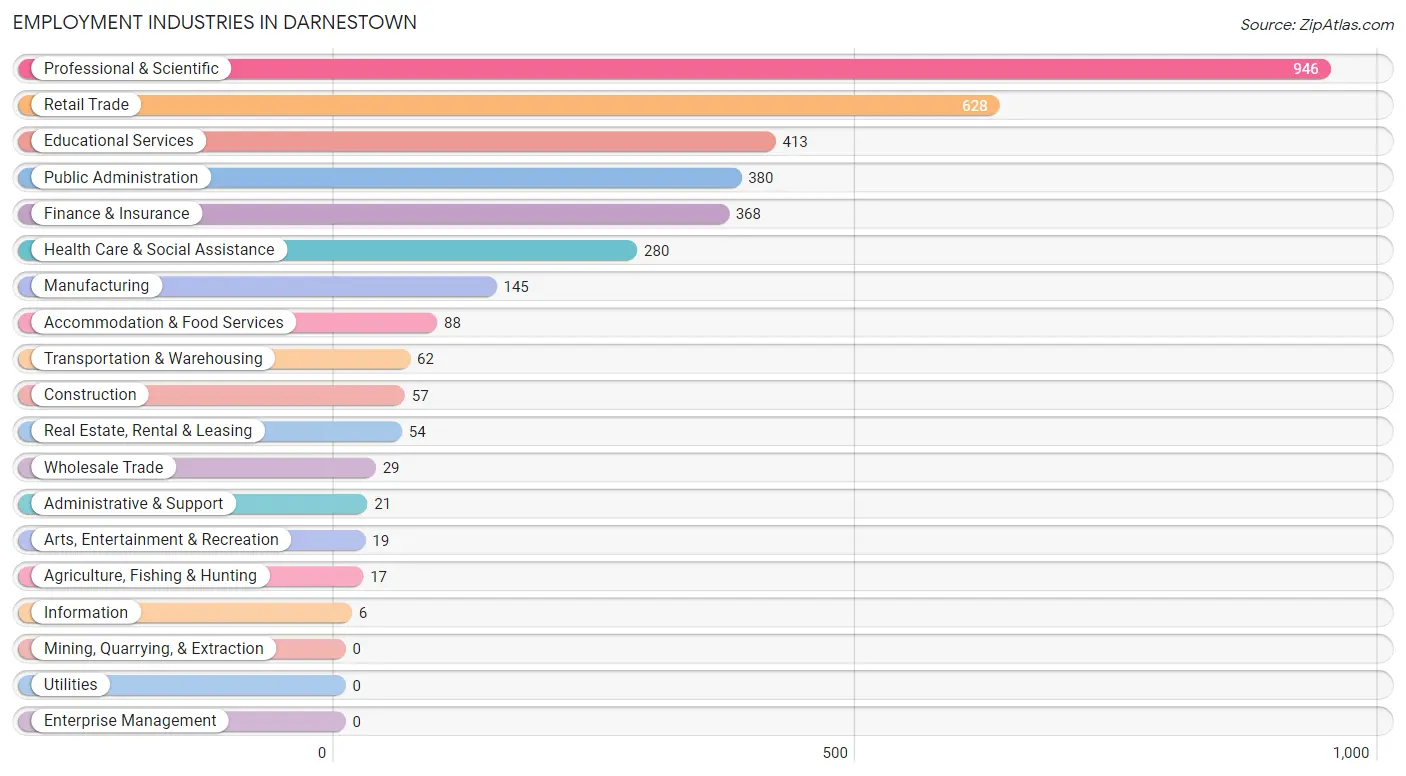
Employment Industries in Darnestown
The major employment industries in Darnestown include Professional & Scientific (946 | 25.2%), Retail Trade (628 | 16.7%), Educational Services (413 | 11.0%), Public Administration (380 | 10.1%), and Finance & Insurance (368 | 9.8%).
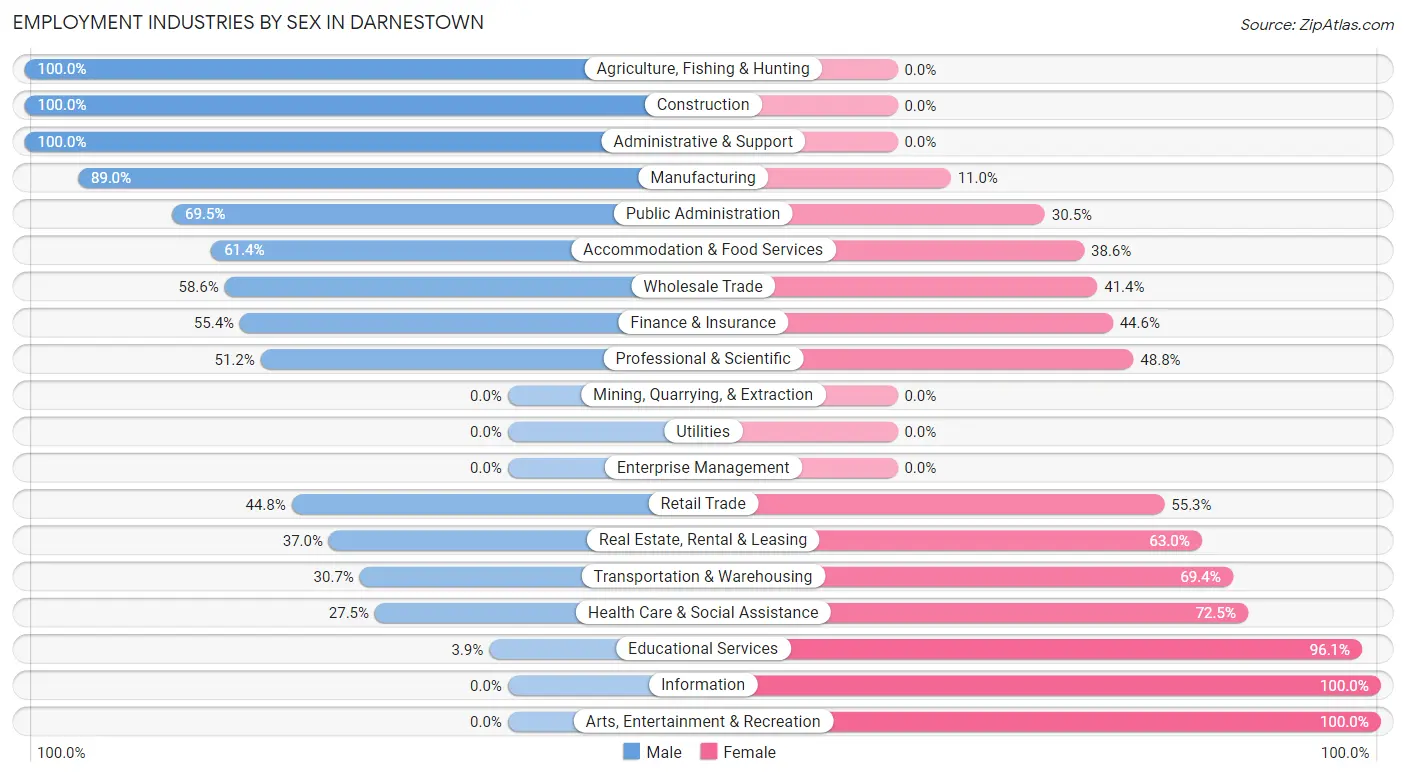
Employment Industries by Sex in Darnestown
The Darnestown industries that see more men than women are Agriculture, Fishing & Hunting (100.0%), Construction (100.0%), and Administrative & Support (100.0%), whereas the industries that tend to have a higher number of women are Information (100.0%), Arts, Entertainment & Recreation (100.0%), and Educational Services (96.1%).
| Industry | Male | Female |
| Agriculture, Fishing & Hunting | 17 (100.0%) | 0 (0.0%) |
| Mining, Quarrying, & Extraction | 0 (0.0%) | 0 (0.0%) |
| Construction | 57 (100.0%) | 0 (0.0%) |
| Manufacturing | 129 (89.0%) | 16 (11.0%) |
| Wholesale Trade | 17 (58.6%) | 12 (41.4%) |
| Retail Trade | 281 (44.8%) | 347 (55.2%) |
| Transportation & Warehousing | 19 (30.6%) | 43 (69.4%) |
| Utilities | 0 (0.0%) | 0 (0.0%) |
| Information | 0 (0.0%) | 6 (100.0%) |
| Finance & Insurance | 204 (55.4%) | 164 (44.6%) |
| Real Estate, Rental & Leasing | 20 (37.0%) | 34 (63.0%) |
| Professional & Scientific | 484 (51.2%) | 462 (48.8%) |
| Enterprise Management | 0 (0.0%) | 0 (0.0%) |
| Administrative & Support | 21 (100.0%) | 0 (0.0%) |
| Educational Services | 16 (3.9%) | 397 (96.1%) |
| Health Care & Social Assistance | 77 (27.5%) | 203 (72.5%) |
| Arts, Entertainment & Recreation | 0 (0.0%) | 19 (100.0%) |
| Accommodation & Food Services | 54 (61.4%) | 34 (38.6%) |
| Public Administration | 264 (69.5%) | 116 (30.5%) |
| Total | 1,717 (45.7%) | 2,037 (54.3%) |
Education in Darnestown
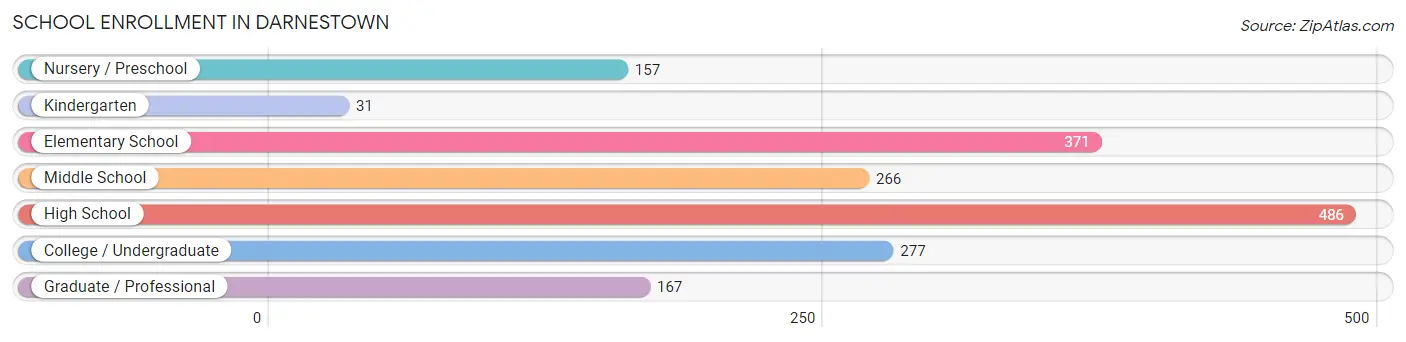
School Enrollment in Darnestown
The most common levels of schooling among the 1,755 students in Darnestown are high school (486 | 27.7%), elementary school (371 | 21.1%), and college / undergraduate (277 | 15.8%).
| School Level | # Students | % Students |
| Nursery / Preschool | 157 | 8.9% |
| Kindergarten | 31 | 1.8% |
| Elementary School | 371 | 21.1% |
| Middle School | 266 | 15.2% |
| High School | 486 | 27.7% |
| College / Undergraduate | 277 | 15.8% |
| Graduate / Professional | 167 | 9.5% |
| Total | 1,755 | 100.0% |
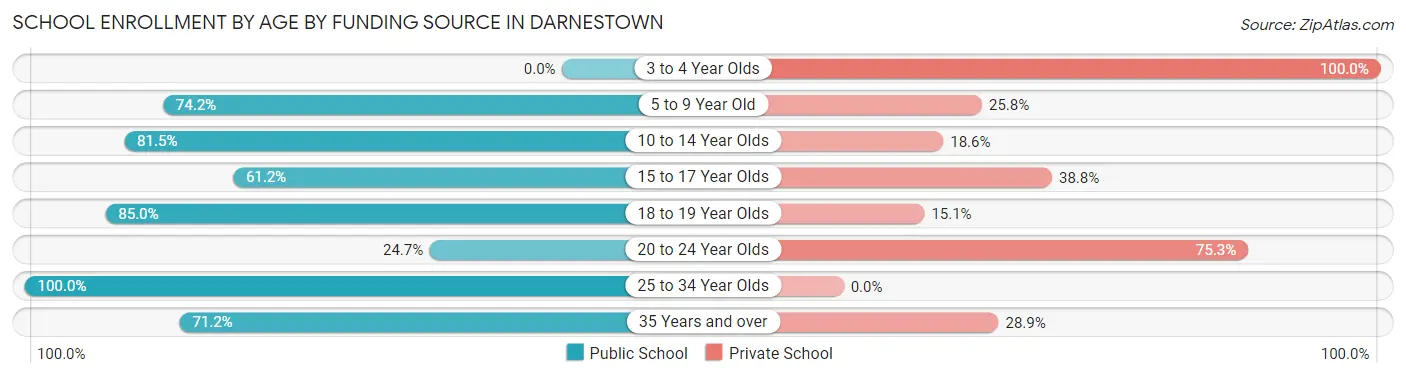
School Enrollment by Age by Funding Source in Darnestown
Out of a total of 1,755 students who are enrolled in schools in Darnestown, 641 (36.5%) attend a private institution, while the remaining 1,114 (63.5%) are enrolled in public schools. The age group of 3 to 4 year olds has the highest likelihood of being enrolled in private schools, with 102 (100.0% in the age bracket) enrolled. Conversely, the age group of 25 to 34 year olds has the lowest likelihood of being enrolled in a private school, with 26 (100.0% in the age bracket) attending a public institution.
| Age Bracket | Public School | Private School |
| 3 to 4 Year Olds | 0 (0.0%) | 102 (100.0%) |
| 5 to 9 Year Old | 288 (74.2%) | 100 (25.8%) |
| 10 to 14 Year Olds | 303 (81.5%) | 69 (18.5%) |
| 15 to 17 Year Olds | 246 (61.2%) | 156 (38.8%) |
| 18 to 19 Year Olds | 158 (85.0%) | 28 (15.0%) |
| 20 to 24 Year Olds | 56 (24.7%) | 171 (75.3%) |
| 25 to 34 Year Olds | 26 (100.0%) | 0 (0.0%) |
| 35 Years and over | 37 (71.2%) | 15 (28.8%) |
| Total | 1,114 (63.5%) | 641 (36.5%) |
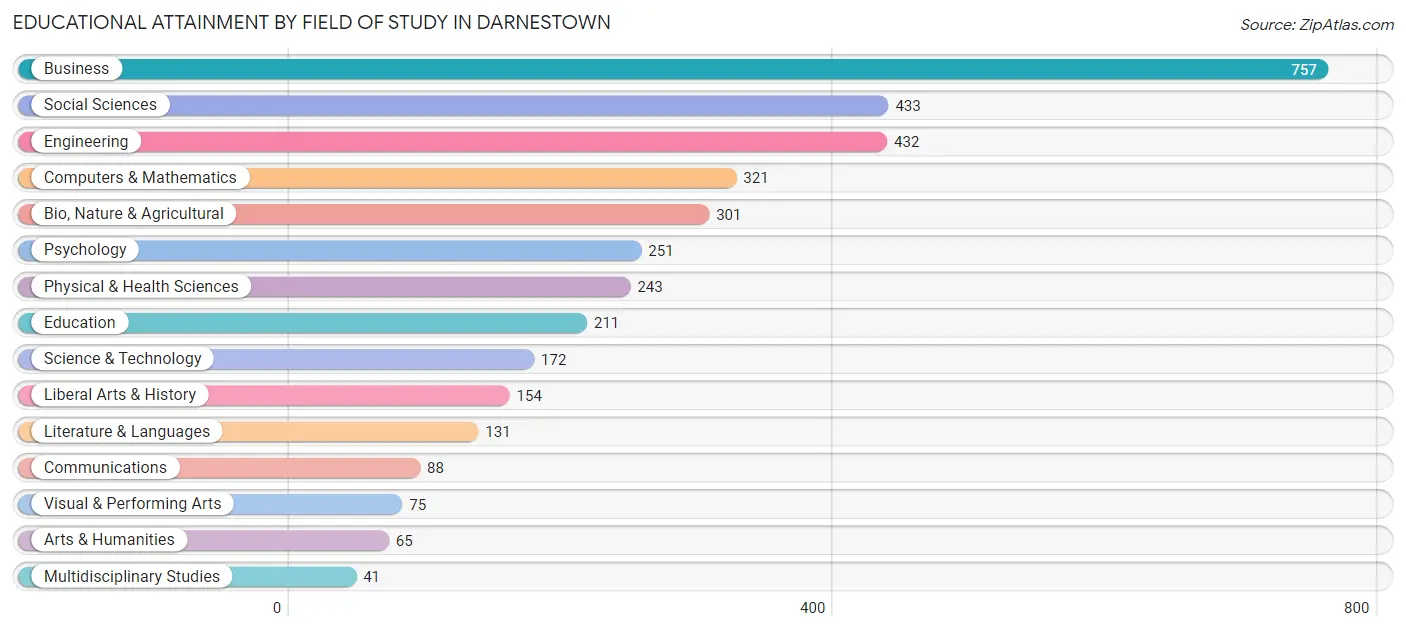
Educational Attainment by Field of Study in Darnestown
Business (757 | 20.6%), social sciences (433 | 11.8%), engineering (432 | 11.8%), computers & mathematics (321 | 8.7%), and bio, nature & agricultural (301 | 8.2%) are the most common fields of study among 3,675 individuals in Darnestown who have obtained a bachelor's degree or higher.
| Field of Study | # Graduates | % Graduates |
| Computers & Mathematics | 321 | 8.7% |
| Bio, Nature & Agricultural | 301 | 8.2% |
| Physical & Health Sciences | 243 | 6.6% |
| Psychology | 251 | 6.8% |
| Social Sciences | 433 | 11.8% |
| Engineering | 432 | 11.8% |
| Multidisciplinary Studies | 41 | 1.1% |
| Science & Technology | 172 | 4.7% |
| Business | 757 | 20.6% |
| Education | 211 | 5.7% |
| Literature & Languages | 131 | 3.6% |
| Liberal Arts & History | 154 | 4.2% |
| Visual & Performing Arts | 75 | 2.0% |
| Communications | 88 | 2.4% |
| Arts & Humanities | 65 | 1.8% |
| Total | 3,675 | 100.0% |
Transportation & Commute in Darnestown
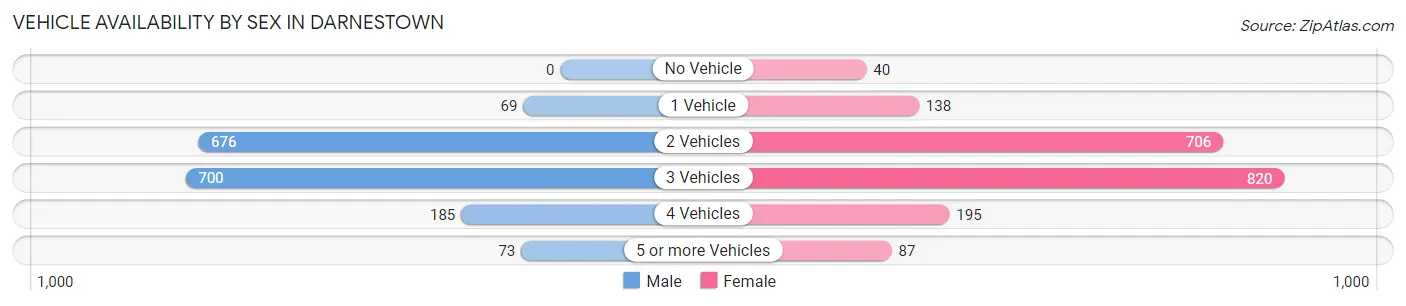
Vehicle Availability by Sex in Darnestown
The most prevalent vehicle ownership categories in Darnestown are males with 3 vehicles (700, accounting for 41.1%) and females with 3 vehicles (820, making up 35.2%).
| Vehicles Available | Male | Female |
| No Vehicle | 0 (0.0%) | 40 (2.0%) |
| 1 Vehicle | 69 (4.1%) | 138 (7.0%) |
| 2 Vehicles | 676 (39.7%) | 706 (35.5%) |
| 3 Vehicles | 700 (41.1%) | 820 (41.3%) |
| 4 Vehicles | 185 (10.9%) | 195 (9.8%) |
| 5 or more Vehicles | 73 (4.3%) | 87 (4.4%) |
| Total | 1,703 (100.0%) | 1,986 (100.0%) |
Commute Time in Darnestown
The most frequently occuring commute durations in Darnestown are 60 to 89 minutes (576 commuters, 21.4%), 45 to 59 minutes (323 commuters, 12.0%), and 25 to 29 minutes (320 commuters, 11.9%).
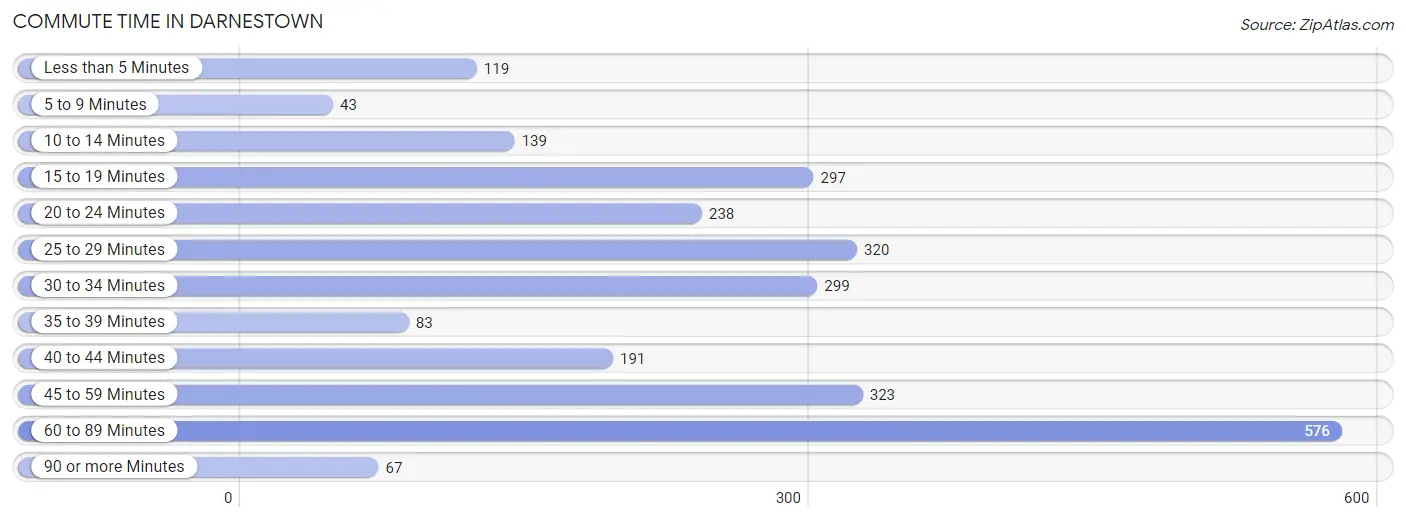
| Commute Time | # Commuters | % Commuters |
| Less than 5 Minutes | 119 | 4.4% |
| 5 to 9 Minutes | 43 | 1.6% |
| 10 to 14 Minutes | 139 | 5.2% |
| 15 to 19 Minutes | 297 | 11.0% |
| 20 to 24 Minutes | 238 | 8.8% |
| 25 to 29 Minutes | 320 | 11.9% |
| 30 to 34 Minutes | 299 | 11.1% |
| 35 to 39 Minutes | 83 | 3.1% |
| 40 to 44 Minutes | 191 | 7.1% |
| 45 to 59 Minutes | 323 | 12.0% |
| 60 to 89 Minutes | 576 | 21.4% |
| 90 or more Minutes | 67 | 2.5% |
Commute Time by Sex in Darnestown
The most common commute times in Darnestown are 45 to 59 minutes (249 commuters, 20.0%) for males and 60 to 89 minutes (386 commuters, 26.7%) for females.
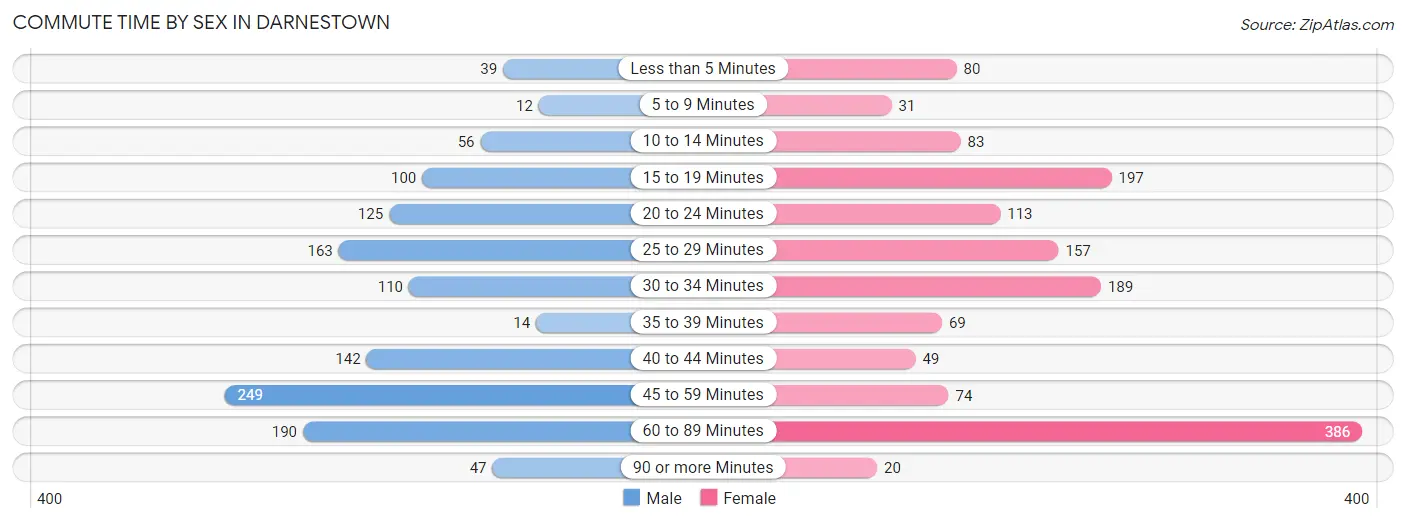
| Commute Time | Male | Female |
| Less than 5 Minutes | 39 (3.1%) | 80 (5.5%) |
| 5 to 9 Minutes | 12 (1.0%) | 31 (2.1%) |
| 10 to 14 Minutes | 56 (4.5%) | 83 (5.7%) |
| 15 to 19 Minutes | 100 (8.0%) | 197 (13.6%) |
| 20 to 24 Minutes | 125 (10.0%) | 113 (7.8%) |
| 25 to 29 Minutes | 163 (13.1%) | 157 (10.8%) |
| 30 to 34 Minutes | 110 (8.8%) | 189 (13.1%) |
| 35 to 39 Minutes | 14 (1.1%) | 69 (4.8%) |
| 40 to 44 Minutes | 142 (11.4%) | 49 (3.4%) |
| 45 to 59 Minutes | 249 (20.0%) | 74 (5.1%) |
| 60 to 89 Minutes | 190 (15.2%) | 386 (26.7%) |
| 90 or more Minutes | 47 (3.8%) | 20 (1.4%) |
Time of Departure to Work by Sex in Darnestown
The most frequent times of departure to work in Darnestown are 7:00 AM to 7:29 AM (229, 18.4%) for males and 7:00 AM to 7:29 AM (297, 20.5%) for females.
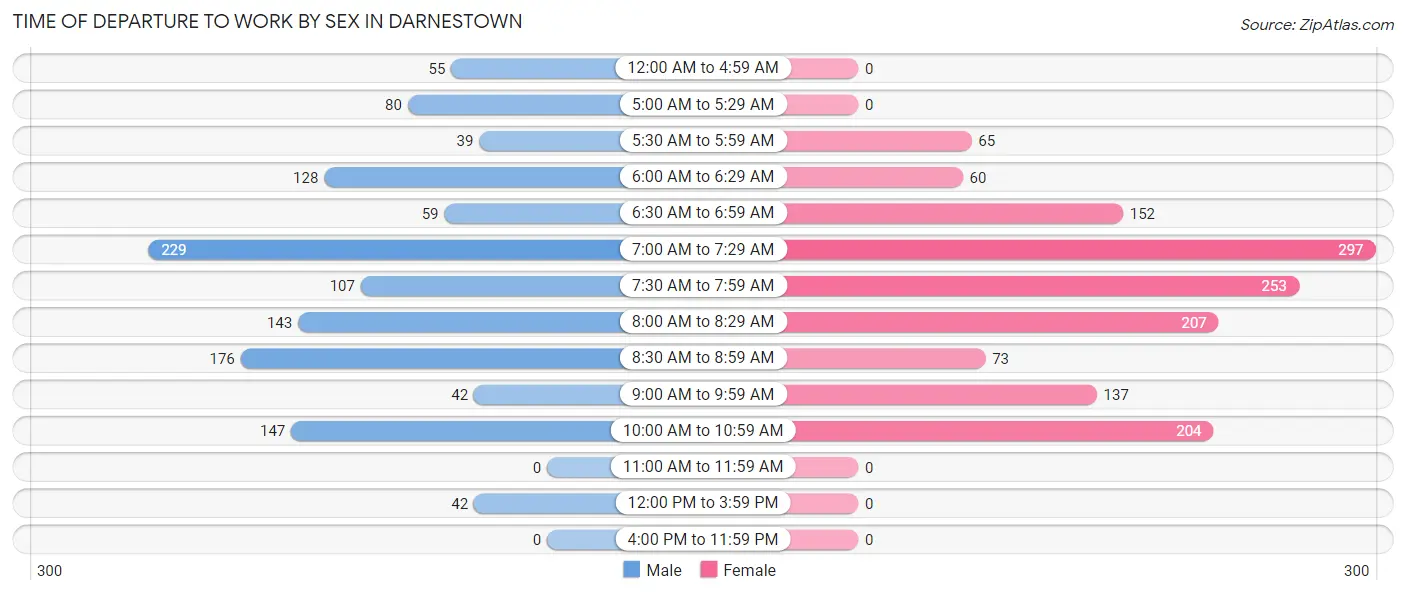
| Time of Departure | Male | Female |
| 12:00 AM to 4:59 AM | 55 (4.4%) | 0 (0.0%) |
| 5:00 AM to 5:29 AM | 80 (6.4%) | 0 (0.0%) |
| 5:30 AM to 5:59 AM | 39 (3.1%) | 65 (4.5%) |
| 6:00 AM to 6:29 AM | 128 (10.3%) | 60 (4.1%) |
| 6:30 AM to 6:59 AM | 59 (4.7%) | 152 (10.5%) |
| 7:00 AM to 7:29 AM | 229 (18.4%) | 297 (20.5%) |
| 7:30 AM to 7:59 AM | 107 (8.6%) | 253 (17.5%) |
| 8:00 AM to 8:29 AM | 143 (11.5%) | 207 (14.3%) |
| 8:30 AM to 8:59 AM | 176 (14.1%) | 73 (5.0%) |
| 9:00 AM to 9:59 AM | 42 (3.4%) | 137 (9.5%) |
| 10:00 AM to 10:59 AM | 147 (11.8%) | 204 (14.1%) |
| 11:00 AM to 11:59 AM | 0 (0.0%) | 0 (0.0%) |
| 12:00 PM to 3:59 PM | 42 (3.4%) | 0 (0.0%) |
| 4:00 PM to 11:59 PM | 0 (0.0%) | 0 (0.0%) |
| Total | 1,247 (100.0%) | 1,448 (100.0%) |
Housing Occupancy in Darnestown
Occupancy by Ownership in Darnestown
Of the total 2,288 dwellings in Darnestown, owner-occupied units account for 2,140 (93.5%), while renter-occupied units make up 148 (6.5%).
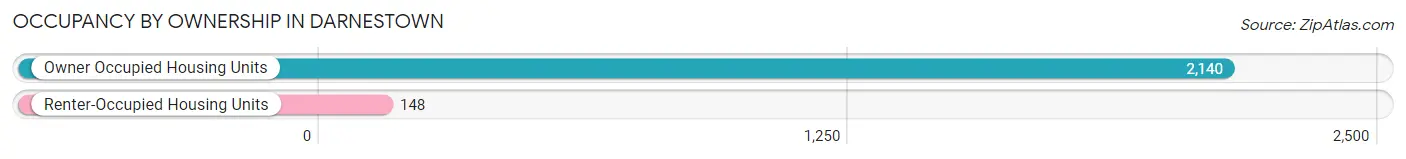
| Occupancy | # Housing Units | % Housing Units |
| Owner Occupied Housing Units | 2,140 | 93.5% |
| Renter-Occupied Housing Units | 148 | 6.5% |
| Total Occupied Housing Units | 2,288 | 100.0% |
Occupancy by Household Size in Darnestown
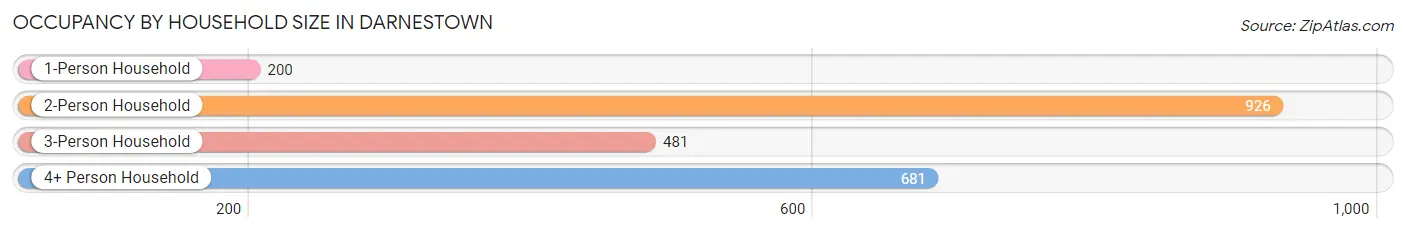
| Household Size | # Housing Units | % Housing Units |
| 1-Person Household | 200 | 8.7% |
| 2-Person Household | 926 | 40.5% |
| 3-Person Household | 481 | 21.0% |
| 4+ Person Household | 681 | 29.8% |
| Total Housing Units | 2,288 | 100.0% |
Occupancy by Ownership by Household Size in Darnestown
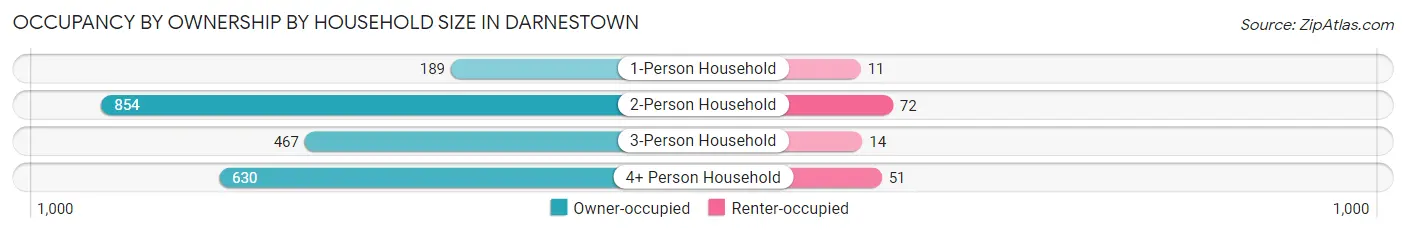
| Household Size | Owner-occupied | Renter-occupied |
| 1-Person Household | 189 (94.5%) | 11 (5.5%) |
| 2-Person Household | 854 (92.2%) | 72 (7.8%) |
| 3-Person Household | 467 (97.1%) | 14 (2.9%) |
| 4+ Person Household | 630 (92.5%) | 51 (7.5%) |
| Total Housing Units | 2,140 (93.5%) | 148 (6.5%) |
Occupancy by Educational Attainment in Darnestown
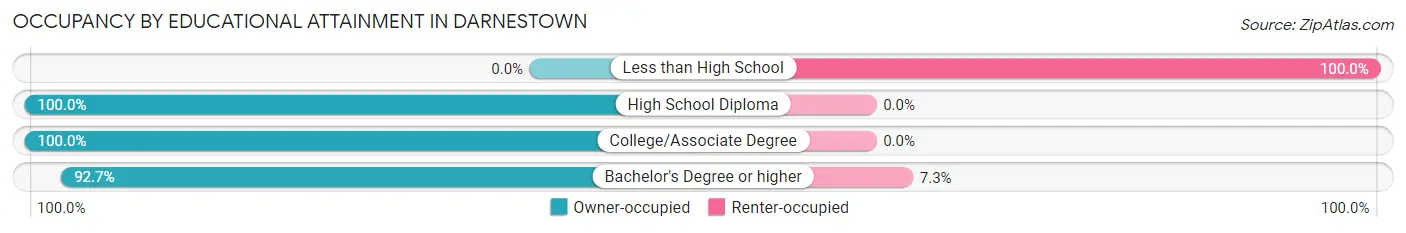
| Household Size | Owner-occupied | Renter-occupied |
| Less than High School | 0 (0.0%) | 13 (100.0%) |
| High School Diploma | 191 (100.0%) | 0 (0.0%) |
| College/Associate Degree | 228 (100.0%) | 0 (0.0%) |
| Bachelor's Degree or higher | 1,721 (92.7%) | 135 (7.3%) |
Occupancy by Age of Householder in Darnestown
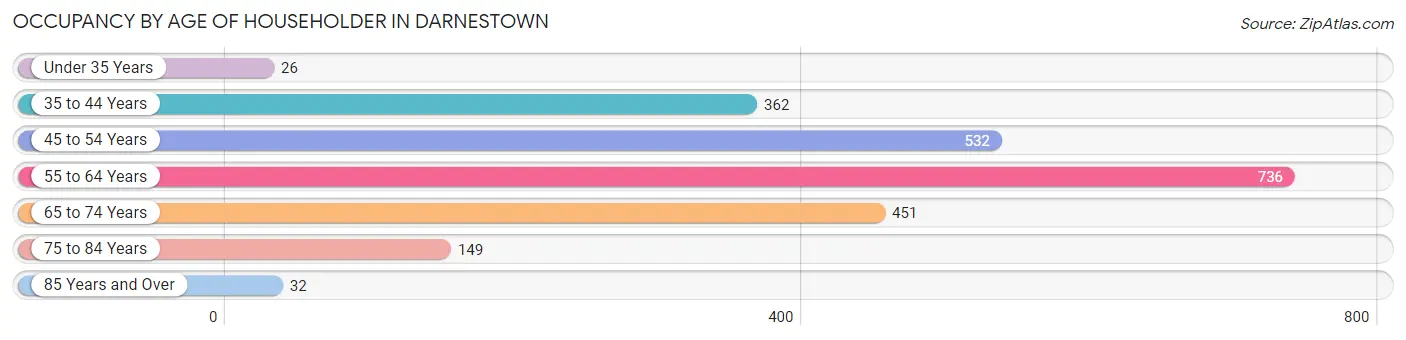
| Age Bracket | # Households | % Households |
| Under 35 Years | 26 | 1.1% |
| 35 to 44 Years | 362 | 15.8% |
| 45 to 54 Years | 532 | 23.3% |
| 55 to 64 Years | 736 | 32.2% |
| 65 to 74 Years | 451 | 19.7% |
| 75 to 84 Years | 149 | 6.5% |
| 85 Years and Over | 32 | 1.4% |
| Total | 2,288 | 100.0% |
Housing Finances in Darnestown
Median Income by Occupancy in Darnestown
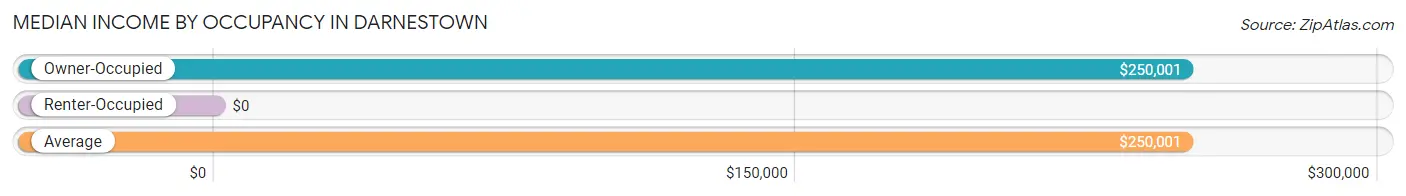
| Occupancy Type | # Households | Median Income |
| Owner-Occupied | 2,140 (93.5%) | $250,001 |
| Renter-Occupied | 148 (6.5%) | $0 |
| Average | 2,288 (100.0%) | $250,001 |
Occupancy by Householder Income Bracket in Darnestown
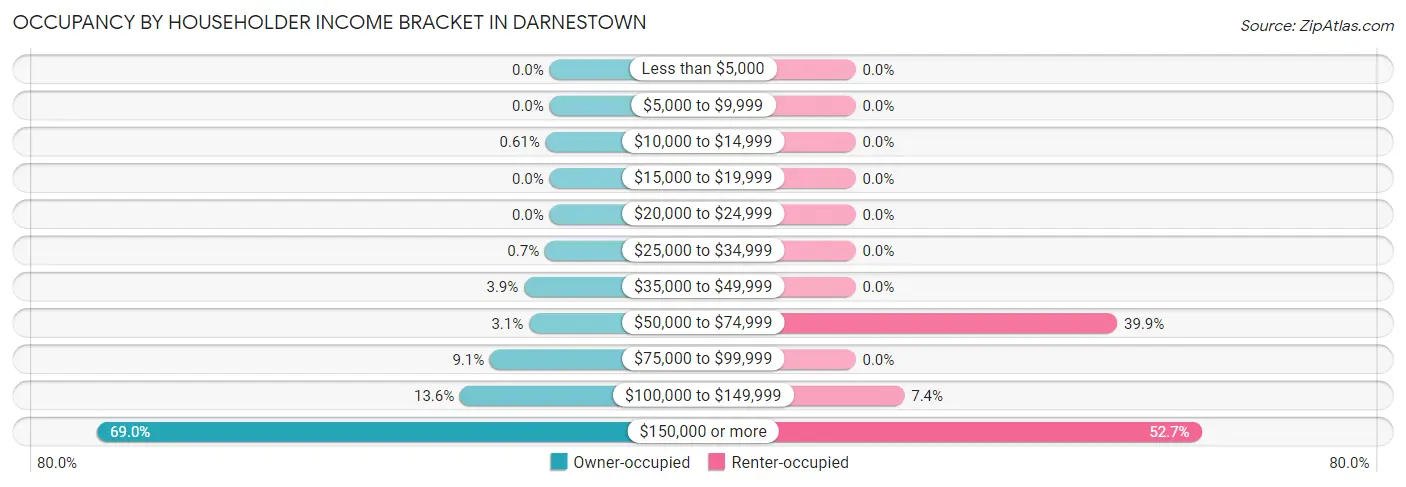
| Income Bracket | Owner-occupied | Renter-occupied |
| Less than $5,000 | 0 (0.0%) | 0 (0.0%) |
| $5,000 to $9,999 | 0 (0.0%) | 0 (0.0%) |
| $10,000 to $14,999 | 13 (0.6%) | 0 (0.0%) |
| $15,000 to $19,999 | 0 (0.0%) | 0 (0.0%) |
| $20,000 to $24,999 | 0 (0.0%) | 0 (0.0%) |
| $25,000 to $34,999 | 15 (0.7%) | 0 (0.0%) |
| $35,000 to $49,999 | 83 (3.9%) | 0 (0.0%) |
| $50,000 to $74,999 | 67 (3.1%) | 59 (39.9%) |
| $75,000 to $99,999 | 194 (9.1%) | 0 (0.0%) |
| $100,000 to $149,999 | 292 (13.6%) | 11 (7.4%) |
| $150,000 or more | 1,476 (69.0%) | 78 (52.7%) |
| Total | 2,140 (100.0%) | 148 (100.0%) |
Monthly Housing Cost Tiers in Darnestown
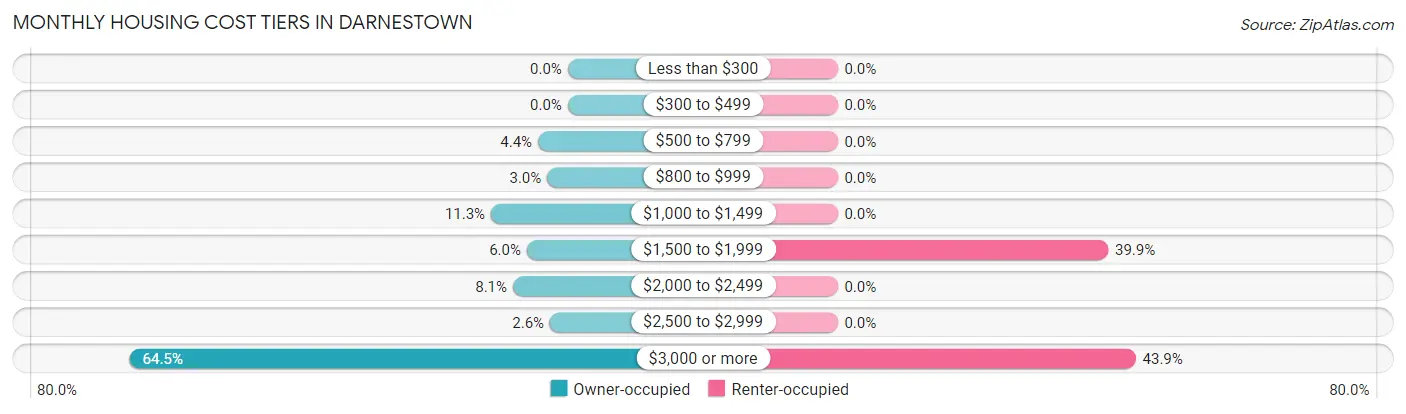
| Monthly Cost | Owner-occupied | Renter-occupied |
| Less than $300 | 0 (0.0%) | 0 (0.0%) |
| $300 to $499 | 0 (0.0%) | 0 (0.0%) |
| $500 to $799 | 94 (4.4%) | 0 (0.0%) |
| $800 to $999 | 65 (3.0%) | 0 (0.0%) |
| $1,000 to $1,499 | 242 (11.3%) | 0 (0.0%) |
| $1,500 to $1,999 | 129 (6.0%) | 59 (39.9%) |
| $2,000 to $2,499 | 173 (8.1%) | 0 (0.0%) |
| $2,500 to $2,999 | 56 (2.6%) | 0 (0.0%) |
| $3,000 or more | 1,381 (64.5%) | 65 (43.9%) |
| Total | 2,140 (100.0%) | 148 (100.0%) |
Physical Housing Characteristics in Darnestown
Housing Structures in Darnestown
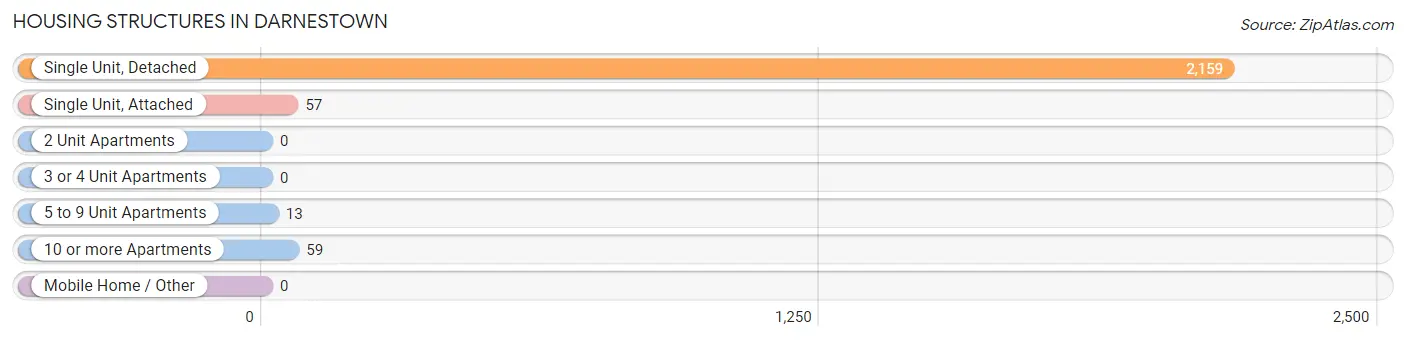
| Structure Type | # Housing Units | % Housing Units |
| Single Unit, Detached | 2,159 | 94.4% |
| Single Unit, Attached | 57 | 2.5% |
| 2 Unit Apartments | 0 | 0.0% |
| 3 or 4 Unit Apartments | 0 | 0.0% |
| 5 to 9 Unit Apartments | 13 | 0.6% |
| 10 or more Apartments | 59 | 2.6% |
| Mobile Home / Other | 0 | 0.0% |
| Total | 2,288 | 100.0% |
Housing Structures by Occupancy in Darnestown
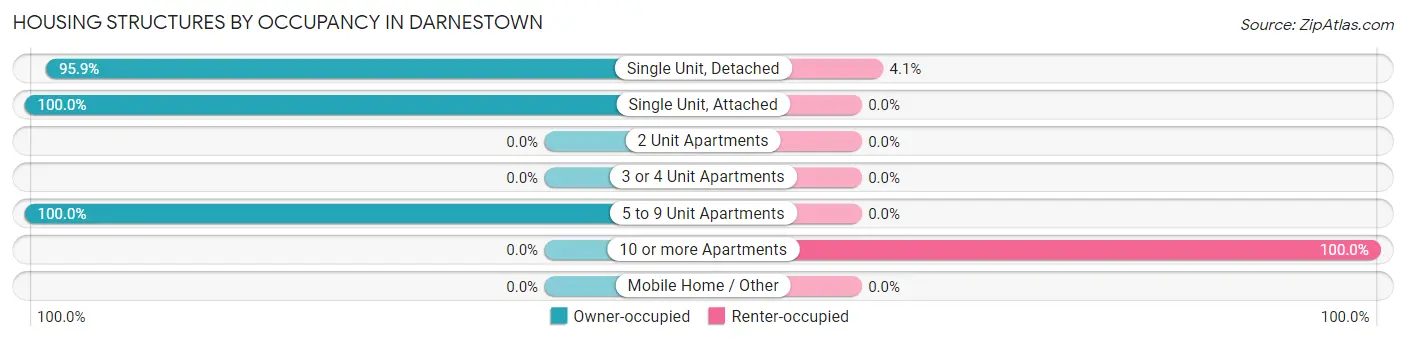
| Structure Type | Owner-occupied | Renter-occupied |
| Single Unit, Detached | 2,070 (95.9%) | 89 (4.1%) |
| Single Unit, Attached | 57 (100.0%) | 0 (0.0%) |
| 2 Unit Apartments | 0 (0.0%) | 0 (0.0%) |
| 3 or 4 Unit Apartments | 0 (0.0%) | 0 (0.0%) |
| 5 to 9 Unit Apartments | 13 (100.0%) | 0 (0.0%) |
| 10 or more Apartments | 0 (0.0%) | 59 (100.0%) |
| Mobile Home / Other | 0 (0.0%) | 0 (0.0%) |
| Total | 2,140 (93.5%) | 148 (6.5%) |
Housing Structures by Number of Rooms in Darnestown
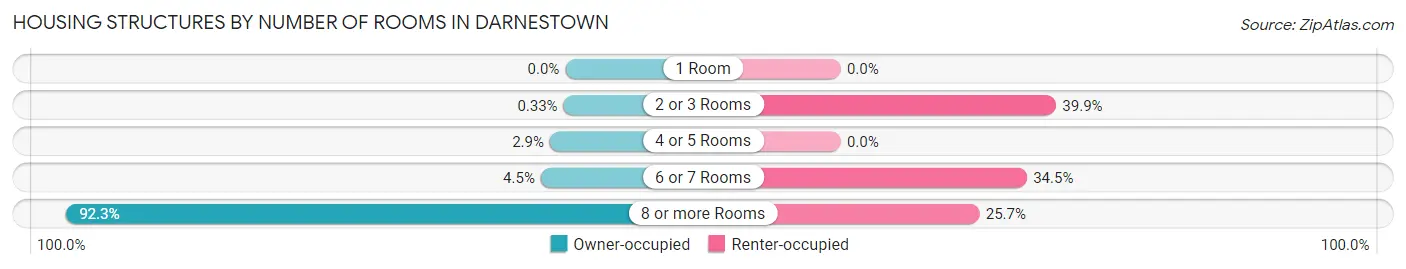
| Number of Rooms | Owner-occupied | Renter-occupied |
| 1 Room | 0 (0.0%) | 0 (0.0%) |
| 2 or 3 Rooms | 7 (0.3%) | 59 (39.9%) |
| 4 or 5 Rooms | 61 (2.9%) | 0 (0.0%) |
| 6 or 7 Rooms | 97 (4.5%) | 51 (34.5%) |
| 8 or more Rooms | 1,975 (92.3%) | 38 (25.7%) |
| Total | 2,140 (100.0%) | 148 (100.0%) |
Housing Structure by Heating Type in Darnestown
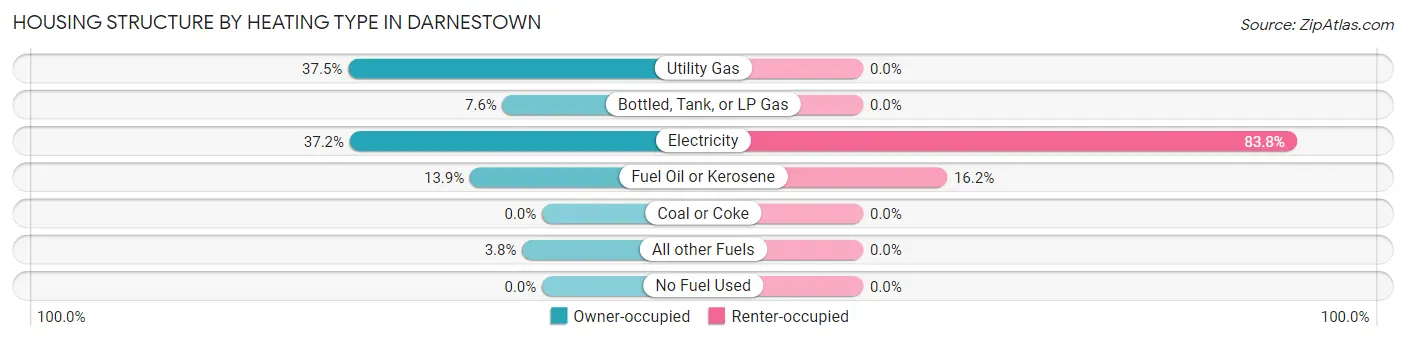
| Heating Type | Owner-occupied | Renter-occupied |
| Utility Gas | 802 (37.5%) | 0 (0.0%) |
| Bottled, Tank, or LP Gas | 163 (7.6%) | 0 (0.0%) |
| Electricity | 795 (37.1%) | 124 (83.8%) |
| Fuel Oil or Kerosene | 298 (13.9%) | 24 (16.2%) |
| Coal or Coke | 0 (0.0%) | 0 (0.0%) |
| All other Fuels | 82 (3.8%) | 0 (0.0%) |
| No Fuel Used | 0 (0.0%) | 0 (0.0%) |
| Total | 2,140 (100.0%) | 148 (100.0%) |
Household Vehicle Usage in Darnestown
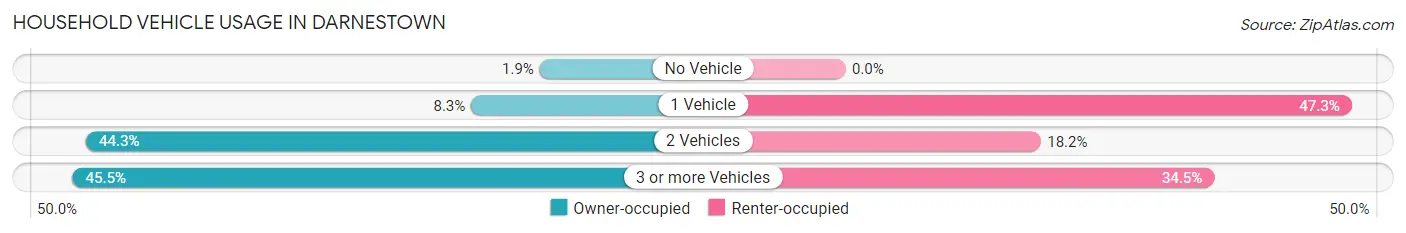
| Vehicles per Household | Owner-occupied | Renter-occupied |
| No Vehicle | 41 (1.9%) | 0 (0.0%) |
| 1 Vehicle | 178 (8.3%) | 70 (47.3%) |
| 2 Vehicles | 947 (44.3%) | 27 (18.2%) |
| 3 or more Vehicles | 974 (45.5%) | 51 (34.5%) |
| Total | 2,140 (100.0%) | 148 (100.0%) |
Real Estate & Mortgages in Darnestown
Real Estate and Mortgage Overview in Darnestown
| Characteristic | Without Mortgage | With Mortgage |
| Housing Units | 442 | 1,698 |
| Median Property Value | $850,700 | $920,800 |
| Median Household Income | $142,237 | $1,257 |
| Monthly Housing Costs | $1,140 | $1,381 |
| Real Estate Taxes | $7,196 | $30 |
Property Value by Mortgage Status in Darnestown
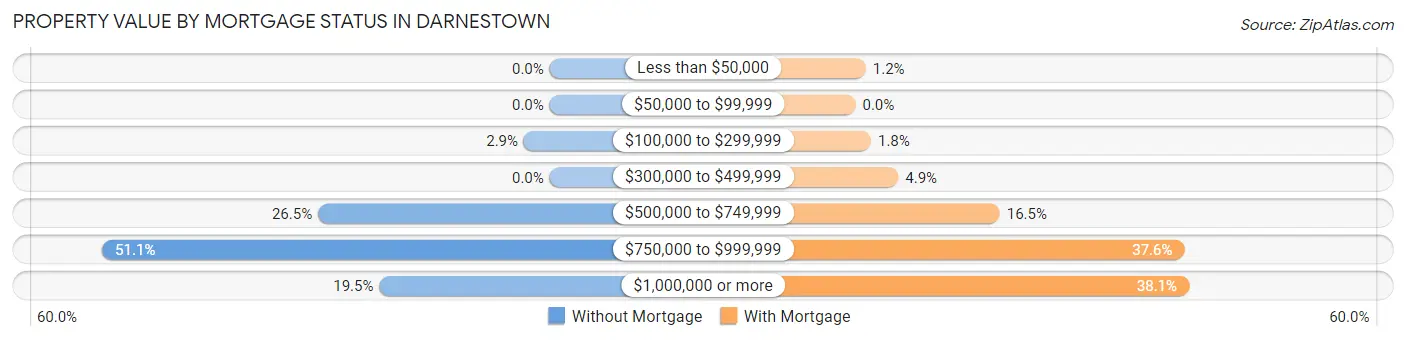
| Property Value | Without Mortgage | With Mortgage |
| Less than $50,000 | 0 (0.0%) | 20 (1.2%) |
| $50,000 to $99,999 | 0 (0.0%) | 0 (0.0%) |
| $100,000 to $299,999 | 13 (2.9%) | 30 (1.8%) |
| $300,000 to $499,999 | 0 (0.0%) | 83 (4.9%) |
| $500,000 to $749,999 | 117 (26.5%) | 280 (16.5%) |
| $750,000 to $999,999 | 226 (51.1%) | 638 (37.6%) |
| $1,000,000 or more | 86 (19.5%) | 647 (38.1%) |
| Total | 442 (100.0%) | 1,698 (100.0%) |
Household Income by Mortgage Status in Darnestown
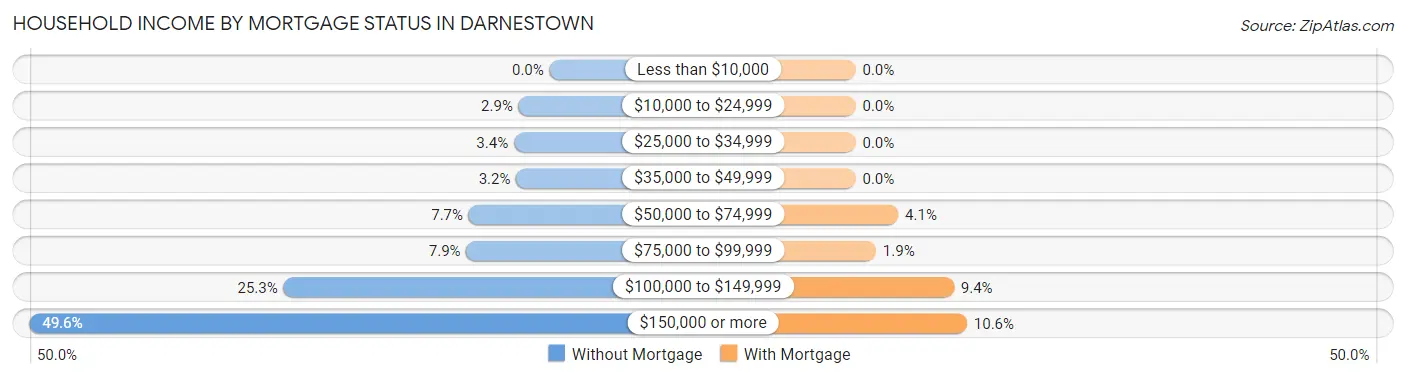
| Household Income | Without Mortgage | With Mortgage |
| Less than $10,000 | 0 (0.0%) | 0 (0.0%) |
| $10,000 to $24,999 | 13 (2.9%) | 0 (0.0%) |
| $25,000 to $34,999 | 15 (3.4%) | 0 (0.0%) |
| $35,000 to $49,999 | 14 (3.2%) | 0 (0.0%) |
| $50,000 to $74,999 | 34 (7.7%) | 69 (4.1%) |
| $75,000 to $99,999 | 35 (7.9%) | 33 (1.9%) |
| $100,000 to $149,999 | 112 (25.3%) | 159 (9.4%) |
| $150,000 or more | 219 (49.5%) | 180 (10.6%) |
| Total | 442 (100.0%) | 1,698 (100.0%) |
Property Value to Household Income Ratio in Darnestown
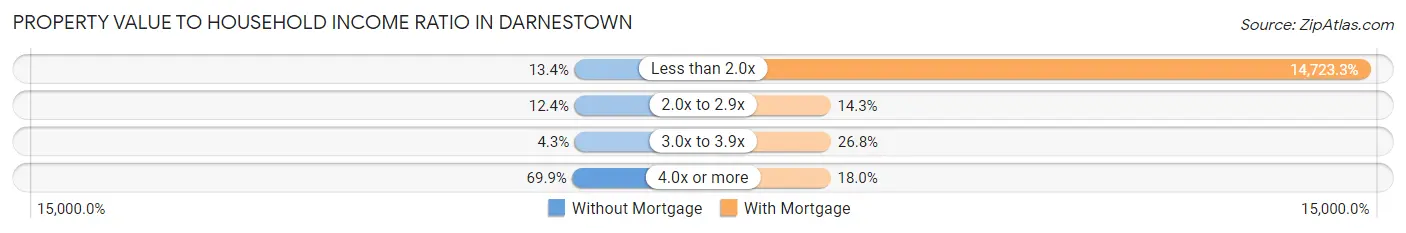
| Value-to-Income Ratio | Without Mortgage | With Mortgage |
| Less than 2.0x | 59 (13.4%) | 250,001 (14,723.3%) |
| 2.0x to 2.9x | 55 (12.4%) | 243 (14.3%) |
| 3.0x to 3.9x | 19 (4.3%) | 455 (26.8%) |
| 4.0x or more | 309 (69.9%) | 305 (18.0%) |
| Total | 442 (100.0%) | 1,698 (100.0%) |
Real Estate Taxes by Mortgage Status in Darnestown
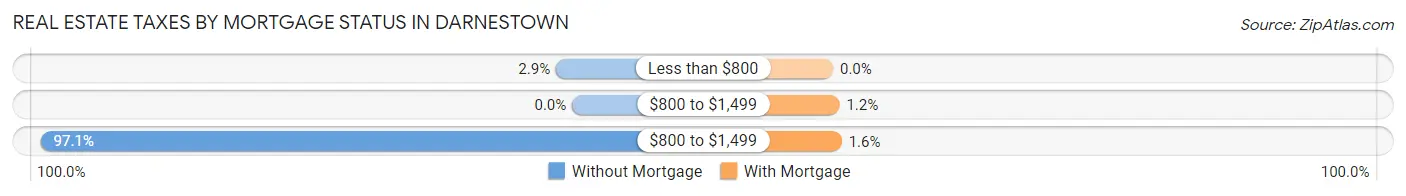
| Property Taxes | Without Mortgage | With Mortgage |
| Less than $800 | 13 (2.9%) | 0 (0.0%) |
| $800 to $1,499 | 0 (0.0%) | 20 (1.2%) |
| $800 to $1,499 | 429 (97.1%) | 27 (1.6%) |
| Total | 442 (100.0%) | 1,698 (100.0%) |
Health & Disability in Darnestown
Health Insurance Coverage by Age in Darnestown
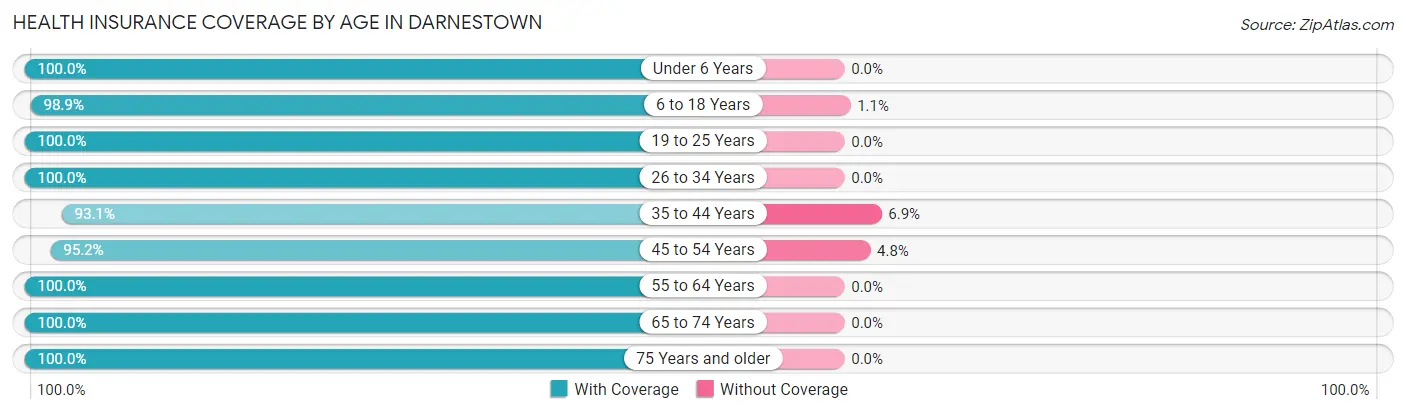
| Age Bracket | With Coverage | Without Coverage |
| Under 6 Years | 413 (100.0%) | 0 (0.0%) |
| 6 to 18 Years | 1,153 (98.9%) | 13 (1.1%) |
| 19 to 25 Years | 547 (100.0%) | 0 (0.0%) |
| 26 to 34 Years | 198 (100.0%) | 0 (0.0%) |
| 35 to 44 Years | 620 (93.1%) | 46 (6.9%) |
| 45 to 54 Years | 1,030 (95.2%) | 52 (4.8%) |
| 55 to 64 Years | 1,315 (100.0%) | 0 (0.0%) |
| 65 to 74 Years | 850 (100.0%) | 0 (0.0%) |
| 75 Years and older | 396 (100.0%) | 0 (0.0%) |
| Total | 6,522 (98.3%) | 111 (1.7%) |
Health Insurance Coverage by Citizenship Status in Darnestown
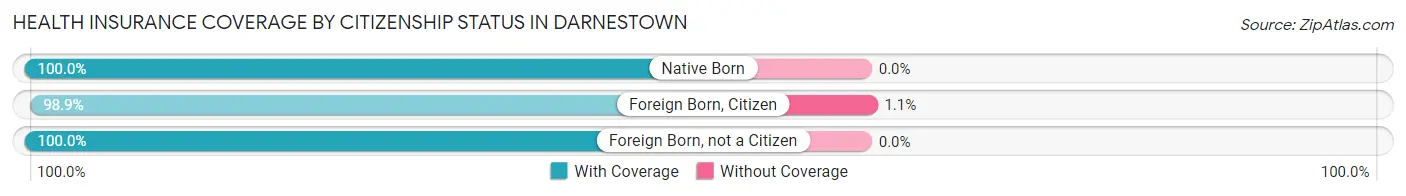
| Citizenship Status | With Coverage | Without Coverage |
| Native Born | 413 (100.0%) | 0 (0.0%) |
| Foreign Born, Citizen | 1,153 (98.9%) | 13 (1.1%) |
| Foreign Born, not a Citizen | 547 (100.0%) | 0 (0.0%) |
Health Insurance Coverage by Household Income in Darnestown
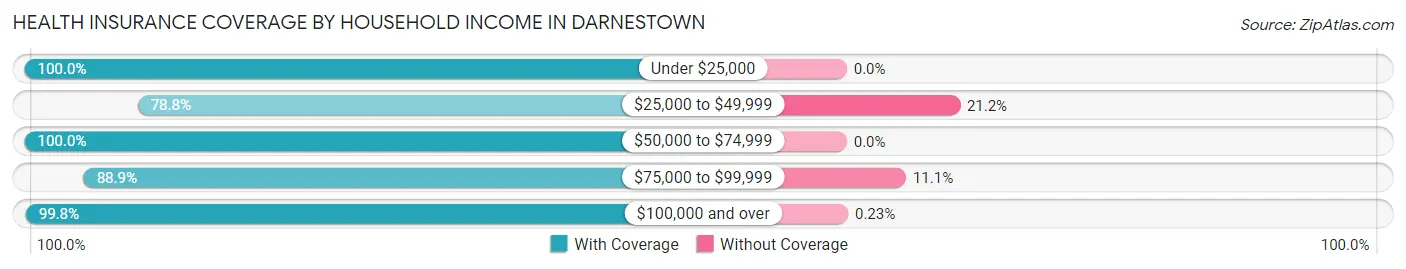
| Household Income | With Coverage | Without Coverage |
| Under $25,000 | 13 (100.0%) | 0 (0.0%) |
| $25,000 to $49,999 | 171 (78.8%) | 46 (21.2%) |
| $50,000 to $74,999 | 294 (100.0%) | 0 (0.0%) |
| $75,000 to $99,999 | 417 (88.9%) | 52 (11.1%) |
| $100,000 and over | 5,627 (99.8%) | 13 (0.2%) |
Public vs Private Health Insurance Coverage by Age in Darnestown
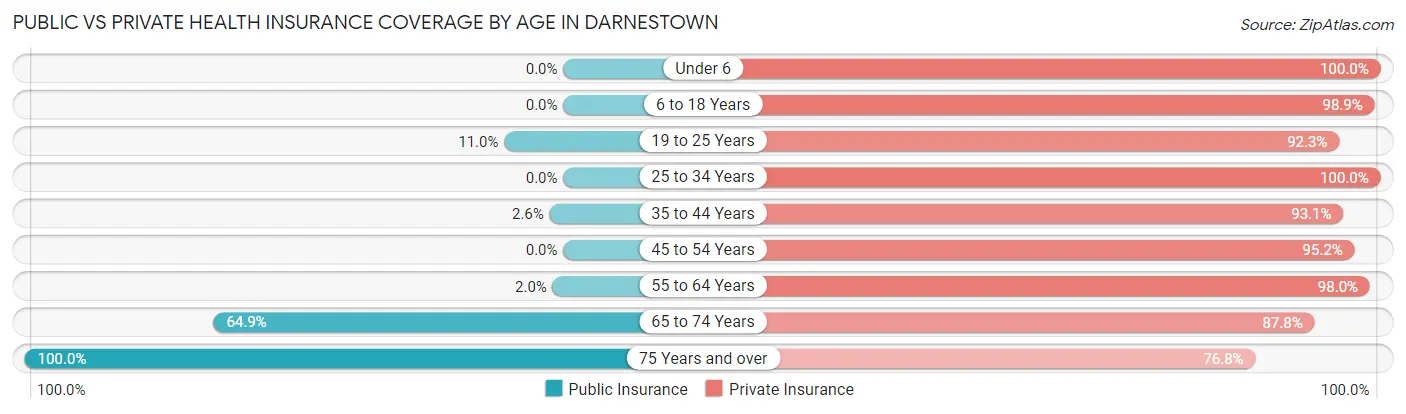
| Age Bracket | Public Insurance | Private Insurance |
| Under 6 | 0 (0.0%) | 413 (100.0%) |
| 6 to 18 Years | 0 (0.0%) | 1,153 (98.9%) |
| 19 to 25 Years | 60 (11.0%) | 505 (92.3%) |
| 25 to 34 Years | 0 (0.0%) | 198 (100.0%) |
| 35 to 44 Years | 17 (2.5%) | 620 (93.1%) |
| 45 to 54 Years | 0 (0.0%) | 1,030 (95.2%) |
| 55 to 64 Years | 26 (2.0%) | 1,289 (98.0%) |
| 65 to 74 Years | 552 (64.9%) | 746 (87.8%) |
| 75 Years and over | 396 (100.0%) | 304 (76.8%) |
| Total | 1,051 (15.9%) | 6,258 (94.4%) |
Disability Status by Sex by Age in Darnestown
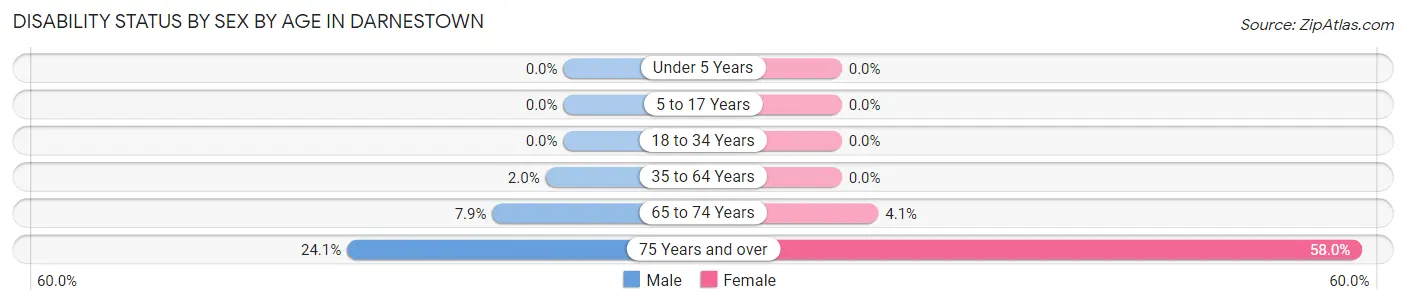
| Age Bracket | Male | Female |
| Under 5 Years | 0 (0.0%) | 0 (0.0%) |
| 5 to 17 Years | 0 (0.0%) | 0 (0.0%) |
| 18 to 34 Years | 0 (0.0%) | 0 (0.0%) |
| 35 to 64 Years | 26 (2.0%) | 0 (0.0%) |
| 65 to 74 Years | 40 (7.9%) | 14 (4.1%) |
| 75 Years and over | 53 (24.1%) | 102 (58.0%) |
Disability Class by Sex by Age in Darnestown
Disability Class: Hearing Difficulty
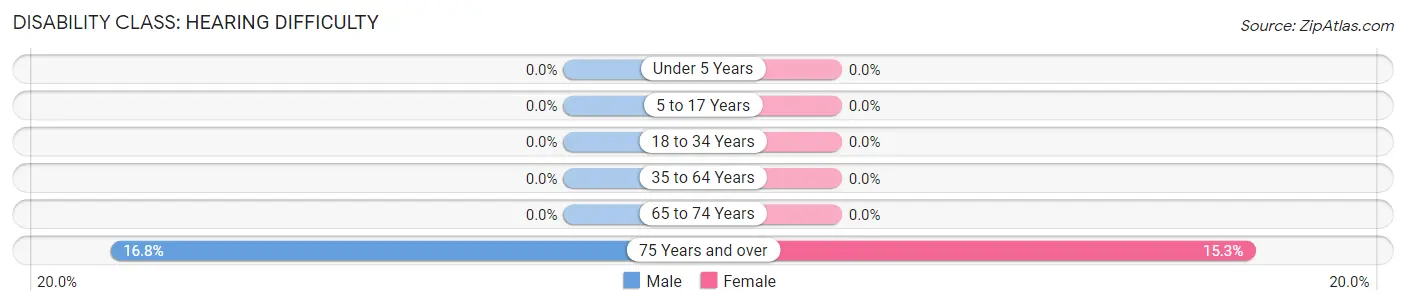
| Age Bracket | Male | Female |
| Under 5 Years | 0 (0.0%) | 0 (0.0%) |
| 5 to 17 Years | 0 (0.0%) | 0 (0.0%) |
| 18 to 34 Years | 0 (0.0%) | 0 (0.0%) |
| 35 to 64 Years | 0 (0.0%) | 0 (0.0%) |
| 65 to 74 Years | 0 (0.0%) | 0 (0.0%) |
| 75 Years and over | 37 (16.8%) | 27 (15.3%) |
Disability Class: Vision Difficulty
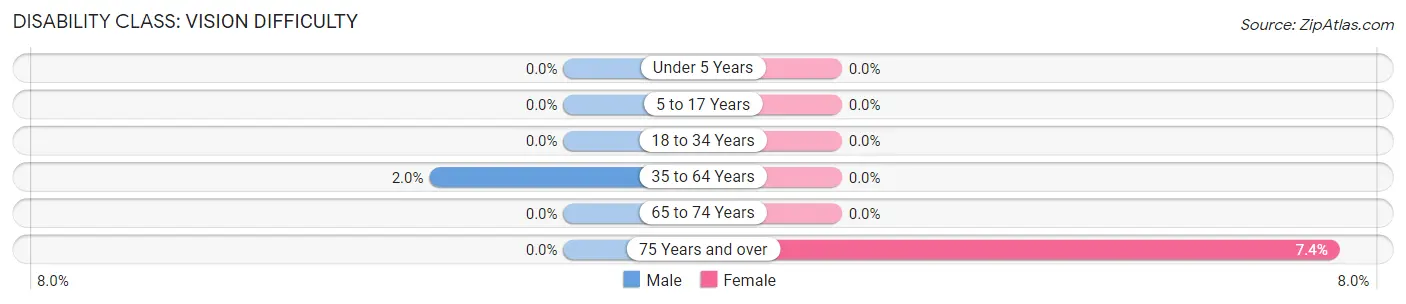
| Age Bracket | Male | Female |
| Under 5 Years | 0 (0.0%) | 0 (0.0%) |
| 5 to 17 Years | 0 (0.0%) | 0 (0.0%) |
| 18 to 34 Years | 0 (0.0%) | 0 (0.0%) |
| 35 to 64 Years | 26 (2.0%) | 0 (0.0%) |
| 65 to 74 Years | 0 (0.0%) | 0 (0.0%) |
| 75 Years and over | 0 (0.0%) | 13 (7.4%) |
Disability Class: Cognitive Difficulty
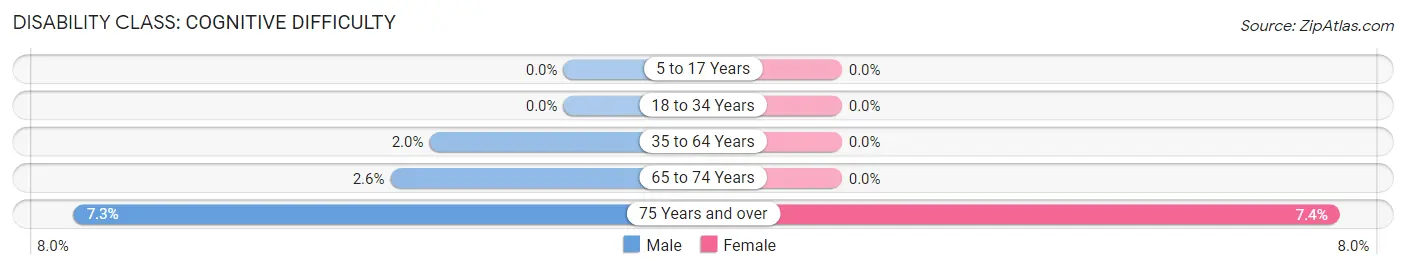
| Age Bracket | Male | Female |
| 5 to 17 Years | 0 (0.0%) | 0 (0.0%) |
| 18 to 34 Years | 0 (0.0%) | 0 (0.0%) |
| 35 to 64 Years | 26 (2.0%) | 0 (0.0%) |
| 65 to 74 Years | 13 (2.6%) | 0 (0.0%) |
| 75 Years and over | 16 (7.3%) | 13 (7.4%) |
Disability Class: Ambulatory Difficulty
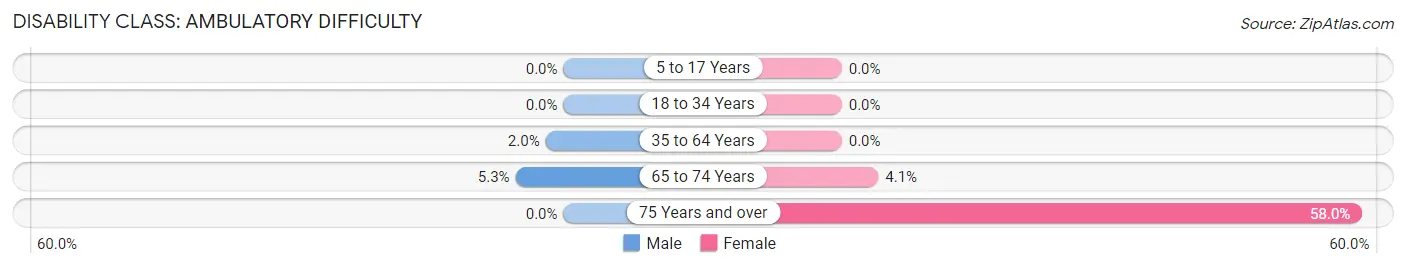
| Age Bracket | Male | Female |
| 5 to 17 Years | 0 (0.0%) | 0 (0.0%) |
| 18 to 34 Years | 0 (0.0%) | 0 (0.0%) |
| 35 to 64 Years | 26 (2.0%) | 0 (0.0%) |
| 65 to 74 Years | 27 (5.3%) | 14 (4.1%) |
| 75 Years and over | 0 (0.0%) | 102 (58.0%) |
Disability Class: Self-Care Difficulty
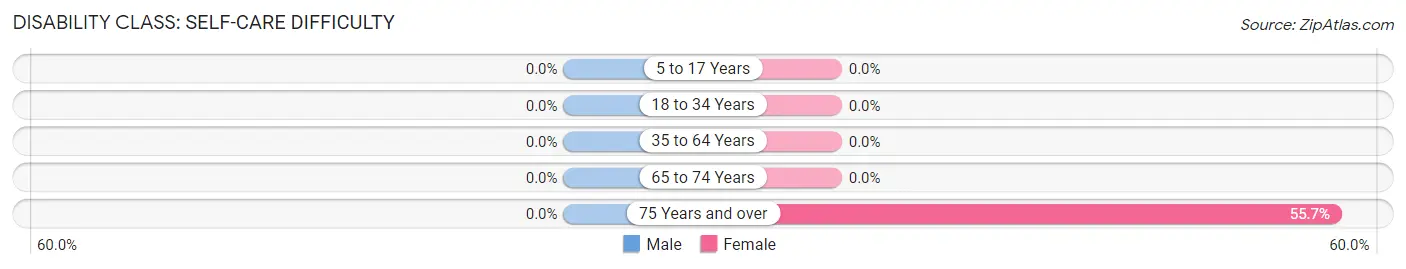
| Age Bracket | Male | Female |
| 5 to 17 Years | 0 (0.0%) | 0 (0.0%) |
| 18 to 34 Years | 0 (0.0%) | 0 (0.0%) |
| 35 to 64 Years | 0 (0.0%) | 0 (0.0%) |
| 65 to 74 Years | 0 (0.0%) | 0 (0.0%) |
| 75 Years and over | 0 (0.0%) | 98 (55.7%) |
Technology Access in Darnestown
Computing Device Access in Darnestown
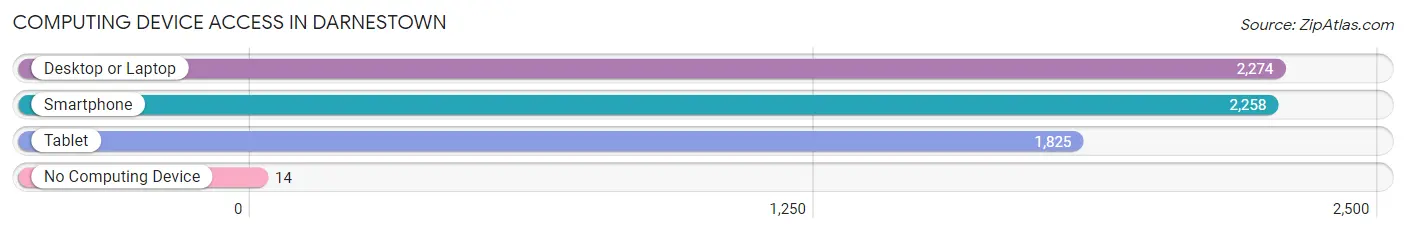
| Device Type | # Households | % Households |
| Desktop or Laptop | 2,274 | 99.4% |
| Smartphone | 2,258 | 98.7% |
| Tablet | 1,825 | 79.8% |
| No Computing Device | 14 | 0.6% |
| Total | 2,288 | 100.0% |
Internet Access in Darnestown
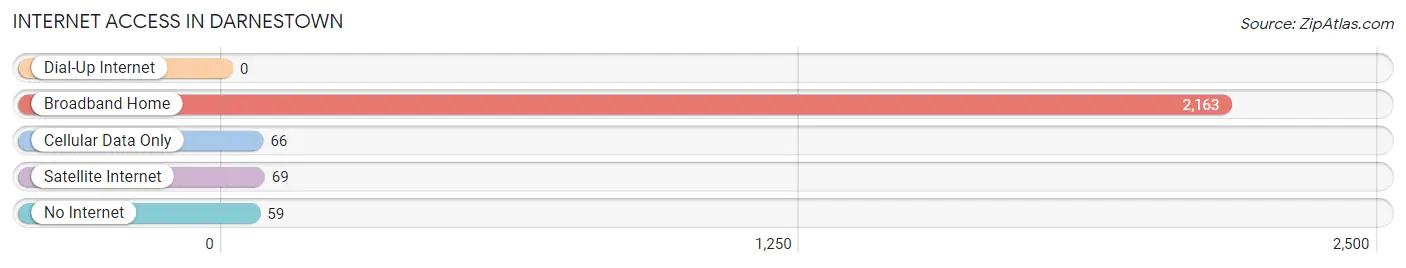
| Internet Type | # Households | % Households |
| Dial-Up Internet | 0 | 0.0% |
| Broadband Home | 2,163 | 94.5% |
| Cellular Data Only | 66 | 2.9% |
| Satellite Internet | 69 | 3.0% |
| No Internet | 59 | 2.6% |
| Total | 2,288 | 100.0% |
Darnestown Summary
Darnestown is an unincorporated community located in Montgomery County, Maryland, United States. It is situated in the northern part of the county, approximately 25 miles northwest of Washington, D.C. The community is bordered by the Potomac River to the north, the Montgomery County Agricultural Reserve to the east, and the towns of Poolesville and Germantown to the south and west, respectively.
History
The area that is now Darnestown was first settled in the late 1700s by the Darnes family, who were among the first settlers in Montgomery County. The family owned a large tract of land in the area, which was known as Darnestown. The community was officially established in 1810, when the Darnes family donated land for a church and cemetery. The church, known as Darnestown Presbyterian Church, is still in operation today.
In the mid-1800s, the area began to grow as a farming community. The Darnes family continued to own much of the land in the area, and the community was known for its large farms and orchards. The area was also home to several mills, including a grist mill, a saw mill, and a paper mill.
In the early 1900s, the area began to transition from a rural farming community to a suburban residential area. The construction of the Washington and Old Dominion Railroad in the 1920s helped to spur this development, as it provided easy access to Washington, D.C. and other nearby cities.
Geography
Darnestown is located in northern Montgomery County, approximately 25 miles northwest of Washington, D.C. The community is bordered by the Potomac River to the north, the Montgomery County Agricultural Reserve to the east, and the towns of Poolesville and Germantown to the south and west, respectively.
The area is characterized by rolling hills and valleys, with elevations ranging from 200 to 500 feet above sea level. The climate is temperate, with hot, humid summers and cold, wet winters.
Economy
Darnestown is primarily a residential community, with most of its residents commuting to nearby cities for work. The area is home to several small businesses, including restaurants, retail stores, and professional services.
The area is also home to several large employers, including the National Institutes of Health, the National Geospatial-Intelligence Agency, and the National Institute of Standards and Technology.
Demographics
As of the 2010 census, the population of Darnestown was 8,945. The racial makeup of the community was 79.3% White, 11.2% African American, 4.2% Asian, and 4.3% Hispanic or Latino.
The median household income in Darnestown was $117,945 in 2017, and the median home value was $541,000. The median age of residents was 40.7 years.
Common Questions
What is Per Capita Income in Darnestown?
Per Capita income in Darnestown is $103,750.
What is the Median Family Income in Darnestown?
Median Family Income in Darnestown is $250,001.
What is the Median Household income in Darnestown?
Median Household Income in Darnestown is $250,001.
What is Income or Wage Gap in Darnestown?
Income or Wage Gap in Darnestown is 63.5%.
Women in Darnestown earn 36.5 cents for every dollar earned by a man.
What is Inequality or Gini Index in Darnestown?
Inequality or Gini Index in Darnestown is 0.42.
What is the Total Population of Darnestown?
Total Population of Darnestown is 6,672.
What is the Total Male Population of Darnestown?
Total Male Population of Darnestown is 3,144.
What is the Total Female Population of Darnestown?
Total Female Population of Darnestown is 3,528.
What is the Ratio of Males per 100 Females in Darnestown?
There are 89.12 Males per 100 Females in Darnestown.
What is the Ratio of Females per 100 Males in Darnestown?
There are 112.21 Females per 100 Males in Darnestown.
What is the Median Population Age in Darnestown?
Median Population Age in Darnestown is 47.7 Years.
What is the Average Family Size in Darnestown
Average Family Size in Darnestown is 3.0 People.
What is the Average Household Size in Darnestown
Average Household Size in Darnestown is 2.9 People.
How Large is the Labor Force in Darnestown?
There are 3,900 People in the Labor Forcein in Darnestown.
What is the Percentage of People in the Labor Force in Darnestown?
71.5% of People are in the Labor Force in Darnestown.
What is the Unemployment Rate in Darnestown?
Unemployment Rate in Darnestown is 3.1%.