South Kensington, MD Map & Demographics
South Kensington Map
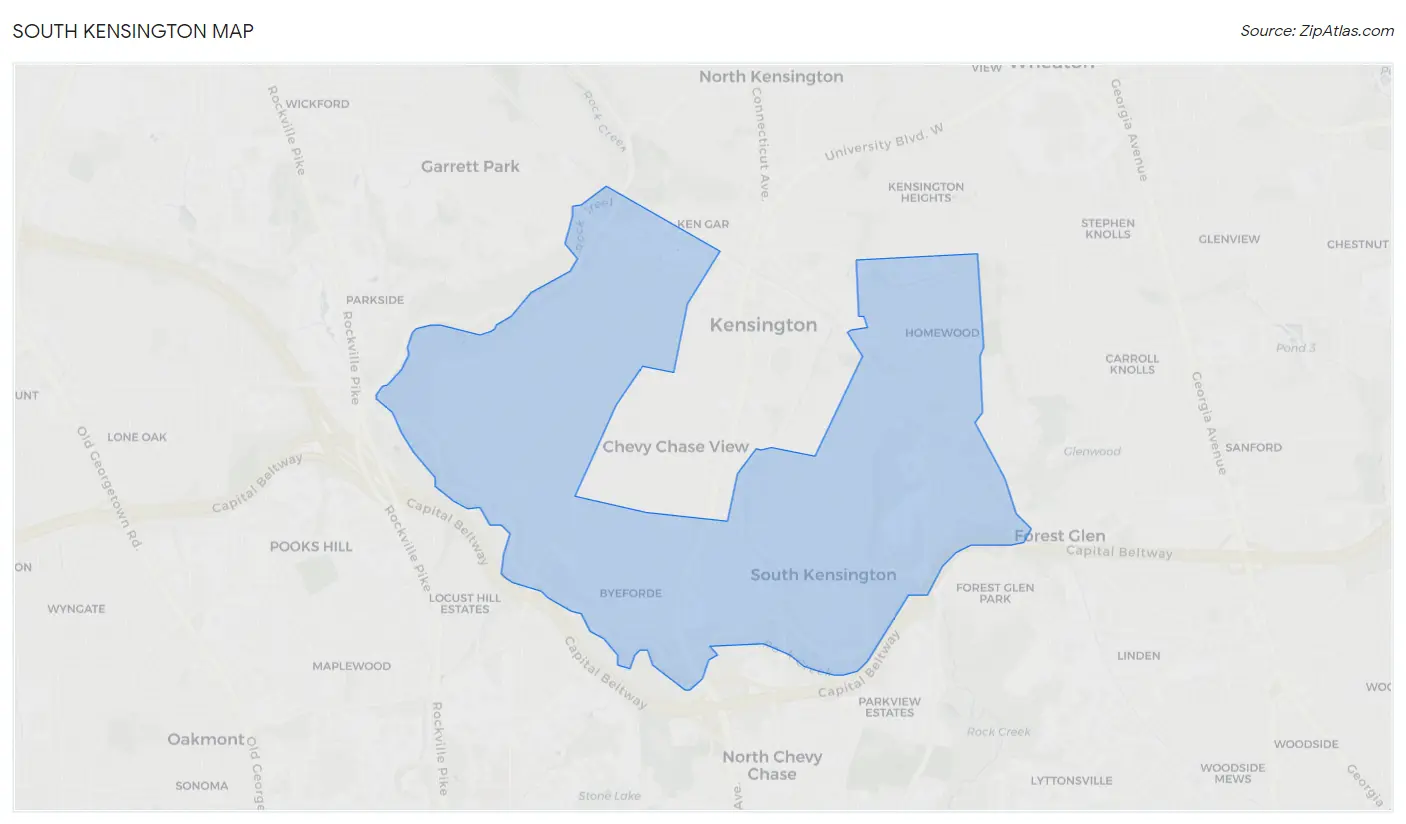
South Kensington Overview
$89,353
PER CAPITA INCOME
$239,167
AVG FAMILY INCOME
$199,981
AVG HOUSEHOLD INCOME
27.4%
WAGE / INCOME GAP [ % ]
72.6¢/ $1
WAGE / INCOME GAP [ $ ]
0.43
INEQUALITY / GINI INDEX
8,371
TOTAL POPULATION
4,040
MALE POPULATION
4,331
FEMALE POPULATION
93.28
MALES / 100 FEMALES
107.20
FEMALES / 100 MALES
43.8
MEDIAN AGE
3.3
AVG FAMILY SIZE
2.8
AVG HOUSEHOLD SIZE
4,284
LABOR FORCE [ PEOPLE ]
67.7%
PERCENT IN LABOR FORCE
2.2%
UNEMPLOYMENT RATE
Income in South Kensington
Income Overview in South Kensington
Per Capita Income in South Kensington is $89,353, while median incomes of families and households are $239,167 and $199,981 respectively.
| Characteristic | Number | Measure |
| Per Capita Income | 8,371 | $89,353 |
| Median Family Income | 2,198 | $239,167 |
| Mean Family Income | 2,198 | $294,358 |
| Median Household Income | 2,923 | $199,981 |
| Mean Household Income | 2,923 | $248,277 |
| Income Deficit | 2,198 | $0 |
| Wage / Income Gap (%) | 8,371 | 27.36% |
| Wage / Income Gap ($) | 8,371 | 72.64¢ per $1 |
| Gini / Inequality Index | 8,371 | 0.43 |
Earnings by Sex in South Kensington
Average Earnings in South Kensington are $112,727, $130,980 for men and $95,139 for women, a difference of 27.4%.
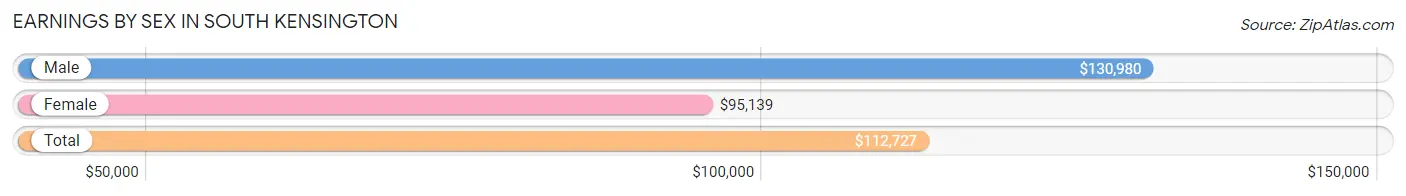
| Sex | Number | Average Earnings |
| Male | 2,386 (51.9%) | $130,980 |
| Female | 2,212 (48.1%) | $95,139 |
| Total | 4,598 (100.0%) | $112,727 |
Earnings by Sex by Income Bracket in South Kensington
The most common earnings brackets in South Kensington are $100,000+ for men (1,445 | 60.6%) and $100,000+ for women (1,045 | 47.2%).
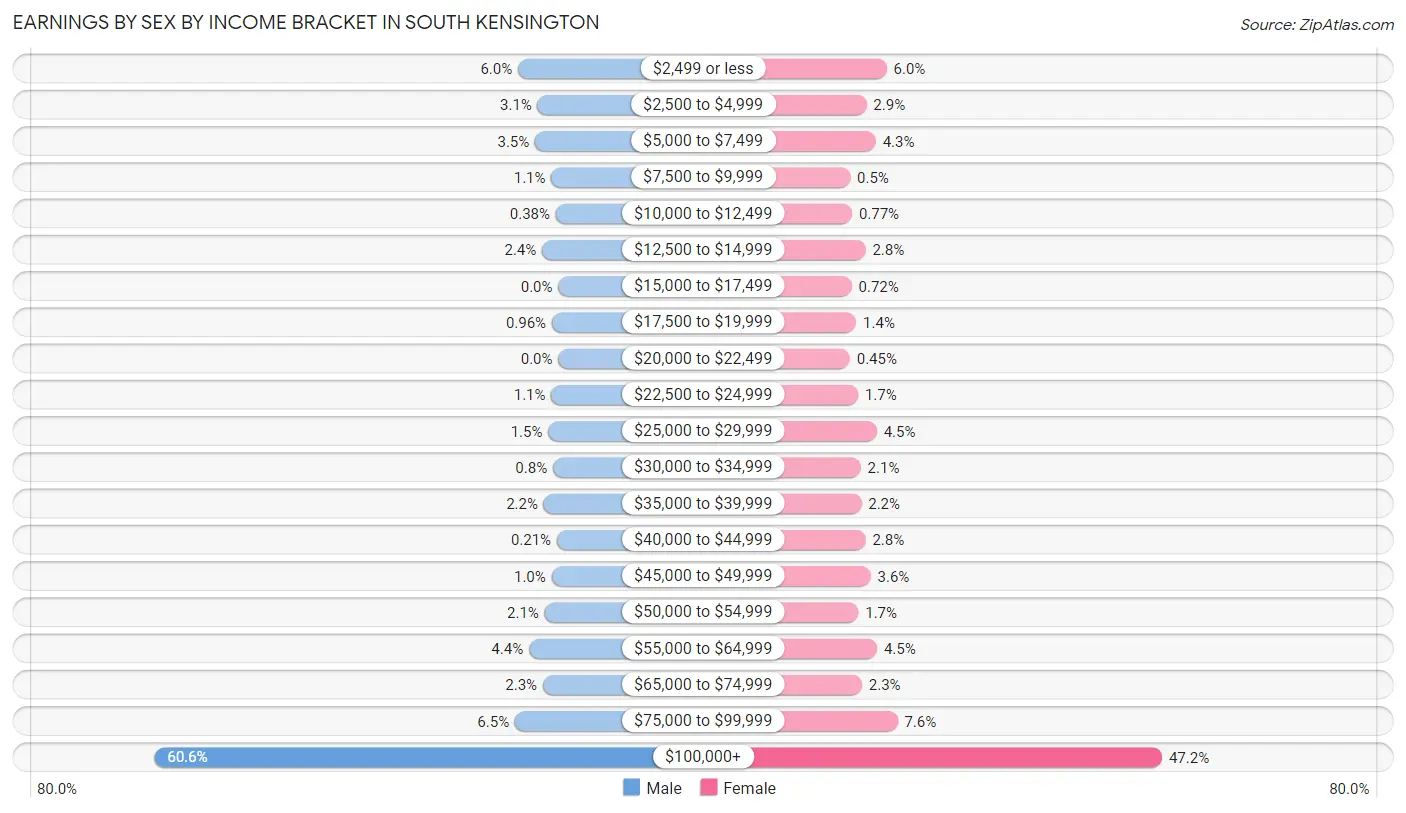
| Income | Male | Female |
| $2,499 or less | 144 (6.0%) | 132 (6.0%) |
| $2,500 to $4,999 | 74 (3.1%) | 65 (2.9%) |
| $5,000 to $7,499 | 83 (3.5%) | 96 (4.3%) |
| $7,500 to $9,999 | 25 (1.1%) | 11 (0.5%) |
| $10,000 to $12,499 | 9 (0.4%) | 17 (0.8%) |
| $12,500 to $14,999 | 58 (2.4%) | 62 (2.8%) |
| $15,000 to $17,499 | 0 (0.0%) | 16 (0.7%) |
| $17,500 to $19,999 | 23 (1.0%) | 31 (1.4%) |
| $20,000 to $22,499 | 0 (0.0%) | 10 (0.4%) |
| $22,500 to $24,999 | 25 (1.1%) | 37 (1.7%) |
| $25,000 to $29,999 | 36 (1.5%) | 99 (4.5%) |
| $30,000 to $34,999 | 19 (0.8%) | 46 (2.1%) |
| $35,000 to $39,999 | 52 (2.2%) | 48 (2.2%) |
| $40,000 to $44,999 | 5 (0.2%) | 62 (2.8%) |
| $45,000 to $49,999 | 24 (1.0%) | 79 (3.6%) |
| $50,000 to $54,999 | 49 (2.1%) | 38 (1.7%) |
| $55,000 to $64,999 | 105 (4.4%) | 100 (4.5%) |
| $65,000 to $74,999 | 55 (2.3%) | 50 (2.3%) |
| $75,000 to $99,999 | 155 (6.5%) | 168 (7.6%) |
| $100,000+ | 1,445 (60.6%) | 1,045 (47.2%) |
| Total | 2,386 (100.0%) | 2,212 (100.0%) |
Earnings by Sex by Educational Attainment in South Kensington
Average earnings in South Kensington are $139,283 for men and $110,642 for women, a difference of 20.6%. Men with an educational attainment of graduate degree enjoy the highest average annual earnings of $158,929, while those with high school diploma education earn the least with $38,194. Women with an educational attainment of graduate degree earn the most with the average annual earnings of $129,118, while those with high school diploma education have the smallest earnings of $22,679.
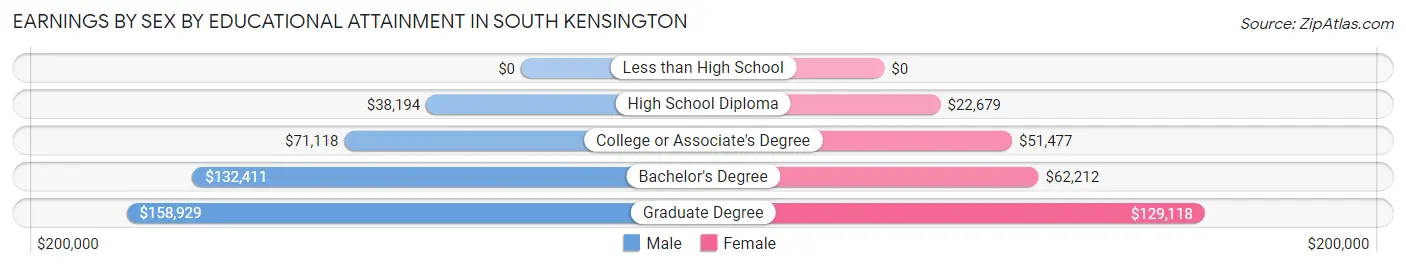
| Educational Attainment | Male Income | Female Income |
| Less than High School | - | - |
| High School Diploma | $38,194 | $22,679 |
| College or Associate's Degree | $71,118 | $51,477 |
| Bachelor's Degree | $132,411 | $62,212 |
| Graduate Degree | $158,929 | $129,118 |
| Total | $139,283 | $110,642 |
Family Income in South Kensington
Family Income Brackets in South Kensington
According to the South Kensington family income data, there are 1,350 families falling into the $200,000+ income range, which is the most common income bracket and makes up 61.4% of all families.
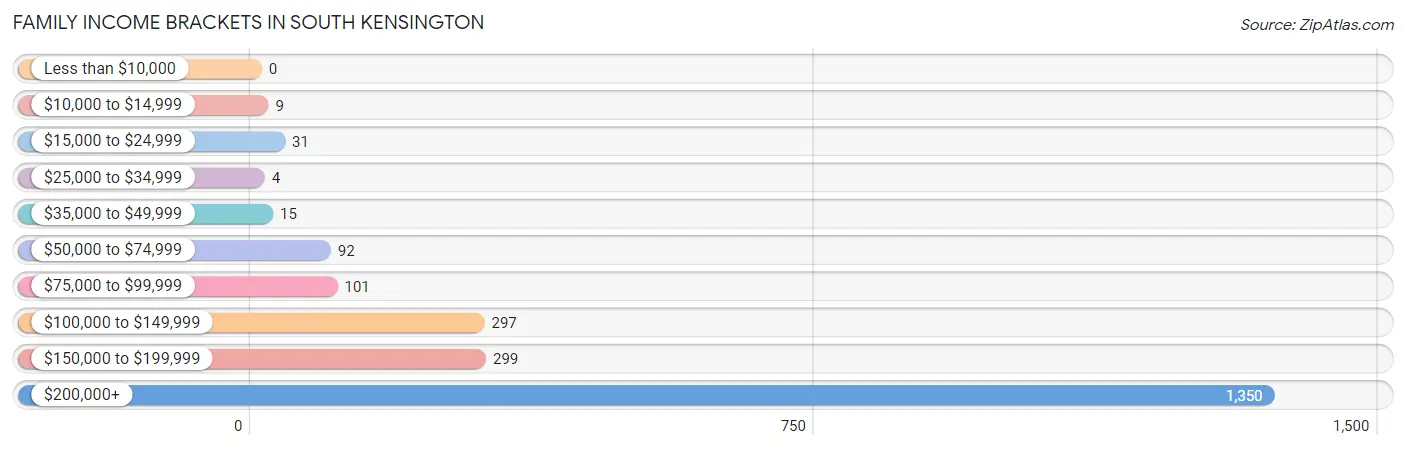
| Income Bracket | # Families | % Families |
| Less than $10,000 | 0 | 0.0% |
| $10,000 to $14,999 | 9 | 0.4% |
| $15,000 to $24,999 | 31 | 1.4% |
| $25,000 to $34,999 | 4 | 0.2% |
| $35,000 to $49,999 | 15 | 0.7% |
| $50,000 to $74,999 | 92 | 4.2% |
| $75,000 to $99,999 | 101 | 4.6% |
| $100,000 to $149,999 | 297 | 13.5% |
| $150,000 to $199,999 | 299 | 13.6% |
| $200,000+ | 1,350 | 61.4% |
Family Income by Famaliy Size in South Kensington
4-person families (681 | 31.0%) account for the highest median family income in South Kensington with $250,001 per family, while 2-person families (907 | 41.3%) have the highest median income of $89,116 per family member.
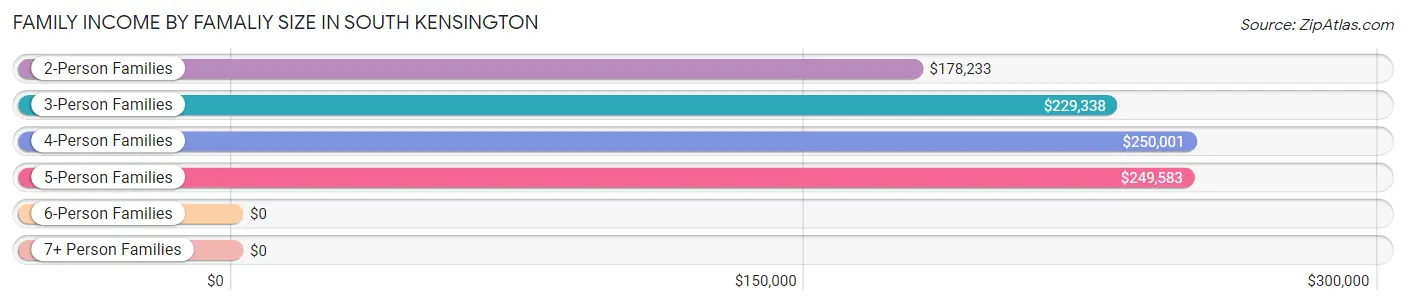
| Income Bracket | # Families | Median Income |
| 2-Person Families | 907 (41.3%) | $178,233 |
| 3-Person Families | 397 (18.1%) | $229,338 |
| 4-Person Families | 681 (31.0%) | $250,001 |
| 5-Person Families | 178 (8.1%) | $249,583 |
| 6-Person Families | 35 (1.6%) | $0 |
| 7+ Person Families | 0 (0.0%) | $0 |
| Total | 2,198 (100.0%) | $239,167 |
Family Income by Number of Earners in South Kensington
The median family income in South Kensington is $239,167, with families comprising 2 earners (1,326) having the highest median family income of $250,001, while families with no earners (239) have the lowest median family income of $117,375, accounting for 60.3% and 10.9% of families, respectively.
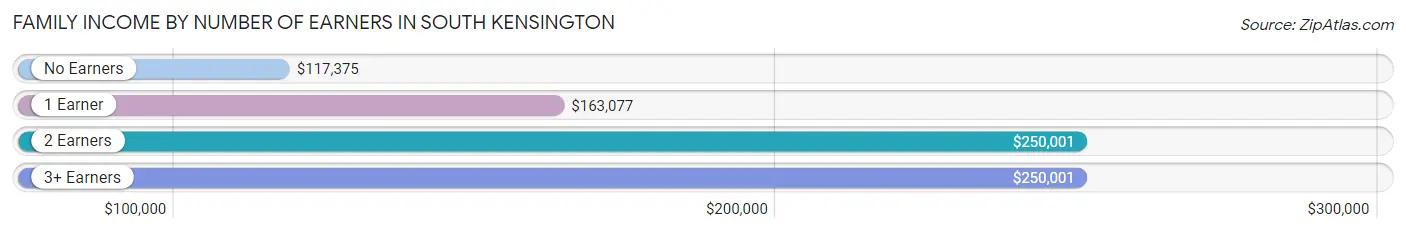
| Number of Earners | # Families | Median Income |
| No Earners | 239 (10.9%) | $117,375 |
| 1 Earner | 372 (16.9%) | $163,077 |
| 2 Earners | 1,326 (60.3%) | $250,001 |
| 3+ Earners | 261 (11.9%) | $250,001 |
| Total | 2,198 (100.0%) | $239,167 |
Household Income in South Kensington
Household Income Brackets in South Kensington
With 1,462 households falling in the category, the $200,000+ income range is the most frequent in South Kensington, accounting for 50.0% of all households. In contrast, only 32 households (1.1%) fall into the $25,000 to $34,999 income bracket, making it the least populous group.
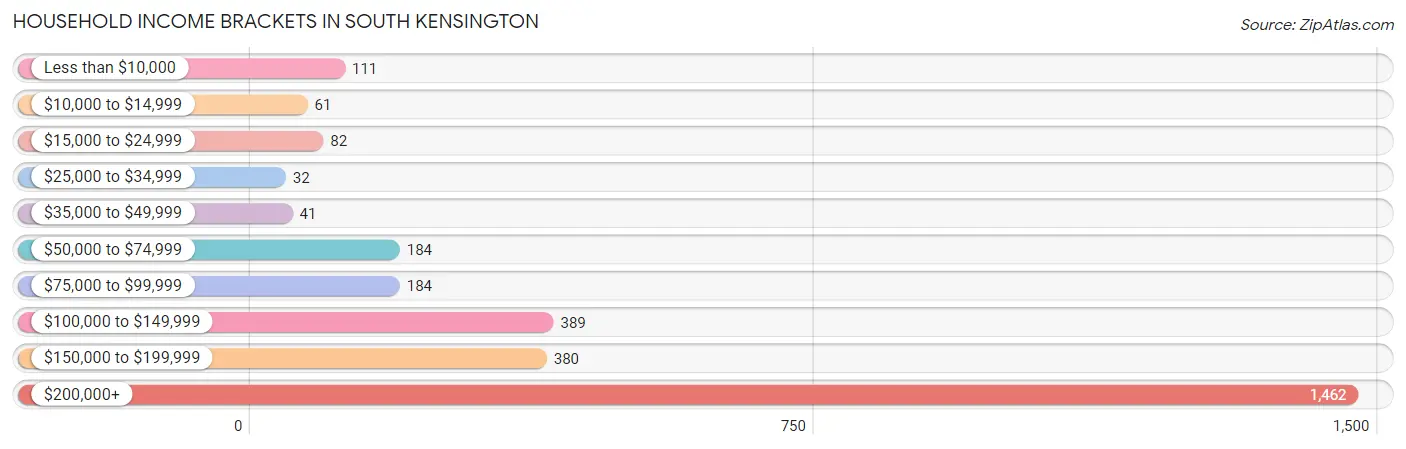
| Income Bracket | # Households | % Households |
| Less than $10,000 | 111 | 3.8% |
| $10,000 to $14,999 | 61 | 2.1% |
| $15,000 to $24,999 | 82 | 2.8% |
| $25,000 to $34,999 | 32 | 1.1% |
| $35,000 to $49,999 | 41 | 1.4% |
| $50,000 to $74,999 | 184 | 6.3% |
| $75,000 to $99,999 | 184 | 6.3% |
| $100,000 to $149,999 | 389 | 13.3% |
| $150,000 to $199,999 | 380 | 13.0% |
| $200,000+ | 1,462 | 50.0% |
Household Income by Householder Age in South Kensington
The median household income in South Kensington is $199,981, with the highest median household income of $250,001 found in the 25 to 44 years age bracket for the primary householder. A total of 760 households (26.0%) fall into this category.
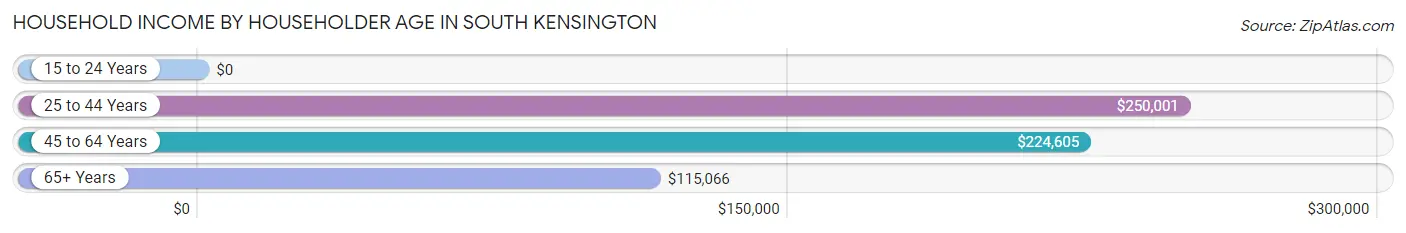
| Income Bracket | # Households | Median Income |
| 15 to 24 Years | 0 (0.0%) | $0 |
| 25 to 44 Years | 760 (26.0%) | $250,001 |
| 45 to 64 Years | 1,186 (40.6%) | $224,605 |
| 65+ Years | 977 (33.4%) | $115,066 |
| Total | 2,923 (100.0%) | $199,981 |
Poverty in South Kensington
Income Below Poverty by Sex and Age in South Kensington
With 2.3% poverty level for males and 6.4% for females among the residents of South Kensington, under 5 year old males and 75 year old and over females are the most vulnerable to poverty, with 15 males (6.5%) and 128 females (32.2%) in their respective age groups living below the poverty level.
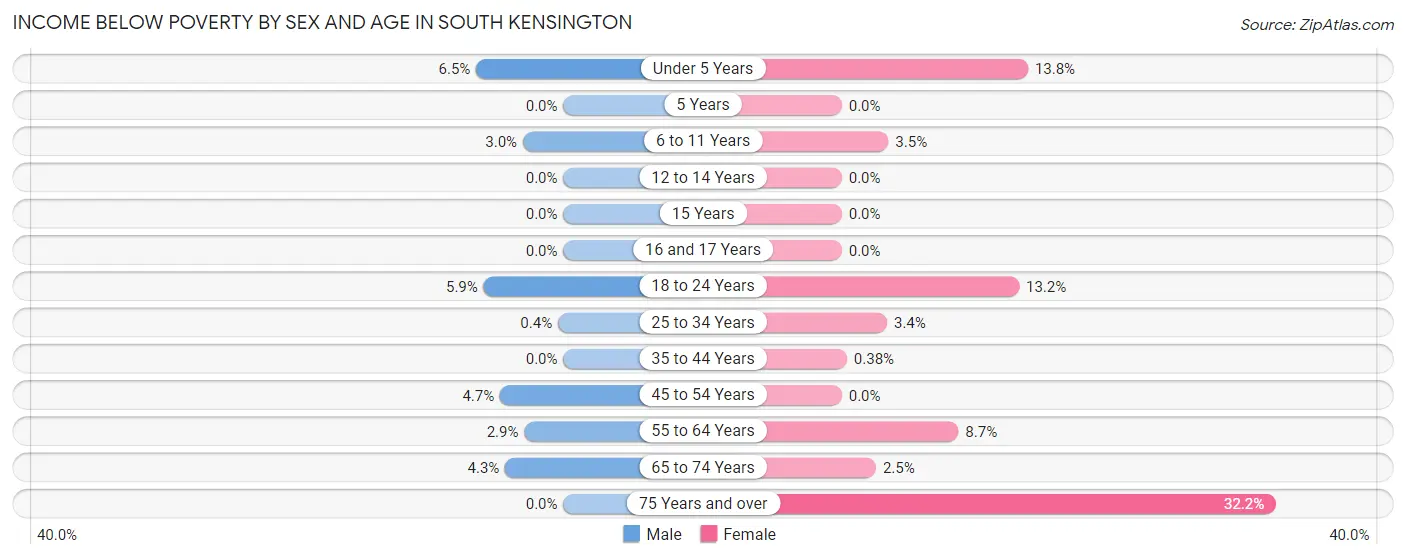
| Age Bracket | Male | Female |
| Under 5 Years | 15 (6.5%) | 34 (13.8%) |
| 5 Years | 0 (0.0%) | 0 (0.0%) |
| 6 to 11 Years | 12 (3.0%) | 13 (3.5%) |
| 12 to 14 Years | 0 (0.0%) | 0 (0.0%) |
| 15 Years | 0 (0.0%) | 0 (0.0%) |
| 16 and 17 Years | 0 (0.0%) | 0 (0.0%) |
| 18 to 24 Years | 9 (5.9%) | 25 (13.2%) |
| 25 to 34 Years | 1 (0.4%) | 9 (3.4%) |
| 35 to 44 Years | 0 (0.0%) | 2 (0.4%) |
| 45 to 54 Years | 21 (4.7%) | 0 (0.0%) |
| 55 to 64 Years | 17 (2.9%) | 49 (8.7%) |
| 65 to 74 Years | 15 (4.3%) | 11 (2.5%) |
| 75 Years and over | 0 (0.0%) | 128 (32.2%) |
| Total | 90 (2.3%) | 271 (6.4%) |
Income Above Poverty by Sex and Age in South Kensington
According to the poverty statistics in South Kensington, males aged 5 years and females aged 5 years are the age groups that are most secure financially, with 100.0% of males and 100.0% of females in these age groups living above the poverty line.
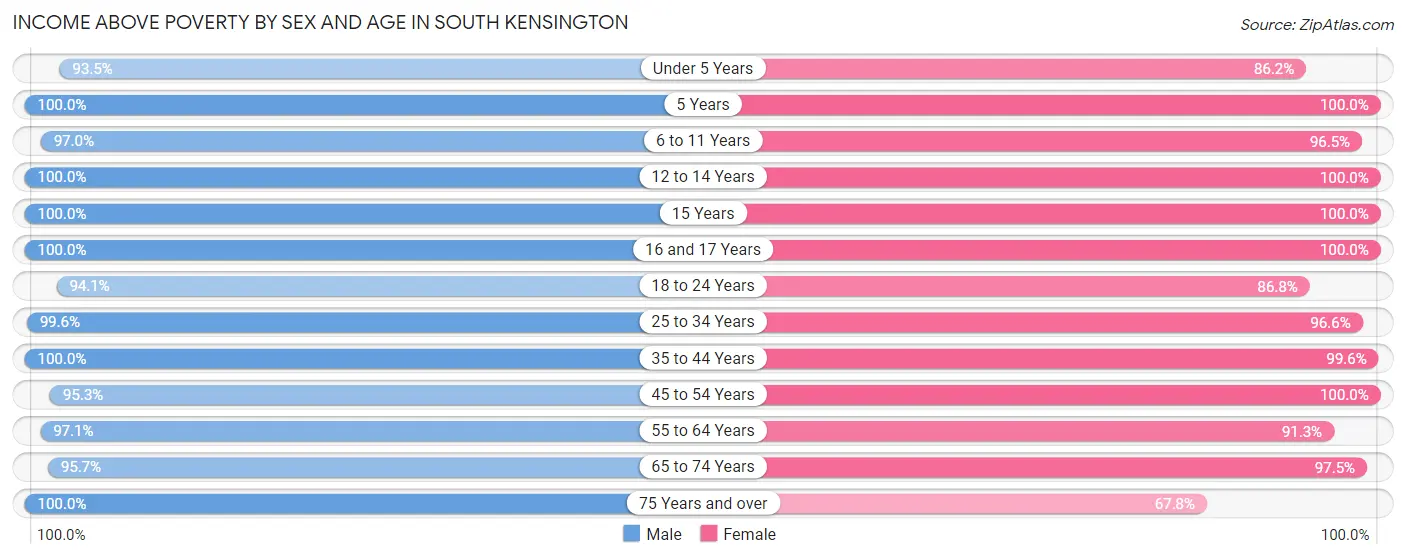
| Age Bracket | Male | Female |
| Under 5 Years | 217 (93.5%) | 212 (86.2%) |
| 5 Years | 74 (100.0%) | 112 (100.0%) |
| 6 to 11 Years | 388 (97.0%) | 363 (96.5%) |
| 12 to 14 Years | 162 (100.0%) | 175 (100.0%) |
| 15 Years | 99 (100.0%) | 121 (100.0%) |
| 16 and 17 Years | 215 (100.0%) | 132 (100.0%) |
| 18 to 24 Years | 143 (94.1%) | 165 (86.8%) |
| 25 to 34 Years | 246 (99.6%) | 259 (96.6%) |
| 35 to 44 Years | 642 (100.0%) | 529 (99.6%) |
| 45 to 54 Years | 426 (95.3%) | 677 (100.0%) |
| 55 to 64 Years | 569 (97.1%) | 517 (91.3%) |
| 65 to 74 Years | 332 (95.7%) | 422 (97.5%) |
| 75 Years and over | 345 (100.0%) | 269 (67.8%) |
| Total | 3,858 (97.7%) | 3,953 (93.6%) |
Income Below Poverty Among Married-Couple Families in South Kensington
The poverty statistics for married-couple families in South Kensington show that 0.4% or 9 of the total 1,981 families live below the poverty line. Families with no children have the highest poverty rate of 0.9%, comprising of 9 families. On the other hand, families with 1 or 2 children have the lowest poverty rate of 0.0%, which includes 0 families.
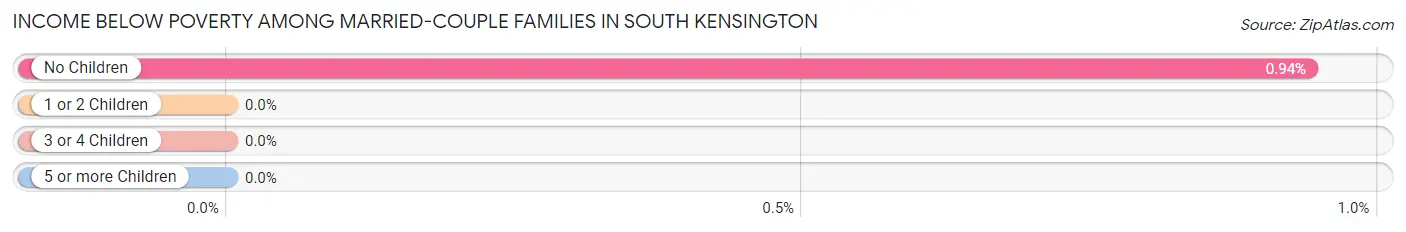
| Children | Above Poverty | Below Poverty |
| No Children | 947 (99.1%) | 9 (0.9%) |
| 1 or 2 Children | 856 (100.0%) | 0 (0.0%) |
| 3 or 4 Children | 169 (100.0%) | 0 (0.0%) |
| 5 or more Children | 0 (0.0%) | 0 (0.0%) |
| Total | 1,972 (99.6%) | 9 (0.4%) |
Income Below Poverty Among Single-Parent Households in South Kensington
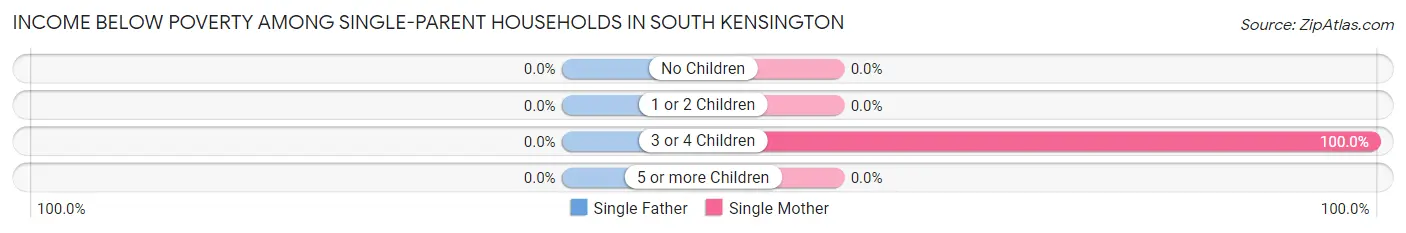
| Children | Single Father | Single Mother |
| No Children | 0 (0.0%) | 0 (0.0%) |
| 1 or 2 Children | 0 (0.0%) | 0 (0.0%) |
| 3 or 4 Children | 0 (0.0%) | 14 (100.0%) |
| 5 or more Children | 0 (0.0%) | 0 (0.0%) |
| Total | 0 (0.0%) | 14 (10.8%) |
Income Below Poverty Among Married-Couple vs Single-Parent Households in South Kensington
The poverty data for South Kensington shows that 9 of the married-couple family households (0.4%) and 14 of the single-parent households (6.5%) are living below the poverty level. Within the married-couple family households, those with no children have the highest poverty rate, with 9 households (0.9%) falling below the poverty line. Among the single-parent households, those with 3 or 4 children have the highest poverty rate, with 14 household (100.0%) living below poverty.
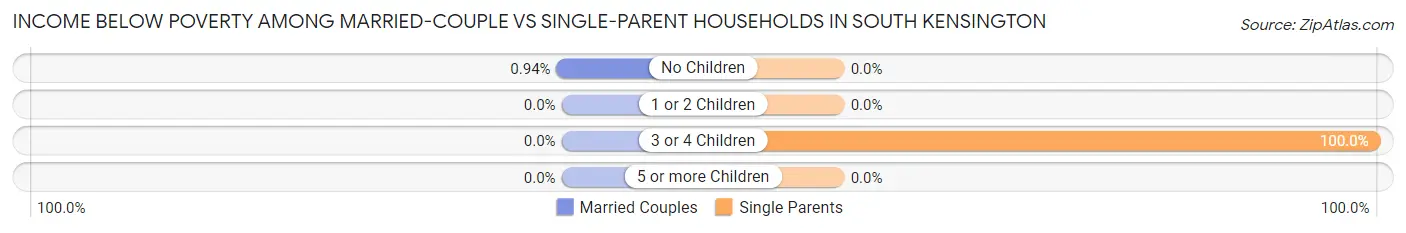
| Children | Married-Couple Families | Single-Parent Households |
| No Children | 9 (0.9%) | 0 (0.0%) |
| 1 or 2 Children | 0 (0.0%) | 0 (0.0%) |
| 3 or 4 Children | 0 (0.0%) | 14 (100.0%) |
| 5 or more Children | 0 (0.0%) | 0 (0.0%) |
| Total | 9 (0.4%) | 14 (6.5%) |
Race in South Kensington
The most populous races in South Kensington are White / Caucasian (6,515 | 77.8%), Two or more Races (788 | 9.4%), and Asian (462 | 5.5%).
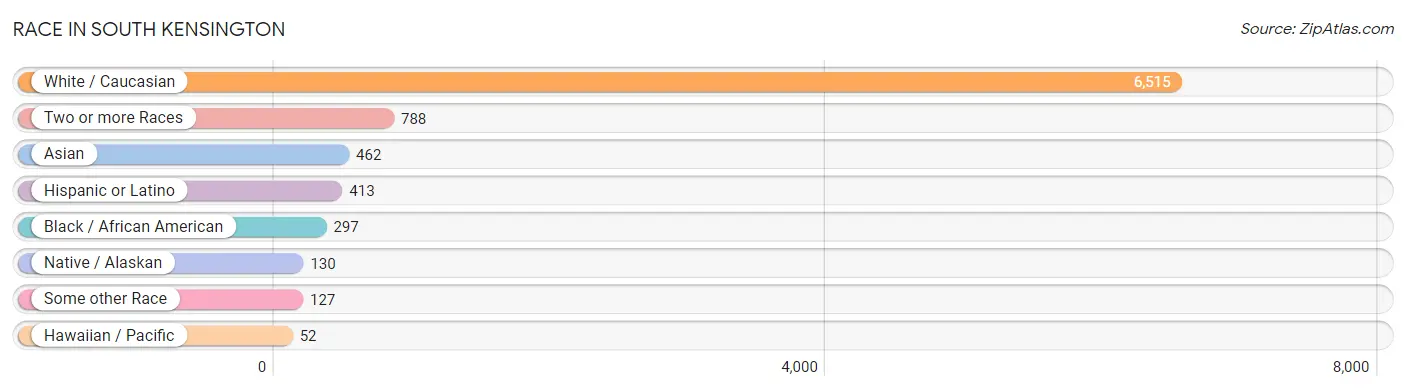
| Race | # Population | % Population |
| Asian | 462 | 5.5% |
| Black / African American | 297 | 3.5% |
| Hawaiian / Pacific | 52 | 0.6% |
| Hispanic or Latino | 413 | 4.9% |
| Native / Alaskan | 130 | 1.5% |
| White / Caucasian | 6,515 | 77.8% |
| Two or more Races | 788 | 9.4% |
| Some other Race | 127 | 1.5% |
| Total | 8,371 | 100.0% |
Ancestry in South Kensington
The most populous ancestries reported in South Kensington are Irish (1,531 | 18.3%), English (1,076 | 12.9%), German (1,049 | 12.5%), Italian (660 | 7.9%), and Scottish (360 | 4.3%), together accounting for 55.8% of all South Kensington residents.
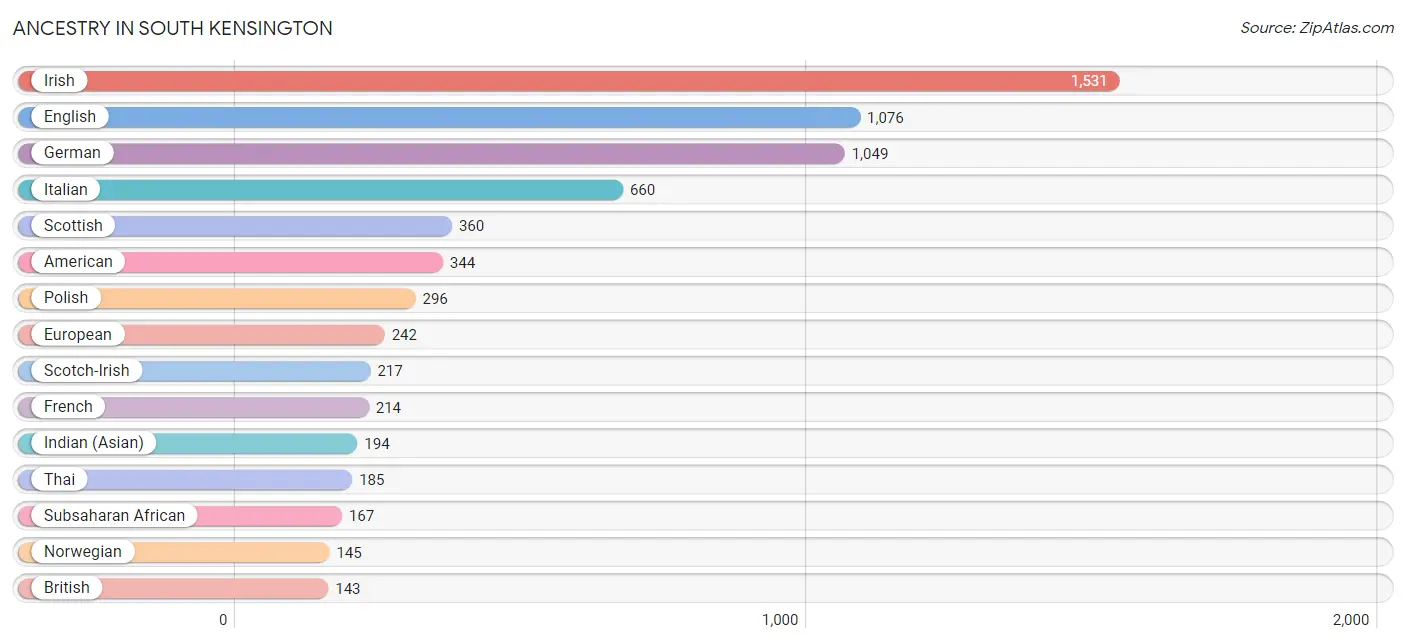
| Ancestry | # Population | % Population |
| African | 20 | 0.2% |
| American | 344 | 4.1% |
| Arab | 69 | 0.8% |
| Armenian | 26 | 0.3% |
| Assyrian / Chaldean / Syriac | 36 | 0.4% |
| Australian | 47 | 0.6% |
| Austrian | 71 | 0.9% |
| Bahamian | 13 | 0.2% |
| Barbadian | 10 | 0.1% |
| Belgian | 10 | 0.1% |
| Bermudan | 27 | 0.3% |
| Bhutanese | 63 | 0.7% |
| Brazilian | 47 | 0.6% |
| British | 143 | 1.7% |
| Burmese | 122 | 1.5% |
| Canadian | 29 | 0.4% |
| Central American | 56 | 0.7% |
| Cherokee | 5 | 0.1% |
| Colombian | 56 | 0.7% |
| Costa Rican | 9 | 0.1% |
| Cuban | 4 | 0.1% |
| Czech | 25 | 0.3% |
| Danish | 55 | 0.7% |
| Dominican | 3 | 0.0% |
| Dutch | 134 | 1.6% |
| Eastern European | 110 | 1.3% |
| English | 1,076 | 12.9% |
| Estonian | 11 | 0.1% |
| Ethiopian | 58 | 0.7% |
| European | 242 | 2.9% |
| Filipino | 13 | 0.2% |
| Finnish | 18 | 0.2% |
| French | 214 | 2.6% |
| French Canadian | 23 | 0.3% |
| German | 1,049 | 12.5% |
| Greek | 71 | 0.9% |
| Hungarian | 57 | 0.7% |
| Indian (Asian) | 194 | 2.3% |
| Iranian | 81 | 1.0% |
| Irish | 1,531 | 18.3% |
| Israeli | 3 | 0.0% |
| Italian | 660 | 7.9% |
| Korean | 58 | 0.7% |
| Laotian | 22 | 0.3% |
| Lebanese | 50 | 0.6% |
| Lithuanian | 13 | 0.2% |
| Mexican | 85 | 1.0% |
| Navajo | 87 | 1.0% |
| Nicaraguan | 14 | 0.2% |
| Northern European | 33 | 0.4% |
| Norwegian | 145 | 1.7% |
| Pakistani | 54 | 0.6% |
| Panamanian | 19 | 0.2% |
| Peruvian | 35 | 0.4% |
| Polish | 296 | 3.5% |
| Portuguese | 57 | 0.7% |
| Romanian | 27 | 0.3% |
| Russian | 138 | 1.7% |
| Salvadoran | 14 | 0.2% |
| Scandinavian | 9 | 0.1% |
| Scotch-Irish | 217 | 2.6% |
| Scottish | 360 | 4.3% |
| Slavic | 6 | 0.1% |
| Slovak | 12 | 0.1% |
| Slovene | 27 | 0.3% |
| South American | 111 | 1.3% |
| Spaniard | 70 | 0.8% |
| Spanish | 46 | 0.5% |
| Sri Lankan | 20 | 0.2% |
| Subsaharan African | 167 | 2.0% |
| Sudanese | 62 | 0.7% |
| Swedish | 56 | 0.7% |
| Swiss | 25 | 0.3% |
| Thai | 185 | 2.2% |
| Trinidadian and Tobagonian | 8 | 0.1% |
| Turkish | 69 | 0.8% |
| Ukrainian | 77 | 0.9% |
| Uruguayan | 20 | 0.2% |
| Welsh | 83 | 1.0% |
| Yugoslavian | 12 | 0.1% | View All 80 Rows |
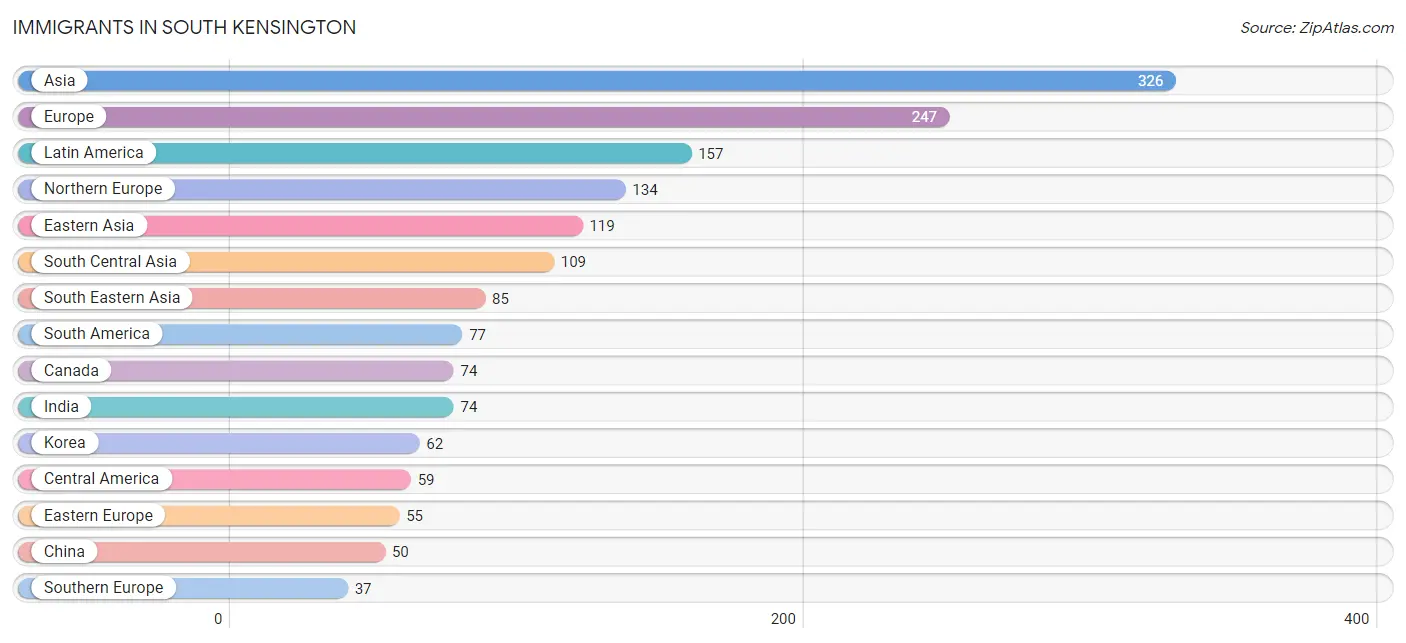
Immigrants in South Kensington
The most numerous immigrant groups reported in South Kensington came from Asia (326 | 3.9%), Europe (247 | 2.9%), Latin America (157 | 1.9%), Northern Europe (134 | 1.6%), and Eastern Asia (119 | 1.4%), together accounting for 11.7% of all South Kensington residents.
| Immigration Origin | # Population | % Population |
| Africa | 36 | 0.4% |
| Asia | 326 | 3.9% |
| Australia | 27 | 0.3% |
| Barbados | 10 | 0.1% |
| Brazil | 33 | 0.4% |
| Canada | 74 | 0.9% |
| Caribbean | 21 | 0.3% |
| Central America | 59 | 0.7% |
| China | 50 | 0.6% |
| Colombia | 20 | 0.2% |
| Costa Rica | 26 | 0.3% |
| Denmark | 6 | 0.1% |
| Eastern Africa | 36 | 0.4% |
| Eastern Asia | 119 | 1.4% |
| Eastern Europe | 55 | 0.7% |
| El Salvador | 14 | 0.2% |
| Ethiopia | 17 | 0.2% |
| Europe | 247 | 2.9% |
| France | 10 | 0.1% |
| Germany | 11 | 0.1% |
| Greece | 8 | 0.1% |
| Hong Kong | 7 | 0.1% |
| Hungary | 11 | 0.1% |
| India | 74 | 0.9% |
| Iran | 26 | 0.3% |
| Ireland | 5 | 0.1% |
| Israel | 3 | 0.0% |
| Italy | 29 | 0.4% |
| Jamaica | 11 | 0.1% |
| Japan | 7 | 0.1% |
| Kazakhstan | 5 | 0.1% |
| Korea | 62 | 0.7% |
| Latin America | 157 | 1.9% |
| Nicaragua | 16 | 0.2% |
| Northern Europe | 134 | 1.6% |
| Norway | 16 | 0.2% |
| Oceania | 27 | 0.3% |
| Panama | 3 | 0.0% |
| Peru | 4 | 0.1% |
| Philippines | 24 | 0.3% |
| Poland | 2 | 0.0% |
| Russia | 36 | 0.4% |
| Scotland | 28 | 0.3% |
| South America | 77 | 0.9% |
| South Central Asia | 109 | 1.3% |
| South Eastern Asia | 85 | 1.0% |
| Southern Europe | 37 | 0.4% |
| Sri Lanka | 4 | 0.1% |
| Sweden | 33 | 0.4% |
| Taiwan | 23 | 0.3% |
| Thailand | 32 | 0.4% |
| Uruguay | 20 | 0.2% |
| Vietnam | 29 | 0.4% |
| Western Asia | 3 | 0.0% |
| Western Europe | 21 | 0.3% | View All 55 Rows |
Sex and Age in South Kensington
Sex and Age in South Kensington
The most populous age groups in South Kensington are 40 to 44 Years (390 | 9.7%) for men and 50 to 54 Years (430 | 9.9%) for women.
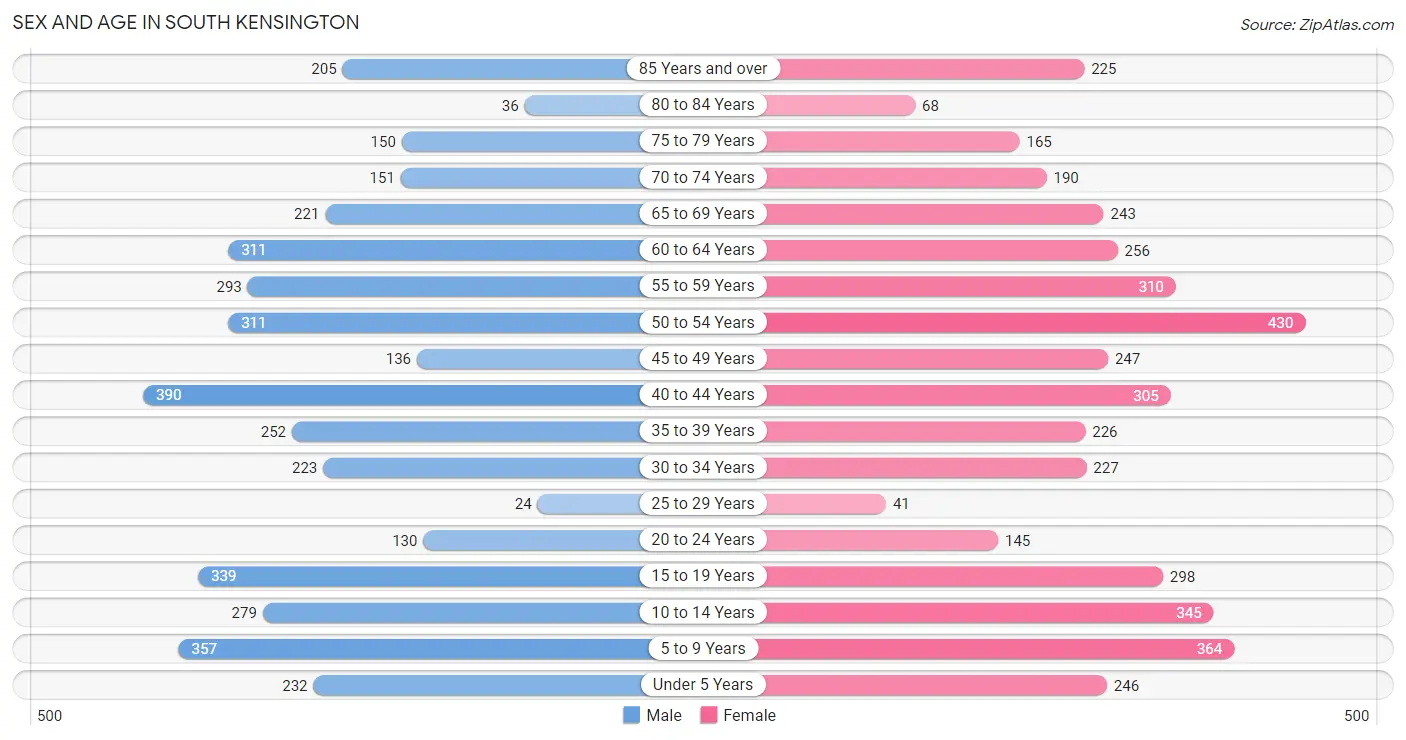
| Age Bracket | Male | Female |
| Under 5 Years | 232 (5.7%) | 246 (5.7%) |
| 5 to 9 Years | 357 (8.8%) | 364 (8.4%) |
| 10 to 14 Years | 279 (6.9%) | 345 (8.0%) |
| 15 to 19 Years | 339 (8.4%) | 298 (6.9%) |
| 20 to 24 Years | 130 (3.2%) | 145 (3.4%) |
| 25 to 29 Years | 24 (0.6%) | 41 (0.9%) |
| 30 to 34 Years | 223 (5.5%) | 227 (5.2%) |
| 35 to 39 Years | 252 (6.2%) | 226 (5.2%) |
| 40 to 44 Years | 390 (9.7%) | 305 (7.0%) |
| 45 to 49 Years | 136 (3.4%) | 247 (5.7%) |
| 50 to 54 Years | 311 (7.7%) | 430 (9.9%) |
| 55 to 59 Years | 293 (7.2%) | 310 (7.2%) |
| 60 to 64 Years | 311 (7.7%) | 256 (5.9%) |
| 65 to 69 Years | 221 (5.5%) | 243 (5.6%) |
| 70 to 74 Years | 151 (3.7%) | 190 (4.4%) |
| 75 to 79 Years | 150 (3.7%) | 165 (3.8%) |
| 80 to 84 Years | 36 (0.9%) | 68 (1.6%) |
| 85 Years and over | 205 (5.1%) | 225 (5.2%) |
| Total | 4,040 (100.0%) | 4,331 (100.0%) |
Families and Households in South Kensington
Median Family Size in South Kensington
The median family size in South Kensington is 3.27 persons per family, with married-couple families (1,981 | 90.1%) accounting for the largest median family size of 3.31 persons per family. On the other hand, single male/father families (88 | 4.0%) represent the smallest median family size with 2.70 persons per family.
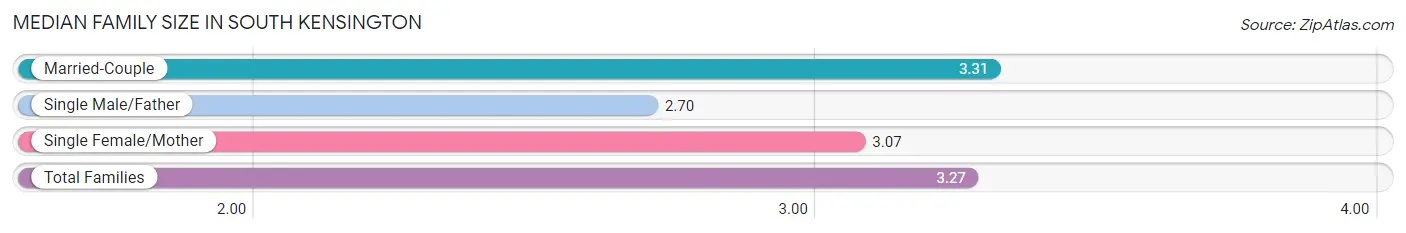
| Family Type | # Families | Family Size |
| Married-Couple | 1,981 (90.1%) | 3.31 |
| Single Male/Father | 88 (4.0%) | 2.70 |
| Single Female/Mother | 129 (5.9%) | 3.07 |
| Total Families | 2,198 (100.0%) | 3.27 |
Median Household Size in South Kensington
The median household size in South Kensington is 2.80 persons per household, with single female/mother households (129 | 4.4%) accounting for the largest median household size of 3.5 persons per household. non-family households (725 | 24.8%) represent the smallest median household size with 1.23 persons per household.
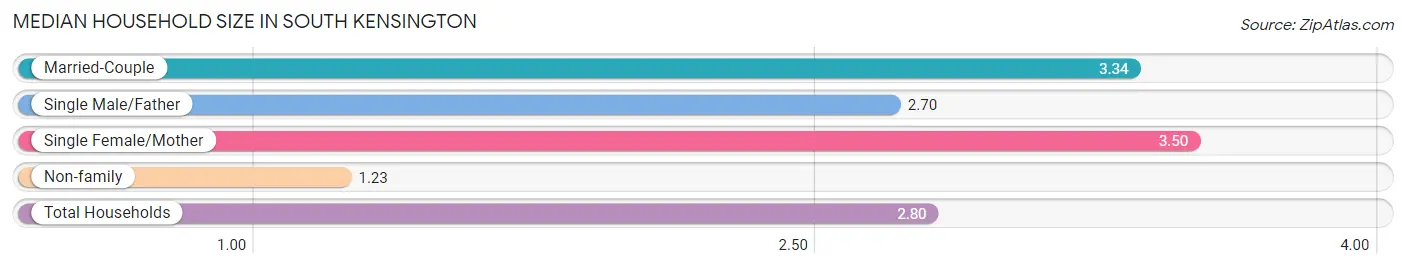
| Household Type | # Households | Household Size |
| Married-Couple | 1,981 (67.8%) | 3.34 |
| Single Male/Father | 88 (3.0%) | 2.70 |
| Single Female/Mother | 129 (4.4%) | 3.50 |
| Non-family | 725 (24.8%) | 1.23 |
| Total Households | 2,923 (100.0%) | 2.80 |
Household Size by Marriage Status in South Kensington
Out of a total of 2,923 households in South Kensington, 2,198 (75.2%) are family households, while 725 (24.8%) are nonfamily households. The most numerous type of family households are 2-person households, comprising 892, and the most common type of nonfamily households are 1-person households, comprising 606.
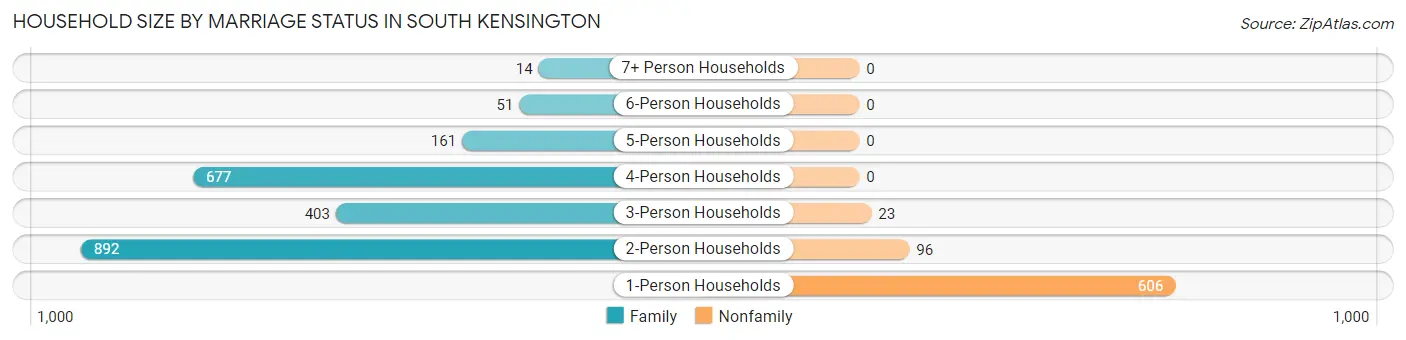
| Household Size | Family Households | Nonfamily Households |
| 1-Person Households | - | 606 (20.7%) |
| 2-Person Households | 892 (30.5%) | 96 (3.3%) |
| 3-Person Households | 403 (13.8%) | 23 (0.8%) |
| 4-Person Households | 677 (23.2%) | 0 (0.0%) |
| 5-Person Households | 161 (5.5%) | 0 (0.0%) |
| 6-Person Households | 51 (1.7%) | 0 (0.0%) |
| 7+ Person Households | 14 (0.5%) | 0 (0.0%) |
| Total | 2,198 (75.2%) | 725 (24.8%) |
Female Fertility in South Kensington
Fertility by Age in South Kensington
Average fertility rate in South Kensington is 78.0 births per 1,000 women. Women in the age bracket of 20 to 34 years have the highest fertility rate with 182.0 births per 1,000 women. Women in the age bracket of 20 to 34 years acount for 60.0% of all women with births.
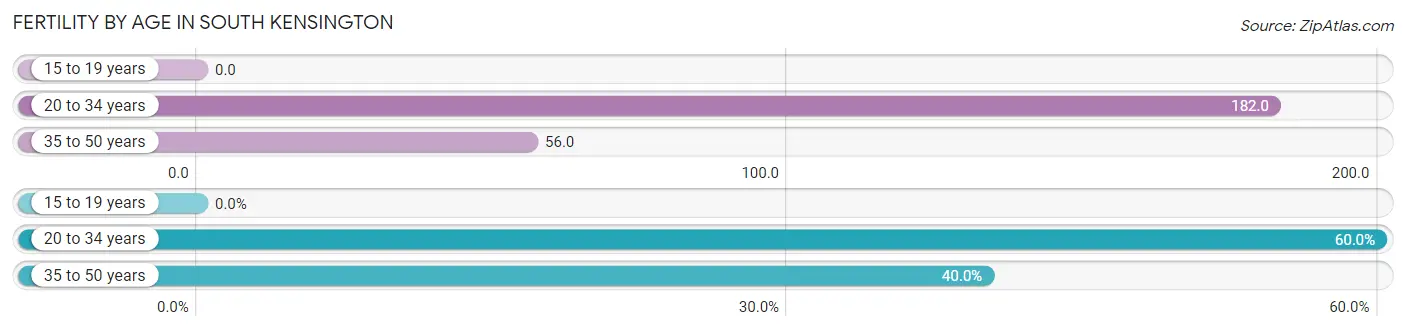
| Age Bracket | Women with Births | Births / 1,000 Women |
| 15 to 19 years | 0 (0.0%) | 0.0 |
| 20 to 34 years | 75 (60.0%) | 182.0 |
| 35 to 50 years | 50 (40.0%) | 56.0 |
| Total | 125 (100.0%) | 78.0 |
Fertility by Age by Marriage Status in South Kensington
93.6% of women with births (125) in South Kensington are married. The highest percentage of unmarried women with births falls into 35 to 50 years age bracket with 16.0% of them unmarried at the time of birth, while the lowest percentage of unmarried women with births belong to 20 to 34 years age bracket with 0.0% of them unmarried.
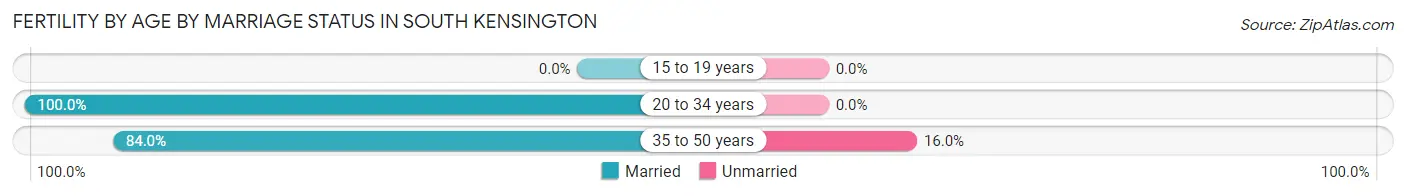
| Age Bracket | Married | Unmarried |
| 15 to 19 years | 0 (0.0%) | 0 (0.0%) |
| 20 to 34 years | 75 (100.0%) | 0 (0.0%) |
| 35 to 50 years | 42 (84.0%) | 8 (16.0%) |
| Total | 117 (93.6%) | 8 (6.4%) |
Fertility by Education in South Kensington
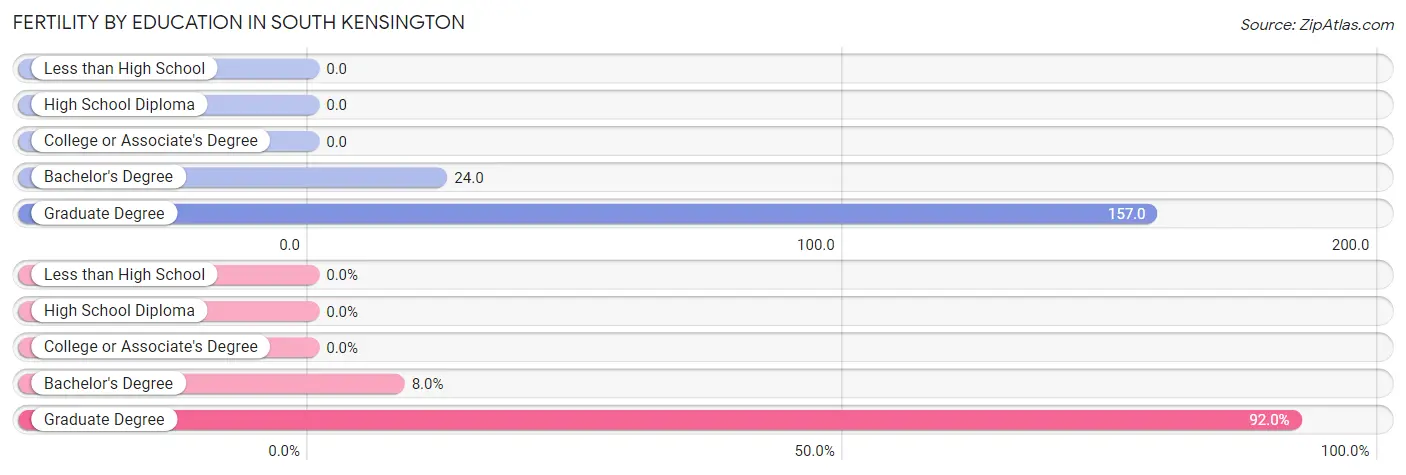
| Educational Attainment | Women with Births | Births / 1,000 Women |
| Less than High School | 0 (0.0%) | 0.0 |
| High School Diploma | 0 (0.0%) | 0.0 |
| College or Associate's Degree | 0 (0.0%) | 0.0 |
| Bachelor's Degree | 10 (8.0%) | 24.0 |
| Graduate Degree | 115 (92.0%) | 157.0 |
| Total | 125 (100.0%) | 78.0 |
Fertility by Education by Marriage Status in South Kensington
6.4% of women with births in South Kensington are unmarried. Women with the educational attainment of bachelor's degree are most likely to be married with 100.0% of them married at childbirth, while women with the educational attainment of graduate degree are least likely to be married with 7.0% of them unmarried at childbirth.
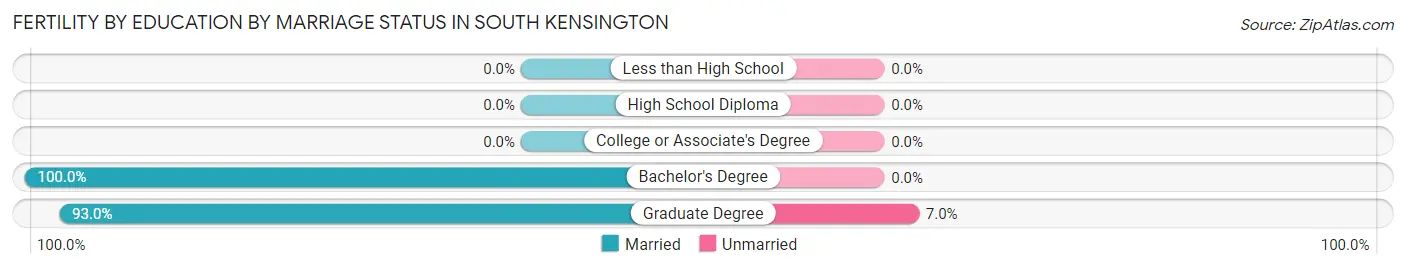
| Educational Attainment | Married | Unmarried |
| Less than High School | 0 (0.0%) | 0 (0.0%) |
| High School Diploma | 0 (0.0%) | 0 (0.0%) |
| College or Associate's Degree | 0 (0.0%) | 0 (0.0%) |
| Bachelor's Degree | 10 (100.0%) | 0 (0.0%) |
| Graduate Degree | 107 (93.0%) | 8 (7.0%) |
| Total | 117 (93.6%) | 8 (6.4%) |
Employment Characteristics in South Kensington
Employment by Class of Employer in South Kensington
Among the 4,119 employed individuals in South Kensington, private company employees (1,940 | 47.1%), federal government employees (958 | 23.3%), and not-for-profit organizations (523 | 12.7%) make up the most common classes of employment.
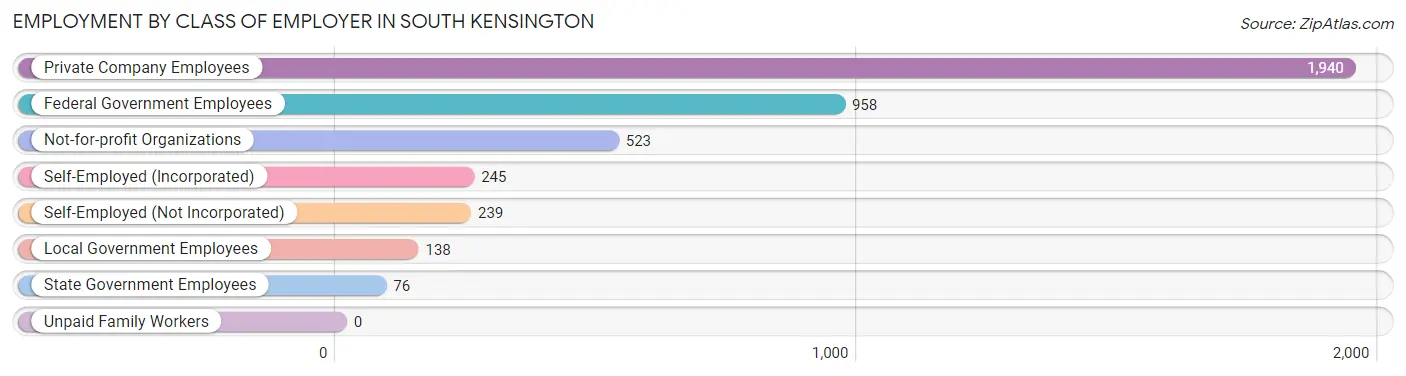
| Employer Class | # Employees | % Employees |
| Private Company Employees | 1,940 | 47.1% |
| Self-Employed (Incorporated) | 245 | 5.9% |
| Self-Employed (Not Incorporated) | 239 | 5.8% |
| Not-for-profit Organizations | 523 | 12.7% |
| Local Government Employees | 138 | 3.4% |
| State Government Employees | 76 | 1.8% |
| Federal Government Employees | 958 | 23.3% |
| Unpaid Family Workers | 0 | 0.0% |
| Total | 4,119 | 100.0% |
Employment Status by Age in South Kensington
According to the labor force statistics for South Kensington, out of the total population over 16 years of age (6,328), 67.7% or 4,284 individuals are in the labor force, with 2.2% or 94 of them unemployed. The age group with the highest labor force participation rate is 30 to 34 years, with 96.0% or 432 individuals in the labor force. Within the labor force, the 16 to 19 years age range has the highest percentage of unemployed individuals, with 16.4% or 18 of them being unemployed.
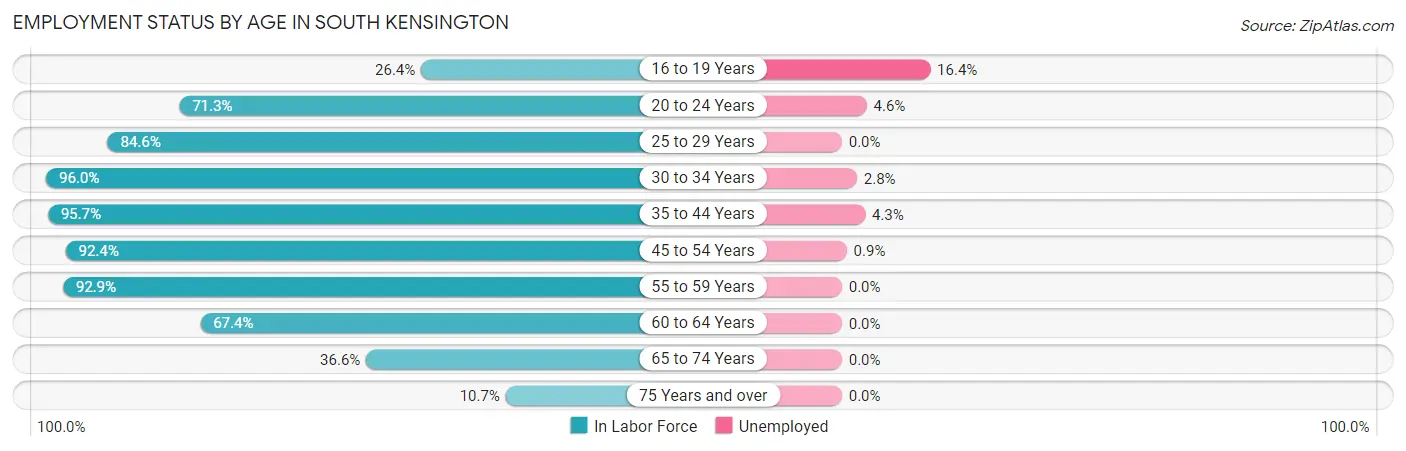
| Age Bracket | In Labor Force | Unemployed |
| 16 to 19 Years | 110 (26.4%) | 18 (16.4%) |
| 20 to 24 Years | 196 (71.3%) | 9 (4.6%) |
| 25 to 29 Years | 55 (84.6%) | 0 (0.0%) |
| 30 to 34 Years | 432 (96.0%) | 12 (2.8%) |
| 35 to 44 Years | 1,123 (95.7%) | 48 (4.3%) |
| 45 to 54 Years | 1,039 (92.4%) | 9 (0.9%) |
| 55 to 59 Years | 560 (92.9%) | 0 (0.0%) |
| 60 to 64 Years | 382 (67.4%) | 0 (0.0%) |
| 65 to 74 Years | 295 (36.6%) | 0 (0.0%) |
| 75 Years and over | 91 (10.7%) | 0 (0.0%) |
| Total | 4,284 (67.7%) | 94 (2.2%) |
Employment Status by Educational Attainment in South Kensington
According to labor force statistics for South Kensington, 90.2% of individuals (3,592) out of the total population between 25 and 64 years of age (3,982) are in the labor force, with 1.9% or 68 of them being unemployed. The group with the highest labor force participation rate are those with the educational attainment of bachelor's degree or higher, with 92.2% or 3,281 individuals in the labor force. Within the labor force, individuals with less than high school education have the highest percentage of unemployment, with 26.3% or 5 of them being unemployed.
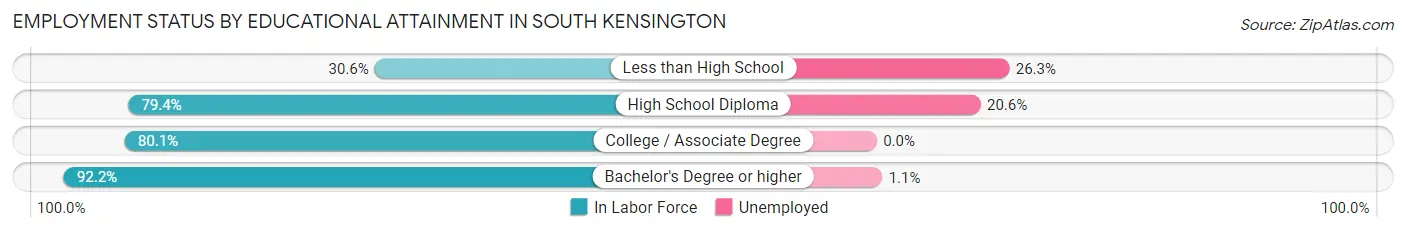
| Educational Attainment | In Labor Force | Unemployed |
| Less than High School | 19 (30.6%) | 16 (26.3%) |
| High School Diploma | 131 (79.4%) | 34 (20.6%) |
| College / Associate Degree | 157 (80.1%) | 0 (0.0%) |
| Bachelor's Degree or higher | 3,281 (92.2%) | 39 (1.1%) |
| Total | 3,592 (90.2%) | 76 (1.9%) |
Employment Occupations by Sex in South Kensington
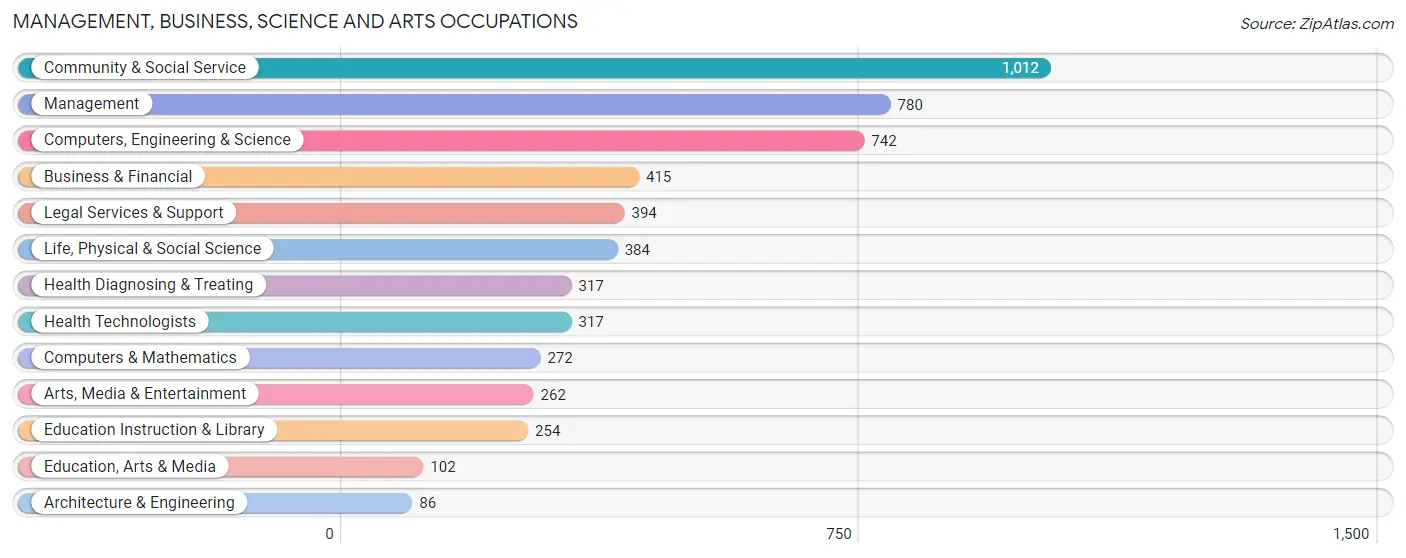
Management, Business, Science and Arts Occupations
The most common Management, Business, Science and Arts occupations in South Kensington are Community & Social Service (1,012 | 24.4%), Management (780 | 18.8%), Computers, Engineering & Science (742 | 17.9%), Business & Financial (415 | 10.0%), and Legal Services & Support (394 | 9.5%).
Management, Business, Science and Arts Occupations by Sex
Within the Management, Business, Science and Arts occupations in South Kensington, the most male-oriented occupations are Architecture & Engineering (74.4%), Computers & Mathematics (73.5%), and Computers, Engineering & Science (65.9%), while the most female-oriented occupations are Health Diagnosing & Treating (76.0%), Health Technologists (76.0%), and Education, Arts & Media (73.5%).
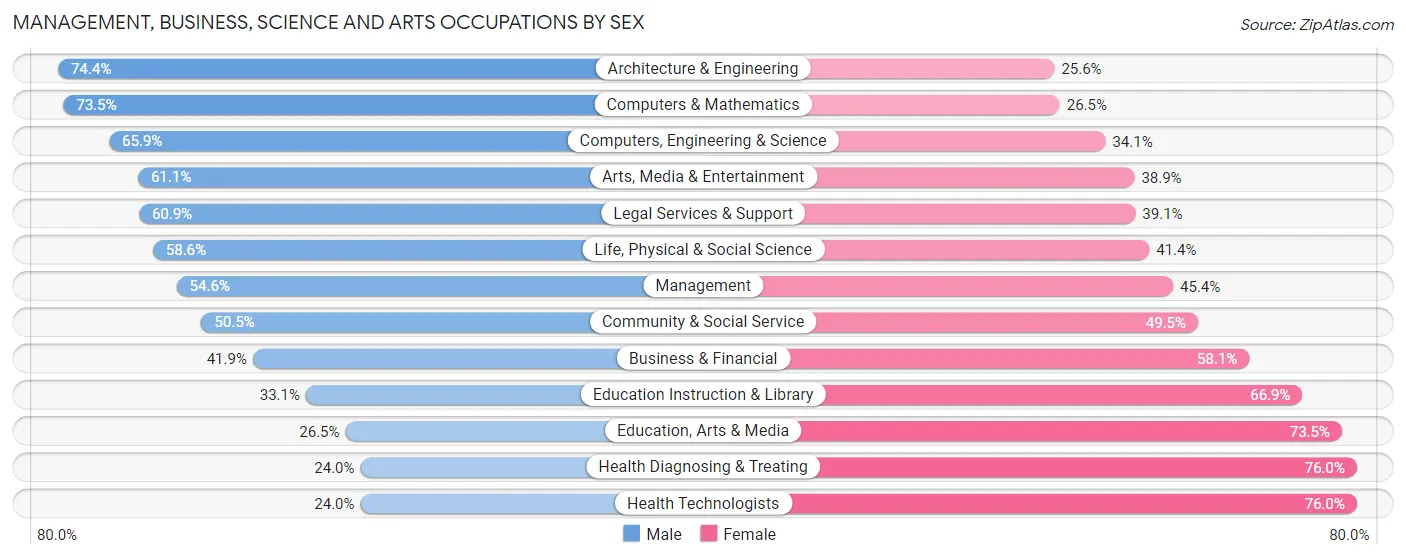
| Occupation | Male | Female |
| Management | 426 (54.6%) | 354 (45.4%) |
| Business & Financial | 174 (41.9%) | 241 (58.1%) |
| Computers, Engineering & Science | 489 (65.9%) | 253 (34.1%) |
| Computers & Mathematics | 200 (73.5%) | 72 (26.5%) |
| Architecture & Engineering | 64 (74.4%) | 22 (25.6%) |
| Life, Physical & Social Science | 225 (58.6%) | 159 (41.4%) |
| Community & Social Service | 511 (50.5%) | 501 (49.5%) |
| Education, Arts & Media | 27 (26.5%) | 75 (73.5%) |
| Legal Services & Support | 240 (60.9%) | 154 (39.1%) |
| Education Instruction & Library | 84 (33.1%) | 170 (66.9%) |
| Arts, Media & Entertainment | 160 (61.1%) | 102 (38.9%) |
| Health Diagnosing & Treating | 76 (24.0%) | 241 (76.0%) |
| Health Technologists | 76 (24.0%) | 241 (76.0%) |
| Total (Category) | 1,676 (51.3%) | 1,590 (48.7%) |
| Total (Overall) | 2,127 (51.2%) | 2,027 (48.8%) |
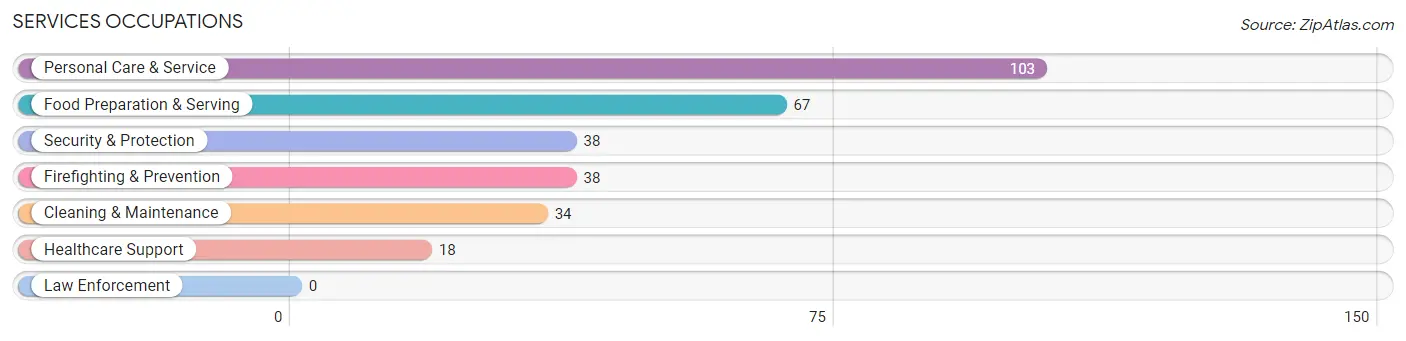
Services Occupations
The most common Services occupations in South Kensington are Personal Care & Service (103 | 2.5%), Food Preparation & Serving (67 | 1.6%), Security & Protection (38 | 0.9%), Firefighting & Prevention (38 | 0.9%), and Cleaning & Maintenance (34 | 0.8%).
Services Occupations by Sex
Within the Services occupations in South Kensington, the most male-oriented occupations are Security & Protection (73.7%), Firefighting & Prevention (73.7%), and Cleaning & Maintenance (70.6%), while the most female-oriented occupations are Healthcare Support (100.0%), Food Preparation & Serving (76.1%), and Personal Care & Service (70.9%).
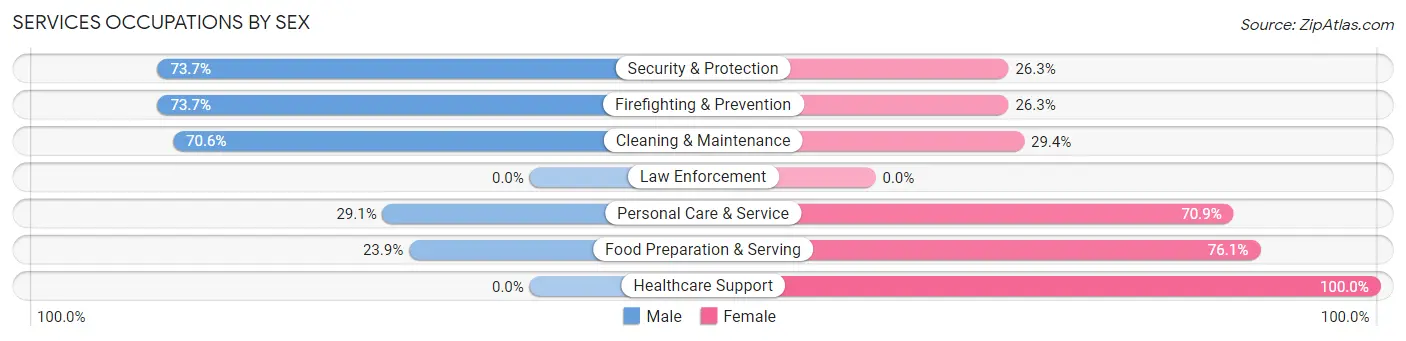
| Occupation | Male | Female |
| Healthcare Support | 0 (0.0%) | 18 (100.0%) |
| Security & Protection | 28 (73.7%) | 10 (26.3%) |
| Firefighting & Prevention | 28 (73.7%) | 10 (26.3%) |
| Law Enforcement | 0 (0.0%) | 0 (0.0%) |
| Food Preparation & Serving | 16 (23.9%) | 51 (76.1%) |
| Cleaning & Maintenance | 24 (70.6%) | 10 (29.4%) |
| Personal Care & Service | 30 (29.1%) | 73 (70.9%) |
| Total (Category) | 98 (37.7%) | 162 (62.3%) |
| Total (Overall) | 2,127 (51.2%) | 2,027 (48.8%) |
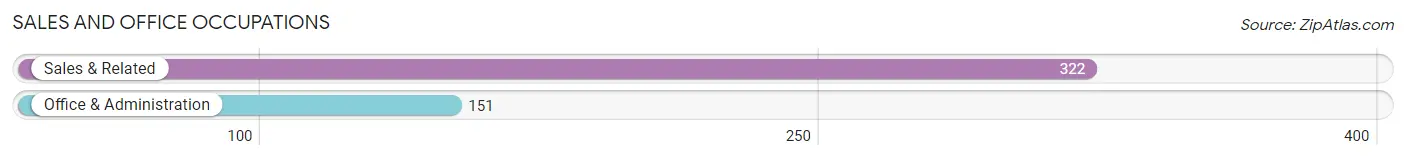
Sales and Office Occupations
The most common Sales and Office occupations in South Kensington are Sales & Related (322 | 7.7%), and Office & Administration (151 | 3.6%).
Sales and Office Occupations by Sex
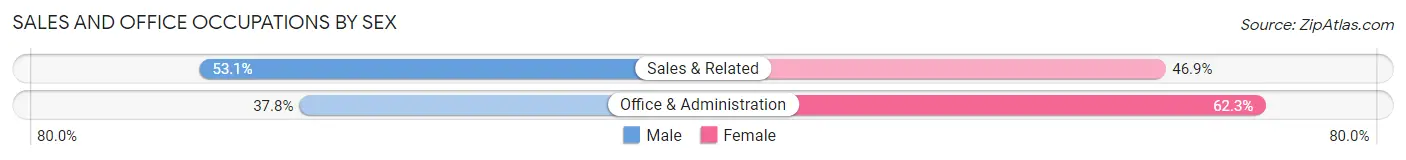
| Occupation | Male | Female |
| Sales & Related | 171 (53.1%) | 151 (46.9%) |
| Office & Administration | 57 (37.8%) | 94 (62.3%) |
| Total (Category) | 228 (48.2%) | 245 (51.8%) |
| Total (Overall) | 2,127 (51.2%) | 2,027 (48.8%) |
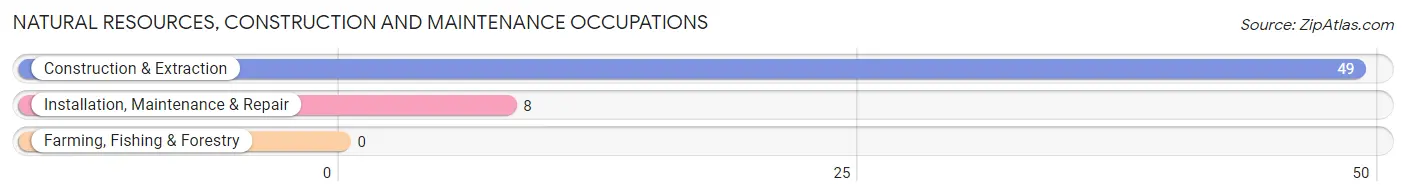
Natural Resources, Construction and Maintenance Occupations
The most common Natural Resources, Construction and Maintenance occupations in South Kensington are Construction & Extraction (49 | 1.2%), and Installation, Maintenance & Repair (8 | 0.2%).
Natural Resources, Construction and Maintenance Occupations by Sex
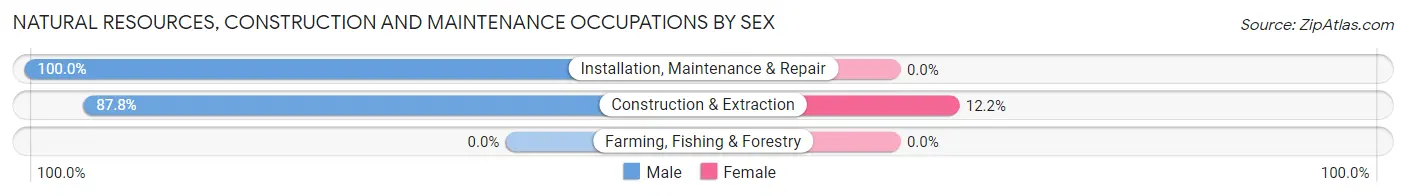
| Occupation | Male | Female |
| Farming, Fishing & Forestry | 0 (0.0%) | 0 (0.0%) |
| Construction & Extraction | 43 (87.8%) | 6 (12.2%) |
| Installation, Maintenance & Repair | 8 (100.0%) | 0 (0.0%) |
| Total (Category) | 51 (89.5%) | 6 (10.5%) |
| Total (Overall) | 2,127 (51.2%) | 2,027 (48.8%) |
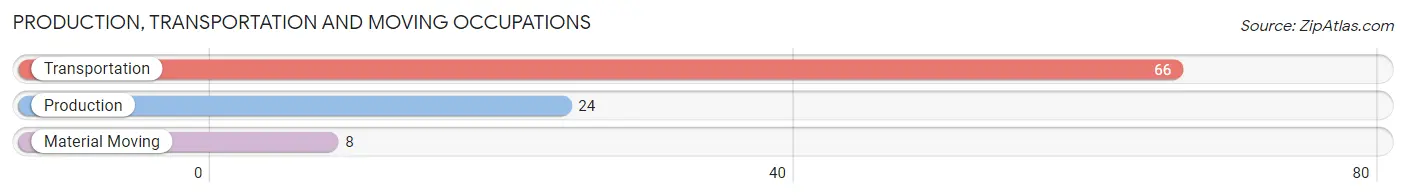
Production, Transportation and Moving Occupations
The most common Production, Transportation and Moving occupations in South Kensington are Transportation (66 | 1.6%), Production (24 | 0.6%), and Material Moving (8 | 0.2%).
Production, Transportation and Moving Occupations by Sex
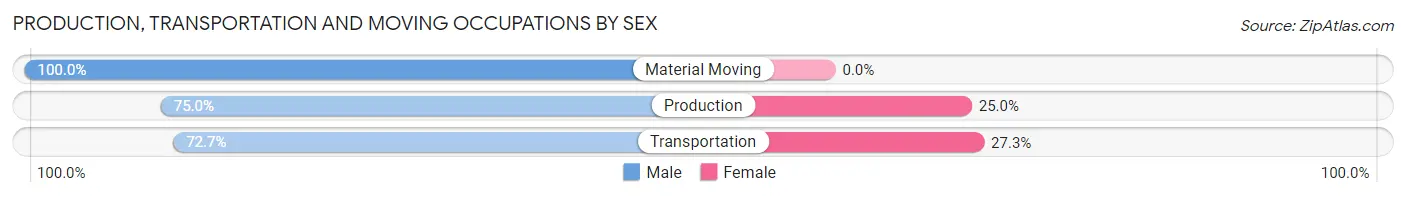
| Occupation | Male | Female |
| Production | 18 (75.0%) | 6 (25.0%) |
| Transportation | 48 (72.7%) | 18 (27.3%) |
| Material Moving | 8 (100.0%) | 0 (0.0%) |
| Total (Category) | 74 (75.5%) | 24 (24.5%) |
| Total (Overall) | 2,127 (51.2%) | 2,027 (48.8%) |
Employment Industries by Sex in South Kensington
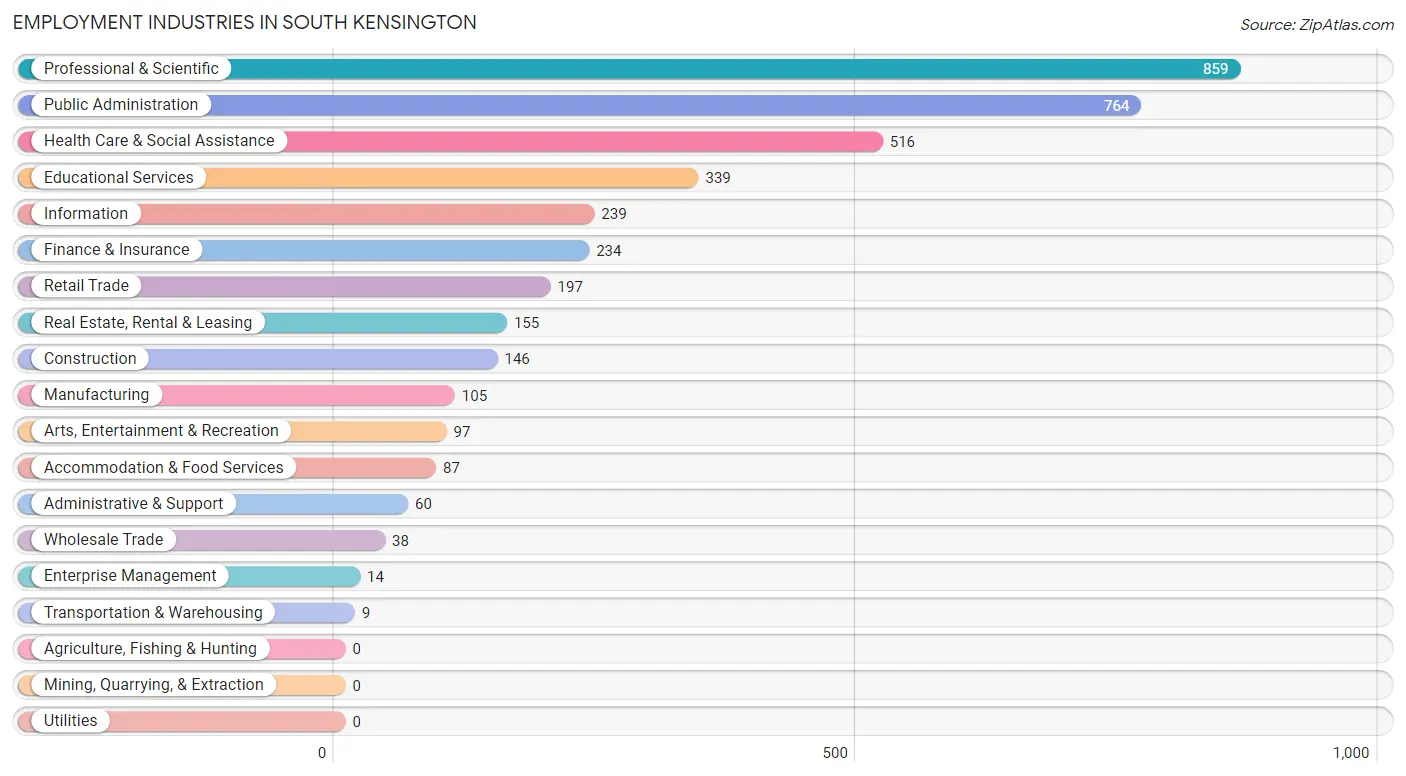
Employment Industries in South Kensington
The major employment industries in South Kensington include Professional & Scientific (859 | 20.7%), Public Administration (764 | 18.4%), Health Care & Social Assistance (516 | 12.4%), Educational Services (339 | 8.2%), and Information (239 | 5.8%).
Employment Industries by Sex in South Kensington
The South Kensington industries that see more men than women are Wholesale Trade (100.0%), Transportation & Warehousing (100.0%), and Enterprise Management (100.0%), whereas the industries that tend to have a higher number of women are Accommodation & Food Services (96.6%), Educational Services (70.8%), and Health Care & Social Assistance (61.6%).
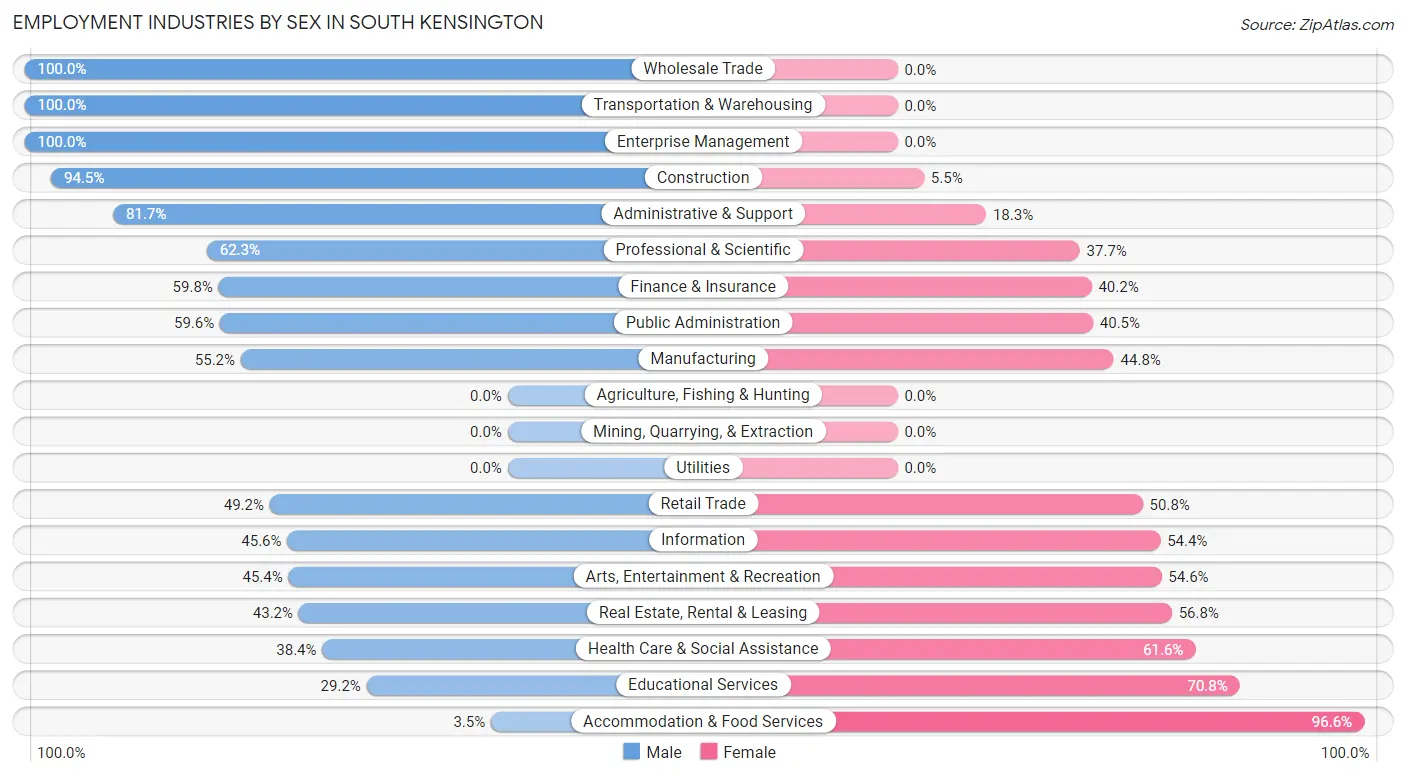
| Industry | Male | Female |
| Agriculture, Fishing & Hunting | 0 (0.0%) | 0 (0.0%) |
| Mining, Quarrying, & Extraction | 0 (0.0%) | 0 (0.0%) |
| Construction | 138 (94.5%) | 8 (5.5%) |
| Manufacturing | 58 (55.2%) | 47 (44.8%) |
| Wholesale Trade | 38 (100.0%) | 0 (0.0%) |
| Retail Trade | 97 (49.2%) | 100 (50.8%) |
| Transportation & Warehousing | 9 (100.0%) | 0 (0.0%) |
| Utilities | 0 (0.0%) | 0 (0.0%) |
| Information | 109 (45.6%) | 130 (54.4%) |
| Finance & Insurance | 140 (59.8%) | 94 (40.2%) |
| Real Estate, Rental & Leasing | 67 (43.2%) | 88 (56.8%) |
| Professional & Scientific | 535 (62.3%) | 324 (37.7%) |
| Enterprise Management | 14 (100.0%) | 0 (0.0%) |
| Administrative & Support | 49 (81.7%) | 11 (18.3%) |
| Educational Services | 99 (29.2%) | 240 (70.8%) |
| Health Care & Social Assistance | 198 (38.4%) | 318 (61.6%) |
| Arts, Entertainment & Recreation | 44 (45.4%) | 53 (54.6%) |
| Accommodation & Food Services | 3 (3.5%) | 84 (96.6%) |
| Public Administration | 455 (59.6%) | 309 (40.5%) |
| Total | 2,127 (51.2%) | 2,027 (48.8%) |
Education in South Kensington
School Enrollment in South Kensington
The most common levels of schooling among the 2,318 students in South Kensington are high school (652 | 28.1%), elementary school (495 | 21.3%), and middle school (422 | 18.2%).
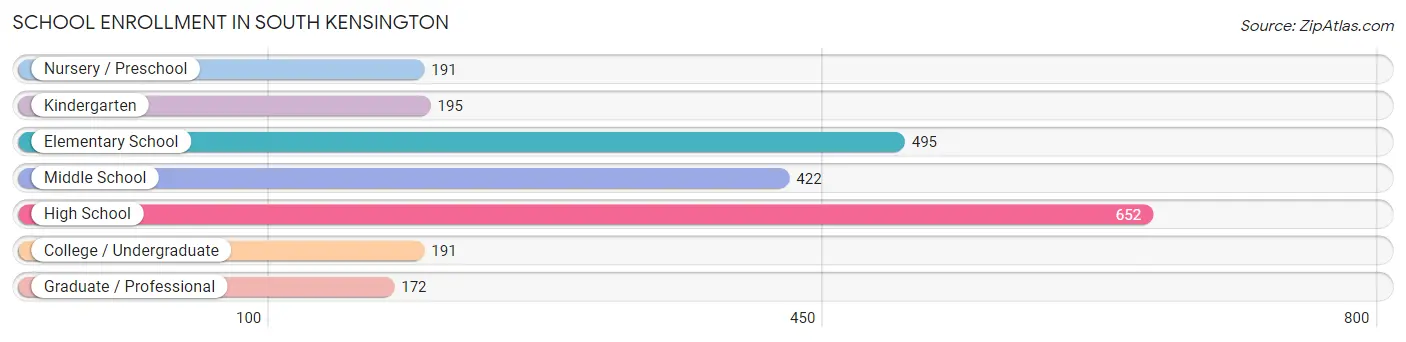
| School Level | # Students | % Students |
| Nursery / Preschool | 191 | 8.2% |
| Kindergarten | 195 | 8.4% |
| Elementary School | 495 | 21.3% |
| Middle School | 422 | 18.2% |
| High School | 652 | 28.1% |
| College / Undergraduate | 191 | 8.2% |
| Graduate / Professional | 172 | 7.4% |
| Total | 2,318 | 100.0% |
School Enrollment by Age by Funding Source in South Kensington
Out of a total of 2,318 students who are enrolled in schools in South Kensington, 837 (36.1%) attend a private institution, while the remaining 1,481 (63.9%) are enrolled in public schools. The age group of 25 to 34 year olds has the highest likelihood of being enrolled in private schools, with 41 (100.0% in the age bracket) enrolled. Conversely, the age group of 18 to 19 year olds has the lowest likelihood of being enrolled in a private school, with 55 (94.8% in the age bracket) attending a public institution.
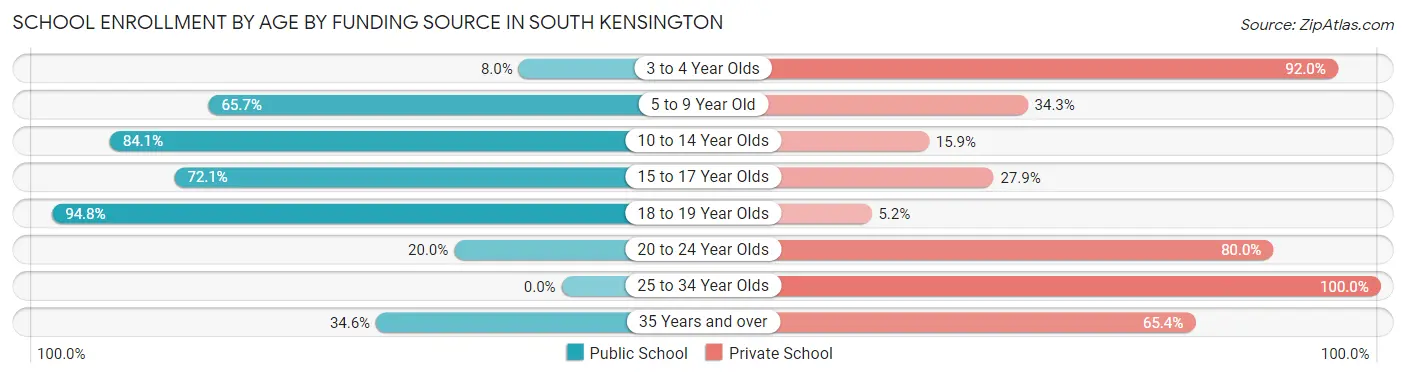
| Age Bracket | Public School | Private School |
| 3 to 4 Year Olds | 10 (8.0%) | 115 (92.0%) |
| 5 to 9 Year Old | 426 (65.7%) | 222 (34.3%) |
| 10 to 14 Year Olds | 525 (84.1%) | 99 (15.9%) |
| 15 to 17 Year Olds | 390 (72.1%) | 151 (27.9%) |
| 18 to 19 Year Olds | 55 (94.8%) | 3 (5.2%) |
| 20 to 24 Year Olds | 29 (20.0%) | 116 (80.0%) |
| 25 to 34 Year Olds | 0 (0.0%) | 41 (100.0%) |
| 35 Years and over | 47 (34.6%) | 89 (65.4%) |
| Total | 1,481 (63.9%) | 837 (36.1%) |
Educational Attainment by Field of Study in South Kensington
Social sciences (930 | 17.7%), business (698 | 13.3%), liberal arts & history (450 | 8.6%), literature & languages (449 | 8.5%), and bio, nature & agricultural (420 | 8.0%) are the most common fields of study among 5,256 individuals in South Kensington who have obtained a bachelor's degree or higher.
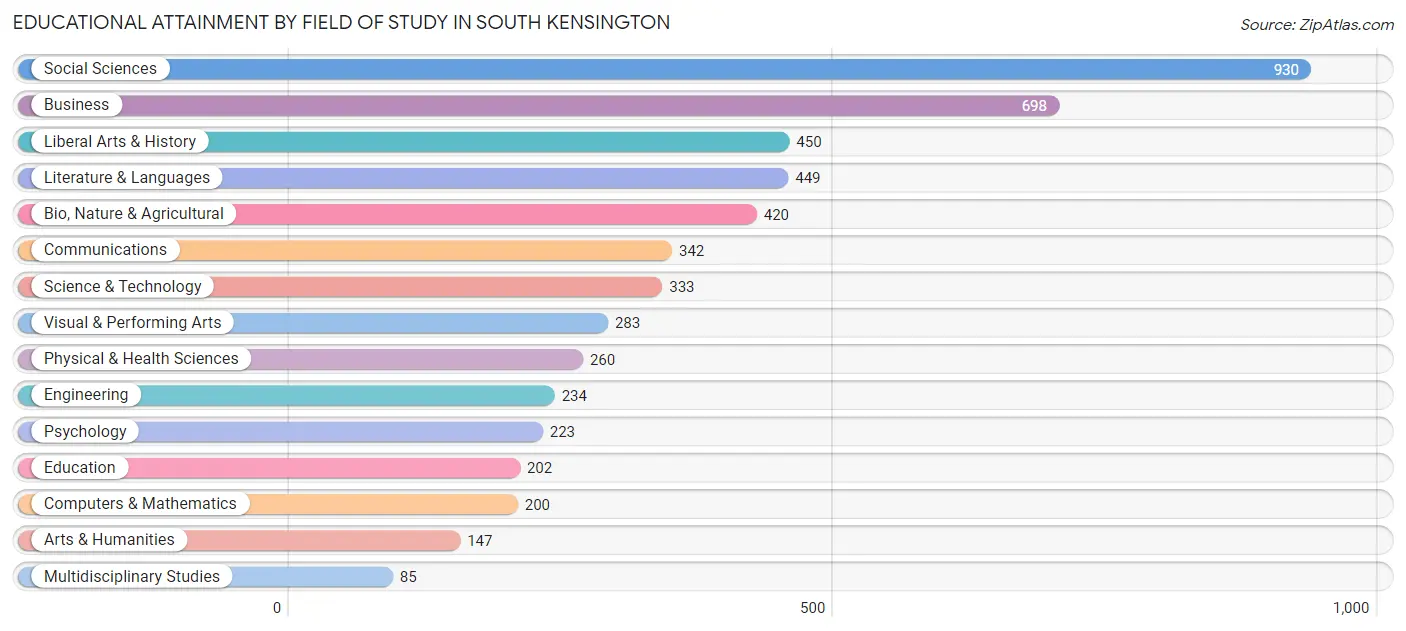
| Field of Study | # Graduates | % Graduates |
| Computers & Mathematics | 200 | 3.8% |
| Bio, Nature & Agricultural | 420 | 8.0% |
| Physical & Health Sciences | 260 | 5.0% |
| Psychology | 223 | 4.2% |
| Social Sciences | 930 | 17.7% |
| Engineering | 234 | 4.4% |
| Multidisciplinary Studies | 85 | 1.6% |
| Science & Technology | 333 | 6.3% |
| Business | 698 | 13.3% |
| Education | 202 | 3.8% |
| Literature & Languages | 449 | 8.5% |
| Liberal Arts & History | 450 | 8.6% |
| Visual & Performing Arts | 283 | 5.4% |
| Communications | 342 | 6.5% |
| Arts & Humanities | 147 | 2.8% |
| Total | 5,256 | 100.0% |
Transportation & Commute in South Kensington
Vehicle Availability by Sex in South Kensington
The most prevalent vehicle ownership categories in South Kensington are males with 2 vehicles (1,118, accounting for 52.6%) and females with 2 vehicles (1,078, making up 56.4%).
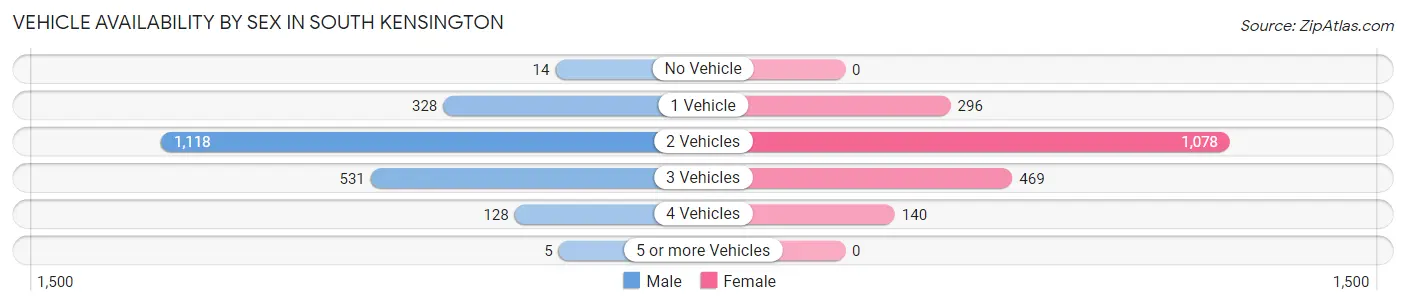
| Vehicles Available | Male | Female |
| No Vehicle | 14 (0.7%) | 0 (0.0%) |
| 1 Vehicle | 328 (15.4%) | 296 (14.9%) |
| 2 Vehicles | 1,118 (52.6%) | 1,078 (54.4%) |
| 3 Vehicles | 531 (25.0%) | 469 (23.6%) |
| 4 Vehicles | 128 (6.0%) | 140 (7.1%) |
| 5 or more Vehicles | 5 (0.2%) | 0 (0.0%) |
| Total | 2,124 (100.0%) | 1,983 (100.0%) |
Commute Time in South Kensington
The most frequently occuring commute durations in South Kensington are 15 to 19 minutes (370 commuters, 13.1%), 25 to 29 minutes (363 commuters, 12.9%), and 30 to 34 minutes (356 commuters, 12.6%).
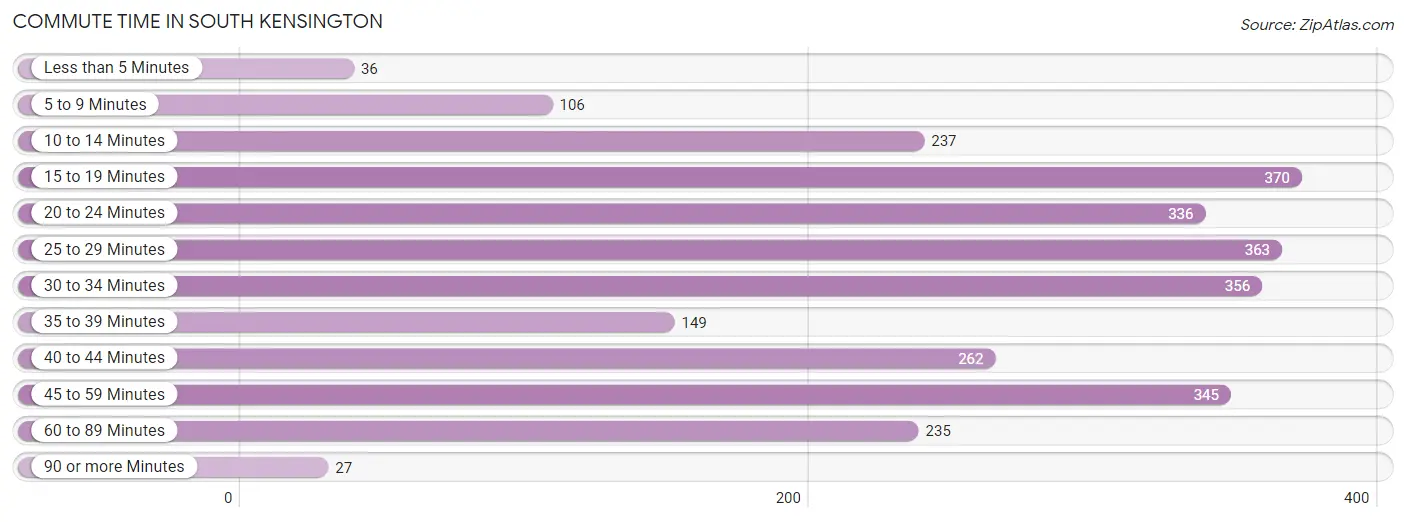
| Commute Time | # Commuters | % Commuters |
| Less than 5 Minutes | 36 | 1.3% |
| 5 to 9 Minutes | 106 | 3.8% |
| 10 to 14 Minutes | 237 | 8.4% |
| 15 to 19 Minutes | 370 | 13.1% |
| 20 to 24 Minutes | 336 | 11.9% |
| 25 to 29 Minutes | 363 | 12.9% |
| 30 to 34 Minutes | 356 | 12.6% |
| 35 to 39 Minutes | 149 | 5.3% |
| 40 to 44 Minutes | 262 | 9.3% |
| 45 to 59 Minutes | 345 | 12.2% |
| 60 to 89 Minutes | 235 | 8.3% |
| 90 or more Minutes | 27 | 1.0% |
Commute Time by Sex in South Kensington
The most common commute times in South Kensington are 30 to 34 minutes (259 commuters, 16.9%) for males and 20 to 24 minutes (198 commuters, 15.4%) for females.
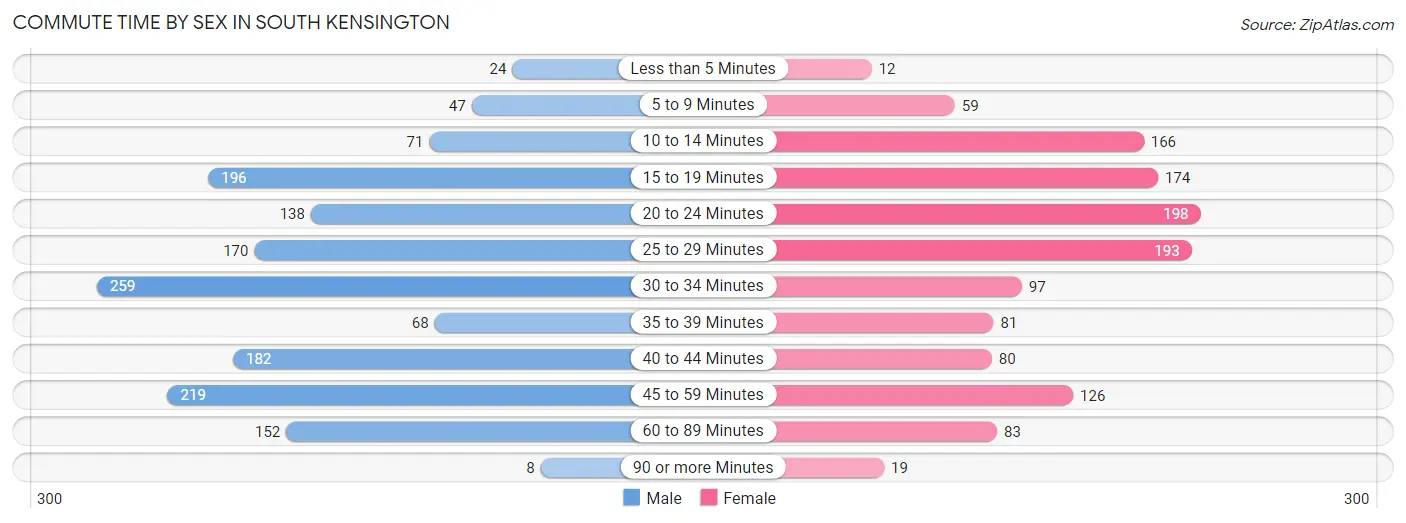
| Commute Time | Male | Female |
| Less than 5 Minutes | 24 (1.6%) | 12 (0.9%) |
| 5 to 9 Minutes | 47 (3.1%) | 59 (4.6%) |
| 10 to 14 Minutes | 71 (4.6%) | 166 (12.9%) |
| 15 to 19 Minutes | 196 (12.8%) | 174 (13.5%) |
| 20 to 24 Minutes | 138 (9.0%) | 198 (15.4%) |
| 25 to 29 Minutes | 170 (11.1%) | 193 (15.0%) |
| 30 to 34 Minutes | 259 (16.9%) | 97 (7.5%) |
| 35 to 39 Minutes | 68 (4.4%) | 81 (6.3%) |
| 40 to 44 Minutes | 182 (11.9%) | 80 (6.2%) |
| 45 to 59 Minutes | 219 (14.3%) | 126 (9.8%) |
| 60 to 89 Minutes | 152 (9.9%) | 83 (6.4%) |
| 90 or more Minutes | 8 (0.5%) | 19 (1.5%) |
Time of Departure to Work by Sex in South Kensington
The most frequent times of departure to work in South Kensington are 8:00 AM to 8:29 AM (288, 18.8%) for males and 8:00 AM to 8:29 AM (278, 21.6%) for females.
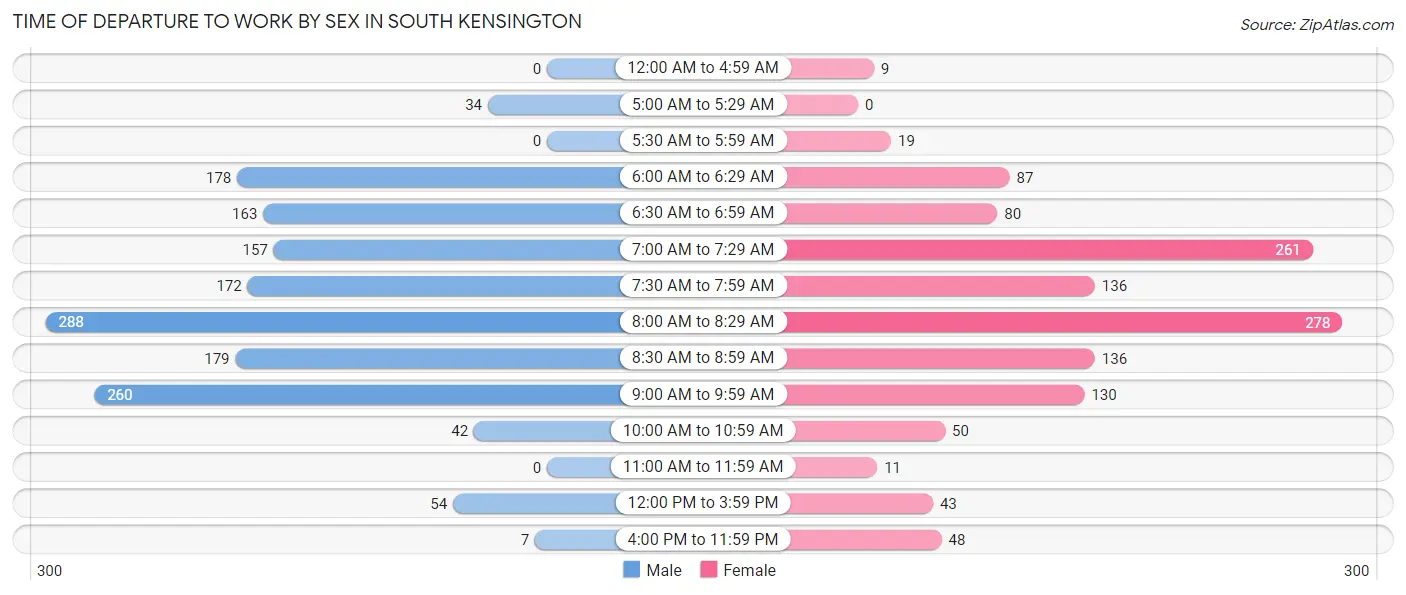
| Time of Departure | Male | Female |
| 12:00 AM to 4:59 AM | 0 (0.0%) | 9 (0.7%) |
| 5:00 AM to 5:29 AM | 34 (2.2%) | 0 (0.0%) |
| 5:30 AM to 5:59 AM | 0 (0.0%) | 19 (1.5%) |
| 6:00 AM to 6:29 AM | 178 (11.6%) | 87 (6.8%) |
| 6:30 AM to 6:59 AM | 163 (10.6%) | 80 (6.2%) |
| 7:00 AM to 7:29 AM | 157 (10.2%) | 261 (20.3%) |
| 7:30 AM to 7:59 AM | 172 (11.2%) | 136 (10.6%) |
| 8:00 AM to 8:29 AM | 288 (18.8%) | 278 (21.6%) |
| 8:30 AM to 8:59 AM | 179 (11.7%) | 136 (10.6%) |
| 9:00 AM to 9:59 AM | 260 (17.0%) | 130 (10.1%) |
| 10:00 AM to 10:59 AM | 42 (2.7%) | 50 (3.9%) |
| 11:00 AM to 11:59 AM | 0 (0.0%) | 11 (0.9%) |
| 12:00 PM to 3:59 PM | 54 (3.5%) | 43 (3.3%) |
| 4:00 PM to 11:59 PM | 7 (0.5%) | 48 (3.7%) |
| Total | 1,534 (100.0%) | 1,288 (100.0%) |
Housing Occupancy in South Kensington
Occupancy by Ownership in South Kensington
Of the total 2,923 dwellings in South Kensington, owner-occupied units account for 2,547 (87.1%), while renter-occupied units make up 376 (12.9%).
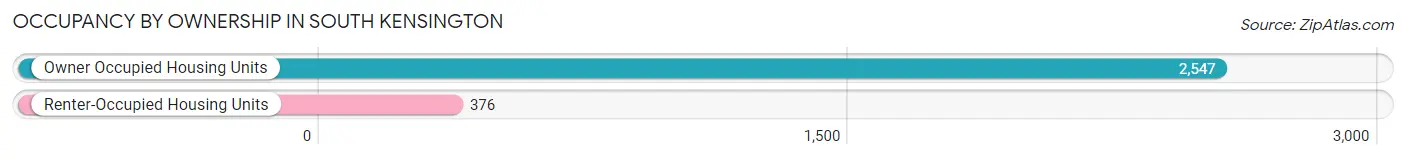
| Occupancy | # Housing Units | % Housing Units |
| Owner Occupied Housing Units | 2,547 | 87.1% |
| Renter-Occupied Housing Units | 376 | 12.9% |
| Total Occupied Housing Units | 2,923 | 100.0% |
Occupancy by Household Size in South Kensington
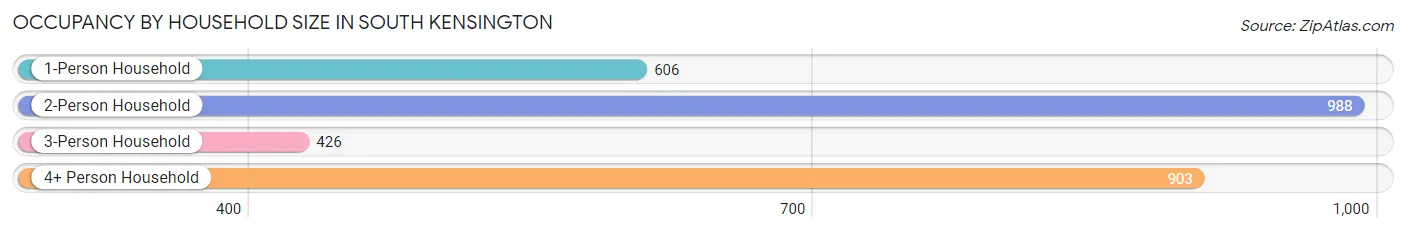
| Household Size | # Housing Units | % Housing Units |
| 1-Person Household | 606 | 20.7% |
| 2-Person Household | 988 | 33.8% |
| 3-Person Household | 426 | 14.6% |
| 4+ Person Household | 903 | 30.9% |
| Total Housing Units | 2,923 | 100.0% |
Occupancy by Ownership by Household Size in South Kensington
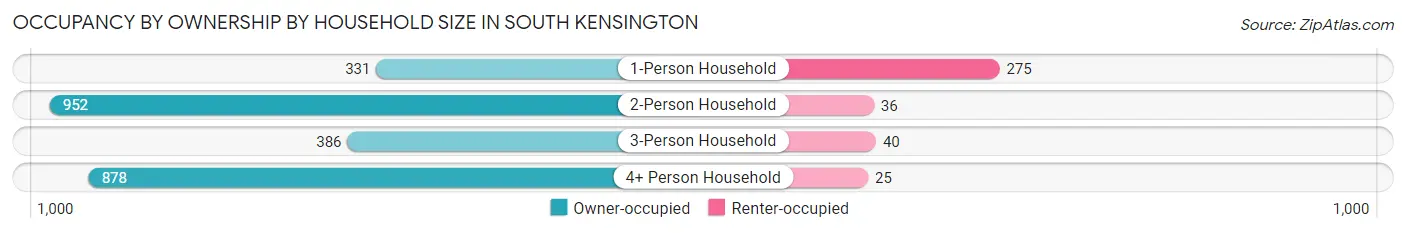
| Household Size | Owner-occupied | Renter-occupied |
| 1-Person Household | 331 (54.6%) | 275 (45.4%) |
| 2-Person Household | 952 (96.4%) | 36 (3.6%) |
| 3-Person Household | 386 (90.6%) | 40 (9.4%) |
| 4+ Person Household | 878 (97.2%) | 25 (2.8%) |
| Total Housing Units | 2,547 (87.1%) | 376 (12.9%) |
Occupancy by Educational Attainment in South Kensington
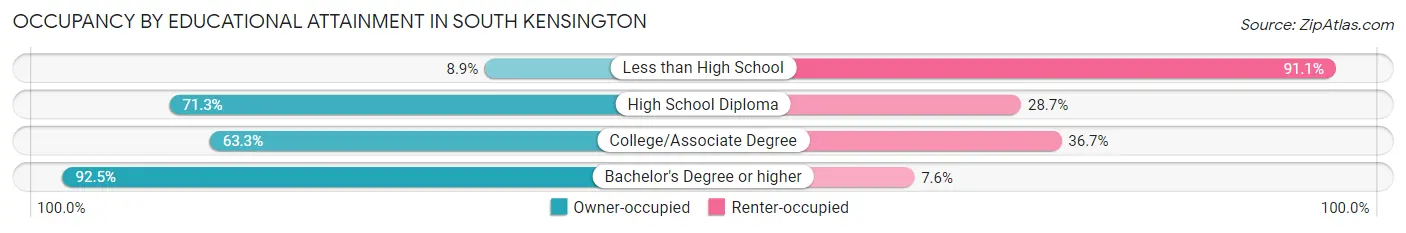
| Household Size | Owner-occupied | Renter-occupied |
| Less than High School | 4 (8.9%) | 41 (91.1%) |
| High School Diploma | 67 (71.3%) | 27 (28.7%) |
| College/Associate Degree | 212 (63.3%) | 123 (36.7%) |
| Bachelor's Degree or higher | 2,264 (92.4%) | 185 (7.5%) |
Occupancy by Age of Householder in South Kensington
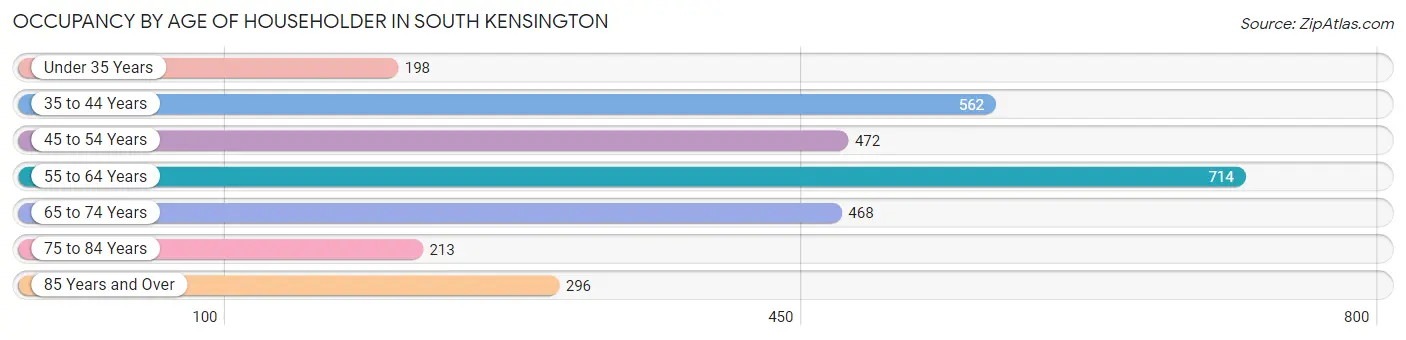
| Age Bracket | # Households | % Households |
| Under 35 Years | 198 | 6.8% |
| 35 to 44 Years | 562 | 19.2% |
| 45 to 54 Years | 472 | 16.2% |
| 55 to 64 Years | 714 | 24.4% |
| 65 to 74 Years | 468 | 16.0% |
| 75 to 84 Years | 213 | 7.3% |
| 85 Years and Over | 296 | 10.1% |
| Total | 2,923 | 100.0% |
Housing Finances in South Kensington
Median Income by Occupancy in South Kensington
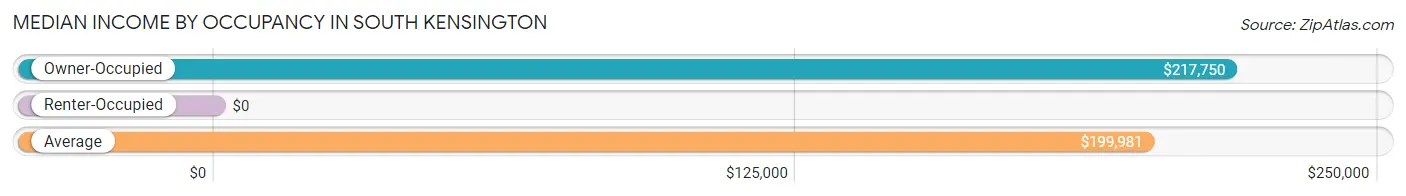
| Occupancy Type | # Households | Median Income |
| Owner-Occupied | 2,547 (87.1%) | $217,750 |
| Renter-Occupied | 376 (12.9%) | $0 |
| Average | 2,923 (100.0%) | $199,981 |
Occupancy by Householder Income Bracket in South Kensington
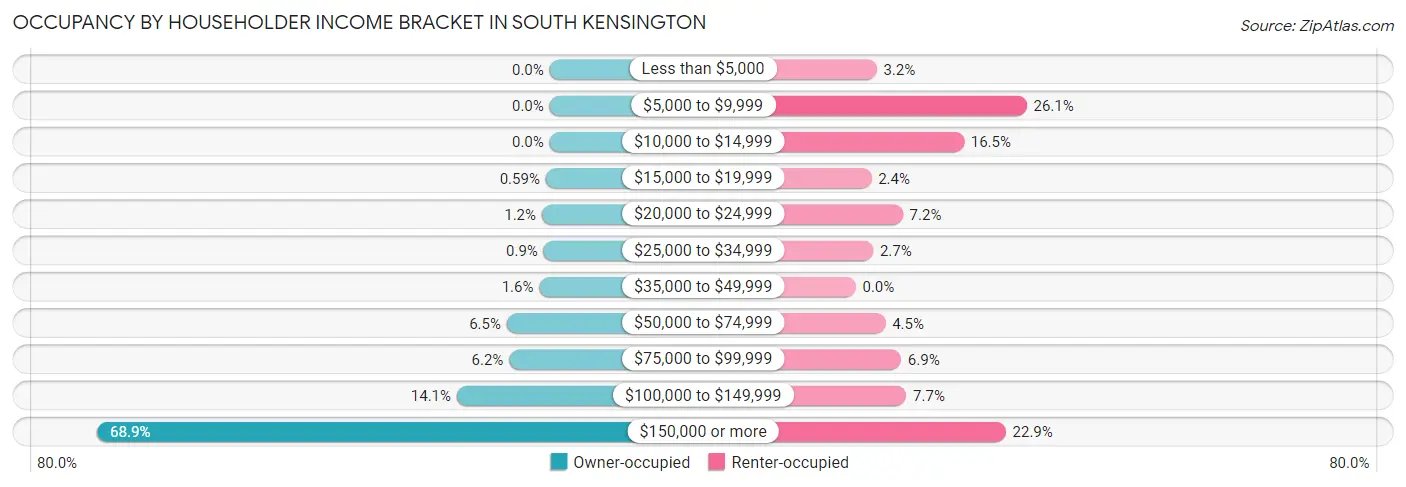
| Income Bracket | Owner-occupied | Renter-occupied |
| Less than $5,000 | 0 (0.0%) | 12 (3.2%) |
| $5,000 to $9,999 | 0 (0.0%) | 98 (26.1%) |
| $10,000 to $14,999 | 0 (0.0%) | 62 (16.5%) |
| $15,000 to $19,999 | 15 (0.6%) | 9 (2.4%) |
| $20,000 to $24,999 | 30 (1.2%) | 27 (7.2%) |
| $25,000 to $34,999 | 23 (0.9%) | 10 (2.7%) |
| $35,000 to $49,999 | 40 (1.6%) | 0 (0.0%) |
| $50,000 to $74,999 | 166 (6.5%) | 17 (4.5%) |
| $75,000 to $99,999 | 157 (6.2%) | 26 (6.9%) |
| $100,000 to $149,999 | 360 (14.1%) | 29 (7.7%) |
| $150,000 or more | 1,756 (68.9%) | 86 (22.9%) |
| Total | 2,547 (100.0%) | 376 (100.0%) |
Monthly Housing Cost Tiers in South Kensington
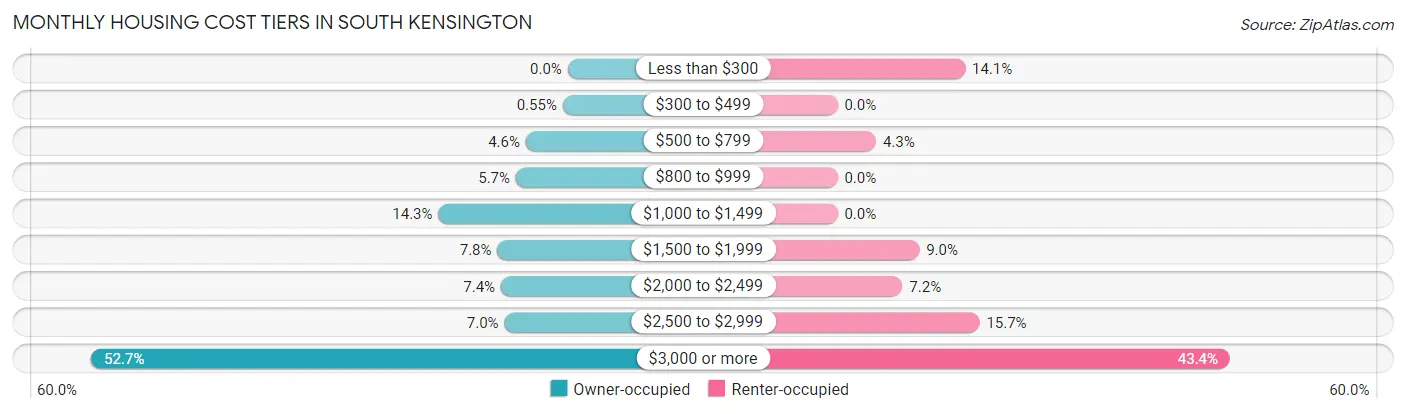
| Monthly Cost | Owner-occupied | Renter-occupied |
| Less than $300 | 0 (0.0%) | 53 (14.1%) |
| $300 to $499 | 14 (0.5%) | 0 (0.0%) |
| $500 to $799 | 118 (4.6%) | 16 (4.3%) |
| $800 to $999 | 146 (5.7%) | 0 (0.0%) |
| $1,000 to $1,499 | 364 (14.3%) | 0 (0.0%) |
| $1,500 to $1,999 | 198 (7.8%) | 34 (9.0%) |
| $2,000 to $2,499 | 188 (7.4%) | 27 (7.2%) |
| $2,500 to $2,999 | 178 (7.0%) | 59 (15.7%) |
| $3,000 or more | 1,341 (52.6%) | 163 (43.3%) |
| Total | 2,547 (100.0%) | 376 (100.0%) |
Physical Housing Characteristics in South Kensington
Housing Structures in South Kensington
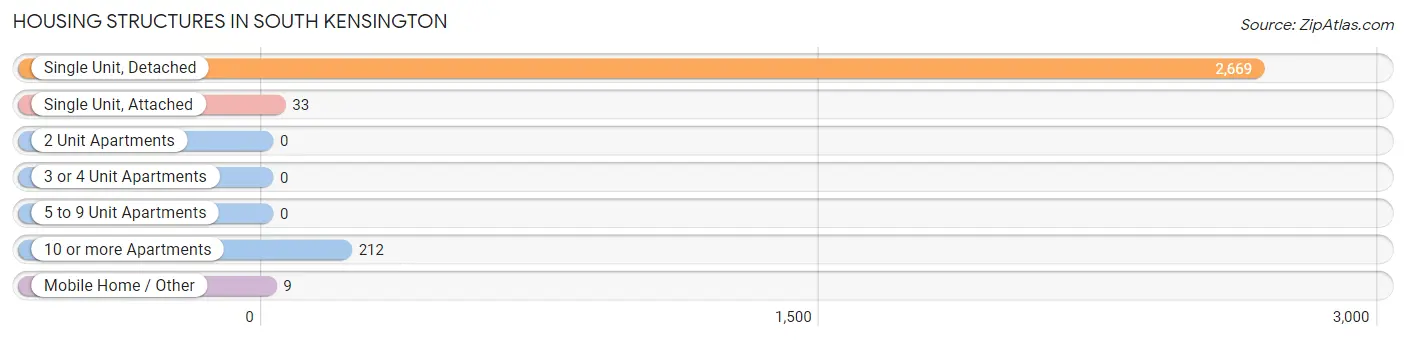
| Structure Type | # Housing Units | % Housing Units |
| Single Unit, Detached | 2,669 | 91.3% |
| Single Unit, Attached | 33 | 1.1% |
| 2 Unit Apartments | 0 | 0.0% |
| 3 or 4 Unit Apartments | 0 | 0.0% |
| 5 to 9 Unit Apartments | 0 | 0.0% |
| 10 or more Apartments | 212 | 7.2% |
| Mobile Home / Other | 9 | 0.3% |
| Total | 2,923 | 100.0% |
Housing Structures by Occupancy in South Kensington
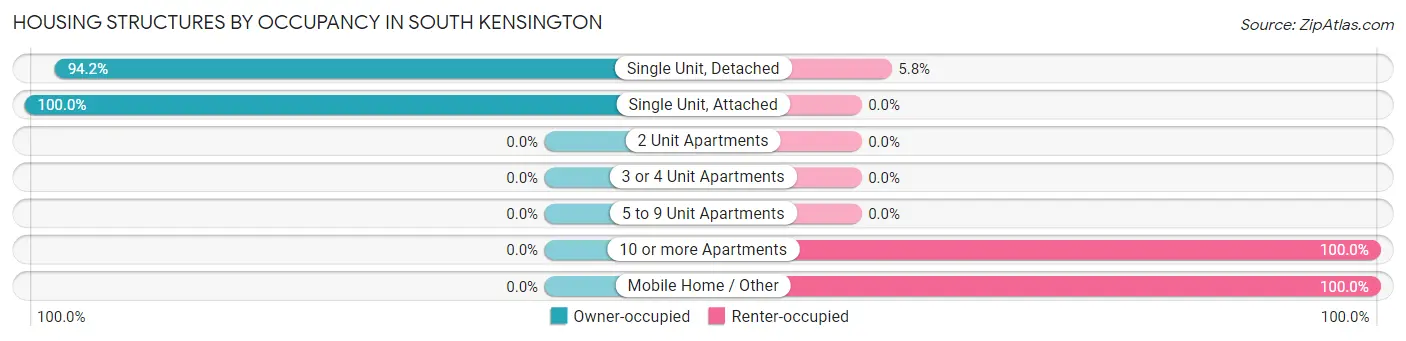
| Structure Type | Owner-occupied | Renter-occupied |
| Single Unit, Detached | 2,514 (94.2%) | 155 (5.8%) |
| Single Unit, Attached | 33 (100.0%) | 0 (0.0%) |
| 2 Unit Apartments | 0 (0.0%) | 0 (0.0%) |
| 3 or 4 Unit Apartments | 0 (0.0%) | 0 (0.0%) |
| 5 to 9 Unit Apartments | 0 (0.0%) | 0 (0.0%) |
| 10 or more Apartments | 0 (0.0%) | 212 (100.0%) |
| Mobile Home / Other | 0 (0.0%) | 9 (100.0%) |
| Total | 2,547 (87.1%) | 376 (12.9%) |
Housing Structures by Number of Rooms in South Kensington
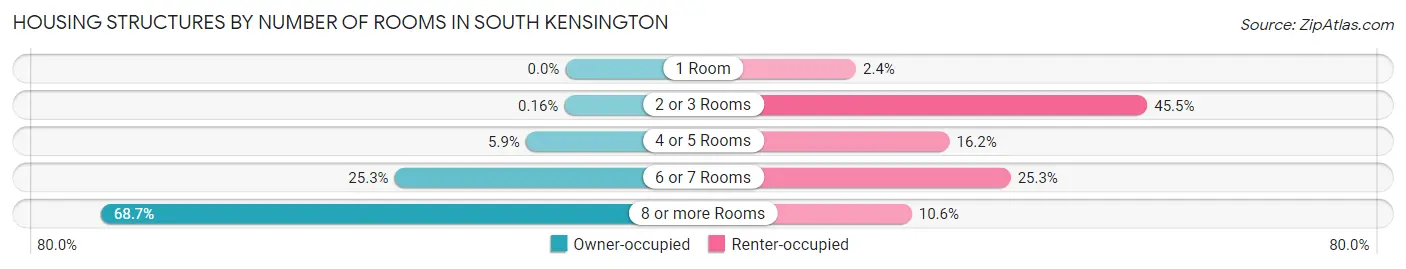
| Number of Rooms | Owner-occupied | Renter-occupied |
| 1 Room | 0 (0.0%) | 9 (2.4%) |
| 2 or 3 Rooms | 4 (0.2%) | 171 (45.5%) |
| 4 or 5 Rooms | 149 (5.9%) | 61 (16.2%) |
| 6 or 7 Rooms | 644 (25.3%) | 95 (25.3%) |
| 8 or more Rooms | 1,750 (68.7%) | 40 (10.6%) |
| Total | 2,547 (100.0%) | 376 (100.0%) |
Housing Structure by Heating Type in South Kensington
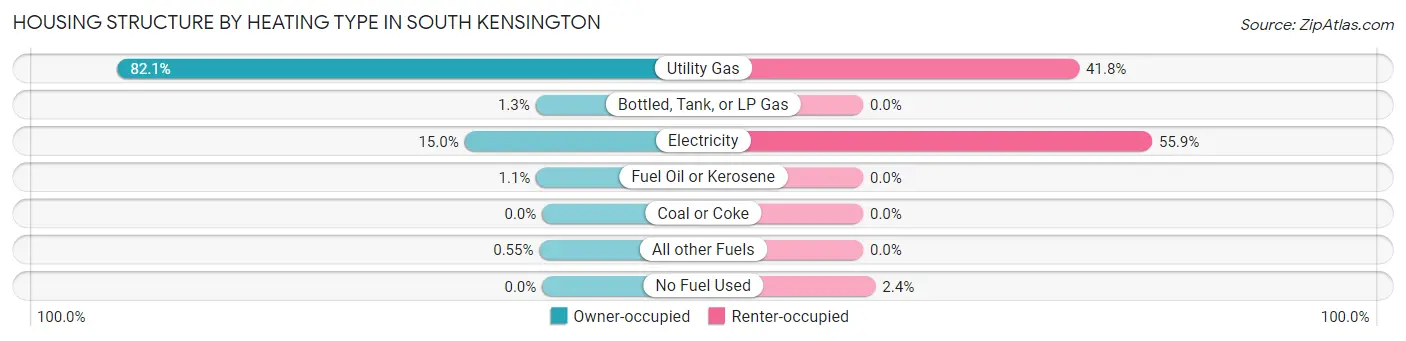
| Heating Type | Owner-occupied | Renter-occupied |
| Utility Gas | 2,090 (82.1%) | 157 (41.8%) |
| Bottled, Tank, or LP Gas | 32 (1.3%) | 0 (0.0%) |
| Electricity | 382 (15.0%) | 210 (55.8%) |
| Fuel Oil or Kerosene | 29 (1.1%) | 0 (0.0%) |
| Coal or Coke | 0 (0.0%) | 0 (0.0%) |
| All other Fuels | 14 (0.5%) | 0 (0.0%) |
| No Fuel Used | 0 (0.0%) | 9 (2.4%) |
| Total | 2,547 (100.0%) | 376 (100.0%) |
Household Vehicle Usage in South Kensington
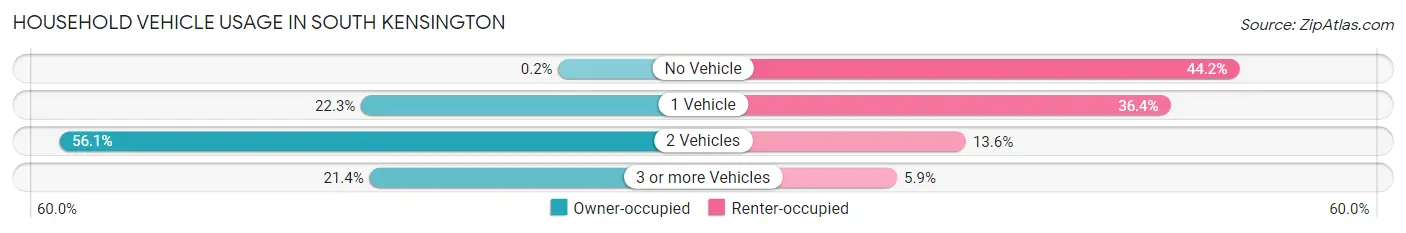
| Vehicles per Household | Owner-occupied | Renter-occupied |
| No Vehicle | 5 (0.2%) | 166 (44.2%) |
| 1 Vehicle | 568 (22.3%) | 137 (36.4%) |
| 2 Vehicles | 1,430 (56.1%) | 51 (13.6%) |
| 3 or more Vehicles | 544 (21.4%) | 22 (5.9%) |
| Total | 2,547 (100.0%) | 376 (100.0%) |
Real Estate & Mortgages in South Kensington
Real Estate and Mortgage Overview in South Kensington
| Characteristic | Without Mortgage | With Mortgage |
| Housing Units | 640 | 1,907 |
| Median Property Value | $852,300 | $909,700 |
| Median Household Income | $151,250 | $1,436 |
| Monthly Housing Costs | $1,082 | $1,341 |
| Real Estate Taxes | $7,793 | $0 |
Property Value by Mortgage Status in South Kensington
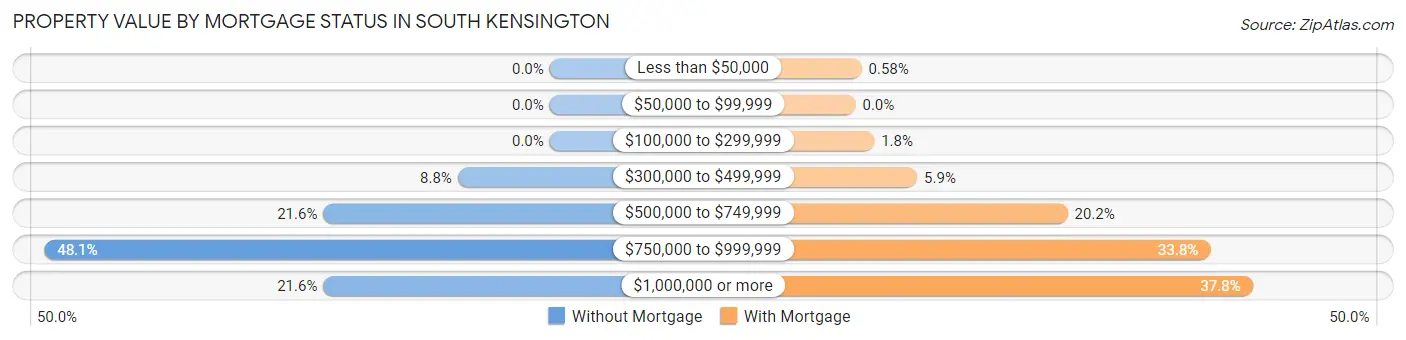
| Property Value | Without Mortgage | With Mortgage |
| Less than $50,000 | 0 (0.0%) | 11 (0.6%) |
| $50,000 to $99,999 | 0 (0.0%) | 0 (0.0%) |
| $100,000 to $299,999 | 0 (0.0%) | 34 (1.8%) |
| $300,000 to $499,999 | 56 (8.7%) | 112 (5.9%) |
| $500,000 to $749,999 | 138 (21.6%) | 385 (20.2%) |
| $750,000 to $999,999 | 308 (48.1%) | 644 (33.8%) |
| $1,000,000 or more | 138 (21.6%) | 721 (37.8%) |
| Total | 640 (100.0%) | 1,907 (100.0%) |
Household Income by Mortgage Status in South Kensington
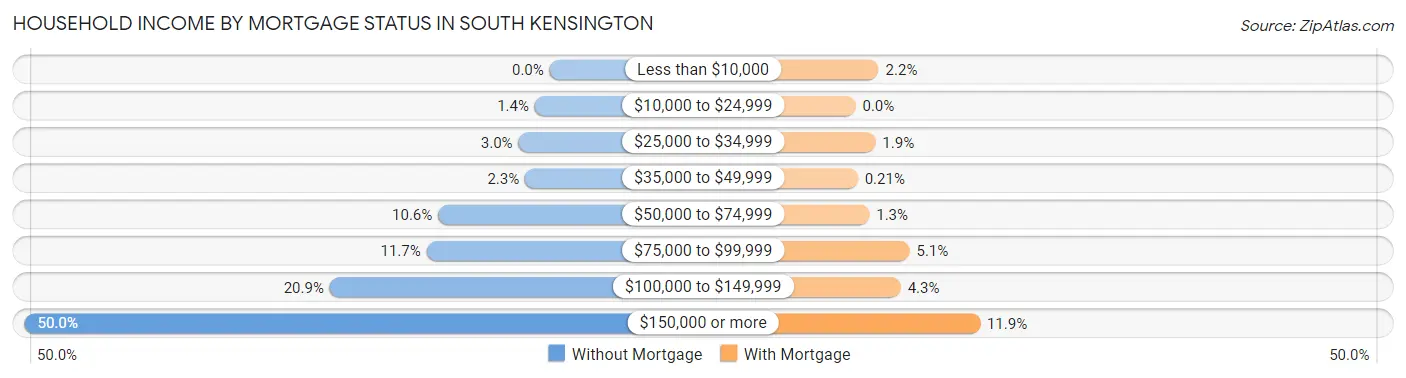
| Household Income | Without Mortgage | With Mortgage |
| Less than $10,000 | 0 (0.0%) | 42 (2.2%) |
| $10,000 to $24,999 | 9 (1.4%) | 0 (0.0%) |
| $25,000 to $34,999 | 19 (3.0%) | 36 (1.9%) |
| $35,000 to $49,999 | 15 (2.3%) | 4 (0.2%) |
| $50,000 to $74,999 | 68 (10.6%) | 25 (1.3%) |
| $75,000 to $99,999 | 75 (11.7%) | 98 (5.1%) |
| $100,000 to $149,999 | 134 (20.9%) | 82 (4.3%) |
| $150,000 or more | 320 (50.0%) | 226 (11.8%) |
| Total | 640 (100.0%) | 1,907 (100.0%) |
Property Value to Household Income Ratio in South Kensington
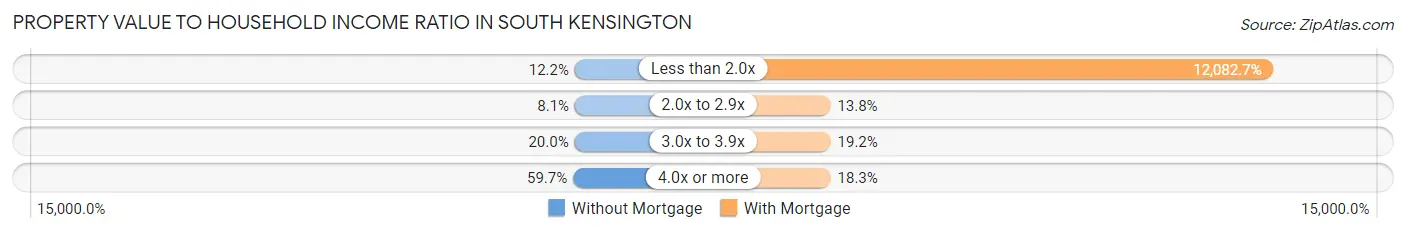
| Value-to-Income Ratio | Without Mortgage | With Mortgage |
| Less than 2.0x | 78 (12.2%) | 230,417 (12,082.7%) |
| 2.0x to 2.9x | 52 (8.1%) | 264 (13.8%) |
| 3.0x to 3.9x | 128 (20.0%) | 366 (19.2%) |
| 4.0x or more | 382 (59.7%) | 349 (18.3%) |
| Total | 640 (100.0%) | 1,907 (100.0%) |
Real Estate Taxes by Mortgage Status in South Kensington
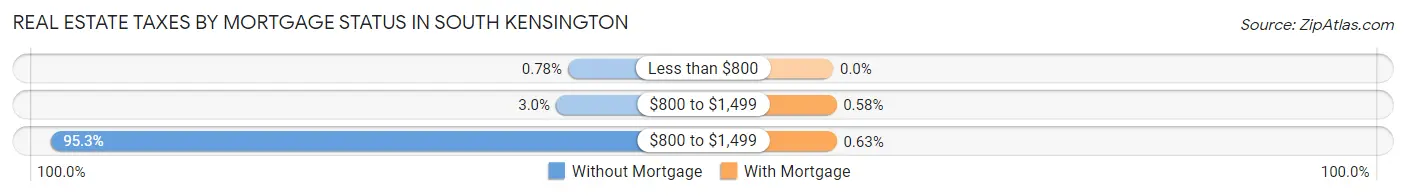
| Property Taxes | Without Mortgage | With Mortgage |
| Less than $800 | 5 (0.8%) | 0 (0.0%) |
| $800 to $1,499 | 19 (3.0%) | 11 (0.6%) |
| $800 to $1,499 | 610 (95.3%) | 12 (0.6%) |
| Total | 640 (100.0%) | 1,907 (100.0%) |
Health & Disability in South Kensington
Health Insurance Coverage by Age in South Kensington
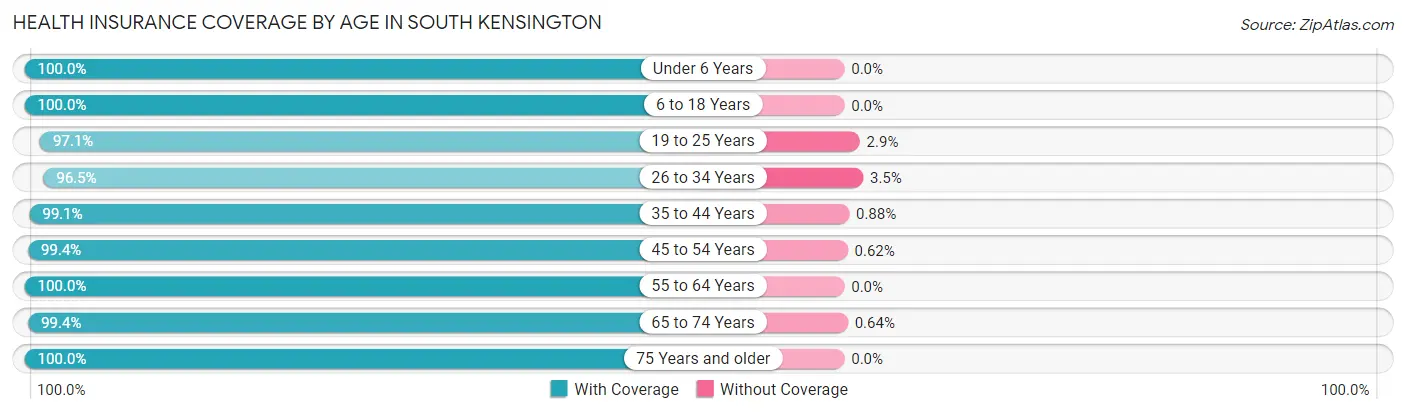
| Age Bracket | With Coverage | Without Coverage |
| Under 6 Years | 664 (100.0%) | 0 (0.0%) |
| 6 to 18 Years | 1,753 (100.0%) | 0 (0.0%) |
| 19 to 25 Years | 306 (97.1%) | 9 (2.9%) |
| 26 to 34 Years | 497 (96.5%) | 18 (3.5%) |
| 35 to 44 Years | 1,130 (99.1%) | 10 (0.9%) |
| 45 to 54 Years | 1,117 (99.4%) | 7 (0.6%) |
| 55 to 64 Years | 1,152 (100.0%) | 0 (0.0%) |
| 65 to 74 Years | 775 (99.4%) | 5 (0.6%) |
| 75 Years and older | 742 (100.0%) | 0 (0.0%) |
| Total | 8,136 (99.4%) | 49 (0.6%) |
Health Insurance Coverage by Citizenship Status in South Kensington
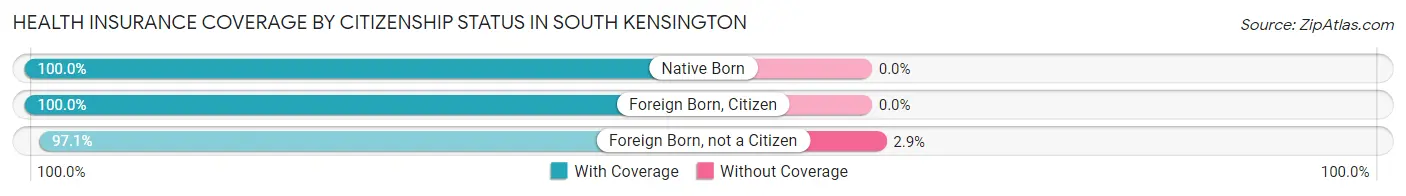
| Citizenship Status | With Coverage | Without Coverage |
| Native Born | 664 (100.0%) | 0 (0.0%) |
| Foreign Born, Citizen | 1,753 (100.0%) | 0 (0.0%) |
| Foreign Born, not a Citizen | 306 (97.1%) | 9 (2.9%) |
Health Insurance Coverage by Household Income in South Kensington
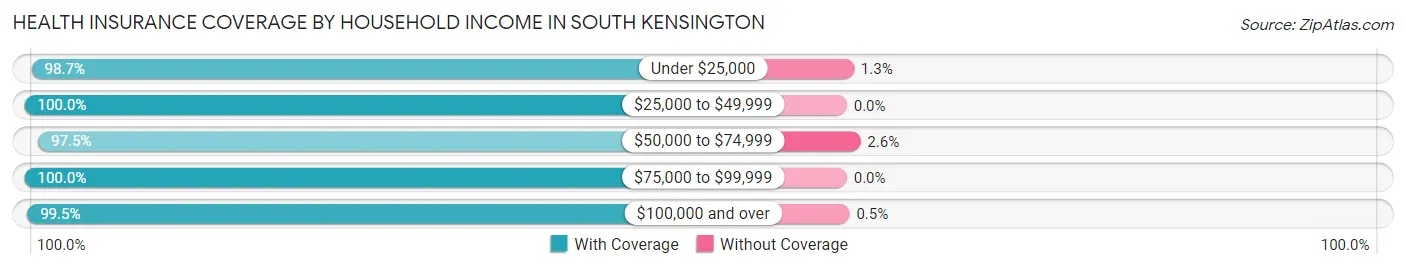
| Household Income | With Coverage | Without Coverage |
| Under $25,000 | 371 (98.7%) | 5 (1.3%) |
| $25,000 to $49,999 | 122 (100.0%) | 0 (0.0%) |
| $50,000 to $74,999 | 344 (97.5%) | 9 (2.5%) |
| $75,000 to $99,999 | 302 (100.0%) | 0 (0.0%) |
| $100,000 and over | 6,976 (99.5%) | 35 (0.5%) |
Public vs Private Health Insurance Coverage by Age in South Kensington
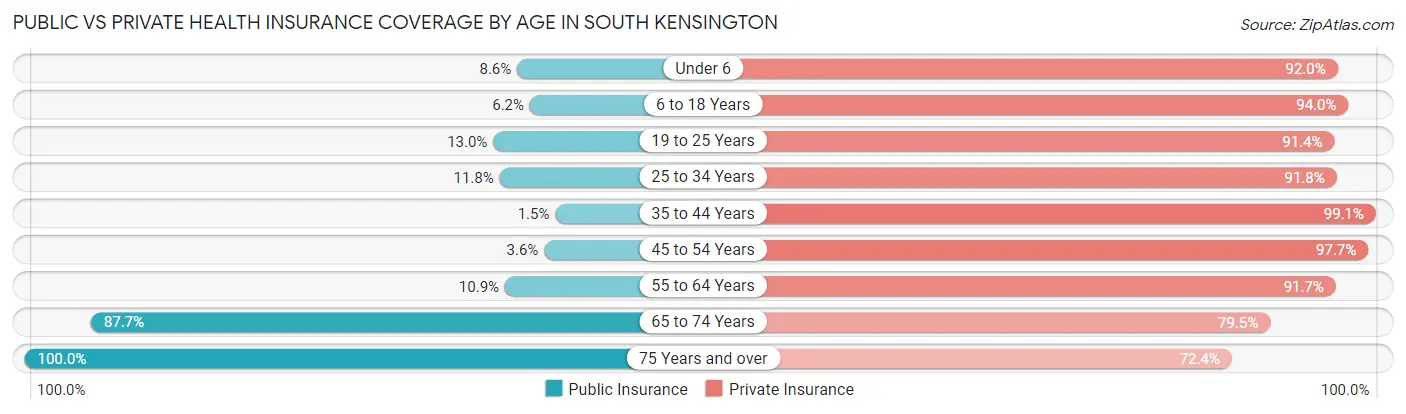
| Age Bracket | Public Insurance | Private Insurance |
| Under 6 | 57 (8.6%) | 611 (92.0%) |
| 6 to 18 Years | 109 (6.2%) | 1,648 (94.0%) |
| 19 to 25 Years | 41 (13.0%) | 288 (91.4%) |
| 25 to 34 Years | 61 (11.8%) | 473 (91.8%) |
| 35 to 44 Years | 17 (1.5%) | 1,130 (99.1%) |
| 45 to 54 Years | 40 (3.6%) | 1,098 (97.7%) |
| 55 to 64 Years | 125 (10.8%) | 1,056 (91.7%) |
| 65 to 74 Years | 684 (87.7%) | 620 (79.5%) |
| 75 Years and over | 742 (100.0%) | 537 (72.4%) |
| Total | 1,876 (22.9%) | 7,461 (91.1%) |
Disability Status by Sex by Age in South Kensington
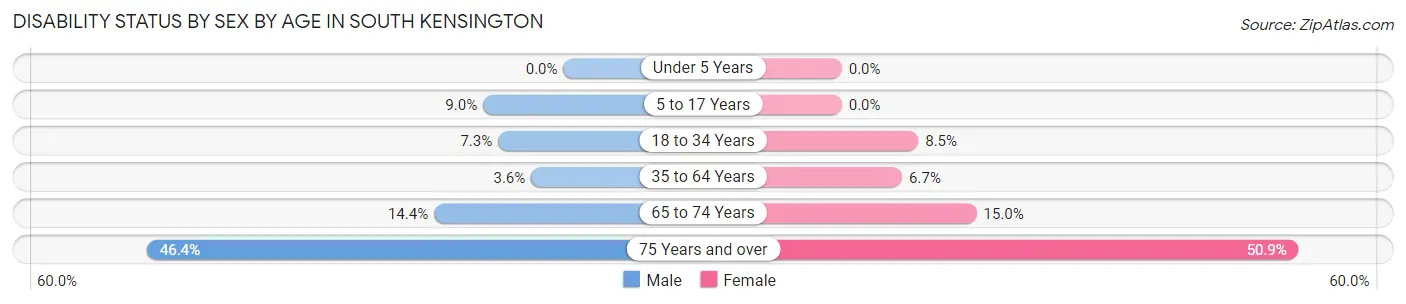
| Age Bracket | Male | Female |
| Under 5 Years | 0 (0.0%) | 0 (0.0%) |
| 5 to 17 Years | 85 (8.9%) | 0 (0.0%) |
| 18 to 34 Years | 29 (7.3%) | 39 (8.5%) |
| 35 to 64 Years | 59 (3.6%) | 119 (6.7%) |
| 65 to 74 Years | 50 (14.4%) | 65 (15.0%) |
| 75 Years and over | 160 (46.4%) | 202 (50.9%) |
Disability Class by Sex by Age in South Kensington
Disability Class: Hearing Difficulty
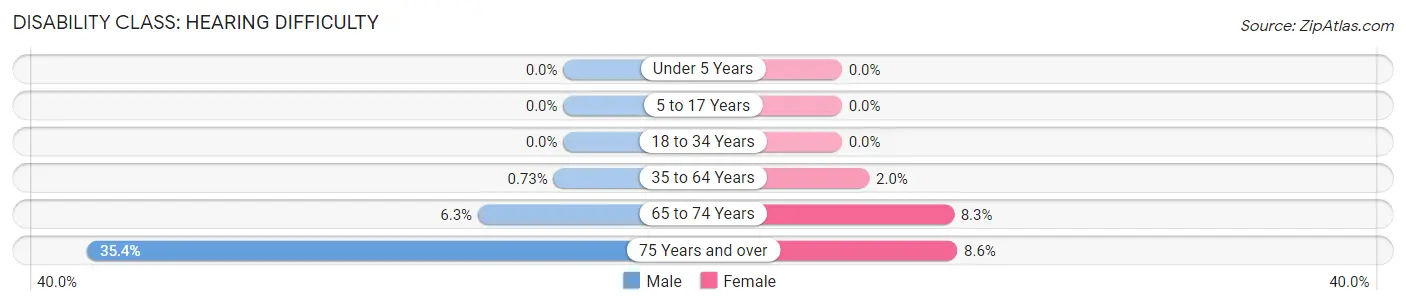
| Age Bracket | Male | Female |
| Under 5 Years | 0 (0.0%) | 0 (0.0%) |
| 5 to 17 Years | 0 (0.0%) | 0 (0.0%) |
| 18 to 34 Years | 0 (0.0%) | 0 (0.0%) |
| 35 to 64 Years | 12 (0.7%) | 36 (2.0%) |
| 65 to 74 Years | 22 (6.3%) | 36 (8.3%) |
| 75 Years and over | 122 (35.4%) | 34 (8.6%) |
Disability Class: Vision Difficulty

| Age Bracket | Male | Female |
| Under 5 Years | 0 (0.0%) | 0 (0.0%) |
| 5 to 17 Years | 0 (0.0%) | 0 (0.0%) |
| 18 to 34 Years | 0 (0.0%) | 0 (0.0%) |
| 35 to 64 Years | 18 (1.1%) | 0 (0.0%) |
| 65 to 74 Years | 9 (2.6%) | 14 (3.2%) |
| 75 Years and over | 0 (0.0%) | 39 (9.8%) |
Disability Class: Cognitive Difficulty
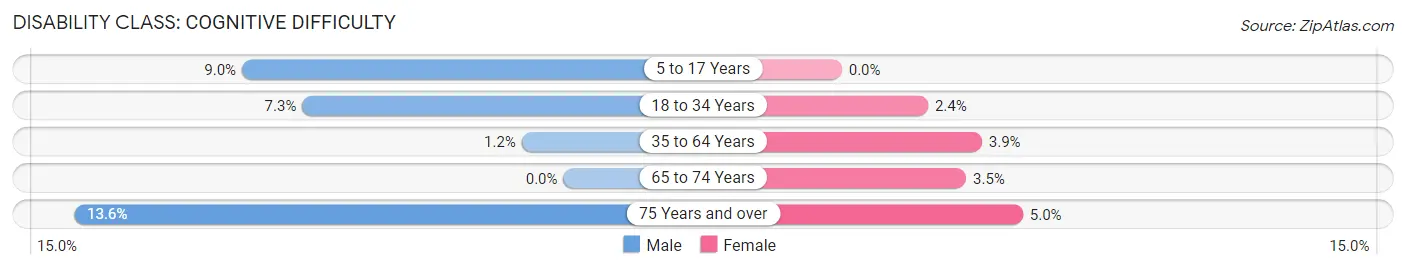
| Age Bracket | Male | Female |
| 5 to 17 Years | 85 (8.9%) | 0 (0.0%) |
| 18 to 34 Years | 29 (7.3%) | 11 (2.4%) |
| 35 to 64 Years | 19 (1.2%) | 69 (3.9%) |
| 65 to 74 Years | 0 (0.0%) | 15 (3.5%) |
| 75 Years and over | 47 (13.6%) | 20 (5.0%) |
Disability Class: Ambulatory Difficulty
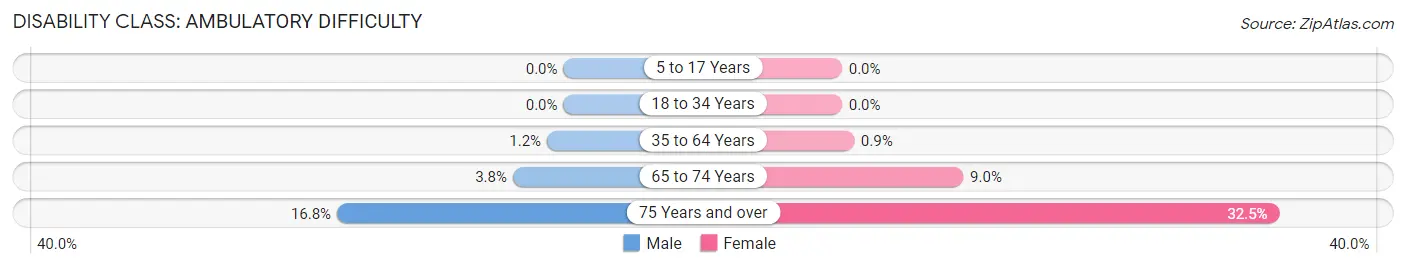
| Age Bracket | Male | Female |
| 5 to 17 Years | 0 (0.0%) | 0 (0.0%) |
| 18 to 34 Years | 0 (0.0%) | 0 (0.0%) |
| 35 to 64 Years | 20 (1.2%) | 16 (0.9%) |
| 65 to 74 Years | 13 (3.7%) | 39 (9.0%) |
| 75 Years and over | 58 (16.8%) | 129 (32.5%) |
Disability Class: Self-Care Difficulty
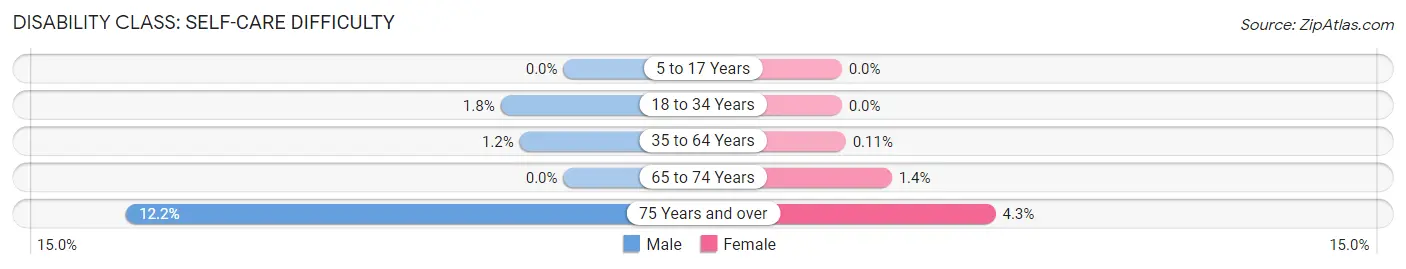
| Age Bracket | Male | Female |
| 5 to 17 Years | 0 (0.0%) | 0 (0.0%) |
| 18 to 34 Years | 7 (1.8%) | 0 (0.0%) |
| 35 to 64 Years | 20 (1.2%) | 2 (0.1%) |
| 65 to 74 Years | 0 (0.0%) | 6 (1.4%) |
| 75 Years and over | 42 (12.2%) | 17 (4.3%) |
Technology Access in South Kensington
Computing Device Access in South Kensington
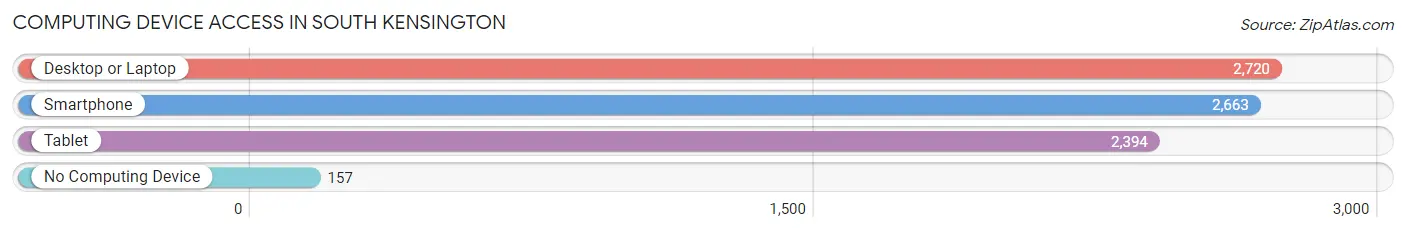
| Device Type | # Households | % Households |
| Desktop or Laptop | 2,720 | 93.1% |
| Smartphone | 2,663 | 91.1% |
| Tablet | 2,394 | 81.9% |
| No Computing Device | 157 | 5.4% |
| Total | 2,923 | 100.0% |
Internet Access in South Kensington
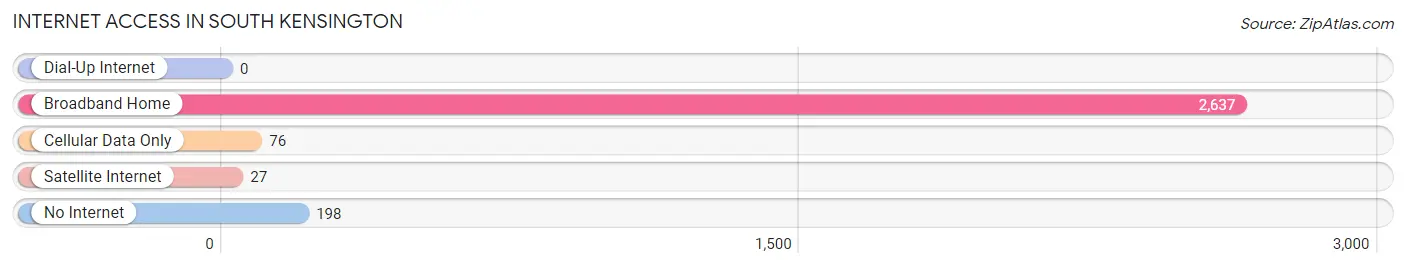
| Internet Type | # Households | % Households |
| Dial-Up Internet | 0 | 0.0% |
| Broadband Home | 2,637 | 90.2% |
| Cellular Data Only | 76 | 2.6% |
| Satellite Internet | 27 | 0.9% |
| No Internet | 198 | 6.8% |
| Total | 2,923 | 100.0% |
South Kensington Summary
South Kensington is a small, unincorporated community located in Montgomery County, Maryland. It is situated just north of the city of Rockville and is part of the Washington, D.C. metropolitan area. The community is bordered by Kensington to the north, Garrett Park to the east, and Wheaton to the south.
History
South Kensington was first settled in the late 19th century by German and Irish immigrants. The area was originally known as “Kensington Station” due to the presence of a train station in the area. The station was built in 1873 and served as a stop on the Metropolitan Branch of the Baltimore and Ohio Railroad. The station was eventually closed in the 1950s and the area was renamed South Kensington.
The area was largely rural until the 1950s when it began to experience rapid growth and development. This was due to the construction of the Capital Beltway, which provided easy access to Washington, D.C. and the surrounding suburbs. The area also experienced an influx of new residents due to the construction of the nearby White Flint Mall in the 1970s.
Geography
South Kensington is located in Montgomery County, Maryland. It is situated just north of the city of Rockville and is part of the Washington, D.C. metropolitan area. The community is bordered by Kensington to the north, Garrett Park to the east, and Wheaton to the south.
The area is characterized by rolling hills and is largely residential. The terrain is mostly flat with some areas of higher elevation. The area is also home to several parks, including South Kensington Park, which features a playground, basketball court, and picnic area.
Economy
South Kensington is largely a residential community, but it does have a few businesses. The area is home to several restaurants, including the popular Italian restaurant, La Piazza. The area also has several small retail stores, including a grocery store, a hardware store, and a pet store.
The area is also home to several corporate offices, including those of the National Institutes of Health and the National Institute of Standards and Technology. The area is also home to several government agencies, including the Federal Aviation Administration and the National Oceanic and Atmospheric Administration.
Demographics
As of the 2010 census, South Kensington had a population of 8,945. The population is largely white (77.3%) and Hispanic (14.2%). The median household income is $90,945 and the median age is 40.
South Kensington is a diverse community with a variety of cultures and backgrounds. The area is home to a large number of immigrants from Latin America, Asia, and the Middle East. The area is also home to a large number of professionals, including doctors, lawyers, and engineers.
Conclusion
South Kensington is a small, unincorporated community located in Montgomery County, Maryland. It is situated just north of the city of Rockville and is part of the Washington, D.C. metropolitan area. The community is bordered by Kensington to the north, Garrett Park to the east, and Wheaton to the south. The area was first settled in the late 19th century by German and Irish immigrants and has since experienced rapid growth and development due to the construction of the Capital Beltway and the nearby White Flint Mall. South Kensington is largely a residential community, but it does have a few businesses. The area is home to several restaurants, retail stores, corporate offices, and government agencies. As of the 2010 census, South Kensington had a population of 8,945. The population is largely white (77.3%) and Hispanic (14.2%). The median household income is $90,945 and the median age is 40. South Kensington is a diverse community with a variety of cultures and backgrounds.
Common Questions
What is Per Capita Income in South Kensington?
Per Capita income in South Kensington is $89,353.
What is the Median Family Income in South Kensington?
Median Family Income in South Kensington is $239,167.
What is the Median Household income in South Kensington?
Median Household Income in South Kensington is $199,981.
What is Income or Wage Gap in South Kensington?
Income or Wage Gap in South Kensington is 27.4%.
Women in South Kensington earn 72.6 cents for every dollar earned by a man.
What is Inequality or Gini Index in South Kensington?
Inequality or Gini Index in South Kensington is 0.43.
What is the Total Population of South Kensington?
Total Population of South Kensington is 8,371.
What is the Total Male Population of South Kensington?
Total Male Population of South Kensington is 4,040.
What is the Total Female Population of South Kensington?
Total Female Population of South Kensington is 4,331.
What is the Ratio of Males per 100 Females in South Kensington?
There are 93.28 Males per 100 Females in South Kensington.
What is the Ratio of Females per 100 Males in South Kensington?
There are 107.20 Females per 100 Males in South Kensington.
What is the Median Population Age in South Kensington?
Median Population Age in South Kensington is 43.8 Years.
What is the Average Family Size in South Kensington
Average Family Size in South Kensington is 3.3 People.
What is the Average Household Size in South Kensington
Average Household Size in South Kensington is 2.8 People.
How Large is the Labor Force in South Kensington?
There are 4,284 People in the Labor Forcein in South Kensington.
What is the Percentage of People in the Labor Force in South Kensington?
67.7% of People are in the Labor Force in South Kensington.
What is the Unemployment Rate in South Kensington?
Unemployment Rate in South Kensington is 2.2%.