Frederick, MD Map & Demographics
Frederick Map
Frederick Overview
$45,050
PER CAPITA INCOME
$108,301
AVG FAMILY INCOME
$89,981
AVG HOUSEHOLD INCOME
28.0%
WAGE / INCOME GAP [ % ]
72.0¢/ $1
WAGE / INCOME GAP [ $ ]
$13,418
FAMILY INCOME DEFICIT
0.40
INEQUALITY / GINI INDEX
78,390
TOTAL POPULATION
37,984
MALE POPULATION
40,406
FEMALE POPULATION
94.01
MALES / 100 FEMALES
106.38
FEMALES / 100 MALES
37.0
MEDIAN AGE
3.1
AVG FAMILY SIZE
2.4
AVG HOUSEHOLD SIZE
44,024
LABOR FORCE [ PEOPLE ]
70.2%
PERCENT IN LABOR FORCE
4.3%
UNEMPLOYMENT RATE
Income in Frederick
Income Overview in Frederick
Per Capita Income in Frederick is $45,050, while median incomes of families and households are $108,301 and $89,981 respectively.
| Characteristic | Number | Measure |
| Per Capita Income | 78,390 | $45,050 |
| Median Family Income | 19,230 | $108,301 |
| Mean Family Income | 19,230 | $126,425 |
| Median Household Income | 31,383 | $89,981 |
| Mean Household Income | 31,383 | $110,738 |
| Income Deficit | 19,230 | $13,418 |
| Wage / Income Gap (%) | 78,390 | 28.01% |
| Wage / Income Gap ($) | 78,390 | 71.99¢ per $1 |
| Gini / Inequality Index | 78,390 | 0.40 |
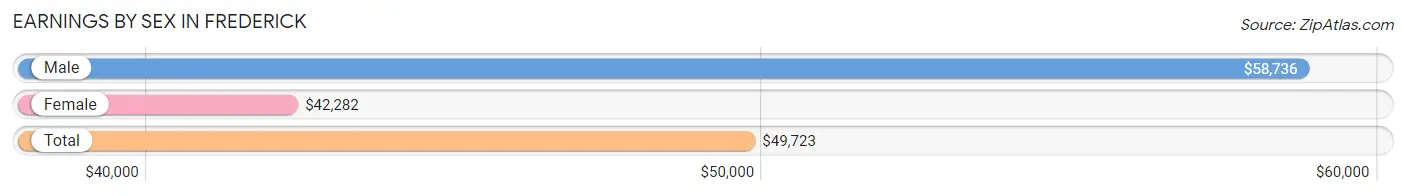
Earnings by Sex in Frederick
Average Earnings in Frederick are $49,723, $58,736 for men and $42,282 for women, a difference of 28.0%.
| Sex | Number | Average Earnings |
| Male | 23,847 (52.3%) | $58,736 |
| Female | 21,767 (47.7%) | $42,282 |
| Total | 45,614 (100.0%) | $49,723 |
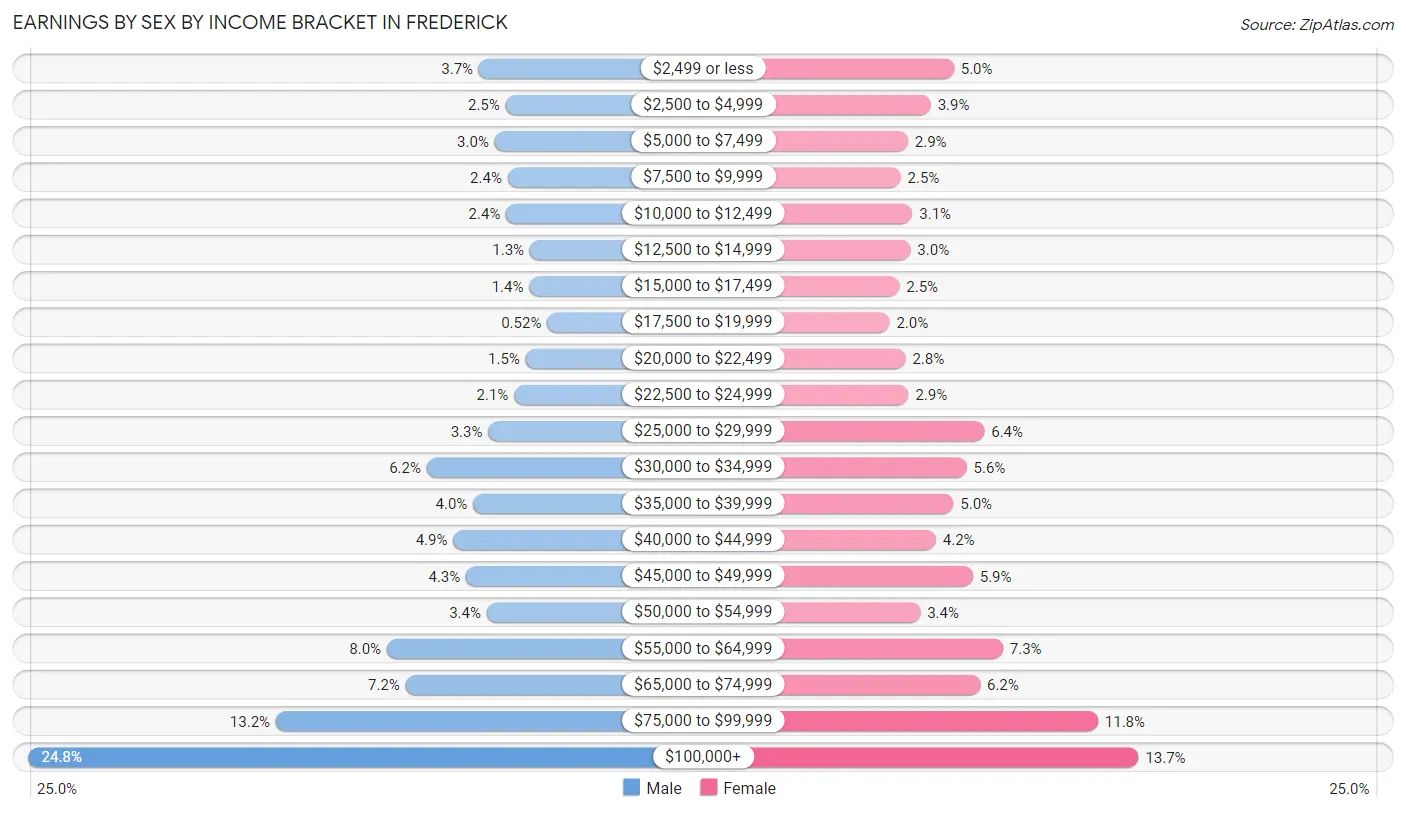
Earnings by Sex by Income Bracket in Frederick
The most common earnings brackets in Frederick are $100,000+ for men (5,917 | 24.8%) and $100,000+ for women (2,973 | 13.7%).
| Income | Male | Female |
| $2,499 or less | 886 (3.7%) | 1,091 (5.0%) |
| $2,500 to $4,999 | 590 (2.5%) | 855 (3.9%) |
| $5,000 to $7,499 | 711 (3.0%) | 623 (2.9%) |
| $7,500 to $9,999 | 565 (2.4%) | 548 (2.5%) |
| $10,000 to $12,499 | 581 (2.4%) | 669 (3.1%) |
| $12,500 to $14,999 | 316 (1.3%) | 649 (3.0%) |
| $15,000 to $17,499 | 324 (1.4%) | 536 (2.5%) |
| $17,500 to $19,999 | 123 (0.5%) | 436 (2.0%) |
| $20,000 to $22,499 | 364 (1.5%) | 599 (2.8%) |
| $22,500 to $24,999 | 493 (2.1%) | 630 (2.9%) |
| $25,000 to $29,999 | 781 (3.3%) | 1,401 (6.4%) |
| $30,000 to $34,999 | 1,468 (6.2%) | 1,221 (5.6%) |
| $35,000 to $39,999 | 951 (4.0%) | 1,087 (5.0%) |
| $40,000 to $44,999 | 1,174 (4.9%) | 908 (4.2%) |
| $45,000 to $49,999 | 1,030 (4.3%) | 1,284 (5.9%) |
| $50,000 to $54,999 | 798 (3.4%) | 748 (3.4%) |
| $55,000 to $64,999 | 1,914 (8.0%) | 1,591 (7.3%) |
| $65,000 to $74,999 | 1,705 (7.1%) | 1,358 (6.2%) |
| $75,000 to $99,999 | 3,156 (13.2%) | 2,560 (11.8%) |
| $100,000+ | 5,917 (24.8%) | 2,973 (13.7%) |
| Total | 23,847 (100.0%) | 21,767 (100.0%) |
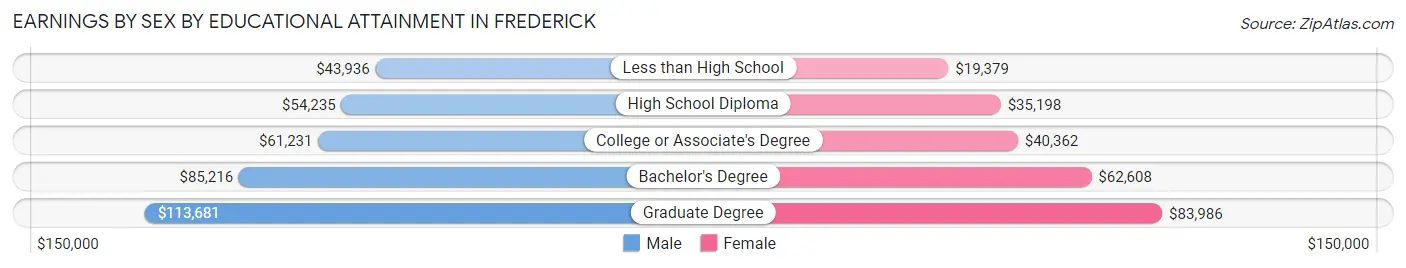
Earnings by Sex by Educational Attainment in Frederick
Average earnings in Frederick are $66,957 for men and $48,364 for women, a difference of 27.8%. Men with an educational attainment of graduate degree enjoy the highest average annual earnings of $113,681, while those with less than high school education earn the least with $43,936. Women with an educational attainment of graduate degree earn the most with the average annual earnings of $83,986, while those with less than high school education have the smallest earnings of $19,379.
| Educational Attainment | Male Income | Female Income |
| Less than High School | $43,936 | $19,379 |
| High School Diploma | $54,235 | $35,198 |
| College or Associate's Degree | $61,231 | $40,362 |
| Bachelor's Degree | $85,216 | $62,608 |
| Graduate Degree | $113,681 | $83,986 |
| Total | $66,957 | $48,364 |
Family Income in Frederick
Family Income Brackets in Frederick
According to the Frederick family income data, there are 4,481 families falling into the $100,000 to $149,999 income range, which is the most common income bracket and makes up 23.3% of all families. Conversely, the $10,000 to $14,999 income bracket is the least frequent group with only 462 families (2.4%) belonging to this category.
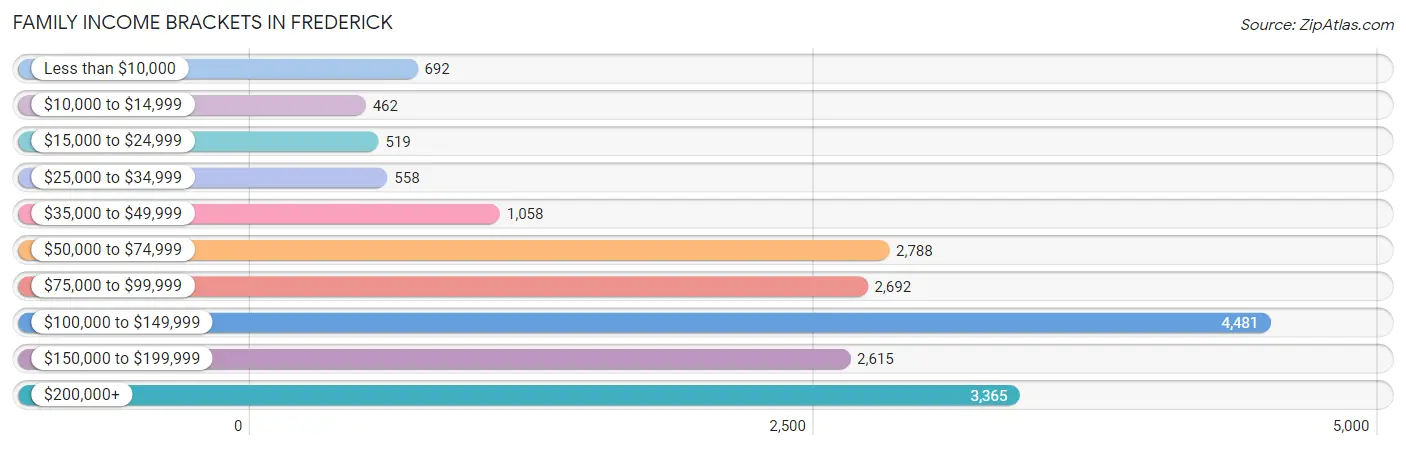
| Income Bracket | # Families | % Families |
| Less than $10,000 | 692 | 3.6% |
| $10,000 to $14,999 | 462 | 2.4% |
| $15,000 to $24,999 | 519 | 2.7% |
| $25,000 to $34,999 | 558 | 2.9% |
| $35,000 to $49,999 | 1,058 | 5.5% |
| $50,000 to $74,999 | 2,788 | 14.5% |
| $75,000 to $99,999 | 2,692 | 14.0% |
| $100,000 to $149,999 | 4,481 | 23.3% |
| $150,000 to $199,999 | 2,615 | 13.6% |
| $200,000+ | 3,365 | 17.5% |
Family Income by Famaliy Size in Frederick
4-person families (4,549 | 23.7%) account for the highest median family income in Frederick with $129,466 per family, while 2-person families (7,863 | 40.9%) have the highest median income of $51,606 per family member.
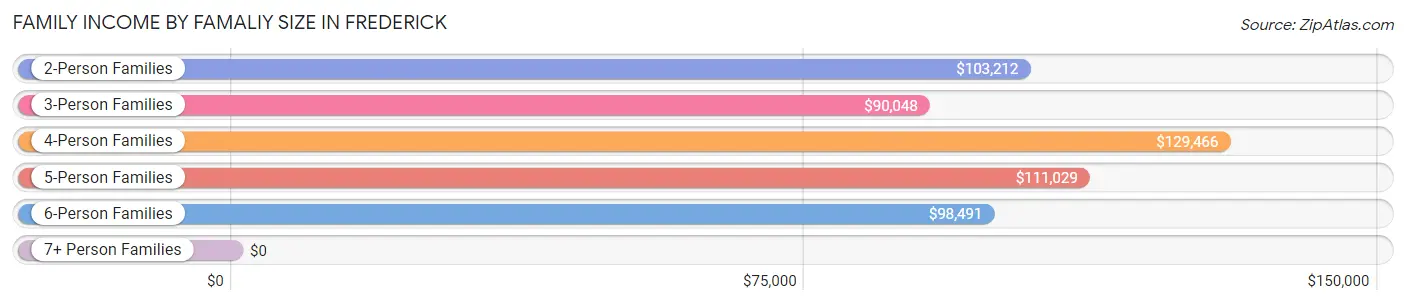
| Income Bracket | # Families | Median Income |
| 2-Person Families | 7,863 (40.9%) | $103,212 |
| 3-Person Families | 4,267 (22.2%) | $90,048 |
| 4-Person Families | 4,549 (23.7%) | $129,466 |
| 5-Person Families | 1,750 (9.1%) | $111,029 |
| 6-Person Families | 592 (3.1%) | $98,491 |
| 7+ Person Families | 209 (1.1%) | $0 |
| Total | 19,230 (100.0%) | $108,301 |
Family Income by Number of Earners in Frederick
The median family income in Frederick is $108,301, with families comprising 3+ earners (2,662) having the highest median family income of $161,121, while families with no earners (2,118) have the lowest median family income of $50,671, accounting for 13.8% and 11.0% of families, respectively.
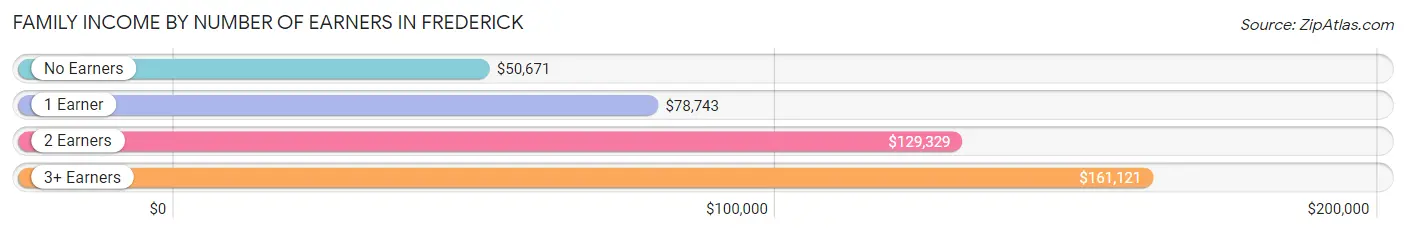
| Number of Earners | # Families | Median Income |
| No Earners | 2,118 (11.0%) | $50,671 |
| 1 Earner | 5,995 (31.2%) | $78,743 |
| 2 Earners | 8,455 (44.0%) | $129,329 |
| 3+ Earners | 2,662 (13.8%) | $161,121 |
| Total | 19,230 (100.0%) | $108,301 |
Household Income in Frederick
Household Income Brackets in Frederick
With 6,434 households falling in the category, the $100,000 to $149,999 income range is the most frequent in Frederick, accounting for 20.5% of all households. In contrast, only 973 households (3.1%) fall into the $10,000 to $14,999 income bracket, making it the least populous group.
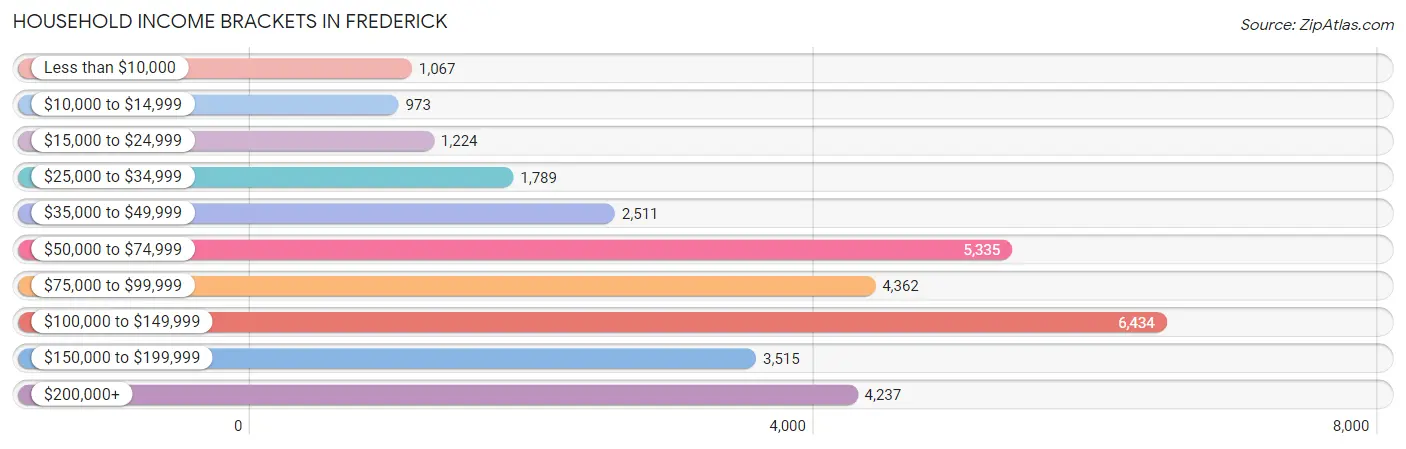
| Income Bracket | # Households | % Households |
| Less than $10,000 | 1,067 | 3.4% |
| $10,000 to $14,999 | 973 | 3.1% |
| $15,000 to $24,999 | 1,224 | 3.9% |
| $25,000 to $34,999 | 1,789 | 5.7% |
| $35,000 to $49,999 | 2,511 | 8.0% |
| $50,000 to $74,999 | 5,335 | 17.0% |
| $75,000 to $99,999 | 4,362 | 13.9% |
| $100,000 to $149,999 | 6,434 | 20.5% |
| $150,000 to $199,999 | 3,515 | 11.2% |
| $200,000+ | 4,237 | 13.5% |
Household Income by Householder Age in Frederick
The median household income in Frederick is $89,981, with the highest median household income of $104,996 found in the 45 to 64 years age bracket for the primary householder. A total of 11,155 households (35.5%) fall into this category. Meanwhile, the 15 to 24 years age bracket for the primary householder has the lowest median household income of $56,200, with 1,185 households (3.8%) in this group.
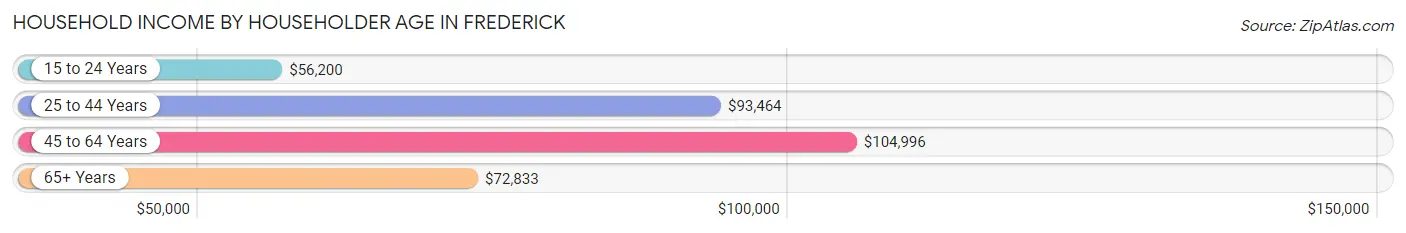
| Income Bracket | # Households | Median Income |
| 15 to 24 Years | 1,185 (3.8%) | $56,200 |
| 25 to 44 Years | 12,082 (38.5%) | $93,464 |
| 45 to 64 Years | 11,155 (35.5%) | $104,996 |
| 65+ Years | 6,961 (22.2%) | $72,833 |
| Total | 31,383 (100.0%) | $89,981 |
Poverty in Frederick
Income Below Poverty by Sex and Age in Frederick
With 8.6% poverty level for males and 11.0% for females among the residents of Frederick, 16 and 17 year old males and 15 year old females are the most vulnerable to poverty, with 168 males (18.9%) and 129 females (20.6%) in their respective age groups living below the poverty level.
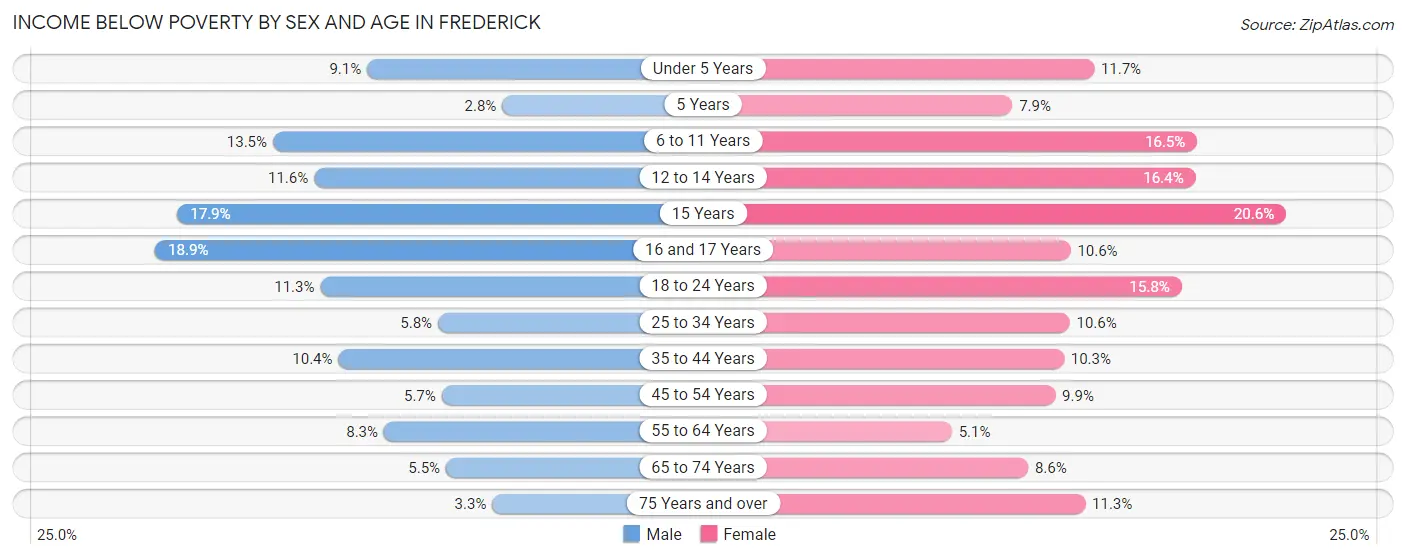
| Age Bracket | Male | Female |
| Under 5 Years | 205 (9.1%) | 289 (11.7%) |
| 5 Years | 18 (2.8%) | 45 (7.9%) |
| 6 to 11 Years | 364 (13.5%) | 456 (16.5%) |
| 12 to 14 Years | 161 (11.6%) | 248 (16.4%) |
| 15 Years | 101 (17.9%) | 129 (20.6%) |
| 16 and 17 Years | 168 (18.9%) | 78 (10.6%) |
| 18 to 24 Years | 344 (11.3%) | 547 (15.8%) |
| 25 to 34 Years | 344 (5.8%) | 647 (10.6%) |
| 35 to 44 Years | 632 (10.4%) | 562 (10.3%) |
| 45 to 54 Years | 286 (5.7%) | 502 (9.9%) |
| 55 to 64 Years | 368 (8.3%) | 231 (5.1%) |
| 65 to 74 Years | 160 (5.4%) | 299 (8.6%) |
| 75 Years and over | 49 (3.3%) | 286 (11.3%) |
| Total | 3,200 (8.6%) | 4,319 (11.0%) |
Income Above Poverty by Sex and Age in Frederick
According to the poverty statistics in Frederick, males aged 5 years and females aged 55 to 64 years are the age groups that are most secure financially, with 97.2% of males and 94.9% of females in these age groups living above the poverty line.
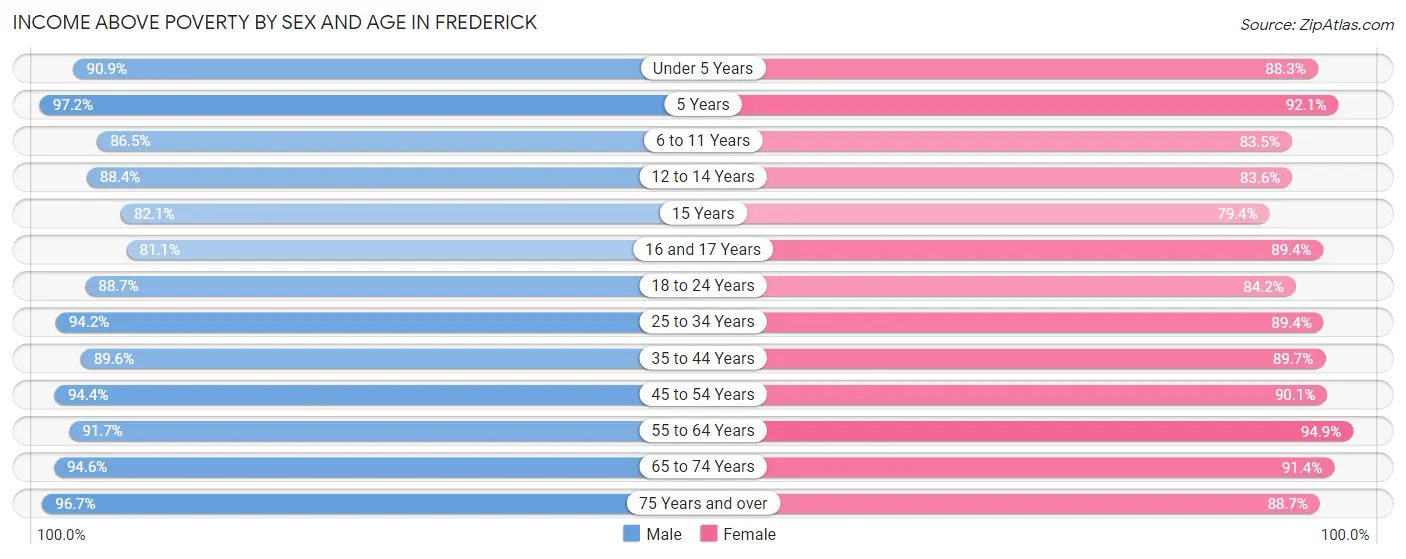
| Age Bracket | Male | Female |
| Under 5 Years | 2,046 (90.9%) | 2,181 (88.3%) |
| 5 Years | 615 (97.2%) | 524 (92.1%) |
| 6 to 11 Years | 2,337 (86.5%) | 2,309 (83.5%) |
| 12 to 14 Years | 1,231 (88.4%) | 1,263 (83.6%) |
| 15 Years | 463 (82.1%) | 497 (79.4%) |
| 16 and 17 Years | 719 (81.1%) | 657 (89.4%) |
| 18 to 24 Years | 2,706 (88.7%) | 2,922 (84.2%) |
| 25 to 34 Years | 5,568 (94.2%) | 5,473 (89.4%) |
| 35 to 44 Years | 5,419 (89.6%) | 4,892 (89.7%) |
| 45 to 54 Years | 4,776 (94.4%) | 4,570 (90.1%) |
| 55 to 64 Years | 4,049 (91.7%) | 4,300 (94.9%) |
| 65 to 74 Years | 2,777 (94.6%) | 3,162 (91.4%) |
| 75 Years and over | 1,434 (96.7%) | 2,247 (88.7%) |
| Total | 34,140 (91.4%) | 34,997 (89.0%) |
Income Below Poverty Among Married-Couple Families in Frederick
The poverty statistics for married-couple families in Frederick show that 2.5% or 342 of the total 13,613 families live below the poverty line. Families with 3 or 4 children have the highest poverty rate of 6.5%, comprising of 73 families. On the other hand, families with 5 or more children have the lowest poverty rate of 0.0%, which includes 0 families.
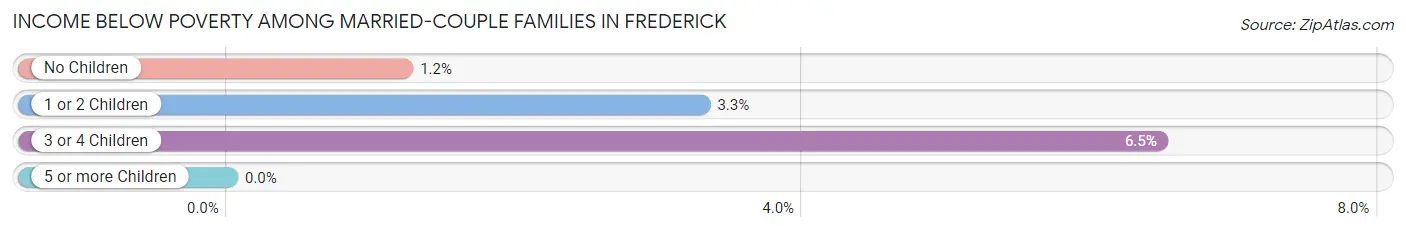
| Children | Above Poverty | Below Poverty |
| No Children | 6,640 (98.8%) | 82 (1.2%) |
| 1 or 2 Children | 5,498 (96.7%) | 187 (3.3%) |
| 3 or 4 Children | 1,054 (93.5%) | 73 (6.5%) |
| 5 or more Children | 79 (100.0%) | 0 (0.0%) |
| Total | 13,271 (97.5%) | 342 (2.5%) |
Income Below Poverty Among Single-Parent Households in Frederick
According to the poverty data in Frederick, 12.8% or 161 single-father households and 25.2% or 1,096 single-mother households are living below the poverty line. Among single-father households, those with 3 or 4 children have the highest poverty rate, with 57 households (39.9%) experiencing poverty. Likewise, among single-mother households, those with 5 or more children have the highest poverty rate, with 38 households (100.0%) falling below the poverty line.
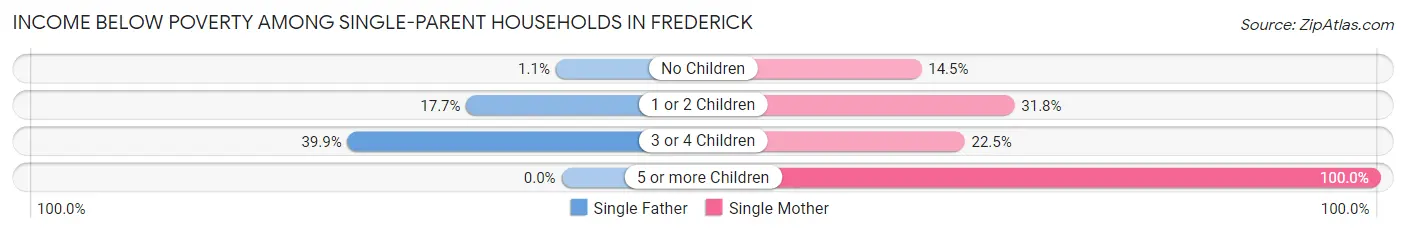
| Children | Single Father | Single Mother |
| No Children | 6 (1.1%) | 223 (14.4%) |
| 1 or 2 Children | 98 (17.7%) | 719 (31.8%) |
| 3 or 4 Children | 57 (39.9%) | 116 (22.5%) |
| 5 or more Children | 0 (0.0%) | 38 (100.0%) |
| Total | 161 (12.8%) | 1,096 (25.2%) |
Income Below Poverty Among Married-Couple vs Single-Parent Households in Frederick
The poverty data for Frederick shows that 342 of the married-couple family households (2.5%) and 1,257 of the single-parent households (22.4%) are living below the poverty level. Within the married-couple family households, those with 3 or 4 children have the highest poverty rate, with 73 households (6.5%) falling below the poverty line. Among the single-parent households, those with 5 or more children have the highest poverty rate, with 38 household (100.0%) living below poverty.
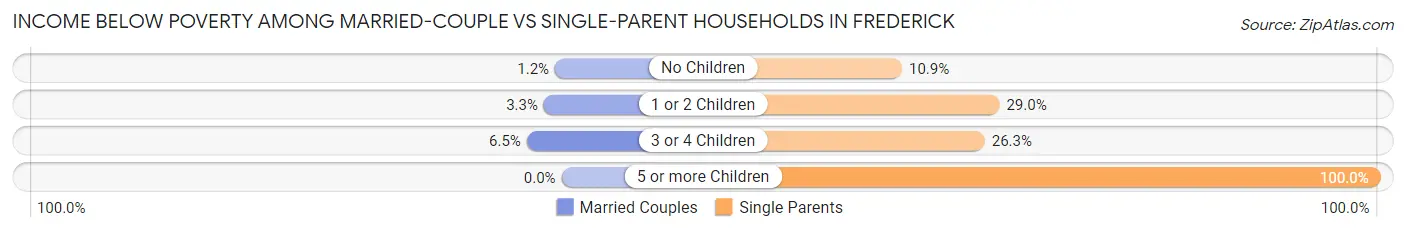
| Children | Married-Couple Families | Single-Parent Households |
| No Children | 82 (1.2%) | 229 (10.9%) |
| 1 or 2 Children | 187 (3.3%) | 817 (29.0%) |
| 3 or 4 Children | 73 (6.5%) | 173 (26.3%) |
| 5 or more Children | 0 (0.0%) | 38 (100.0%) |
| Total | 342 (2.5%) | 1,257 (22.4%) |
Race in Frederick
The most populous races in Frederick are White / Caucasian (48,842 | 62.3%), Hispanic or Latino (13,894 | 17.7%), and Black / African American (13,589 | 17.3%).
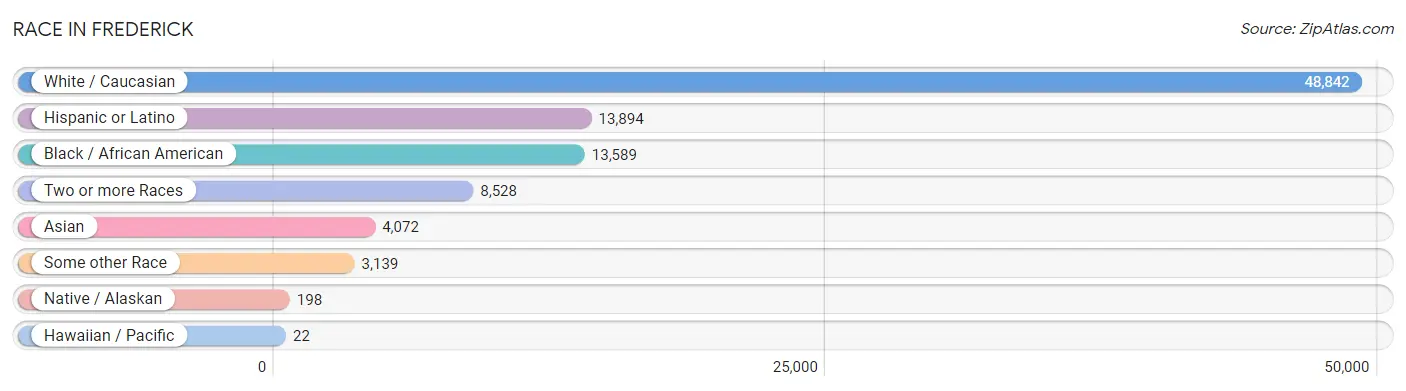
| Race | # Population | % Population |
| Asian | 4,072 | 5.2% |
| Black / African American | 13,589 | 17.3% |
| Hawaiian / Pacific | 22 | 0.0% |
| Hispanic or Latino | 13,894 | 17.7% |
| Native / Alaskan | 198 | 0.3% |
| White / Caucasian | 48,842 | 62.3% |
| Two or more Races | 8,528 | 10.9% |
| Some other Race | 3,139 | 4.0% |
| Total | 78,390 | 100.0% |
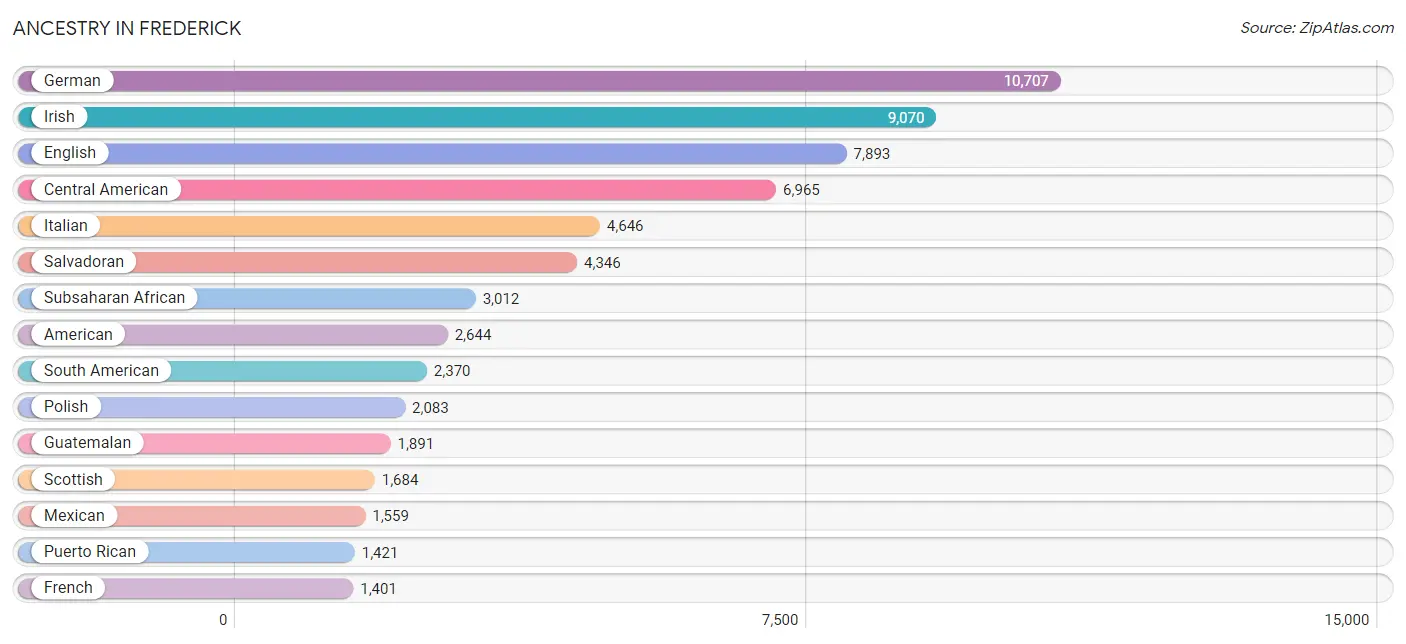
Ancestry in Frederick
The most populous ancestries reported in Frederick are German (10,707 | 13.7%), Irish (9,070 | 11.6%), English (7,893 | 10.1%), Central American (6,965 | 8.9%), and Italian (4,646 | 5.9%), together accounting for 50.1% of all Frederick residents.
| Ancestry | # Population | % Population |
| Afghan | 6 | 0.0% |
| African | 1,093 | 1.4% |
| Albanian | 52 | 0.1% |
| American | 2,644 | 3.4% |
| Arab | 443 | 0.6% |
| Argentinean | 197 | 0.3% |
| Armenian | 19 | 0.0% |
| Australian | 38 | 0.1% |
| Austrian | 139 | 0.2% |
| Barbadian | 43 | 0.1% |
| Belgian | 69 | 0.1% |
| Bhutanese | 342 | 0.4% |
| Blackfeet | 11 | 0.0% |
| Bolivian | 252 | 0.3% |
| Brazilian | 112 | 0.1% |
| British | 549 | 0.7% |
| Bulgarian | 36 | 0.1% |
| Burmese | 807 | 1.0% |
| Canadian | 152 | 0.2% |
| Carpatho Rusyn | 40 | 0.1% |
| Celtic | 6 | 0.0% |
| Central American | 6,965 | 8.9% |
| Central American Indian | 111 | 0.1% |
| Cherokee | 94 | 0.1% |
| Chilean | 177 | 0.2% |
| Choctaw | 4 | 0.0% |
| Colombian | 735 | 0.9% |
| Costa Rican | 374 | 0.5% |
| Croatian | 233 | 0.3% |
| Cuban | 335 | 0.4% |
| Czech | 391 | 0.5% |
| Czechoslovakian | 144 | 0.2% |
| Danish | 110 | 0.1% |
| Delaware | 14 | 0.0% |
| Dominican | 292 | 0.4% |
| Dutch | 577 | 0.7% |
| Eastern European | 302 | 0.4% |
| Ecuadorian | 220 | 0.3% |
| Egyptian | 43 | 0.1% |
| English | 7,893 | 10.1% |
| Estonian | 53 | 0.1% |
| European | 879 | 1.1% |
| Filipino | 19 | 0.0% |
| Finnish | 135 | 0.2% |
| French | 1,401 | 1.8% |
| French Canadian | 227 | 0.3% |
| German | 10,707 | 13.7% |
| Ghanaian | 840 | 1.1% |
| Greek | 195 | 0.3% |
| Guatemalan | 1,891 | 2.4% |
| Guyanese | 39 | 0.1% |
| Haitian | 53 | 0.1% |
| Honduran | 197 | 0.3% |
| Hungarian | 421 | 0.5% |
| Indian (Asian) | 1,299 | 1.7% |
| Indonesian | 555 | 0.7% |
| Inupiat | 5 | 0.0% |
| Iranian | 51 | 0.1% |
| Irish | 9,070 | 11.6% |
| Iroquois | 61 | 0.1% |
| Israeli | 26 | 0.0% |
| Italian | 4,646 | 5.9% |
| Jamaican | 593 | 0.8% |
| Japanese | 95 | 0.1% |
| Jordanian | 49 | 0.1% |
| Kenyan | 116 | 0.2% |
| Korean | 559 | 0.7% |
| Laotian | 127 | 0.2% |
| Latvian | 28 | 0.0% |
| Lebanese | 81 | 0.1% |
| Liberian | 33 | 0.0% |
| Lithuanian | 185 | 0.2% |
| Macedonian | 10 | 0.0% |
| Mexican | 1,559 | 2.0% |
| Mexican American Indian | 28 | 0.0% |
| Moroccan | 89 | 0.1% |
| Native Hawaiian | 85 | 0.1% |
| Navajo | 9 | 0.0% |
| Nicaraguan | 100 | 0.1% |
| Nigerian | 258 | 0.3% |
| Northern European | 86 | 0.1% |
| Norwegian | 421 | 0.5% |
| Pakistani | 43 | 0.1% |
| Palestinian | 24 | 0.0% |
| Panamanian | 57 | 0.1% |
| Paraguayan | 32 | 0.0% |
| Pennsylvania German | 52 | 0.1% |
| Peruvian | 408 | 0.5% |
| Polish | 2,083 | 2.7% |
| Portuguese | 330 | 0.4% |
| Potawatomi | 3 | 0.0% |
| Puerto Rican | 1,421 | 1.8% |
| Romanian | 80 | 0.1% |
| Russian | 443 | 0.6% |
| Salvadoran | 4,346 | 5.5% |
| Scandinavian | 158 | 0.2% |
| Scotch-Irish | 749 | 1.0% |
| Scottish | 1,684 | 2.1% |
| Seminole | 4 | 0.0% |
| Serbian | 61 | 0.1% |
| Slavic | 42 | 0.1% |
| Slovak | 113 | 0.1% |
| Slovene | 18 | 0.0% |
| South African | 51 | 0.1% |
| South American | 2,370 | 3.0% |
| Spaniard | 27 | 0.0% |
| Spanish | 187 | 0.2% |
| Sri Lankan | 611 | 0.8% |
| Subsaharan African | 3,012 | 3.8% |
| Sudanese | 17 | 0.0% |
| Swedish | 476 | 0.6% |
| Swiss | 484 | 0.6% |
| Syrian | 21 | 0.0% |
| Thai | 944 | 1.2% |
| Turkish | 207 | 0.3% |
| Ugandan | 19 | 0.0% |
| Ukrainian | 509 | 0.6% |
| Uruguayan | 53 | 0.1% |
| Venezuelan | 225 | 0.3% |
| Vietnamese | 87 | 0.1% |
| Welsh | 601 | 0.8% |
| West Indian | 26 | 0.0% |
| Yugoslavian | 49 | 0.1% |
| Zimbabwean | 35 | 0.0% | View All 124 Rows |
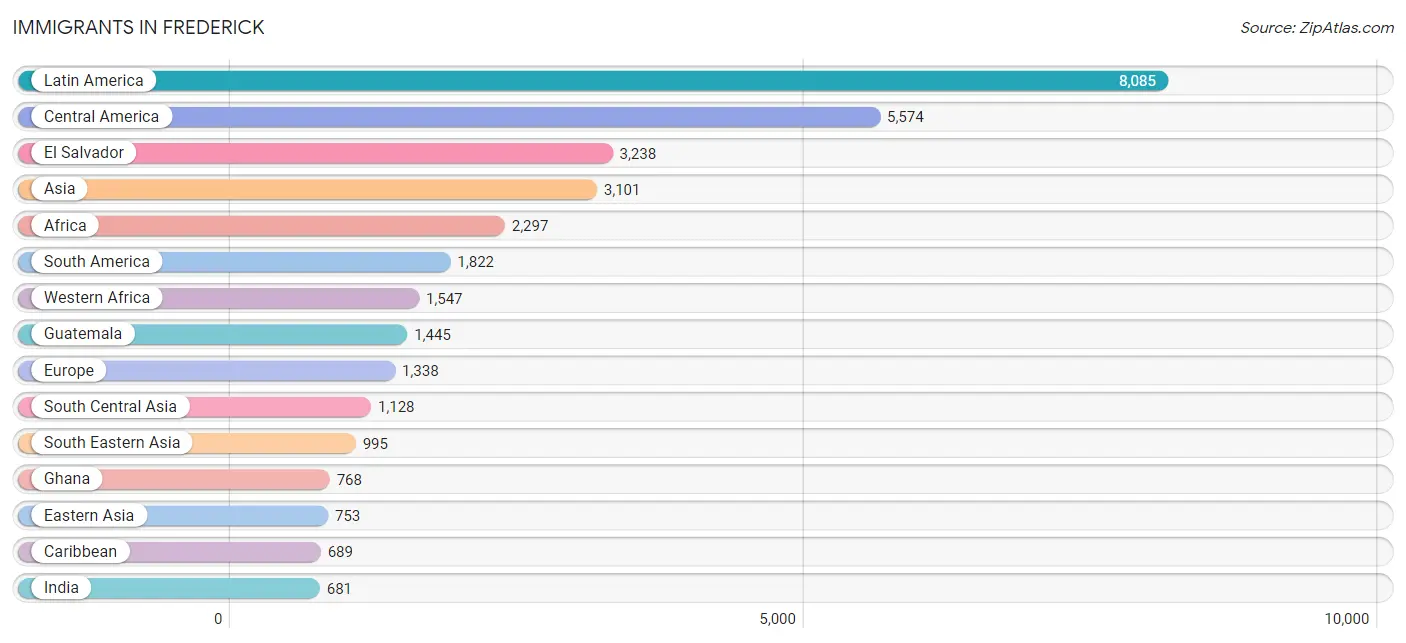
Immigrants in Frederick
The most numerous immigrant groups reported in Frederick came from Latin America (8,085 | 10.3%), Central America (5,574 | 7.1%), El Salvador (3,238 | 4.1%), Asia (3,101 | 4.0%), and Africa (2,297 | 2.9%), together accounting for 28.4% of all Frederick residents.
| Immigration Origin | # Population | % Population |
| Afghanistan | 6 | 0.0% |
| Africa | 2,297 | 2.9% |
| Albania | 40 | 0.1% |
| Argentina | 133 | 0.2% |
| Asia | 3,101 | 4.0% |
| Australia | 38 | 0.1% |
| Bangladesh | 92 | 0.1% |
| Belgium | 62 | 0.1% |
| Bolivia | 157 | 0.2% |
| Bosnia and Herzegovina | 41 | 0.1% |
| Brazil | 96 | 0.1% |
| Bulgaria | 26 | 0.0% |
| Cambodia | 20 | 0.0% |
| Cameroon | 210 | 0.3% |
| Canada | 66 | 0.1% |
| Caribbean | 689 | 0.9% |
| Central America | 5,574 | 7.1% |
| Chile | 258 | 0.3% |
| China | 510 | 0.6% |
| Colombia | 399 | 0.5% |
| Costa Rica | 334 | 0.4% |
| Croatia | 20 | 0.0% |
| Cuba | 50 | 0.1% |
| Czechoslovakia | 21 | 0.0% |
| Dominican Republic | 114 | 0.2% |
| Eastern Africa | 233 | 0.3% |
| Eastern Asia | 753 | 1.0% |
| Eastern Europe | 598 | 0.8% |
| Ecuador | 49 | 0.1% |
| Egypt | 33 | 0.0% |
| El Salvador | 3,238 | 4.1% |
| England | 117 | 0.2% |
| Ethiopia | 5 | 0.0% |
| Europe | 1,338 | 1.7% |
| France | 41 | 0.1% |
| Germany | 194 | 0.3% |
| Ghana | 768 | 1.0% |
| Greece | 23 | 0.0% |
| Guatemala | 1,445 | 1.8% |
| Guyana | 8 | 0.0% |
| Haiti | 17 | 0.0% |
| Honduras | 43 | 0.1% |
| Hungary | 6 | 0.0% |
| India | 681 | 0.9% |
| Indonesia | 76 | 0.1% |
| Iran | 13 | 0.0% |
| Ireland | 43 | 0.1% |
| Italy | 97 | 0.1% |
| Jamaica | 386 | 0.5% |
| Japan | 12 | 0.0% |
| Jordan | 49 | 0.1% |
| Kenya | 104 | 0.1% |
| Korea | 231 | 0.3% |
| Latin America | 8,085 | 10.3% |
| Liberia | 33 | 0.0% |
| Malaysia | 19 | 0.0% |
| Mexico | 462 | 0.6% |
| Middle Africa | 261 | 0.3% |
| Moldova | 17 | 0.0% |
| Morocco | 64 | 0.1% |
| Nepal | 21 | 0.0% |
| Netherlands | 12 | 0.0% |
| Nicaragua | 40 | 0.1% |
| Nigeria | 209 | 0.3% |
| Northern Africa | 114 | 0.2% |
| Northern Europe | 285 | 0.4% |
| Norway | 5 | 0.0% |
| Oceania | 38 | 0.1% |
| Pakistan | 123 | 0.2% |
| Panama | 12 | 0.0% |
| Peru | 426 | 0.5% |
| Philippines | 316 | 0.4% |
| Poland | 31 | 0.0% |
| Romania | 41 | 0.1% |
| Russia | 55 | 0.1% |
| Scotland | 18 | 0.0% |
| Sierra Leone | 18 | 0.0% |
| Singapore | 25 | 0.0% |
| South Africa | 58 | 0.1% |
| South America | 1,822 | 2.3% |
| South Central Asia | 1,128 | 1.4% |
| South Eastern Asia | 995 | 1.3% |
| Southern Europe | 134 | 0.2% |
| Spain | 14 | 0.0% |
| Sri Lanka | 95 | 0.1% |
| Sudan | 17 | 0.0% |
| Sweden | 12 | 0.0% |
| Syria | 16 | 0.0% |
| Taiwan | 19 | 0.0% |
| Thailand | 22 | 0.0% |
| Trinidad and Tobago | 122 | 0.2% |
| Turkey | 131 | 0.2% |
| Ukraine | 184 | 0.2% |
| Uruguay | 30 | 0.0% |
| Uzbekistan | 97 | 0.1% |
| Venezuela | 102 | 0.1% |
| Vietnam | 244 | 0.3% |
| Western Africa | 1,547 | 2.0% |
| Western Asia | 225 | 0.3% |
| Western Europe | 309 | 0.4% |
| Zaire | 51 | 0.1% |
| Zimbabwe | 35 | 0.0% | View All 102 Rows |
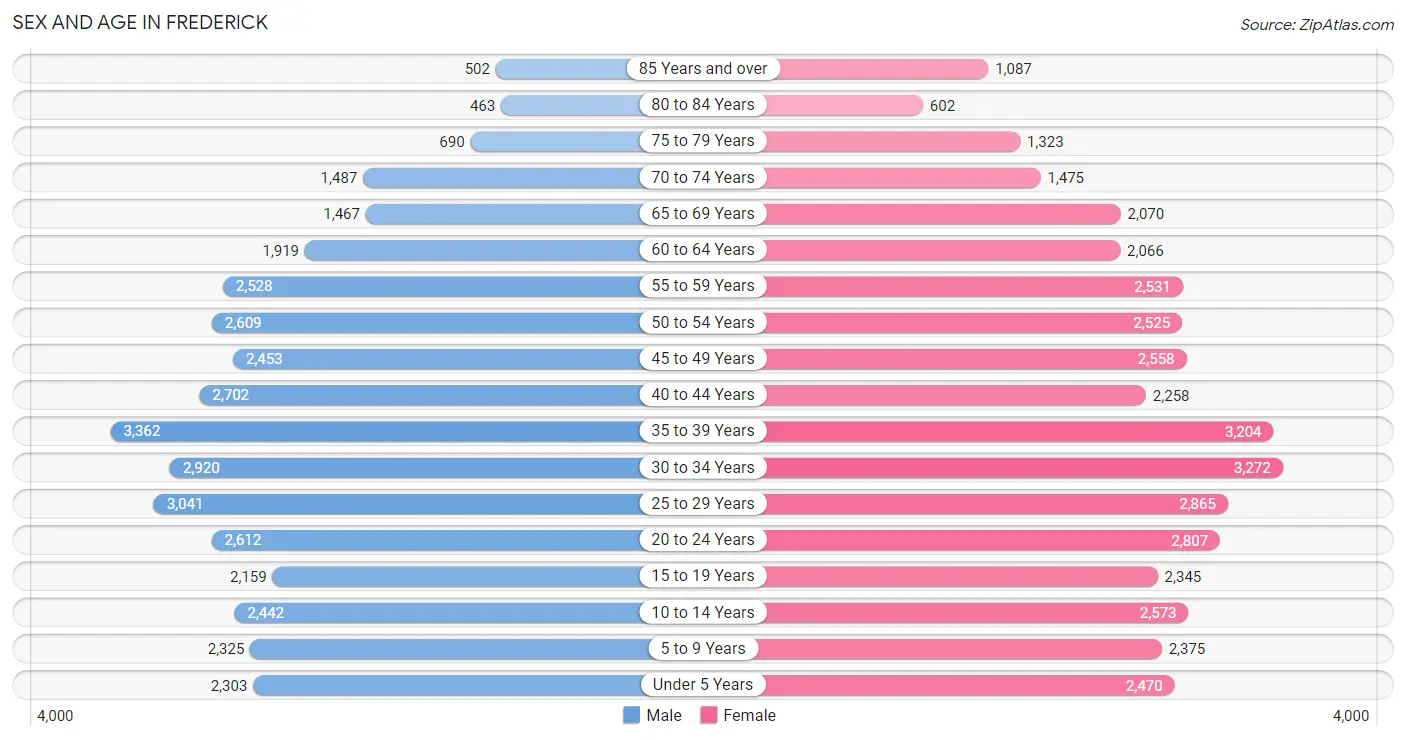
Sex and Age in Frederick
Sex and Age in Frederick
The most populous age groups in Frederick are 35 to 39 Years (3,362 | 8.8%) for men and 30 to 34 Years (3,272 | 8.1%) for women.
| Age Bracket | Male | Female |
| Under 5 Years | 2,303 (6.1%) | 2,470 (6.1%) |
| 5 to 9 Years | 2,325 (6.1%) | 2,375 (5.9%) |
| 10 to 14 Years | 2,442 (6.4%) | 2,573 (6.4%) |
| 15 to 19 Years | 2,159 (5.7%) | 2,345 (5.8%) |
| 20 to 24 Years | 2,612 (6.9%) | 2,807 (7.0%) |
| 25 to 29 Years | 3,041 (8.0%) | 2,865 (7.1%) |
| 30 to 34 Years | 2,920 (7.7%) | 3,272 (8.1%) |
| 35 to 39 Years | 3,362 (8.8%) | 3,204 (7.9%) |
| 40 to 44 Years | 2,702 (7.1%) | 2,258 (5.6%) |
| 45 to 49 Years | 2,453 (6.5%) | 2,558 (6.3%) |
| 50 to 54 Years | 2,609 (6.9%) | 2,525 (6.2%) |
| 55 to 59 Years | 2,528 (6.7%) | 2,531 (6.3%) |
| 60 to 64 Years | 1,919 (5.1%) | 2,066 (5.1%) |
| 65 to 69 Years | 1,467 (3.9%) | 2,070 (5.1%) |
| 70 to 74 Years | 1,487 (3.9%) | 1,475 (3.6%) |
| 75 to 79 Years | 690 (1.8%) | 1,323 (3.3%) |
| 80 to 84 Years | 463 (1.2%) | 602 (1.5%) |
| 85 Years and over | 502 (1.3%) | 1,087 (2.7%) |
| Total | 37,984 (100.0%) | 40,406 (100.0%) |
Families and Households in Frederick
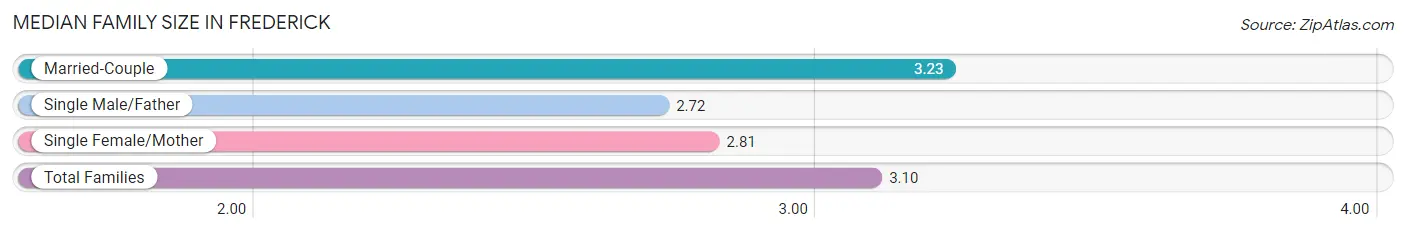
Median Family Size in Frederick
The median family size in Frederick is 3.10 persons per family, with married-couple families (13,613 | 70.8%) accounting for the largest median family size of 3.23 persons per family. On the other hand, single male/father families (1,259 | 6.6%) represent the smallest median family size with 2.72 persons per family.
| Family Type | # Families | Family Size |
| Married-Couple | 13,613 (70.8%) | 3.23 |
| Single Male/Father | 1,259 (6.6%) | 2.72 |
| Single Female/Mother | 4,358 (22.7%) | 2.81 |
| Total Families | 19,230 (100.0%) | 3.10 |
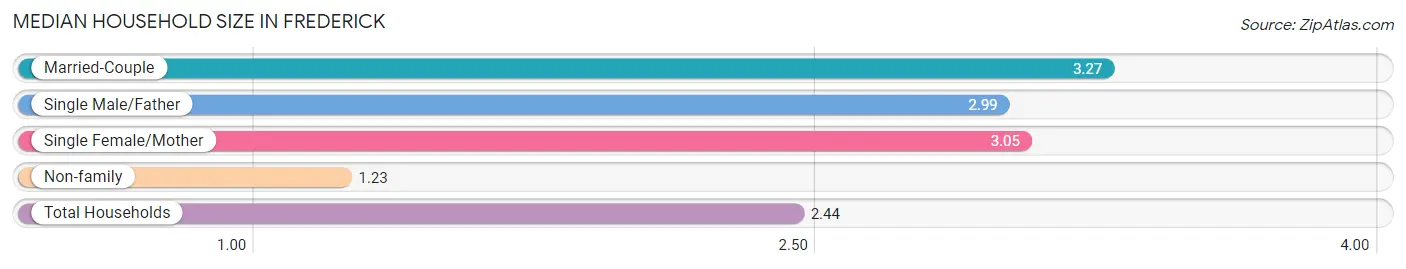
Median Household Size in Frederick
The median household size in Frederick is 2.44 persons per household, with married-couple households (13,613 | 43.4%) accounting for the largest median household size of 3.27 persons per household. non-family households (12,153 | 38.7%) represent the smallest median household size with 1.23 persons per household.
| Household Type | # Households | Household Size |
| Married-Couple | 13,613 (43.4%) | 3.27 |
| Single Male/Father | 1,259 (4.0%) | 2.99 |
| Single Female/Mother | 4,358 (13.9%) | 3.05 |
| Non-family | 12,153 (38.7%) | 1.23 |
| Total Households | 31,383 (100.0%) | 2.44 |
Household Size by Marriage Status in Frederick
Out of a total of 31,383 households in Frederick, 19,230 (61.3%) are family households, while 12,153 (38.7%) are nonfamily households. The most numerous type of family households are 2-person households, comprising 7,191, and the most common type of nonfamily households are 1-person households, comprising 9,744.
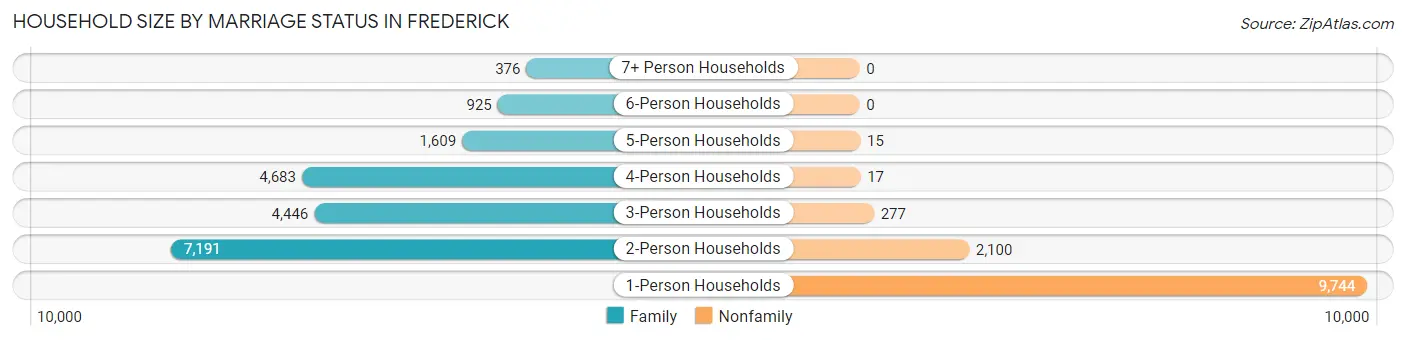
| Household Size | Family Households | Nonfamily Households |
| 1-Person Households | - | 9,744 (31.0%) |
| 2-Person Households | 7,191 (22.9%) | 2,100 (6.7%) |
| 3-Person Households | 4,446 (14.2%) | 277 (0.9%) |
| 4-Person Households | 4,683 (14.9%) | 17 (0.1%) |
| 5-Person Households | 1,609 (5.1%) | 15 (0.1%) |
| 6-Person Households | 925 (2.9%) | 0 (0.0%) |
| 7+ Person Households | 376 (1.2%) | 0 (0.0%) |
| Total | 19,230 (61.3%) | 12,153 (38.7%) |
Female Fertility in Frederick
Fertility by Age in Frederick
Average fertility rate in Frederick is 54.0 births per 1,000 women. Women in the age bracket of 20 to 34 years have the highest fertility rate with 88.0 births per 1,000 women. Women in the age bracket of 20 to 34 years acount for 72.7% of all women with births.
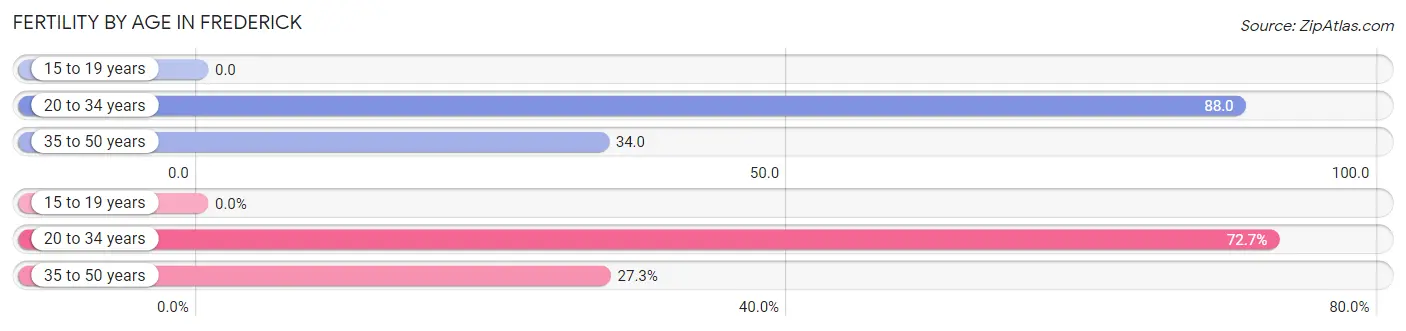
| Age Bracket | Women with Births | Births / 1,000 Women |
| 15 to 19 years | 0 (0.0%) | 0.0 |
| 20 to 34 years | 790 (72.7%) | 88.0 |
| 35 to 50 years | 297 (27.3%) | 34.0 |
| Total | 1,087 (100.0%) | 54.0 |
Fertility by Age by Marriage Status in Frederick
74.9% of women with births (1,087) in Frederick are married. The highest percentage of unmarried women with births falls into 20 to 34 years age bracket with 25.3% of them unmarried at the time of birth, while the lowest percentage of unmarried women with births belong to 35 to 50 years age bracket with 24.6% of them unmarried.
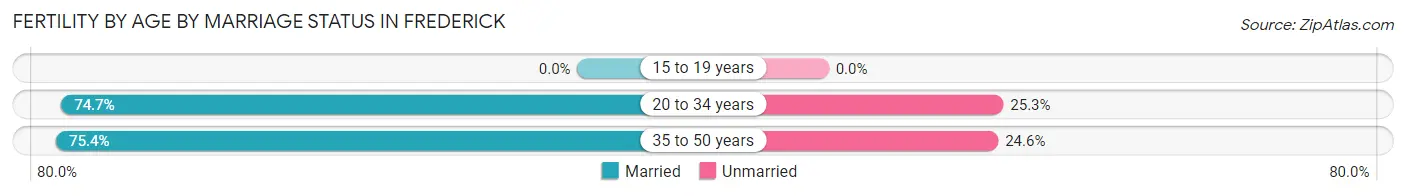
| Age Bracket | Married | Unmarried |
| 15 to 19 years | 0 (0.0%) | 0 (0.0%) |
| 20 to 34 years | 590 (74.7%) | 200 (25.3%) |
| 35 to 50 years | 224 (75.4%) | 73 (24.6%) |
| Total | 814 (74.9%) | 273 (25.1%) |
Fertility by Education in Frederick
Average fertility rate in Frederick is 54.0 births per 1,000 women. Women with the education attainment of graduate degree have the highest fertility rate of 108.0 births per 1,000 women, while women with the education attainment of less than high school have the lowest fertility at 31.0 births per 1,000 women. Women with the education attainment of graduate degree represent 31.7% of all women with births.
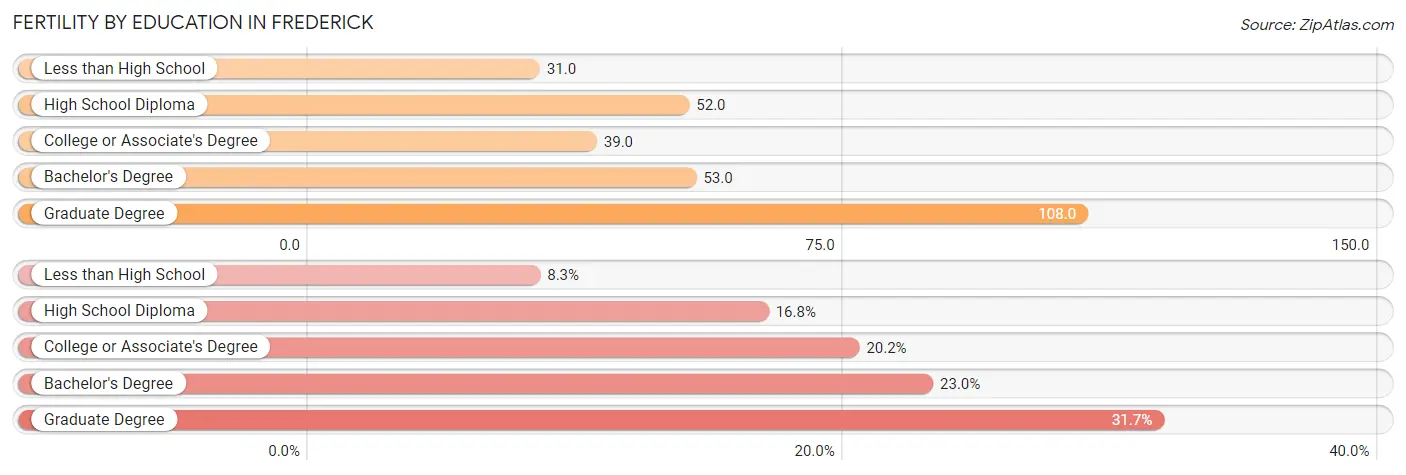
| Educational Attainment | Women with Births | Births / 1,000 Women |
| Less than High School | 90 (8.3%) | 31.0 |
| High School Diploma | 183 (16.8%) | 52.0 |
| College or Associate's Degree | 220 (20.2%) | 39.0 |
| Bachelor's Degree | 250 (23.0%) | 53.0 |
| Graduate Degree | 344 (31.7%) | 108.0 |
| Total | 1,087 (100.0%) | 54.0 |
Fertility by Education by Marriage Status in Frederick
25.1% of women with births in Frederick are unmarried. Women with the educational attainment of college or associate's degree are most likely to be married with 85.5% of them married at childbirth, while women with the educational attainment of bachelor's degree are least likely to be married with 38.4% of them unmarried at childbirth.
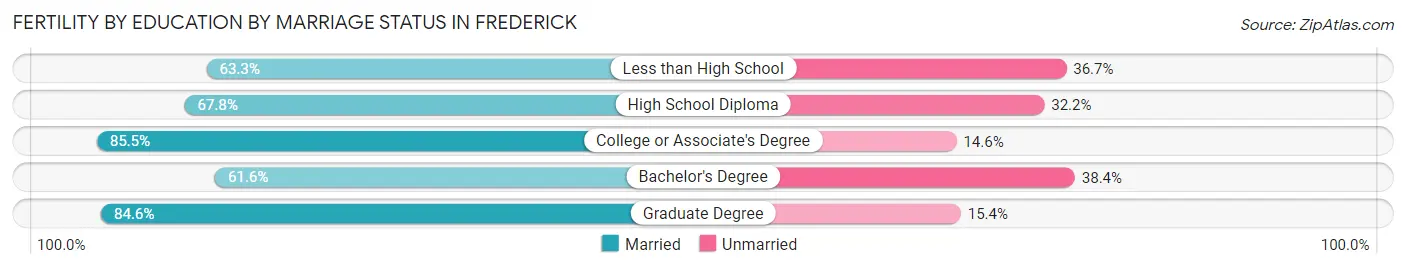
| Educational Attainment | Married | Unmarried |
| Less than High School | 57 (63.3%) | 33 (36.7%) |
| High School Diploma | 124 (67.8%) | 59 (32.2%) |
| College or Associate's Degree | 188 (85.5%) | 32 (14.5%) |
| Bachelor's Degree | 154 (61.6%) | 96 (38.4%) |
| Graduate Degree | 291 (84.6%) | 53 (15.4%) |
| Total | 814 (74.9%) | 273 (25.1%) |
Employment Characteristics in Frederick
Employment by Class of Employer in Frederick
Among the 41,352 employed individuals in Frederick, private company employees (26,771 | 64.7%), federal government employees (3,772 | 9.1%), and not-for-profit organizations (3,524 | 8.5%) make up the most common classes of employment.
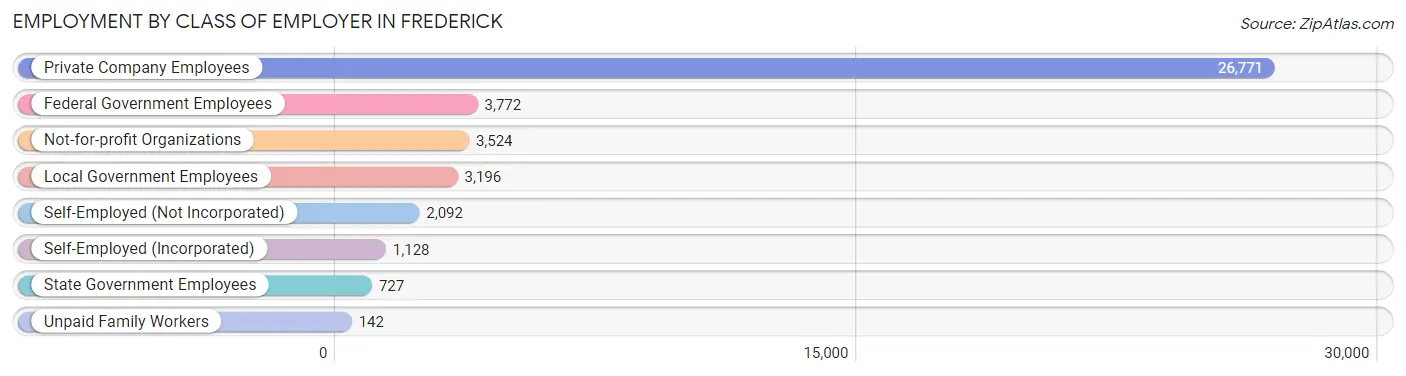
| Employer Class | # Employees | % Employees |
| Private Company Employees | 26,771 | 64.7% |
| Self-Employed (Incorporated) | 1,128 | 2.7% |
| Self-Employed (Not Incorporated) | 2,092 | 5.1% |
| Not-for-profit Organizations | 3,524 | 8.5% |
| Local Government Employees | 3,196 | 7.7% |
| State Government Employees | 727 | 1.8% |
| Federal Government Employees | 3,772 | 9.1% |
| Unpaid Family Workers | 142 | 0.3% |
| Total | 41,352 | 100.0% |
Employment Status by Age in Frederick
According to the labor force statistics for Frederick, out of the total population over 16 years of age (62,712), 70.2% or 44,024 individuals are in the labor force, with 4.3% or 1,893 of them unemployed. The age group with the highest labor force participation rate is 25 to 29 years, with 91.9% or 5,428 individuals in the labor force. Within the labor force, the 16 to 19 years age range has the highest percentage of unemployed individuals, with 8.7% or 108 of them being unemployed.
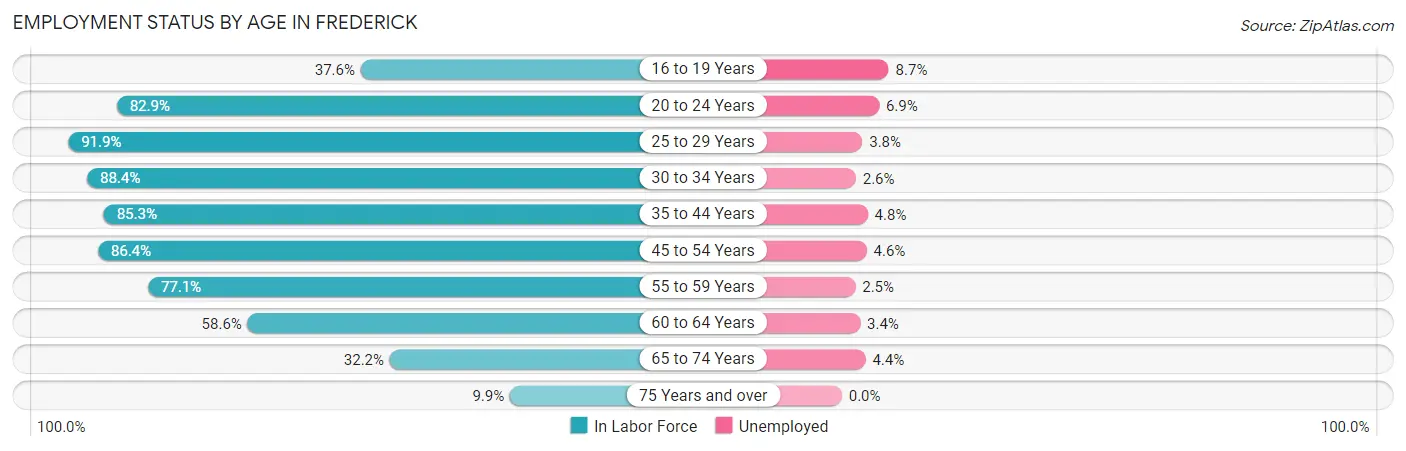
| Age Bracket | In Labor Force | Unemployed |
| 16 to 19 Years | 1,246 (37.6%) | 108 (8.7%) |
| 20 to 24 Years | 4,492 (82.9%) | 310 (6.9%) |
| 25 to 29 Years | 5,428 (91.9%) | 206 (3.8%) |
| 30 to 34 Years | 5,474 (88.4%) | 142 (2.6%) |
| 35 to 44 Years | 9,832 (85.3%) | 472 (4.8%) |
| 45 to 54 Years | 8,765 (86.4%) | 403 (4.6%) |
| 55 to 59 Years | 3,900 (77.1%) | 98 (2.5%) |
| 60 to 64 Years | 2,335 (58.6%) | 79 (3.4%) |
| 65 to 74 Years | 2,093 (32.2%) | 92 (4.4%) |
| 75 Years and over | 462 (9.9%) | 0 (0.0%) |
| Total | 44,024 (70.2%) | 1,893 (4.3%) |
Employment Status by Educational Attainment in Frederick
According to labor force statistics for Frederick, 83.5% of individuals (35,749) out of the total population between 25 and 64 years of age (42,813) are in the labor force, with 3.9% or 1,394 of them being unemployed. The group with the highest labor force participation rate are those with the educational attainment of bachelor's degree or higher, with 89.4% or 16,073 individuals in the labor force. Within the labor force, individuals with high school diploma education have the highest percentage of unemployment, with 6.9% or 460 of them being unemployed.
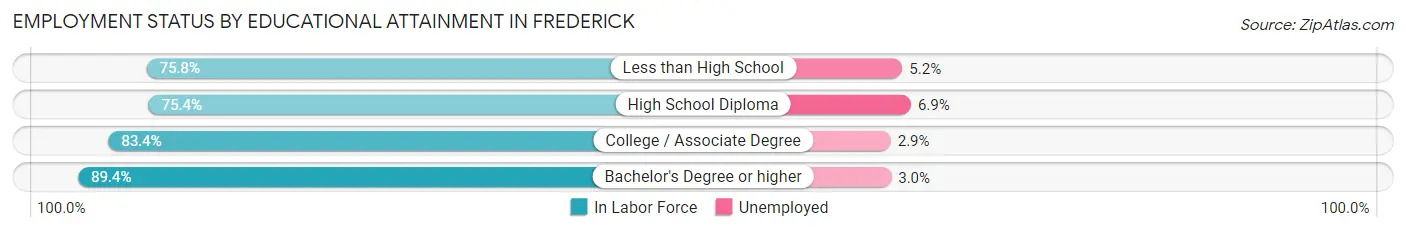
| Educational Attainment | In Labor Force | Unemployed |
| Less than High School | 3,324 (75.8%) | 228 (5.2%) |
| High School Diploma | 6,672 (75.4%) | 611 (6.9%) |
| College / Associate Degree | 9,674 (83.4%) | 336 (2.9%) |
| Bachelor's Degree or higher | 16,073 (89.4%) | 539 (3.0%) |
| Total | 35,749 (83.5%) | 1,670 (3.9%) |
Employment Occupations by Sex in Frederick
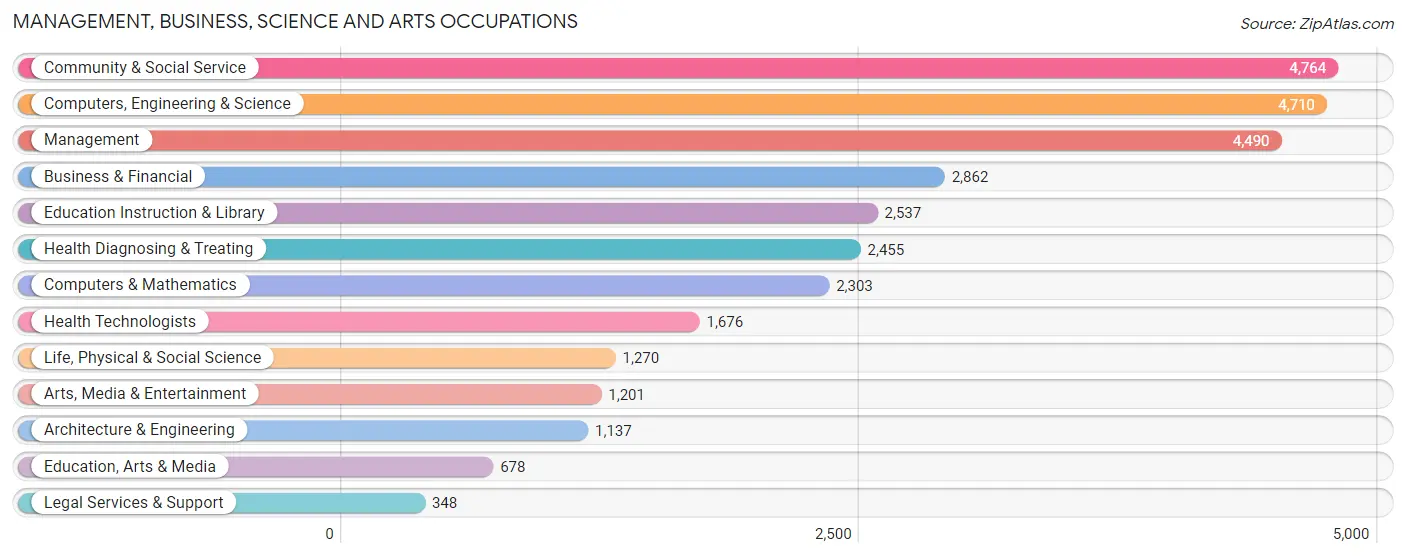
Management, Business, Science and Arts Occupations
The most common Management, Business, Science and Arts occupations in Frederick are Community & Social Service (4,764 | 11.4%), Computers, Engineering & Science (4,710 | 11.3%), Management (4,490 | 10.7%), Business & Financial (2,862 | 6.9%), and Education Instruction & Library (2,537 | 6.1%).
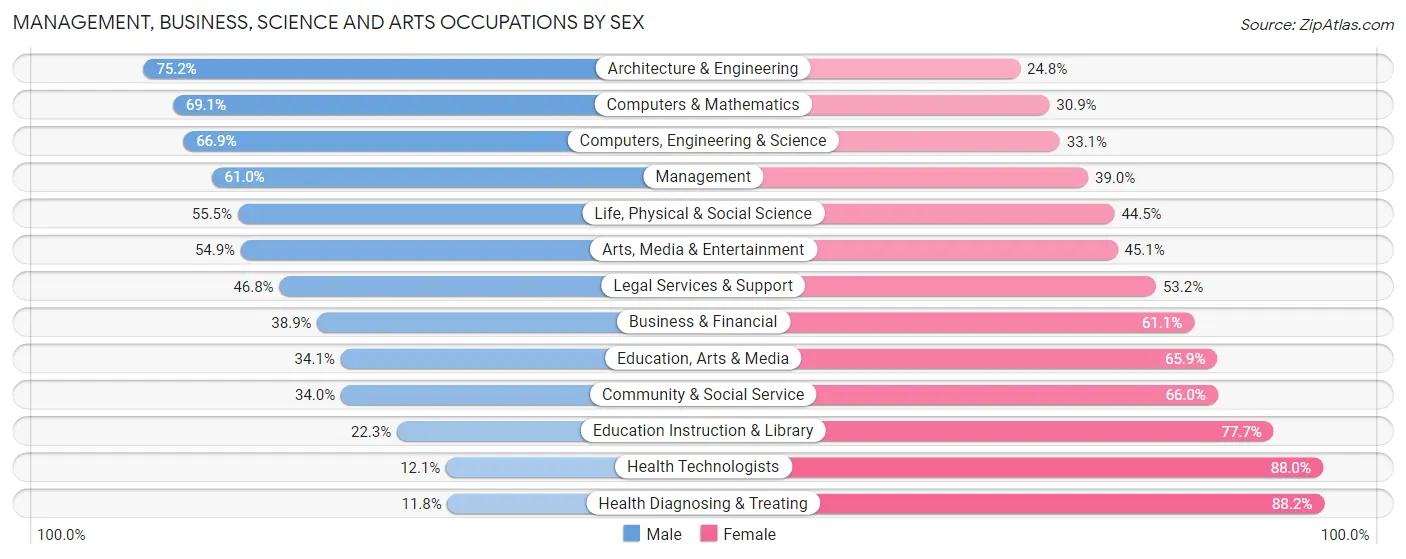
Management, Business, Science and Arts Occupations by Sex
Within the Management, Business, Science and Arts occupations in Frederick, the most male-oriented occupations are Architecture & Engineering (75.2%), Computers & Mathematics (69.1%), and Computers, Engineering & Science (66.9%), while the most female-oriented occupations are Health Diagnosing & Treating (88.2%), Health Technologists (87.9%), and Education Instruction & Library (77.7%).
| Occupation | Male | Female |
| Management | 2,740 (61.0%) | 1,750 (39.0%) |
| Business & Financial | 1,114 (38.9%) | 1,748 (61.1%) |
| Computers, Engineering & Science | 3,151 (66.9%) | 1,559 (33.1%) |
| Computers & Mathematics | 1,591 (69.1%) | 712 (30.9%) |
| Architecture & Engineering | 855 (75.2%) | 282 (24.8%) |
| Life, Physical & Social Science | 705 (55.5%) | 565 (44.5%) |
| Community & Social Service | 1,619 (34.0%) | 3,145 (66.0%) |
| Education, Arts & Media | 231 (34.1%) | 447 (65.9%) |
| Legal Services & Support | 163 (46.8%) | 185 (53.2%) |
| Education Instruction & Library | 566 (22.3%) | 1,971 (77.7%) |
| Arts, Media & Entertainment | 659 (54.9%) | 542 (45.1%) |
| Health Diagnosing & Treating | 289 (11.8%) | 2,166 (88.2%) |
| Health Technologists | 202 (12.0%) | 1,474 (87.9%) |
| Total (Category) | 8,913 (46.2%) | 10,368 (53.8%) |
| Total (Overall) | 22,010 (52.6%) | 19,801 (47.4%) |
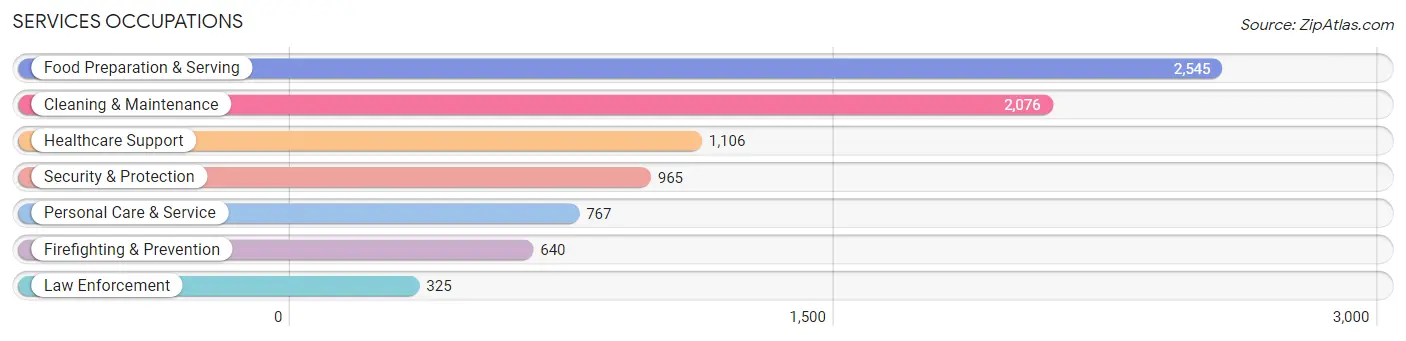
Services Occupations
The most common Services occupations in Frederick are Food Preparation & Serving (2,545 | 6.1%), Cleaning & Maintenance (2,076 | 5.0%), Healthcare Support (1,106 | 2.6%), Security & Protection (965 | 2.3%), and Personal Care & Service (767 | 1.8%).
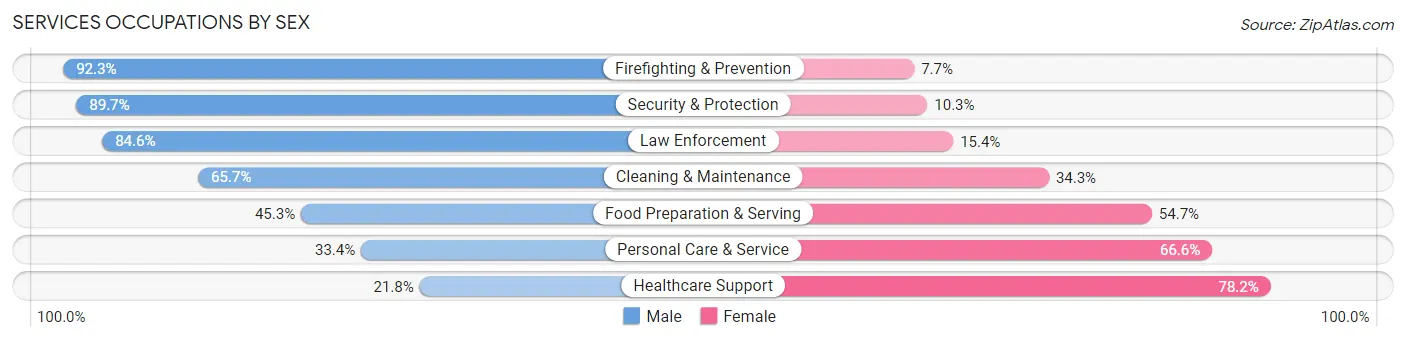
Services Occupations by Sex
Within the Services occupations in Frederick, the most male-oriented occupations are Firefighting & Prevention (92.3%), Security & Protection (89.7%), and Law Enforcement (84.6%), while the most female-oriented occupations are Healthcare Support (78.2%), Personal Care & Service (66.6%), and Food Preparation & Serving (54.7%).
| Occupation | Male | Female |
| Healthcare Support | 241 (21.8%) | 865 (78.2%) |
| Security & Protection | 866 (89.7%) | 99 (10.3%) |
| Firefighting & Prevention | 591 (92.3%) | 49 (7.7%) |
| Law Enforcement | 275 (84.6%) | 50 (15.4%) |
| Food Preparation & Serving | 1,152 (45.3%) | 1,393 (54.7%) |
| Cleaning & Maintenance | 1,363 (65.7%) | 713 (34.3%) |
| Personal Care & Service | 256 (33.4%) | 511 (66.6%) |
| Total (Category) | 3,878 (52.0%) | 3,581 (48.0%) |
| Total (Overall) | 22,010 (52.6%) | 19,801 (47.4%) |
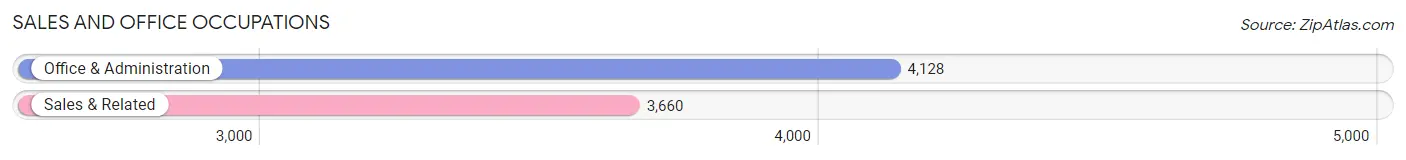
Sales and Office Occupations
The most common Sales and Office occupations in Frederick are Office & Administration (4,128 | 9.9%), and Sales & Related (3,660 | 8.7%).
Sales and Office Occupations by Sex
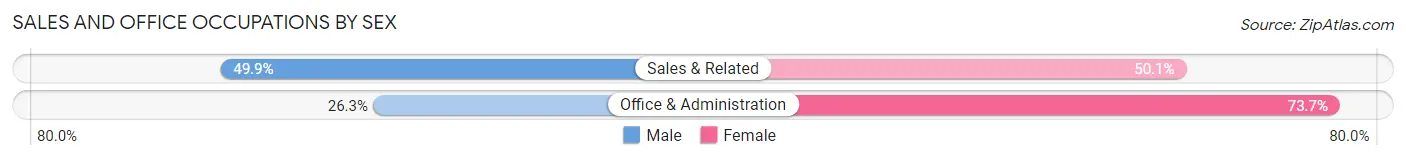
| Occupation | Male | Female |
| Sales & Related | 1,826 (49.9%) | 1,834 (50.1%) |
| Office & Administration | 1,085 (26.3%) | 3,043 (73.7%) |
| Total (Category) | 2,911 (37.4%) | 4,877 (62.6%) |
| Total (Overall) | 22,010 (52.6%) | 19,801 (47.4%) |
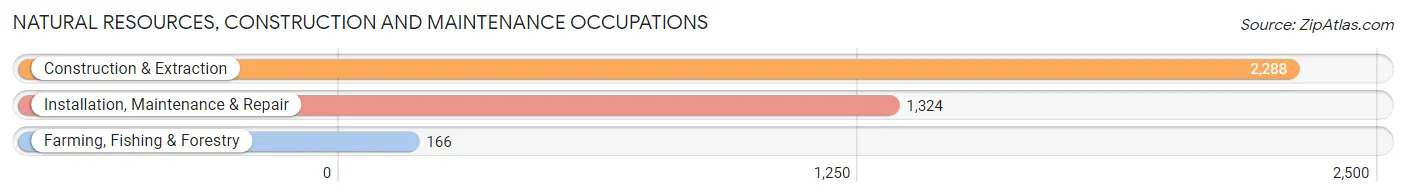
Natural Resources, Construction and Maintenance Occupations
The most common Natural Resources, Construction and Maintenance occupations in Frederick are Construction & Extraction (2,288 | 5.5%), Installation, Maintenance & Repair (1,324 | 3.2%), and Farming, Fishing & Forestry (166 | 0.4%).
Natural Resources, Construction and Maintenance Occupations by Sex
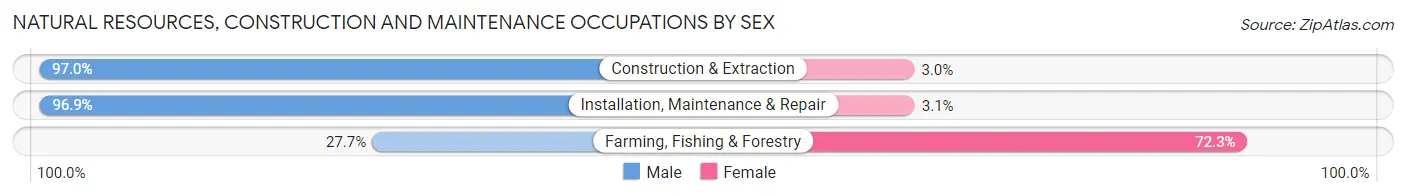
| Occupation | Male | Female |
| Farming, Fishing & Forestry | 46 (27.7%) | 120 (72.3%) |
| Construction & Extraction | 2,219 (97.0%) | 69 (3.0%) |
| Installation, Maintenance & Repair | 1,283 (96.9%) | 41 (3.1%) |
| Total (Category) | 3,548 (93.9%) | 230 (6.1%) |
| Total (Overall) | 22,010 (52.6%) | 19,801 (47.4%) |
Production, Transportation and Moving Occupations
The most common Production, Transportation and Moving occupations in Frederick are Material Moving (1,237 | 3.0%), Transportation (1,188 | 2.8%), and Production (1,080 | 2.6%).
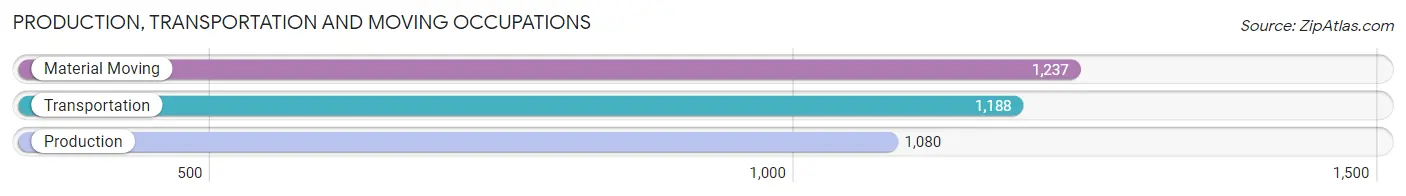
Production, Transportation and Moving Occupations by Sex
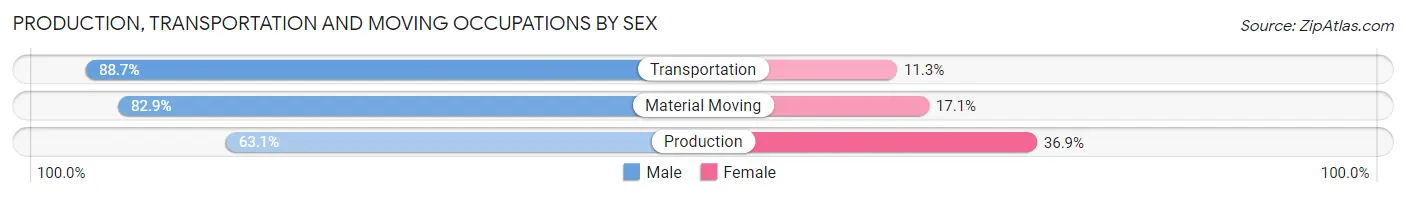
| Occupation | Male | Female |
| Production | 681 (63.1%) | 399 (36.9%) |
| Transportation | 1,054 (88.7%) | 134 (11.3%) |
| Material Moving | 1,025 (82.9%) | 212 (17.1%) |
| Total (Category) | 2,760 (78.7%) | 745 (21.3%) |
| Total (Overall) | 22,010 (52.6%) | 19,801 (47.4%) |
Employment Industries by Sex in Frederick
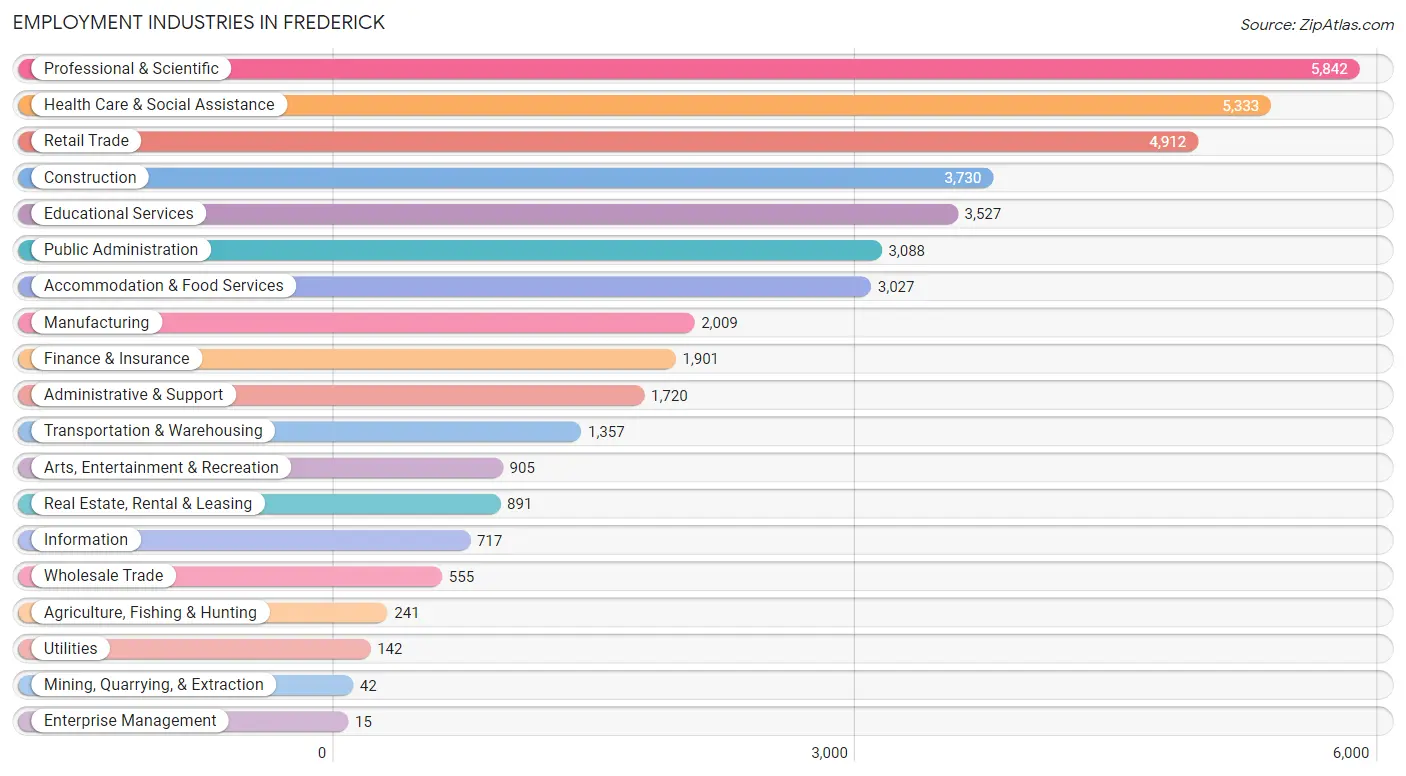
Employment Industries in Frederick
The major employment industries in Frederick include Professional & Scientific (5,842 | 14.0%), Health Care & Social Assistance (5,333 | 12.8%), Retail Trade (4,912 | 11.7%), Construction (3,730 | 8.9%), and Educational Services (3,527 | 8.4%).
Employment Industries by Sex in Frederick
The Frederick industries that see more men than women are Mining, Quarrying, & Extraction (100.0%), Utilities (100.0%), and Construction (92.1%), whereas the industries that tend to have a higher number of women are Enterprise Management (100.0%), Health Care & Social Assistance (80.7%), and Educational Services (67.2%).
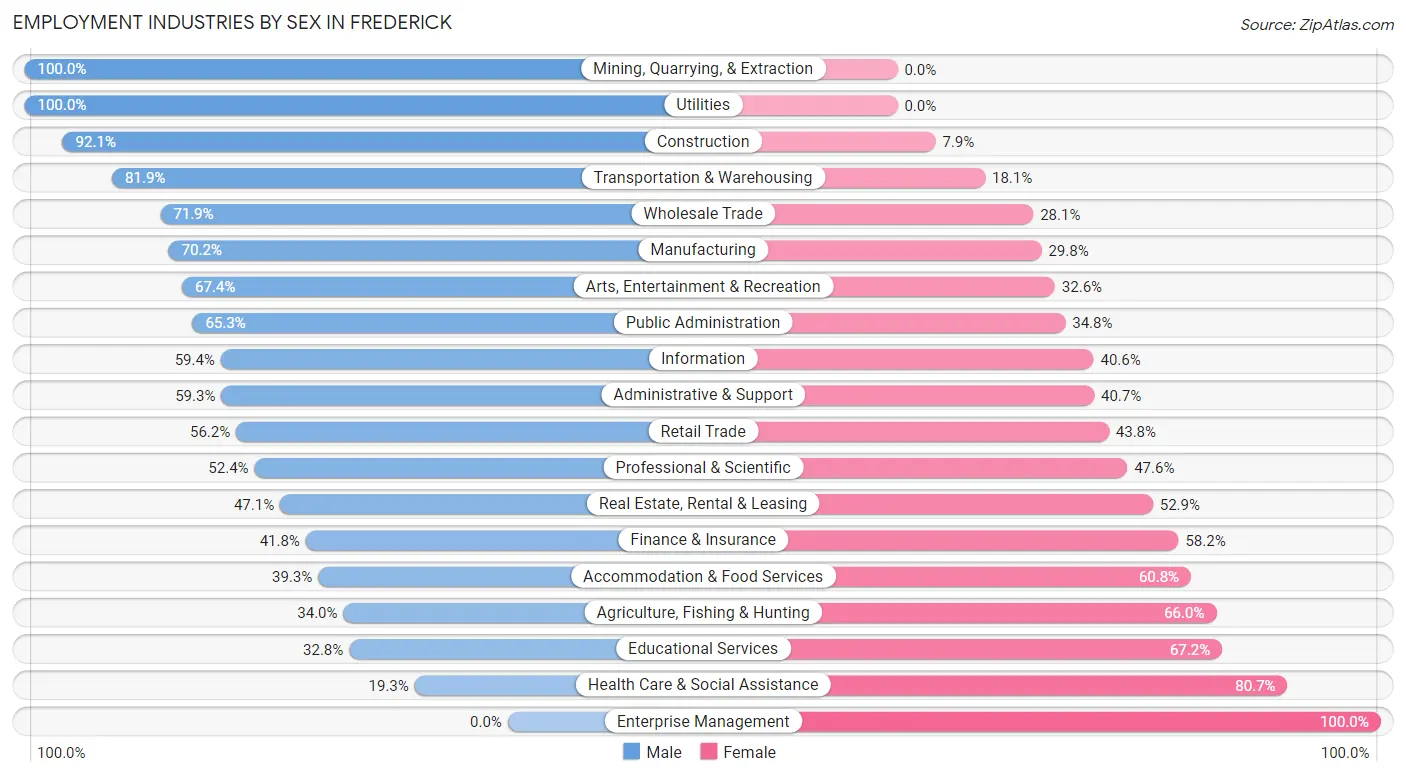
| Industry | Male | Female |
| Agriculture, Fishing & Hunting | 82 (34.0%) | 159 (66.0%) |
| Mining, Quarrying, & Extraction | 42 (100.0%) | 0 (0.0%) |
| Construction | 3,436 (92.1%) | 294 (7.9%) |
| Manufacturing | 1,410 (70.2%) | 599 (29.8%) |
| Wholesale Trade | 399 (71.9%) | 156 (28.1%) |
| Retail Trade | 2,762 (56.2%) | 2,150 (43.8%) |
| Transportation & Warehousing | 1,111 (81.9%) | 246 (18.1%) |
| Utilities | 142 (100.0%) | 0 (0.0%) |
| Information | 426 (59.4%) | 291 (40.6%) |
| Finance & Insurance | 795 (41.8%) | 1,106 (58.2%) |
| Real Estate, Rental & Leasing | 420 (47.1%) | 471 (52.9%) |
| Professional & Scientific | 3,063 (52.4%) | 2,779 (47.6%) |
| Enterprise Management | 0 (0.0%) | 15 (100.0%) |
| Administrative & Support | 1,020 (59.3%) | 700 (40.7%) |
| Educational Services | 1,158 (32.8%) | 2,369 (67.2%) |
| Health Care & Social Assistance | 1,029 (19.3%) | 4,304 (80.7%) |
| Arts, Entertainment & Recreation | 610 (67.4%) | 295 (32.6%) |
| Accommodation & Food Services | 1,188 (39.3%) | 1,839 (60.8%) |
| Public Administration | 2,015 (65.2%) | 1,073 (34.7%) |
| Total | 22,010 (52.6%) | 19,801 (47.4%) |
Education in Frederick
School Enrollment in Frederick
The most common levels of schooling among the 19,491 students in Frederick are college / undergraduate (4,472 | 22.9%), high school (4,276 | 21.9%), and middle school (3,738 | 19.2%).
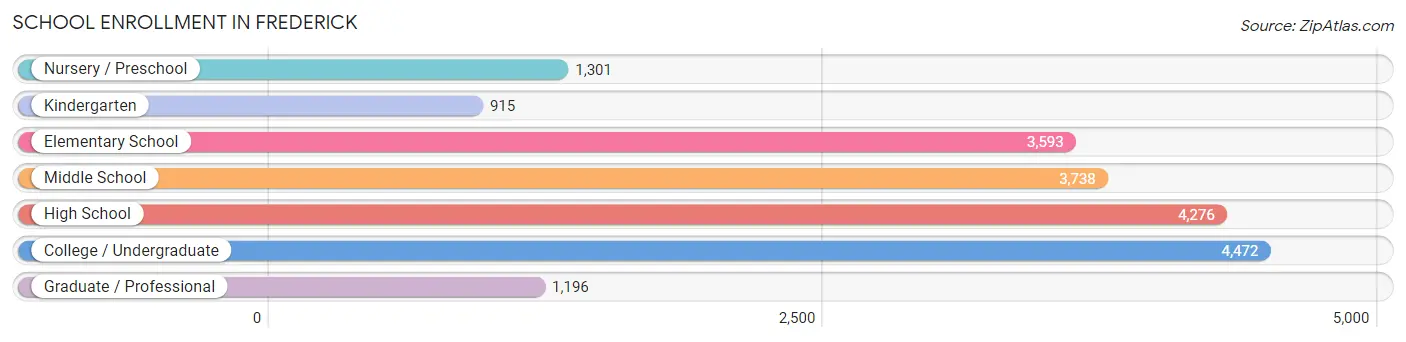
| School Level | # Students | % Students |
| Nursery / Preschool | 1,301 | 6.7% |
| Kindergarten | 915 | 4.7% |
| Elementary School | 3,593 | 18.4% |
| Middle School | 3,738 | 19.2% |
| High School | 4,276 | 21.9% |
| College / Undergraduate | 4,472 | 22.9% |
| Graduate / Professional | 1,196 | 6.1% |
| Total | 19,491 | 100.0% |
School Enrollment by Age by Funding Source in Frederick
Out of a total of 19,491 students who are enrolled in schools in Frederick, 3,547 (18.2%) attend a private institution, while the remaining 15,944 (81.8%) are enrolled in public schools. The age group of 3 to 4 year olds has the highest likelihood of being enrolled in private schools, with 302 (39.9% in the age bracket) enrolled. Conversely, the age group of 15 to 17 year olds has the lowest likelihood of being enrolled in a private school, with 2,552 (93.8% in the age bracket) attending a public institution.
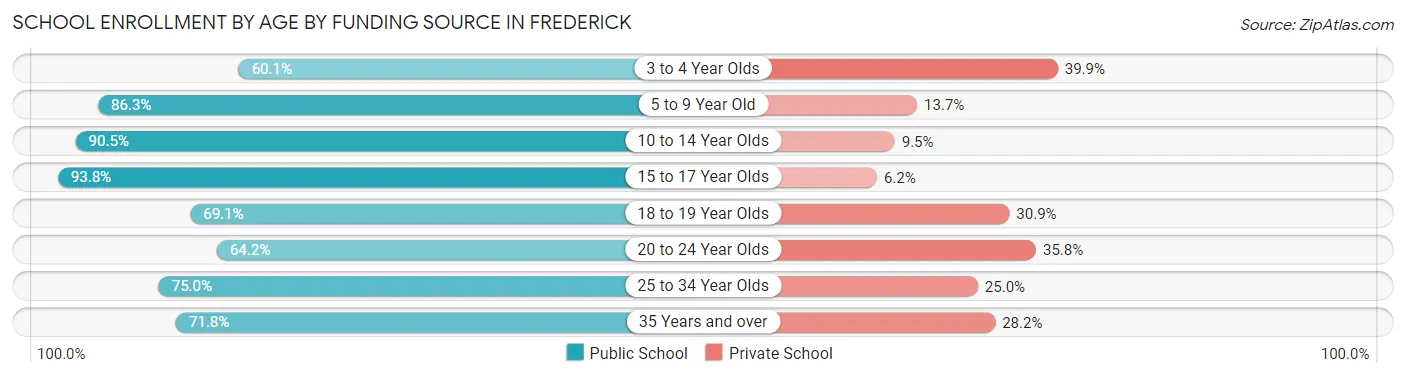
| Age Bracket | Public School | Private School |
| 3 to 4 Year Olds | 455 (60.1%) | 302 (39.9%) |
| 5 to 9 Year Old | 3,903 (86.3%) | 619 (13.7%) |
| 10 to 14 Year Olds | 4,467 (90.5%) | 470 (9.5%) |
| 15 to 17 Year Olds | 2,552 (93.8%) | 169 (6.2%) |
| 18 to 19 Year Olds | 945 (69.1%) | 422 (30.9%) |
| 20 to 24 Year Olds | 1,330 (64.2%) | 743 (35.8%) |
| 25 to 34 Year Olds | 1,233 (75.0%) | 411 (25.0%) |
| 35 Years and over | 1,055 (71.8%) | 415 (28.2%) |
| Total | 15,944 (81.8%) | 3,547 (18.2%) |
Educational Attainment by Field of Study in Frederick
Business (4,140 | 17.1%), education (2,461 | 10.2%), social sciences (2,287 | 9.5%), science & technology (2,037 | 8.4%), and bio, nature & agricultural (2,034 | 8.4%) are the most common fields of study among 24,200 individuals in Frederick who have obtained a bachelor's degree or higher.
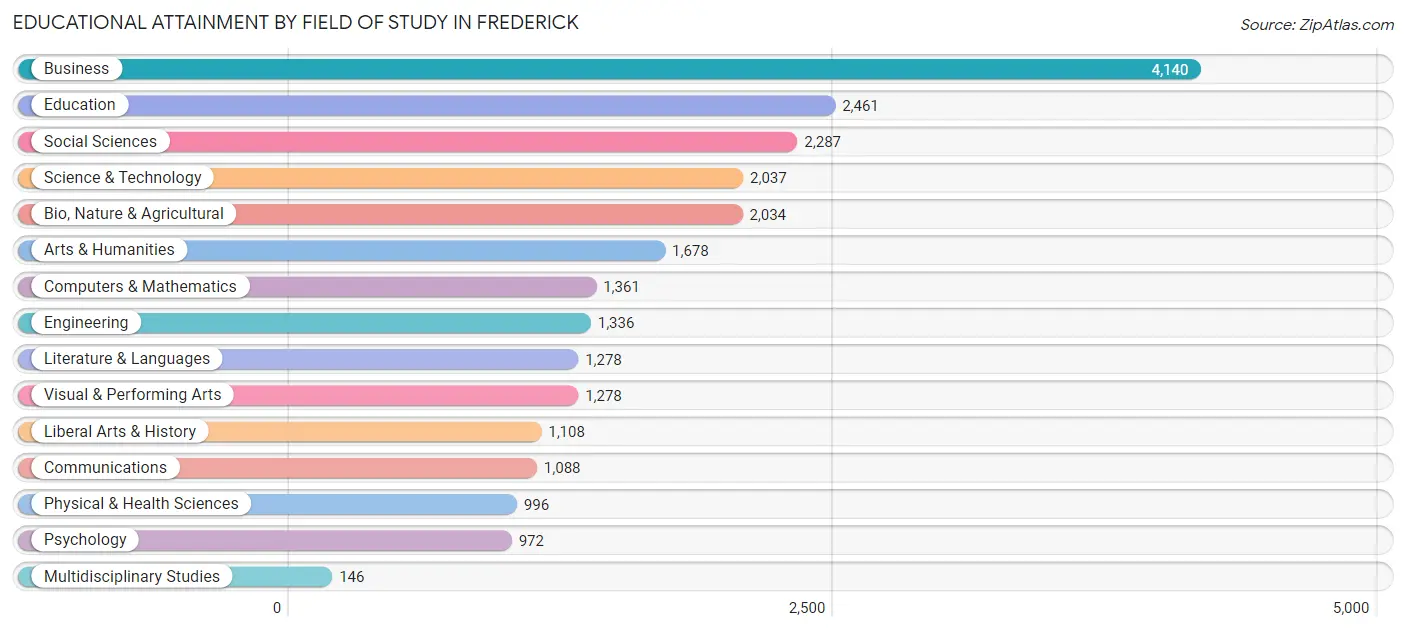
| Field of Study | # Graduates | % Graduates |
| Computers & Mathematics | 1,361 | 5.6% |
| Bio, Nature & Agricultural | 2,034 | 8.4% |
| Physical & Health Sciences | 996 | 4.1% |
| Psychology | 972 | 4.0% |
| Social Sciences | 2,287 | 9.5% |
| Engineering | 1,336 | 5.5% |
| Multidisciplinary Studies | 146 | 0.6% |
| Science & Technology | 2,037 | 8.4% |
| Business | 4,140 | 17.1% |
| Education | 2,461 | 10.2% |
| Literature & Languages | 1,278 | 5.3% |
| Liberal Arts & History | 1,108 | 4.6% |
| Visual & Performing Arts | 1,278 | 5.3% |
| Communications | 1,088 | 4.5% |
| Arts & Humanities | 1,678 | 6.9% |
| Total | 24,200 | 100.0% |
Transportation & Commute in Frederick
Vehicle Availability by Sex in Frederick
The most prevalent vehicle ownership categories in Frederick are males with 2 vehicles (9,554, accounting for 44.0%) and females with 2 vehicles (8,114, making up 49.6%).
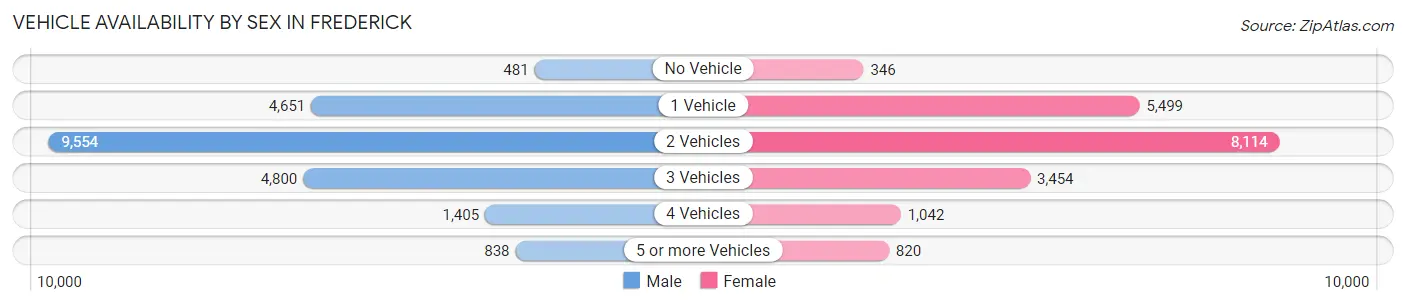
| Vehicles Available | Male | Female |
| No Vehicle | 481 (2.2%) | 346 (1.8%) |
| 1 Vehicle | 4,651 (21.4%) | 5,499 (28.5%) |
| 2 Vehicles | 9,554 (44.0%) | 8,114 (42.1%) |
| 3 Vehicles | 4,800 (22.1%) | 3,454 (17.9%) |
| 4 Vehicles | 1,405 (6.5%) | 1,042 (5.4%) |
| 5 or more Vehicles | 838 (3.9%) | 820 (4.3%) |
| Total | 21,729 (100.0%) | 19,275 (100.0%) |
Commute Time in Frederick
The most frequently occuring commute durations in Frederick are 10 to 14 minutes (6,566 commuters, 18.2%), 15 to 19 minutes (5,970 commuters, 16.6%), and 60 to 89 minutes (4,609 commuters, 12.8%).
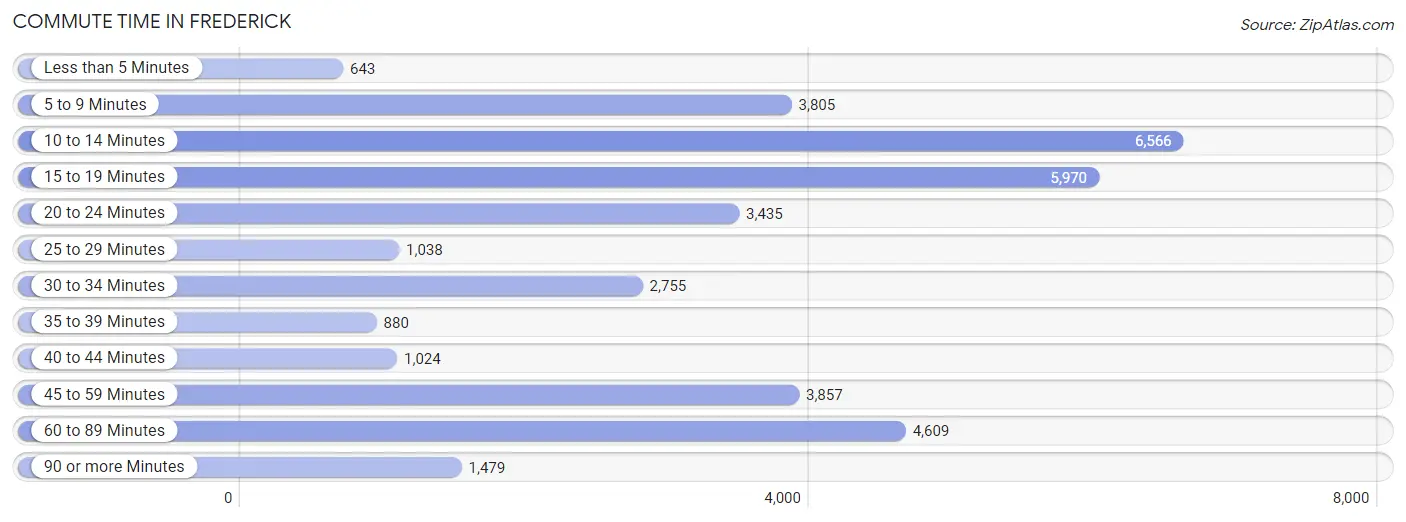
| Commute Time | # Commuters | % Commuters |
| Less than 5 Minutes | 643 | 1.8% |
| 5 to 9 Minutes | 3,805 | 10.5% |
| 10 to 14 Minutes | 6,566 | 18.2% |
| 15 to 19 Minutes | 5,970 | 16.6% |
| 20 to 24 Minutes | 3,435 | 9.5% |
| 25 to 29 Minutes | 1,038 | 2.9% |
| 30 to 34 Minutes | 2,755 | 7.6% |
| 35 to 39 Minutes | 880 | 2.4% |
| 40 to 44 Minutes | 1,024 | 2.8% |
| 45 to 59 Minutes | 3,857 | 10.7% |
| 60 to 89 Minutes | 4,609 | 12.8% |
| 90 or more Minutes | 1,479 | 4.1% |
Commute Time by Sex in Frederick
The most common commute times in Frederick are 10 to 14 minutes (3,090 commuters, 15.9%) for males and 10 to 14 minutes (3,476 commuters, 20.9%) for females.
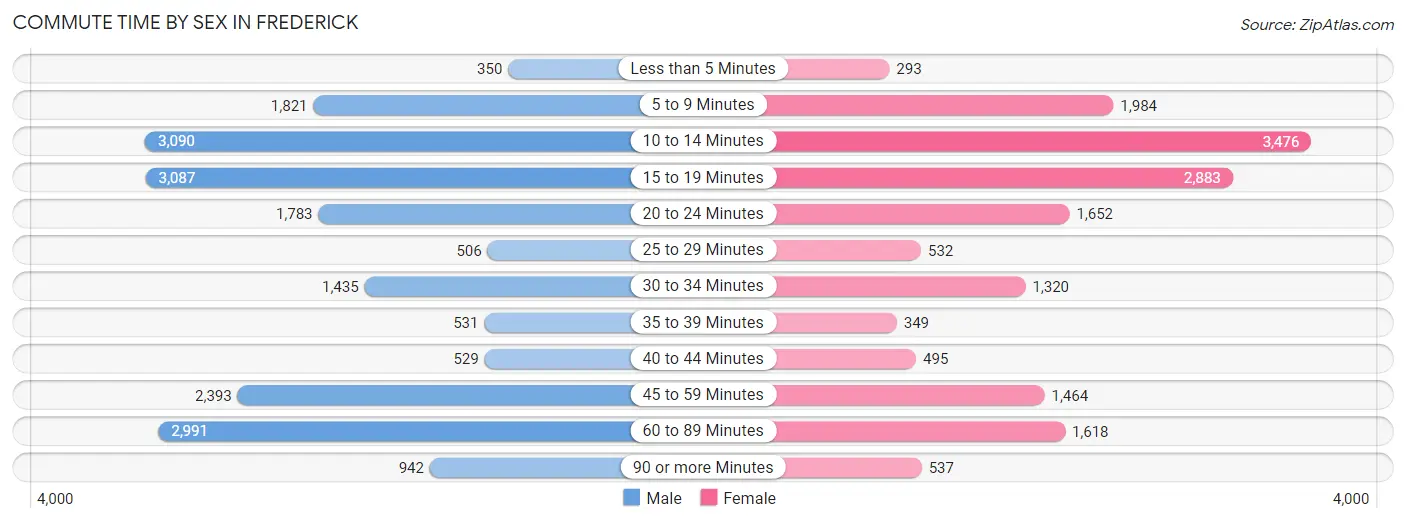
| Commute Time | Male | Female |
| Less than 5 Minutes | 350 (1.8%) | 293 (1.8%) |
| 5 to 9 Minutes | 1,821 (9.4%) | 1,984 (11.9%) |
| 10 to 14 Minutes | 3,090 (15.9%) | 3,476 (20.9%) |
| 15 to 19 Minutes | 3,087 (15.9%) | 2,883 (17.4%) |
| 20 to 24 Minutes | 1,783 (9.2%) | 1,652 (10.0%) |
| 25 to 29 Minutes | 506 (2.6%) | 532 (3.2%) |
| 30 to 34 Minutes | 1,435 (7.4%) | 1,320 (8.0%) |
| 35 to 39 Minutes | 531 (2.7%) | 349 (2.1%) |
| 40 to 44 Minutes | 529 (2.7%) | 495 (3.0%) |
| 45 to 59 Minutes | 2,393 (12.3%) | 1,464 (8.8%) |
| 60 to 89 Minutes | 2,991 (15.4%) | 1,618 (9.8%) |
| 90 or more Minutes | 942 (4.8%) | 537 (3.2%) |
Time of Departure to Work by Sex in Frederick
The most frequent times of departure to work in Frederick are 6:00 AM to 6:29 AM (2,090, 10.7%) for males and 7:30 AM to 7:59 AM (2,611, 15.7%) for females.
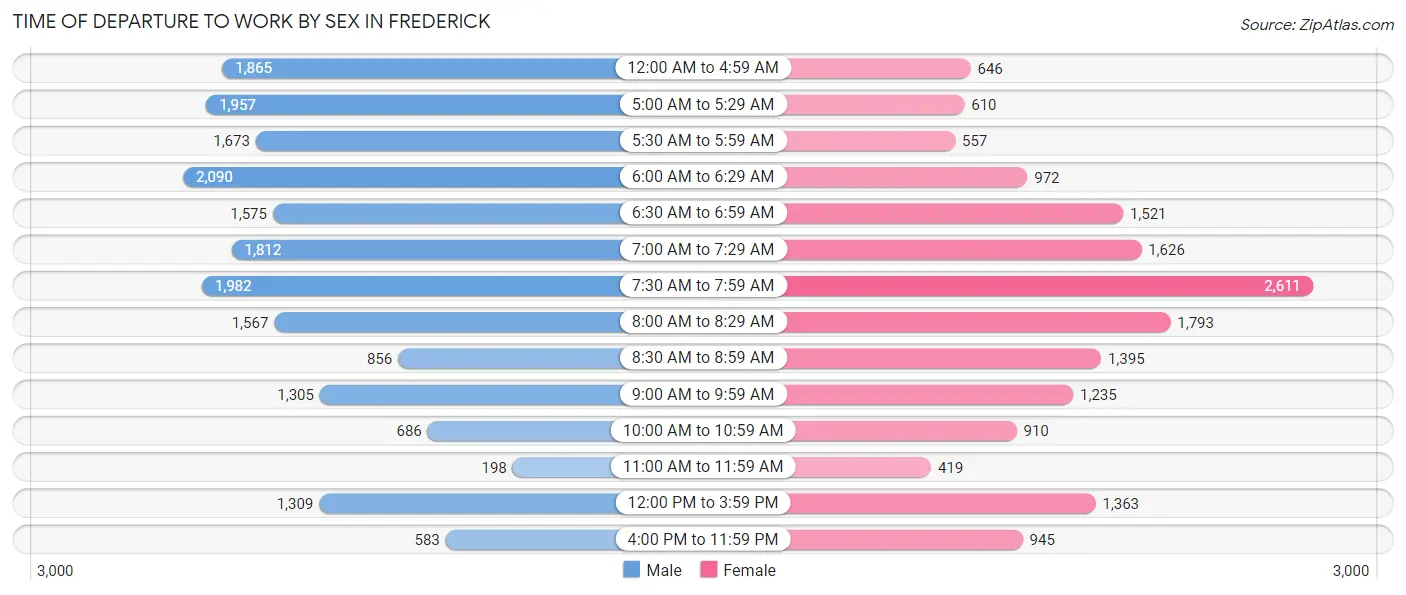
| Time of Departure | Male | Female |
| 12:00 AM to 4:59 AM | 1,865 (9.6%) | 646 (3.9%) |
| 5:00 AM to 5:29 AM | 1,957 (10.1%) | 610 (3.7%) |
| 5:30 AM to 5:59 AM | 1,673 (8.6%) | 557 (3.4%) |
| 6:00 AM to 6:29 AM | 2,090 (10.7%) | 972 (5.9%) |
| 6:30 AM to 6:59 AM | 1,575 (8.1%) | 1,521 (9.2%) |
| 7:00 AM to 7:29 AM | 1,812 (9.3%) | 1,626 (9.8%) |
| 7:30 AM to 7:59 AM | 1,982 (10.2%) | 2,611 (15.7%) |
| 8:00 AM to 8:29 AM | 1,567 (8.1%) | 1,793 (10.8%) |
| 8:30 AM to 8:59 AM | 856 (4.4%) | 1,395 (8.4%) |
| 9:00 AM to 9:59 AM | 1,305 (6.7%) | 1,235 (7.4%) |
| 10:00 AM to 10:59 AM | 686 (3.5%) | 910 (5.5%) |
| 11:00 AM to 11:59 AM | 198 (1.0%) | 419 (2.5%) |
| 12:00 PM to 3:59 PM | 1,309 (6.7%) | 1,363 (8.2%) |
| 4:00 PM to 11:59 PM | 583 (3.0%) | 945 (5.7%) |
| Total | 19,458 (100.0%) | 16,603 (100.0%) |
Housing Occupancy in Frederick
Occupancy by Ownership in Frederick
Of the total 31,383 dwellings in Frederick, owner-occupied units account for 18,351 (58.5%), while renter-occupied units make up 13,032 (41.5%).
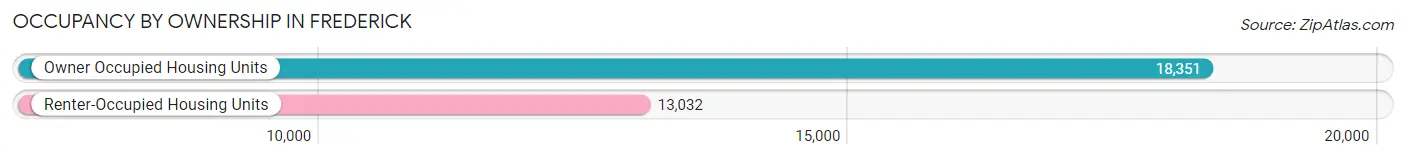
| Occupancy | # Housing Units | % Housing Units |
| Owner Occupied Housing Units | 18,351 | 58.5% |
| Renter-Occupied Housing Units | 13,032 | 41.5% |
| Total Occupied Housing Units | 31,383 | 100.0% |
Occupancy by Household Size in Frederick
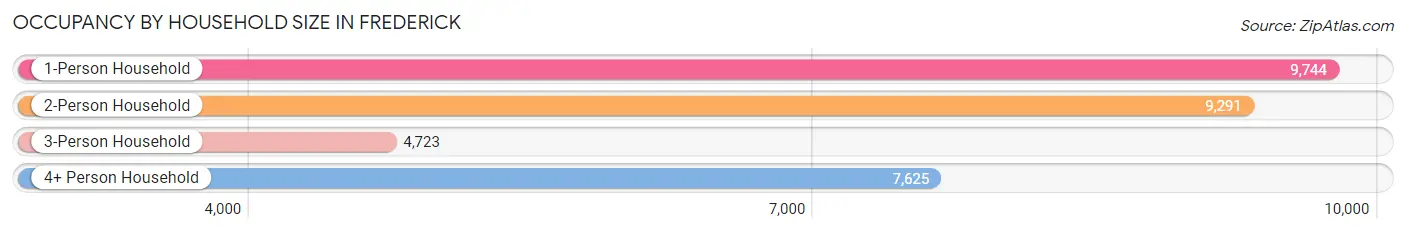
| Household Size | # Housing Units | % Housing Units |
| 1-Person Household | 9,744 | 31.0% |
| 2-Person Household | 9,291 | 29.6% |
| 3-Person Household | 4,723 | 15.0% |
| 4+ Person Household | 7,625 | 24.3% |
| Total Housing Units | 31,383 | 100.0% |
Occupancy by Ownership by Household Size in Frederick
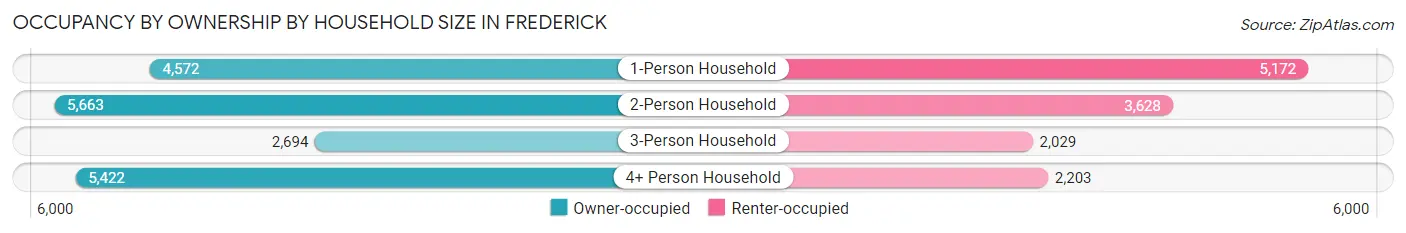
| Household Size | Owner-occupied | Renter-occupied |
| 1-Person Household | 4,572 (46.9%) | 5,172 (53.1%) |
| 2-Person Household | 5,663 (61.0%) | 3,628 (39.1%) |
| 3-Person Household | 2,694 (57.0%) | 2,029 (43.0%) |
| 4+ Person Household | 5,422 (71.1%) | 2,203 (28.9%) |
| Total Housing Units | 18,351 (58.5%) | 13,032 (41.5%) |
Occupancy by Educational Attainment in Frederick
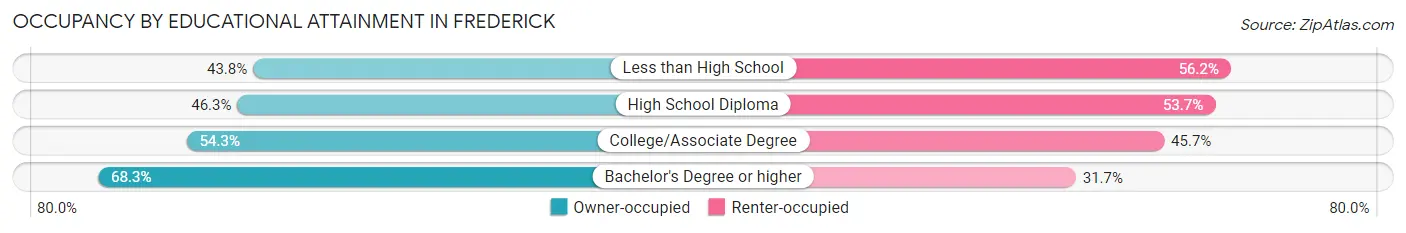
| Household Size | Owner-occupied | Renter-occupied |
| Less than High School | 1,197 (43.8%) | 1,538 (56.2%) |
| High School Diploma | 2,607 (46.3%) | 3,027 (53.7%) |
| College/Associate Degree | 4,577 (54.3%) | 3,849 (45.7%) |
| Bachelor's Degree or higher | 9,970 (68.3%) | 4,618 (31.7%) |
Occupancy by Age of Householder in Frederick
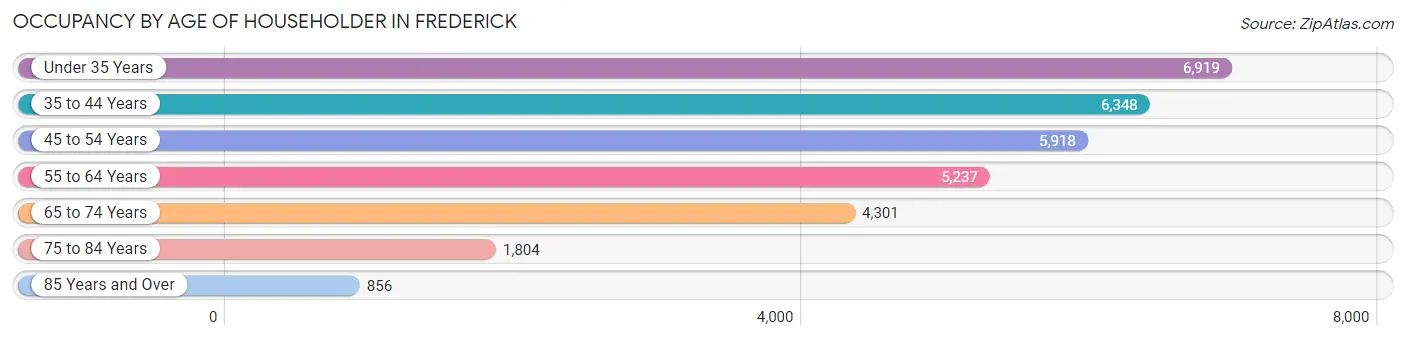
| Age Bracket | # Households | % Households |
| Under 35 Years | 6,919 | 22.1% |
| 35 to 44 Years | 6,348 | 20.2% |
| 45 to 54 Years | 5,918 | 18.9% |
| 55 to 64 Years | 5,237 | 16.7% |
| 65 to 74 Years | 4,301 | 13.7% |
| 75 to 84 Years | 1,804 | 5.8% |
| 85 Years and Over | 856 | 2.7% |
| Total | 31,383 | 100.0% |
Housing Finances in Frederick
Median Income by Occupancy in Frederick
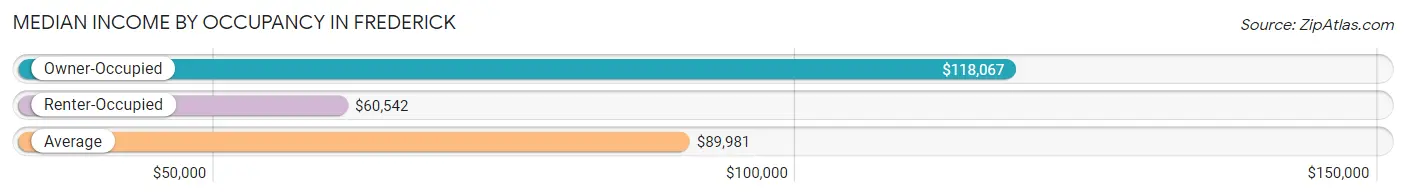
| Occupancy Type | # Households | Median Income |
| Owner-Occupied | 18,351 (58.5%) | $118,067 |
| Renter-Occupied | 13,032 (41.5%) | $60,542 |
| Average | 31,383 (100.0%) | $89,981 |
Occupancy by Householder Income Bracket in Frederick
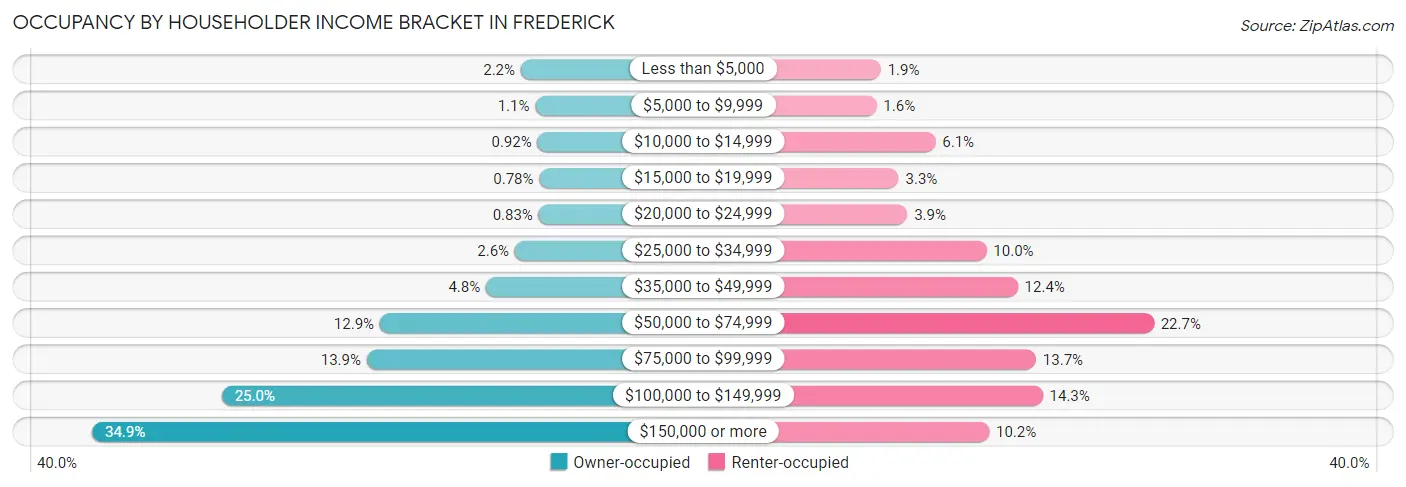
| Income Bracket | Owner-occupied | Renter-occupied |
| Less than $5,000 | 401 (2.2%) | 250 (1.9%) |
| $5,000 to $9,999 | 200 (1.1%) | 207 (1.6%) |
| $10,000 to $14,999 | 169 (0.9%) | 792 (6.1%) |
| $15,000 to $19,999 | 143 (0.8%) | 427 (3.3%) |
| $20,000 to $24,999 | 153 (0.8%) | 514 (3.9%) |
| $25,000 to $34,999 | 484 (2.6%) | 1,299 (10.0%) |
| $35,000 to $49,999 | 889 (4.8%) | 1,609 (12.3%) |
| $50,000 to $74,999 | 2,373 (12.9%) | 2,961 (22.7%) |
| $75,000 to $99,999 | 2,557 (13.9%) | 1,791 (13.7%) |
| $100,000 to $149,999 | 4,584 (25.0%) | 1,857 (14.2%) |
| $150,000 or more | 6,398 (34.9%) | 1,325 (10.2%) |
| Total | 18,351 (100.0%) | 13,032 (100.0%) |
Monthly Housing Cost Tiers in Frederick
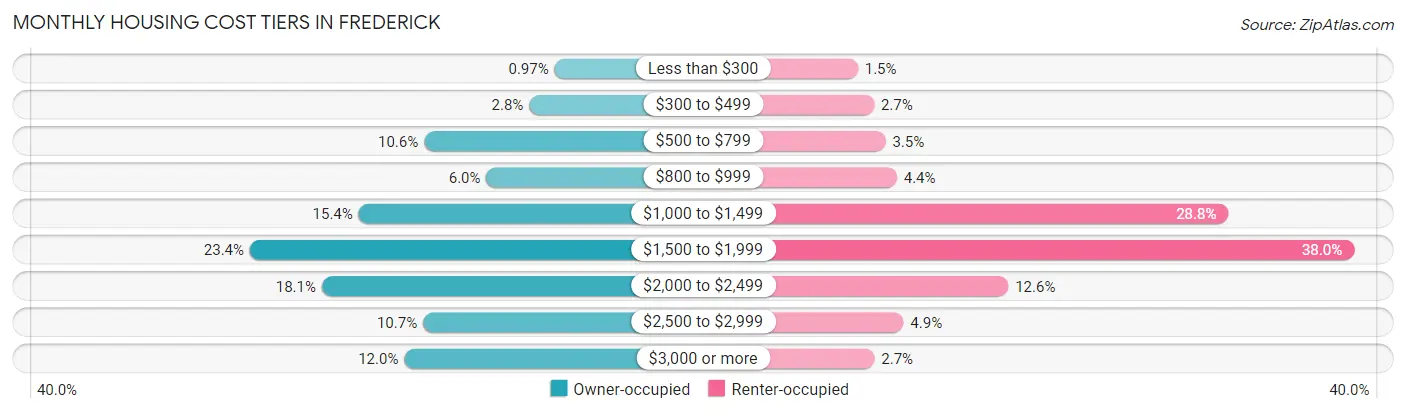
| Monthly Cost | Owner-occupied | Renter-occupied |
| Less than $300 | 178 (1.0%) | 195 (1.5%) |
| $300 to $499 | 522 (2.8%) | 350 (2.7%) |
| $500 to $799 | 1,941 (10.6%) | 461 (3.5%) |
| $800 to $999 | 1,099 (6.0%) | 569 (4.4%) |
| $1,000 to $1,499 | 2,826 (15.4%) | 3,751 (28.8%) |
| $1,500 to $1,999 | 4,296 (23.4%) | 4,958 (38.0%) |
| $2,000 to $2,499 | 3,323 (18.1%) | 1,639 (12.6%) |
| $2,500 to $2,999 | 1,956 (10.7%) | 633 (4.9%) |
| $3,000 or more | 2,210 (12.0%) | 355 (2.7%) |
| Total | 18,351 (100.0%) | 13,032 (100.0%) |
Physical Housing Characteristics in Frederick
Housing Structures in Frederick
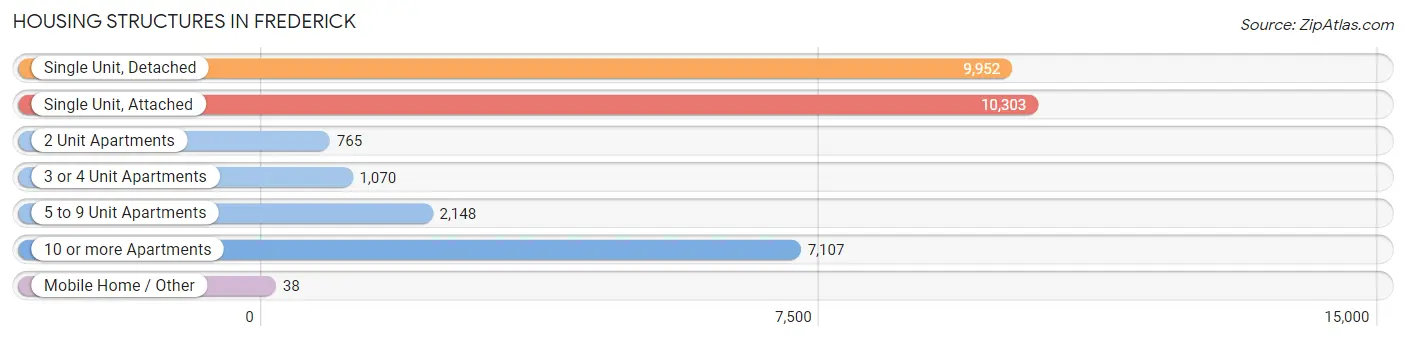
| Structure Type | # Housing Units | % Housing Units |
| Single Unit, Detached | 9,952 | 31.7% |
| Single Unit, Attached | 10,303 | 32.8% |
| 2 Unit Apartments | 765 | 2.4% |
| 3 or 4 Unit Apartments | 1,070 | 3.4% |
| 5 to 9 Unit Apartments | 2,148 | 6.8% |
| 10 or more Apartments | 7,107 | 22.7% |
| Mobile Home / Other | 38 | 0.1% |
| Total | 31,383 | 100.0% |
Housing Structures by Occupancy in Frederick
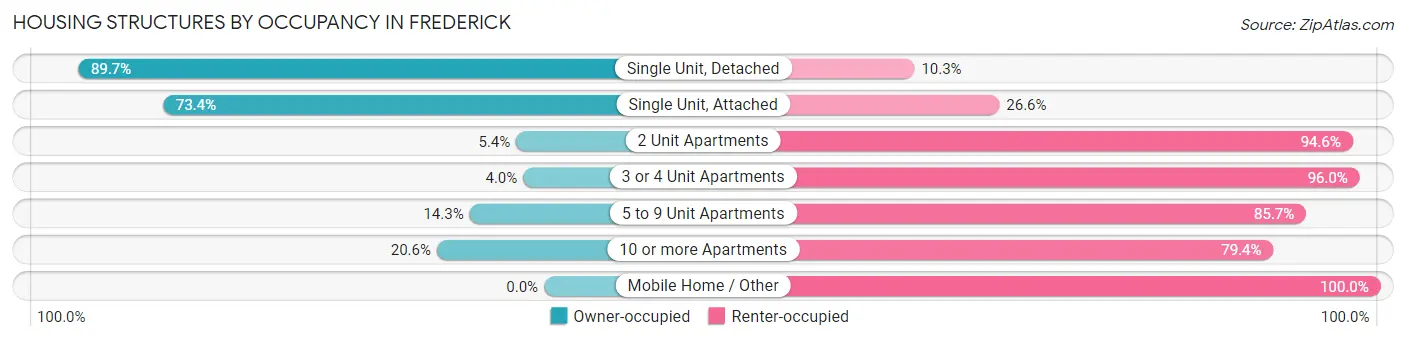
| Structure Type | Owner-occupied | Renter-occupied |
| Single Unit, Detached | 8,931 (89.7%) | 1,021 (10.3%) |
| Single Unit, Attached | 7,561 (73.4%) | 2,742 (26.6%) |
| 2 Unit Apartments | 41 (5.4%) | 724 (94.6%) |
| 3 or 4 Unit Apartments | 43 (4.0%) | 1,027 (96.0%) |
| 5 to 9 Unit Apartments | 308 (14.3%) | 1,840 (85.7%) |
| 10 or more Apartments | 1,467 (20.6%) | 5,640 (79.4%) |
| Mobile Home / Other | 0 (0.0%) | 38 (100.0%) |
| Total | 18,351 (58.5%) | 13,032 (41.5%) |
Housing Structures by Number of Rooms in Frederick
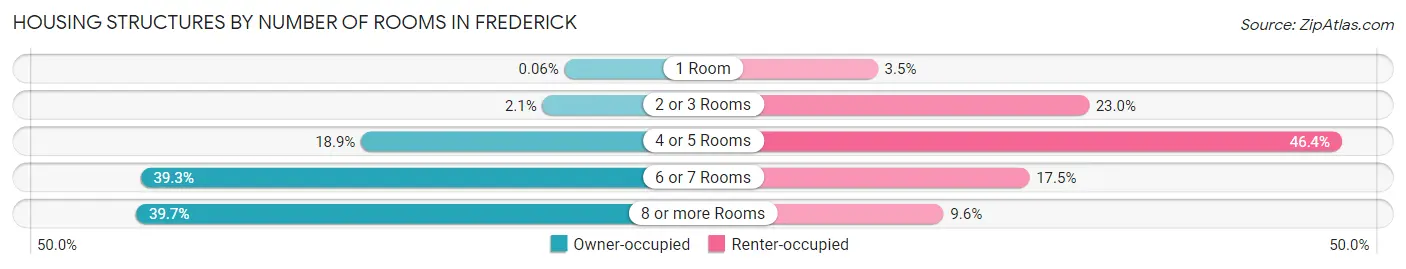
| Number of Rooms | Owner-occupied | Renter-occupied |
| 1 Room | 11 (0.1%) | 455 (3.5%) |
| 2 or 3 Rooms | 385 (2.1%) | 2,999 (23.0%) |
| 4 or 5 Rooms | 3,463 (18.9%) | 6,049 (46.4%) |
| 6 or 7 Rooms | 7,208 (39.3%) | 2,282 (17.5%) |
| 8 or more Rooms | 7,284 (39.7%) | 1,247 (9.6%) |
| Total | 18,351 (100.0%) | 13,032 (100.0%) |
Housing Structure by Heating Type in Frederick
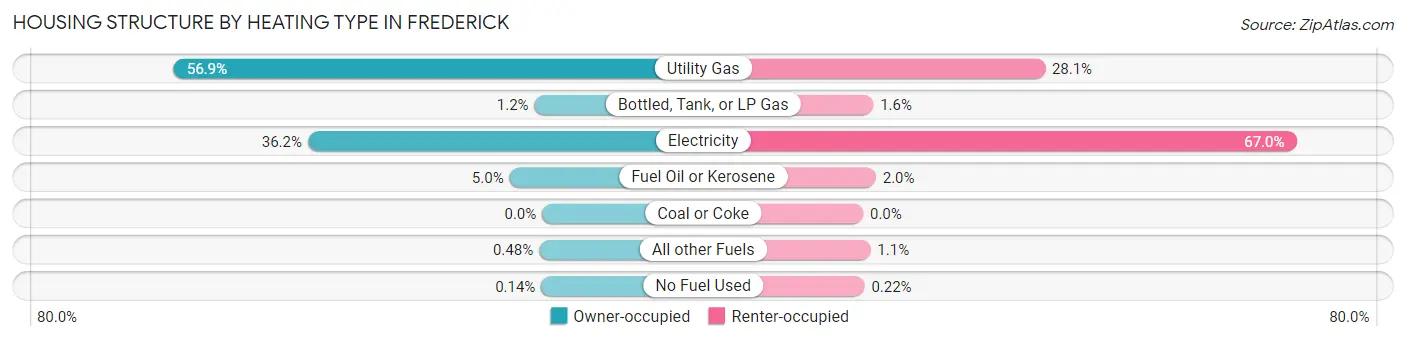
| Heating Type | Owner-occupied | Renter-occupied |
| Utility Gas | 10,447 (56.9%) | 3,664 (28.1%) |
| Bottled, Tank, or LP Gas | 219 (1.2%) | 204 (1.6%) |
| Electricity | 6,647 (36.2%) | 8,729 (67.0%) |
| Fuel Oil or Kerosene | 924 (5.0%) | 257 (2.0%) |
| Coal or Coke | 0 (0.0%) | 0 (0.0%) |
| All other Fuels | 88 (0.5%) | 149 (1.1%) |
| No Fuel Used | 26 (0.1%) | 29 (0.2%) |
| Total | 18,351 (100.0%) | 13,032 (100.0%) |
Household Vehicle Usage in Frederick
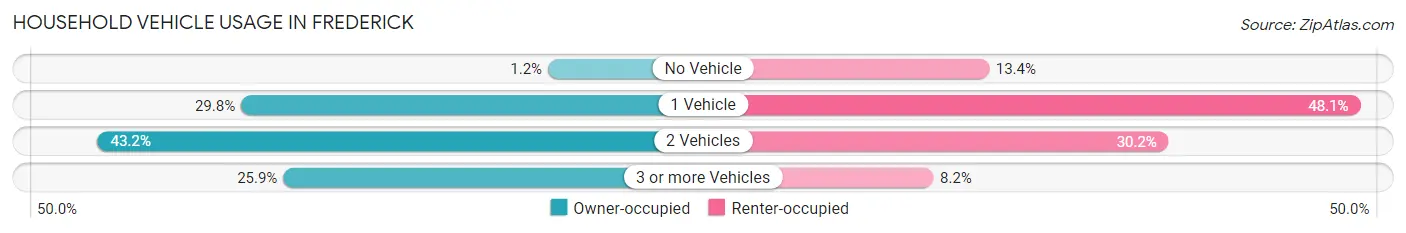
| Vehicles per Household | Owner-occupied | Renter-occupied |
| No Vehicle | 211 (1.1%) | 1,750 (13.4%) |
| 1 Vehicle | 5,469 (29.8%) | 6,271 (48.1%) |
| 2 Vehicles | 7,926 (43.2%) | 3,938 (30.2%) |
| 3 or more Vehicles | 4,745 (25.9%) | 1,073 (8.2%) |
| Total | 18,351 (100.0%) | 13,032 (100.0%) |
Real Estate & Mortgages in Frederick
Real Estate and Mortgage Overview in Frederick
| Characteristic | Without Mortgage | With Mortgage |
| Housing Units | 4,079 | 14,272 |
| Median Property Value | $330,200 | $347,500 |
| Median Household Income | $86,278 | $5,427 |
| Monthly Housing Costs | $726 | $2,210 |
| Real Estate Taxes | $5,006 | $434 |
Property Value by Mortgage Status in Frederick
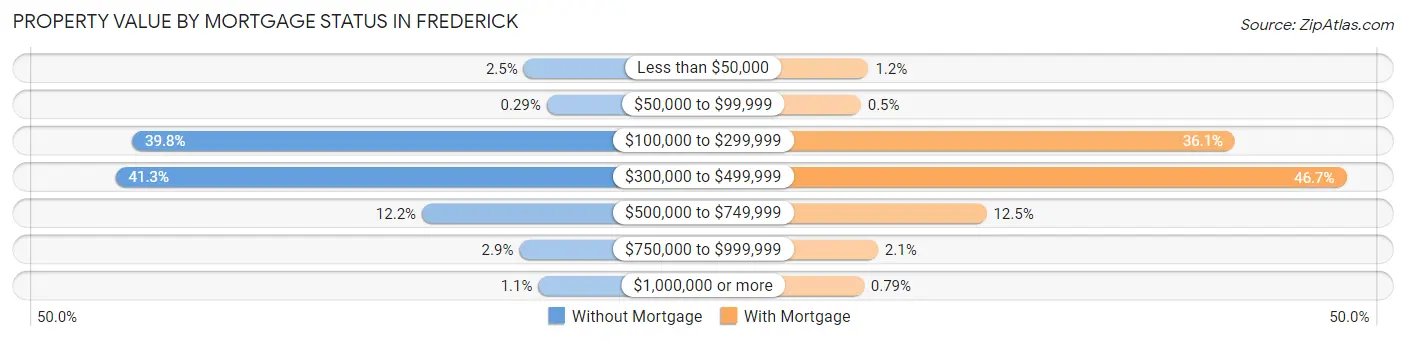
| Property Value | Without Mortgage | With Mortgage |
| Less than $50,000 | 101 (2.5%) | 176 (1.2%) |
| $50,000 to $99,999 | 12 (0.3%) | 72 (0.5%) |
| $100,000 to $299,999 | 1,622 (39.8%) | 5,156 (36.1%) |
| $300,000 to $499,999 | 1,686 (41.3%) | 6,671 (46.7%) |
| $500,000 to $749,999 | 496 (12.2%) | 1,780 (12.5%) |
| $750,000 to $999,999 | 118 (2.9%) | 304 (2.1%) |
| $1,000,000 or more | 44 (1.1%) | 113 (0.8%) |
| Total | 4,079 (100.0%) | 14,272 (100.0%) |
Household Income by Mortgage Status in Frederick
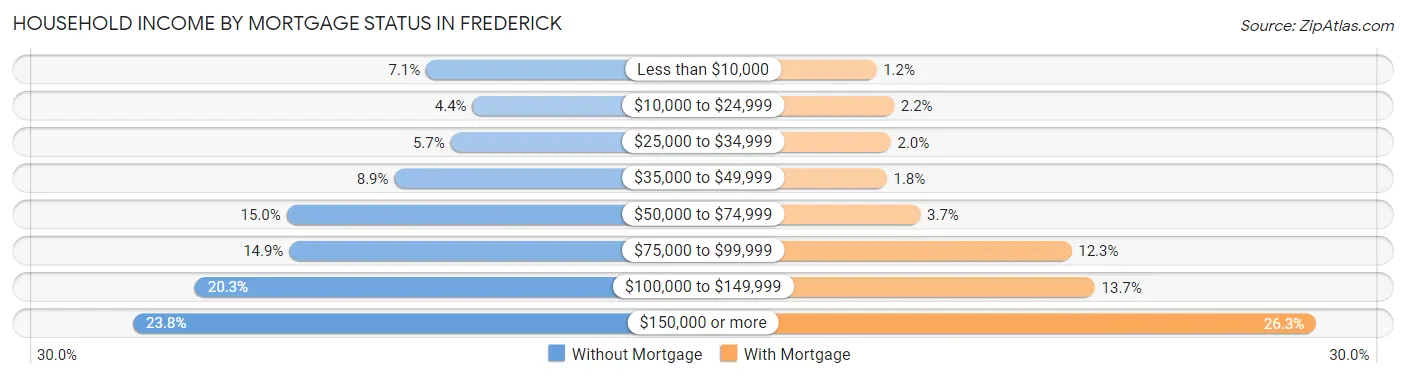
| Household Income | Without Mortgage | With Mortgage |
| Less than $10,000 | 288 (7.1%) | 169 (1.2%) |
| $10,000 to $24,999 | 180 (4.4%) | 313 (2.2%) |
| $25,000 to $34,999 | 231 (5.7%) | 285 (2.0%) |
| $35,000 to $49,999 | 362 (8.9%) | 253 (1.8%) |
| $50,000 to $74,999 | 613 (15.0%) | 527 (3.7%) |
| $75,000 to $99,999 | 607 (14.9%) | 1,760 (12.3%) |
| $100,000 to $149,999 | 827 (20.3%) | 1,950 (13.7%) |
| $150,000 or more | 971 (23.8%) | 3,757 (26.3%) |
| Total | 4,079 (100.0%) | 14,272 (100.0%) |
Property Value to Household Income Ratio in Frederick
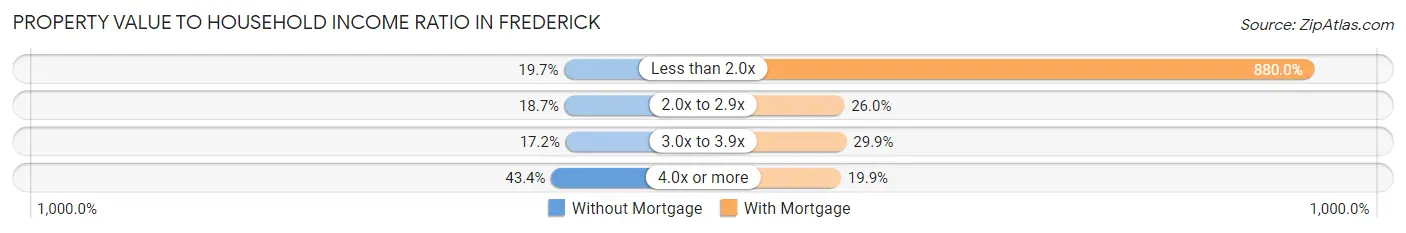
| Value-to-Income Ratio | Without Mortgage | With Mortgage |
| Less than 2.0x | 804 (19.7%) | 125,599 (880.0%) |
| 2.0x to 2.9x | 762 (18.7%) | 3,714 (26.0%) |
| 3.0x to 3.9x | 702 (17.2%) | 4,261 (29.9%) |
| 4.0x or more | 1,769 (43.4%) | 2,845 (19.9%) |
| Total | 4,079 (100.0%) | 14,272 (100.0%) |
Real Estate Taxes by Mortgage Status in Frederick
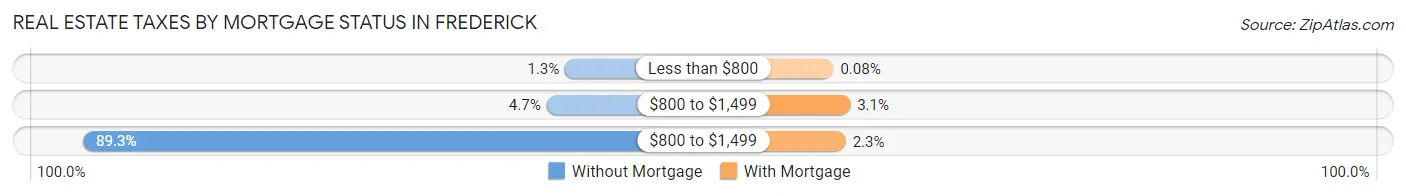
| Property Taxes | Without Mortgage | With Mortgage |
| Less than $800 | 52 (1.3%) | 12 (0.1%) |
| $800 to $1,499 | 191 (4.7%) | 448 (3.1%) |
| $800 to $1,499 | 3,643 (89.3%) | 329 (2.3%) |
| Total | 4,079 (100.0%) | 14,272 (100.0%) |
Health & Disability in Frederick
Health Insurance Coverage by Age in Frederick
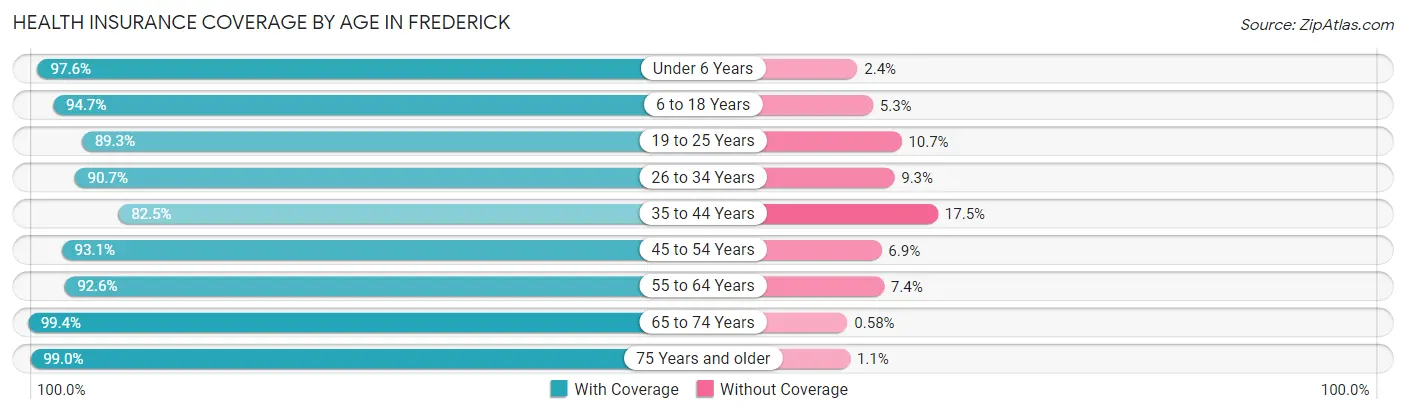
| Age Bracket | With Coverage | Without Coverage |
| Under 6 Years | 5,829 (97.6%) | 146 (2.4%) |
| 6 to 18 Years | 11,497 (94.7%) | 646 (5.3%) |
| 19 to 25 Years | 6,408 (89.3%) | 765 (10.7%) |
| 26 to 34 Years | 9,980 (90.7%) | 1,026 (9.3%) |
| 35 to 44 Years | 9,489 (82.5%) | 2,007 (17.5%) |
| 45 to 54 Years | 9,317 (93.1%) | 693 (6.9%) |
| 55 to 64 Years | 8,287 (92.6%) | 661 (7.4%) |
| 65 to 74 Years | 6,361 (99.4%) | 37 (0.6%) |
| 75 Years and older | 3,974 (99.0%) | 42 (1.1%) |
| Total | 71,142 (92.2%) | 6,023 (7.8%) |
Health Insurance Coverage by Citizenship Status in Frederick
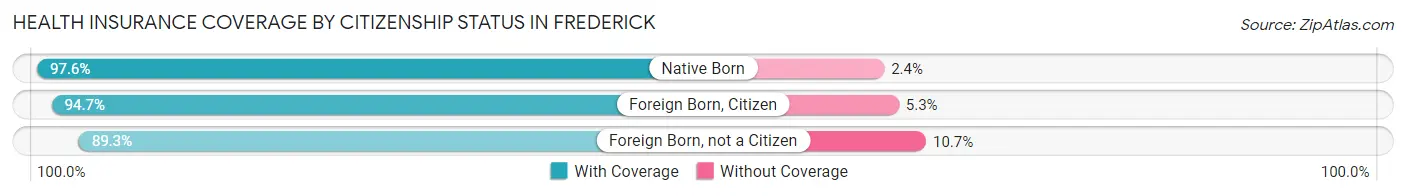
| Citizenship Status | With Coverage | Without Coverage |
| Native Born | 5,829 (97.6%) | 146 (2.4%) |
| Foreign Born, Citizen | 11,497 (94.7%) | 646 (5.3%) |
| Foreign Born, not a Citizen | 6,408 (89.3%) | 765 (10.7%) |
Health Insurance Coverage by Household Income in Frederick
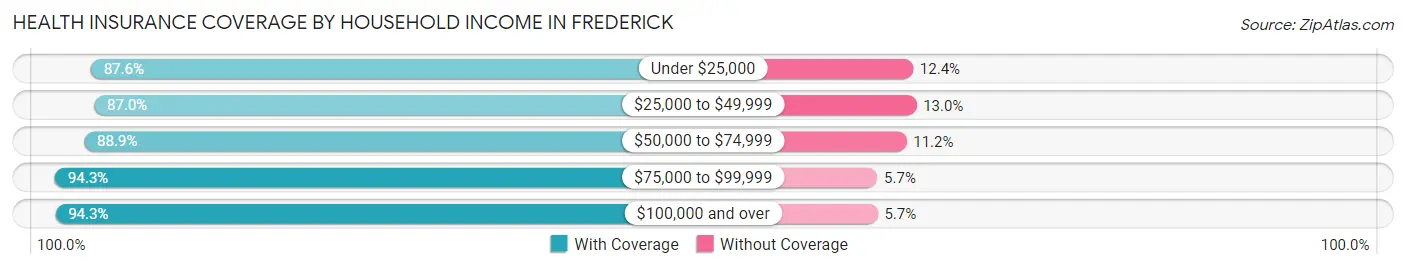
| Household Income | With Coverage | Without Coverage |
| Under $25,000 | 5,317 (87.6%) | 752 (12.4%) |
| $25,000 to $49,999 | 7,157 (87.0%) | 1,069 (13.0%) |
| $50,000 to $74,999 | 9,917 (88.8%) | 1,244 (11.2%) |
| $75,000 to $99,999 | 9,646 (94.3%) | 582 (5.7%) |
| $100,000 and over | 38,305 (94.3%) | 2,333 (5.7%) |
Public vs Private Health Insurance Coverage by Age in Frederick
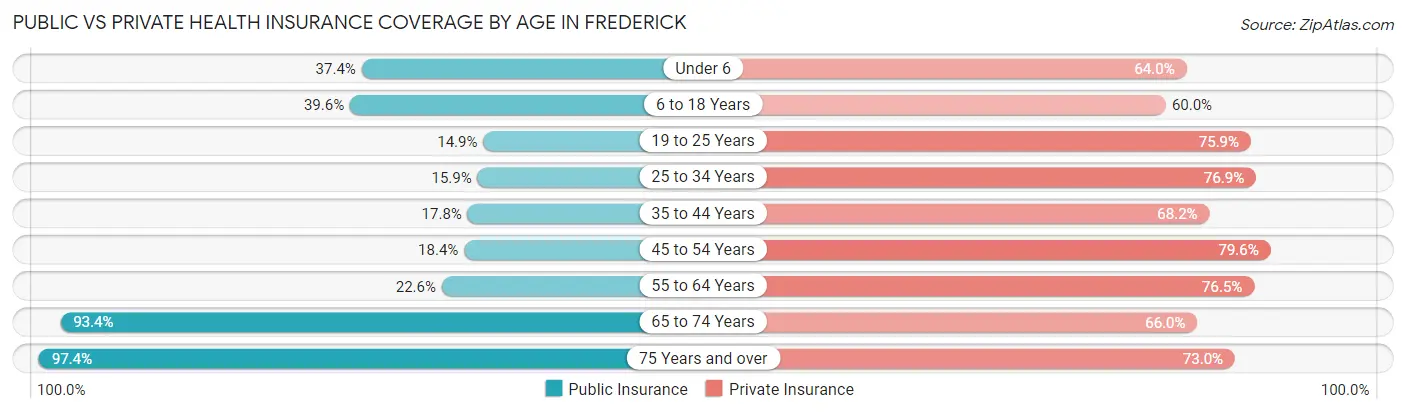
| Age Bracket | Public Insurance | Private Insurance |
| Under 6 | 2,237 (37.4%) | 3,822 (64.0%) |
| 6 to 18 Years | 4,809 (39.6%) | 7,283 (60.0%) |
| 19 to 25 Years | 1,066 (14.9%) | 5,446 (75.9%) |
| 25 to 34 Years | 1,753 (15.9%) | 8,461 (76.9%) |
| 35 to 44 Years | 2,042 (17.8%) | 7,844 (68.2%) |
| 45 to 54 Years | 1,843 (18.4%) | 7,966 (79.6%) |
| 55 to 64 Years | 2,019 (22.6%) | 6,848 (76.5%) |
| 65 to 74 Years | 5,975 (93.4%) | 4,222 (66.0%) |
| 75 Years and over | 3,910 (97.4%) | 2,930 (73.0%) |
| Total | 25,654 (33.3%) | 54,822 (71.1%) |
Disability Status by Sex by Age in Frederick
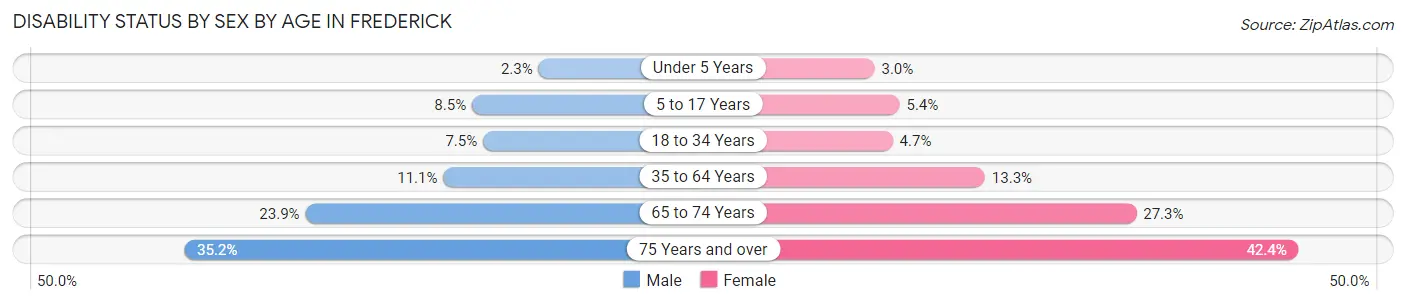
| Age Bracket | Male | Female |
| Under 5 Years | 53 (2.3%) | 75 (3.0%) |
| 5 to 17 Years | 527 (8.5%) | 338 (5.4%) |
| 18 to 34 Years | 678 (7.4%) | 467 (4.7%) |
| 35 to 64 Years | 1,716 (11.1%) | 1,998 (13.3%) |
| 65 to 74 Years | 703 (23.9%) | 946 (27.3%) |
| 75 Years and over | 522 (35.2%) | 1,074 (42.4%) |
Disability Class by Sex by Age in Frederick
Disability Class: Hearing Difficulty
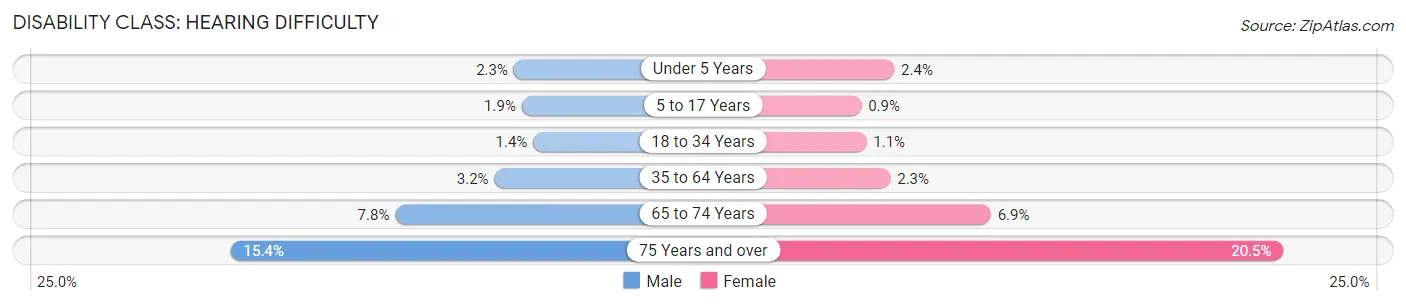
| Age Bracket | Male | Female |
| Under 5 Years | 53 (2.3%) | 60 (2.4%) |
| 5 to 17 Years | 120 (1.9%) | 57 (0.9%) |
| 18 to 34 Years | 127 (1.4%) | 113 (1.1%) |
| 35 to 64 Years | 493 (3.2%) | 339 (2.2%) |
| 65 to 74 Years | 229 (7.8%) | 239 (6.9%) |
| 75 Years and over | 229 (15.4%) | 519 (20.5%) |
Disability Class: Vision Difficulty
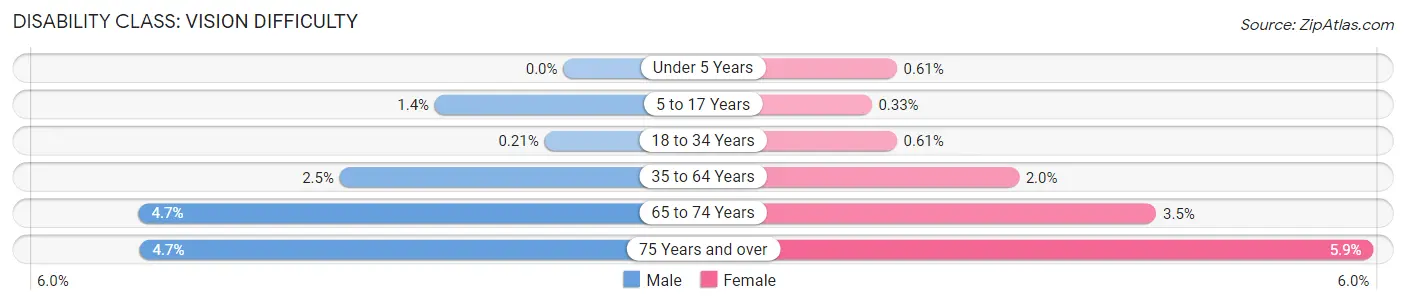
| Age Bracket | Male | Female |
| Under 5 Years | 0 (0.0%) | 15 (0.6%) |
| 5 to 17 Years | 89 (1.4%) | 21 (0.3%) |
| 18 to 34 Years | 19 (0.2%) | 60 (0.6%) |
| 35 to 64 Years | 383 (2.5%) | 296 (2.0%) |
| 65 to 74 Years | 139 (4.7%) | 121 (3.5%) |
| 75 Years and over | 70 (4.7%) | 150 (5.9%) |
Disability Class: Cognitive Difficulty

| Age Bracket | Male | Female |
| 5 to 17 Years | 470 (7.6%) | 228 (3.6%) |
| 18 to 34 Years | 491 (5.4%) | 378 (3.8%) |
| 35 to 64 Years | 593 (3.8%) | 659 (4.4%) |
| 65 to 74 Years | 82 (2.8%) | 237 (6.9%) |
| 75 Years and over | 184 (12.4%) | 256 (10.1%) |
Disability Class: Ambulatory Difficulty
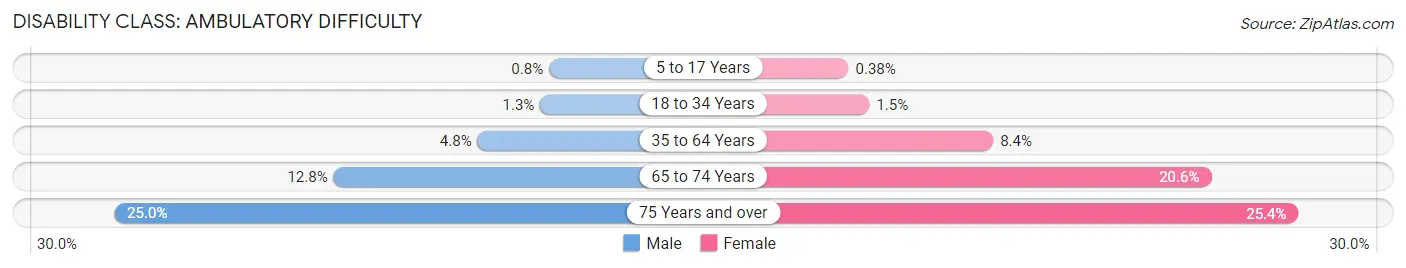
| Age Bracket | Male | Female |
| 5 to 17 Years | 50 (0.8%) | 24 (0.4%) |
| 18 to 34 Years | 117 (1.3%) | 152 (1.5%) |
| 35 to 64 Years | 737 (4.8%) | 1,269 (8.4%) |
| 65 to 74 Years | 376 (12.8%) | 712 (20.6%) |
| 75 Years and over | 371 (25.0%) | 644 (25.4%) |
Disability Class: Self-Care Difficulty
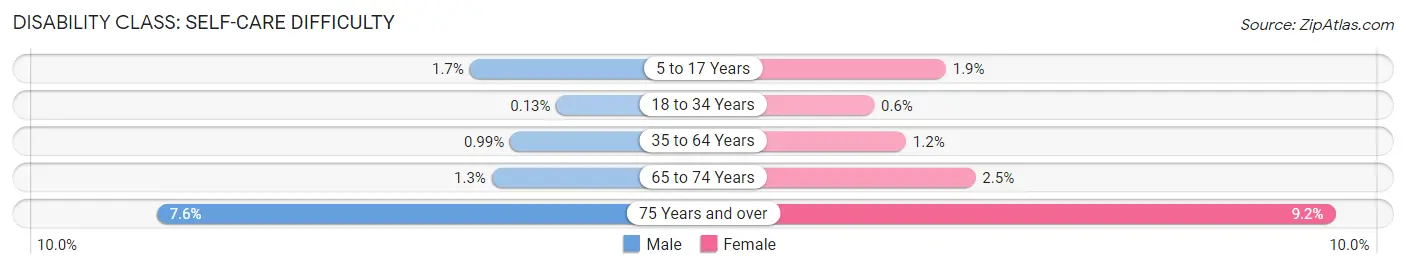
| Age Bracket | Male | Female |
| 5 to 17 Years | 108 (1.7%) | 122 (1.9%) |
| 18 to 34 Years | 12 (0.1%) | 59 (0.6%) |
| 35 to 64 Years | 152 (1.0%) | 179 (1.2%) |
| 65 to 74 Years | 39 (1.3%) | 86 (2.5%) |
| 75 Years and over | 112 (7.5%) | 232 (9.2%) |
Technology Access in Frederick
Computing Device Access in Frederick
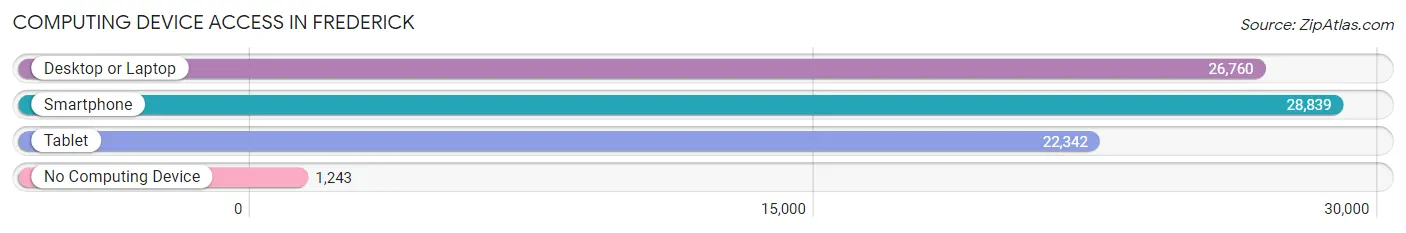
| Device Type | # Households | % Households |
| Desktop or Laptop | 26,760 | 85.3% |
| Smartphone | 28,839 | 91.9% |
| Tablet | 22,342 | 71.2% |
| No Computing Device | 1,243 | 4.0% |
| Total | 31,383 | 100.0% |
Internet Access in Frederick
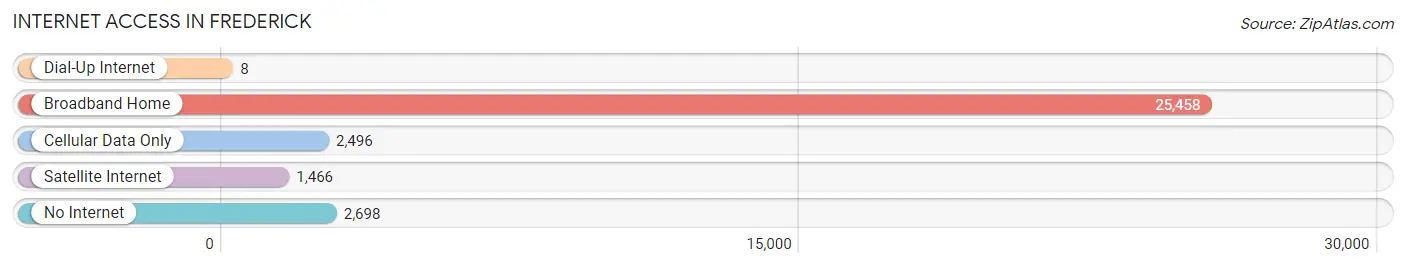
| Internet Type | # Households | % Households |
| Dial-Up Internet | 8 | 0.0% |
| Broadband Home | 25,458 | 81.1% |
| Cellular Data Only | 2,496 | 8.0% |
| Satellite Internet | 1,466 | 4.7% |
| No Internet | 2,698 | 8.6% |
| Total | 31,383 | 100.0% |
Frederick Summary
Frederick, Maryland is a city located in the northern part of the state, in Frederick County. It is the county seat and the largest city in the county. The city is situated in the foothills of the Appalachian Mountains, and is located approximately 50 miles northwest of Washington, D.C. and 40 miles west of Baltimore. The city is home to a population of approximately 65,000 people, making it the second largest city in Maryland.
History
Frederick was founded in 1745 by German and Swiss settlers, and was named after Frederick Calvert, the sixth Lord Baltimore. The city was originally a small farming community, but it quickly grew into a bustling trading center due to its location along the National Road, which connected the city to Baltimore and Washington, D.C. During the Civil War, Frederick was a major supply center for the Union Army, and the city was the site of the Battle of Monocacy in 1864. After the war, the city continued to grow and develop, and by the early 20th century, it had become a major industrial center.
Geography
Frederick is located in the northern part of Maryland, in Frederick County. The city is situated in the foothills of the Appalachian Mountains, and is located approximately 50 miles northwest of Washington, D.C. and 40 miles west of Baltimore. The city is situated along the Monocacy River, and is surrounded by rolling hills and farmland. The city has a total area of 16.2 square miles, of which 16.1 square miles is land and 0.1 square miles is water.
Economy
Frederick’s economy is largely based on government, healthcare, and technology. The city is home to several government agencies, including the National Institute of Standards and Technology, the National Cancer Institute, and the National Institutes of Health. The city is also home to several major healthcare providers, including Frederick Memorial Hospital and the University of Maryland Medical Center. In addition, the city is home to several technology companies, including Novetta Solutions and Tenable Network Security.
Demographics
As of the 2010 census, the population of Frederick was 65,239. The racial makeup of the city was 79.2% White, 11.3% African American, 0.3% Native American, 4.2% Asian, 0.1% Pacific Islander, 2.7% from other races, and 2.4% from two or more races. Hispanic or Latino of any race were 6.7% of the population. The median household income was $60,976, and the median family income was $72,912. The per capita income was $30,845.
In conclusion, Frederick, Maryland is a city located in the northern part of the state, in Frederick County. It is the county seat and the largest city in the county. The city is situated in the foothills of the Appalachian Mountains, and is located approximately 50 miles northwest of Washington, D.C. and 40 miles west of Baltimore. The city is home to a population of approximately 65,000 people, making it the second largest city in Maryland. The city’s economy is largely based on government, healthcare, and technology, and the population is largely white, with a significant African American population.
Common Questions
What is Per Capita Income in Frederick?
Per Capita income in Frederick is $45,050.
What is the Median Family Income in Frederick?
Median Family Income in Frederick is $108,301.
What is the Median Household income in Frederick?
Median Household Income in Frederick is $89,981.
What is Income or Wage Gap in Frederick?
Income or Wage Gap in Frederick is 28.0%.
Women in Frederick earn 72.0 cents for every dollar earned by a man.
What is Family Income Deficit in Frederick?
Family Income Deficit in Frederick is $13,418.
Families that are below poverty line in Frederick earn $13,418 less on average than the poverty threshold level.
What is Inequality or Gini Index in Frederick?
Inequality or Gini Index in Frederick is 0.40.
What is the Total Population of Frederick?
Total Population of Frederick is 78,390.
What is the Total Male Population of Frederick?
Total Male Population of Frederick is 37,984.
What is the Total Female Population of Frederick?
Total Female Population of Frederick is 40,406.
What is the Ratio of Males per 100 Females in Frederick?
There are 94.01 Males per 100 Females in Frederick.
What is the Ratio of Females per 100 Males in Frederick?
There are 106.38 Females per 100 Males in Frederick.
What is the Median Population Age in Frederick?
Median Population Age in Frederick is 37.0 Years.
What is the Average Family Size in Frederick
Average Family Size in Frederick is 3.1 People.
What is the Average Household Size in Frederick
Average Household Size in Frederick is 2.4 People.
How Large is the Labor Force in Frederick?
There are 44,024 People in the Labor Forcein in Frederick.
What is the Percentage of People in the Labor Force in Frederick?
70.2% of People are in the Labor Force in Frederick.
What is the Unemployment Rate in Frederick?
Unemployment Rate in Frederick is 4.3%.