Ilchester, MD Map & Demographics
Ilchester Map
Ilchester Overview
$61,546
PER CAPITA INCOME
$174,709
AVG FAMILY INCOME
$150,417
AVG HOUSEHOLD INCOME
31.7%
WAGE / INCOME GAP [ % ]
68.3¢/ $1
WAGE / INCOME GAP [ $ ]
0.39
INEQUALITY / GINI INDEX
27,300
TOTAL POPULATION
13,722
MALE POPULATION
13,578
FEMALE POPULATION
101.06
MALES / 100 FEMALES
98.95
FEMALES / 100 MALES
36.3
MEDIAN AGE
3.3
AVG FAMILY SIZE
2.8
AVG HOUSEHOLD SIZE
16,472
LABOR FORCE [ PEOPLE ]
76.3%
PERCENT IN LABOR FORCE
3.0%
UNEMPLOYMENT RATE
Income in Ilchester
Income Overview in Ilchester
Per Capita Income in Ilchester is $61,546, while median incomes of families and households are $174,709 and $150,417 respectively.
| Characteristic | Number | Measure |
| Per Capita Income | 27,300 | $61,546 |
| Median Family Income | 6,927 | $174,709 |
| Mean Family Income | 6,927 | $194,053 |
| Median Household Income | 9,669 | $150,417 |
| Mean Household Income | 9,669 | $170,749 |
| Income Deficit | 6,927 | $0 |
| Wage / Income Gap (%) | 27,300 | 31.74% |
| Wage / Income Gap ($) | 27,300 | 68.26¢ per $1 |
| Gini / Inequality Index | 27,300 | 0.39 |
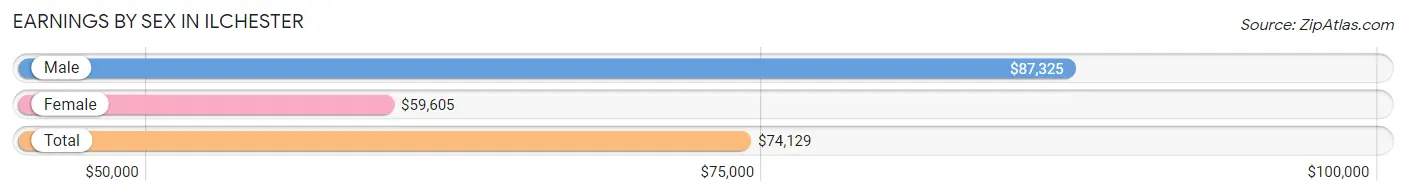
Earnings by Sex in Ilchester
Average Earnings in Ilchester are $74,129, $87,325 for men and $59,605 for women, a difference of 31.7%.
| Sex | Number | Average Earnings |
| Male | 9,007 (53.0%) | $87,325 |
| Female | 7,976 (47.0%) | $59,605 |
| Total | 16,983 (100.0%) | $74,129 |
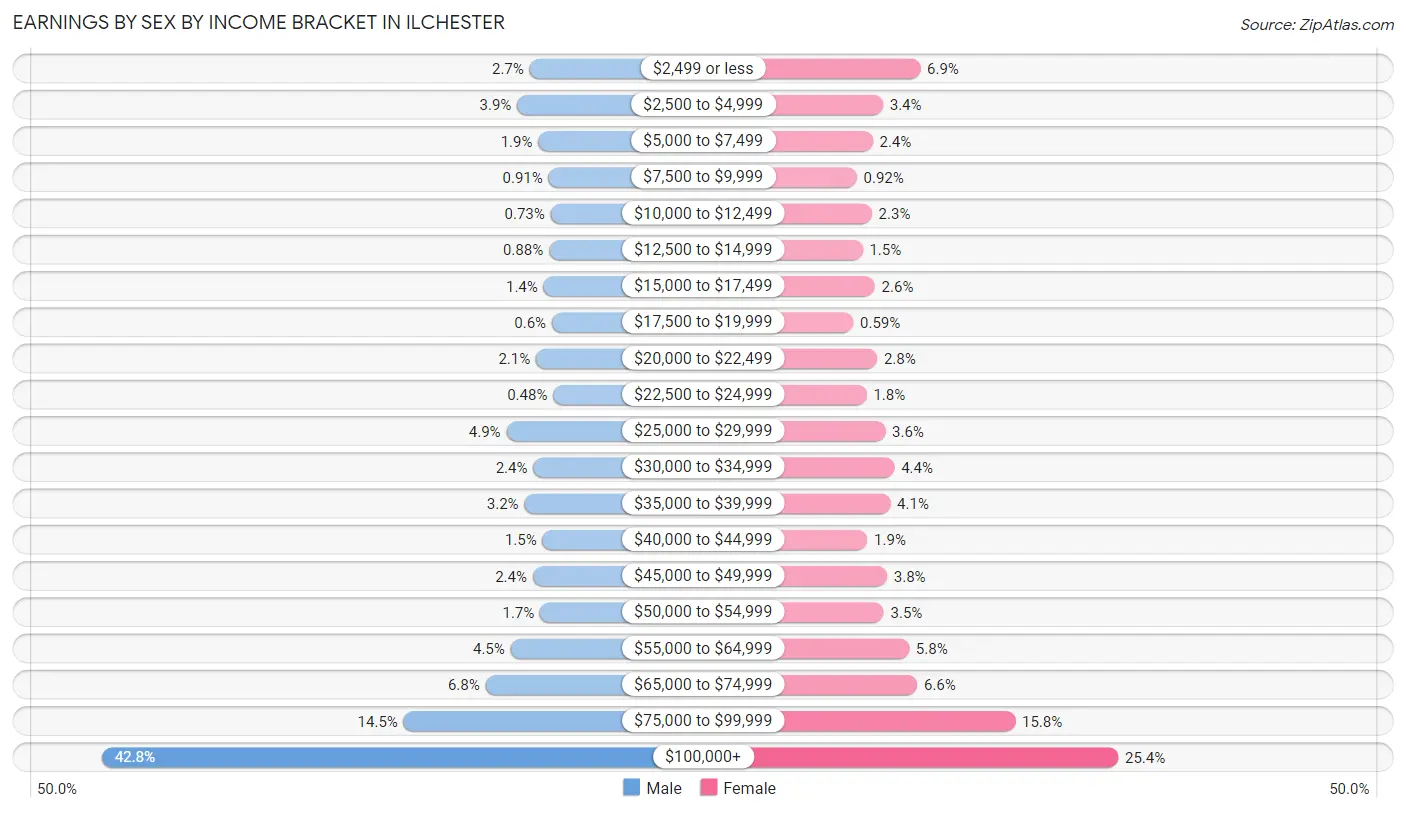
Earnings by Sex by Income Bracket in Ilchester
The most common earnings brackets in Ilchester are $100,000+ for men (3,852 | 42.8%) and $100,000+ for women (2,027 | 25.4%).
| Income | Male | Female |
| $2,499 or less | 242 (2.7%) | 548 (6.9%) |
| $2,500 to $4,999 | 348 (3.9%) | 269 (3.4%) |
| $5,000 to $7,499 | 169 (1.9%) | 192 (2.4%) |
| $7,500 to $9,999 | 82 (0.9%) | 73 (0.9%) |
| $10,000 to $12,499 | 66 (0.7%) | 186 (2.3%) |
| $12,500 to $14,999 | 79 (0.9%) | 117 (1.5%) |
| $15,000 to $17,499 | 124 (1.4%) | 208 (2.6%) |
| $17,500 to $19,999 | 54 (0.6%) | 47 (0.6%) |
| $20,000 to $22,499 | 188 (2.1%) | 226 (2.8%) |
| $22,500 to $24,999 | 43 (0.5%) | 147 (1.8%) |
| $25,000 to $29,999 | 438 (4.9%) | 286 (3.6%) |
| $30,000 to $34,999 | 212 (2.4%) | 354 (4.4%) |
| $35,000 to $39,999 | 286 (3.2%) | 324 (4.1%) |
| $40,000 to $44,999 | 133 (1.5%) | 152 (1.9%) |
| $45,000 to $49,999 | 215 (2.4%) | 299 (3.7%) |
| $50,000 to $54,999 | 154 (1.7%) | 275 (3.5%) |
| $55,000 to $64,999 | 403 (4.5%) | 464 (5.8%) |
| $65,000 to $74,999 | 614 (6.8%) | 525 (6.6%) |
| $75,000 to $99,999 | 1,305 (14.5%) | 1,257 (15.8%) |
| $100,000+ | 3,852 (42.8%) | 2,027 (25.4%) |
| Total | 9,007 (100.0%) | 7,976 (100.0%) |
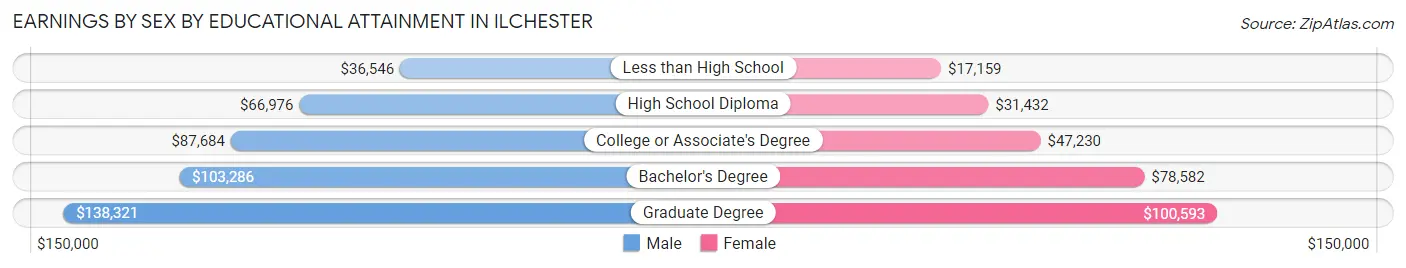
Earnings by Sex by Educational Attainment in Ilchester
Average earnings in Ilchester are $103,507 for men and $71,158 for women, a difference of 31.2%. Men with an educational attainment of graduate degree enjoy the highest average annual earnings of $138,321, while those with less than high school education earn the least with $36,546. Women with an educational attainment of graduate degree earn the most with the average annual earnings of $100,593, while those with less than high school education have the smallest earnings of $17,159.
| Educational Attainment | Male Income | Female Income |
| Less than High School | $36,546 | $17,159 |
| High School Diploma | $66,976 | $31,432 |
| College or Associate's Degree | $87,684 | $47,230 |
| Bachelor's Degree | $103,286 | $78,582 |
| Graduate Degree | $138,321 | $100,593 |
| Total | $103,507 | $71,158 |
Family Income in Ilchester
Family Income Brackets in Ilchester
According to the Ilchester family income data, there are 2,750 families falling into the $200,000+ income range, which is the most common income bracket and makes up 39.7% of all families. Conversely, the $10,000 to $14,999 income bracket is the least frequent group with only 21 families (0.3%) belonging to this category.
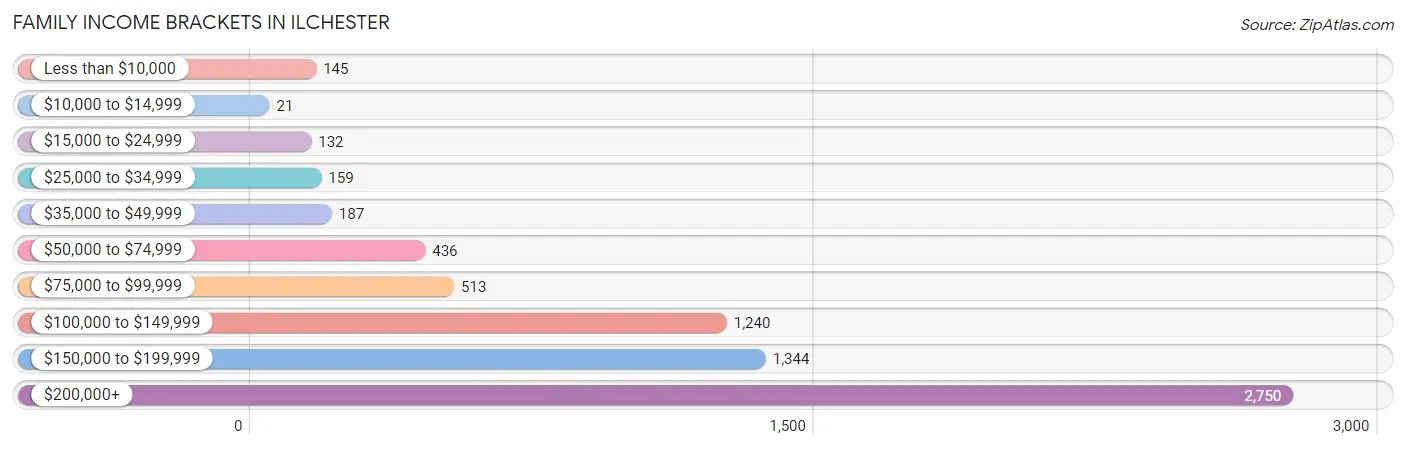
| Income Bracket | # Families | % Families |
| Less than $10,000 | 145 | 2.1% |
| $10,000 to $14,999 | 21 | 0.3% |
| $15,000 to $24,999 | 132 | 1.9% |
| $25,000 to $34,999 | 159 | 2.3% |
| $35,000 to $49,999 | 187 | 2.7% |
| $50,000 to $74,999 | 436 | 6.3% |
| $75,000 to $99,999 | 513 | 7.4% |
| $100,000 to $149,999 | 1,240 | 17.9% |
| $150,000 to $199,999 | 1,344 | 19.4% |
| $200,000+ | 2,750 | 39.7% |
Family Income by Famaliy Size in Ilchester
7+ person families (50 | 0.7%) account for the highest median family income in Ilchester with $250,001 per family, while 2-person families (2,469 | 35.6%) have the highest median income of $65,474 per family member.
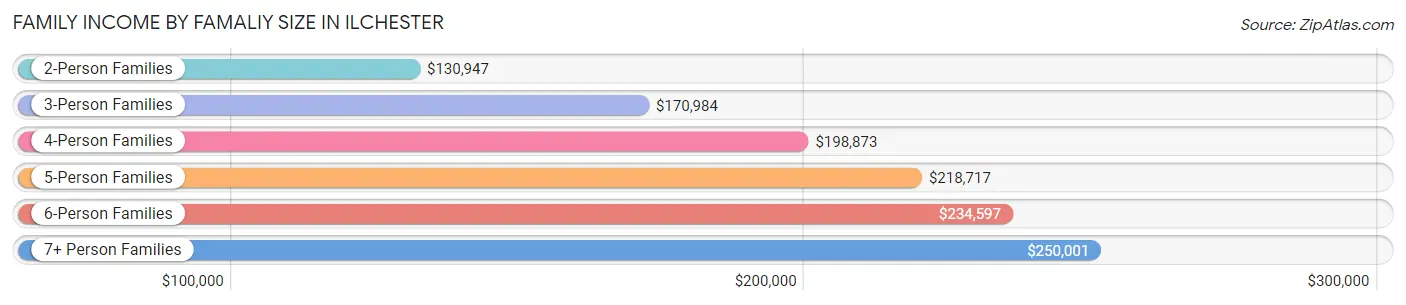
| Income Bracket | # Families | Median Income |
| 2-Person Families | 2,469 (35.6%) | $130,947 |
| 3-Person Families | 1,679 (24.2%) | $170,984 |
| 4-Person Families | 1,906 (27.5%) | $198,873 |
| 5-Person Families | 685 (9.9%) | $218,717 |
| 6-Person Families | 138 (2.0%) | $234,597 |
| 7+ Person Families | 50 (0.7%) | $250,001 |
| Total | 6,927 (100.0%) | $174,709 |
Family Income by Number of Earners in Ilchester
The median family income in Ilchester is $174,709, with families comprising 3+ earners (1,170) having the highest median family income of $234,630, while families with no earners (417) have the lowest median family income of $86,103, accounting for 16.9% and 6.0% of families, respectively.
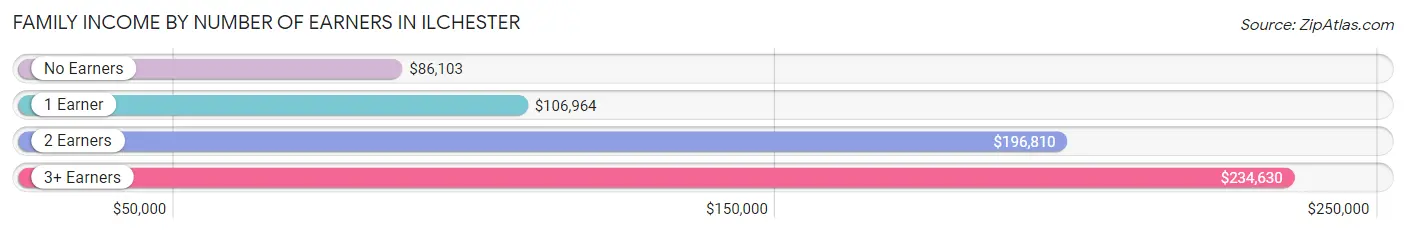
| Number of Earners | # Families | Median Income |
| No Earners | 417 (6.0%) | $86,103 |
| 1 Earner | 1,522 (22.0%) | $106,964 |
| 2 Earners | 3,818 (55.1%) | $196,810 |
| 3+ Earners | 1,170 (16.9%) | $234,630 |
| Total | 6,927 (100.0%) | $174,709 |
Household Income in Ilchester
Household Income Brackets in Ilchester
With 3,113 households falling in the category, the $200,000+ income range is the most frequent in Ilchester, accounting for 32.2% of all households. In contrast, only 106 households (1.1%) fall into the $10,000 to $14,999 income bracket, making it the least populous group.
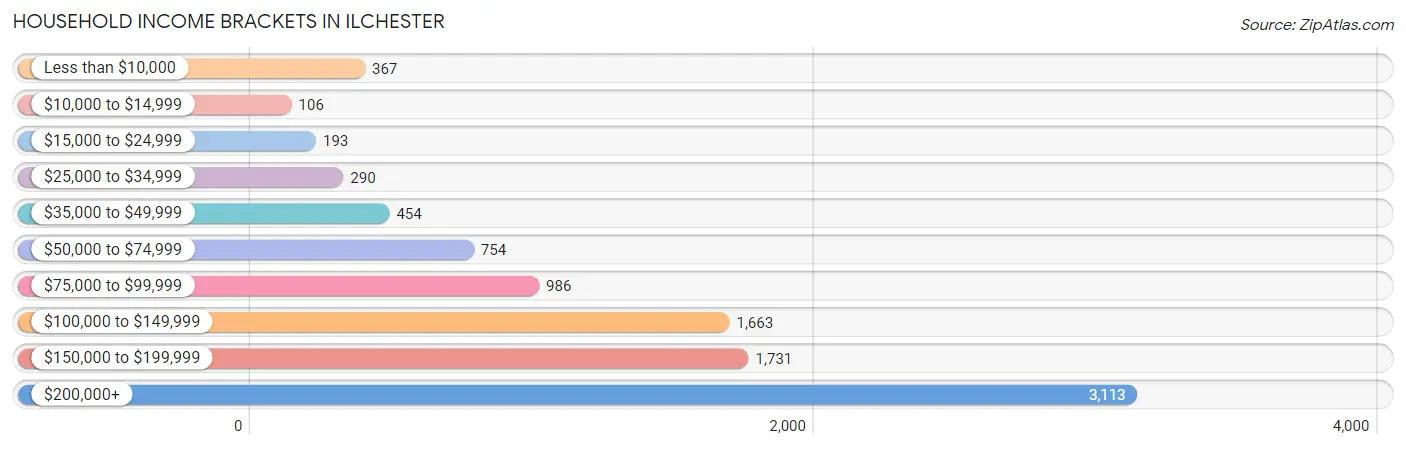
| Income Bracket | # Households | % Households |
| Less than $10,000 | 367 | 3.8% |
| $10,000 to $14,999 | 106 | 1.1% |
| $15,000 to $24,999 | 193 | 2.0% |
| $25,000 to $34,999 | 290 | 3.0% |
| $35,000 to $49,999 | 454 | 4.7% |
| $50,000 to $74,999 | 754 | 7.8% |
| $75,000 to $99,999 | 986 | 10.2% |
| $100,000 to $149,999 | 1,663 | 17.2% |
| $150,000 to $199,999 | 1,731 | 17.9% |
| $200,000+ | 3,113 | 32.2% |
Household Income by Householder Age in Ilchester
The median household income in Ilchester is $150,417, with the highest median household income of $183,596 found in the 45 to 64 years age bracket for the primary householder. A total of 4,085 households (42.2%) fall into this category. Meanwhile, the 65+ years age bracket for the primary householder has the lowest median household income of $77,174, with 1,386 households (14.3%) in this group.
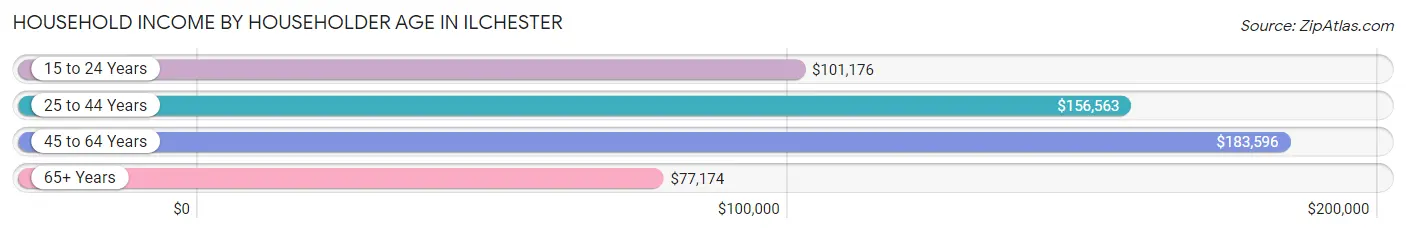
| Income Bracket | # Households | Median Income |
| 15 to 24 Years | 186 (1.9%) | $101,176 |
| 25 to 44 Years | 4,012 (41.5%) | $156,563 |
| 45 to 64 Years | 4,085 (42.2%) | $183,596 |
| 65+ Years | 1,386 (14.3%) | $77,174 |
| Total | 9,669 (100.0%) | $150,417 |
Poverty in Ilchester
Income Below Poverty by Sex and Age in Ilchester
With 3.5% poverty level for males and 5.6% for females among the residents of Ilchester, 5 year old males and 75 year old and over females are the most vulnerable to poverty, with 27 males (9.9%) and 144 females (23.4%) in their respective age groups living below the poverty level.
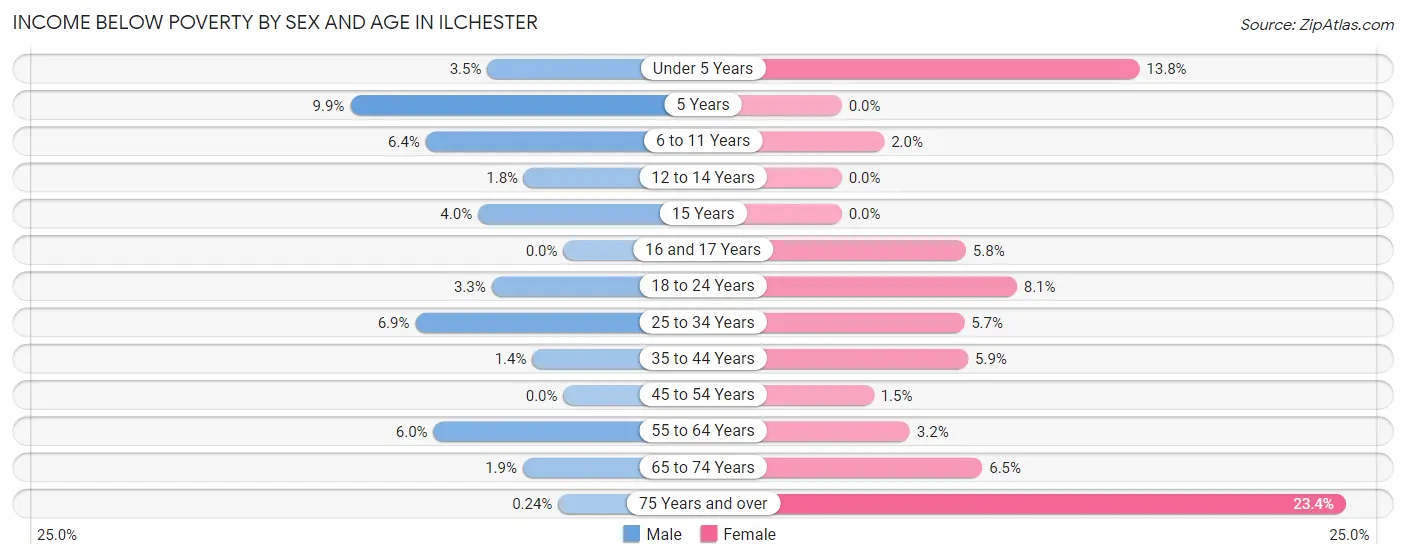
| Age Bracket | Male | Female |
| Under 5 Years | 23 (3.5%) | 103 (13.8%) |
| 5 Years | 27 (9.9%) | 0 (0.0%) |
| 6 to 11 Years | 59 (6.4%) | 20 (2.0%) |
| 12 to 14 Years | 14 (1.8%) | 0 (0.0%) |
| 15 Years | 8 (4.0%) | 0 (0.0%) |
| 16 and 17 Years | 0 (0.0%) | 28 (5.8%) |
| 18 to 24 Years | 49 (3.3%) | 87 (8.1%) |
| 25 to 34 Years | 141 (6.9%) | 100 (5.7%) |
| 35 to 44 Years | 31 (1.4%) | 135 (5.9%) |
| 45 to 54 Years | 0 (0.0%) | 30 (1.5%) |
| 55 to 64 Years | 108 (6.0%) | 52 (3.2%) |
| 65 to 74 Years | 12 (1.9%) | 50 (6.5%) |
| 75 Years and over | 1 (0.2%) | 144 (23.4%) |
| Total | 473 (3.5%) | 749 (5.6%) |
Income Above Poverty by Sex and Age in Ilchester
According to the poverty statistics in Ilchester, males aged 16 and 17 years and females aged 5 years are the age groups that are most secure financially, with 100.0% of males and 100.0% of females in these age groups living above the poverty line.
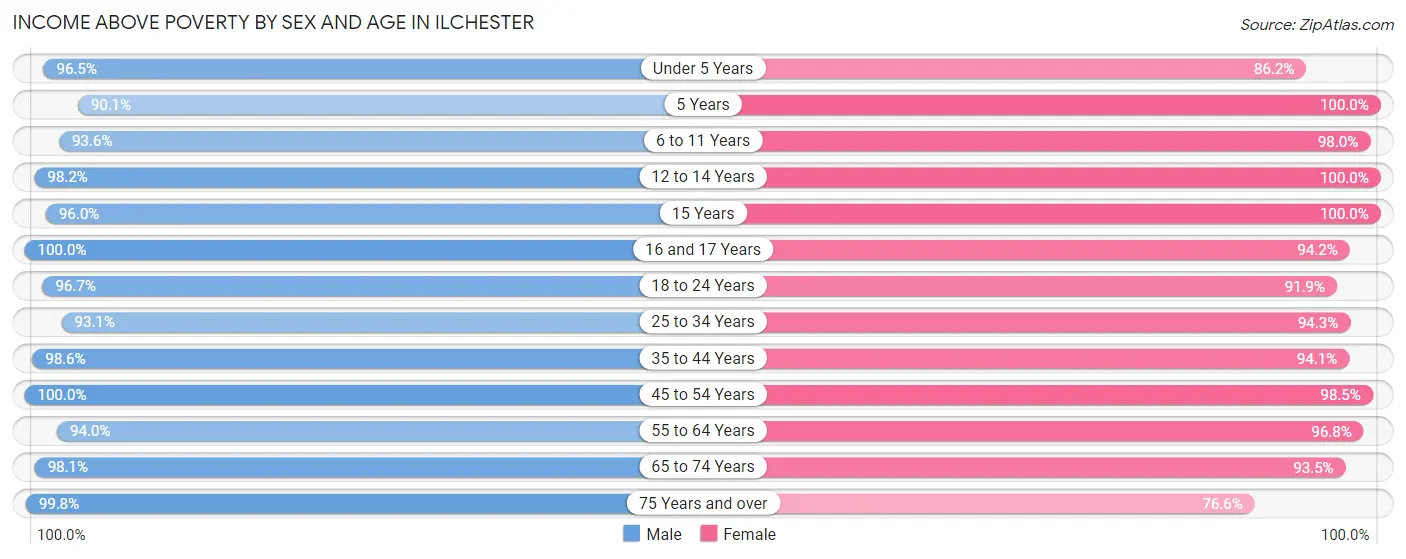
| Age Bracket | Male | Female |
| Under 5 Years | 629 (96.5%) | 643 (86.2%) |
| 5 Years | 246 (90.1%) | 178 (100.0%) |
| 6 to 11 Years | 864 (93.6%) | 997 (98.0%) |
| 12 to 14 Years | 751 (98.2%) | 514 (100.0%) |
| 15 Years | 194 (96.0%) | 176 (100.0%) |
| 16 and 17 Years | 448 (100.0%) | 458 (94.2%) |
| 18 to 24 Years | 1,423 (96.7%) | 984 (91.9%) |
| 25 to 34 Years | 1,910 (93.1%) | 1,661 (94.3%) |
| 35 to 44 Years | 2,115 (98.6%) | 2,168 (94.1%) |
| 45 to 54 Years | 1,940 (100.0%) | 2,000 (98.5%) |
| 55 to 64 Years | 1,684 (94.0%) | 1,596 (96.8%) |
| 65 to 74 Years | 626 (98.1%) | 717 (93.5%) |
| 75 Years and over | 419 (99.8%) | 472 (76.6%) |
| Total | 13,249 (96.6%) | 12,564 (94.4%) |
Income Below Poverty Among Married-Couple Families in Ilchester
The poverty statistics for married-couple families in Ilchester show that 3.8% or 221 of the total 5,829 families live below the poverty line. Families with 3 or 4 children have the highest poverty rate of 6.3%, comprising of 23 families. On the other hand, families with 5 or more children have the lowest poverty rate of 0.0%, which includes 0 families.
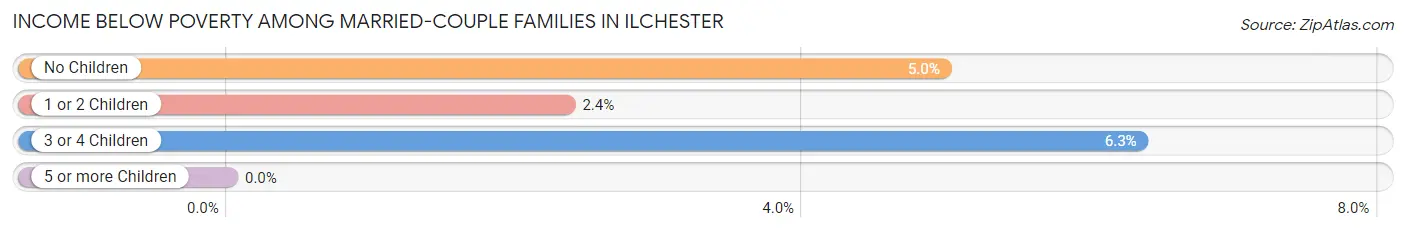
| Children | Above Poverty | Below Poverty |
| No Children | 2,525 (95.0%) | 132 (5.0%) |
| 1 or 2 Children | 2,738 (97.7%) | 66 (2.4%) |
| 3 or 4 Children | 340 (93.7%) | 23 (6.3%) |
| 5 or more Children | 5 (100.0%) | 0 (0.0%) |
| Total | 5,608 (96.2%) | 221 (3.8%) |
Income Below Poverty Among Single-Parent Households in Ilchester
According to the poverty data in Ilchester, 3.2% or 10 single-father households and 8.6% or 67 single-mother households are living below the poverty line. Among single-father households, those with no children have the highest poverty rate, with 10 households (6.9%) experiencing poverty. Likewise, among single-mother households, those with 1 or 2 children have the highest poverty rate, with 58 households (15.1%) falling below the poverty line.
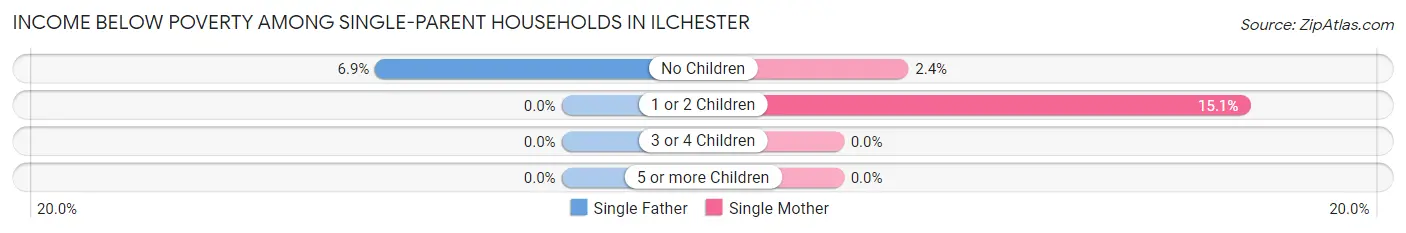
| Children | Single Father | Single Mother |
| No Children | 10 (6.9%) | 9 (2.4%) |
| 1 or 2 Children | 0 (0.0%) | 58 (15.1%) |
| 3 or 4 Children | 0 (0.0%) | 0 (0.0%) |
| 5 or more Children | 0 (0.0%) | 0 (0.0%) |
| Total | 10 (3.2%) | 67 (8.6%) |
Income Below Poverty Among Married-Couple vs Single-Parent Households in Ilchester
The poverty data for Ilchester shows that 221 of the married-couple family households (3.8%) and 77 of the single-parent households (7.0%) are living below the poverty level. Within the married-couple family households, those with 3 or 4 children have the highest poverty rate, with 23 households (6.3%) falling below the poverty line. Among the single-parent households, those with 1 or 2 children have the highest poverty rate, with 58 household (10.4%) living below poverty.
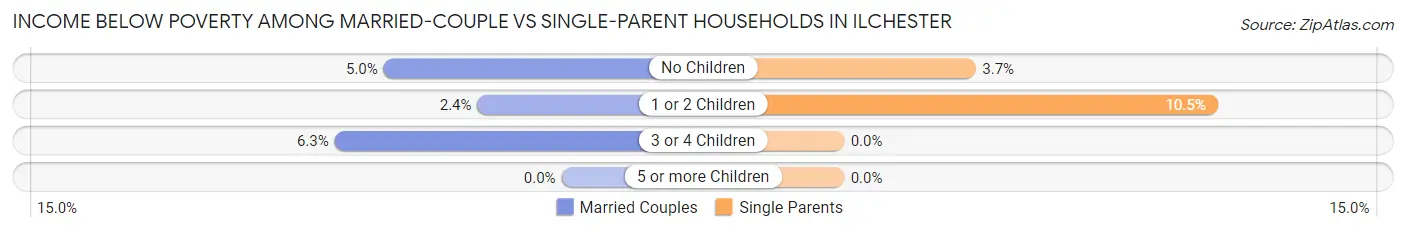
| Children | Married-Couple Families | Single-Parent Households |
| No Children | 132 (5.0%) | 19 (3.7%) |
| 1 or 2 Children | 66 (2.4%) | 58 (10.4%) |
| 3 or 4 Children | 23 (6.3%) | 0 (0.0%) |
| 5 or more Children | 0 (0.0%) | 0 (0.0%) |
| Total | 221 (3.8%) | 77 (7.0%) |
Race in Ilchester
The most populous races in Ilchester are White / Caucasian (14,873 | 54.5%), Asian (5,269 | 19.3%), and Hispanic or Latino (3,422 | 12.5%).
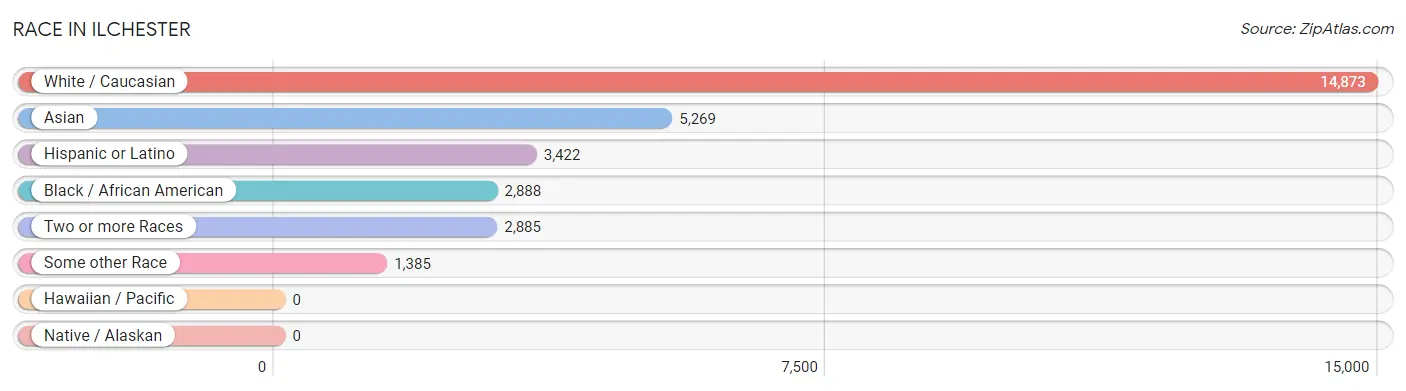
| Race | # Population | % Population |
| Asian | 5,269 | 19.3% |
| Black / African American | 2,888 | 10.6% |
| Hawaiian / Pacific | 0 | 0.0% |
| Hispanic or Latino | 3,422 | 12.5% |
| Native / Alaskan | 0 | 0.0% |
| White / Caucasian | 14,873 | 54.5% |
| Two or more Races | 2,885 | 10.6% |
| Some other Race | 1,385 | 5.1% |
| Total | 27,300 | 100.0% |
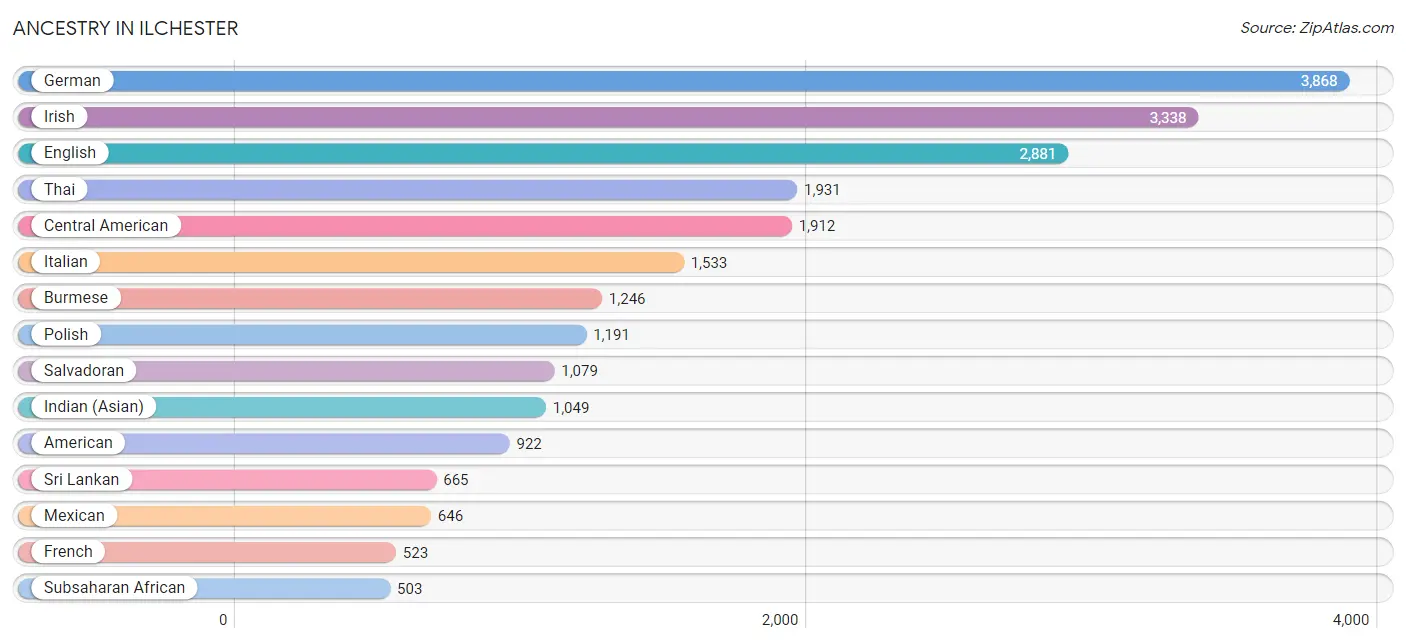
Ancestry in Ilchester
The most populous ancestries reported in Ilchester are German (3,868 | 14.2%), Irish (3,338 | 12.2%), English (2,881 | 10.5%), Thai (1,931 | 7.1%), and Central American (1,912 | 7.0%), together accounting for 51.0% of all Ilchester residents.
| Ancestry | # Population | % Population |
| African | 146 | 0.5% |
| Albanian | 15 | 0.1% |
| American | 922 | 3.4% |
| Arab | 437 | 1.6% |
| Argentinean | 47 | 0.2% |
| Armenian | 11 | 0.0% |
| Austrian | 20 | 0.1% |
| Bahamian | 22 | 0.1% |
| Barbadian | 28 | 0.1% |
| Bhutanese | 186 | 0.7% |
| Blackfeet | 17 | 0.1% |
| Bolivian | 18 | 0.1% |
| Brazilian | 62 | 0.2% |
| British | 225 | 0.8% |
| Burmese | 1,246 | 4.6% |
| Cajun | 11 | 0.0% |
| Cambodian | 30 | 0.1% |
| Canadian | 107 | 0.4% |
| Central American | 1,912 | 7.0% |
| Central American Indian | 4 | 0.0% |
| Cherokee | 103 | 0.4% |
| Colombian | 126 | 0.5% |
| Costa Rican | 43 | 0.2% |
| Croatian | 10 | 0.0% |
| Cuban | 17 | 0.1% |
| Czech | 267 | 1.0% |
| Czechoslovakian | 36 | 0.1% |
| Danish | 96 | 0.4% |
| Dominican | 188 | 0.7% |
| Dutch | 128 | 0.5% |
| Eastern European | 73 | 0.3% |
| Egyptian | 180 | 0.7% |
| English | 2,881 | 10.5% |
| Estonian | 74 | 0.3% |
| Ethiopian | 53 | 0.2% |
| European | 381 | 1.4% |
| Filipino | 131 | 0.5% |
| Finnish | 19 | 0.1% |
| French | 523 | 1.9% |
| French Canadian | 221 | 0.8% |
| German | 3,868 | 14.2% |
| German Russian | 123 | 0.4% |
| Ghanaian | 90 | 0.3% |
| Greek | 122 | 0.4% |
| Guatemalan | 311 | 1.1% |
| Haitian | 57 | 0.2% |
| Honduran | 423 | 1.5% |
| Indian (Asian) | 1,049 | 3.8% |
| Iranian | 115 | 0.4% |
| Iraqi | 44 | 0.2% |
| Irish | 3,338 | 12.2% |
| Italian | 1,533 | 5.6% |
| Japanese | 45 | 0.2% |
| Korean | 482 | 1.8% |
| Lebanese | 101 | 0.4% |
| Liberian | 7 | 0.0% |
| Lithuanian | 125 | 0.5% |
| Mexican | 646 | 2.4% |
| Native Hawaiian | 236 | 0.9% |
| Nigerian | 138 | 0.5% |
| Northern European | 21 | 0.1% |
| Norwegian | 145 | 0.5% |
| Pakistani | 67 | 0.3% |
| Palestinian | 21 | 0.1% |
| Panamanian | 56 | 0.2% |
| Peruvian | 76 | 0.3% |
| Polish | 1,191 | 4.4% |
| Puerto Rican | 236 | 0.9% |
| Russian | 271 | 1.0% |
| Salvadoran | 1,079 | 4.0% |
| Scandinavian | 68 | 0.3% |
| Scotch-Irish | 195 | 0.7% |
| Scottish | 494 | 1.8% |
| Serbian | 46 | 0.2% |
| Sioux | 40 | 0.2% |
| Slovak | 80 | 0.3% |
| Slovene | 8 | 0.0% |
| South African | 12 | 0.0% |
| South American | 327 | 1.2% |
| Spaniard | 38 | 0.1% |
| Spanish | 49 | 0.2% |
| Sri Lankan | 665 | 2.4% |
| Subsaharan African | 503 | 1.8% |
| Swedish | 118 | 0.4% |
| Swiss | 99 | 0.4% |
| Thai | 1,931 | 7.1% |
| Trinidadian and Tobagonian | 20 | 0.1% |
| Turkish | 54 | 0.2% |
| Ukrainian | 122 | 0.4% |
| Venezuelan | 60 | 0.2% |
| Vietnamese | 137 | 0.5% |
| Welsh | 89 | 0.3% |
| West Indian | 6 | 0.0% | View All 93 Rows |
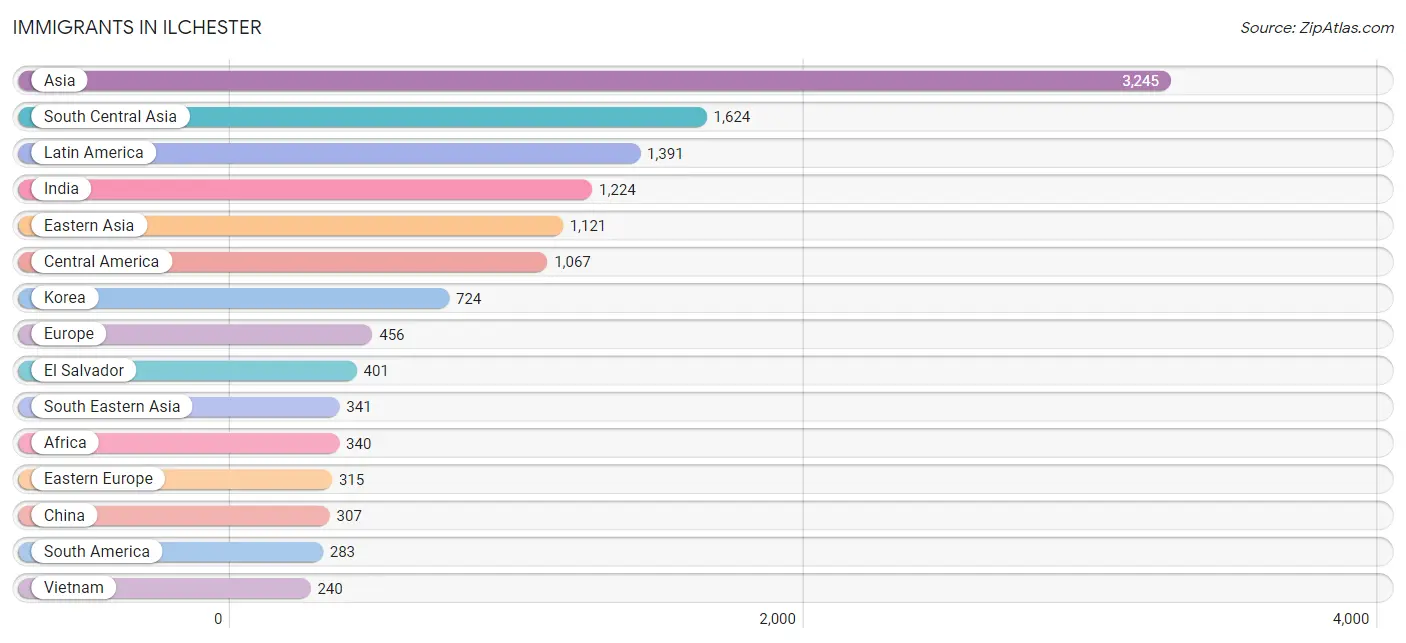
Immigrants in Ilchester
The most numerous immigrant groups reported in Ilchester came from Asia (3,245 | 11.9%), South Central Asia (1,624 | 5.9%), Latin America (1,391 | 5.1%), India (1,224 | 4.5%), and Eastern Asia (1,121 | 4.1%), together accounting for 31.5% of all Ilchester residents.
| Immigration Origin | # Population | % Population |
| Africa | 340 | 1.3% |
| Argentina | 20 | 0.1% |
| Asia | 3,245 | 11.9% |
| Australia | 11 | 0.0% |
| Bangladesh | 93 | 0.3% |
| Bolivia | 18 | 0.1% |
| Brazil | 21 | 0.1% |
| Bulgaria | 9 | 0.0% |
| Canada | 61 | 0.2% |
| Caribbean | 41 | 0.2% |
| Central America | 1,067 | 3.9% |
| China | 307 | 1.1% |
| Colombia | 140 | 0.5% |
| Costa Rica | 14 | 0.1% |
| Czechoslovakia | 11 | 0.0% |
| Dominican Republic | 41 | 0.2% |
| Eastern Africa | 56 | 0.2% |
| Eastern Asia | 1,121 | 4.1% |
| Eastern Europe | 315 | 1.1% |
| Egypt | 72 | 0.3% |
| El Salvador | 401 | 1.5% |
| Ethiopia | 40 | 0.2% |
| Europe | 456 | 1.7% |
| France | 24 | 0.1% |
| Germany | 47 | 0.2% |
| Ghana | 39 | 0.1% |
| Guatemala | 219 | 0.8% |
| Honduras | 206 | 0.7% |
| Hong Kong | 31 | 0.1% |
| India | 1,224 | 4.5% |
| Iran | 67 | 0.3% |
| Iraq | 44 | 0.2% |
| Japan | 60 | 0.2% |
| Kazakhstan | 5 | 0.0% |
| Kenya | 16 | 0.1% |
| Korea | 724 | 2.6% |
| Latin America | 1,391 | 5.1% |
| Lebanon | 8 | 0.0% |
| Liberia | 19 | 0.1% |
| Malaysia | 17 | 0.1% |
| Mexico | 227 | 0.8% |
| Nepal | 82 | 0.3% |
| Nigeria | 122 | 0.4% |
| Northern Africa | 84 | 0.3% |
| Northern Europe | 64 | 0.2% |
| Norway | 17 | 0.1% |
| Oceania | 11 | 0.0% |
| Pakistan | 153 | 0.6% |
| Peru | 24 | 0.1% |
| Philippines | 59 | 0.2% |
| Poland | 44 | 0.2% |
| Russia | 111 | 0.4% |
| Saudi Arabia | 6 | 0.0% |
| Serbia | 17 | 0.1% |
| South Africa | 12 | 0.0% |
| South America | 283 | 1.0% |
| South Central Asia | 1,624 | 5.9% |
| South Eastern Asia | 341 | 1.3% |
| Syria | 35 | 0.1% |
| Taiwan | 84 | 0.3% |
| Thailand | 25 | 0.1% |
| Turkey | 29 | 0.1% |
| Ukraine | 53 | 0.2% |
| Venezuela | 60 | 0.2% |
| Vietnam | 240 | 0.9% |
| Western Africa | 188 | 0.7% |
| Western Asia | 159 | 0.6% |
| Western Europe | 71 | 0.3% | View All 68 Rows |
Sex and Age in Ilchester
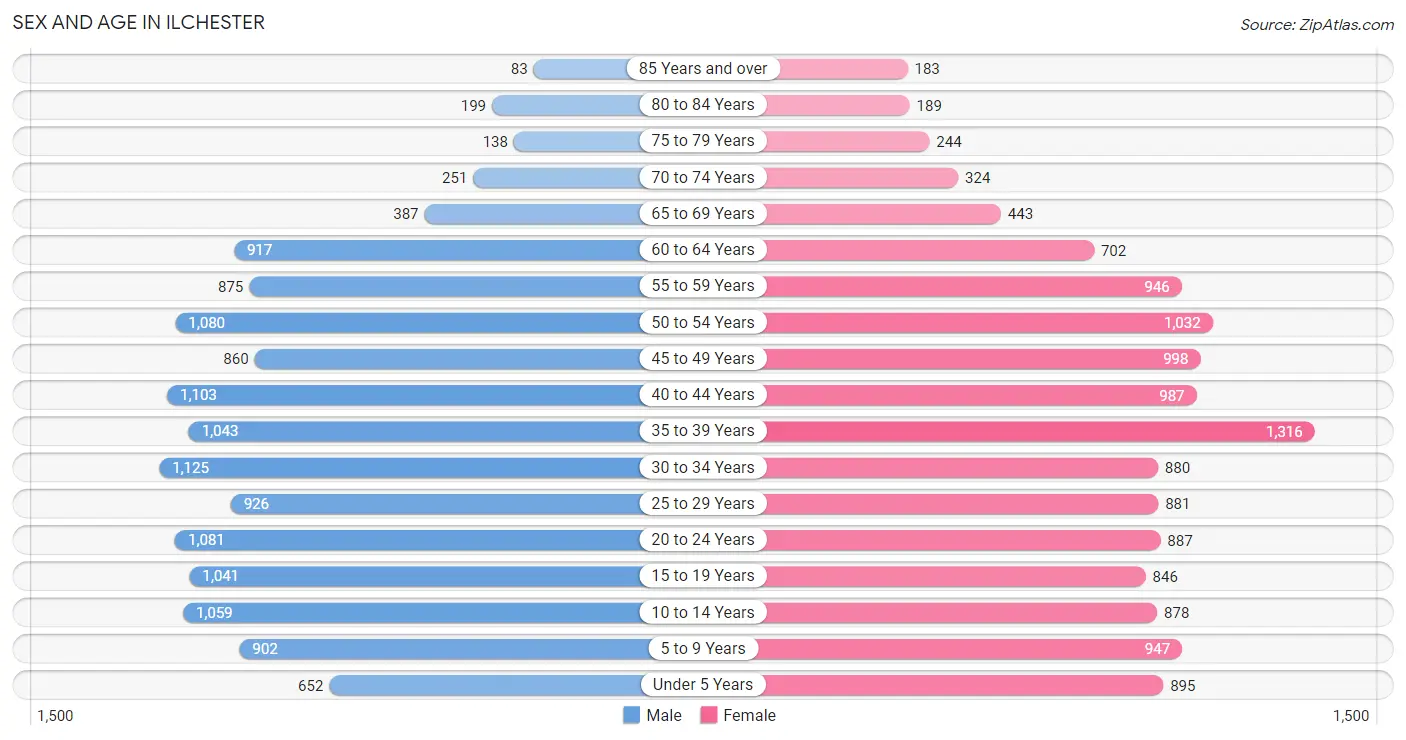
Sex and Age in Ilchester
The most populous age groups in Ilchester are 30 to 34 Years (1,125 | 8.2%) for men and 35 to 39 Years (1,316 | 9.7%) for women.
| Age Bracket | Male | Female |
| Under 5 Years | 652 (4.8%) | 895 (6.6%) |
| 5 to 9 Years | 902 (6.6%) | 947 (7.0%) |
| 10 to 14 Years | 1,059 (7.7%) | 878 (6.5%) |
| 15 to 19 Years | 1,041 (7.6%) | 846 (6.2%) |
| 20 to 24 Years | 1,081 (7.9%) | 887 (6.5%) |
| 25 to 29 Years | 926 (6.8%) | 881 (6.5%) |
| 30 to 34 Years | 1,125 (8.2%) | 880 (6.5%) |
| 35 to 39 Years | 1,043 (7.6%) | 1,316 (9.7%) |
| 40 to 44 Years | 1,103 (8.0%) | 987 (7.3%) |
| 45 to 49 Years | 860 (6.3%) | 998 (7.3%) |
| 50 to 54 Years | 1,080 (7.9%) | 1,032 (7.6%) |
| 55 to 59 Years | 875 (6.4%) | 946 (7.0%) |
| 60 to 64 Years | 917 (6.7%) | 702 (5.2%) |
| 65 to 69 Years | 387 (2.8%) | 443 (3.3%) |
| 70 to 74 Years | 251 (1.8%) | 324 (2.4%) |
| 75 to 79 Years | 138 (1.0%) | 244 (1.8%) |
| 80 to 84 Years | 199 (1.5%) | 189 (1.4%) |
| 85 Years and over | 83 (0.6%) | 183 (1.3%) |
| Total | 13,722 (100.0%) | 13,578 (100.0%) |
Families and Households in Ilchester
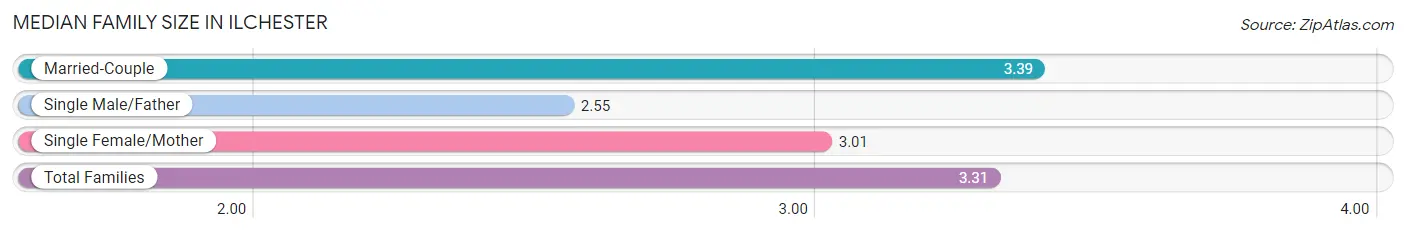
Median Family Size in Ilchester
The median family size in Ilchester is 3.31 persons per family, with married-couple families (5,829 | 84.2%) accounting for the largest median family size of 3.39 persons per family. On the other hand, single male/father families (316 | 4.6%) represent the smallest median family size with 2.55 persons per family.
| Family Type | # Families | Family Size |
| Married-Couple | 5,829 (84.2%) | 3.39 |
| Single Male/Father | 316 (4.6%) | 2.55 |
| Single Female/Mother | 782 (11.3%) | 3.01 |
| Total Families | 6,927 (100.0%) | 3.31 |
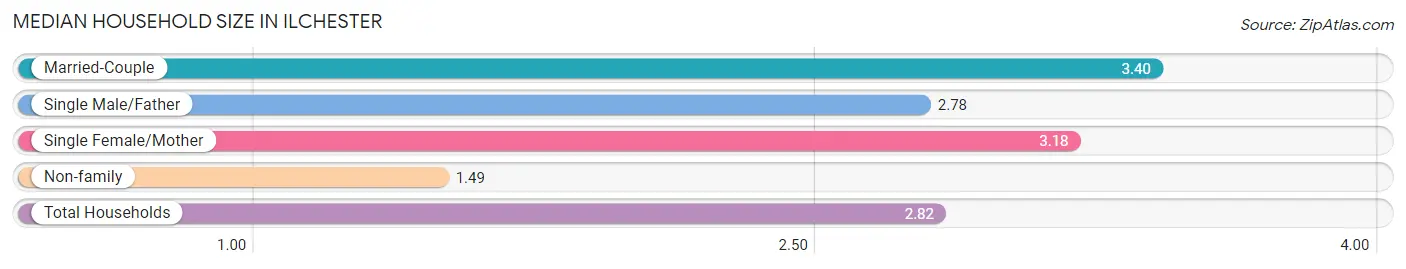
Median Household Size in Ilchester
The median household size in Ilchester is 2.82 persons per household, with married-couple households (5,829 | 60.3%) accounting for the largest median household size of 3.4 persons per household. non-family households (2,742 | 28.4%) represent the smallest median household size with 1.49 persons per household.
| Household Type | # Households | Household Size |
| Married-Couple | 5,829 (60.3%) | 3.40 |
| Single Male/Father | 316 (3.3%) | 2.78 |
| Single Female/Mother | 782 (8.1%) | 3.18 |
| Non-family | 2,742 (28.4%) | 1.49 |
| Total Households | 9,669 (100.0%) | 2.82 |
Household Size by Marriage Status in Ilchester
Out of a total of 9,669 households in Ilchester, 6,927 (71.6%) are family households, while 2,742 (28.4%) are nonfamily households. The most numerous type of family households are 2-person households, comprising 2,319, and the most common type of nonfamily households are 1-person households, comprising 1,933.
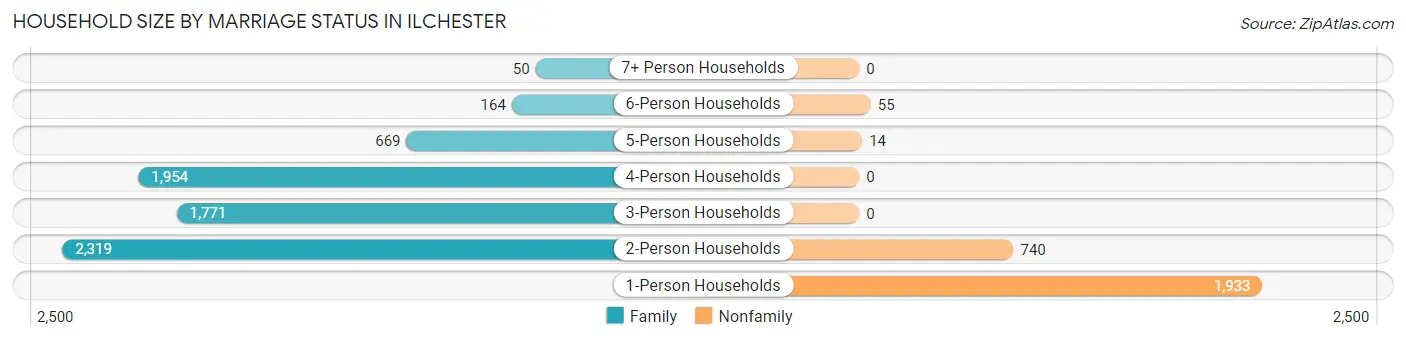
| Household Size | Family Households | Nonfamily Households |
| 1-Person Households | - | 1,933 (20.0%) |
| 2-Person Households | 2,319 (24.0%) | 740 (7.6%) |
| 3-Person Households | 1,771 (18.3%) | 0 (0.0%) |
| 4-Person Households | 1,954 (20.2%) | 0 (0.0%) |
| 5-Person Households | 669 (6.9%) | 14 (0.1%) |
| 6-Person Households | 164 (1.7%) | 55 (0.6%) |
| 7+ Person Households | 50 (0.5%) | 0 (0.0%) |
| Total | 6,927 (71.6%) | 2,742 (28.4%) |
Female Fertility in Ilchester
Fertility by Age in Ilchester
Average fertility rate in Ilchester is 39.0 births per 1,000 women. Women in the age bracket of 20 to 34 years have the highest fertility rate with 58.0 births per 1,000 women. Women in the age bracket of 20 to 34 years acount for 56.0% of all women with births.
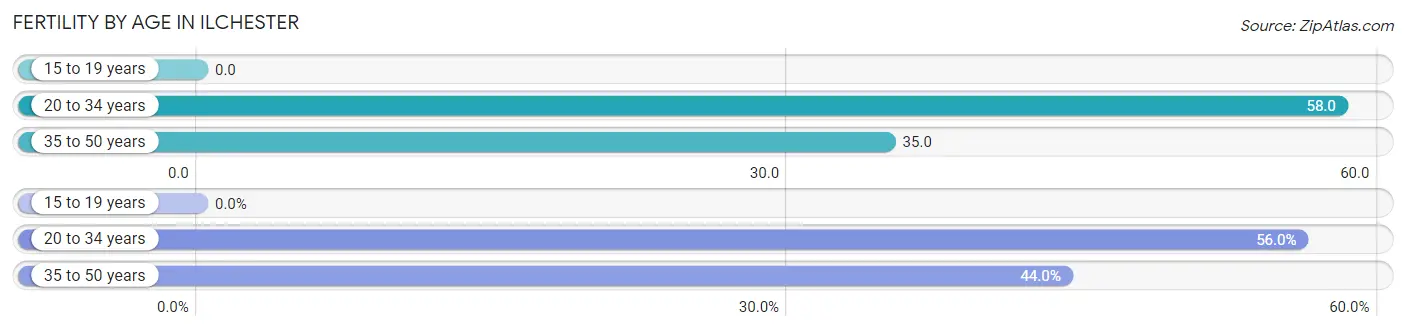
| Age Bracket | Women with Births | Births / 1,000 Women |
| 15 to 19 years | 0 (0.0%) | 0.0 |
| 20 to 34 years | 154 (56.0%) | 58.0 |
| 35 to 50 years | 121 (44.0%) | 35.0 |
| Total | 275 (100.0%) | 39.0 |
Fertility by Age by Marriage Status in Ilchester
90.5% of women with births (275) in Ilchester are married. The highest percentage of unmarried women with births falls into 20 to 34 years age bracket with 16.9% of them unmarried at the time of birth, while the lowest percentage of unmarried women with births belong to 35 to 50 years age bracket with 0.0% of them unmarried.
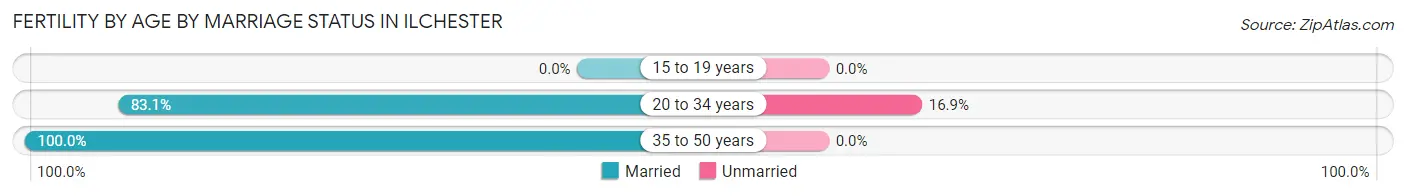
| Age Bracket | Married | Unmarried |
| 15 to 19 years | 0 (0.0%) | 0 (0.0%) |
| 20 to 34 years | 128 (83.1%) | 26 (16.9%) |
| 35 to 50 years | 121 (100.0%) | 0 (0.0%) |
| Total | 249 (90.5%) | 26 (9.5%) |
Fertility by Education in Ilchester
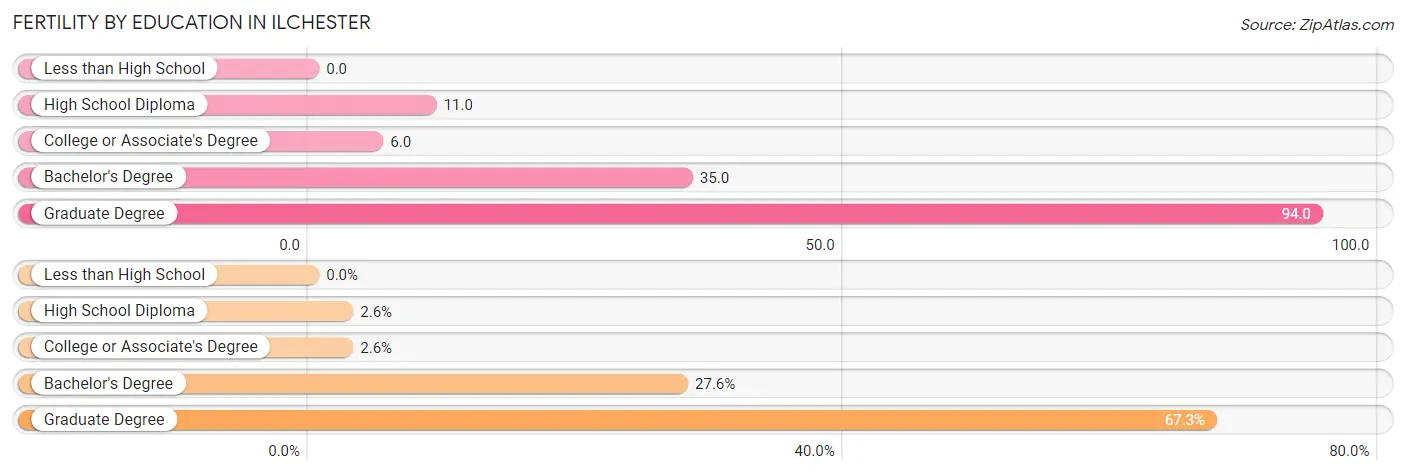
| Educational Attainment | Women with Births | Births / 1,000 Women |
| Less than High School | 0 (0.0%) | 0.0 |
| High School Diploma | 7 (2.5%) | 11.0 |
| College or Associate's Degree | 7 (2.5%) | 6.0 |
| Bachelor's Degree | 76 (27.6%) | 35.0 |
| Graduate Degree | 185 (67.3%) | 94.0 |
| Total | 275 (100.0%) | 39.0 |
Fertility by Education by Marriage Status in Ilchester
9.5% of women with births in Ilchester are unmarried. Women with the educational attainment of high school diploma are most likely to be married with 100.0% of them married at childbirth, while women with the educational attainment of bachelor's degree are least likely to be married with 34.2% of them unmarried at childbirth.
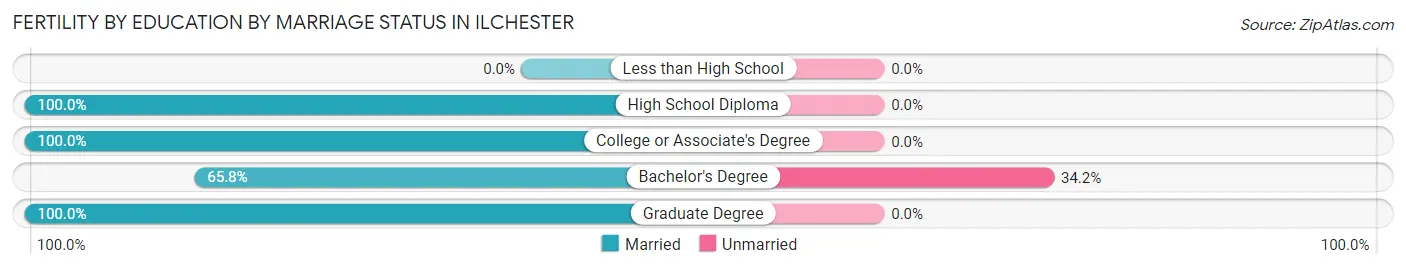
| Educational Attainment | Married | Unmarried |
| Less than High School | 0 (0.0%) | 0 (0.0%) |
| High School Diploma | 7 (100.0%) | 0 (0.0%) |
| College or Associate's Degree | 7 (100.0%) | 0 (0.0%) |
| Bachelor's Degree | 50 (65.8%) | 26 (34.2%) |
| Graduate Degree | 185 (100.0%) | 0 (0.0%) |
| Total | 249 (90.5%) | 26 (9.5%) |
Employment Characteristics in Ilchester
Employment by Class of Employer in Ilchester
Among the 15,750 employed individuals in Ilchester, private company employees (8,814 | 56.0%), federal government employees (2,102 | 13.4%), and not-for-profit organizations (1,717 | 10.9%) make up the most common classes of employment.
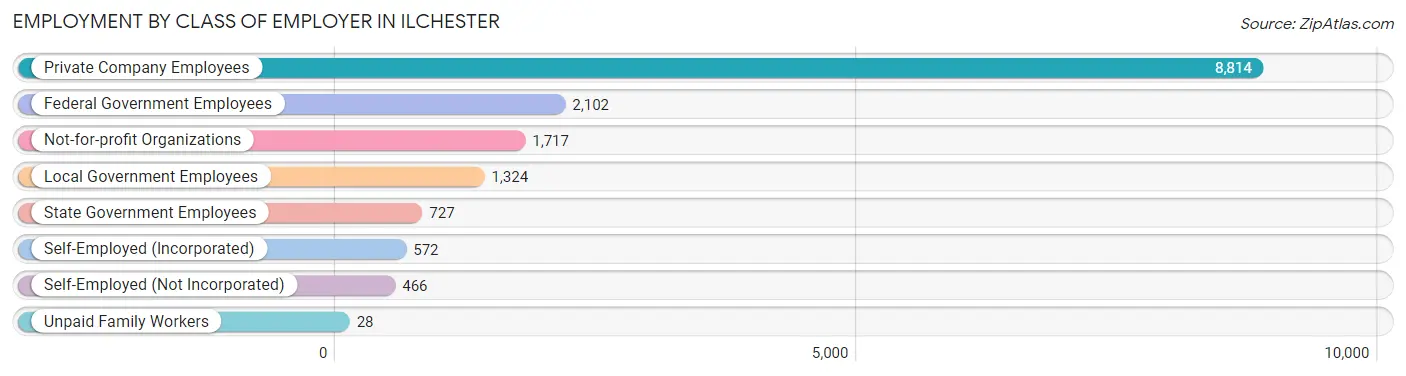
| Employer Class | # Employees | % Employees |
| Private Company Employees | 8,814 | 56.0% |
| Self-Employed (Incorporated) | 572 | 3.6% |
| Self-Employed (Not Incorporated) | 466 | 3.0% |
| Not-for-profit Organizations | 1,717 | 10.9% |
| Local Government Employees | 1,324 | 8.4% |
| State Government Employees | 727 | 4.6% |
| Federal Government Employees | 2,102 | 13.4% |
| Unpaid Family Workers | 28 | 0.2% |
| Total | 15,750 | 100.0% |
Employment Status by Age in Ilchester
According to the labor force statistics for Ilchester, out of the total population over 16 years of age (21,589), 76.3% or 16,472 individuals are in the labor force, with 3.0% or 494 of them unemployed. The age group with the highest labor force participation rate is 45 to 54 years, with 95.0% or 3,772 individuals in the labor force. Within the labor force, the 20 to 24 years age range has the highest percentage of unemployed individuals, with 8.2% or 108 of them being unemployed.
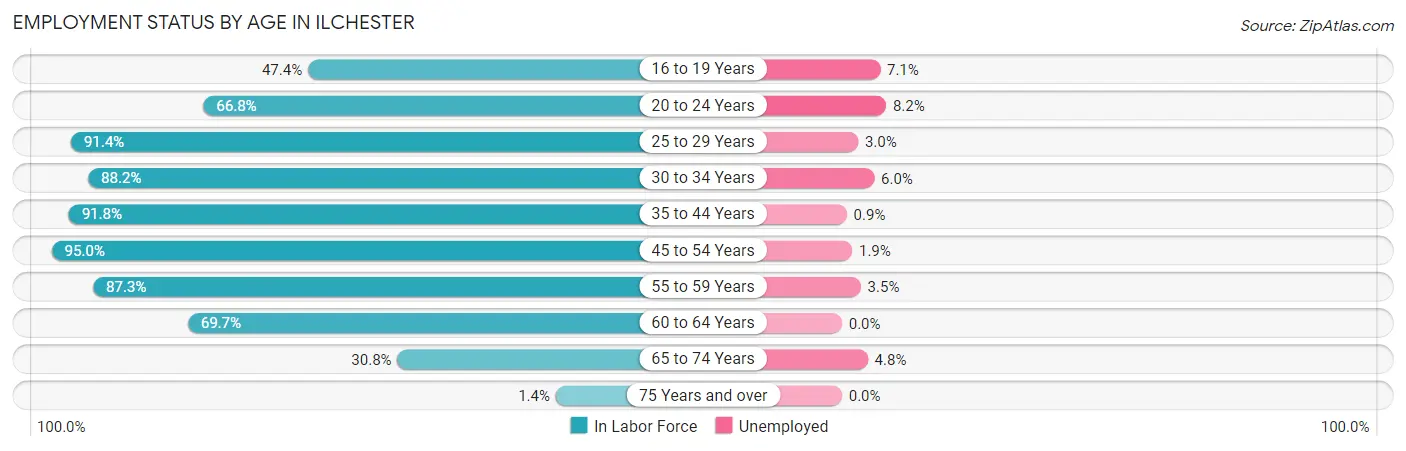
| Age Bracket | In Labor Force | Unemployed |
| 16 to 19 Years | 715 (47.4%) | 51 (7.1%) |
| 20 to 24 Years | 1,315 (66.8%) | 108 (8.2%) |
| 25 to 29 Years | 1,652 (91.4%) | 50 (3.0%) |
| 30 to 34 Years | 1,768 (88.2%) | 106 (6.0%) |
| 35 to 44 Years | 4,084 (91.8%) | 37 (0.9%) |
| 45 to 54 Years | 3,772 (95.0%) | 72 (1.9%) |
| 55 to 59 Years | 1,590 (87.3%) | 56 (3.5%) |
| 60 to 64 Years | 1,128 (69.7%) | 0 (0.0%) |
| 65 to 74 Years | 433 (30.8%) | 21 (4.8%) |
| 75 Years and over | 15 (1.4%) | 0 (0.0%) |
| Total | 16,472 (76.3%) | 494 (3.0%) |
Employment Status by Educational Attainment in Ilchester
According to labor force statistics for Ilchester, 89.3% of individuals (13,994) out of the total population between 25 and 64 years of age (15,671) are in the labor force, with 2.3% or 322 of them being unemployed. The group with the highest labor force participation rate are those with the educational attainment of bachelor's degree or higher, with 91.1% or 9,297 individuals in the labor force. Within the labor force, individuals with high school diploma education have the highest percentage of unemployment, with 4.9% or 69 of them being unemployed.
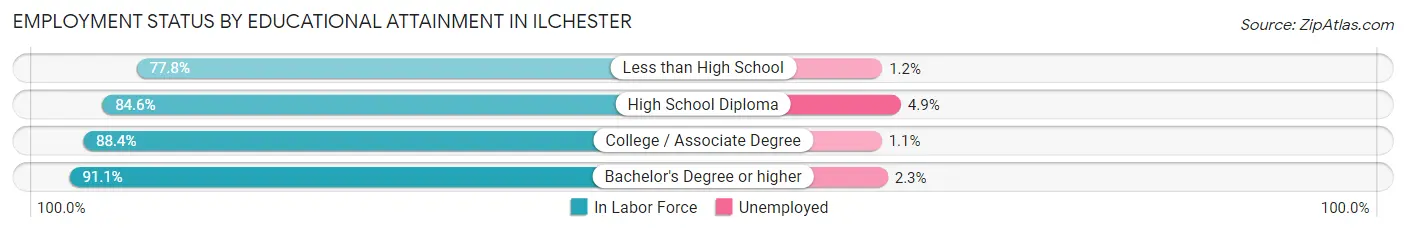
| Educational Attainment | In Labor Force | Unemployed |
| Less than High School | 516 (77.8%) | 8 (1.2%) |
| High School Diploma | 1,399 (84.6%) | 81 (4.9%) |
| College / Associate Degree | 2,784 (88.4%) | 35 (1.1%) |
| Bachelor's Degree or higher | 9,297 (91.1%) | 235 (2.3%) |
| Total | 13,994 (89.3%) | 360 (2.3%) |
Employment Occupations by Sex in Ilchester
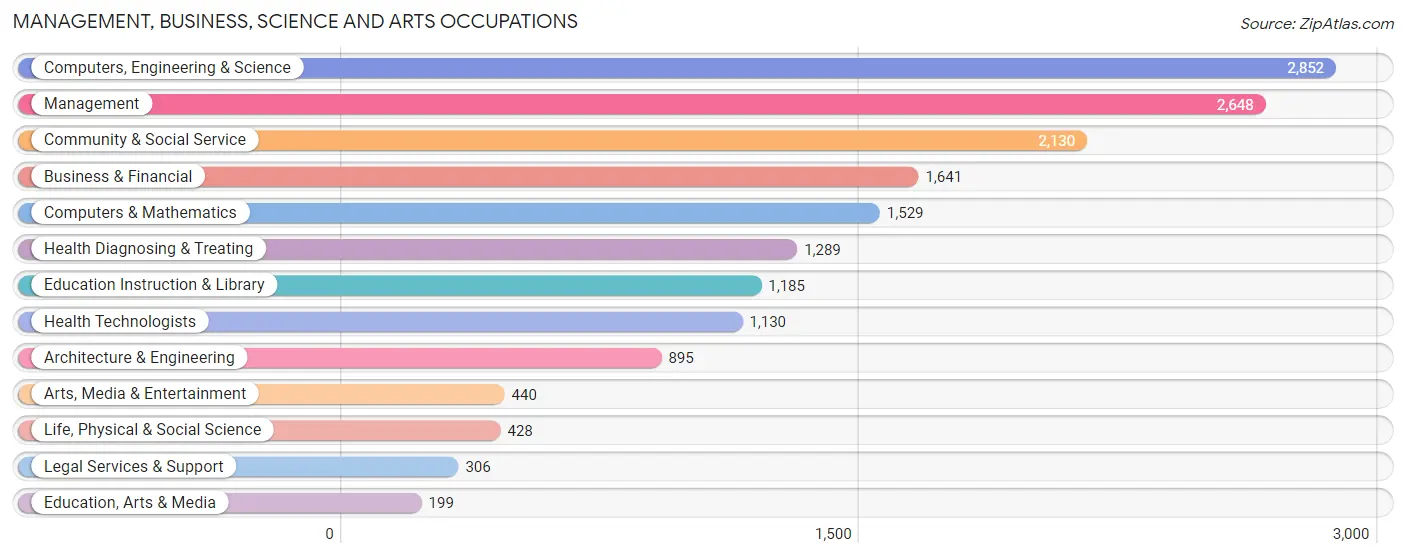
Management, Business, Science and Arts Occupations
The most common Management, Business, Science and Arts occupations in Ilchester are Computers, Engineering & Science (2,852 | 18.1%), Management (2,648 | 16.8%), Community & Social Service (2,130 | 13.5%), Business & Financial (1,641 | 10.4%), and Computers & Mathematics (1,529 | 9.7%).
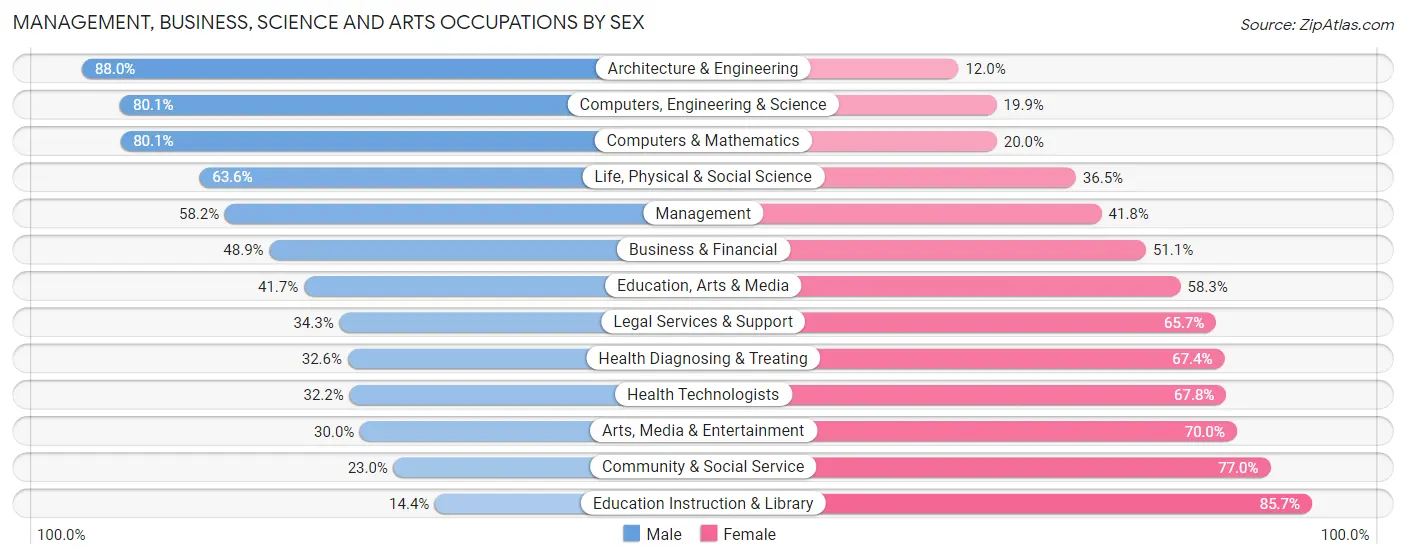
Management, Business, Science and Arts Occupations by Sex
Within the Management, Business, Science and Arts occupations in Ilchester, the most male-oriented occupations are Architecture & Engineering (88.0%), Computers, Engineering & Science (80.1%), and Computers & Mathematics (80.0%), while the most female-oriented occupations are Education Instruction & Library (85.7%), Community & Social Service (77.0%), and Arts, Media & Entertainment (70.0%).
| Occupation | Male | Female |
| Management | 1,541 (58.2%) | 1,107 (41.8%) |
| Business & Financial | 803 (48.9%) | 838 (51.1%) |
| Computers, Engineering & Science | 2,284 (80.1%) | 568 (19.9%) |
| Computers & Mathematics | 1,224 (80.0%) | 305 (20.0%) |
| Architecture & Engineering | 788 (88.0%) | 107 (12.0%) |
| Life, Physical & Social Science | 272 (63.5%) | 156 (36.4%) |
| Community & Social Service | 490 (23.0%) | 1,640 (77.0%) |
| Education, Arts & Media | 83 (41.7%) | 116 (58.3%) |
| Legal Services & Support | 105 (34.3%) | 201 (65.7%) |
| Education Instruction & Library | 170 (14.3%) | 1,015 (85.7%) |
| Arts, Media & Entertainment | 132 (30.0%) | 308 (70.0%) |
| Health Diagnosing & Treating | 420 (32.6%) | 869 (67.4%) |
| Health Technologists | 364 (32.2%) | 766 (67.8%) |
| Total (Category) | 5,538 (52.4%) | 5,022 (47.6%) |
| Total (Overall) | 8,421 (53.3%) | 7,374 (46.7%) |
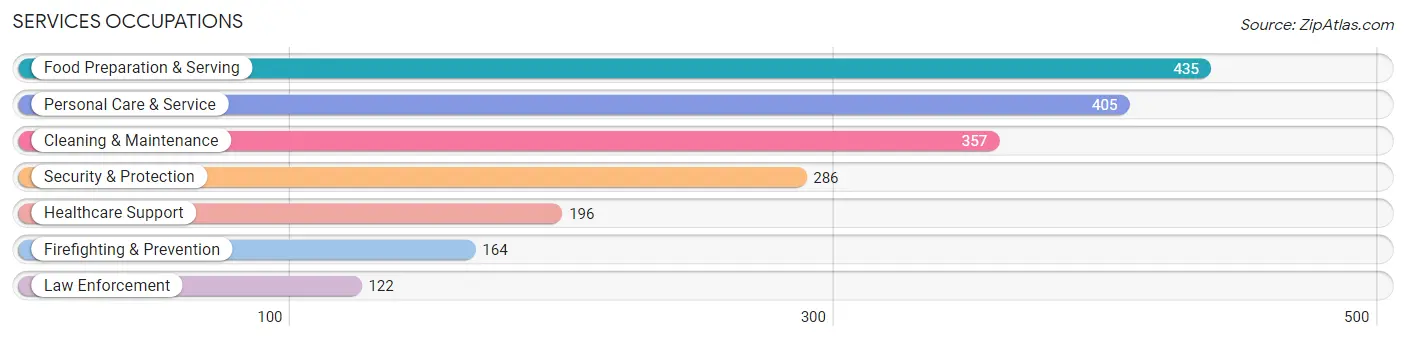
Services Occupations
The most common Services occupations in Ilchester are Food Preparation & Serving (435 | 2.8%), Personal Care & Service (405 | 2.6%), Cleaning & Maintenance (357 | 2.3%), Security & Protection (286 | 1.8%), and Healthcare Support (196 | 1.2%).
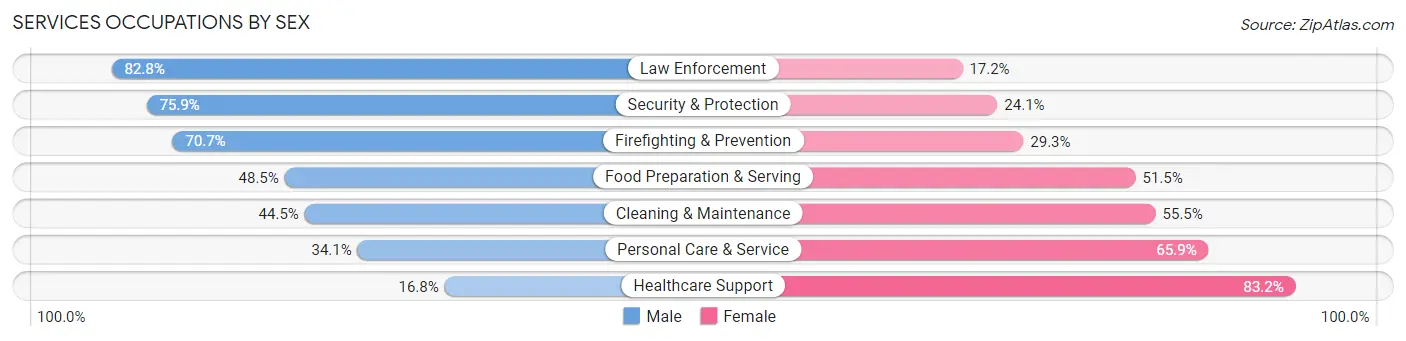
Services Occupations by Sex
Within the Services occupations in Ilchester, the most male-oriented occupations are Law Enforcement (82.8%), Security & Protection (75.9%), and Firefighting & Prevention (70.7%), while the most female-oriented occupations are Healthcare Support (83.2%), Personal Care & Service (65.9%), and Cleaning & Maintenance (55.5%).
| Occupation | Male | Female |
| Healthcare Support | 33 (16.8%) | 163 (83.2%) |
| Security & Protection | 217 (75.9%) | 69 (24.1%) |
| Firefighting & Prevention | 116 (70.7%) | 48 (29.3%) |
| Law Enforcement | 101 (82.8%) | 21 (17.2%) |
| Food Preparation & Serving | 211 (48.5%) | 224 (51.5%) |
| Cleaning & Maintenance | 159 (44.5%) | 198 (55.5%) |
| Personal Care & Service | 138 (34.1%) | 267 (65.9%) |
| Total (Category) | 758 (45.2%) | 921 (54.8%) |
| Total (Overall) | 8,421 (53.3%) | 7,374 (46.7%) |
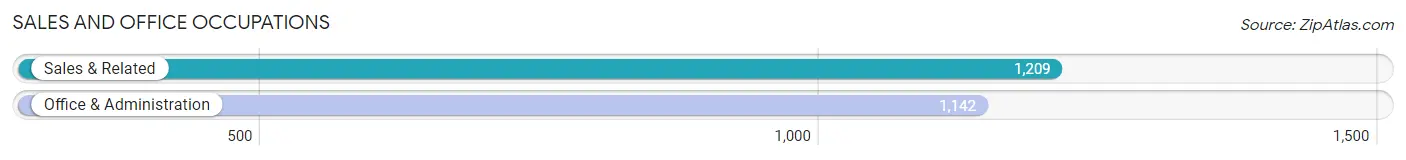
Sales and Office Occupations
The most common Sales and Office occupations in Ilchester are Sales & Related (1,209 | 7.6%), and Office & Administration (1,142 | 7.2%).
Sales and Office Occupations by Sex
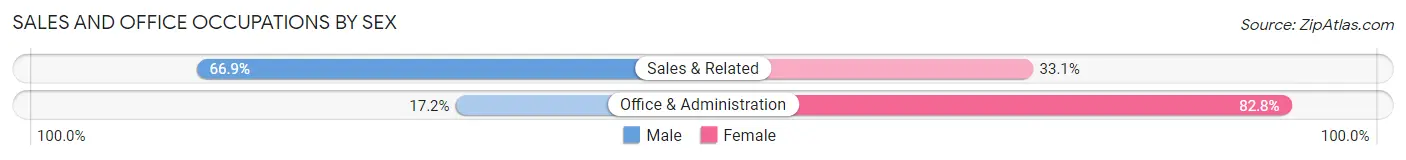
| Occupation | Male | Female |
| Sales & Related | 809 (66.9%) | 400 (33.1%) |
| Office & Administration | 196 (17.2%) | 946 (82.8%) |
| Total (Category) | 1,005 (42.7%) | 1,346 (57.3%) |
| Total (Overall) | 8,421 (53.3%) | 7,374 (46.7%) |
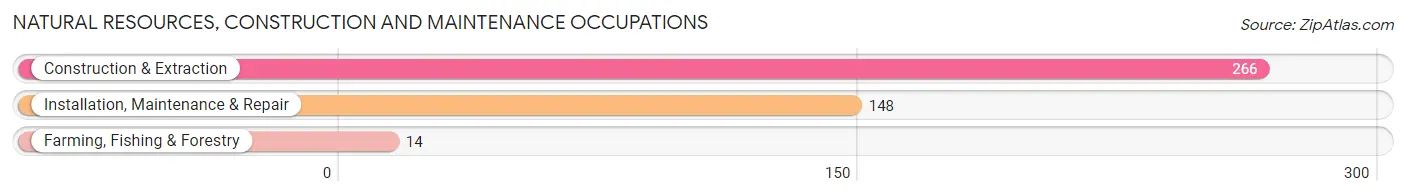
Natural Resources, Construction and Maintenance Occupations
The most common Natural Resources, Construction and Maintenance occupations in Ilchester are Construction & Extraction (266 | 1.7%), Installation, Maintenance & Repair (148 | 0.9%), and Farming, Fishing & Forestry (14 | 0.1%).
Natural Resources, Construction and Maintenance Occupations by Sex
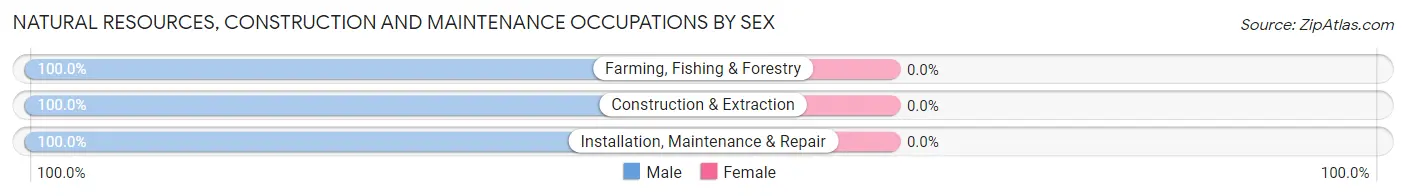
| Occupation | Male | Female |
| Farming, Fishing & Forestry | 14 (100.0%) | 0 (0.0%) |
| Construction & Extraction | 266 (100.0%) | 0 (0.0%) |
| Installation, Maintenance & Repair | 148 (100.0%) | 0 (0.0%) |
| Total (Category) | 428 (100.0%) | 0 (0.0%) |
| Total (Overall) | 8,421 (53.3%) | 7,374 (46.7%) |
Production, Transportation and Moving Occupations
The most common Production, Transportation and Moving occupations in Ilchester are Transportation (288 | 1.8%), Production (272 | 1.7%), and Material Moving (217 | 1.4%).
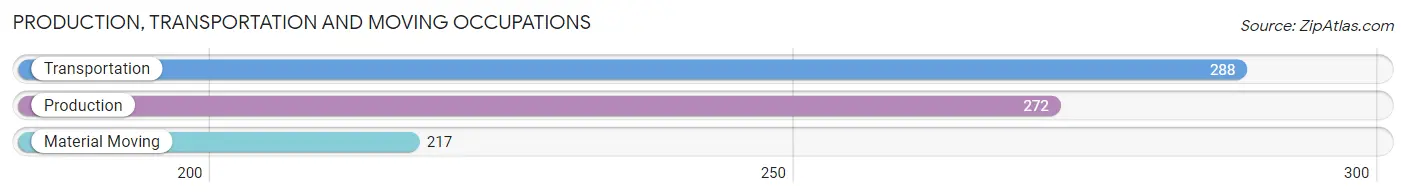
Production, Transportation and Moving Occupations by Sex
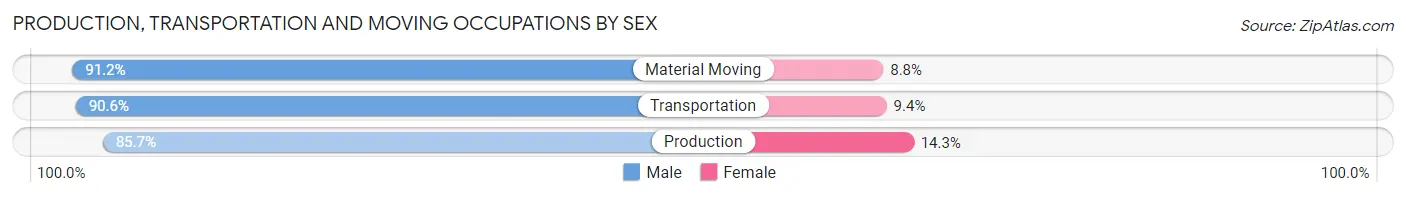
| Occupation | Male | Female |
| Production | 233 (85.7%) | 39 (14.3%) |
| Transportation | 261 (90.6%) | 27 (9.4%) |
| Material Moving | 198 (91.2%) | 19 (8.8%) |
| Total (Category) | 692 (89.1%) | 85 (10.9%) |
| Total (Overall) | 8,421 (53.3%) | 7,374 (46.7%) |
Employment Industries by Sex in Ilchester
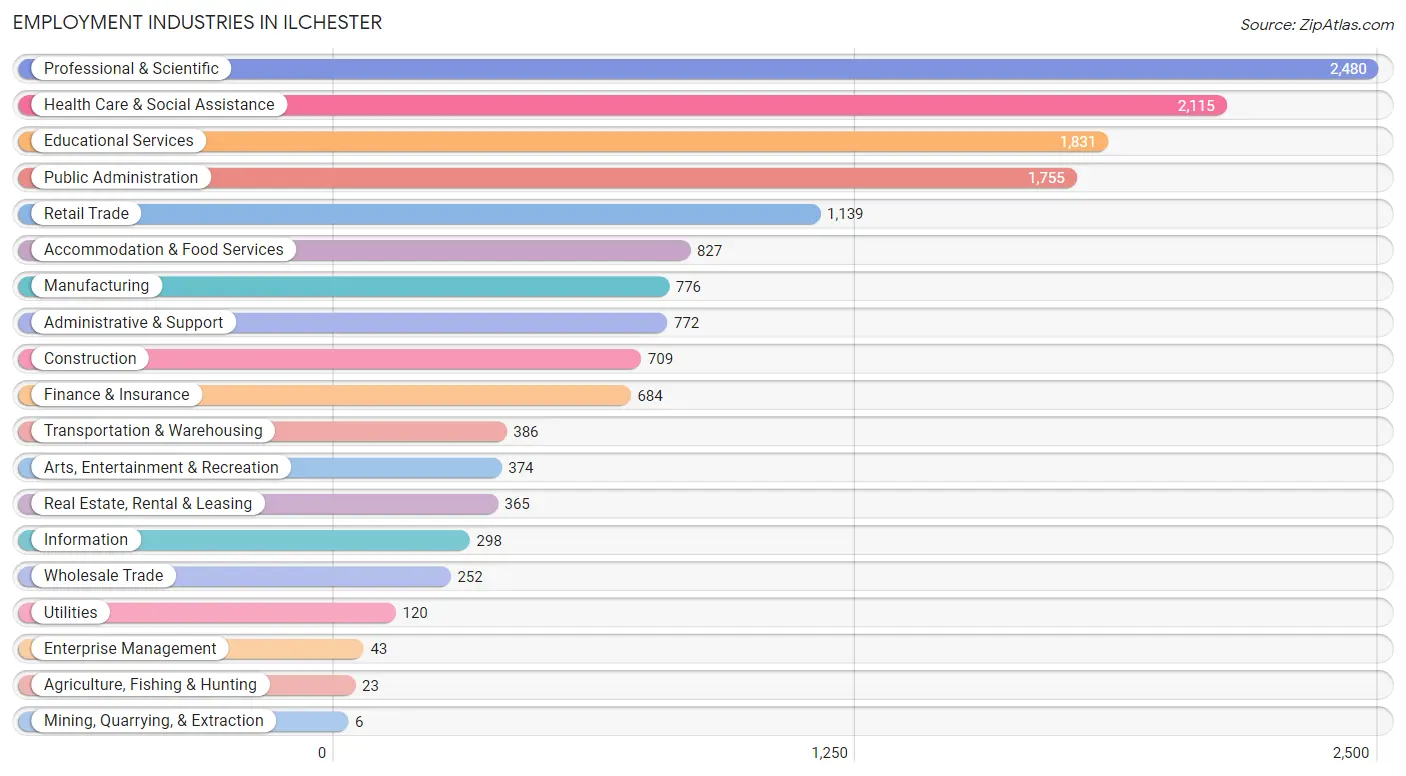
Employment Industries in Ilchester
The major employment industries in Ilchester include Professional & Scientific (2,480 | 15.7%), Health Care & Social Assistance (2,115 | 13.4%), Educational Services (1,831 | 11.6%), Public Administration (1,755 | 11.1%), and Retail Trade (1,139 | 7.2%).
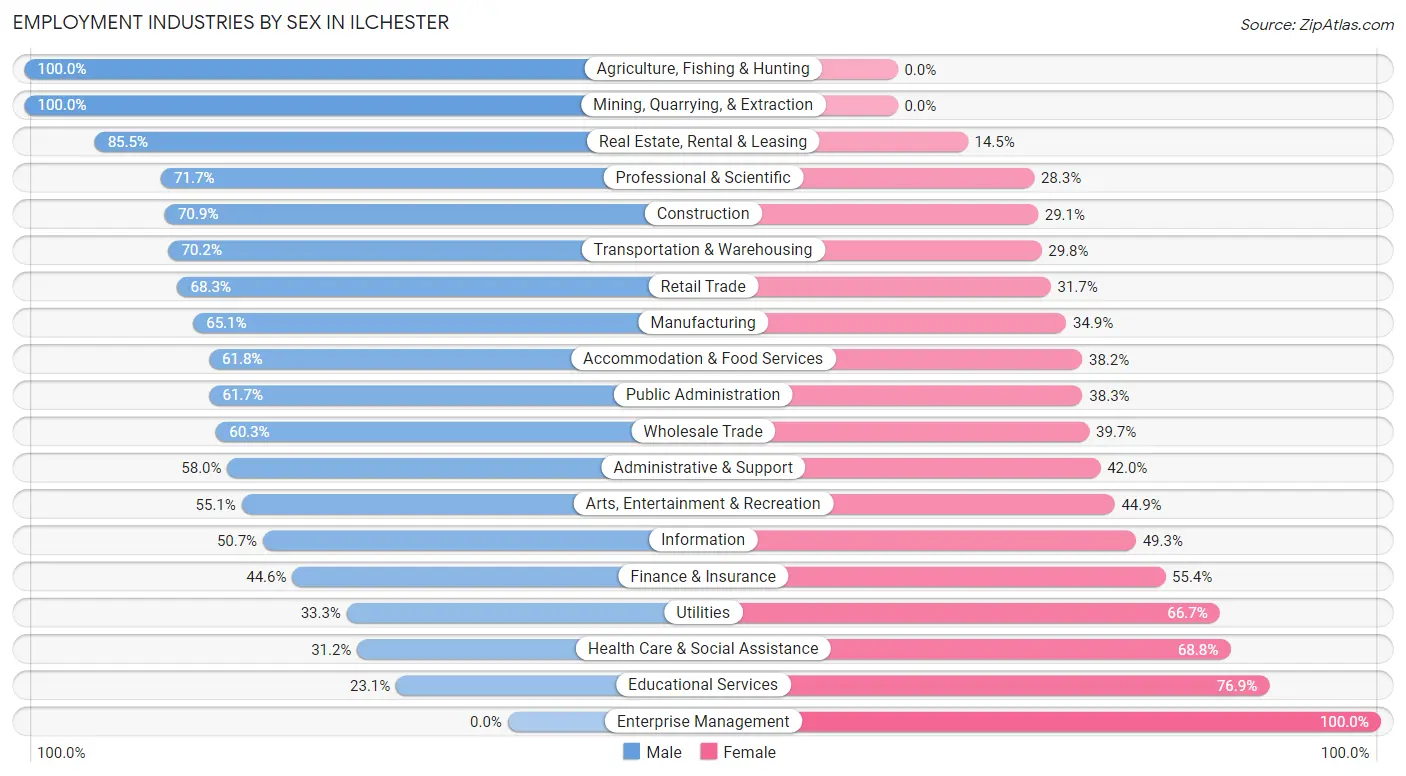
Employment Industries by Sex in Ilchester
The Ilchester industries that see more men than women are Agriculture, Fishing & Hunting (100.0%), Mining, Quarrying, & Extraction (100.0%), and Real Estate, Rental & Leasing (85.5%), whereas the industries that tend to have a higher number of women are Enterprise Management (100.0%), Educational Services (76.9%), and Health Care & Social Assistance (68.8%).
| Industry | Male | Female |
| Agriculture, Fishing & Hunting | 23 (100.0%) | 0 (0.0%) |
| Mining, Quarrying, & Extraction | 6 (100.0%) | 0 (0.0%) |
| Construction | 503 (70.9%) | 206 (29.1%) |
| Manufacturing | 505 (65.1%) | 271 (34.9%) |
| Wholesale Trade | 152 (60.3%) | 100 (39.7%) |
| Retail Trade | 778 (68.3%) | 361 (31.7%) |
| Transportation & Warehousing | 271 (70.2%) | 115 (29.8%) |
| Utilities | 40 (33.3%) | 80 (66.7%) |
| Information | 151 (50.7%) | 147 (49.3%) |
| Finance & Insurance | 305 (44.6%) | 379 (55.4%) |
| Real Estate, Rental & Leasing | 312 (85.5%) | 53 (14.5%) |
| Professional & Scientific | 1,779 (71.7%) | 701 (28.3%) |
| Enterprise Management | 0 (0.0%) | 43 (100.0%) |
| Administrative & Support | 448 (58.0%) | 324 (42.0%) |
| Educational Services | 423 (23.1%) | 1,408 (76.9%) |
| Health Care & Social Assistance | 659 (31.2%) | 1,456 (68.8%) |
| Arts, Entertainment & Recreation | 206 (55.1%) | 168 (44.9%) |
| Accommodation & Food Services | 511 (61.8%) | 316 (38.2%) |
| Public Administration | 1,083 (61.7%) | 672 (38.3%) |
| Total | 8,421 (53.3%) | 7,374 (46.7%) |
Education in Ilchester
School Enrollment in Ilchester
The most common levels of schooling among the 7,985 students in Ilchester are high school (1,763 | 22.1%), college / undergraduate (1,738 | 21.8%), and middle school (1,596 | 20.0%).
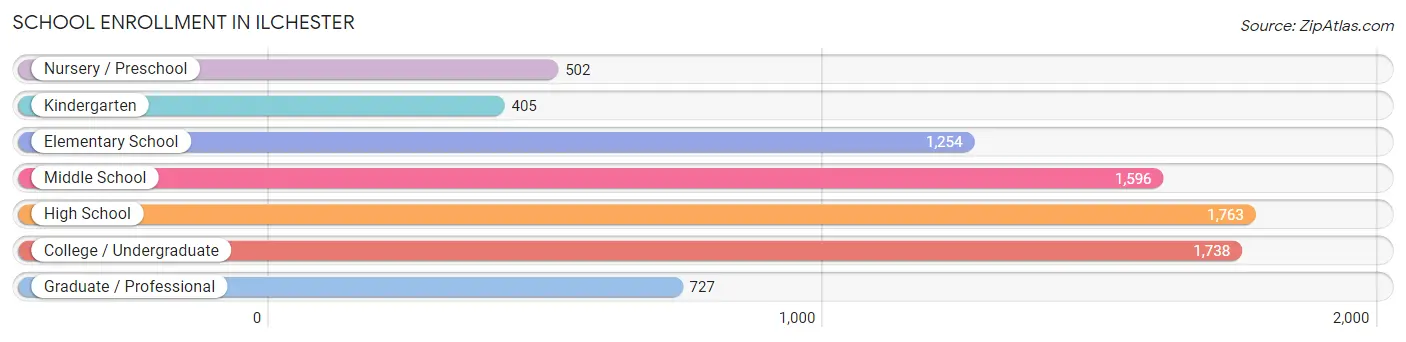
| School Level | # Students | % Students |
| Nursery / Preschool | 502 | 6.3% |
| Kindergarten | 405 | 5.1% |
| Elementary School | 1,254 | 15.7% |
| Middle School | 1,596 | 20.0% |
| High School | 1,763 | 22.1% |
| College / Undergraduate | 1,738 | 21.8% |
| Graduate / Professional | 727 | 9.1% |
| Total | 7,985 | 100.0% |
School Enrollment by Age by Funding Source in Ilchester
Out of a total of 7,985 students who are enrolled in schools in Ilchester, 1,182 (14.8%) attend a private institution, while the remaining 6,803 (85.2%) are enrolled in public schools. The age group of 35 years and over has the highest likelihood of being enrolled in private schools, with 228 (55.5% in the age bracket) enrolled. Conversely, the age group of 5 to 9 year old has the lowest likelihood of being enrolled in a private school, with 1,628 (92.9% in the age bracket) attending a public institution.
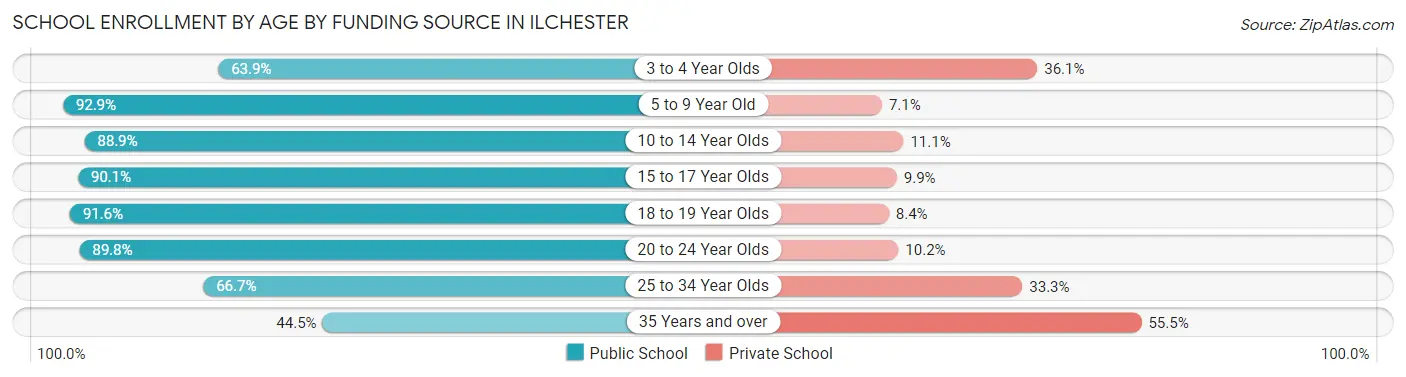
| Age Bracket | Public School | Private School |
| 3 to 4 Year Olds | 195 (63.9%) | 110 (36.1%) |
| 5 to 9 Year Old | 1,628 (92.9%) | 125 (7.1%) |
| 10 to 14 Year Olds | 1,699 (88.9%) | 213 (11.1%) |
| 15 to 17 Year Olds | 1,182 (90.1%) | 130 (9.9%) |
| 18 to 19 Year Olds | 424 (91.6%) | 39 (8.4%) |
| 20 to 24 Year Olds | 1,065 (89.8%) | 121 (10.2%) |
| 25 to 34 Year Olds | 429 (66.7%) | 214 (33.3%) |
| 35 Years and over | 183 (44.5%) | 228 (55.5%) |
| Total | 6,803 (85.2%) | 1,182 (14.8%) |
Educational Attainment by Field of Study in Ilchester
Business (2,422 | 19.7%), engineering (1,485 | 12.1%), science & technology (1,322 | 10.7%), computers & mathematics (1,212 | 9.9%), and social sciences (1,071 | 8.7%) are the most common fields of study among 12,301 individuals in Ilchester who have obtained a bachelor's degree or higher.
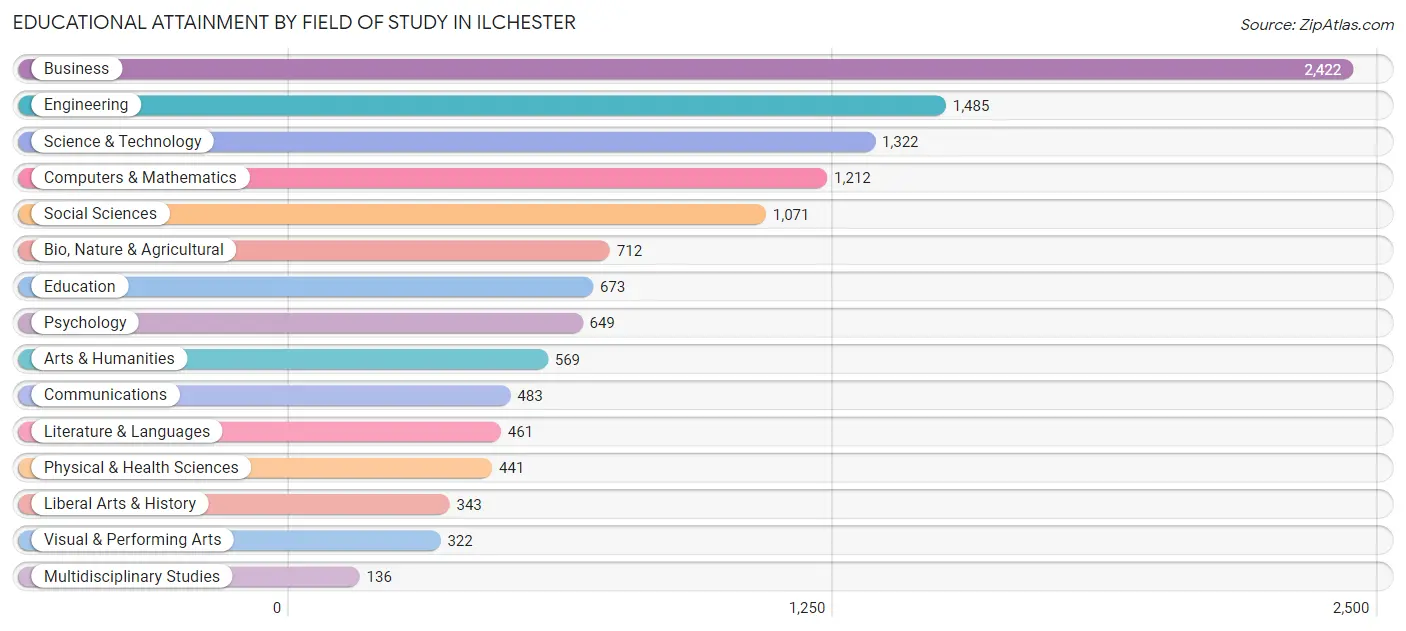
| Field of Study | # Graduates | % Graduates |
| Computers & Mathematics | 1,212 | 9.9% |
| Bio, Nature & Agricultural | 712 | 5.8% |
| Physical & Health Sciences | 441 | 3.6% |
| Psychology | 649 | 5.3% |
| Social Sciences | 1,071 | 8.7% |
| Engineering | 1,485 | 12.1% |
| Multidisciplinary Studies | 136 | 1.1% |
| Science & Technology | 1,322 | 10.7% |
| Business | 2,422 | 19.7% |
| Education | 673 | 5.5% |
| Literature & Languages | 461 | 3.7% |
| Liberal Arts & History | 343 | 2.8% |
| Visual & Performing Arts | 322 | 2.6% |
| Communications | 483 | 3.9% |
| Arts & Humanities | 569 | 4.6% |
| Total | 12,301 | 100.0% |
Transportation & Commute in Ilchester
Vehicle Availability by Sex in Ilchester
The most prevalent vehicle ownership categories in Ilchester are males with 2 vehicles (4,252, accounting for 50.0%) and females with 2 vehicles (3,589, making up 58.7%).
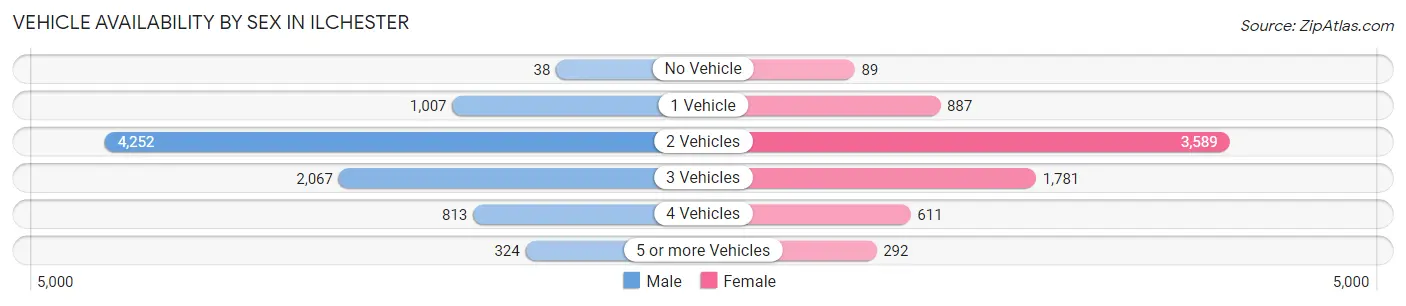
| Vehicles Available | Male | Female |
| No Vehicle | 38 (0.4%) | 89 (1.2%) |
| 1 Vehicle | 1,007 (11.8%) | 887 (12.2%) |
| 2 Vehicles | 4,252 (50.0%) | 3,589 (49.5%) |
| 3 Vehicles | 2,067 (24.3%) | 1,781 (24.6%) |
| 4 Vehicles | 813 (9.6%) | 611 (8.4%) |
| 5 or more Vehicles | 324 (3.8%) | 292 (4.0%) |
| Total | 8,501 (100.0%) | 7,249 (100.0%) |
Commute Time in Ilchester
The most frequently occuring commute durations in Ilchester are 15 to 19 minutes (2,796 commuters, 21.8%), 20 to 24 minutes (1,966 commuters, 15.4%), and 30 to 34 minutes (1,738 commuters, 13.6%).
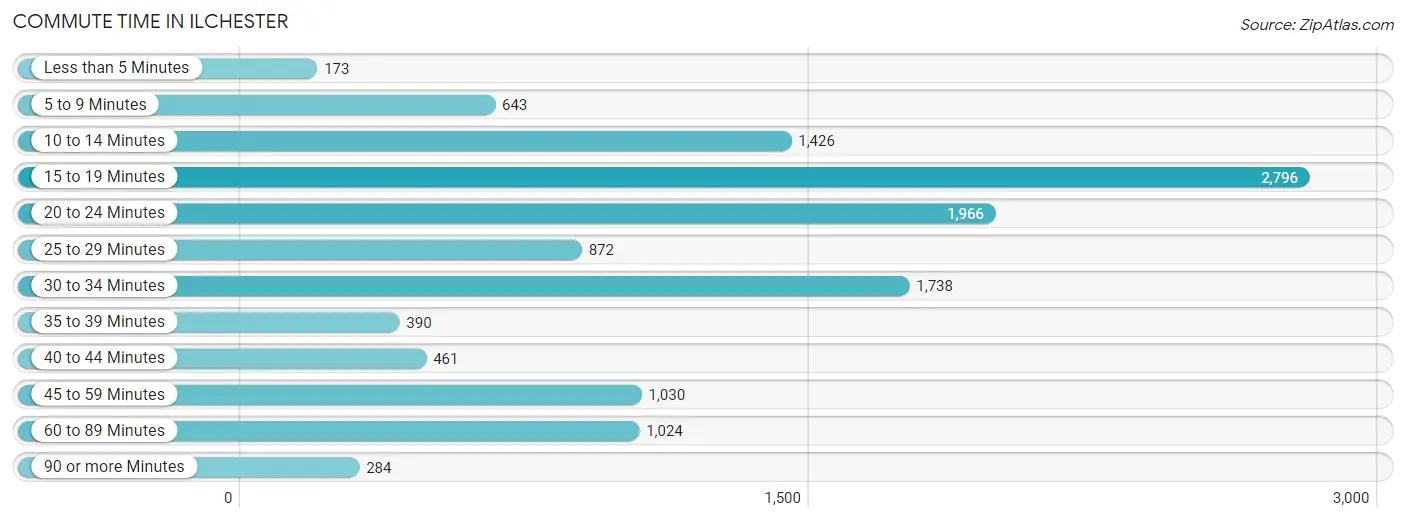
| Commute Time | # Commuters | % Commuters |
| Less than 5 Minutes | 173 | 1.3% |
| 5 to 9 Minutes | 643 | 5.0% |
| 10 to 14 Minutes | 1,426 | 11.1% |
| 15 to 19 Minutes | 2,796 | 21.8% |
| 20 to 24 Minutes | 1,966 | 15.4% |
| 25 to 29 Minutes | 872 | 6.8% |
| 30 to 34 Minutes | 1,738 | 13.6% |
| 35 to 39 Minutes | 390 | 3.0% |
| 40 to 44 Minutes | 461 | 3.6% |
| 45 to 59 Minutes | 1,030 | 8.0% |
| 60 to 89 Minutes | 1,024 | 8.0% |
| 90 or more Minutes | 284 | 2.2% |
Commute Time by Sex in Ilchester
The most common commute times in Ilchester are 15 to 19 minutes (1,556 commuters, 21.7%) for males and 15 to 19 minutes (1,240 commuters, 22.0%) for females.
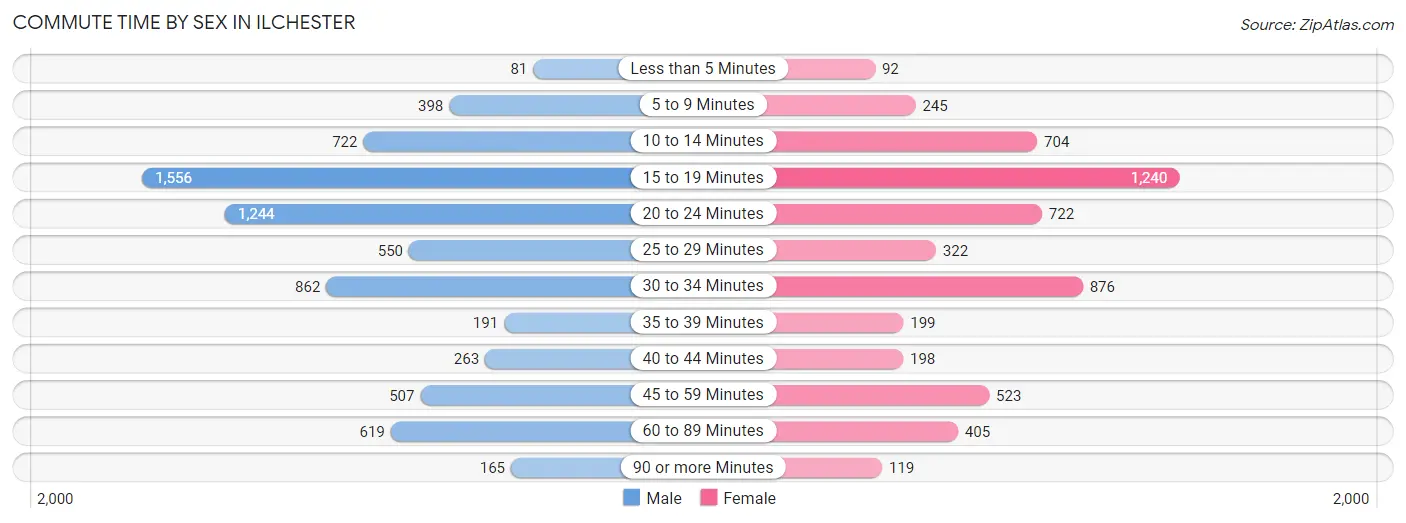
| Commute Time | Male | Female |
| Less than 5 Minutes | 81 (1.1%) | 92 (1.6%) |
| 5 to 9 Minutes | 398 (5.6%) | 245 (4.3%) |
| 10 to 14 Minutes | 722 (10.1%) | 704 (12.5%) |
| 15 to 19 Minutes | 1,556 (21.7%) | 1,240 (22.0%) |
| 20 to 24 Minutes | 1,244 (17.4%) | 722 (12.8%) |
| 25 to 29 Minutes | 550 (7.7%) | 322 (5.7%) |
| 30 to 34 Minutes | 862 (12.0%) | 876 (15.5%) |
| 35 to 39 Minutes | 191 (2.7%) | 199 (3.5%) |
| 40 to 44 Minutes | 263 (3.7%) | 198 (3.5%) |
| 45 to 59 Minutes | 507 (7.1%) | 523 (9.3%) |
| 60 to 89 Minutes | 619 (8.6%) | 405 (7.2%) |
| 90 or more Minutes | 165 (2.3%) | 119 (2.1%) |
Time of Departure to Work by Sex in Ilchester
The most frequent times of departure to work in Ilchester are 7:00 AM to 7:29 AM (1,070, 14.9%) for males and 8:00 AM to 8:29 AM (1,037, 18.4%) for females.
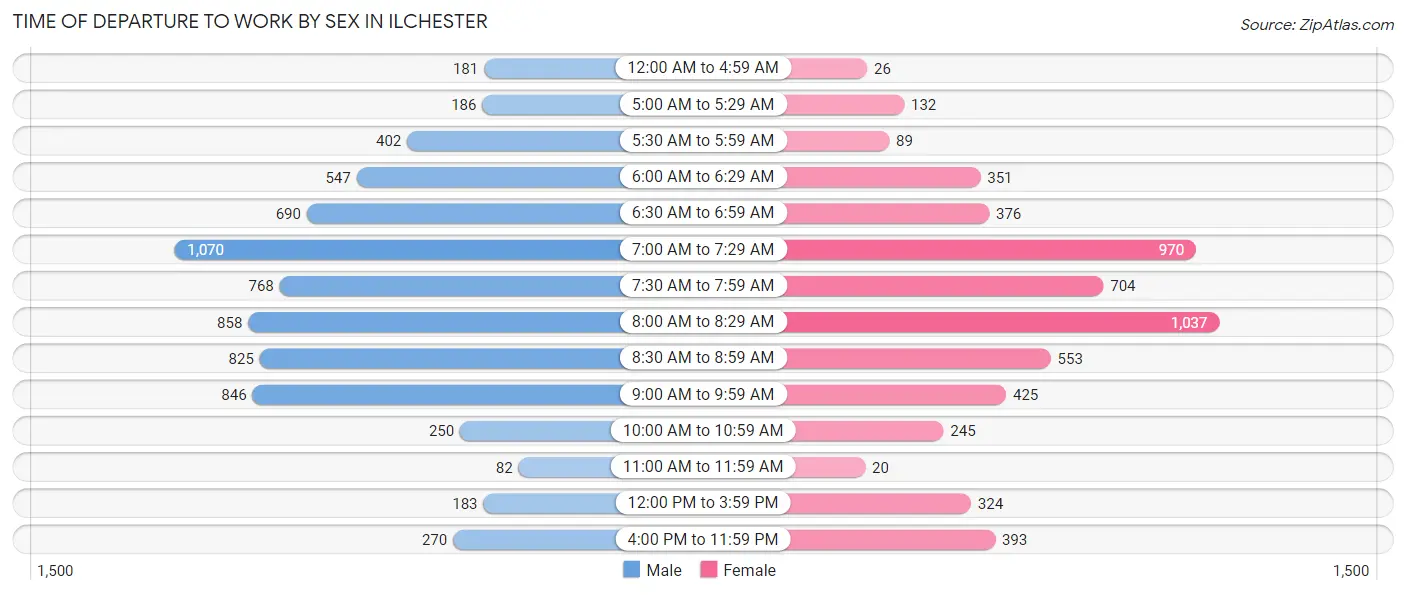
| Time of Departure | Male | Female |
| 12:00 AM to 4:59 AM | 181 (2.5%) | 26 (0.5%) |
| 5:00 AM to 5:29 AM | 186 (2.6%) | 132 (2.3%) |
| 5:30 AM to 5:59 AM | 402 (5.6%) | 89 (1.6%) |
| 6:00 AM to 6:29 AM | 547 (7.6%) | 351 (6.2%) |
| 6:30 AM to 6:59 AM | 690 (9.6%) | 376 (6.7%) |
| 7:00 AM to 7:29 AM | 1,070 (14.9%) | 970 (17.2%) |
| 7:30 AM to 7:59 AM | 768 (10.7%) | 704 (12.5%) |
| 8:00 AM to 8:29 AM | 858 (12.0%) | 1,037 (18.4%) |
| 8:30 AM to 8:59 AM | 825 (11.5%) | 553 (9.8%) |
| 9:00 AM to 9:59 AM | 846 (11.8%) | 425 (7.5%) |
| 10:00 AM to 10:59 AM | 250 (3.5%) | 245 (4.3%) |
| 11:00 AM to 11:59 AM | 82 (1.1%) | 20 (0.4%) |
| 12:00 PM to 3:59 PM | 183 (2.6%) | 324 (5.7%) |
| 4:00 PM to 11:59 PM | 270 (3.8%) | 393 (7.0%) |
| Total | 7,158 (100.0%) | 5,645 (100.0%) |
Housing Occupancy in Ilchester
Occupancy by Ownership in Ilchester
Of the total 9,669 dwellings in Ilchester, owner-occupied units account for 7,671 (79.3%), while renter-occupied units make up 1,998 (20.7%).
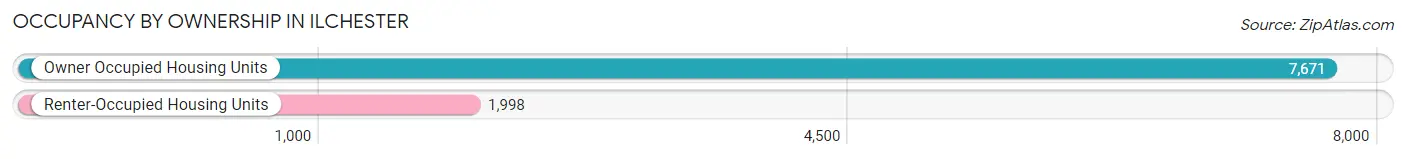
| Occupancy | # Housing Units | % Housing Units |
| Owner Occupied Housing Units | 7,671 | 79.3% |
| Renter-Occupied Housing Units | 1,998 | 20.7% |
| Total Occupied Housing Units | 9,669 | 100.0% |
Occupancy by Household Size in Ilchester
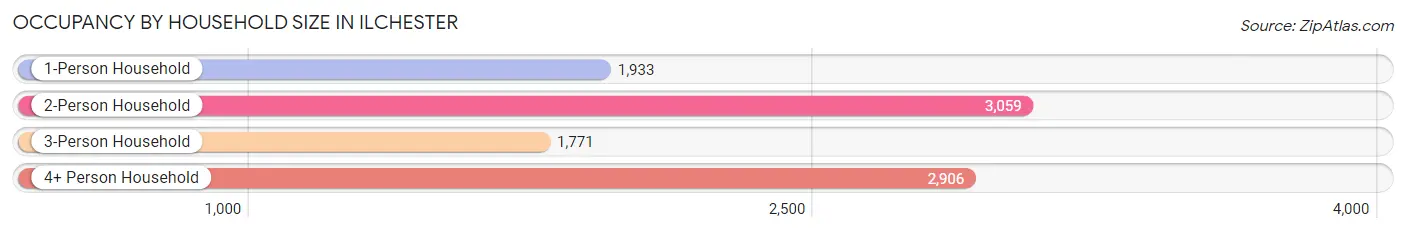
| Household Size | # Housing Units | % Housing Units |
| 1-Person Household | 1,933 | 20.0% |
| 2-Person Household | 3,059 | 31.6% |
| 3-Person Household | 1,771 | 18.3% |
| 4+ Person Household | 2,906 | 30.0% |
| Total Housing Units | 9,669 | 100.0% |
Occupancy by Ownership by Household Size in Ilchester
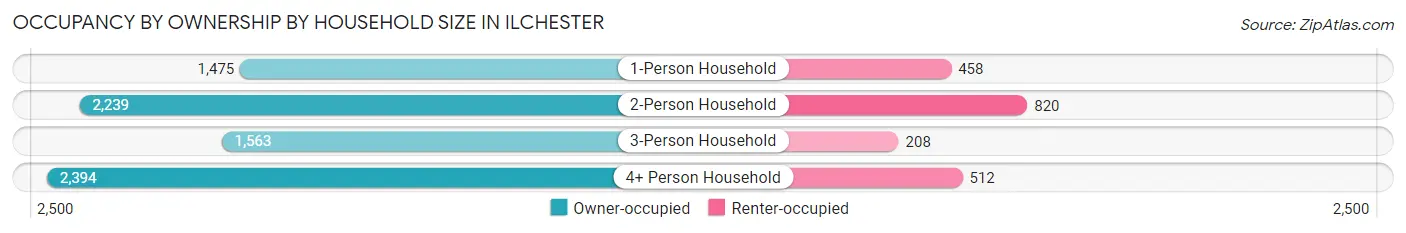
| Household Size | Owner-occupied | Renter-occupied |
| 1-Person Household | 1,475 (76.3%) | 458 (23.7%) |
| 2-Person Household | 2,239 (73.2%) | 820 (26.8%) |
| 3-Person Household | 1,563 (88.3%) | 208 (11.7%) |
| 4+ Person Household | 2,394 (82.4%) | 512 (17.6%) |
| Total Housing Units | 7,671 (79.3%) | 1,998 (20.7%) |
Occupancy by Educational Attainment in Ilchester
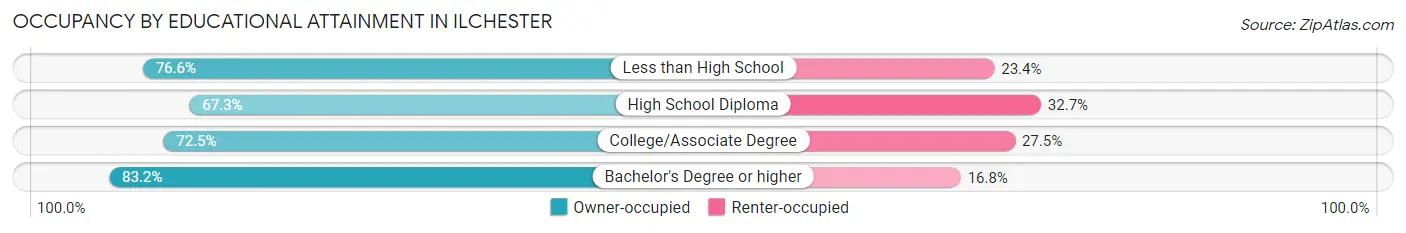
| Household Size | Owner-occupied | Renter-occupied |
| Less than High School | 255 (76.6%) | 78 (23.4%) |
| High School Diploma | 664 (67.3%) | 322 (32.7%) |
| College/Associate Degree | 1,338 (72.5%) | 508 (27.5%) |
| Bachelor's Degree or higher | 5,414 (83.2%) | 1,090 (16.8%) |
Occupancy by Age of Householder in Ilchester
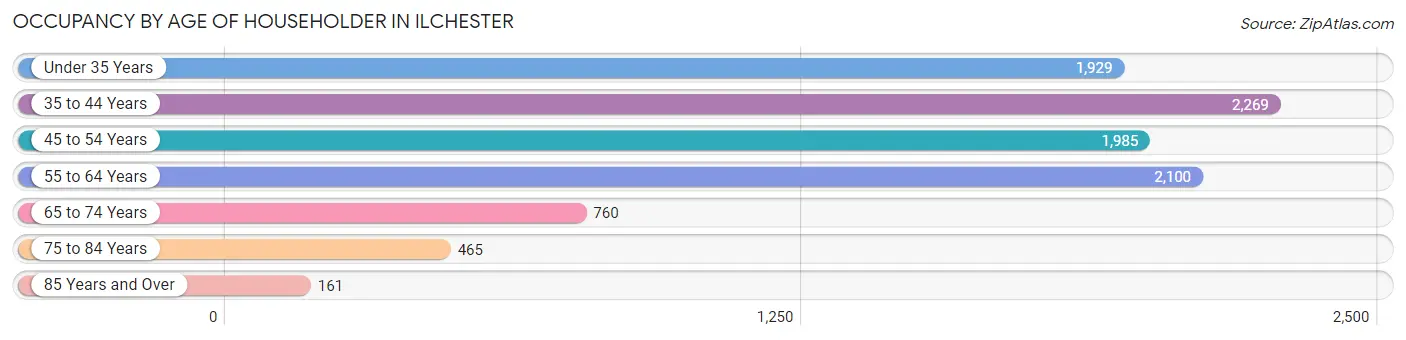
| Age Bracket | # Households | % Households |
| Under 35 Years | 1,929 | 20.0% |
| 35 to 44 Years | 2,269 | 23.5% |
| 45 to 54 Years | 1,985 | 20.5% |
| 55 to 64 Years | 2,100 | 21.7% |
| 65 to 74 Years | 760 | 7.9% |
| 75 to 84 Years | 465 | 4.8% |
| 85 Years and Over | 161 | 1.7% |
| Total | 9,669 | 100.0% |
Housing Finances in Ilchester
Median Income by Occupancy in Ilchester
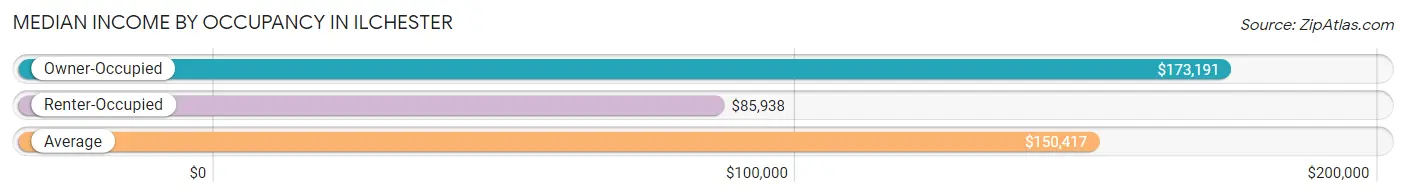
| Occupancy Type | # Households | Median Income |
| Owner-Occupied | 7,671 (79.3%) | $173,191 |
| Renter-Occupied | 1,998 (20.7%) | $85,938 |
| Average | 9,669 (100.0%) | $150,417 |
Occupancy by Householder Income Bracket in Ilchester
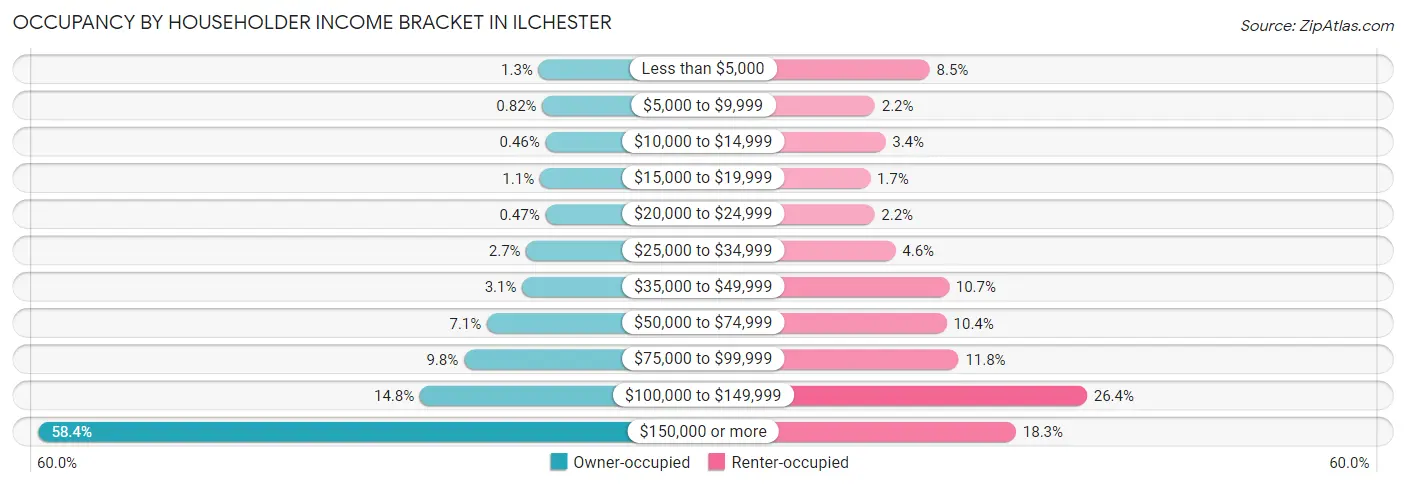
| Income Bracket | Owner-occupied | Renter-occupied |
| Less than $5,000 | 96 (1.3%) | 169 (8.5%) |
| $5,000 to $9,999 | 63 (0.8%) | 44 (2.2%) |
| $10,000 to $14,999 | 35 (0.5%) | 68 (3.4%) |
| $15,000 to $19,999 | 84 (1.1%) | 33 (1.7%) |
| $20,000 to $24,999 | 36 (0.5%) | 43 (2.1%) |
| $25,000 to $34,999 | 203 (2.6%) | 91 (4.5%) |
| $35,000 to $49,999 | 239 (3.1%) | 213 (10.7%) |
| $50,000 to $74,999 | 548 (7.1%) | 208 (10.4%) |
| $75,000 to $99,999 | 750 (9.8%) | 235 (11.8%) |
| $100,000 to $149,999 | 1,136 (14.8%) | 528 (26.4%) |
| $150,000 or more | 4,481 (58.4%) | 366 (18.3%) |
| Total | 7,671 (100.0%) | 1,998 (100.0%) |
Monthly Housing Cost Tiers in Ilchester
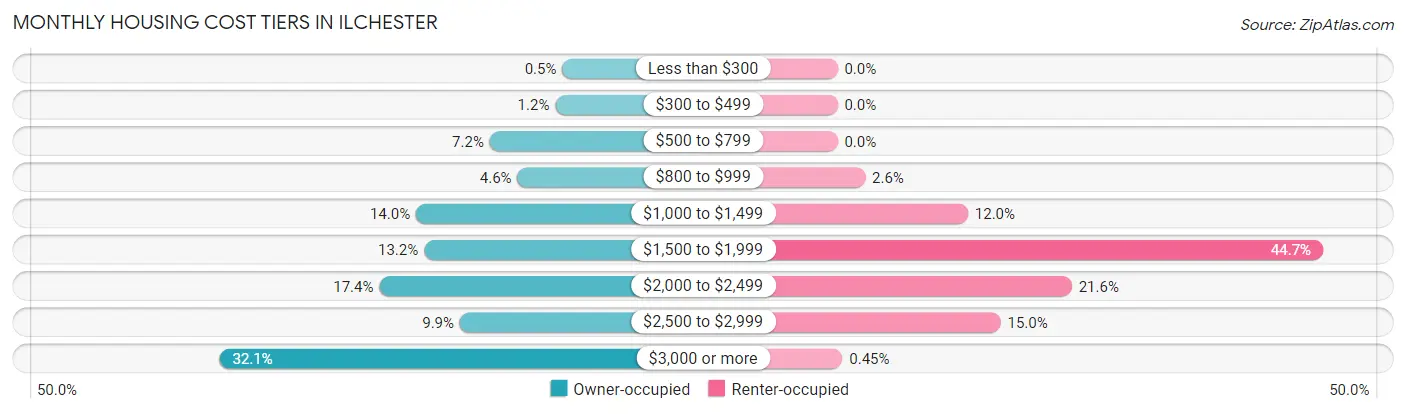
| Monthly Cost | Owner-occupied | Renter-occupied |
| Less than $300 | 38 (0.5%) | 0 (0.0%) |
| $300 to $499 | 88 (1.1%) | 0 (0.0%) |
| $500 to $799 | 551 (7.2%) | 0 (0.0%) |
| $800 to $999 | 355 (4.6%) | 51 (2.5%) |
| $1,000 to $1,499 | 1,072 (14.0%) | 240 (12.0%) |
| $1,500 to $1,999 | 1,015 (13.2%) | 893 (44.7%) |
| $2,000 to $2,499 | 1,331 (17.3%) | 431 (21.6%) |
| $2,500 to $2,999 | 762 (9.9%) | 300 (15.0%) |
| $3,000 or more | 2,459 (32.1%) | 9 (0.4%) |
| Total | 7,671 (100.0%) | 1,998 (100.0%) |
Physical Housing Characteristics in Ilchester
Housing Structures in Ilchester
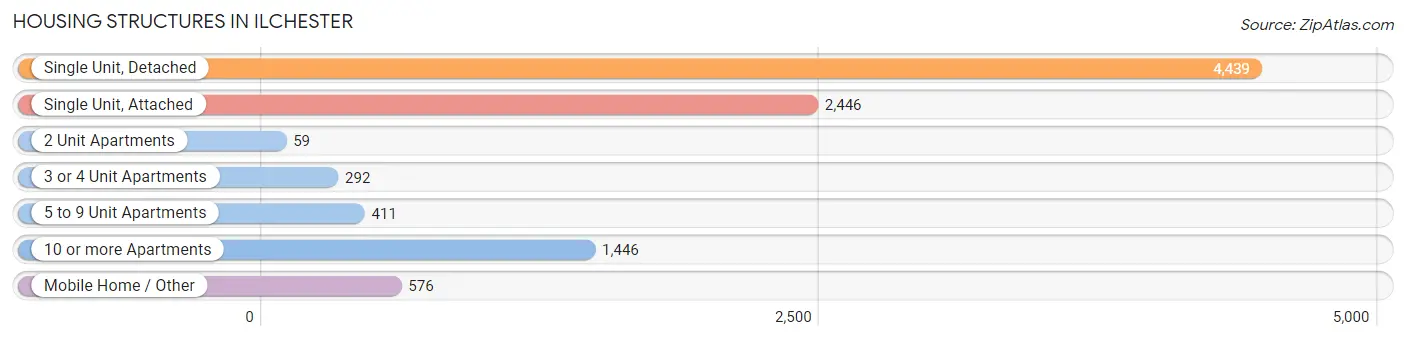
| Structure Type | # Housing Units | % Housing Units |
| Single Unit, Detached | 4,439 | 45.9% |
| Single Unit, Attached | 2,446 | 25.3% |
| 2 Unit Apartments | 59 | 0.6% |
| 3 or 4 Unit Apartments | 292 | 3.0% |
| 5 to 9 Unit Apartments | 411 | 4.3% |
| 10 or more Apartments | 1,446 | 15.0% |
| Mobile Home / Other | 576 | 6.0% |
| Total | 9,669 | 100.0% |
Housing Structures by Occupancy in Ilchester
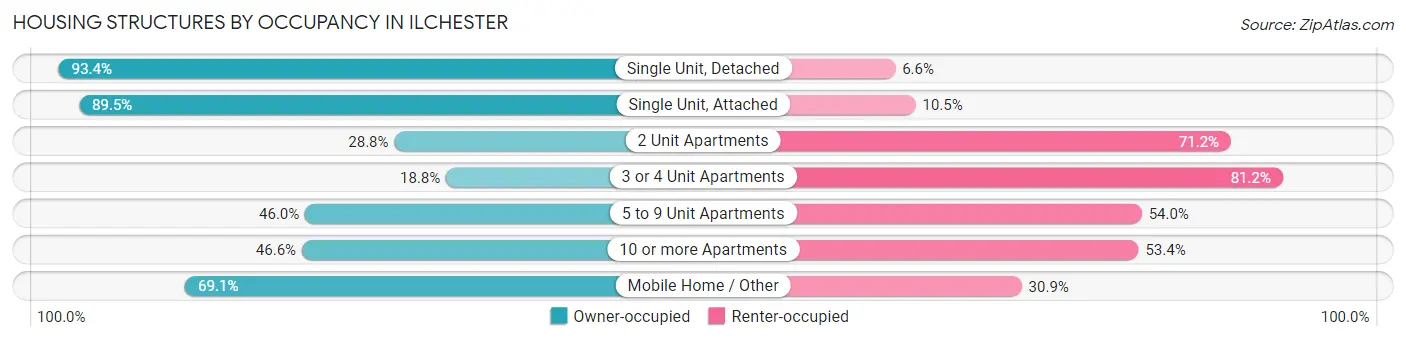
| Structure Type | Owner-occupied | Renter-occupied |
| Single Unit, Detached | 4,148 (93.4%) | 291 (6.6%) |
| Single Unit, Attached | 2,190 (89.5%) | 256 (10.5%) |
| 2 Unit Apartments | 17 (28.8%) | 42 (71.2%) |
| 3 or 4 Unit Apartments | 55 (18.8%) | 237 (81.2%) |
| 5 to 9 Unit Apartments | 189 (46.0%) | 222 (54.0%) |
| 10 or more Apartments | 674 (46.6%) | 772 (53.4%) |
| Mobile Home / Other | 398 (69.1%) | 178 (30.9%) |
| Total | 7,671 (79.3%) | 1,998 (20.7%) |
Housing Structures by Number of Rooms in Ilchester
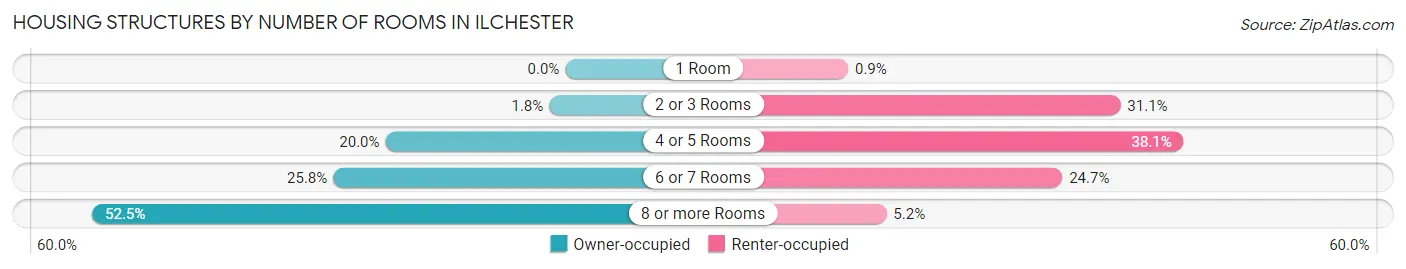
| Number of Rooms | Owner-occupied | Renter-occupied |
| 1 Room | 0 (0.0%) | 18 (0.9%) |
| 2 or 3 Rooms | 137 (1.8%) | 622 (31.1%) |
| 4 or 5 Rooms | 1,531 (20.0%) | 762 (38.1%) |
| 6 or 7 Rooms | 1,976 (25.8%) | 493 (24.7%) |
| 8 or more Rooms | 4,027 (52.5%) | 103 (5.2%) |
| Total | 7,671 (100.0%) | 1,998 (100.0%) |
Housing Structure by Heating Type in Ilchester
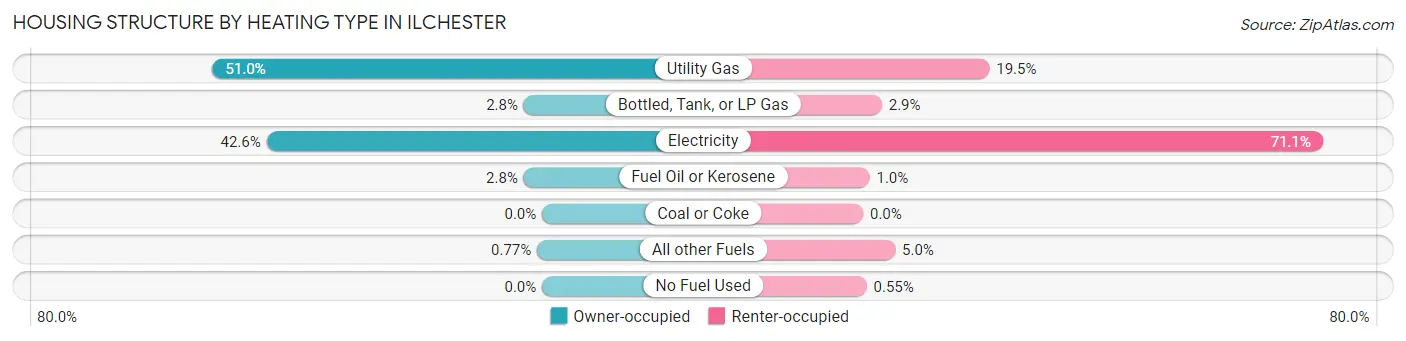
| Heating Type | Owner-occupied | Renter-occupied |
| Utility Gas | 3,909 (51.0%) | 390 (19.5%) |
| Bottled, Tank, or LP Gas | 217 (2.8%) | 58 (2.9%) |
| Electricity | 3,268 (42.6%) | 1,420 (71.1%) |
| Fuel Oil or Kerosene | 218 (2.8%) | 20 (1.0%) |
| Coal or Coke | 0 (0.0%) | 0 (0.0%) |
| All other Fuels | 59 (0.8%) | 99 (5.0%) |
| No Fuel Used | 0 (0.0%) | 11 (0.5%) |
| Total | 7,671 (100.0%) | 1,998 (100.0%) |
Household Vehicle Usage in Ilchester
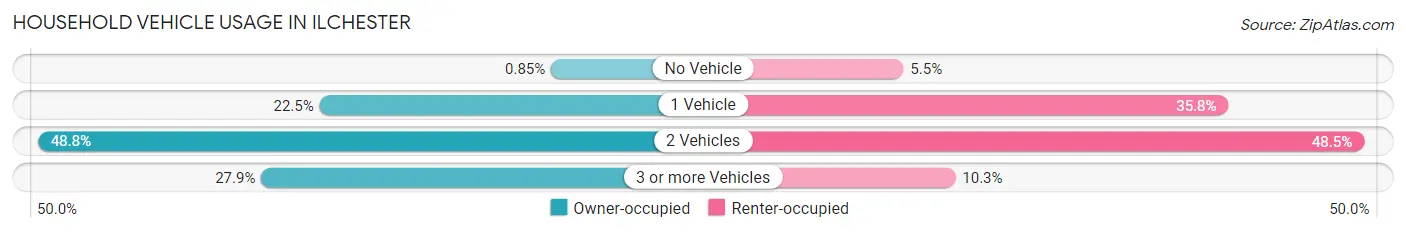
| Vehicles per Household | Owner-occupied | Renter-occupied |
| No Vehicle | 65 (0.9%) | 109 (5.5%) |
| 1 Vehicle | 1,724 (22.5%) | 715 (35.8%) |
| 2 Vehicles | 3,741 (48.8%) | 968 (48.4%) |
| 3 or more Vehicles | 2,141 (27.9%) | 206 (10.3%) |
| Total | 7,671 (100.0%) | 1,998 (100.0%) |
Real Estate & Mortgages in Ilchester
Real Estate and Mortgage Overview in Ilchester
| Characteristic | Without Mortgage | With Mortgage |
| Housing Units | 1,984 | 5,687 |
| Median Property Value | $411,200 | $512,100 |
| Median Household Income | $95,000 | $3,892 |
| Monthly Housing Costs | $994 | $2,459 |
| Real Estate Taxes | $6,175 | $23 |
Property Value by Mortgage Status in Ilchester
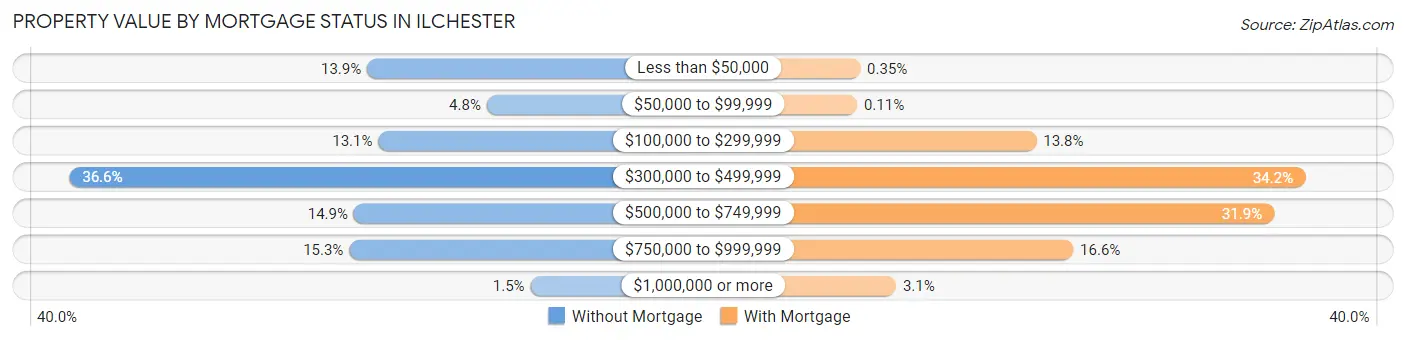
| Property Value | Without Mortgage | With Mortgage |
| Less than $50,000 | 276 (13.9%) | 20 (0.4%) |
| $50,000 to $99,999 | 95 (4.8%) | 6 (0.1%) |
| $100,000 to $299,999 | 259 (13.1%) | 783 (13.8%) |
| $300,000 to $499,999 | 726 (36.6%) | 1,947 (34.2%) |
| $500,000 to $749,999 | 296 (14.9%) | 1,813 (31.9%) |
| $750,000 to $999,999 | 303 (15.3%) | 943 (16.6%) |
| $1,000,000 or more | 29 (1.5%) | 175 (3.1%) |
| Total | 1,984 (100.0%) | 5,687 (100.0%) |
Household Income by Mortgage Status in Ilchester
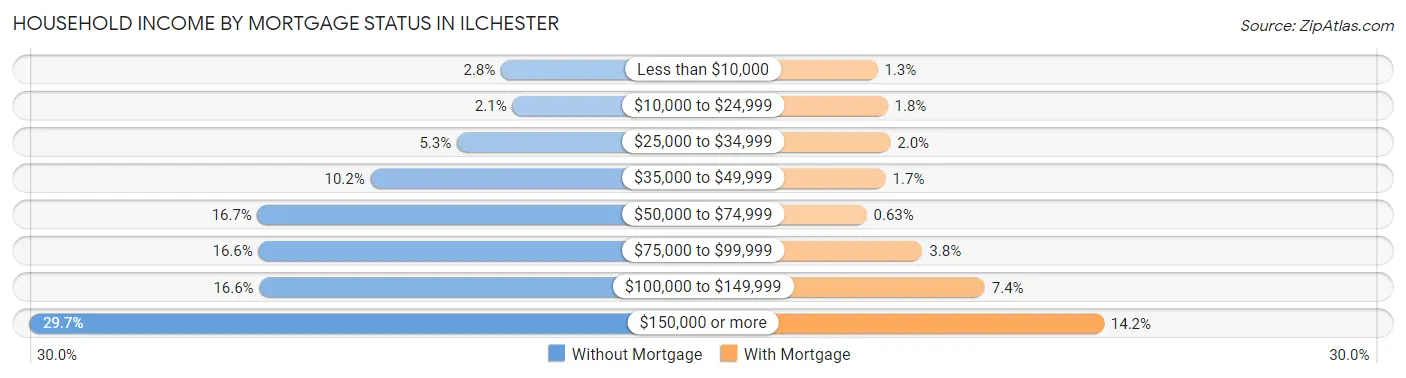
| Household Income | Without Mortgage | With Mortgage |
| Less than $10,000 | 55 (2.8%) | 71 (1.3%) |
| $10,000 to $24,999 | 42 (2.1%) | 104 (1.8%) |
| $25,000 to $34,999 | 105 (5.3%) | 113 (2.0%) |
| $35,000 to $49,999 | 203 (10.2%) | 98 (1.7%) |
| $50,000 to $74,999 | 331 (16.7%) | 36 (0.6%) |
| $75,000 to $99,999 | 330 (16.6%) | 217 (3.8%) |
| $100,000 to $149,999 | 329 (16.6%) | 420 (7.4%) |
| $150,000 or more | 589 (29.7%) | 807 (14.2%) |
| Total | 1,984 (100.0%) | 5,687 (100.0%) |
Property Value to Household Income Ratio in Ilchester
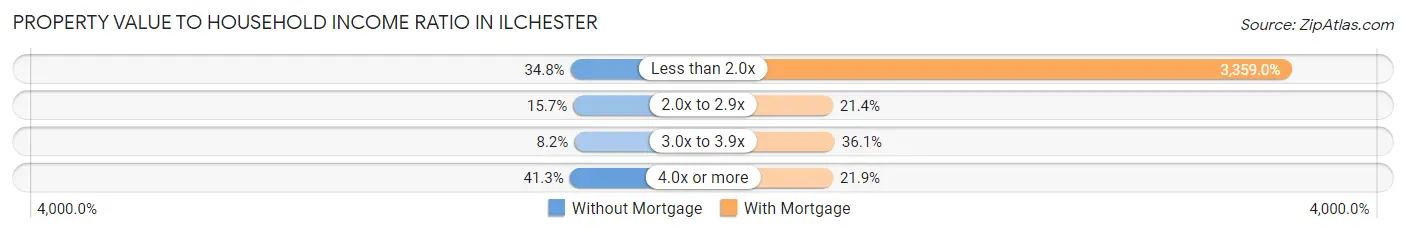
| Value-to-Income Ratio | Without Mortgage | With Mortgage |
| Less than 2.0x | 690 (34.8%) | 191,028 (3,359.0%) |
| 2.0x to 2.9x | 312 (15.7%) | 1,219 (21.4%) |
| 3.0x to 3.9x | 163 (8.2%) | 2,053 (36.1%) |
| 4.0x or more | 819 (41.3%) | 1,245 (21.9%) |
| Total | 1,984 (100.0%) | 5,687 (100.0%) |
Real Estate Taxes by Mortgage Status in Ilchester
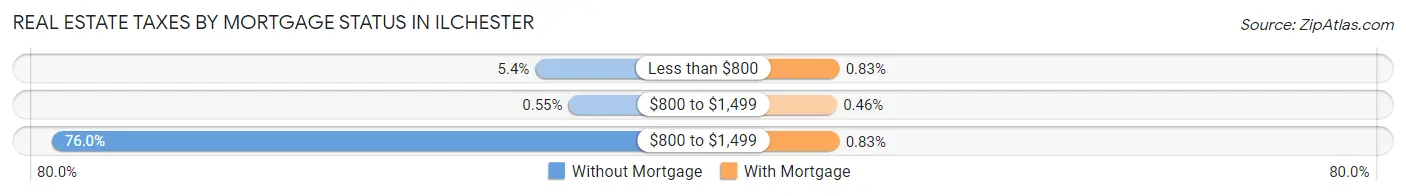
| Property Taxes | Without Mortgage | With Mortgage |
| Less than $800 | 107 (5.4%) | 47 (0.8%) |
| $800 to $1,499 | 11 (0.5%) | 26 (0.5%) |
| $800 to $1,499 | 1,508 (76.0%) | 47 (0.8%) |
| Total | 1,984 (100.0%) | 5,687 (100.0%) |
Health & Disability in Ilchester
Health Insurance Coverage by Age in Ilchester
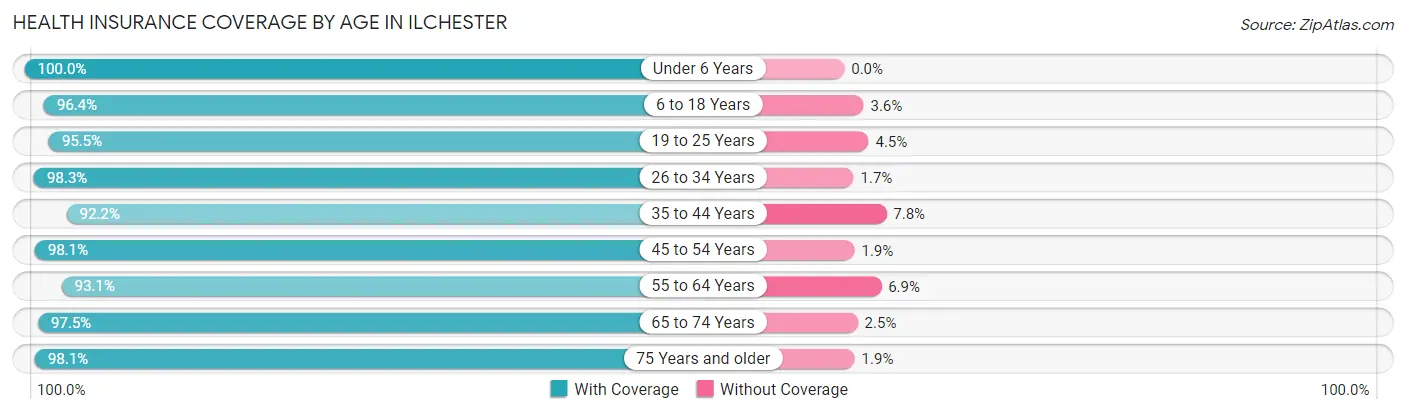
| Age Bracket | With Coverage | Without Coverage |
| Under 6 Years | 2,087 (100.0%) | 0 (0.0%) |
| 6 to 18 Years | 4,755 (96.4%) | 177 (3.6%) |
| 19 to 25 Years | 2,283 (95.5%) | 108 (4.5%) |
| 26 to 34 Years | 3,383 (98.3%) | 60 (1.7%) |
| 35 to 44 Years | 4,067 (92.2%) | 346 (7.8%) |
| 45 to 54 Years | 3,894 (98.1%) | 76 (1.9%) |
| 55 to 64 Years | 3,203 (93.1%) | 237 (6.9%) |
| 65 to 74 Years | 1,370 (97.5%) | 35 (2.5%) |
| 75 Years and older | 1,016 (98.1%) | 20 (1.9%) |
| Total | 26,058 (96.1%) | 1,059 (3.9%) |
Health Insurance Coverage by Citizenship Status in Ilchester
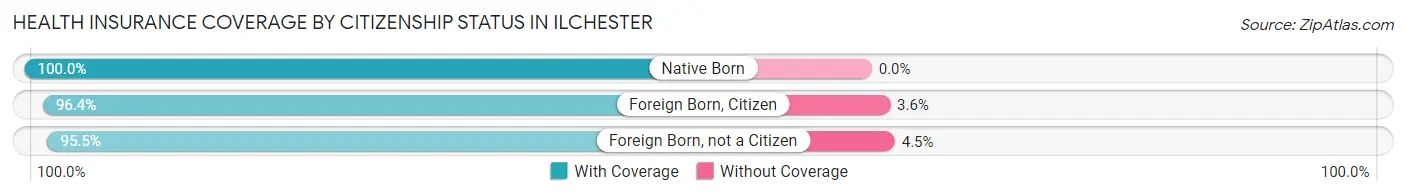
| Citizenship Status | With Coverage | Without Coverage |
| Native Born | 2,087 (100.0%) | 0 (0.0%) |
| Foreign Born, Citizen | 4,755 (96.4%) | 177 (3.6%) |
| Foreign Born, not a Citizen | 2,283 (95.5%) | 108 (4.5%) |
Health Insurance Coverage by Household Income in Ilchester
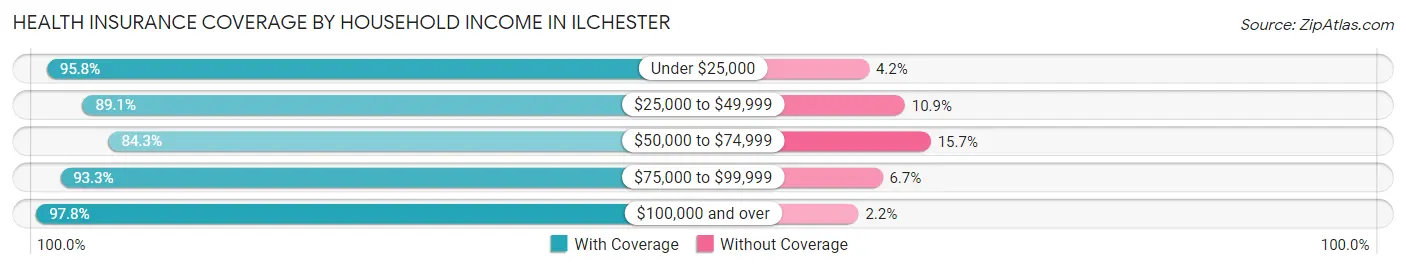
| Household Income | With Coverage | Without Coverage |
| Under $25,000 | 1,014 (95.8%) | 44 (4.2%) |
| $25,000 to $49,999 | 1,370 (89.1%) | 167 (10.9%) |
| $50,000 to $74,999 | 1,382 (84.3%) | 258 (15.7%) |
| $75,000 to $99,999 | 1,858 (93.3%) | 133 (6.7%) |
| $100,000 and over | 20,426 (97.8%) | 457 (2.2%) |
Public vs Private Health Insurance Coverage by Age in Ilchester
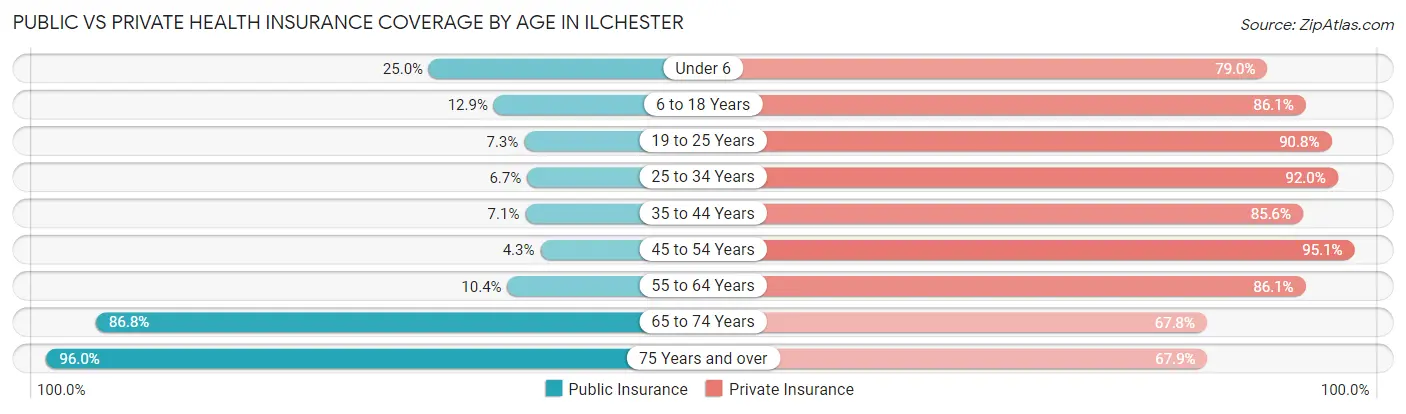
| Age Bracket | Public Insurance | Private Insurance |
| Under 6 | 521 (25.0%) | 1,648 (79.0%) |
| 6 to 18 Years | 637 (12.9%) | 4,245 (86.1%) |
| 19 to 25 Years | 174 (7.3%) | 2,172 (90.8%) |
| 25 to 34 Years | 232 (6.7%) | 3,168 (92.0%) |
| 35 to 44 Years | 312 (7.1%) | 3,776 (85.6%) |
| 45 to 54 Years | 170 (4.3%) | 3,777 (95.1%) |
| 55 to 64 Years | 357 (10.4%) | 2,960 (86.1%) |
| 65 to 74 Years | 1,219 (86.8%) | 952 (67.8%) |
| 75 Years and over | 994 (96.0%) | 703 (67.9%) |
| Total | 4,616 (17.0%) | 23,401 (86.3%) |
Disability Status by Sex by Age in Ilchester
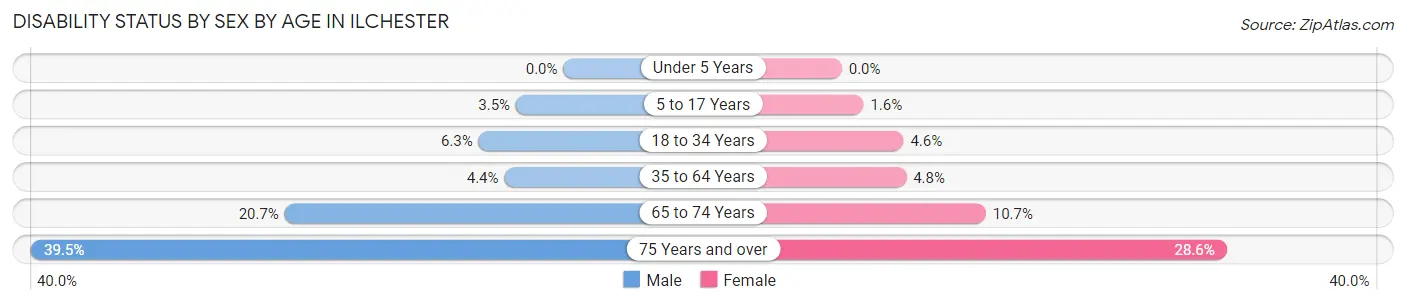
| Age Bracket | Male | Female |
| Under 5 Years | 0 (0.0%) | 0 (0.0%) |
| 5 to 17 Years | 92 (3.5%) | 40 (1.6%) |
| 18 to 34 Years | 215 (6.3%) | 128 (4.6%) |
| 35 to 64 Years | 257 (4.4%) | 285 (4.8%) |
| 65 to 74 Years | 132 (20.7%) | 82 (10.7%) |
| 75 Years and over | 166 (39.5%) | 176 (28.6%) |
Disability Class by Sex by Age in Ilchester
Disability Class: Hearing Difficulty
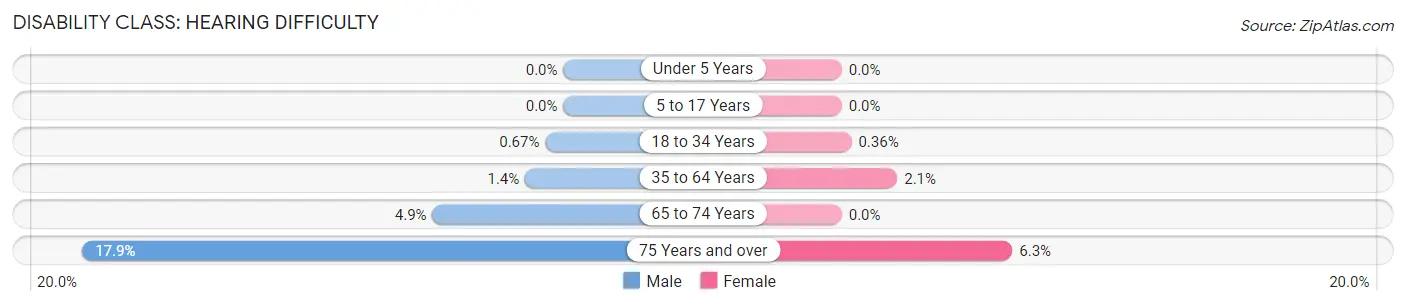
| Age Bracket | Male | Female |
| Under 5 Years | 0 (0.0%) | 0 (0.0%) |
| 5 to 17 Years | 0 (0.0%) | 0 (0.0%) |
| 18 to 34 Years | 23 (0.7%) | 10 (0.4%) |
| 35 to 64 Years | 83 (1.4%) | 123 (2.1%) |
| 65 to 74 Years | 31 (4.9%) | 0 (0.0%) |
| 75 Years and over | 75 (17.9%) | 39 (6.3%) |
Disability Class: Vision Difficulty
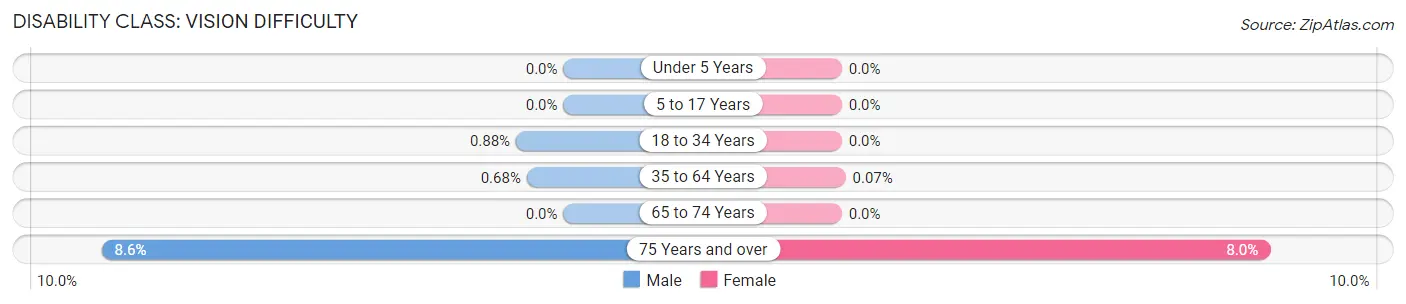
| Age Bracket | Male | Female |
| Under 5 Years | 0 (0.0%) | 0 (0.0%) |
| 5 to 17 Years | 0 (0.0%) | 0 (0.0%) |
| 18 to 34 Years | 30 (0.9%) | 0 (0.0%) |
| 35 to 64 Years | 40 (0.7%) | 4 (0.1%) |
| 65 to 74 Years | 0 (0.0%) | 0 (0.0%) |
| 75 Years and over | 36 (8.6%) | 49 (8.0%) |
Disability Class: Cognitive Difficulty
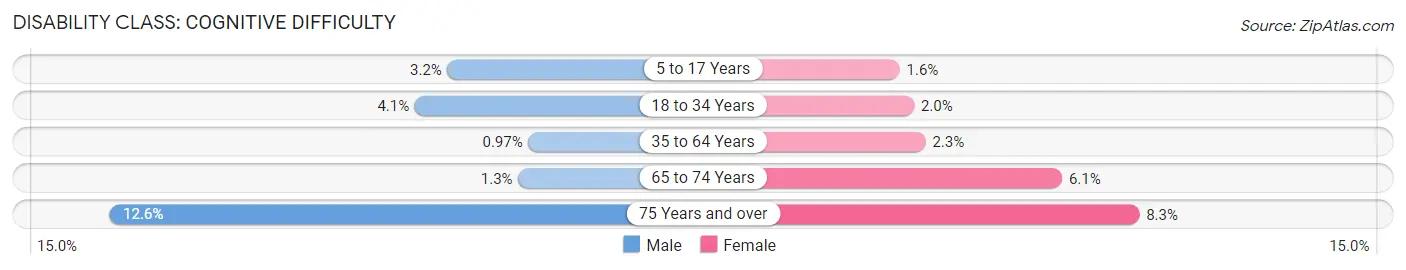
| Age Bracket | Male | Female |
| 5 to 17 Years | 84 (3.2%) | 40 (1.6%) |
| 18 to 34 Years | 141 (4.1%) | 56 (2.0%) |
| 35 to 64 Years | 57 (1.0%) | 139 (2.3%) |
| 65 to 74 Years | 8 (1.3%) | 47 (6.1%) |
| 75 Years and over | 53 (12.6%) | 51 (8.3%) |
Disability Class: Ambulatory Difficulty
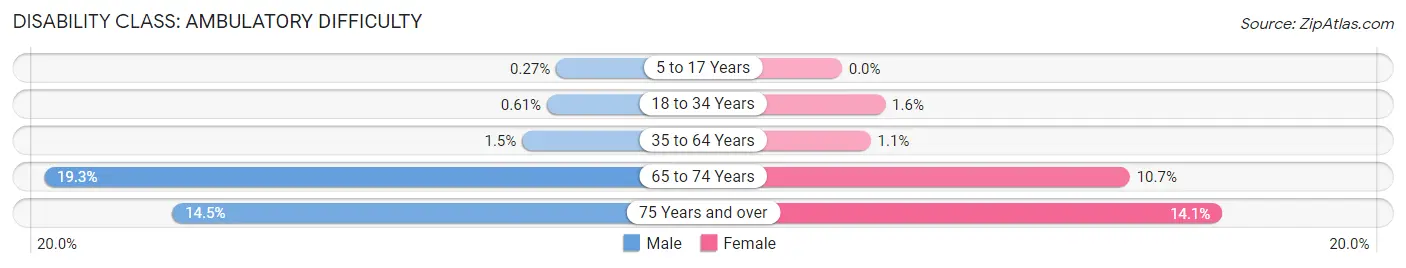
| Age Bracket | Male | Female |
| 5 to 17 Years | 7 (0.3%) | 0 (0.0%) |
| 18 to 34 Years | 21 (0.6%) | 45 (1.6%) |
| 35 to 64 Years | 90 (1.5%) | 64 (1.1%) |
| 65 to 74 Years | 123 (19.3%) | 82 (10.7%) |
| 75 Years and over | 61 (14.5%) | 87 (14.1%) |
Disability Class: Self-Care Difficulty
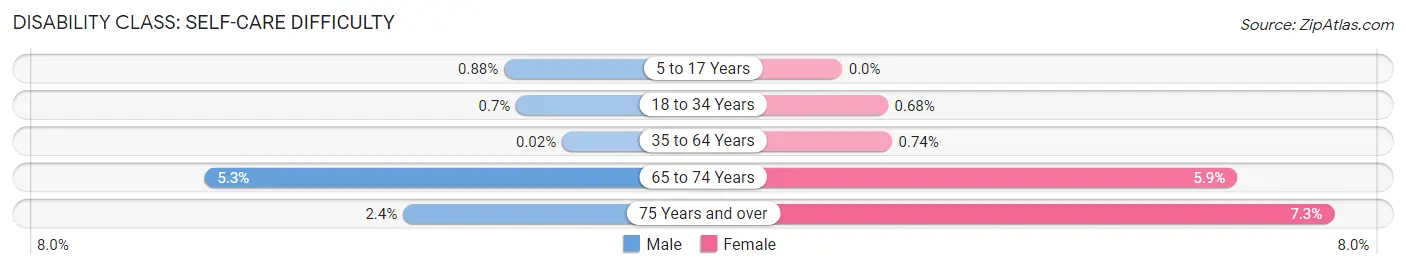
| Age Bracket | Male | Female |
| 5 to 17 Years | 23 (0.9%) | 0 (0.0%) |
| 18 to 34 Years | 24 (0.7%) | 19 (0.7%) |
| 35 to 64 Years | 1 (0.0%) | 44 (0.7%) |
| 65 to 74 Years | 34 (5.3%) | 45 (5.9%) |
| 75 Years and over | 10 (2.4%) | 45 (7.3%) |
Technology Access in Ilchester
Computing Device Access in Ilchester
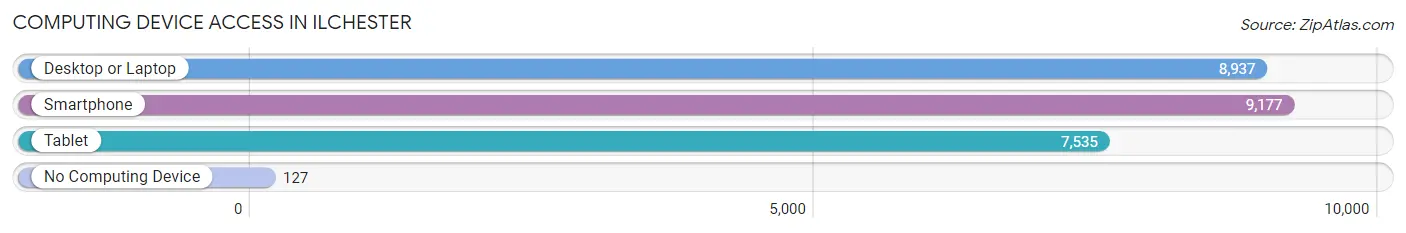
| Device Type | # Households | % Households |
| Desktop or Laptop | 8,937 | 92.4% |
| Smartphone | 9,177 | 94.9% |
| Tablet | 7,535 | 77.9% |
| No Computing Device | 127 | 1.3% |
| Total | 9,669 | 100.0% |
Internet Access in Ilchester
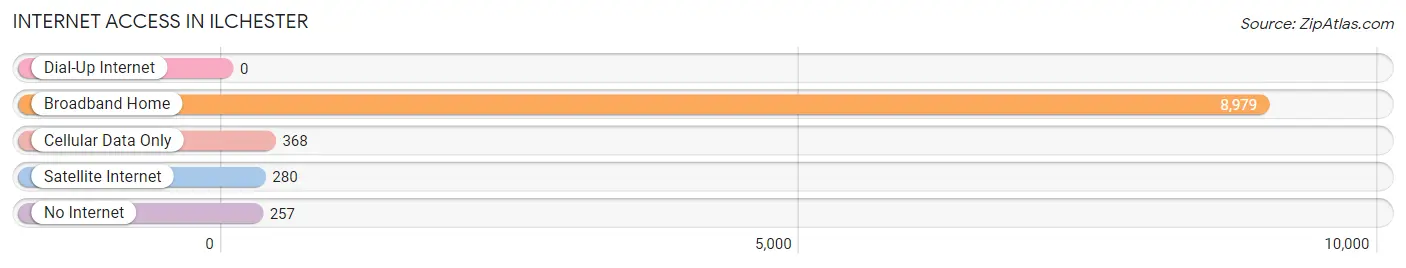
| Internet Type | # Households | % Households |
| Dial-Up Internet | 0 | 0.0% |
| Broadband Home | 8,979 | 92.9% |
| Cellular Data Only | 368 | 3.8% |
| Satellite Internet | 280 | 2.9% |
| No Internet | 257 | 2.7% |
| Total | 9,669 | 100.0% |
Ilchester Summary
I History
Ilchester, Maryland is a small unincorporated community located in Howard County, Maryland. It is situated along the Patapsco River, just south of the city of Ellicott City. The area was first settled in the late 1700s by German and English immigrants, and the town was officially established in 1837. The town was named after the nearby Ilchester Estate, which was owned by the Ellicott family.
The town of Ilchester was a small agricultural community for much of its history. The town was home to several mills, including a grist mill, a saw mill, and a paper mill. The paper mill was the largest employer in the town, and it provided jobs for many of the town’s residents.
In the late 19th century, the town began to grow and develop. The Baltimore and Ohio Railroad built a station in Ilchester in 1884, and the town became a popular stop for travelers. The town also became a popular destination for summer vacationers, who came to enjoy the area’s natural beauty.
In the early 20th century, the town began to decline. The paper mill closed in the 1920s, and the railroad station was closed in the 1940s. The town’s population began to decline, and by the 1950s, the town was mostly abandoned.
Today, Ilchester is a small, quiet community. The town is home to a few small businesses, including a post office, a gas station, and a few restaurants. The town is also home to a few historic sites, including the Ilchester Estate and the old railroad station.
II Geography
Ilchester is located in Howard County, Maryland, just south of the city of Ellicott City. The town is situated along the Patapsco River, and it is surrounded by rolling hills and forests. The town is located at an elevation of about 500 feet above sea level.
The climate in Ilchester is humid subtropical, with hot, humid summers and mild winters. The average annual temperature is around 60 degrees Fahrenheit, and the average annual precipitation is around 40 inches.
III Economy
The economy of Ilchester is largely based on tourism and small businesses. The town is home to a few small businesses, including a post office, a gas station, and a few restaurants. The town is also home to a few historic sites, which attract visitors from all over the region.
The town is also home to a few small farms, which produce a variety of crops, including corn, soybeans, and hay. The town is also home to a few wineries, which produce a variety of wines.
IV Demographics
As of the 2010 census, the population of Ilchester was 1,845. The racial makeup of the town was 94.3% White, 2.2% African American, 0.3% Native American, 0.7% Asian, 0.1% Pacific Islander, and 2.4% from other races. The median household income was $76,250, and the median family income was $87,500.
The town is home to a few churches, including the Ilchester United Methodist Church and the Ilchester Presbyterian Church. The town is also home to a few schools, including Ilchester Elementary School and Ilchester Middle School.
V Conclusion
Ilchester, Maryland is a small unincorporated community located in Howard County, Maryland. The town was first settled in the late 1700s, and it was officially established in 1837. The town was once a thriving agricultural community, but it has since declined. Today, the town is a quiet, peaceful community, and it is home to a few small businesses and historic sites. The town is also home to a few farms and wineries, which produce a variety of crops and wines. The town has a population of 1,845, and the median household income is $76,250.
Common Questions
What is Per Capita Income in Ilchester?
Per Capita income in Ilchester is $61,546.
What is the Median Family Income in Ilchester?
Median Family Income in Ilchester is $174,709.
What is the Median Household income in Ilchester?
Median Household Income in Ilchester is $150,417.
What is Income or Wage Gap in Ilchester?
Income or Wage Gap in Ilchester is 31.7%.
Women in Ilchester earn 68.3 cents for every dollar earned by a man.
What is Inequality or Gini Index in Ilchester?
Inequality or Gini Index in Ilchester is 0.39.
What is the Total Population of Ilchester?
Total Population of Ilchester is 27,300.
What is the Total Male Population of Ilchester?
Total Male Population of Ilchester is 13,722.
What is the Total Female Population of Ilchester?
Total Female Population of Ilchester is 13,578.
What is the Ratio of Males per 100 Females in Ilchester?
There are 101.06 Males per 100 Females in Ilchester.
What is the Ratio of Females per 100 Males in Ilchester?
There are 98.95 Females per 100 Males in Ilchester.
What is the Median Population Age in Ilchester?
Median Population Age in Ilchester is 36.3 Years.
What is the Average Family Size in Ilchester
Average Family Size in Ilchester is 3.3 People.
What is the Average Household Size in Ilchester
Average Household Size in Ilchester is 2.8 People.
How Large is the Labor Force in Ilchester?
There are 16,472 People in the Labor Forcein in Ilchester.
What is the Percentage of People in the Labor Force in Ilchester?
76.3% of People are in the Labor Force in Ilchester.
What is the Unemployment Rate in Ilchester?
Unemployment Rate in Ilchester is 3.0%.