North Laurel, MD Map & Demographics
North Laurel Map
North Laurel Overview
$53,598
PER CAPITA INCOME
$143,551
AVG FAMILY INCOME
$115,294
AVG HOUSEHOLD INCOME
8.7%
WAGE / INCOME GAP [ % ]
91.3¢/ $1
WAGE / INCOME GAP [ $ ]
0.39
INEQUALITY / GINI INDEX
24,414
TOTAL POPULATION
11,416
MALE POPULATION
12,998
FEMALE POPULATION
87.83
MALES / 100 FEMALES
113.86
FEMALES / 100 MALES
35.8
MEDIAN AGE
3.4
AVG FAMILY SIZE
2.8
AVG HOUSEHOLD SIZE
14,062
LABOR FORCE [ PEOPLE ]
74.4%
PERCENT IN LABOR FORCE
3.0%
UNEMPLOYMENT RATE
Income in North Laurel
Income Overview in North Laurel
Per Capita Income in North Laurel is $53,598, while median incomes of families and households are $143,551 and $115,294 respectively.
| Characteristic | Number | Measure |
| Per Capita Income | 24,414 | $53,598 |
| Median Family Income | 6,140 | $143,551 |
| Mean Family Income | 6,140 | $170,421 |
| Median Household Income | 8,656 | $115,294 |
| Mean Household Income | 8,656 | $147,962 |
| Income Deficit | 6,140 | $0 |
| Wage / Income Gap (%) | 24,414 | 8.68% |
| Wage / Income Gap ($) | 24,414 | 91.32¢ per $1 |
| Gini / Inequality Index | 24,414 | 0.39 |
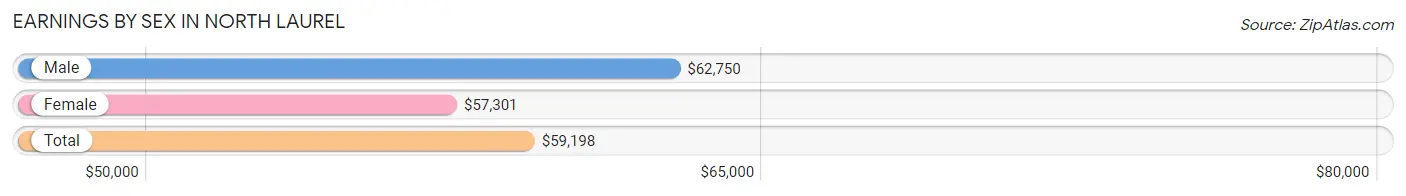
Earnings by Sex in North Laurel
Average Earnings in North Laurel are $59,198, $62,750 for men and $57,301 for women, a difference of 8.7%.
| Sex | Number | Average Earnings |
| Male | 7,070 (48.5%) | $62,750 |
| Female | 7,513 (51.5%) | $57,301 |
| Total | 14,583 (100.0%) | $59,198 |
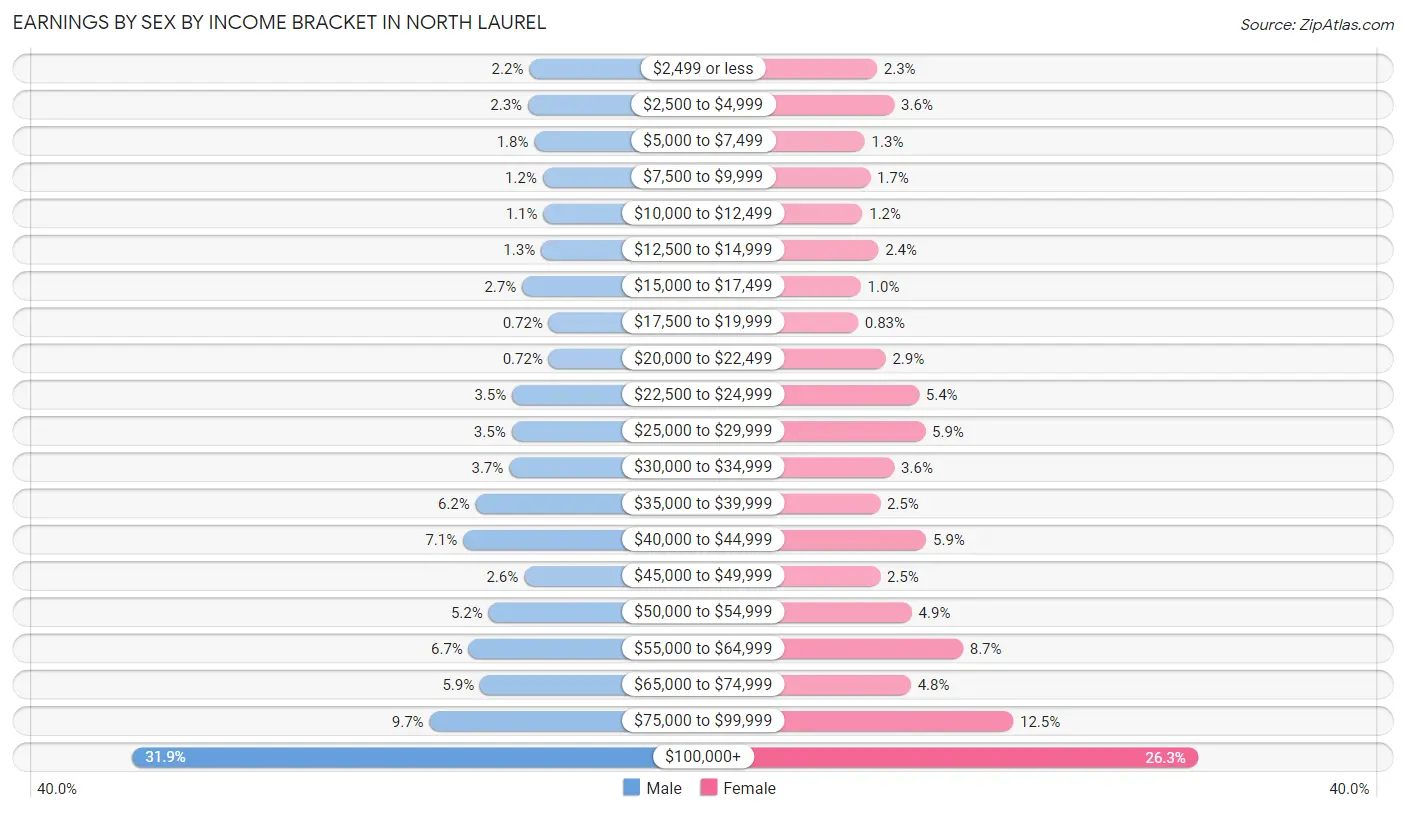
Earnings by Sex by Income Bracket in North Laurel
The most common earnings brackets in North Laurel are $100,000+ for men (2,257 | 31.9%) and $100,000+ for women (1,975 | 26.3%).
| Income | Male | Female |
| $2,499 or less | 154 (2.2%) | 169 (2.2%) |
| $2,500 to $4,999 | 161 (2.3%) | 267 (3.5%) |
| $5,000 to $7,499 | 127 (1.8%) | 101 (1.3%) |
| $7,500 to $9,999 | 83 (1.2%) | 131 (1.7%) |
| $10,000 to $12,499 | 80 (1.1%) | 87 (1.2%) |
| $12,500 to $14,999 | 92 (1.3%) | 177 (2.4%) |
| $15,000 to $17,499 | 192 (2.7%) | 78 (1.0%) |
| $17,500 to $19,999 | 51 (0.7%) | 62 (0.8%) |
| $20,000 to $22,499 | 51 (0.7%) | 218 (2.9%) |
| $22,500 to $24,999 | 245 (3.5%) | 406 (5.4%) |
| $25,000 to $29,999 | 248 (3.5%) | 441 (5.9%) |
| $30,000 to $34,999 | 261 (3.7%) | 267 (3.5%) |
| $35,000 to $39,999 | 438 (6.2%) | 187 (2.5%) |
| $40,000 to $44,999 | 505 (7.1%) | 446 (5.9%) |
| $45,000 to $49,999 | 182 (2.6%) | 187 (2.5%) |
| $50,000 to $54,999 | 370 (5.2%) | 365 (4.9%) |
| $55,000 to $64,999 | 475 (6.7%) | 653 (8.7%) |
| $65,000 to $74,999 | 415 (5.9%) | 360 (4.8%) |
| $75,000 to $99,999 | 683 (9.7%) | 936 (12.5%) |
| $100,000+ | 2,257 (31.9%) | 1,975 (26.3%) |
| Total | 7,070 (100.0%) | 7,513 (100.0%) |
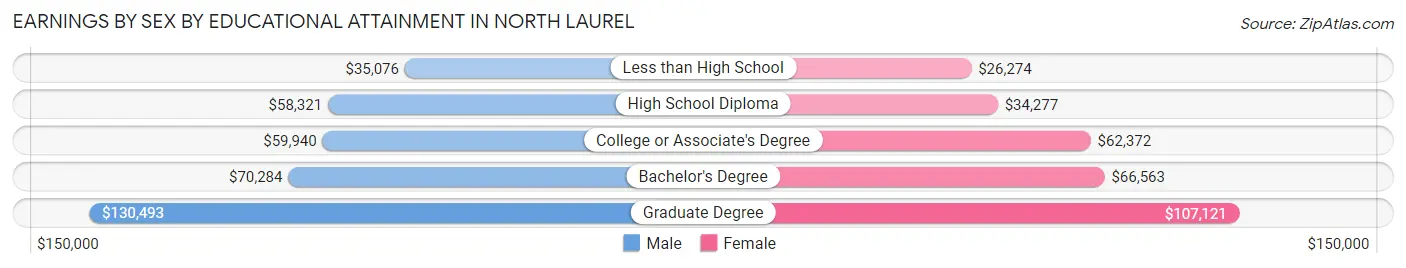
Earnings by Sex by Educational Attainment in North Laurel
Average earnings in North Laurel are $71,885 for men and $63,886 for women, a difference of 11.1%. Men with an educational attainment of graduate degree enjoy the highest average annual earnings of $130,493, while those with less than high school education earn the least with $35,076. Women with an educational attainment of graduate degree earn the most with the average annual earnings of $107,121, while those with less than high school education have the smallest earnings of $26,274.
| Educational Attainment | Male Income | Female Income |
| Less than High School | $35,076 | $26,274 |
| High School Diploma | $58,321 | $34,277 |
| College or Associate's Degree | $59,940 | $62,372 |
| Bachelor's Degree | $70,284 | $66,563 |
| Graduate Degree | $130,493 | $107,121 |
| Total | $71,885 | $63,886 |
Family Income in North Laurel
Family Income Brackets in North Laurel
According to the North Laurel family income data, there are 2,032 families falling into the $200,000+ income range, which is the most common income bracket and makes up 33.1% of all families. Conversely, the $10,000 to $14,999 income bracket is the least frequent group with only 18 families (0.3%) belonging to this category.
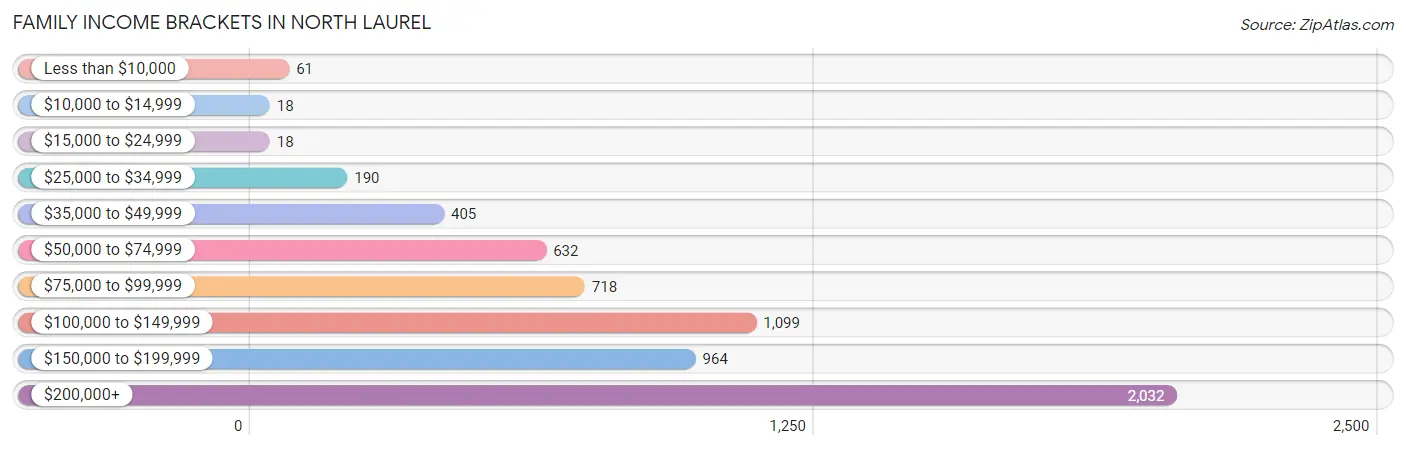
| Income Bracket | # Families | % Families |
| Less than $10,000 | 61 | 1.0% |
| $10,000 to $14,999 | 18 | 0.3% |
| $15,000 to $24,999 | 18 | 0.3% |
| $25,000 to $34,999 | 190 | 3.1% |
| $35,000 to $49,999 | 405 | 6.6% |
| $50,000 to $74,999 | 632 | 10.3% |
| $75,000 to $99,999 | 718 | 11.7% |
| $100,000 to $149,999 | 1,099 | 17.9% |
| $150,000 to $199,999 | 964 | 15.7% |
| $200,000+ | 2,032 | 33.1% |
Family Income by Famaliy Size in North Laurel
5-person families (523 | 8.5%) account for the highest median family income in North Laurel with $193,063 per family, while 2-person families (2,455 | 40.0%) have the highest median income of $54,977 per family member.
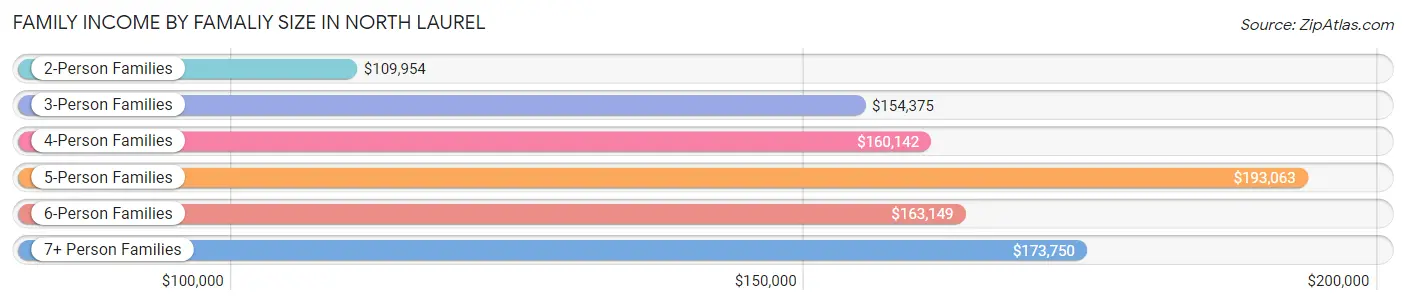
| Income Bracket | # Families | Median Income |
| 2-Person Families | 2,455 (40.0%) | $109,954 |
| 3-Person Families | 1,234 (20.1%) | $154,375 |
| 4-Person Families | 1,559 (25.4%) | $160,142 |
| 5-Person Families | 523 (8.5%) | $193,063 |
| 6-Person Families | 249 (4.1%) | $163,149 |
| 7+ Person Families | 120 (1.9%) | $173,750 |
| Total | 6,140 (100.0%) | $143,551 |
Family Income by Number of Earners in North Laurel
The median family income in North Laurel is $143,551, with families comprising 2 earners (3,299) having the highest median family income of $173,417, while families with no earners (282) have the lowest median family income of $67,333, accounting for 53.7% and 4.6% of families, respectively.
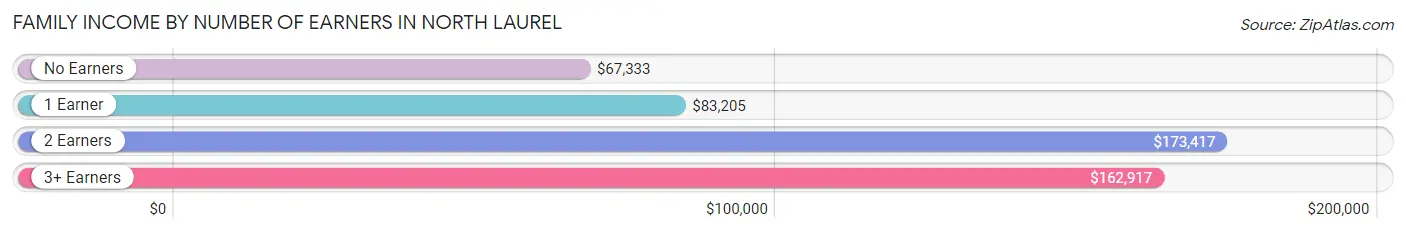
| Number of Earners | # Families | Median Income |
| No Earners | 282 (4.6%) | $67,333 |
| 1 Earner | 1,758 (28.6%) | $83,205 |
| 2 Earners | 3,299 (53.7%) | $173,417 |
| 3+ Earners | 801 (13.1%) | $162,917 |
| Total | 6,140 (100.0%) | $143,551 |
Household Income in North Laurel
Household Income Brackets in North Laurel
With 2,181 households falling in the category, the $200,000+ income range is the most frequent in North Laurel, accounting for 25.2% of all households. In contrast, only 43 households (0.5%) fall into the $10,000 to $14,999 income bracket, making it the least populous group.
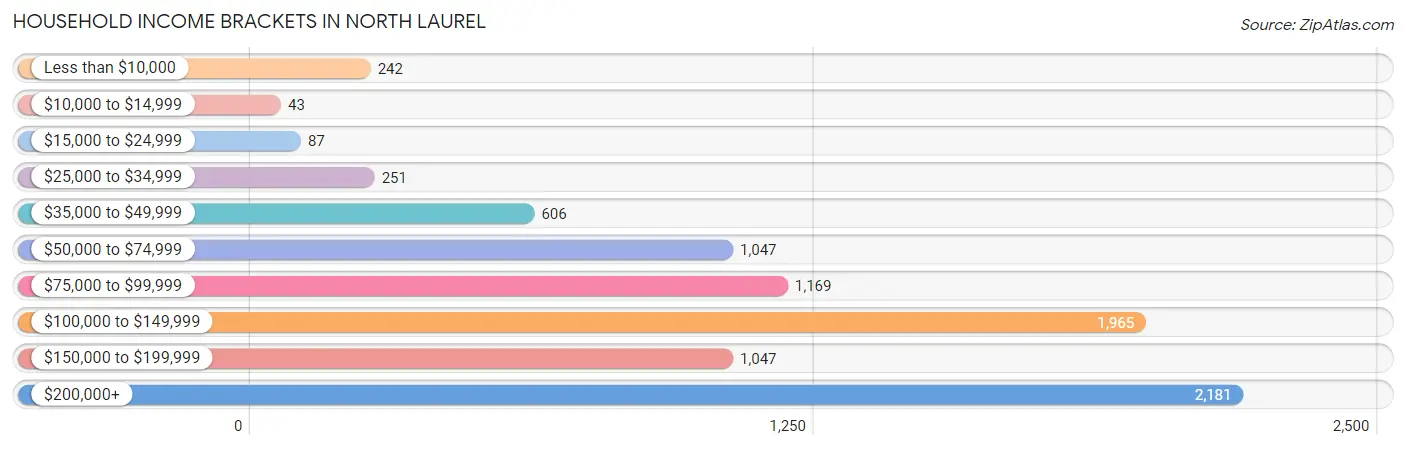
| Income Bracket | # Households | % Households |
| Less than $10,000 | 242 | 2.8% |
| $10,000 to $14,999 | 43 | 0.5% |
| $15,000 to $24,999 | 87 | 1.0% |
| $25,000 to $34,999 | 251 | 2.9% |
| $35,000 to $49,999 | 606 | 7.0% |
| $50,000 to $74,999 | 1,047 | 12.1% |
| $75,000 to $99,999 | 1,169 | 13.5% |
| $100,000 to $149,999 | 1,965 | 22.7% |
| $150,000 to $199,999 | 1,047 | 12.1% |
| $200,000+ | 2,181 | 25.2% |
Household Income by Householder Age in North Laurel
The median household income in North Laurel is $115,294, with the highest median household income of $142,500 found in the 45 to 64 years age bracket for the primary householder. A total of 3,486 households (40.3%) fall into this category. Meanwhile, the 15 to 24 years age bracket for the primary householder has the lowest median household income of $64,821, with 274 households (3.2%) in this group.
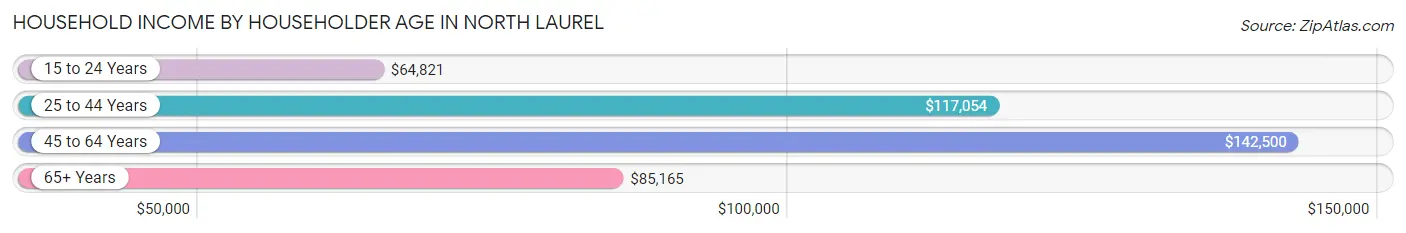
| Income Bracket | # Households | Median Income |
| 15 to 24 Years | 274 (3.2%) | $64,821 |
| 25 to 44 Years | 3,609 (41.7%) | $117,054 |
| 45 to 64 Years | 3,486 (40.3%) | $142,500 |
| 65+ Years | 1,287 (14.9%) | $85,165 |
| Total | 8,656 (100.0%) | $115,294 |
Poverty in North Laurel
Income Below Poverty by Sex and Age in North Laurel
With 2.2% poverty level for males and 3.4% for females among the residents of North Laurel, under 5 year old males and 18 to 24 year old females are the most vulnerable to poverty, with 57 males (6.0%) and 129 females (11.8%) in their respective age groups living below the poverty level.
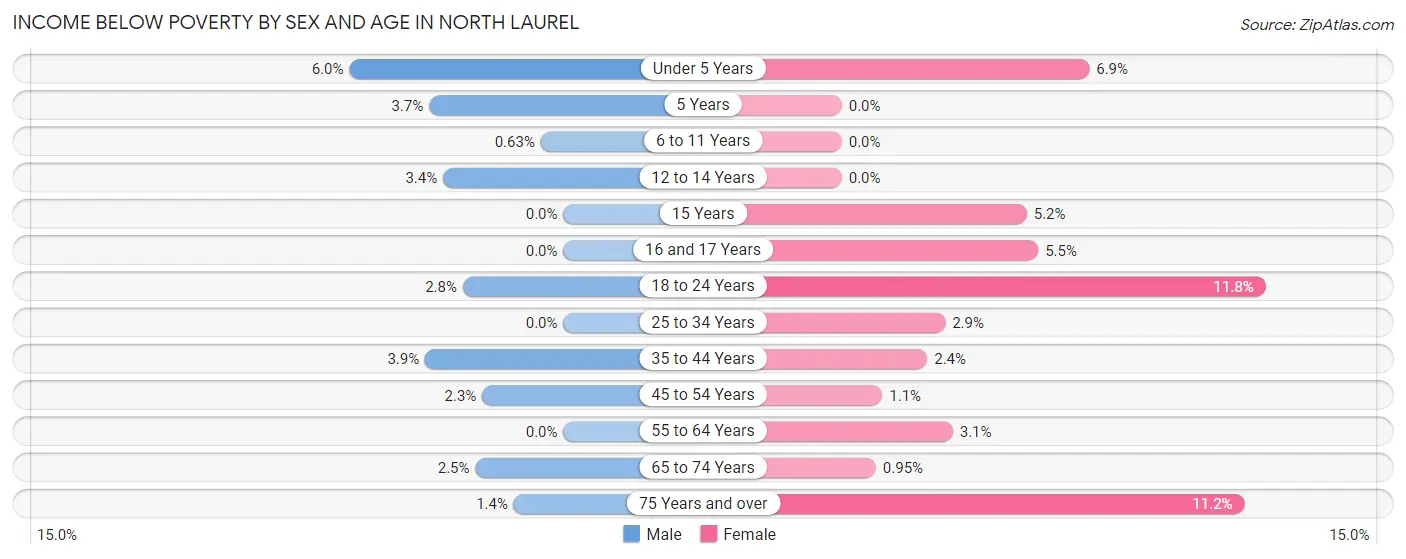
| Age Bracket | Male | Female |
| Under 5 Years | 57 (6.0%) | 64 (6.9%) |
| 5 Years | 4 (3.7%) | 0 (0.0%) |
| 6 to 11 Years | 6 (0.6%) | 0 (0.0%) |
| 12 to 14 Years | 16 (3.4%) | 0 (0.0%) |
| 15 Years | 0 (0.0%) | 14 (5.1%) |
| 16 and 17 Years | 0 (0.0%) | 14 (5.5%) |
| 18 to 24 Years | 30 (2.8%) | 129 (11.8%) |
| 25 to 34 Years | 0 (0.0%) | 55 (2.9%) |
| 35 to 44 Years | 76 (3.8%) | 49 (2.4%) |
| 45 to 54 Years | 33 (2.3%) | 20 (1.1%) |
| 55 to 64 Years | 0 (0.0%) | 52 (3.1%) |
| 65 to 74 Years | 19 (2.5%) | 10 (0.9%) |
| 75 Years and over | 5 (1.4%) | 38 (11.2%) |
| Total | 246 (2.2%) | 445 (3.4%) |
Income Above Poverty by Sex and Age in North Laurel
According to the poverty statistics in North Laurel, males aged 15 years and females aged 5 years are the age groups that are most secure financially, with 100.0% of males and 100.0% of females in these age groups living above the poverty line.
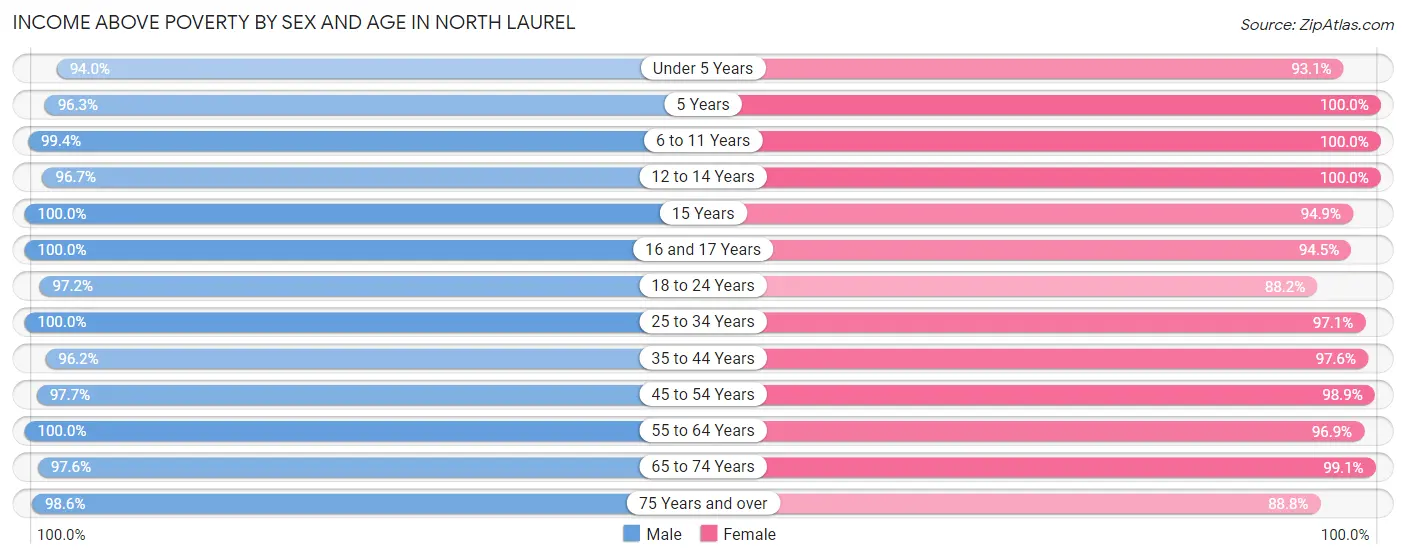
| Age Bracket | Male | Female |
| Under 5 Years | 899 (94.0%) | 865 (93.1%) |
| 5 Years | 103 (96.3%) | 140 (100.0%) |
| 6 to 11 Years | 946 (99.4%) | 991 (100.0%) |
| 12 to 14 Years | 462 (96.7%) | 497 (100.0%) |
| 15 Years | 170 (100.0%) | 258 (94.9%) |
| 16 and 17 Years | 326 (100.0%) | 242 (94.5%) |
| 18 to 24 Years | 1,040 (97.2%) | 964 (88.2%) |
| 25 to 34 Years | 1,584 (100.0%) | 1,852 (97.1%) |
| 35 to 44 Years | 1,896 (96.2%) | 2,007 (97.6%) |
| 45 to 54 Years | 1,428 (97.7%) | 1,751 (98.9%) |
| 55 to 64 Years | 1,188 (100.0%) | 1,632 (96.9%) |
| 65 to 74 Years | 756 (97.6%) | 1,047 (99.1%) |
| 75 Years and over | 357 (98.6%) | 301 (88.8%) |
| Total | 11,155 (97.8%) | 12,547 (96.6%) |
Income Below Poverty Among Married-Couple Families in North Laurel
The poverty statistics for married-couple families in North Laurel show that 0.8% or 35 of the total 4,561 families live below the poverty line. Families with 5 or more children have the highest poverty rate of 11.1%, comprising of 2 families. On the other hand, families with no children have the lowest poverty rate of 0.0%, which includes 0 families.
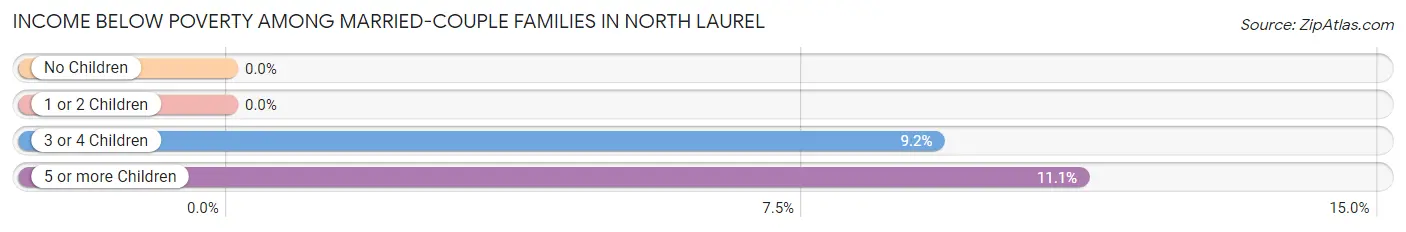
| Children | Above Poverty | Below Poverty |
| No Children | 2,318 (100.0%) | 0 (0.0%) |
| 1 or 2 Children | 1,867 (100.0%) | 0 (0.0%) |
| 3 or 4 Children | 325 (90.8%) | 33 (9.2%) |
| 5 or more Children | 16 (88.9%) | 2 (11.1%) |
| Total | 4,526 (99.2%) | 35 (0.8%) |
Income Below Poverty Among Single-Parent Households in North Laurel
According to the poverty data in North Laurel, 3.9% or 11 single-father households and 2.8% or 36 single-mother households are living below the poverty line. Among single-father households, those with 1 or 2 children have the highest poverty rate, with 11 households (15.1%) experiencing poverty. Likewise, among single-mother households, those with 1 or 2 children have the highest poverty rate, with 34 households (6.0%) falling below the poverty line.
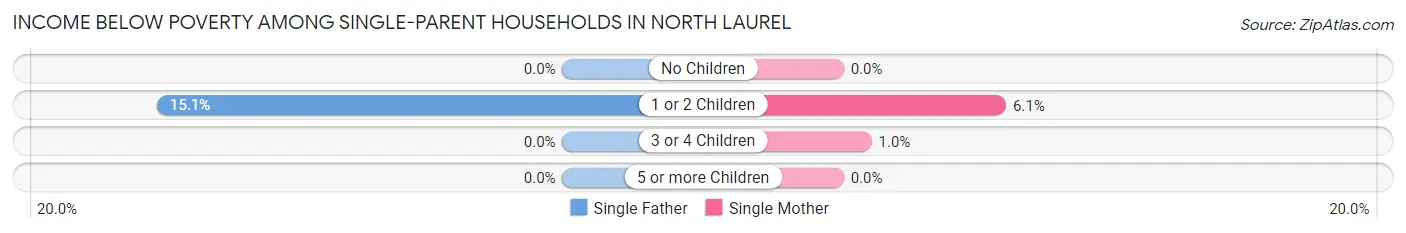
| Children | Single Father | Single Mother |
| No Children | 0 (0.0%) | 0 (0.0%) |
| 1 or 2 Children | 11 (15.1%) | 34 (6.0%) |
| 3 or 4 Children | 0 (0.0%) | 2 (1.0%) |
| 5 or more Children | 0 (0.0%) | 0 (0.0%) |
| Total | 11 (3.9%) | 36 (2.8%) |
Income Below Poverty Among Married-Couple vs Single-Parent Households in North Laurel
The poverty data for North Laurel shows that 35 of the married-couple family households (0.8%) and 47 of the single-parent households (3.0%) are living below the poverty level. Within the married-couple family households, those with 5 or more children have the highest poverty rate, with 2 households (11.1%) falling below the poverty line. Among the single-parent households, those with 1 or 2 children have the highest poverty rate, with 45 household (7.1%) living below poverty.
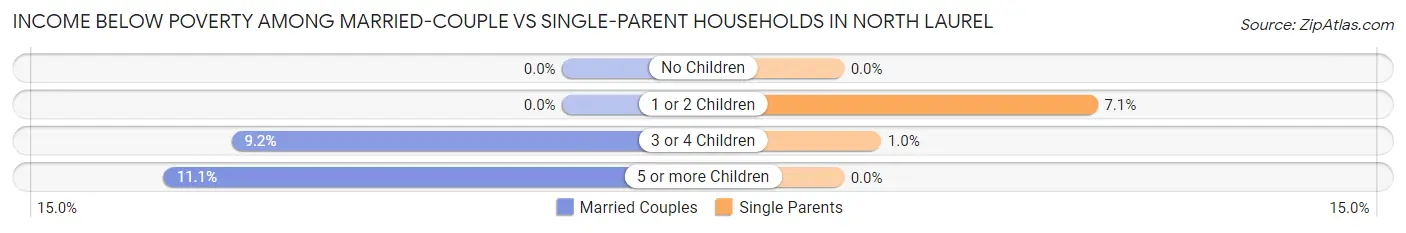
| Children | Married-Couple Families | Single-Parent Households |
| No Children | 0 (0.0%) | 0 (0.0%) |
| 1 or 2 Children | 0 (0.0%) | 45 (7.1%) |
| 3 or 4 Children | 33 (9.2%) | 2 (1.0%) |
| 5 or more Children | 2 (11.1%) | 0 (0.0%) |
| Total | 35 (0.8%) | 47 (3.0%) |
Race in North Laurel
The most populous races in North Laurel are Black / African American (9,188 | 37.6%), White / Caucasian (8,264 | 33.9%), and Asian (3,477 | 14.2%).
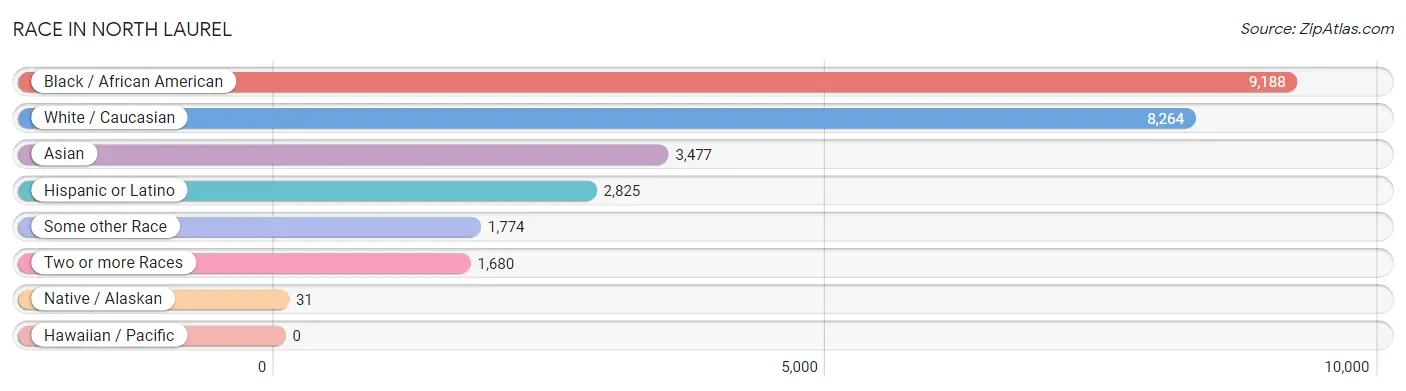
| Race | # Population | % Population |
| Asian | 3,477 | 14.2% |
| Black / African American | 9,188 | 37.6% |
| Hawaiian / Pacific | 0 | 0.0% |
| Hispanic or Latino | 2,825 | 11.6% |
| Native / Alaskan | 31 | 0.1% |
| White / Caucasian | 8,264 | 33.9% |
| Two or more Races | 1,680 | 6.9% |
| Some other Race | 1,774 | 7.3% |
| Total | 24,414 | 100.0% |
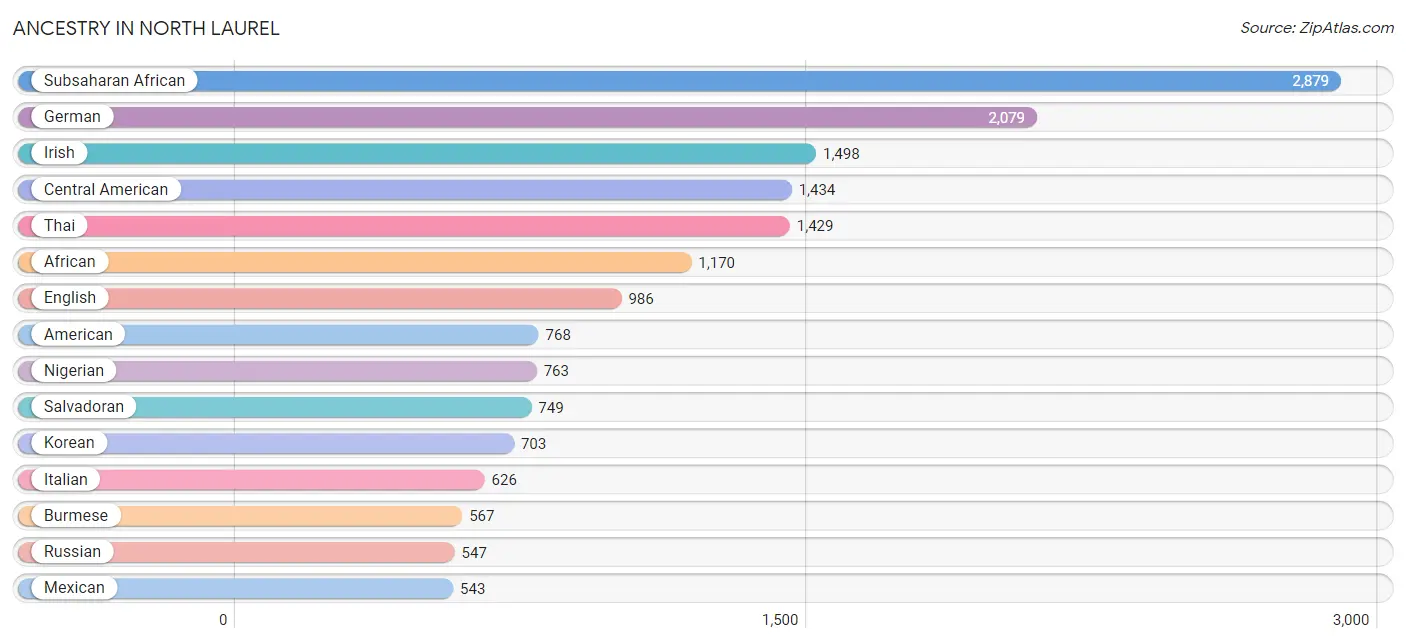
Ancestry in North Laurel
The most populous ancestries reported in North Laurel are Subsaharan African (2,879 | 11.8%), German (2,079 | 8.5%), Irish (1,498 | 6.1%), Central American (1,434 | 5.9%), and Thai (1,429 | 5.9%), together accounting for 38.2% of all North Laurel residents.
| Ancestry | # Population | % Population |
| Afghan | 27 | 0.1% |
| African | 1,170 | 4.8% |
| American | 768 | 3.2% |
| Arab | 538 | 2.2% |
| Australian | 55 | 0.2% |
| Austrian | 73 | 0.3% |
| Barbadian | 15 | 0.1% |
| Brazilian | 284 | 1.2% |
| British | 46 | 0.2% |
| Burmese | 567 | 2.3% |
| Central American | 1,434 | 5.9% |
| Central American Indian | 14 | 0.1% |
| Cherokee | 64 | 0.3% |
| Chilean | 2 | 0.0% |
| Colombian | 116 | 0.5% |
| Croatian | 56 | 0.2% |
| Cuban | 26 | 0.1% |
| Czech | 39 | 0.2% |
| Dominican | 197 | 0.8% |
| Dutch | 103 | 0.4% |
| Eastern European | 169 | 0.7% |
| Ecuadorian | 39 | 0.2% |
| Egyptian | 64 | 0.3% |
| English | 986 | 4.0% |
| Ethiopian | 318 | 1.3% |
| European | 275 | 1.1% |
| Filipino | 29 | 0.1% |
| Finnish | 26 | 0.1% |
| French | 142 | 0.6% |
| French Canadian | 66 | 0.3% |
| German | 2,079 | 8.5% |
| Ghanaian | 167 | 0.7% |
| Guatemalan | 540 | 2.2% |
| Guyanese | 96 | 0.4% |
| Haitian | 106 | 0.4% |
| Honduran | 128 | 0.5% |
| Hungarian | 33 | 0.1% |
| Indian (Asian) | 365 | 1.5% |
| Indonesian | 198 | 0.8% |
| Iranian | 110 | 0.4% |
| Irish | 1,498 | 6.1% |
| Iroquois | 13 | 0.1% |
| Italian | 626 | 2.6% |
| Jamaican | 287 | 1.2% |
| Jordanian | 201 | 0.8% |
| Kenyan | 16 | 0.1% |
| Korean | 703 | 2.9% |
| Laotian | 76 | 0.3% |
| Lebanese | 117 | 0.5% |
| Liberian | 56 | 0.2% |
| Lithuanian | 71 | 0.3% |
| Mexican | 543 | 2.2% |
| Navajo | 17 | 0.1% |
| Nicaraguan | 3 | 0.0% |
| Nigerian | 763 | 3.1% |
| Northern European | 27 | 0.1% |
| Norwegian | 61 | 0.3% |
| Pakistani | 63 | 0.3% |
| Palestinian | 192 | 0.8% |
| Panamanian | 14 | 0.1% |
| Paraguayan | 59 | 0.2% |
| Pennsylvania German | 15 | 0.1% |
| Peruvian | 44 | 0.2% |
| Polish | 342 | 1.4% |
| Portuguese | 22 | 0.1% |
| Puerto Rican | 312 | 1.3% |
| Romanian | 44 | 0.2% |
| Russian | 547 | 2.2% |
| Salvadoran | 749 | 3.1% |
| Scandinavian | 78 | 0.3% |
| Scotch-Irish | 56 | 0.2% |
| Scottish | 186 | 0.8% |
| Sierra Leonean | 142 | 0.6% |
| Slovak | 13 | 0.1% |
| South African | 61 | 0.3% |
| South American | 264 | 1.1% |
| South American Indian | 63 | 0.3% |
| Sri Lankan | 154 | 0.6% |
| Subsaharan African | 2,879 | 11.8% |
| Sudanese | 24 | 0.1% |
| Swedish | 216 | 0.9% |
| Syrian | 24 | 0.1% |
| Thai | 1,429 | 5.9% |
| Ukrainian | 27 | 0.1% |
| Welsh | 12 | 0.1% |
| West Indian | 38 | 0.2% | View All 86 Rows |
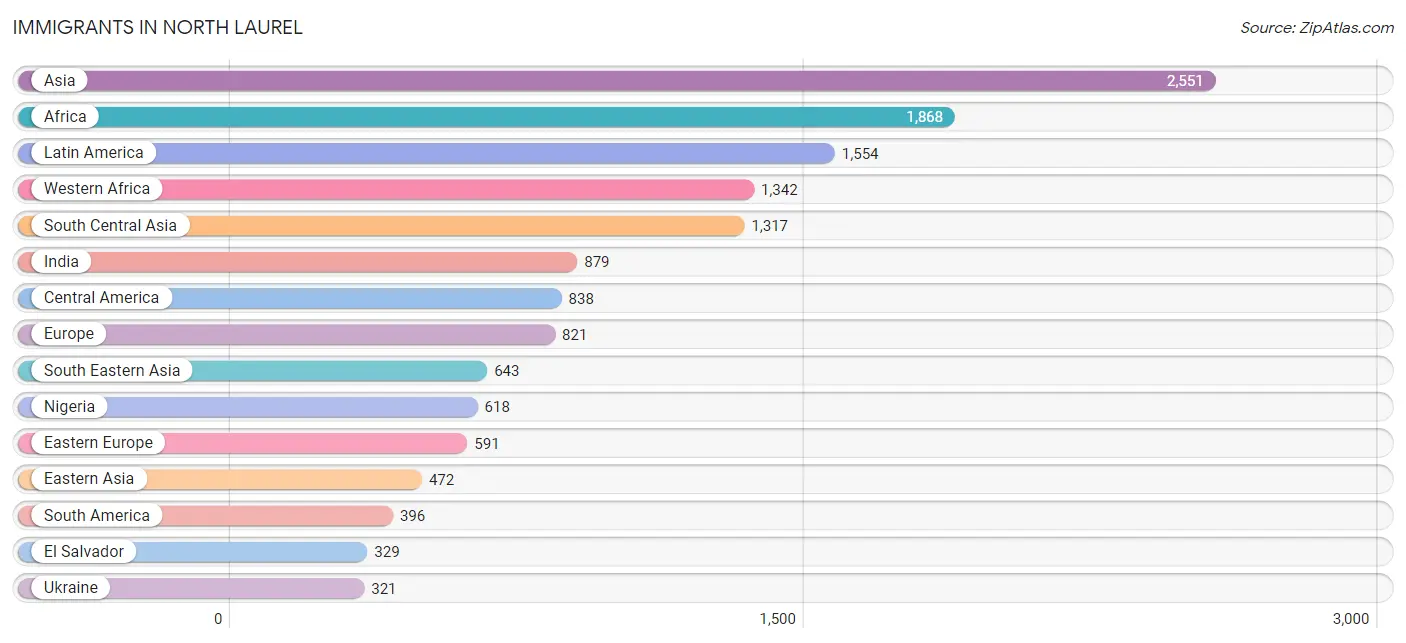
Immigrants in North Laurel
The most numerous immigrant groups reported in North Laurel came from Asia (2,551 | 10.4%), Africa (1,868 | 7.6%), Latin America (1,554 | 6.4%), Western Africa (1,342 | 5.5%), and South Central Asia (1,317 | 5.4%), together accounting for 35.4% of all North Laurel residents.
| Immigration Origin | # Population | % Population |
| Africa | 1,868 | 7.6% |
| Asia | 2,551 | 10.4% |
| Australia | 18 | 0.1% |
| Belarus | 29 | 0.1% |
| Brazil | 223 | 0.9% |
| Cameroon | 54 | 0.2% |
| Canada | 70 | 0.3% |
| Caribbean | 320 | 1.3% |
| Central America | 838 | 3.4% |
| China | 215 | 0.9% |
| Colombia | 14 | 0.1% |
| Dominica | 17 | 0.1% |
| Dominican Republic | 118 | 0.5% |
| Eastern Africa | 191 | 0.8% |
| Eastern Asia | 472 | 1.9% |
| Eastern Europe | 591 | 2.4% |
| Ecuador | 39 | 0.2% |
| Egypt | 74 | 0.3% |
| El Salvador | 329 | 1.3% |
| Ethiopia | 154 | 0.6% |
| Europe | 821 | 3.4% |
| Fiji | 19 | 0.1% |
| Germany | 139 | 0.6% |
| Ghana | 313 | 1.3% |
| Guatemala | 290 | 1.2% |
| Guyana | 37 | 0.2% |
| Haiti | 26 | 0.1% |
| Honduras | 80 | 0.3% |
| Hong Kong | 41 | 0.2% |
| Hungary | 18 | 0.1% |
| India | 879 | 3.6% |
| Indonesia | 25 | 0.1% |
| Iran | 110 | 0.4% |
| Italy | 29 | 0.1% |
| Jamaica | 111 | 0.4% |
| Jordan | 61 | 0.3% |
| Kenya | 17 | 0.1% |
| Korea | 257 | 1.1% |
| Latin America | 1,554 | 6.4% |
| Liberia | 221 | 0.9% |
| Lithuania | 28 | 0.1% |
| Mexico | 125 | 0.5% |
| Middle Africa | 54 | 0.2% |
| Moldova | 13 | 0.1% |
| Morocco | 20 | 0.1% |
| Nepal | 70 | 0.3% |
| Nigeria | 618 | 2.5% |
| Northern Africa | 235 | 1.0% |
| Northern Europe | 62 | 0.3% |
| Norway | 17 | 0.1% |
| Oceania | 37 | 0.2% |
| Pakistan | 224 | 0.9% |
| Panama | 14 | 0.1% |
| Peru | 24 | 0.1% |
| Philippines | 308 | 1.3% |
| Romania | 22 | 0.1% |
| Russia | 160 | 0.7% |
| Saudi Arabia | 15 | 0.1% |
| Sierra Leone | 190 | 0.8% |
| Somalia | 20 | 0.1% |
| South Africa | 24 | 0.1% |
| South America | 396 | 1.6% |
| South Central Asia | 1,317 | 5.4% |
| South Eastern Asia | 643 | 2.6% |
| Southern Europe | 29 | 0.1% |
| Sudan | 141 | 0.6% |
| Sweden | 45 | 0.2% |
| Syria | 24 | 0.1% |
| Taiwan | 29 | 0.1% |
| Thailand | 37 | 0.2% |
| Trinidad and Tobago | 30 | 0.1% |
| Ukraine | 321 | 1.3% |
| Uzbekistan | 34 | 0.1% |
| Vietnam | 107 | 0.4% |
| West Indies | 18 | 0.1% |
| Western Africa | 1,342 | 5.5% |
| Western Asia | 100 | 0.4% |
| Western Europe | 139 | 0.6% | View All 78 Rows |
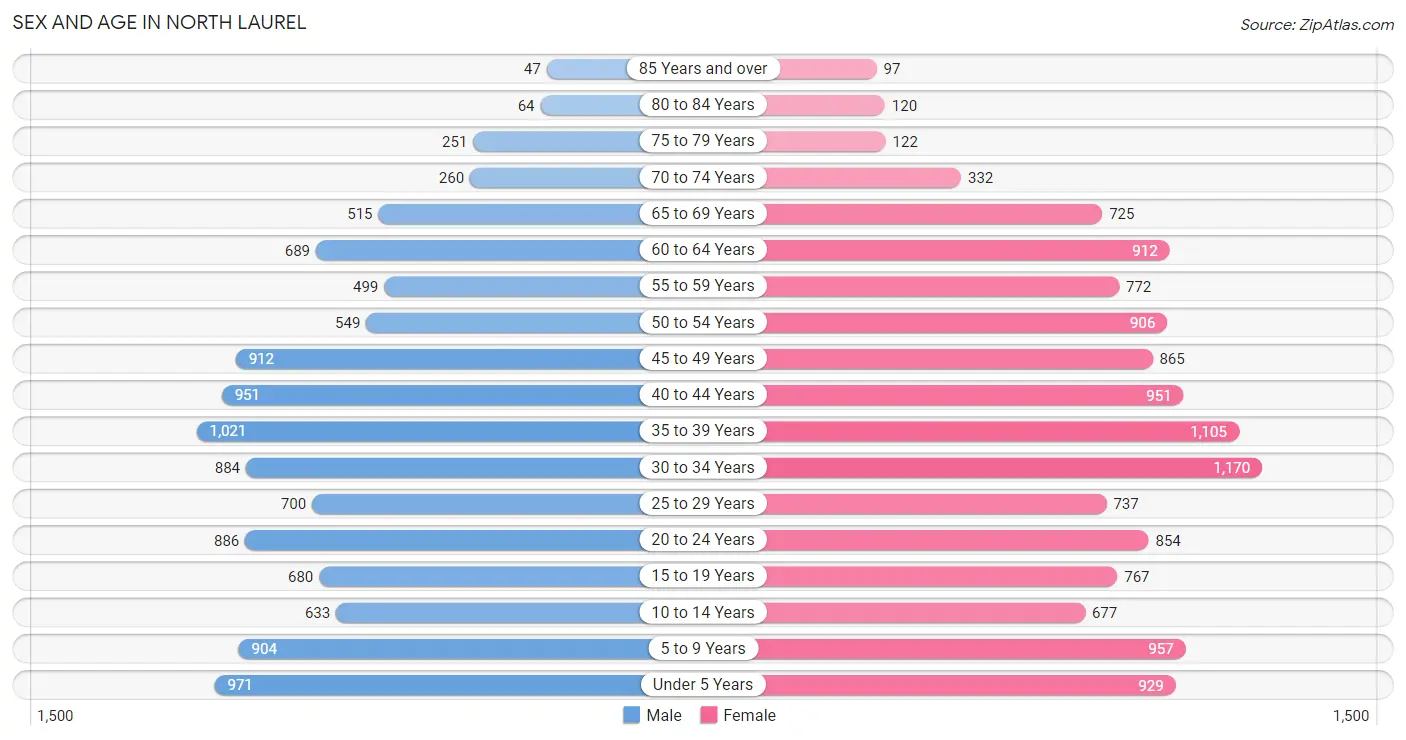
Sex and Age in North Laurel
Sex and Age in North Laurel
The most populous age groups in North Laurel are 35 to 39 Years (1,021 | 8.9%) for men and 30 to 34 Years (1,170 | 9.0%) for women.
| Age Bracket | Male | Female |
| Under 5 Years | 971 (8.5%) | 929 (7.1%) |
| 5 to 9 Years | 904 (7.9%) | 957 (7.4%) |
| 10 to 14 Years | 633 (5.5%) | 677 (5.2%) |
| 15 to 19 Years | 680 (6.0%) | 767 (5.9%) |
| 20 to 24 Years | 886 (7.8%) | 854 (6.6%) |
| 25 to 29 Years | 700 (6.1%) | 737 (5.7%) |
| 30 to 34 Years | 884 (7.7%) | 1,170 (9.0%) |
| 35 to 39 Years | 1,021 (8.9%) | 1,105 (8.5%) |
| 40 to 44 Years | 951 (8.3%) | 951 (7.3%) |
| 45 to 49 Years | 912 (8.0%) | 865 (6.7%) |
| 50 to 54 Years | 549 (4.8%) | 906 (7.0%) |
| 55 to 59 Years | 499 (4.4%) | 772 (5.9%) |
| 60 to 64 Years | 689 (6.0%) | 912 (7.0%) |
| 65 to 69 Years | 515 (4.5%) | 725 (5.6%) |
| 70 to 74 Years | 260 (2.3%) | 332 (2.5%) |
| 75 to 79 Years | 251 (2.2%) | 122 (0.9%) |
| 80 to 84 Years | 64 (0.6%) | 120 (0.9%) |
| 85 Years and over | 47 (0.4%) | 97 (0.7%) |
| Total | 11,416 (100.0%) | 12,998 (100.0%) |
Families and Households in North Laurel
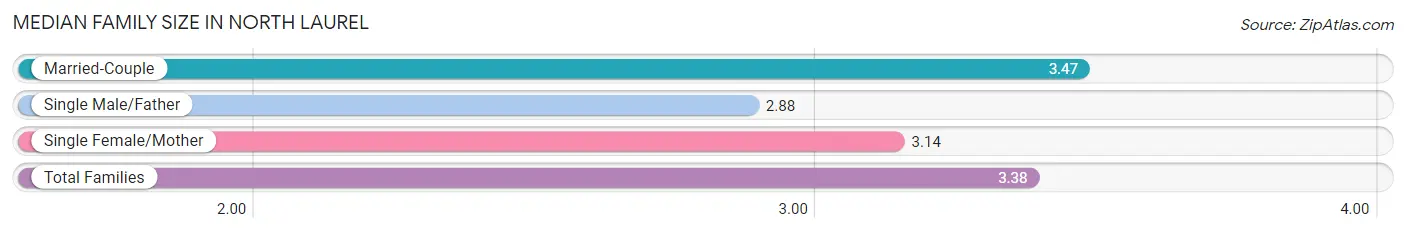
Median Family Size in North Laurel
The median family size in North Laurel is 3.38 persons per family, with married-couple families (4,561 | 74.3%) accounting for the largest median family size of 3.47 persons per family. On the other hand, single male/father families (282 | 4.6%) represent the smallest median family size with 2.88 persons per family.
| Family Type | # Families | Family Size |
| Married-Couple | 4,561 (74.3%) | 3.47 |
| Single Male/Father | 282 (4.6%) | 2.88 |
| Single Female/Mother | 1,297 (21.1%) | 3.14 |
| Total Families | 6,140 (100.0%) | 3.38 |
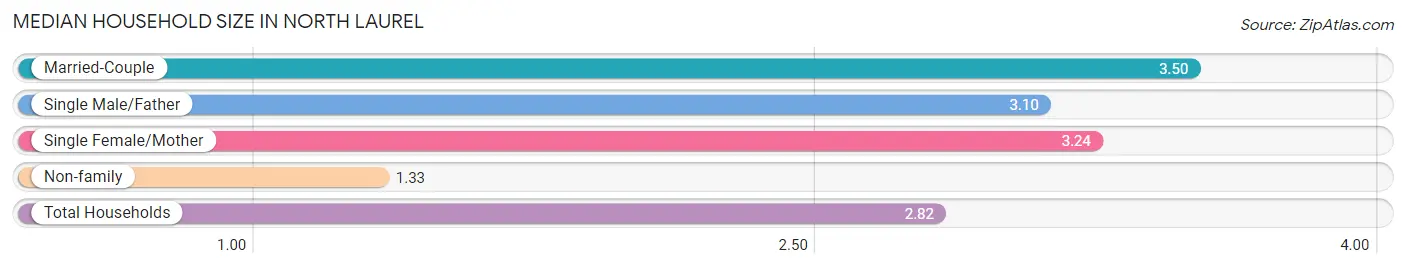
Median Household Size in North Laurel
The median household size in North Laurel is 2.82 persons per household, with married-couple households (4,561 | 52.7%) accounting for the largest median household size of 3.5 persons per household. non-family households (2,516 | 29.1%) represent the smallest median household size with 1.33 persons per household.
| Household Type | # Households | Household Size |
| Married-Couple | 4,561 (52.7%) | 3.50 |
| Single Male/Father | 282 (3.3%) | 3.10 |
| Single Female/Mother | 1,297 (15.0%) | 3.24 |
| Non-family | 2,516 (29.1%) | 1.33 |
| Total Households | 8,656 (100.0%) | 2.82 |
Household Size by Marriage Status in North Laurel
Out of a total of 8,656 households in North Laurel, 6,140 (70.9%) are family households, while 2,516 (29.1%) are nonfamily households. The most numerous type of family households are 2-person households, comprising 2,315, and the most common type of nonfamily households are 1-person households, comprising 1,725.
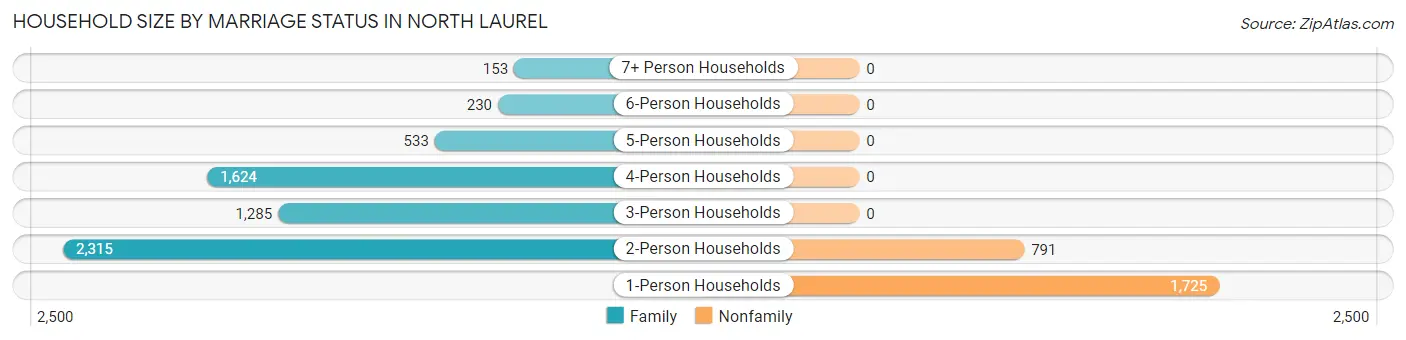
| Household Size | Family Households | Nonfamily Households |
| 1-Person Households | - | 1,725 (19.9%) |
| 2-Person Households | 2,315 (26.7%) | 791 (9.1%) |
| 3-Person Households | 1,285 (14.8%) | 0 (0.0%) |
| 4-Person Households | 1,624 (18.8%) | 0 (0.0%) |
| 5-Person Households | 533 (6.2%) | 0 (0.0%) |
| 6-Person Households | 230 (2.7%) | 0 (0.0%) |
| 7+ Person Households | 153 (1.8%) | 0 (0.0%) |
| Total | 6,140 (70.9%) | 2,516 (29.1%) |
Female Fertility in North Laurel
Fertility by Age in North Laurel
Average fertility rate in North Laurel is 42.0 births per 1,000 women. Women in the age bracket of 20 to 34 years have the highest fertility rate with 54.0 births per 1,000 women. Women in the age bracket of 20 to 34 years acount for 53.2% of all women with births.
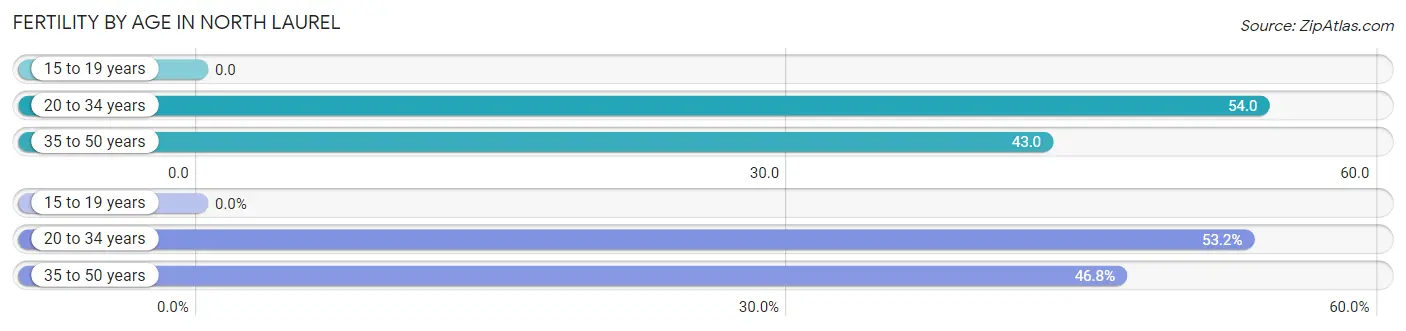
| Age Bracket | Women with Births | Births / 1,000 Women |
| 15 to 19 years | 0 (0.0%) | 0.0 |
| 20 to 34 years | 148 (53.2%) | 54.0 |
| 35 to 50 years | 130 (46.8%) | 43.0 |
| Total | 278 (100.0%) | 42.0 |
Fertility by Age by Marriage Status in North Laurel
90.3% of women with births (278) in North Laurel are married. The highest percentage of unmarried women with births falls into 20 to 34 years age bracket with 18.2% of them unmarried at the time of birth, while the lowest percentage of unmarried women with births belong to 35 to 50 years age bracket with 0.0% of them unmarried.
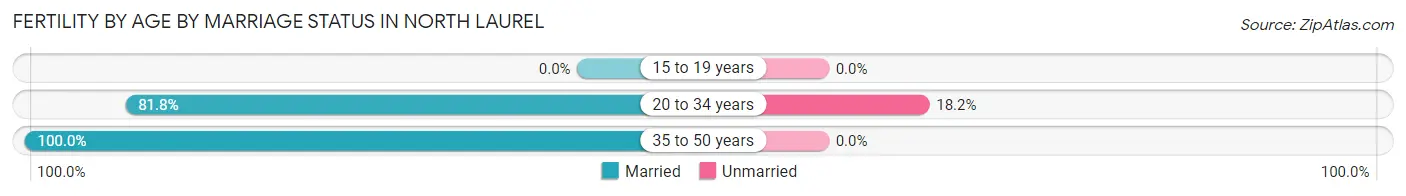
| Age Bracket | Married | Unmarried |
| 15 to 19 years | 0 (0.0%) | 0 (0.0%) |
| 20 to 34 years | 121 (81.8%) | 27 (18.2%) |
| 35 to 50 years | 130 (100.0%) | 0 (0.0%) |
| Total | 251 (90.3%) | 27 (9.7%) |
Fertility by Education in North Laurel
Average fertility rate in North Laurel is 42.0 births per 1,000 women. Women with the education attainment of bachelor's degree have the highest fertility rate of 55.0 births per 1,000 women, while women with the education attainment of less than high school have the lowest fertility at 11.0 births per 1,000 women. Women with the education attainment of bachelor's degree represent 45.7% of all women with births.
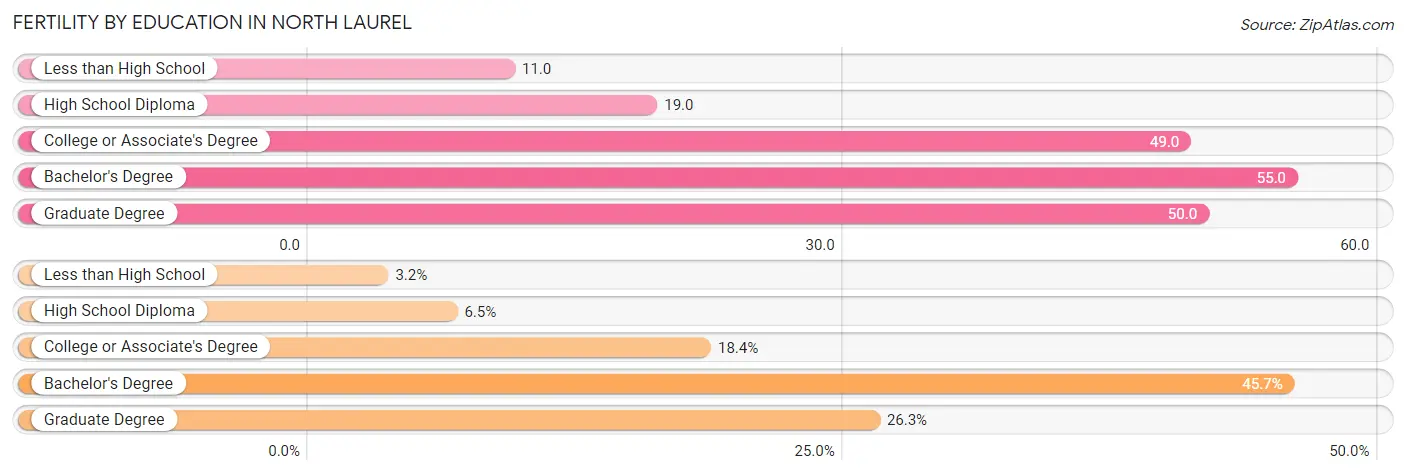
| Educational Attainment | Women with Births | Births / 1,000 Women |
| Less than High School | 9 (3.2%) | 11.0 |
| High School Diploma | 18 (6.5%) | 19.0 |
| College or Associate's Degree | 51 (18.3%) | 49.0 |
| Bachelor's Degree | 127 (45.7%) | 55.0 |
| Graduate Degree | 73 (26.3%) | 50.0 |
| Total | 278 (100.0%) | 42.0 |
Fertility by Education by Marriage Status in North Laurel
9.7% of women with births in North Laurel are unmarried. Women with the educational attainment of college or associate's degree are most likely to be married with 100.0% of them married at childbirth, while women with the educational attainment of less than high school are least likely to be married with 100.0% of them unmarried at childbirth.
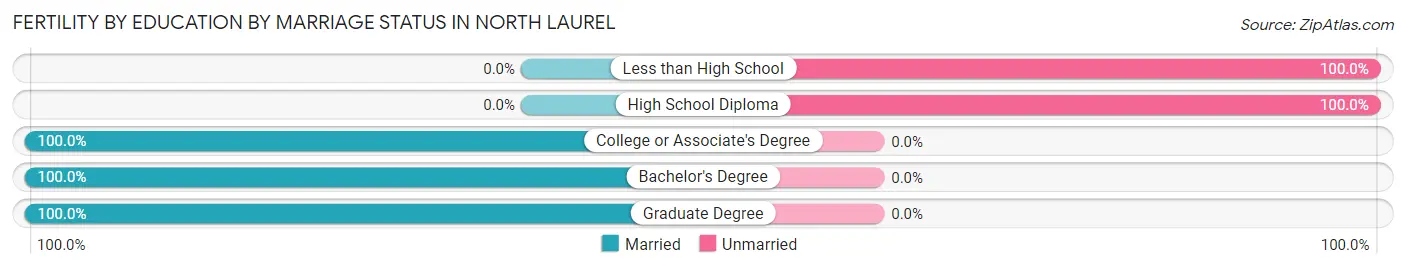
| Educational Attainment | Married | Unmarried |
| Less than High School | 0 (0.0%) | 9 (100.0%) |
| High School Diploma | 0 (0.0%) | 18 (100.0%) |
| College or Associate's Degree | 51 (100.0%) | 0 (0.0%) |
| Bachelor's Degree | 127 (100.0%) | 0 (0.0%) |
| Graduate Degree | 73 (100.0%) | 0 (0.0%) |
| Total | 251 (90.3%) | 27 (9.7%) |
Employment Characteristics in North Laurel
Employment by Class of Employer in North Laurel
Among the 13,356 employed individuals in North Laurel, private company employees (7,053 | 52.8%), federal government employees (2,124 | 15.9%), and not-for-profit organizations (1,633 | 12.2%) make up the most common classes of employment.
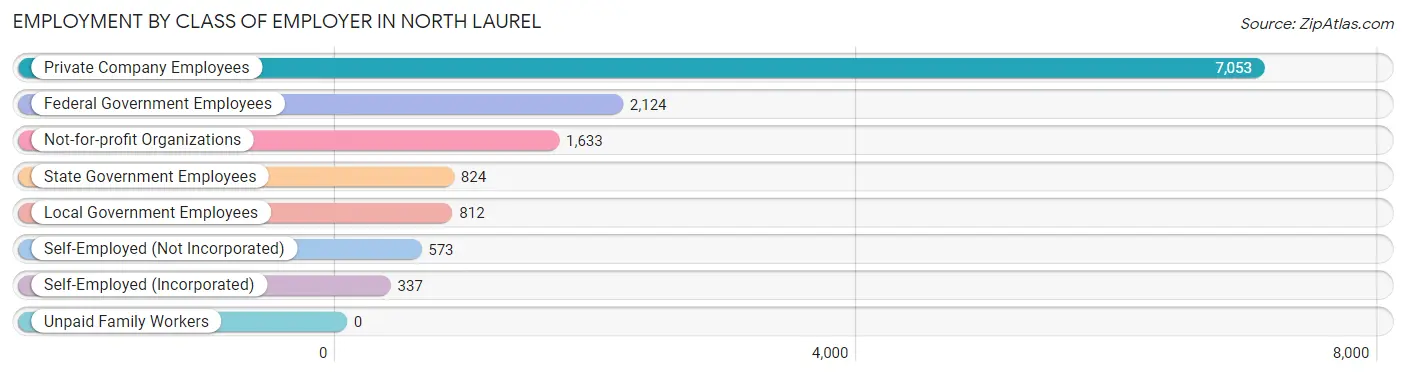
| Employer Class | # Employees | % Employees |
| Private Company Employees | 7,053 | 52.8% |
| Self-Employed (Incorporated) | 337 | 2.5% |
| Self-Employed (Not Incorporated) | 573 | 4.3% |
| Not-for-profit Organizations | 1,633 | 12.2% |
| Local Government Employees | 812 | 6.1% |
| State Government Employees | 824 | 6.2% |
| Federal Government Employees | 2,124 | 15.9% |
| Unpaid Family Workers | 0 | 0.0% |
| Total | 13,356 | 100.0% |
Employment Status by Age in North Laurel
According to the labor force statistics for North Laurel, out of the total population over 16 years of age (18,901), 74.4% or 14,062 individuals are in the labor force, with 3.0% or 422 of them unemployed. The age group with the highest labor force participation rate is 45 to 54 years, with 91.4% or 2,954 individuals in the labor force. Within the labor force, the 16 to 19 years age range has the highest percentage of unemployed individuals, with 26.2% or 39 of them being unemployed.
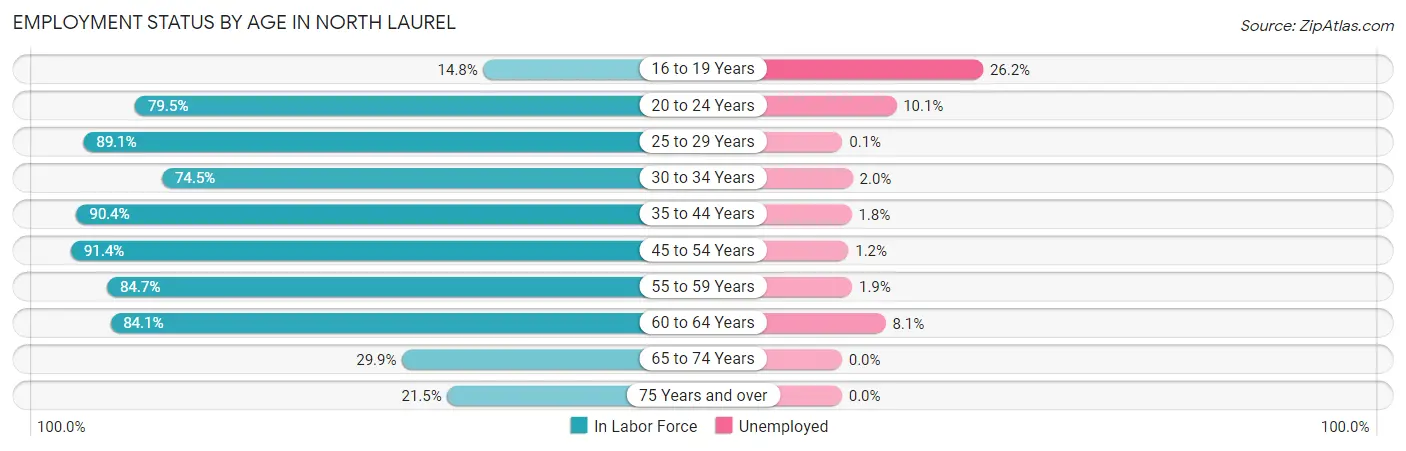
| Age Bracket | In Labor Force | Unemployed |
| 16 to 19 Years | 149 (14.8%) | 39 (26.2%) |
| 20 to 24 Years | 1,383 (79.5%) | 140 (10.1%) |
| 25 to 29 Years | 1,280 (89.1%) | 1 (0.1%) |
| 30 to 34 Years | 1,530 (74.5%) | 31 (2.0%) |
| 35 to 44 Years | 3,641 (90.4%) | 66 (1.8%) |
| 45 to 54 Years | 2,954 (91.4%) | 35 (1.2%) |
| 55 to 59 Years | 1,077 (84.7%) | 20 (1.9%) |
| 60 to 64 Years | 1,346 (84.1%) | 109 (8.1%) |
| 65 to 74 Years | 548 (29.9%) | 0 (0.0%) |
| 75 Years and over | 151 (21.5%) | 0 (0.0%) |
| Total | 14,062 (74.4%) | 422 (3.0%) |
Employment Status by Educational Attainment in North Laurel
According to labor force statistics for North Laurel, 86.8% of individuals (11,825) out of the total population between 25 and 64 years of age (13,623) are in the labor force, with 2.2% or 260 of them being unemployed. The group with the highest labor force participation rate are those with the educational attainment of bachelor's degree or higher, with 89.7% or 7,357 individuals in the labor force. Within the labor force, individuals with college / associate degree education have the highest percentage of unemployment, with 4.6% or 105 of them being unemployed.
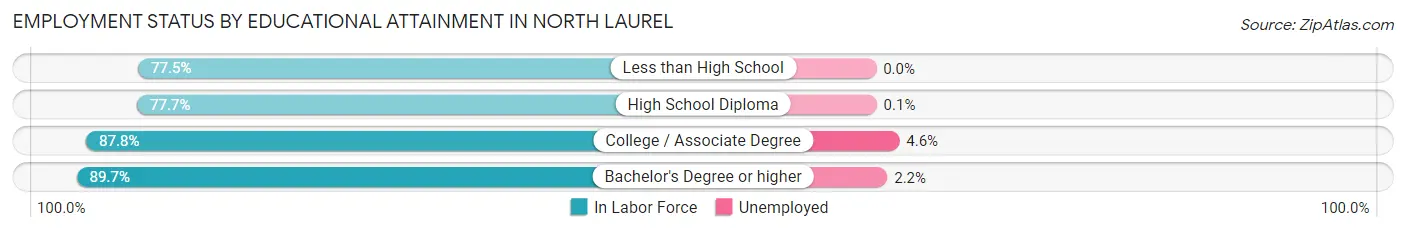
| Educational Attainment | In Labor Force | Unemployed |
| Less than High School | 621 (77.5%) | 0 (0.0%) |
| High School Diploma | 1,573 (77.7%) | 2 (0.1%) |
| College / Associate Degree | 2,278 (87.8%) | 119 (4.6%) |
| Bachelor's Degree or higher | 7,357 (89.7%) | 180 (2.2%) |
| Total | 11,825 (86.8%) | 300 (2.2%) |
Employment Occupations by Sex in North Laurel
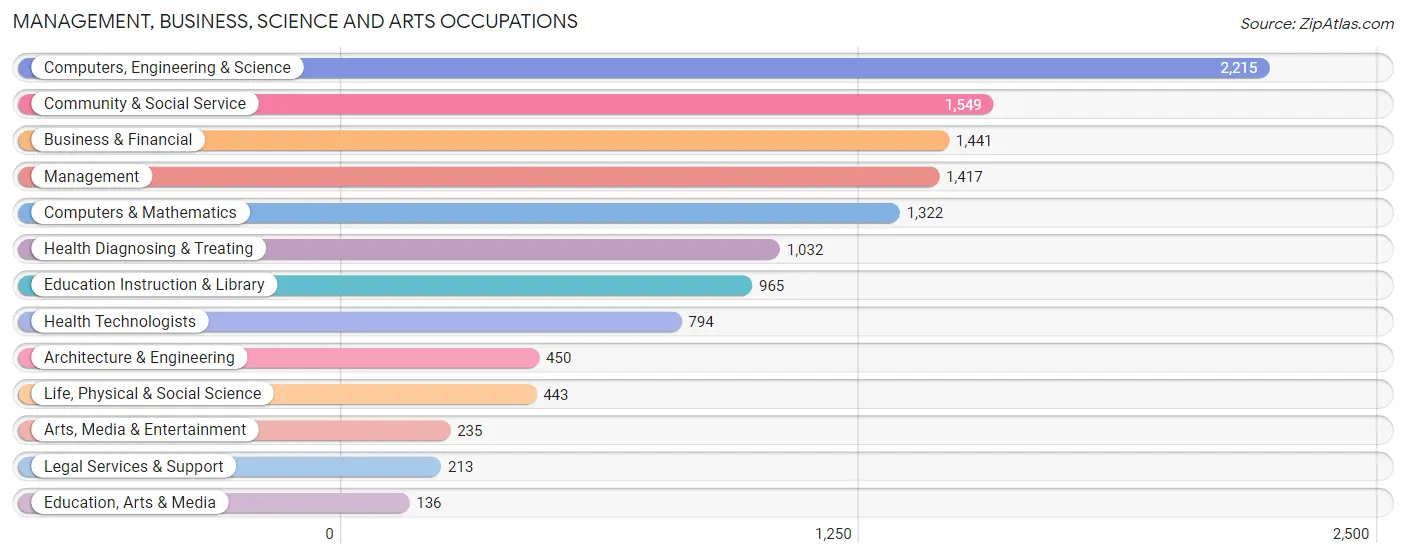
Management, Business, Science and Arts Occupations
The most common Management, Business, Science and Arts occupations in North Laurel are Computers, Engineering & Science (2,215 | 16.7%), Community & Social Service (1,549 | 11.7%), Business & Financial (1,441 | 10.9%), Management (1,417 | 10.7%), and Computers & Mathematics (1,322 | 10.0%).
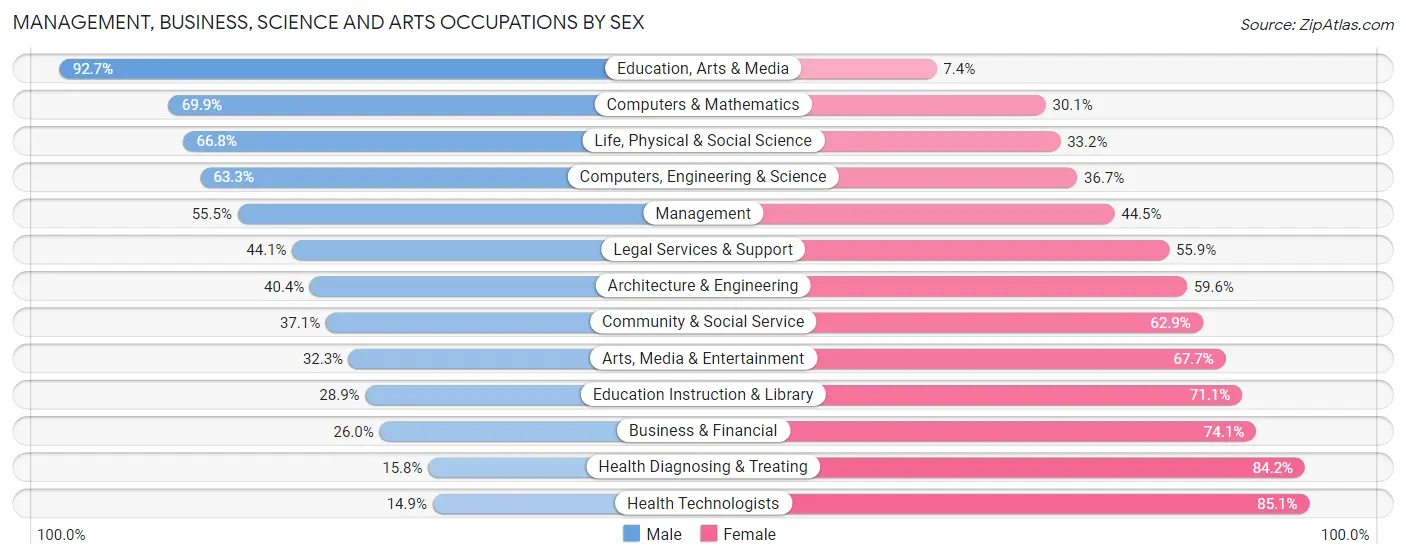
Management, Business, Science and Arts Occupations by Sex
Within the Management, Business, Science and Arts occupations in North Laurel, the most male-oriented occupations are Education, Arts & Media (92.6%), Computers & Mathematics (69.9%), and Life, Physical & Social Science (66.8%), while the most female-oriented occupations are Health Technologists (85.1%), Health Diagnosing & Treating (84.2%), and Business & Financial (74.1%).
| Occupation | Male | Female |
| Management | 787 (55.5%) | 630 (44.5%) |
| Business & Financial | 374 (26.0%) | 1,067 (74.1%) |
| Computers, Engineering & Science | 1,402 (63.3%) | 813 (36.7%) |
| Computers & Mathematics | 924 (69.9%) | 398 (30.1%) |
| Architecture & Engineering | 182 (40.4%) | 268 (59.6%) |
| Life, Physical & Social Science | 296 (66.8%) | 147 (33.2%) |
| Community & Social Service | 575 (37.1%) | 974 (62.9%) |
| Education, Arts & Media | 126 (92.6%) | 10 (7.3%) |
| Legal Services & Support | 94 (44.1%) | 119 (55.9%) |
| Education Instruction & Library | 279 (28.9%) | 686 (71.1%) |
| Arts, Media & Entertainment | 76 (32.3%) | 159 (67.7%) |
| Health Diagnosing & Treating | 163 (15.8%) | 869 (84.2%) |
| Health Technologists | 118 (14.9%) | 676 (85.1%) |
| Total (Category) | 3,301 (43.1%) | 4,353 (56.9%) |
| Total (Overall) | 6,186 (46.7%) | 7,049 (53.3%) |
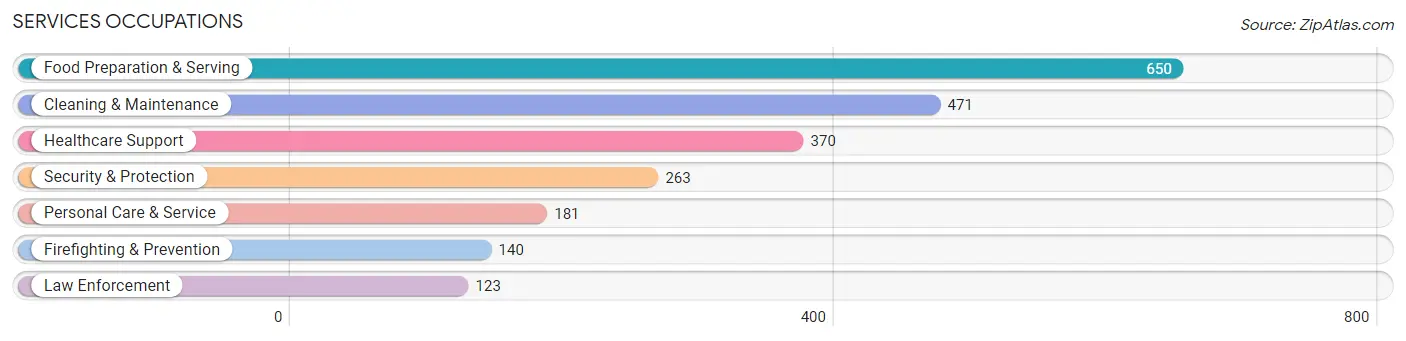
Services Occupations
The most common Services occupations in North Laurel are Food Preparation & Serving (650 | 4.9%), Cleaning & Maintenance (471 | 3.6%), Healthcare Support (370 | 2.8%), Security & Protection (263 | 2.0%), and Personal Care & Service (181 | 1.4%).
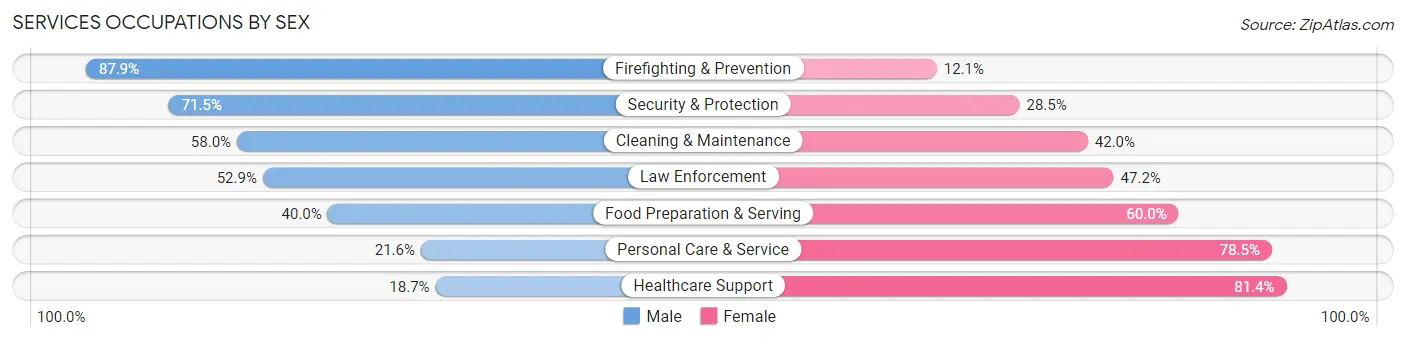
Services Occupations by Sex
Within the Services occupations in North Laurel, the most male-oriented occupations are Firefighting & Prevention (87.9%), Security & Protection (71.5%), and Cleaning & Maintenance (58.0%), while the most female-oriented occupations are Healthcare Support (81.4%), Personal Care & Service (78.4%), and Food Preparation & Serving (60.0%).
| Occupation | Male | Female |
| Healthcare Support | 69 (18.6%) | 301 (81.4%) |
| Security & Protection | 188 (71.5%) | 75 (28.5%) |
| Firefighting & Prevention | 123 (87.9%) | 17 (12.1%) |
| Law Enforcement | 65 (52.8%) | 58 (47.1%) |
| Food Preparation & Serving | 260 (40.0%) | 390 (60.0%) |
| Cleaning & Maintenance | 273 (58.0%) | 198 (42.0%) |
| Personal Care & Service | 39 (21.5%) | 142 (78.4%) |
| Total (Category) | 829 (42.8%) | 1,106 (57.2%) |
| Total (Overall) | 6,186 (46.7%) | 7,049 (53.3%) |
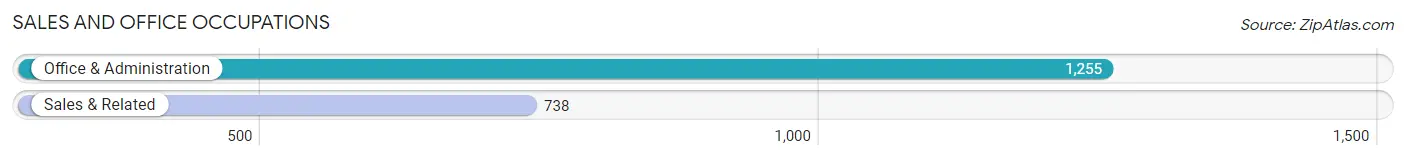
Sales and Office Occupations
The most common Sales and Office occupations in North Laurel are Office & Administration (1,255 | 9.5%), and Sales & Related (738 | 5.6%).
Sales and Office Occupations by Sex
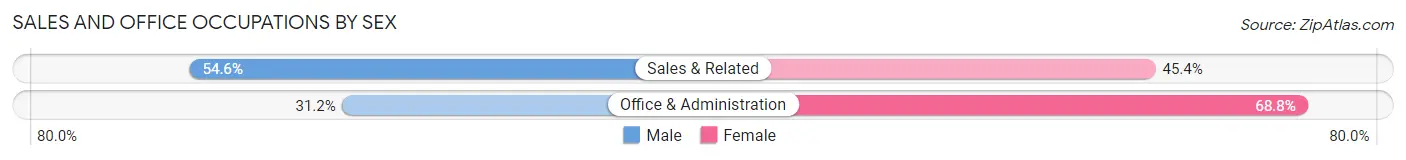
| Occupation | Male | Female |
| Sales & Related | 403 (54.6%) | 335 (45.4%) |
| Office & Administration | 392 (31.2%) | 863 (68.8%) |
| Total (Category) | 795 (39.9%) | 1,198 (60.1%) |
| Total (Overall) | 6,186 (46.7%) | 7,049 (53.3%) |
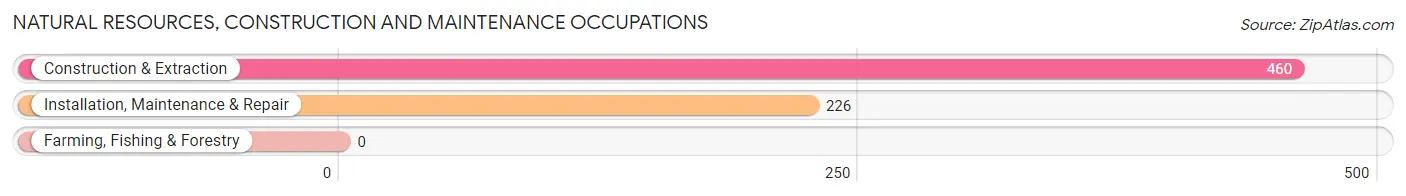
Natural Resources, Construction and Maintenance Occupations
The most common Natural Resources, Construction and Maintenance occupations in North Laurel are Construction & Extraction (460 | 3.5%), and Installation, Maintenance & Repair (226 | 1.7%).
Natural Resources, Construction and Maintenance Occupations by Sex
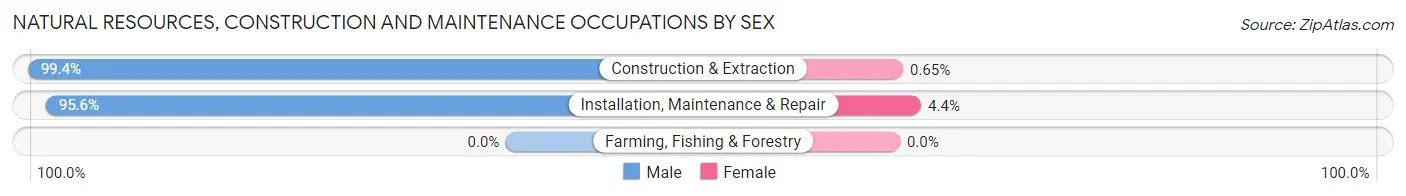
| Occupation | Male | Female |
| Farming, Fishing & Forestry | 0 (0.0%) | 0 (0.0%) |
| Construction & Extraction | 457 (99.4%) | 3 (0.6%) |
| Installation, Maintenance & Repair | 216 (95.6%) | 10 (4.4%) |
| Total (Category) | 673 (98.1%) | 13 (1.9%) |
| Total (Overall) | 6,186 (46.7%) | 7,049 (53.3%) |
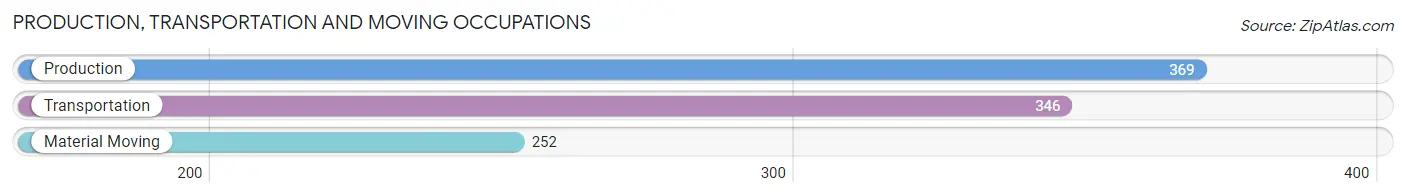
Production, Transportation and Moving Occupations
The most common Production, Transportation and Moving occupations in North Laurel are Production (369 | 2.8%), Transportation (346 | 2.6%), and Material Moving (252 | 1.9%).
Production, Transportation and Moving Occupations by Sex
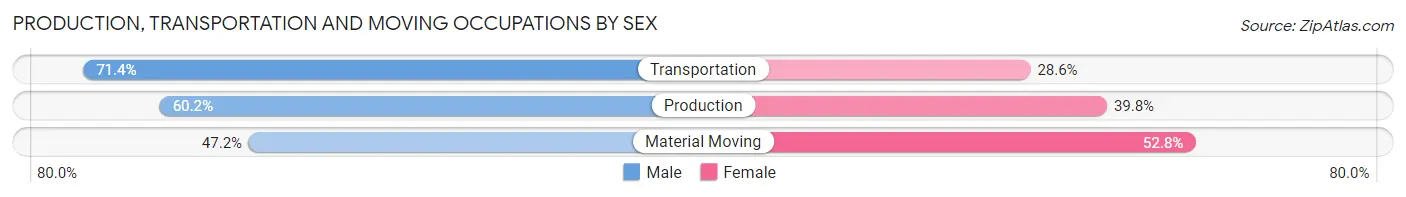
| Occupation | Male | Female |
| Production | 222 (60.2%) | 147 (39.8%) |
| Transportation | 247 (71.4%) | 99 (28.6%) |
| Material Moving | 119 (47.2%) | 133 (52.8%) |
| Total (Category) | 588 (60.8%) | 379 (39.2%) |
| Total (Overall) | 6,186 (46.7%) | 7,049 (53.3%) |
Employment Industries by Sex in North Laurel
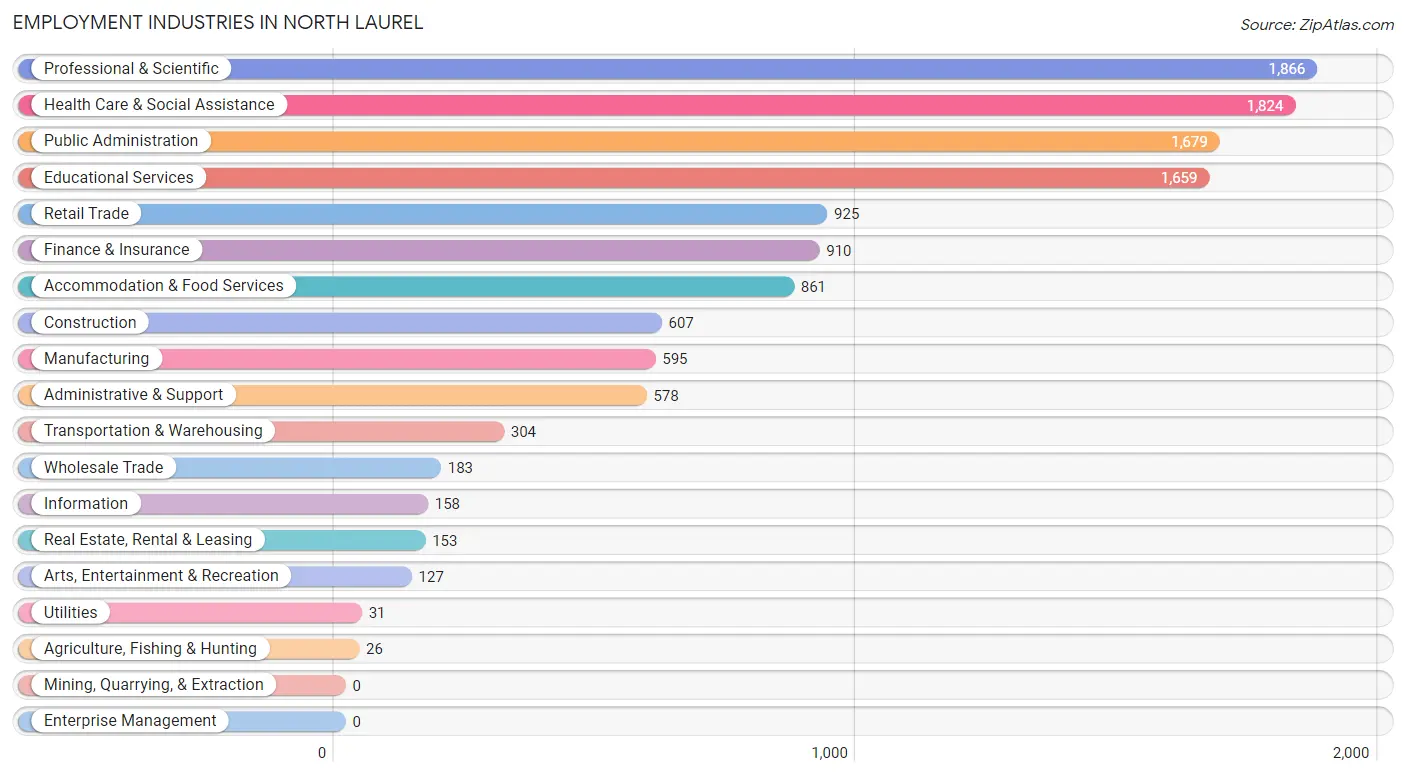
Employment Industries in North Laurel
The major employment industries in North Laurel include Professional & Scientific (1,866 | 14.1%), Health Care & Social Assistance (1,824 | 13.8%), Public Administration (1,679 | 12.7%), Educational Services (1,659 | 12.5%), and Retail Trade (925 | 7.0%).
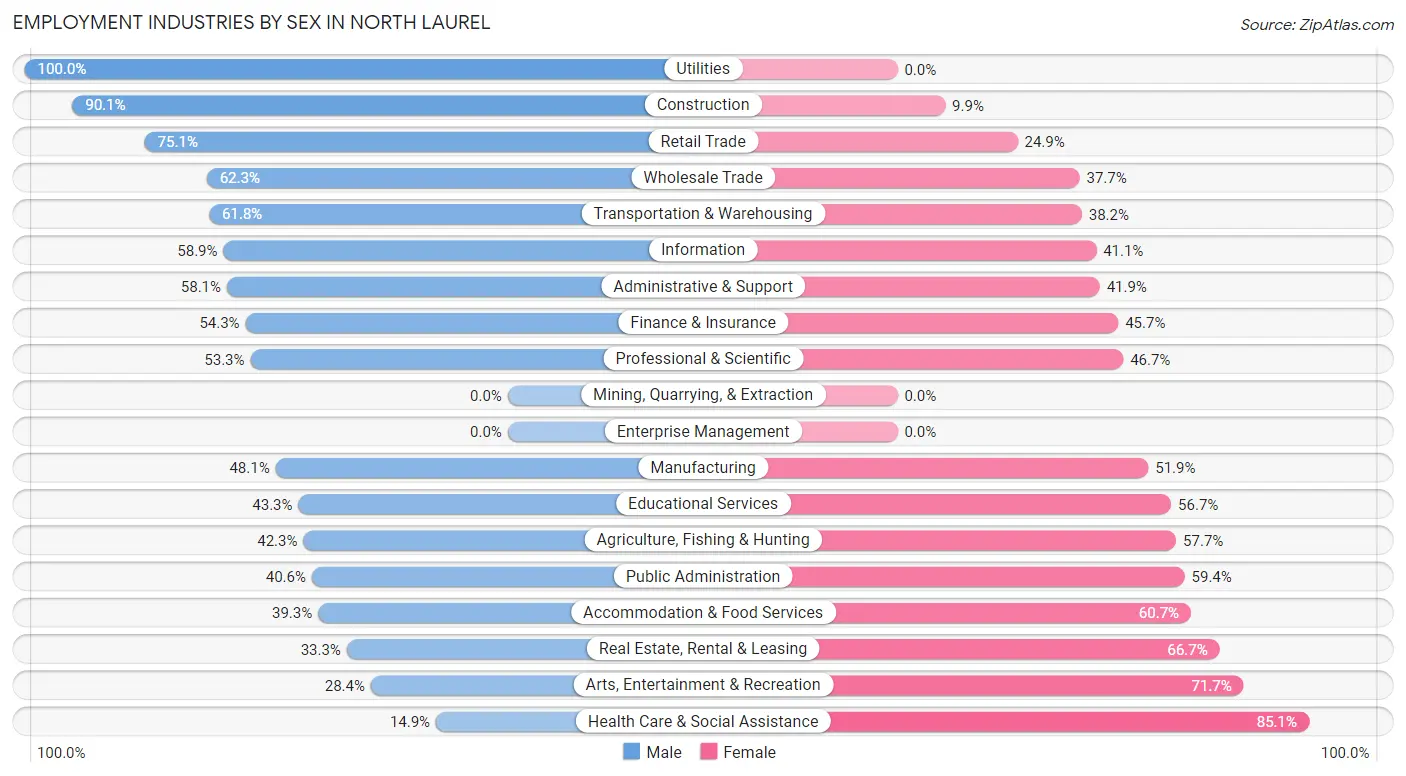
Employment Industries by Sex in North Laurel
The North Laurel industries that see more men than women are Utilities (100.0%), Construction (90.1%), and Retail Trade (75.1%), whereas the industries that tend to have a higher number of women are Health Care & Social Assistance (85.1%), Arts, Entertainment & Recreation (71.7%), and Real Estate, Rental & Leasing (66.7%).
| Industry | Male | Female |
| Agriculture, Fishing & Hunting | 11 (42.3%) | 15 (57.7%) |
| Mining, Quarrying, & Extraction | 0 (0.0%) | 0 (0.0%) |
| Construction | 547 (90.1%) | 60 (9.9%) |
| Manufacturing | 286 (48.1%) | 309 (51.9%) |
| Wholesale Trade | 114 (62.3%) | 69 (37.7%) |
| Retail Trade | 695 (75.1%) | 230 (24.9%) |
| Transportation & Warehousing | 188 (61.8%) | 116 (38.2%) |
| Utilities | 31 (100.0%) | 0 (0.0%) |
| Information | 93 (58.9%) | 65 (41.1%) |
| Finance & Insurance | 494 (54.3%) | 416 (45.7%) |
| Real Estate, Rental & Leasing | 51 (33.3%) | 102 (66.7%) |
| Professional & Scientific | 994 (53.3%) | 872 (46.7%) |
| Enterprise Management | 0 (0.0%) | 0 (0.0%) |
| Administrative & Support | 336 (58.1%) | 242 (41.9%) |
| Educational Services | 719 (43.3%) | 940 (56.7%) |
| Health Care & Social Assistance | 271 (14.9%) | 1,553 (85.1%) |
| Arts, Entertainment & Recreation | 36 (28.3%) | 91 (71.7%) |
| Accommodation & Food Services | 338 (39.3%) | 523 (60.7%) |
| Public Administration | 681 (40.6%) | 998 (59.4%) |
| Total | 6,186 (46.7%) | 7,049 (53.3%) |
Education in North Laurel
School Enrollment in North Laurel
The most common levels of schooling among the 6,150 students in North Laurel are elementary school (1,526 | 24.8%), high school (1,261 | 20.5%), and middle school (1,107 | 18.0%).
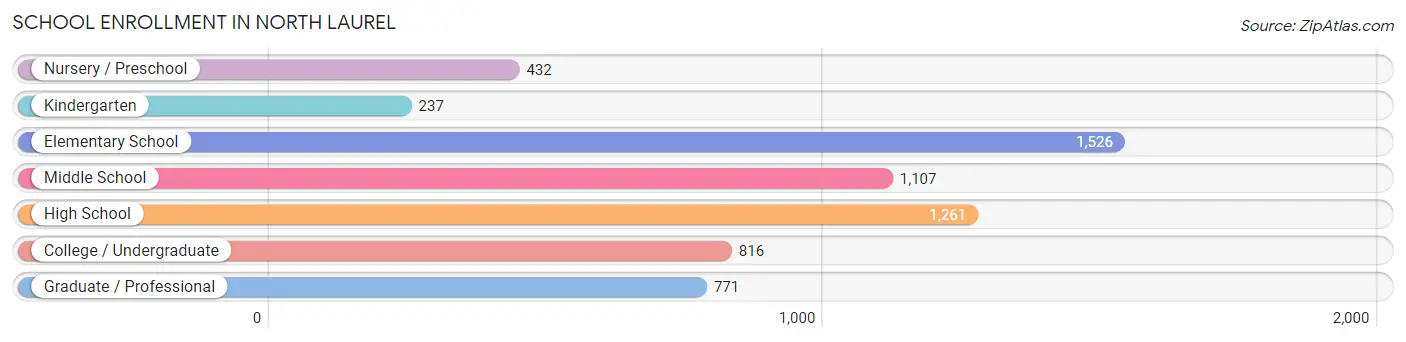
| School Level | # Students | % Students |
| Nursery / Preschool | 432 | 7.0% |
| Kindergarten | 237 | 3.8% |
| Elementary School | 1,526 | 24.8% |
| Middle School | 1,107 | 18.0% |
| High School | 1,261 | 20.5% |
| College / Undergraduate | 816 | 13.3% |
| Graduate / Professional | 771 | 12.5% |
| Total | 6,150 | 100.0% |
School Enrollment by Age by Funding Source in North Laurel
Out of a total of 6,150 students who are enrolled in schools in North Laurel, 922 (15.0%) attend a private institution, while the remaining 5,228 (85.0%) are enrolled in public schools. The age group of 3 to 4 year olds has the highest likelihood of being enrolled in private schools, with 276 (77.3% in the age bracket) enrolled. Conversely, the age group of 18 to 19 year olds has the lowest likelihood of being enrolled in a private school, with 396 (100.0% in the age bracket) attending a public institution.
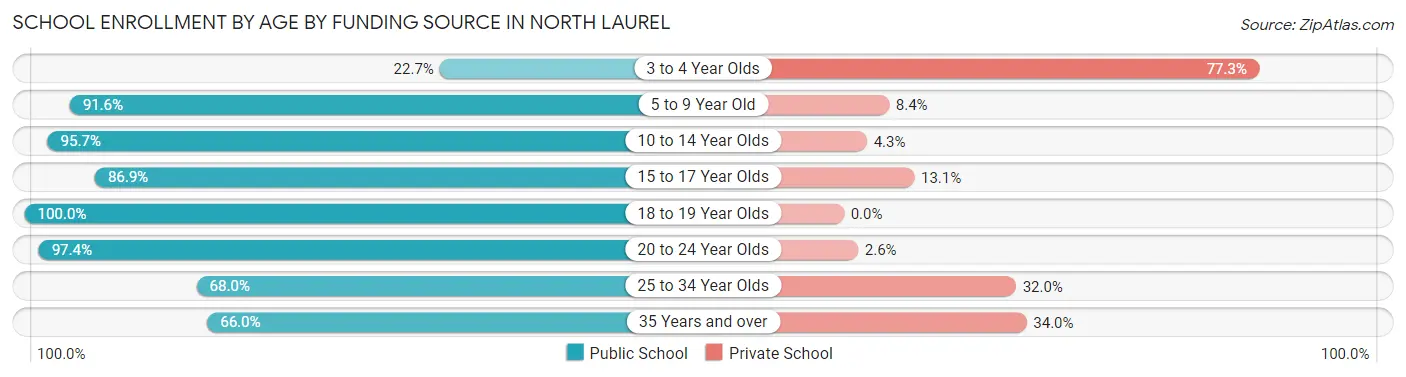
| Age Bracket | Public School | Private School |
| 3 to 4 Year Olds | 81 (22.7%) | 276 (77.3%) |
| 5 to 9 Year Old | 1,631 (91.6%) | 150 (8.4%) |
| 10 to 14 Year Olds | 1,249 (95.7%) | 56 (4.3%) |
| 15 to 17 Year Olds | 815 (86.9%) | 123 (13.1%) |
| 18 to 19 Year Olds | 396 (100.0%) | 0 (0.0%) |
| 20 to 24 Year Olds | 442 (97.4%) | 12 (2.6%) |
| 25 to 34 Year Olds | 333 (68.0%) | 157 (32.0%) |
| 35 Years and over | 283 (66.0%) | 146 (34.0%) |
| Total | 5,228 (85.0%) | 922 (15.0%) |
Educational Attainment by Field of Study in North Laurel
Business (1,650 | 15.8%), social sciences (1,381 | 13.3%), science & technology (1,106 | 10.6%), computers & mathematics (895 | 8.6%), and engineering (892 | 8.6%) are the most common fields of study among 10,425 individuals in North Laurel who have obtained a bachelor's degree or higher.
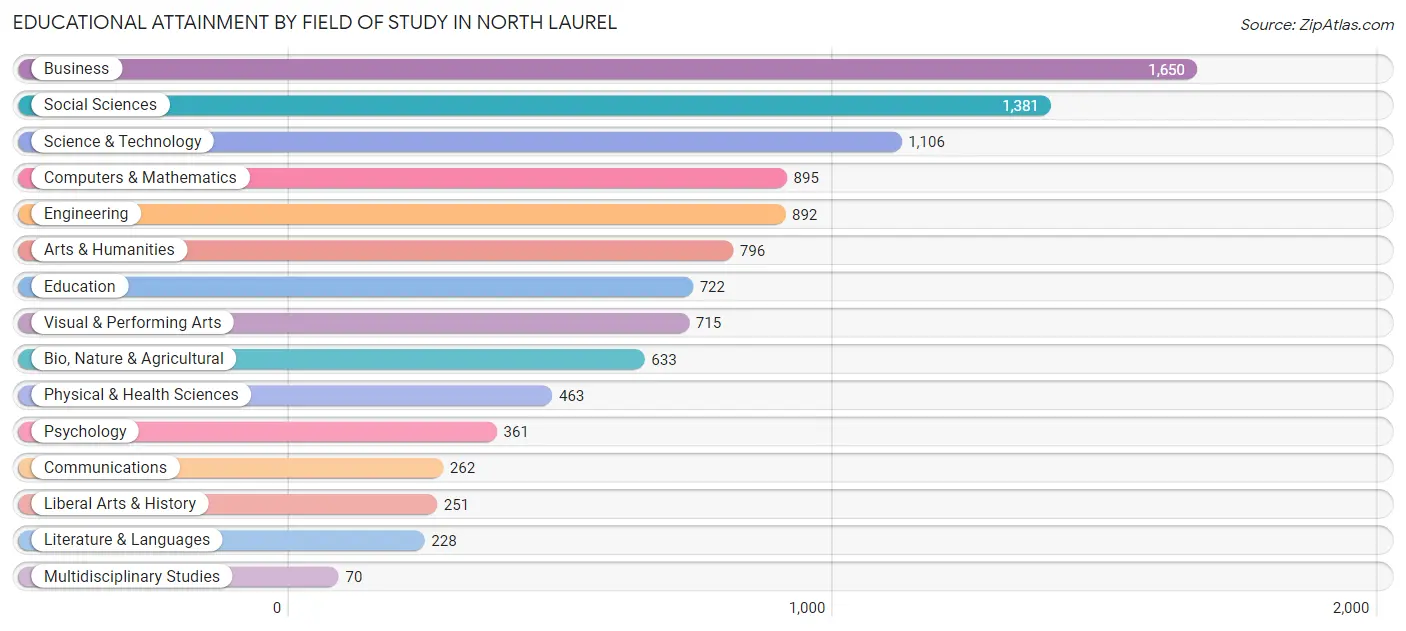
| Field of Study | # Graduates | % Graduates |
| Computers & Mathematics | 895 | 8.6% |
| Bio, Nature & Agricultural | 633 | 6.1% |
| Physical & Health Sciences | 463 | 4.4% |
| Psychology | 361 | 3.5% |
| Social Sciences | 1,381 | 13.3% |
| Engineering | 892 | 8.6% |
| Multidisciplinary Studies | 70 | 0.7% |
| Science & Technology | 1,106 | 10.6% |
| Business | 1,650 | 15.8% |
| Education | 722 | 6.9% |
| Literature & Languages | 228 | 2.2% |
| Liberal Arts & History | 251 | 2.4% |
| Visual & Performing Arts | 715 | 6.9% |
| Communications | 262 | 2.5% |
| Arts & Humanities | 796 | 7.6% |
| Total | 10,425 | 100.0% |
Transportation & Commute in North Laurel
Vehicle Availability by Sex in North Laurel
The most prevalent vehicle ownership categories in North Laurel are males with 2 vehicles (3,584, accounting for 55.6%) and females with 2 vehicles (3,428, making up 51.9%).
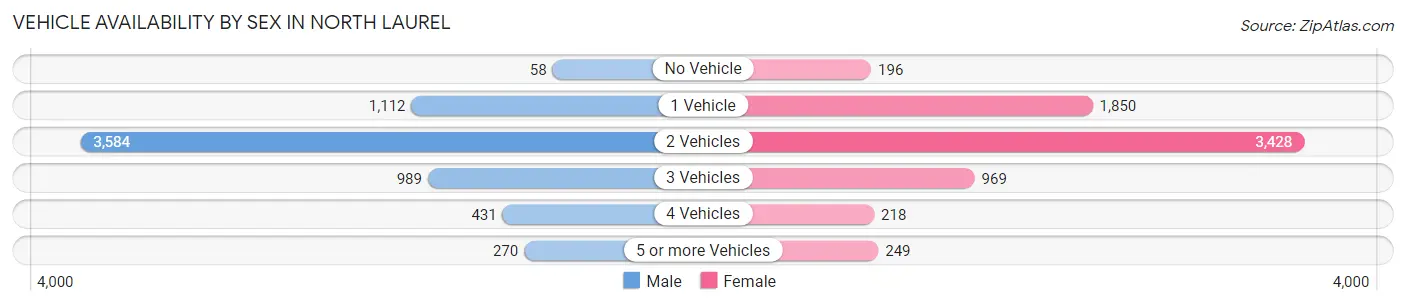
| Vehicles Available | Male | Female |
| No Vehicle | 58 (0.9%) | 196 (2.8%) |
| 1 Vehicle | 1,112 (17.3%) | 1,850 (26.8%) |
| 2 Vehicles | 3,584 (55.6%) | 3,428 (49.6%) |
| 3 Vehicles | 989 (15.3%) | 969 (14.0%) |
| 4 Vehicles | 431 (6.7%) | 218 (3.2%) |
| 5 or more Vehicles | 270 (4.2%) | 249 (3.6%) |
| Total | 6,444 (100.0%) | 6,910 (100.0%) |
Commute Time in North Laurel
The most frequently occuring commute durations in North Laurel are 30 to 34 minutes (1,896 commuters, 16.9%), 45 to 59 minutes (1,395 commuters, 12.4%), and 15 to 19 minutes (1,314 commuters, 11.7%).
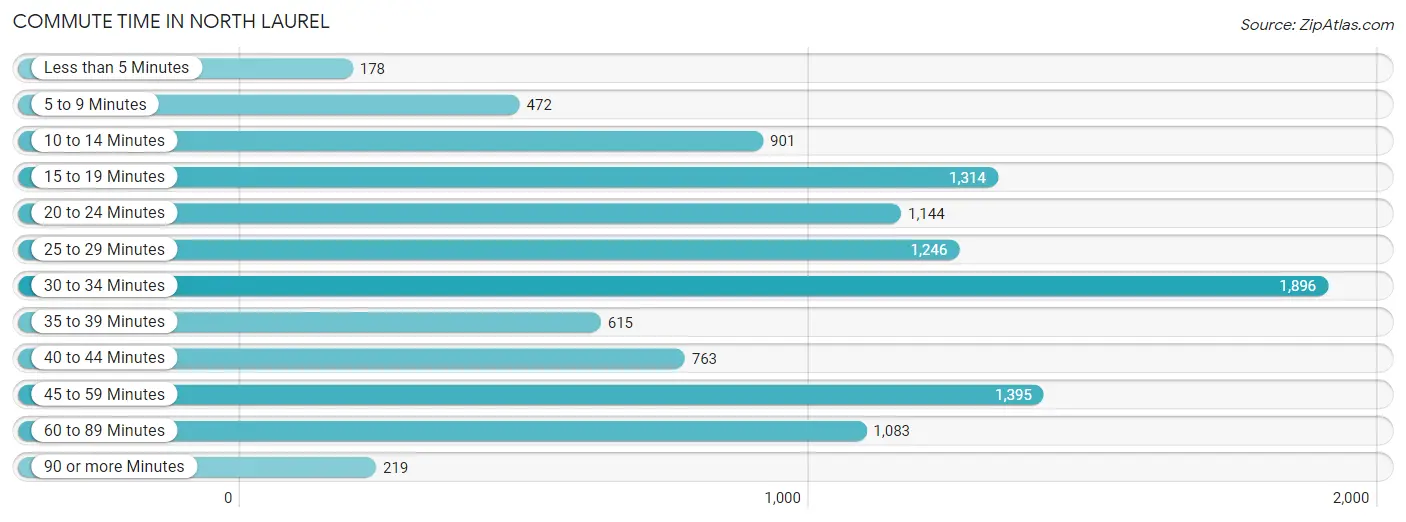
| Commute Time | # Commuters | % Commuters |
| Less than 5 Minutes | 178 | 1.6% |
| 5 to 9 Minutes | 472 | 4.2% |
| 10 to 14 Minutes | 901 | 8.0% |
| 15 to 19 Minutes | 1,314 | 11.7% |
| 20 to 24 Minutes | 1,144 | 10.2% |
| 25 to 29 Minutes | 1,246 | 11.1% |
| 30 to 34 Minutes | 1,896 | 16.9% |
| 35 to 39 Minutes | 615 | 5.5% |
| 40 to 44 Minutes | 763 | 6.8% |
| 45 to 59 Minutes | 1,395 | 12.4% |
| 60 to 89 Minutes | 1,083 | 9.7% |
| 90 or more Minutes | 219 | 1.9% |
Commute Time by Sex in North Laurel
The most common commute times in North Laurel are 45 to 59 minutes (738 commuters, 13.5%) for males and 30 to 34 minutes (1,168 commuters, 20.3%) for females.
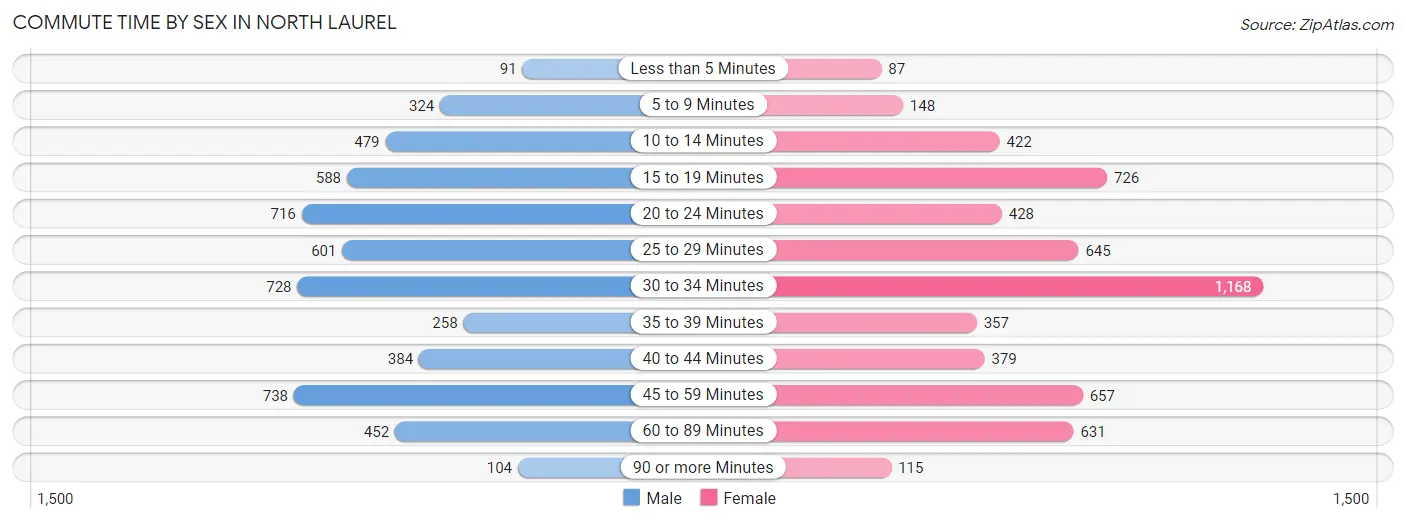
| Commute Time | Male | Female |
| Less than 5 Minutes | 91 (1.7%) | 87 (1.5%) |
| 5 to 9 Minutes | 324 (5.9%) | 148 (2.6%) |
| 10 to 14 Minutes | 479 (8.8%) | 422 (7.3%) |
| 15 to 19 Minutes | 588 (10.8%) | 726 (12.6%) |
| 20 to 24 Minutes | 716 (13.1%) | 428 (7.4%) |
| 25 to 29 Minutes | 601 (11.0%) | 645 (11.2%) |
| 30 to 34 Minutes | 728 (13.3%) | 1,168 (20.3%) |
| 35 to 39 Minutes | 258 (4.7%) | 357 (6.2%) |
| 40 to 44 Minutes | 384 (7.0%) | 379 (6.6%) |
| 45 to 59 Minutes | 738 (13.5%) | 657 (11.4%) |
| 60 to 89 Minutes | 452 (8.3%) | 631 (11.0%) |
| 90 or more Minutes | 104 (1.9%) | 115 (2.0%) |
Time of Departure to Work by Sex in North Laurel
The most frequent times of departure to work in North Laurel are 7:00 AM to 7:29 AM (632, 11.6%) for males and 7:00 AM to 7:29 AM (938, 16.3%) for females.
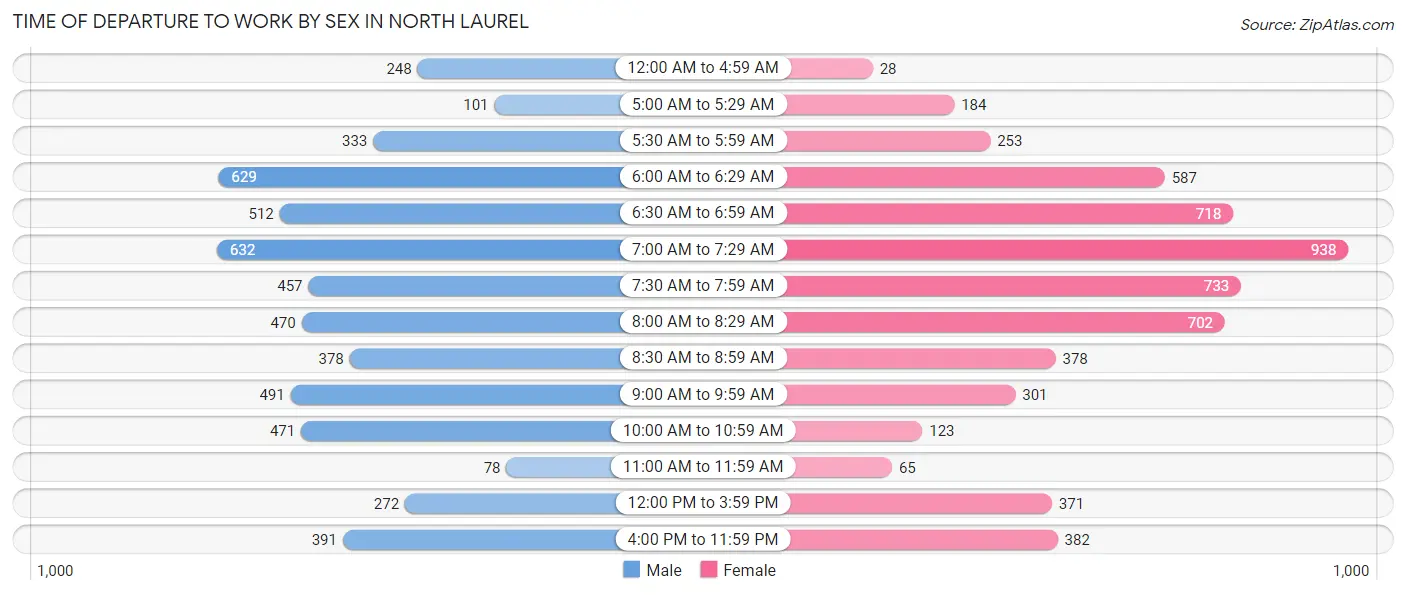
| Time of Departure | Male | Female |
| 12:00 AM to 4:59 AM | 248 (4.5%) | 28 (0.5%) |
| 5:00 AM to 5:29 AM | 101 (1.8%) | 184 (3.2%) |
| 5:30 AM to 5:59 AM | 333 (6.1%) | 253 (4.4%) |
| 6:00 AM to 6:29 AM | 629 (11.5%) | 587 (10.2%) |
| 6:30 AM to 6:59 AM | 512 (9.4%) | 718 (12.5%) |
| 7:00 AM to 7:29 AM | 632 (11.6%) | 938 (16.3%) |
| 7:30 AM to 7:59 AM | 457 (8.4%) | 733 (12.7%) |
| 8:00 AM to 8:29 AM | 470 (8.6%) | 702 (12.2%) |
| 8:30 AM to 8:59 AM | 378 (6.9%) | 378 (6.6%) |
| 9:00 AM to 9:59 AM | 491 (9.0%) | 301 (5.2%) |
| 10:00 AM to 10:59 AM | 471 (8.6%) | 123 (2.1%) |
| 11:00 AM to 11:59 AM | 78 (1.4%) | 65 (1.1%) |
| 12:00 PM to 3:59 PM | 272 (5.0%) | 371 (6.4%) |
| 4:00 PM to 11:59 PM | 391 (7.2%) | 382 (6.6%) |
| Total | 5,463 (100.0%) | 5,763 (100.0%) |
Housing Occupancy in North Laurel
Occupancy by Ownership in North Laurel
Of the total 8,656 dwellings in North Laurel, owner-occupied units account for 5,534 (63.9%), while renter-occupied units make up 3,122 (36.1%).
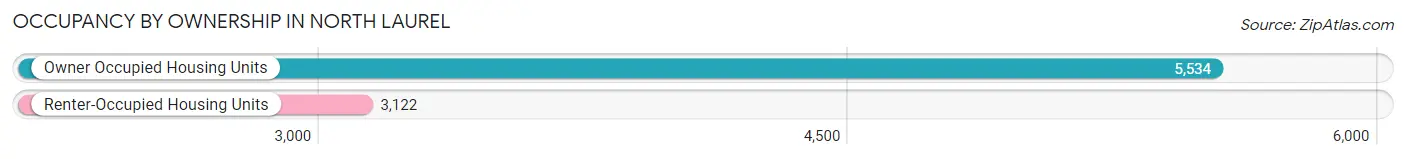
| Occupancy | # Housing Units | % Housing Units |
| Owner Occupied Housing Units | 5,534 | 63.9% |
| Renter-Occupied Housing Units | 3,122 | 36.1% |
| Total Occupied Housing Units | 8,656 | 100.0% |
Occupancy by Household Size in North Laurel
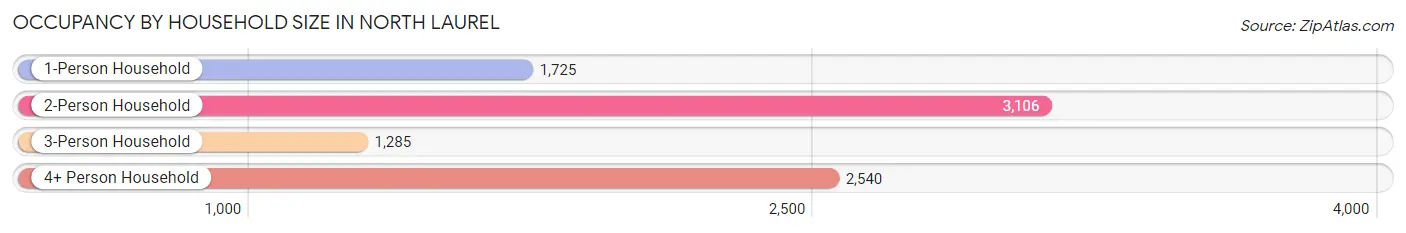
| Household Size | # Housing Units | % Housing Units |
| 1-Person Household | 1,725 | 19.9% |
| 2-Person Household | 3,106 | 35.9% |
| 3-Person Household | 1,285 | 14.8% |
| 4+ Person Household | 2,540 | 29.3% |
| Total Housing Units | 8,656 | 100.0% |
Occupancy by Ownership by Household Size in North Laurel
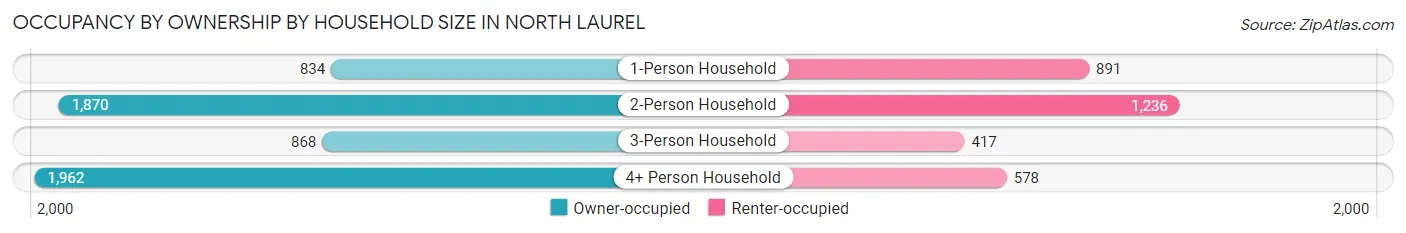
| Household Size | Owner-occupied | Renter-occupied |
| 1-Person Household | 834 (48.3%) | 891 (51.6%) |
| 2-Person Household | 1,870 (60.2%) | 1,236 (39.8%) |
| 3-Person Household | 868 (67.5%) | 417 (32.5%) |
| 4+ Person Household | 1,962 (77.2%) | 578 (22.8%) |
| Total Housing Units | 5,534 (63.9%) | 3,122 (36.1%) |
Occupancy by Educational Attainment in North Laurel
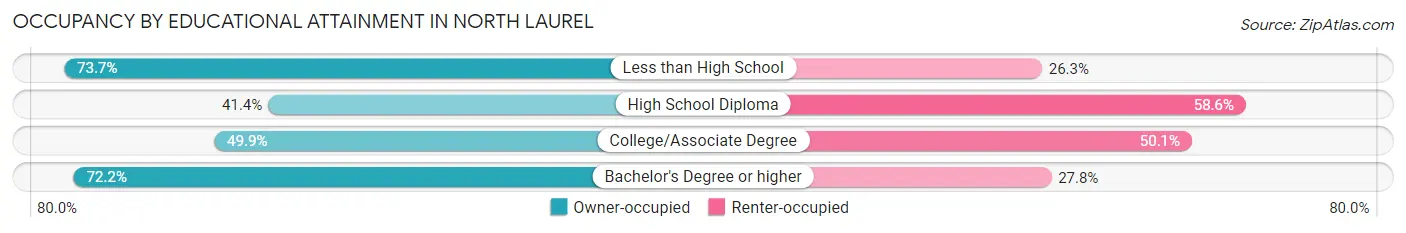
| Household Size | Owner-occupied | Renter-occupied |
| Less than High School | 320 (73.7%) | 114 (26.3%) |
| High School Diploma | 533 (41.4%) | 755 (58.6%) |
| College/Associate Degree | 735 (49.9%) | 737 (50.1%) |
| Bachelor's Degree or higher | 3,946 (72.2%) | 1,516 (27.8%) |
Occupancy by Age of Householder in North Laurel
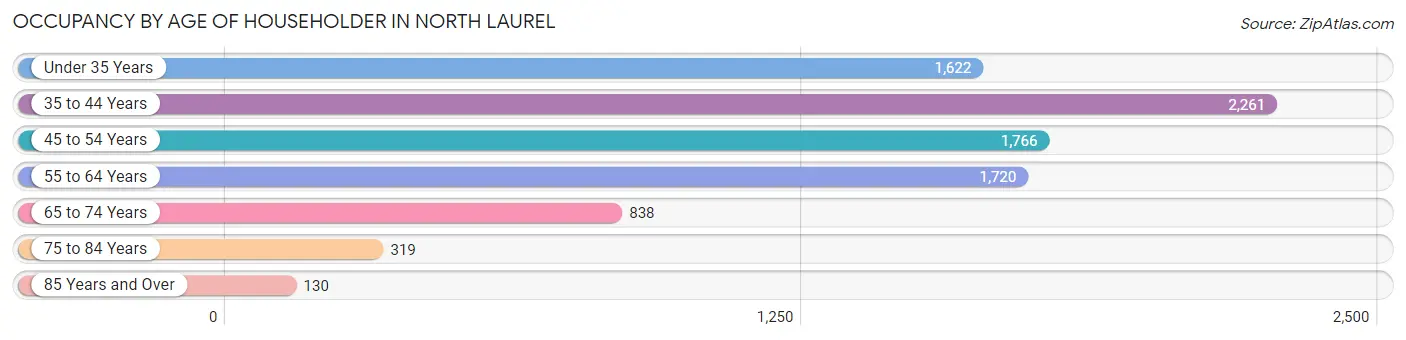
| Age Bracket | # Households | % Households |
| Under 35 Years | 1,622 | 18.7% |
| 35 to 44 Years | 2,261 | 26.1% |
| 45 to 54 Years | 1,766 | 20.4% |
| 55 to 64 Years | 1,720 | 19.9% |
| 65 to 74 Years | 838 | 9.7% |
| 75 to 84 Years | 319 | 3.7% |
| 85 Years and Over | 130 | 1.5% |
| Total | 8,656 | 100.0% |
Housing Finances in North Laurel
Median Income by Occupancy in North Laurel
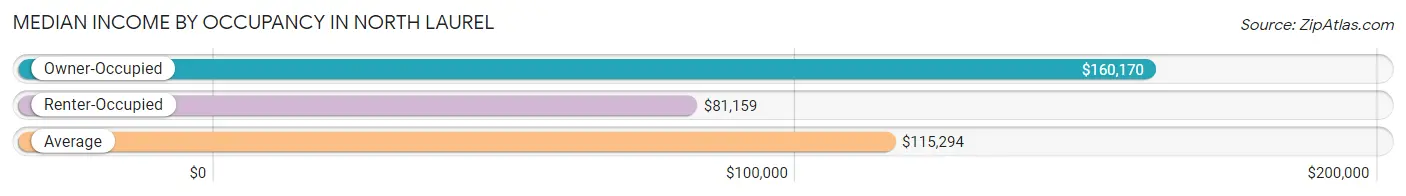
| Occupancy Type | # Households | Median Income |
| Owner-Occupied | 5,534 (63.9%) | $160,170 |
| Renter-Occupied | 3,122 (36.1%) | $81,159 |
| Average | 8,656 (100.0%) | $115,294 |
Occupancy by Householder Income Bracket in North Laurel
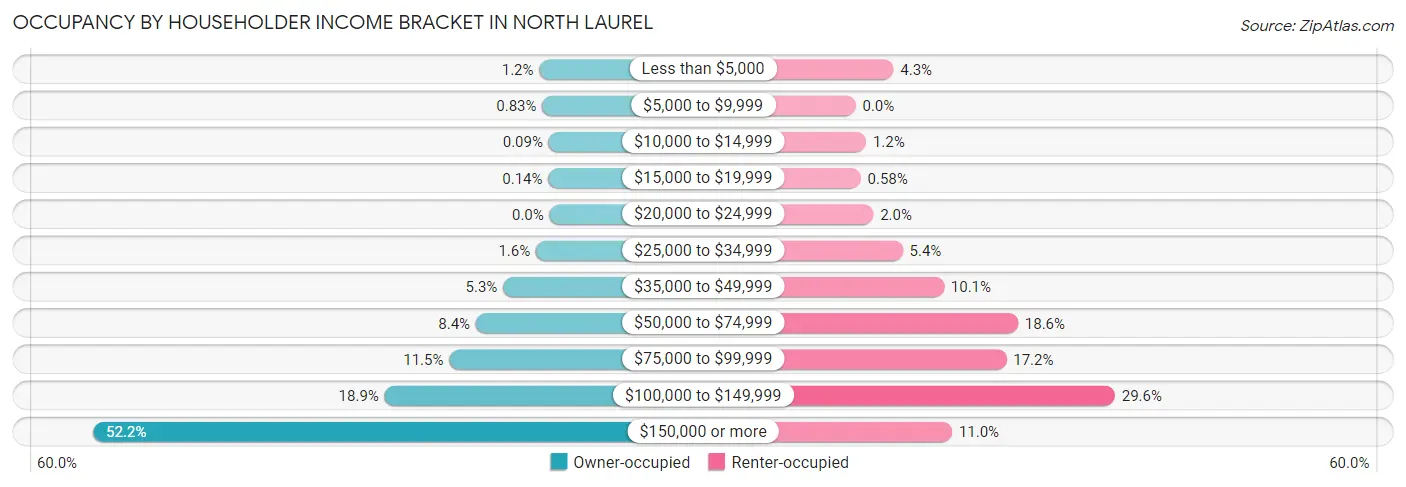
| Income Bracket | Owner-occupied | Renter-occupied |
| Less than $5,000 | 65 (1.2%) | 135 (4.3%) |
| $5,000 to $9,999 | 46 (0.8%) | 0 (0.0%) |
| $10,000 to $14,999 | 5 (0.1%) | 37 (1.2%) |
| $15,000 to $19,999 | 8 (0.1%) | 18 (0.6%) |
| $20,000 to $24,999 | 0 (0.0%) | 63 (2.0%) |
| $25,000 to $34,999 | 86 (1.5%) | 168 (5.4%) |
| $35,000 to $49,999 | 294 (5.3%) | 315 (10.1%) |
| $50,000 to $74,999 | 466 (8.4%) | 579 (18.5%) |
| $75,000 to $99,999 | 634 (11.5%) | 538 (17.2%) |
| $100,000 to $149,999 | 1,043 (18.9%) | 925 (29.6%) |
| $150,000 or more | 2,887 (52.2%) | 344 (11.0%) |
| Total | 5,534 (100.0%) | 3,122 (100.0%) |
Monthly Housing Cost Tiers in North Laurel
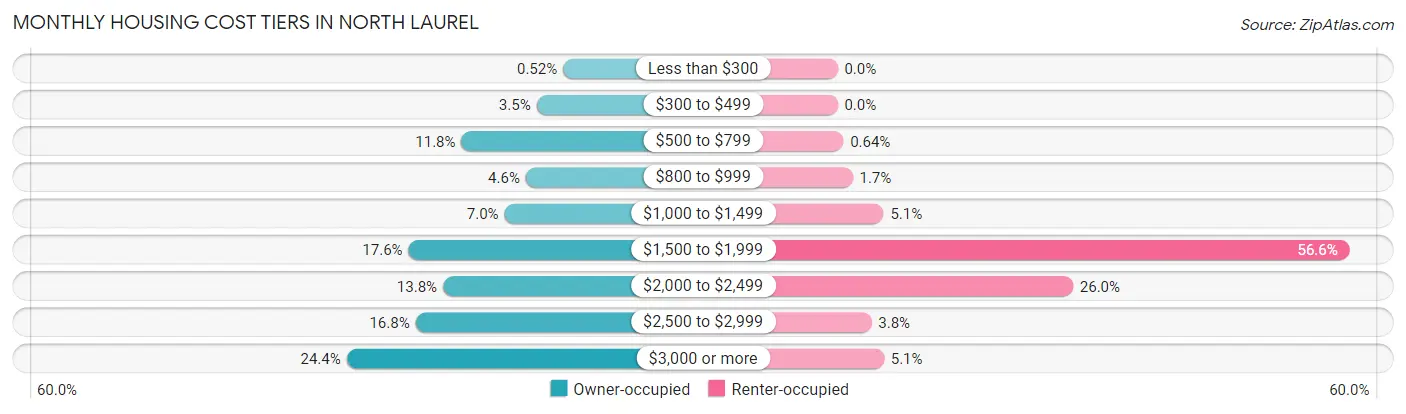
| Monthly Cost | Owner-occupied | Renter-occupied |
| Less than $300 | 29 (0.5%) | 0 (0.0%) |
| $300 to $499 | 191 (3.5%) | 0 (0.0%) |
| $500 to $799 | 650 (11.7%) | 20 (0.6%) |
| $800 to $999 | 257 (4.6%) | 52 (1.7%) |
| $1,000 to $1,499 | 387 (7.0%) | 159 (5.1%) |
| $1,500 to $1,999 | 974 (17.6%) | 1,766 (56.6%) |
| $2,000 to $2,499 | 763 (13.8%) | 812 (26.0%) |
| $2,500 to $2,999 | 931 (16.8%) | 117 (3.7%) |
| $3,000 or more | 1,352 (24.4%) | 160 (5.1%) |
| Total | 5,534 (100.0%) | 3,122 (100.0%) |
Physical Housing Characteristics in North Laurel
Housing Structures in North Laurel
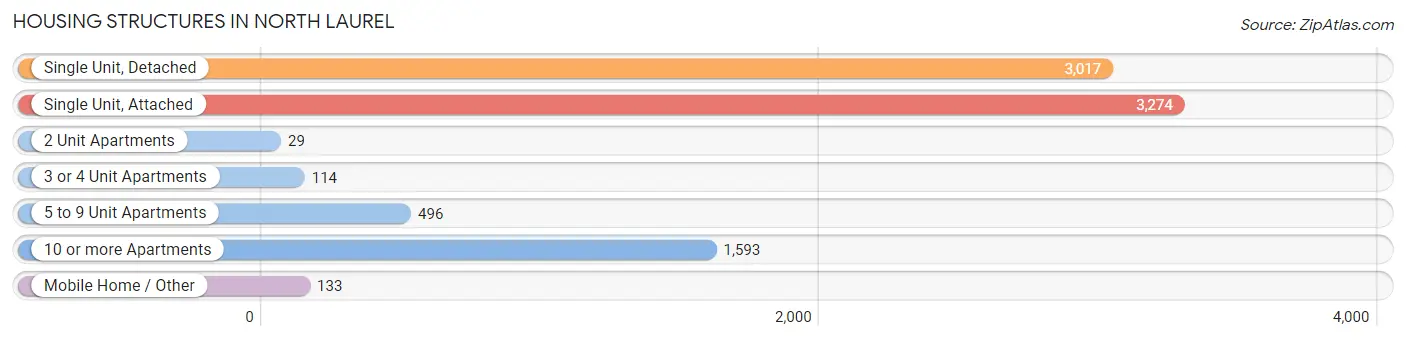
| Structure Type | # Housing Units | % Housing Units |
| Single Unit, Detached | 3,017 | 34.8% |
| Single Unit, Attached | 3,274 | 37.8% |
| 2 Unit Apartments | 29 | 0.3% |
| 3 or 4 Unit Apartments | 114 | 1.3% |
| 5 to 9 Unit Apartments | 496 | 5.7% |
| 10 or more Apartments | 1,593 | 18.4% |
| Mobile Home / Other | 133 | 1.5% |
| Total | 8,656 | 100.0% |
Housing Structures by Occupancy in North Laurel
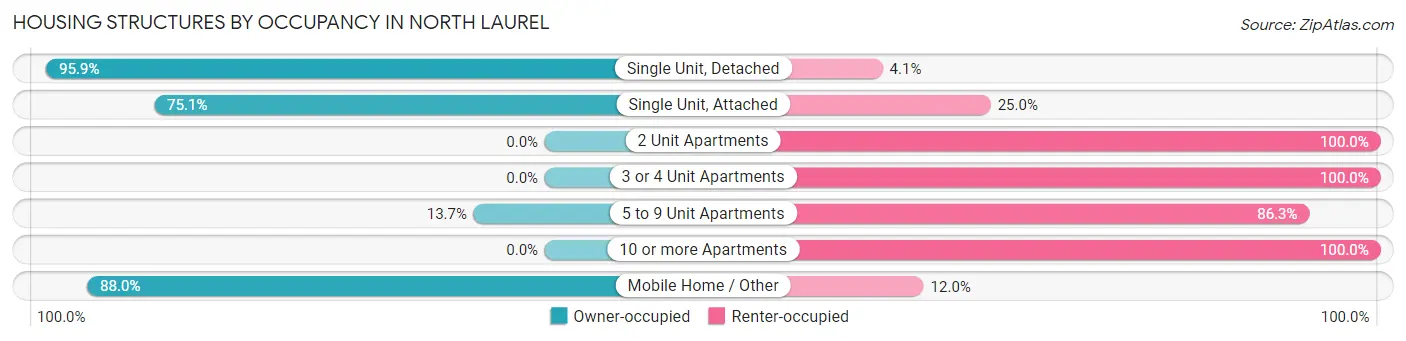
| Structure Type | Owner-occupied | Renter-occupied |
| Single Unit, Detached | 2,892 (95.9%) | 125 (4.1%) |
| Single Unit, Attached | 2,457 (75.0%) | 817 (24.9%) |
| 2 Unit Apartments | 0 (0.0%) | 29 (100.0%) |
| 3 or 4 Unit Apartments | 0 (0.0%) | 114 (100.0%) |
| 5 to 9 Unit Apartments | 68 (13.7%) | 428 (86.3%) |
| 10 or more Apartments | 0 (0.0%) | 1,593 (100.0%) |
| Mobile Home / Other | 117 (88.0%) | 16 (12.0%) |
| Total | 5,534 (63.9%) | 3,122 (36.1%) |
Housing Structures by Number of Rooms in North Laurel
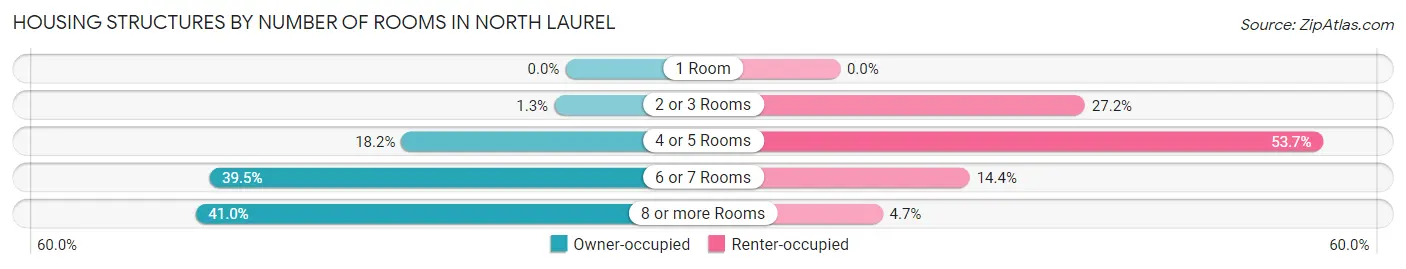
| Number of Rooms | Owner-occupied | Renter-occupied |
| 1 Room | 0 (0.0%) | 0 (0.0%) |
| 2 or 3 Rooms | 69 (1.3%) | 849 (27.2%) |
| 4 or 5 Rooms | 1,007 (18.2%) | 1,675 (53.6%) |
| 6 or 7 Rooms | 2,187 (39.5%) | 450 (14.4%) |
| 8 or more Rooms | 2,271 (41.0%) | 148 (4.7%) |
| Total | 5,534 (100.0%) | 3,122 (100.0%) |
Housing Structure by Heating Type in North Laurel
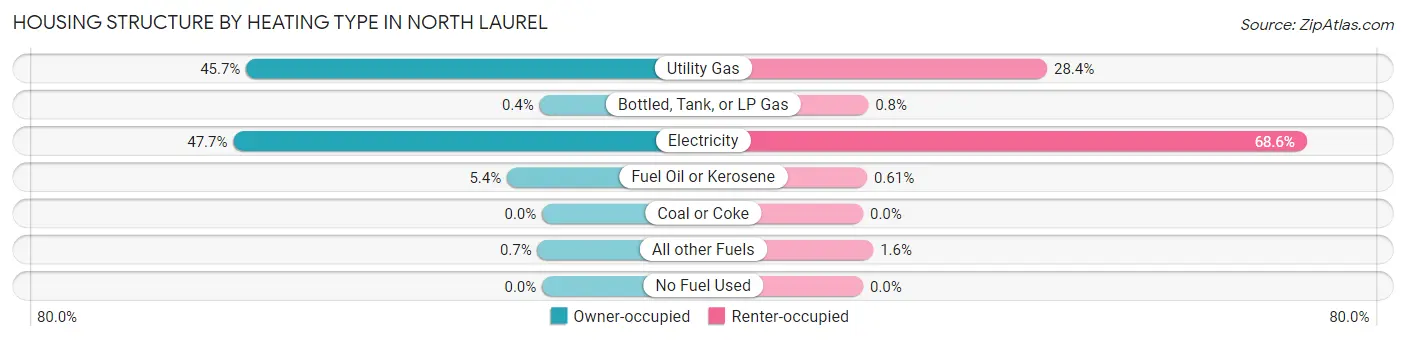
| Heating Type | Owner-occupied | Renter-occupied |
| Utility Gas | 2,531 (45.7%) | 888 (28.4%) |
| Bottled, Tank, or LP Gas | 22 (0.4%) | 25 (0.8%) |
| Electricity | 2,642 (47.7%) | 2,141 (68.6%) |
| Fuel Oil or Kerosene | 300 (5.4%) | 19 (0.6%) |
| Coal or Coke | 0 (0.0%) | 0 (0.0%) |
| All other Fuels | 39 (0.7%) | 49 (1.6%) |
| No Fuel Used | 0 (0.0%) | 0 (0.0%) |
| Total | 5,534 (100.0%) | 3,122 (100.0%) |
Household Vehicle Usage in North Laurel
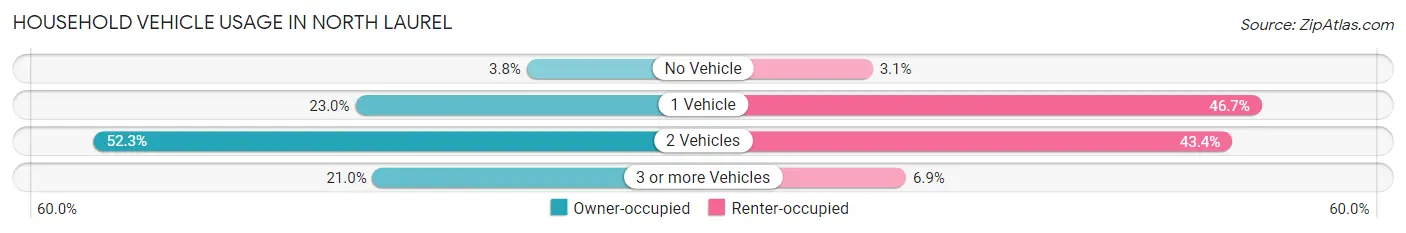
| Vehicles per Household | Owner-occupied | Renter-occupied |
| No Vehicle | 208 (3.8%) | 97 (3.1%) |
| 1 Vehicle | 1,270 (23.0%) | 1,457 (46.7%) |
| 2 Vehicles | 2,892 (52.3%) | 1,354 (43.4%) |
| 3 or more Vehicles | 1,164 (21.0%) | 214 (6.9%) |
| Total | 5,534 (100.0%) | 3,122 (100.0%) |
Real Estate & Mortgages in North Laurel
Real Estate and Mortgage Overview in North Laurel
| Characteristic | Without Mortgage | With Mortgage |
| Housing Units | 1,181 | 4,353 |
| Median Property Value | $406,500 | $445,600 |
| Median Household Income | $92,109 | $2,415 |
| Monthly Housing Costs | $648 | $1,352 |
| Real Estate Taxes | $4,389 | $30 |
Property Value by Mortgage Status in North Laurel
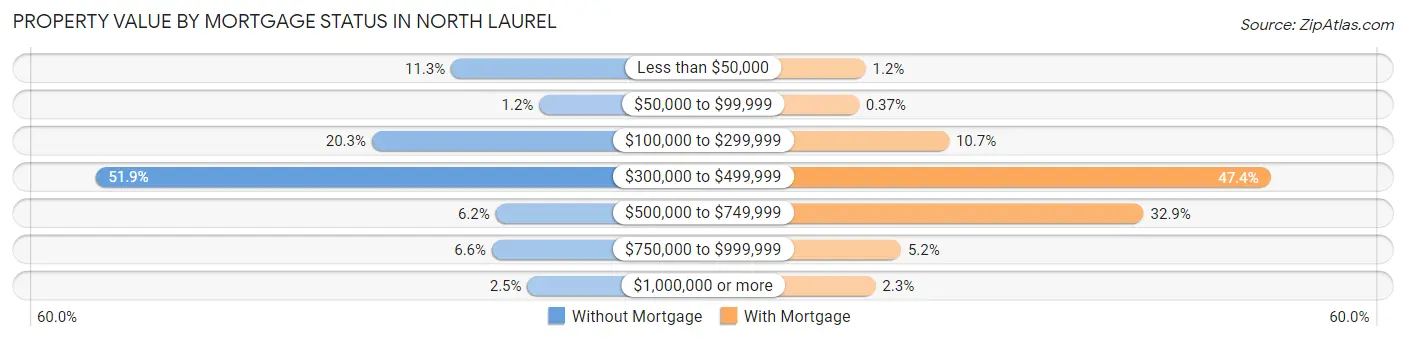
| Property Value | Without Mortgage | With Mortgage |
| Less than $50,000 | 133 (11.3%) | 50 (1.1%) |
| $50,000 to $99,999 | 14 (1.2%) | 16 (0.4%) |
| $100,000 to $299,999 | 240 (20.3%) | 465 (10.7%) |
| $300,000 to $499,999 | 613 (51.9%) | 2,064 (47.4%) |
| $500,000 to $749,999 | 73 (6.2%) | 1,433 (32.9%) |
| $750,000 to $999,999 | 78 (6.6%) | 226 (5.2%) |
| $1,000,000 or more | 30 (2.5%) | 99 (2.3%) |
| Total | 1,181 (100.0%) | 4,353 (100.0%) |
Household Income by Mortgage Status in North Laurel
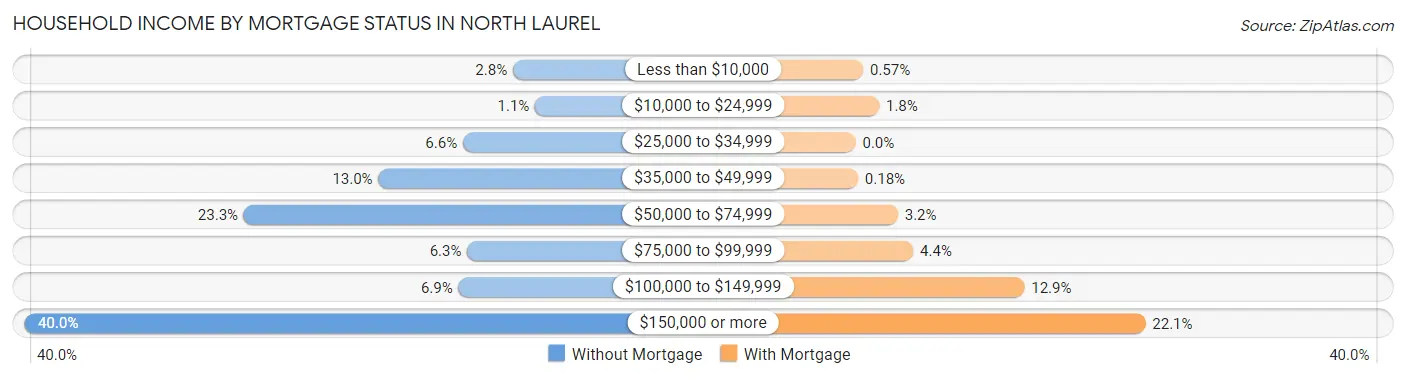
| Household Income | Without Mortgage | With Mortgage |
| Less than $10,000 | 33 (2.8%) | 25 (0.6%) |
| $10,000 to $24,999 | 13 (1.1%) | 78 (1.8%) |
| $25,000 to $34,999 | 78 (6.6%) | 0 (0.0%) |
| $35,000 to $49,999 | 154 (13.0%) | 8 (0.2%) |
| $50,000 to $74,999 | 275 (23.3%) | 140 (3.2%) |
| $75,000 to $99,999 | 74 (6.3%) | 191 (4.4%) |
| $100,000 to $149,999 | 82 (6.9%) | 560 (12.9%) |
| $150,000 or more | 472 (40.0%) | 961 (22.1%) |
| Total | 1,181 (100.0%) | 4,353 (100.0%) |
Property Value to Household Income Ratio in North Laurel
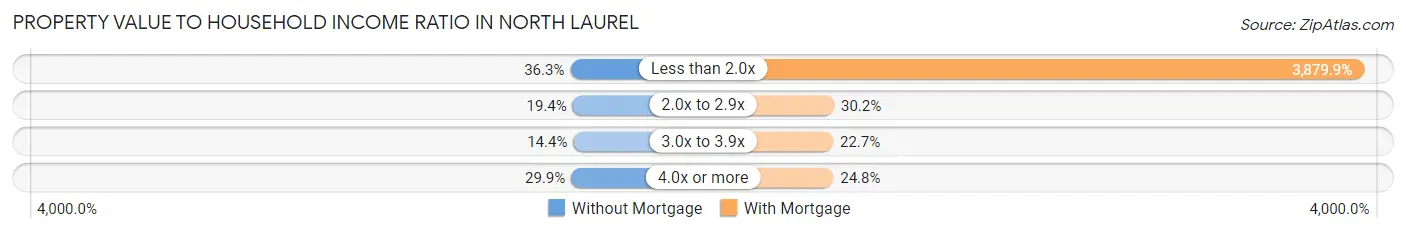
| Value-to-Income Ratio | Without Mortgage | With Mortgage |
| Less than 2.0x | 429 (36.3%) | 168,893 (3,879.9%) |
| 2.0x to 2.9x | 229 (19.4%) | 1,315 (30.2%) |
| 3.0x to 3.9x | 170 (14.4%) | 986 (22.7%) |
| 4.0x or more | 353 (29.9%) | 1,079 (24.8%) |
| Total | 1,181 (100.0%) | 4,353 (100.0%) |
Real Estate Taxes by Mortgage Status in North Laurel
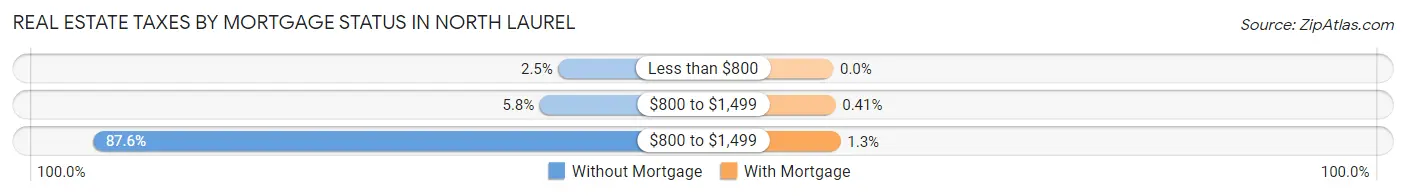
| Property Taxes | Without Mortgage | With Mortgage |
| Less than $800 | 29 (2.5%) | 0 (0.0%) |
| $800 to $1,499 | 69 (5.8%) | 18 (0.4%) |
| $800 to $1,499 | 1,034 (87.5%) | 58 (1.3%) |
| Total | 1,181 (100.0%) | 4,353 (100.0%) |
Health & Disability in North Laurel
Health Insurance Coverage by Age in North Laurel
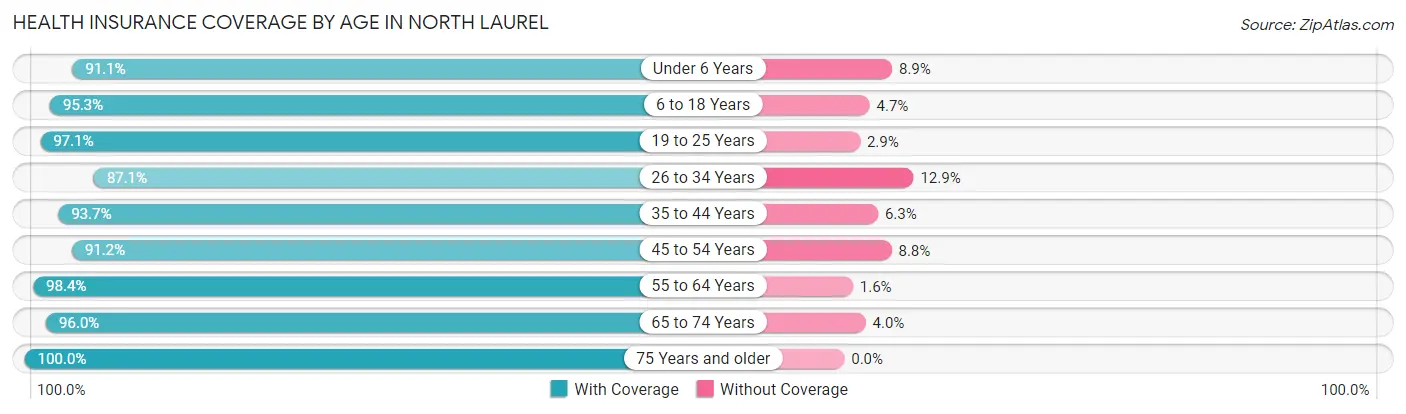
| Age Bracket | With Coverage | Without Coverage |
| Under 6 Years | 1,956 (91.1%) | 191 (8.9%) |
| 6 to 18 Years | 4,056 (95.3%) | 201 (4.7%) |
| 19 to 25 Years | 1,796 (97.1%) | 54 (2.9%) |
| 26 to 34 Years | 2,722 (87.1%) | 403 (12.9%) |
| 35 to 44 Years | 3,744 (93.7%) | 251 (6.3%) |
| 45 to 54 Years | 2,939 (91.2%) | 284 (8.8%) |
| 55 to 64 Years | 2,826 (98.4%) | 46 (1.6%) |
| 65 to 74 Years | 1,759 (96.0%) | 73 (4.0%) |
| 75 Years and older | 701 (100.0%) | 0 (0.0%) |
| Total | 22,499 (93.7%) | 1,503 (6.3%) |
Health Insurance Coverage by Citizenship Status in North Laurel
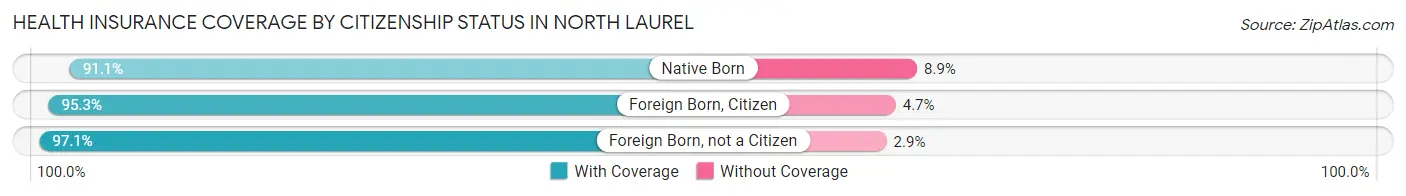
| Citizenship Status | With Coverage | Without Coverage |
| Native Born | 1,956 (91.1%) | 191 (8.9%) |
| Foreign Born, Citizen | 4,056 (95.3%) | 201 (4.7%) |
| Foreign Born, not a Citizen | 1,796 (97.1%) | 54 (2.9%) |
Health Insurance Coverage by Household Income in North Laurel
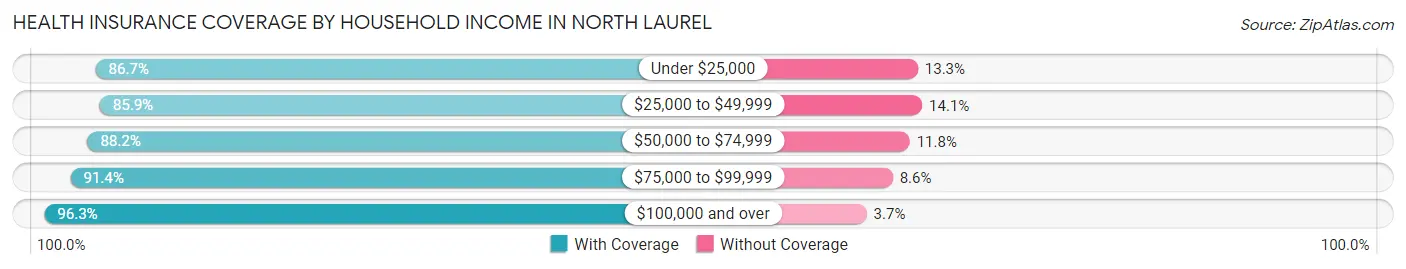
| Household Income | With Coverage | Without Coverage |
| Under $25,000 | 521 (86.7%) | 80 (13.3%) |
| $25,000 to $49,999 | 1,940 (85.9%) | 319 (14.1%) |
| $50,000 to $74,999 | 2,334 (88.2%) | 312 (11.8%) |
| $75,000 to $99,999 | 1,943 (91.4%) | 183 (8.6%) |
| $100,000 and over | 15,756 (96.3%) | 609 (3.7%) |
Public vs Private Health Insurance Coverage by Age in North Laurel
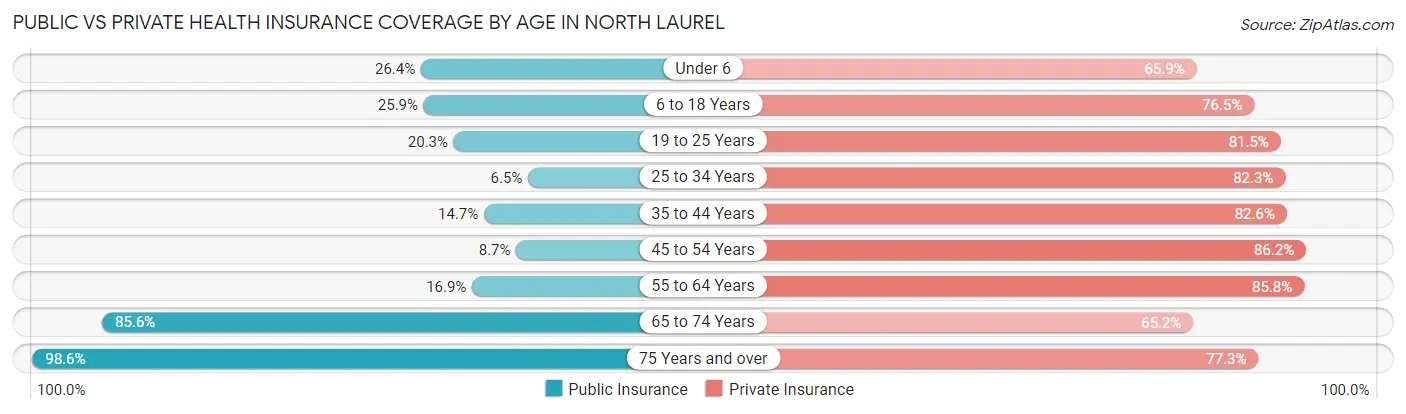
| Age Bracket | Public Insurance | Private Insurance |
| Under 6 | 567 (26.4%) | 1,414 (65.9%) |
| 6 to 18 Years | 1,102 (25.9%) | 3,258 (76.5%) |
| 19 to 25 Years | 376 (20.3%) | 1,507 (81.5%) |
| 25 to 34 Years | 204 (6.5%) | 2,572 (82.3%) |
| 35 to 44 Years | 588 (14.7%) | 3,299 (82.6%) |
| 45 to 54 Years | 281 (8.7%) | 2,778 (86.2%) |
| 55 to 64 Years | 486 (16.9%) | 2,464 (85.8%) |
| 65 to 74 Years | 1,569 (85.6%) | 1,195 (65.2%) |
| 75 Years and over | 691 (98.6%) | 542 (77.3%) |
| Total | 5,864 (24.4%) | 19,029 (79.3%) |
Disability Status by Sex by Age in North Laurel
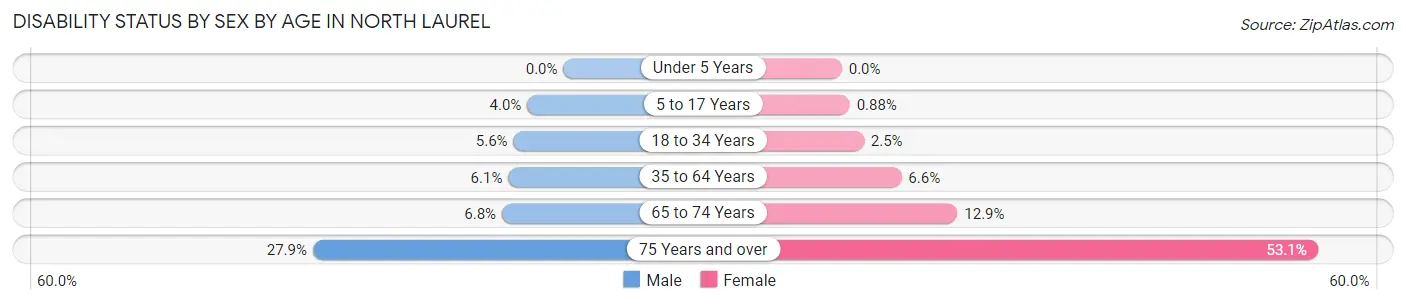
| Age Bracket | Male | Female |
| Under 5 Years | 0 (0.0%) | 0 (0.0%) |
| 5 to 17 Years | 82 (4.0%) | 19 (0.9%) |
| 18 to 34 Years | 129 (5.6%) | 73 (2.5%) |
| 35 to 64 Years | 283 (6.1%) | 364 (6.6%) |
| 65 to 74 Years | 53 (6.8%) | 136 (12.9%) |
| 75 Years and over | 101 (27.9%) | 180 (53.1%) |
Disability Class by Sex by Age in North Laurel
Disability Class: Hearing Difficulty
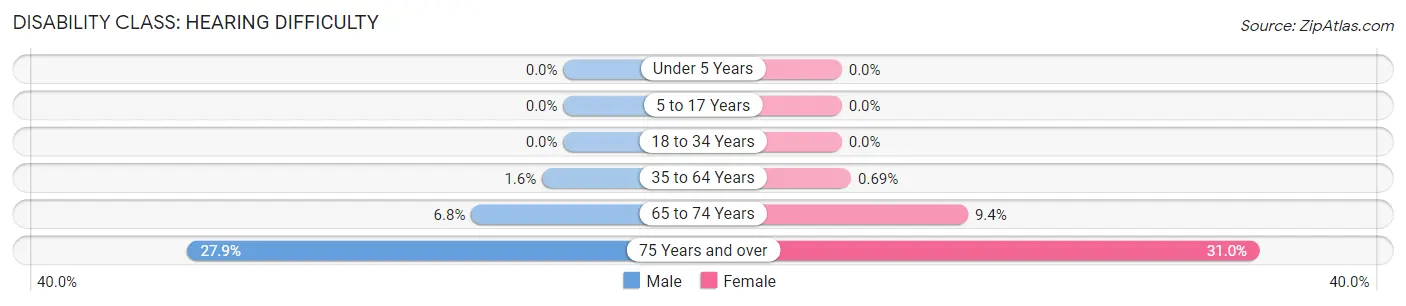
| Age Bracket | Male | Female |
| Under 5 Years | 0 (0.0%) | 0 (0.0%) |
| 5 to 17 Years | 0 (0.0%) | 0 (0.0%) |
| 18 to 34 Years | 0 (0.0%) | 0 (0.0%) |
| 35 to 64 Years | 73 (1.6%) | 38 (0.7%) |
| 65 to 74 Years | 53 (6.8%) | 99 (9.4%) |
| 75 Years and over | 101 (27.9%) | 105 (31.0%) |
Disability Class: Vision Difficulty
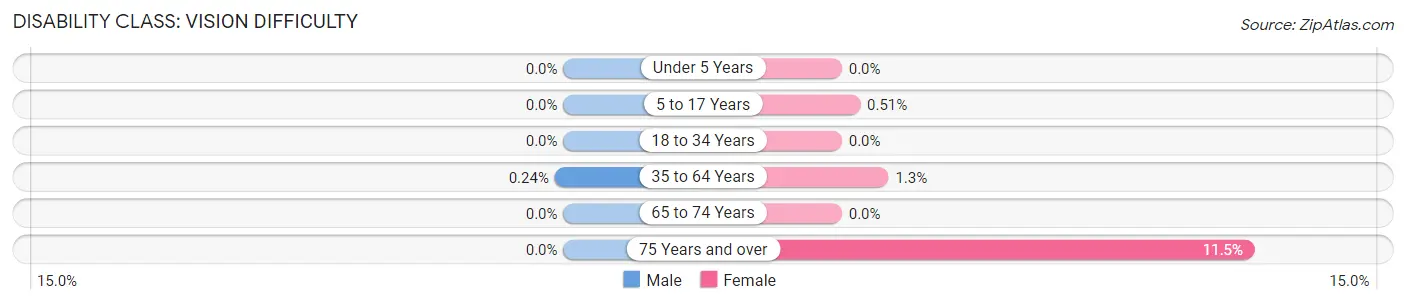
| Age Bracket | Male | Female |
| Under 5 Years | 0 (0.0%) | 0 (0.0%) |
| 5 to 17 Years | 0 (0.0%) | 11 (0.5%) |
| 18 to 34 Years | 0 (0.0%) | 0 (0.0%) |
| 35 to 64 Years | 11 (0.2%) | 71 (1.3%) |
| 65 to 74 Years | 0 (0.0%) | 0 (0.0%) |
| 75 Years and over | 0 (0.0%) | 39 (11.5%) |
Disability Class: Cognitive Difficulty
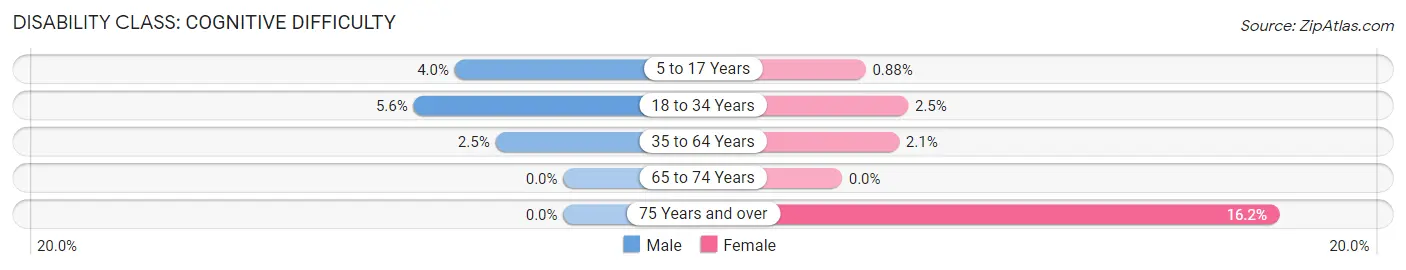
| Age Bracket | Male | Female |
| 5 to 17 Years | 82 (4.0%) | 19 (0.9%) |
| 18 to 34 Years | 129 (5.6%) | 73 (2.5%) |
| 35 to 64 Years | 116 (2.5%) | 116 (2.1%) |
| 65 to 74 Years | 0 (0.0%) | 0 (0.0%) |
| 75 Years and over | 0 (0.0%) | 55 (16.2%) |
Disability Class: Ambulatory Difficulty
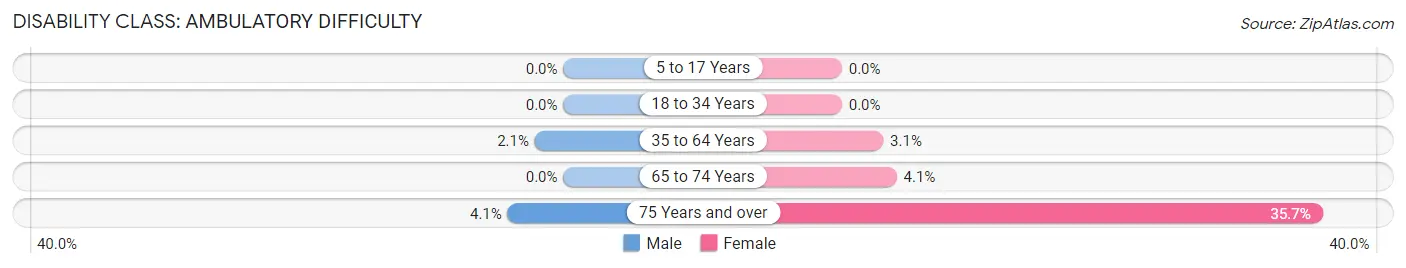
| Age Bracket | Male | Female |
| 5 to 17 Years | 0 (0.0%) | 0 (0.0%) |
| 18 to 34 Years | 0 (0.0%) | 0 (0.0%) |
| 35 to 64 Years | 98 (2.1%) | 168 (3.1%) |
| 65 to 74 Years | 0 (0.0%) | 43 (4.1%) |
| 75 Years and over | 15 (4.1%) | 121 (35.7%) |
Disability Class: Self-Care Difficulty
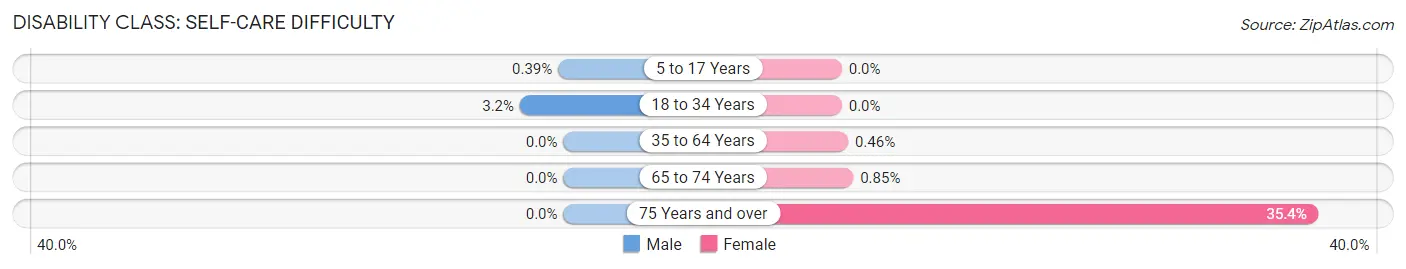
| Age Bracket | Male | Female |
| 5 to 17 Years | 8 (0.4%) | 0 (0.0%) |
| 18 to 34 Years | 75 (3.2%) | 0 (0.0%) |
| 35 to 64 Years | 0 (0.0%) | 25 (0.5%) |
| 65 to 74 Years | 0 (0.0%) | 9 (0.9%) |
| 75 Years and over | 0 (0.0%) | 120 (35.4%) |
Technology Access in North Laurel
Computing Device Access in North Laurel
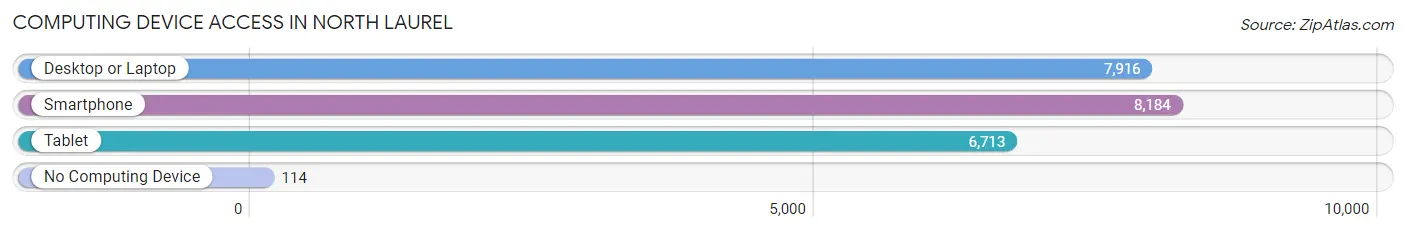
| Device Type | # Households | % Households |
| Desktop or Laptop | 7,916 | 91.4% |
| Smartphone | 8,184 | 94.6% |
| Tablet | 6,713 | 77.5% |
| No Computing Device | 114 | 1.3% |
| Total | 8,656 | 100.0% |
Internet Access in North Laurel
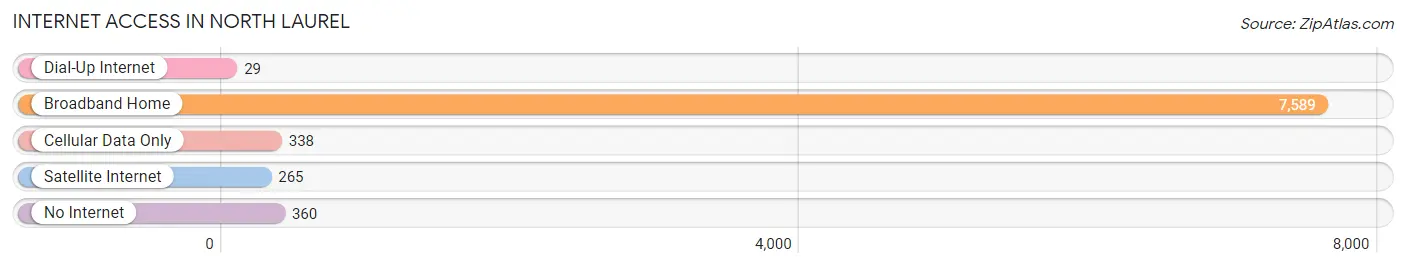
| Internet Type | # Households | % Households |
| Dial-Up Internet | 29 | 0.3% |
| Broadband Home | 7,589 | 87.7% |
| Cellular Data Only | 338 | 3.9% |
| Satellite Internet | 265 | 3.1% |
| No Internet | 360 | 4.2% |
| Total | 8,656 | 100.0% |
North Laurel Summary
History
The area now known as North Laurel, Maryland was first settled in the late 1700s by a group of Quakers from Pennsylvania. The Quakers were attracted to the area due to its fertile soil and abundant natural resources. The area was known as “Quaker Bottom” until the early 1800s when it was renamed “Laurel” after the laurel trees that grew in abundance in the area.
In the mid-1800s, the Baltimore and Ohio Railroad (B&O) was built through the area, connecting it to Baltimore and Washington, D.C. This allowed for the development of the area as a rural farming community. The area was largely agricultural until the 1950s when the population began to grow rapidly due to the construction of the Washington Suburban Sanitary Commission (WSSC) water and sewer lines. This allowed for the development of the area as a suburban community.
In the late 1960s, the area was officially incorporated as the Town of North Laurel. The town was named after the laurel trees that grew in abundance in the area. The town has since grown to become a vibrant and diverse community with a population of over 25,000.
Geography
North Laurel is located in central Maryland, approximately 20 miles north of Washington, D.C. and 25 miles south of Baltimore. The town is situated in the Piedmont region of Maryland, which is characterized by rolling hills and valleys. The area is drained by the Patuxent River and its tributaries.
The town is bordered by the towns of Savage and Jessup to the north, Columbia to the east, and Scaggsville to the south. The town is also bordered by Howard County to the west.
Economy
North Laurel’s economy is largely based on the service industry. The town is home to a variety of businesses, including restaurants, retail stores, and professional services. The town is also home to a number of corporate offices, including those of the WSSC, the Maryland Department of Transportation, and the Maryland State Police.
The town is also home to a number of industrial parks, which provide employment opportunities for local residents. The largest of these is the North Laurel Industrial Park, which is home to a variety of businesses, including manufacturing, warehousing, and distribution.
Demographics
As of the 2010 census, the population of North Laurel was 25,115. The population is racially diverse, with the largest racial group being White (63.3%), followed by African American (25.2%), Asian (4.7%), and Hispanic or Latino (4.3%).
The median household income in North Laurel is $76,845, which is higher than the national median of $53,482. The median age in North Laurel is 37.7, which is slightly lower than the national median of 37.8.
Conclusion
North Laurel, Maryland is a vibrant and diverse community located in central Maryland. The town has a rich history, dating back to the late 1700s when it was first settled by Quakers. The town has since grown to become a suburban community with a population of over 25,000. The town’s economy is largely based on the service industry, with a variety of businesses, corporate offices, and industrial parks providing employment opportunities for local residents. The population of North Laurel is racially diverse, with the largest racial group being White. The median household income in North Laurel is higher than the national median, and the median age is slightly lower than the national median.
Common Questions
What is Per Capita Income in North Laurel?
Per Capita income in North Laurel is $53,598.
What is the Median Family Income in North Laurel?
Median Family Income in North Laurel is $143,551.
What is the Median Household income in North Laurel?
Median Household Income in North Laurel is $115,294.
What is Income or Wage Gap in North Laurel?
Income or Wage Gap in North Laurel is 8.7%.
Women in North Laurel earn 91.3 cents for every dollar earned by a man.
What is Inequality or Gini Index in North Laurel?
Inequality or Gini Index in North Laurel is 0.39.
What is the Total Population of North Laurel?
Total Population of North Laurel is 24,414.
What is the Total Male Population of North Laurel?
Total Male Population of North Laurel is 11,416.
What is the Total Female Population of North Laurel?
Total Female Population of North Laurel is 12,998.
What is the Ratio of Males per 100 Females in North Laurel?
There are 87.83 Males per 100 Females in North Laurel.
What is the Ratio of Females per 100 Males in North Laurel?
There are 113.86 Females per 100 Males in North Laurel.
What is the Median Population Age in North Laurel?
Median Population Age in North Laurel is 35.8 Years.
What is the Average Family Size in North Laurel
Average Family Size in North Laurel is 3.4 People.
What is the Average Household Size in North Laurel
Average Household Size in North Laurel is 2.8 People.
How Large is the Labor Force in North Laurel?
There are 14,062 People in the Labor Forcein in North Laurel.
What is the Percentage of People in the Labor Force in North Laurel?
74.4% of People are in the Labor Force in North Laurel.
What is the Unemployment Rate in North Laurel?
Unemployment Rate in North Laurel is 3.0%.