White Oak, MD Map & Demographics
White Oak Map
White Oak Overview
$36,944
PER CAPITA INCOME
$77,435
AVG FAMILY INCOME
$75,373
AVG HOUSEHOLD INCOME
25.9%
WAGE / INCOME GAP [ % ]
74.1¢/ $1
WAGE / INCOME GAP [ $ ]
$12,114
FAMILY INCOME DEFICIT
0.45
INEQUALITY / GINI INDEX
15,489
TOTAL POPULATION
7,237
MALE POPULATION
8,252
FEMALE POPULATION
87.70
MALES / 100 FEMALES
114.03
FEMALES / 100 MALES
33.5
MEDIAN AGE
3.3
AVG FAMILY SIZE
2.6
AVG HOUSEHOLD SIZE
8,409
LABOR FORCE [ PEOPLE ]
70.4%
PERCENT IN LABOR FORCE
7.3%
UNEMPLOYMENT RATE
Income in White Oak
Income Overview in White Oak
Per Capita Income in White Oak is $36,944, while median incomes of families and households are $77,435 and $75,373 respectively.
| Characteristic | Number | Measure |
| Per Capita Income | 15,489 | $36,944 |
| Median Family Income | 3,747 | $77,435 |
| Mean Family Income | 3,747 | $105,740 |
| Median Household Income | 5,876 | $75,373 |
| Mean Household Income | 5,876 | $94,671 |
| Income Deficit | 3,747 | $12,114 |
| Wage / Income Gap (%) | 15,489 | 25.94% |
| Wage / Income Gap ($) | 15,489 | 74.06¢ per $1 |
| Gini / Inequality Index | 15,489 | 0.45 |
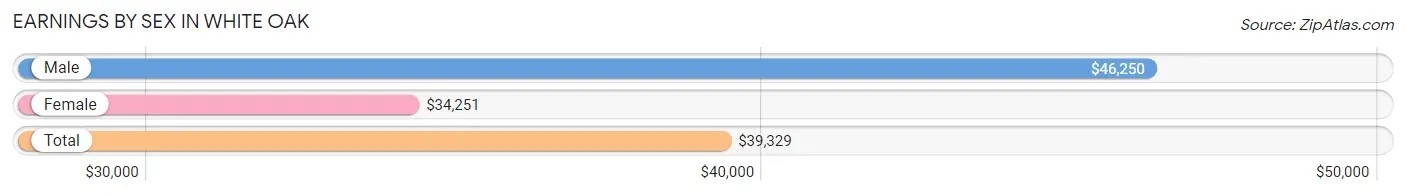
Earnings by Sex in White Oak
Average Earnings in White Oak are $39,329, $46,250 for men and $34,251 for women, a difference of 25.9%.
| Sex | Number | Average Earnings |
| Male | 4,441 (49.5%) | $46,250 |
| Female | 4,534 (50.5%) | $34,251 |
| Total | 8,975 (100.0%) | $39,329 |
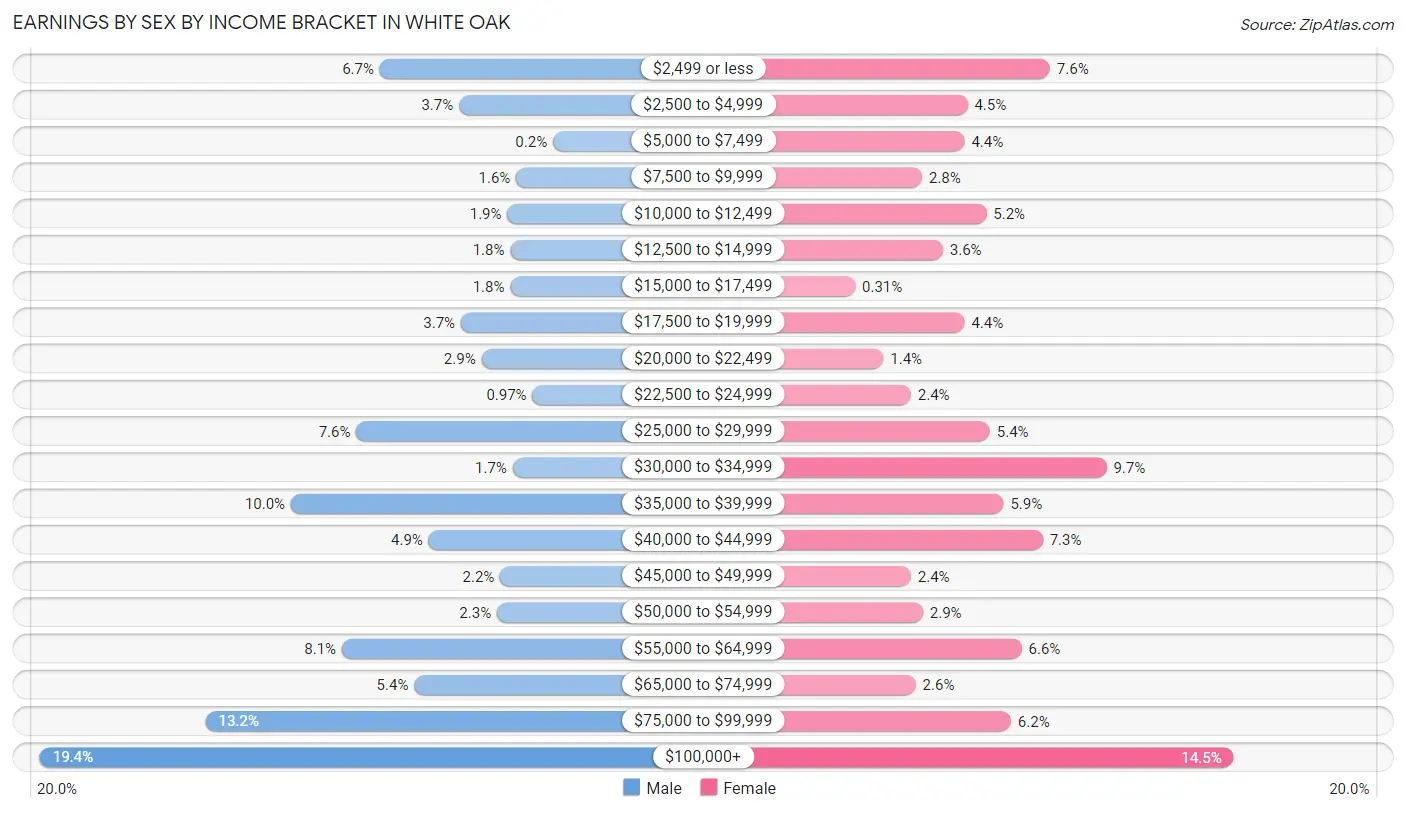
Earnings by Sex by Income Bracket in White Oak
The most common earnings brackets in White Oak are $100,000+ for men (863 | 19.4%) and $100,000+ for women (657 | 14.5%).
| Income | Male | Female |
| $2,499 or less | 297 (6.7%) | 345 (7.6%) |
| $2,500 to $4,999 | 165 (3.7%) | 205 (4.5%) |
| $5,000 to $7,499 | 9 (0.2%) | 200 (4.4%) |
| $7,500 to $9,999 | 70 (1.6%) | 128 (2.8%) |
| $10,000 to $12,499 | 85 (1.9%) | 237 (5.2%) |
| $12,500 to $14,999 | 80 (1.8%) | 163 (3.6%) |
| $15,000 to $17,499 | 80 (1.8%) | 14 (0.3%) |
| $17,500 to $19,999 | 162 (3.6%) | 200 (4.4%) |
| $20,000 to $22,499 | 128 (2.9%) | 62 (1.4%) |
| $22,500 to $24,999 | 43 (1.0%) | 109 (2.4%) |
| $25,000 to $29,999 | 336 (7.6%) | 243 (5.4%) |
| $30,000 to $34,999 | 76 (1.7%) | 441 (9.7%) |
| $35,000 to $39,999 | 445 (10.0%) | 266 (5.9%) |
| $40,000 to $44,999 | 216 (4.9%) | 333 (7.3%) |
| $45,000 to $49,999 | 97 (2.2%) | 109 (2.4%) |
| $50,000 to $54,999 | 102 (2.3%) | 129 (2.9%) |
| $55,000 to $64,999 | 360 (8.1%) | 297 (6.6%) |
| $65,000 to $74,999 | 240 (5.4%) | 117 (2.6%) |
| $75,000 to $99,999 | 587 (13.2%) | 279 (6.1%) |
| $100,000+ | 863 (19.4%) | 657 (14.5%) |
| Total | 4,441 (100.0%) | 4,534 (100.0%) |
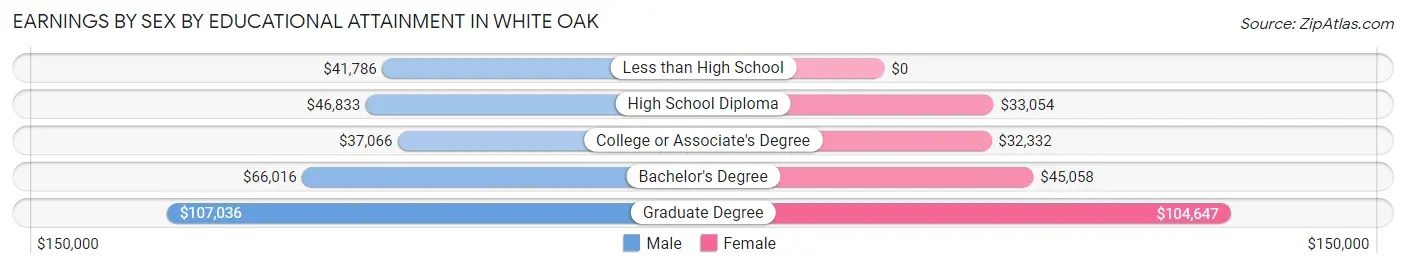
Earnings by Sex by Educational Attainment in White Oak
Average earnings in White Oak are $57,250 for men and $37,420 for women, a difference of 34.6%. Men with an educational attainment of graduate degree enjoy the highest average annual earnings of $107,036, while those with college or associate's degree education earn the least with $37,066. Women with an educational attainment of graduate degree earn the most with the average annual earnings of $104,647, while those with college or associate's degree education have the smallest earnings of $32,332.
| Educational Attainment | Male Income | Female Income |
| Less than High School | $41,786 | $0 |
| High School Diploma | $46,833 | $33,054 |
| College or Associate's Degree | $37,066 | $32,332 |
| Bachelor's Degree | $66,016 | $45,058 |
| Graduate Degree | $107,036 | $104,647 |
| Total | $57,250 | $37,420 |
Family Income in White Oak
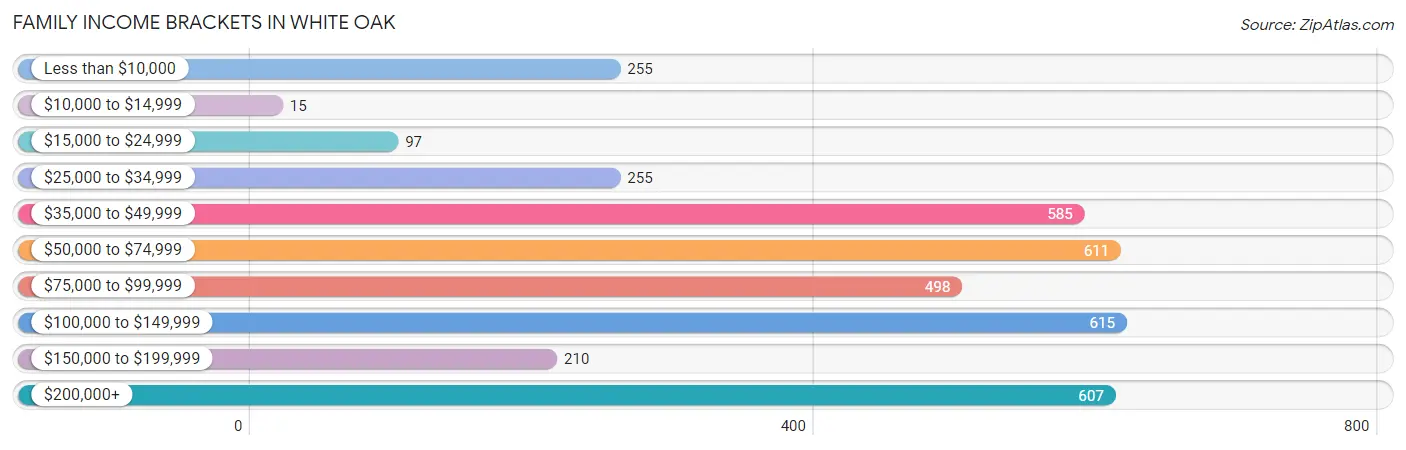
Family Income Brackets in White Oak
According to the White Oak family income data, there are 615 families falling into the $100,000 to $149,999 income range, which is the most common income bracket and makes up 16.4% of all families. Conversely, the $10,000 to $14,999 income bracket is the least frequent group with only 15 families (0.4%) belonging to this category.
| Income Bracket | # Families | % Families |
| Less than $10,000 | 255 | 6.8% |
| $10,000 to $14,999 | 15 | 0.4% |
| $15,000 to $24,999 | 97 | 2.6% |
| $25,000 to $34,999 | 255 | 6.8% |
| $35,000 to $49,999 | 585 | 15.6% |
| $50,000 to $74,999 | 611 | 16.3% |
| $75,000 to $99,999 | 498 | 13.3% |
| $100,000 to $149,999 | 615 | 16.4% |
| $150,000 to $199,999 | 210 | 5.6% |
| $200,000+ | 607 | 16.2% |
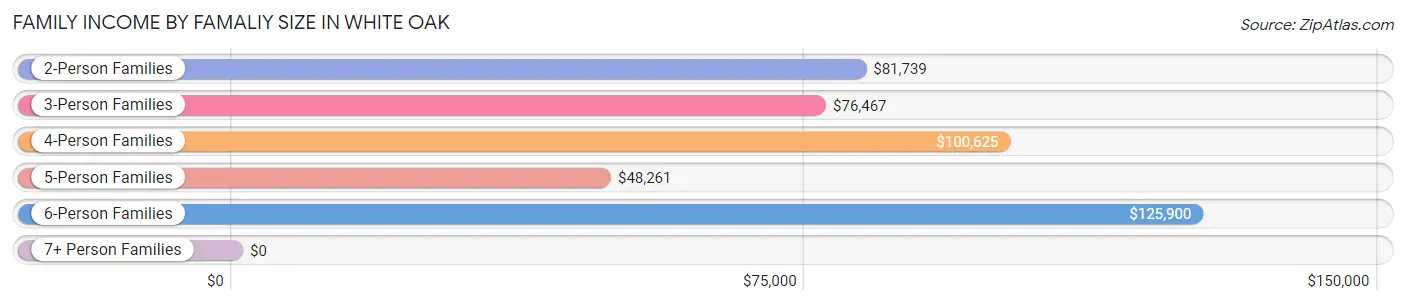
Family Income by Famaliy Size in White Oak
6-person families (80 | 2.1%) account for the highest median family income in White Oak with $125,900 per family, while 2-person families (1,234 | 32.9%) have the highest median income of $40,870 per family member.
| Income Bracket | # Families | Median Income |
| 2-Person Families | 1,234 (32.9%) | $81,739 |
| 3-Person Families | 963 (25.7%) | $76,467 |
| 4-Person Families | 974 (26.0%) | $100,625 |
| 5-Person Families | 496 (13.2%) | $48,261 |
| 6-Person Families | 80 (2.1%) | $125,900 |
| 7+ Person Families | 0 (0.0%) | $0 |
| Total | 3,747 (100.0%) | $77,435 |
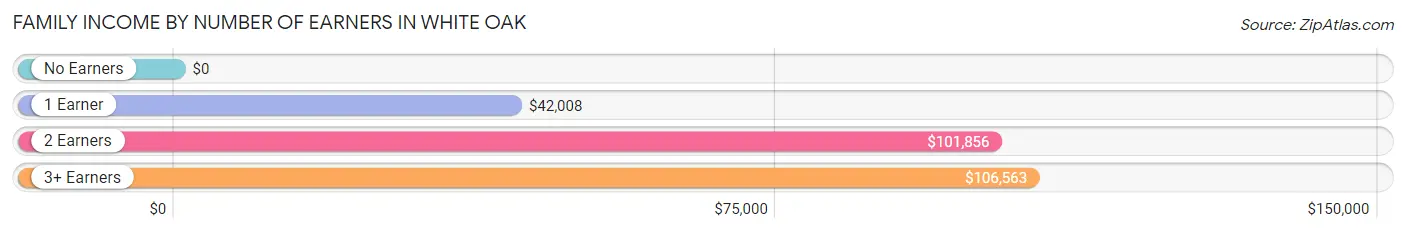
Family Income by Number of Earners in White Oak
| Number of Earners | # Families | Median Income |
| No Earners | 228 (6.1%) | $0 |
| 1 Earner | 1,289 (34.4%) | $42,008 |
| 2 Earners | 1,554 (41.5%) | $101,856 |
| 3+ Earners | 676 (18.0%) | $106,563 |
| Total | 3,747 (100.0%) | $77,435 |
Household Income in White Oak
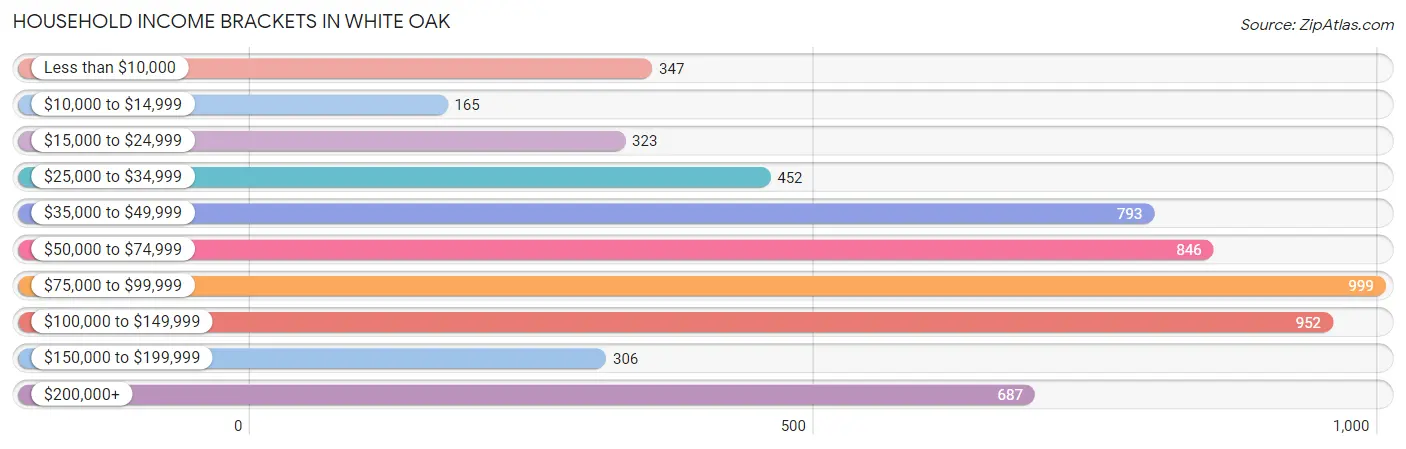
Household Income Brackets in White Oak
With 999 households falling in the category, the $75,000 to $99,999 income range is the most frequent in White Oak, accounting for 17.0% of all households. In contrast, only 165 households (2.8%) fall into the $10,000 to $14,999 income bracket, making it the least populous group.
| Income Bracket | # Households | % Households |
| Less than $10,000 | 347 | 5.9% |
| $10,000 to $14,999 | 165 | 2.8% |
| $15,000 to $24,999 | 323 | 5.5% |
| $25,000 to $34,999 | 452 | 7.7% |
| $35,000 to $49,999 | 793 | 13.5% |
| $50,000 to $74,999 | 846 | 14.4% |
| $75,000 to $99,999 | 999 | 17.0% |
| $100,000 to $149,999 | 952 | 16.2% |
| $150,000 to $199,999 | 306 | 5.2% |
| $200,000+ | 687 | 11.7% |
Household Income by Householder Age in White Oak
The median household income in White Oak is $75,373, with the highest median household income of $81,674 found in the 45 to 64 years age bracket for the primary householder. A total of 2,297 households (39.1%) fall into this category. Meanwhile, the 65+ years age bracket for the primary householder has the lowest median household income of $43,507, with 1,187 households (20.2%) in this group.
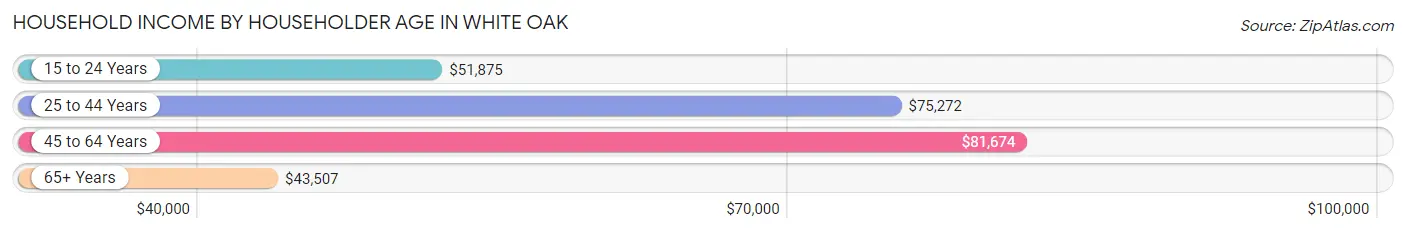
| Income Bracket | # Households | Median Income |
| 15 to 24 Years | 111 (1.9%) | $51,875 |
| 25 to 44 Years | 2,281 (38.8%) | $75,272 |
| 45 to 64 Years | 2,297 (39.1%) | $81,674 |
| 65+ Years | 1,187 (20.2%) | $43,507 |
| Total | 5,876 (100.0%) | $75,373 |
Poverty in White Oak
Income Below Poverty by Sex and Age in White Oak
With 14.3% poverty level for males and 13.1% for females among the residents of White Oak, 12 to 14 year old males and 75 year old and over females are the most vulnerable to poverty, with 123 males (47.5%) and 99 females (43.4%) in their respective age groups living below the poverty level.
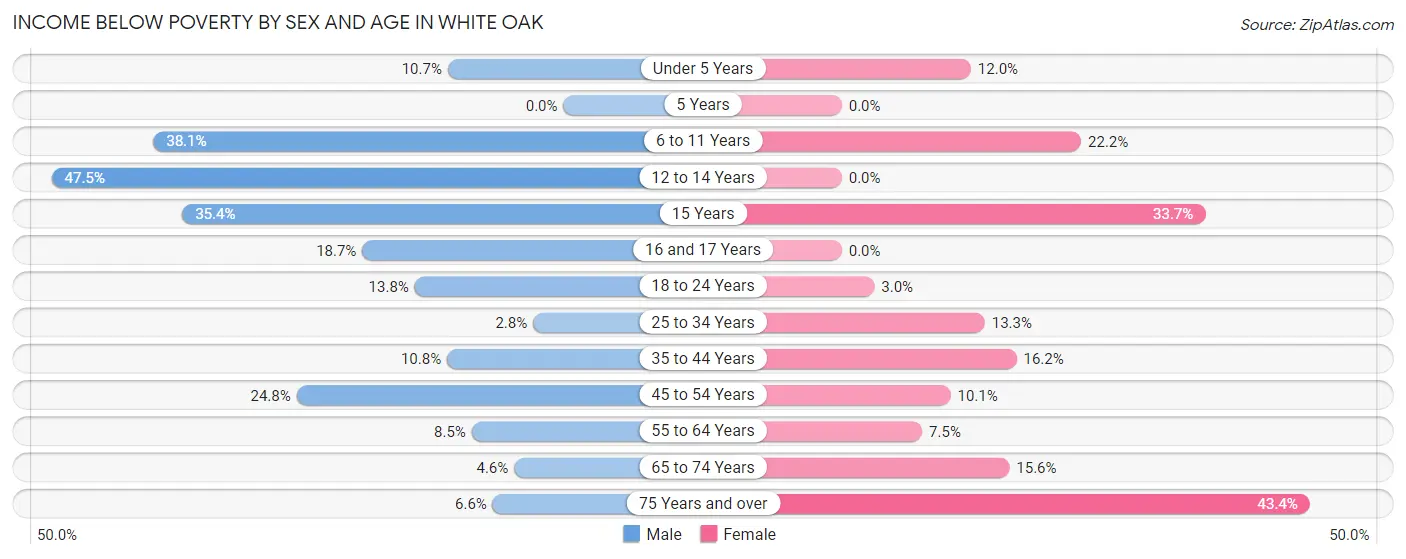
| Age Bracket | Male | Female |
| Under 5 Years | 76 (10.7%) | 75 (12.0%) |
| 5 Years | 0 (0.0%) | 0 (0.0%) |
| 6 to 11 Years | 183 (38.1%) | 183 (22.2%) |
| 12 to 14 Years | 123 (47.5%) | 0 (0.0%) |
| 15 Years | 29 (35.4%) | 29 (33.7%) |
| 16 and 17 Years | 31 (18.7%) | 0 (0.0%) |
| 18 to 24 Years | 101 (13.8%) | 22 (3.0%) |
| 25 to 34 Years | 36 (2.8%) | 182 (13.3%) |
| 35 to 44 Years | 100 (10.8%) | 202 (16.2%) |
| 45 to 54 Years | 260 (24.8%) | 93 (10.1%) |
| 55 to 64 Years | 64 (8.5%) | 63 (7.5%) |
| 65 to 74 Years | 23 (4.6%) | 132 (15.5%) |
| 75 Years and over | 8 (6.6%) | 99 (43.4%) |
| Total | 1,034 (14.3%) | 1,080 (13.1%) |
Income Above Poverty by Sex and Age in White Oak
According to the poverty statistics in White Oak, males aged 5 years and females aged 5 years are the age groups that are most secure financially, with 100.0% of males and 100.0% of females in these age groups living above the poverty line.
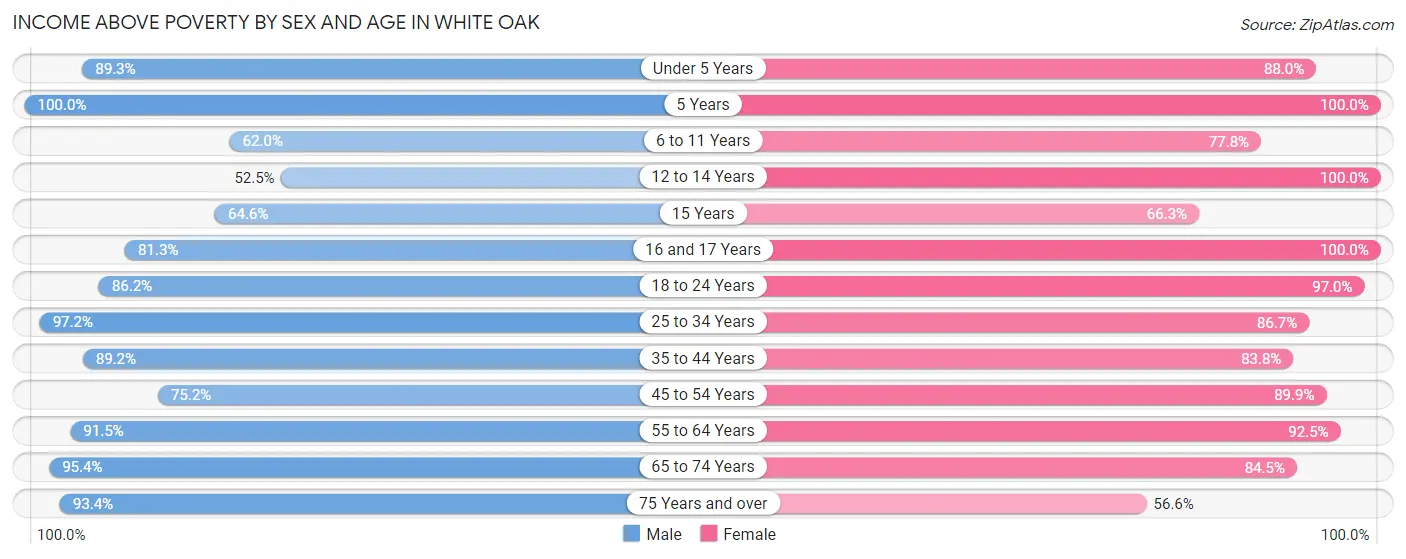
| Age Bracket | Male | Female |
| Under 5 Years | 632 (89.3%) | 551 (88.0%) |
| 5 Years | 153 (100.0%) | 83 (100.0%) |
| 6 to 11 Years | 298 (62.0%) | 641 (77.8%) |
| 12 to 14 Years | 136 (52.5%) | 203 (100.0%) |
| 15 Years | 53 (64.6%) | 57 (66.3%) |
| 16 and 17 Years | 135 (81.3%) | 220 (100.0%) |
| 18 to 24 Years | 631 (86.2%) | 707 (97.0%) |
| 25 to 34 Years | 1,245 (97.2%) | 1,189 (86.7%) |
| 35 to 44 Years | 826 (89.2%) | 1,043 (83.8%) |
| 45 to 54 Years | 790 (75.2%) | 829 (89.9%) |
| 55 to 64 Years | 688 (91.5%) | 782 (92.5%) |
| 65 to 74 Years | 480 (95.4%) | 717 (84.5%) |
| 75 Years and over | 114 (93.4%) | 129 (56.6%) |
| Total | 6,181 (85.7%) | 7,151 (86.9%) |
Income Below Poverty Among Married-Couple Families in White Oak
The poverty statistics for married-couple families in White Oak show that 10.1% or 236 of the total 2,327 families live below the poverty line. Families with 1 or 2 children have the highest poverty rate of 14.1%, comprising of 130 families. On the other hand, families with no children have the lowest poverty rate of 6.6%, which includes 75 families.
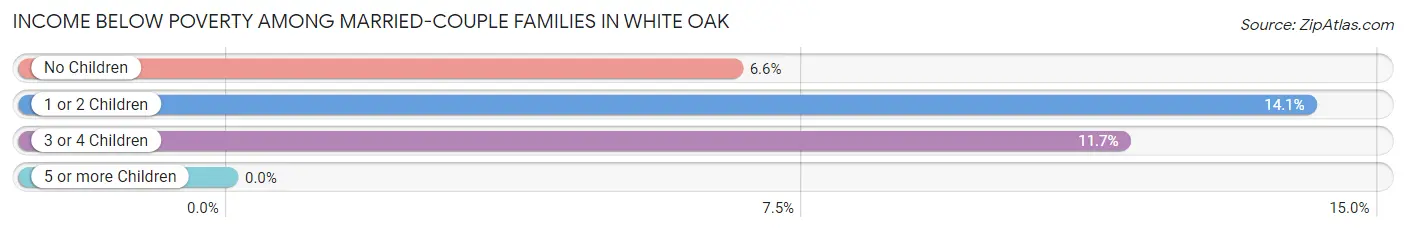
| Children | Above Poverty | Below Poverty |
| No Children | 1,063 (93.4%) | 75 (6.6%) |
| 1 or 2 Children | 793 (85.9%) | 130 (14.1%) |
| 3 or 4 Children | 235 (88.3%) | 31 (11.7%) |
| 5 or more Children | 0 (0.0%) | 0 (0.0%) |
| Total | 2,091 (89.9%) | 236 (10.1%) |
Income Below Poverty Among Single-Parent Households in White Oak
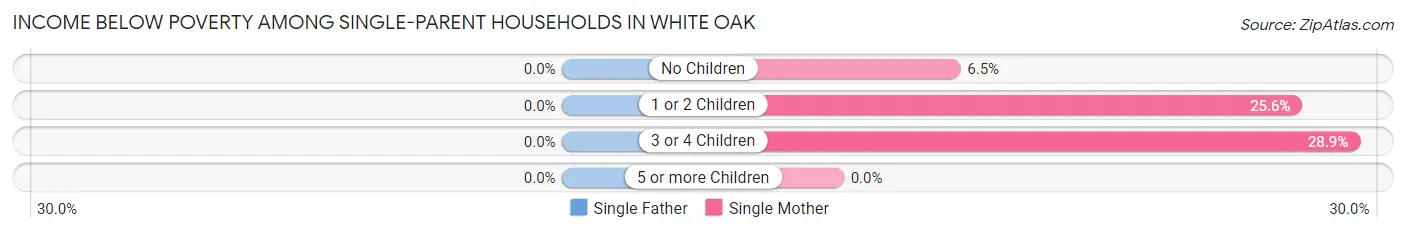
| Children | Single Father | Single Mother |
| No Children | 0 (0.0%) | 36 (6.5%) |
| 1 or 2 Children | 0 (0.0%) | 123 (25.6%) |
| 3 or 4 Children | 0 (0.0%) | 60 (28.8%) |
| 5 or more Children | 0 (0.0%) | 0 (0.0%) |
| Total | 0 (0.0%) | 219 (17.7%) |
Income Below Poverty Among Married-Couple vs Single-Parent Households in White Oak
The poverty data for White Oak shows that 236 of the married-couple family households (10.1%) and 219 of the single-parent households (15.4%) are living below the poverty level. Within the married-couple family households, those with 1 or 2 children have the highest poverty rate, with 130 households (14.1%) falling below the poverty line. Among the single-parent households, those with 3 or 4 children have the highest poverty rate, with 60 household (28.8%) living below poverty.
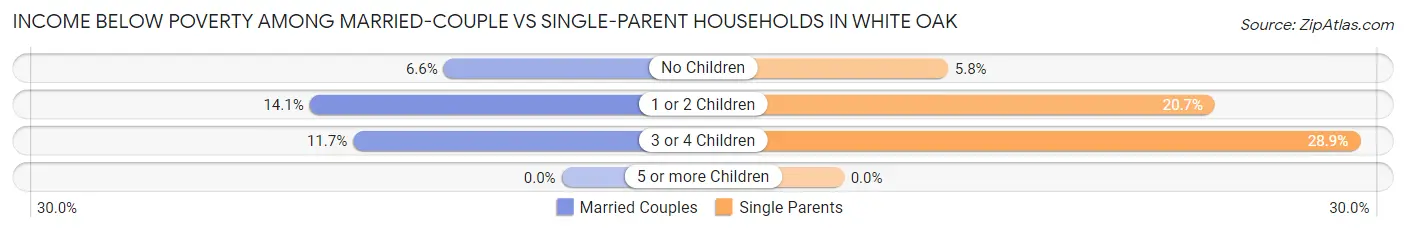
| Children | Married-Couple Families | Single-Parent Households |
| No Children | 75 (6.6%) | 36 (5.8%) |
| 1 or 2 Children | 130 (14.1%) | 123 (20.7%) |
| 3 or 4 Children | 31 (11.7%) | 60 (28.8%) |
| 5 or more Children | 0 (0.0%) | 0 (0.0%) |
| Total | 236 (10.1%) | 219 (15.4%) |
Race in White Oak
The most populous races in White Oak are Black / African American (9,840 | 63.5%), Hispanic or Latino (2,647 | 17.1%), and White / Caucasian (2,197 | 14.2%).
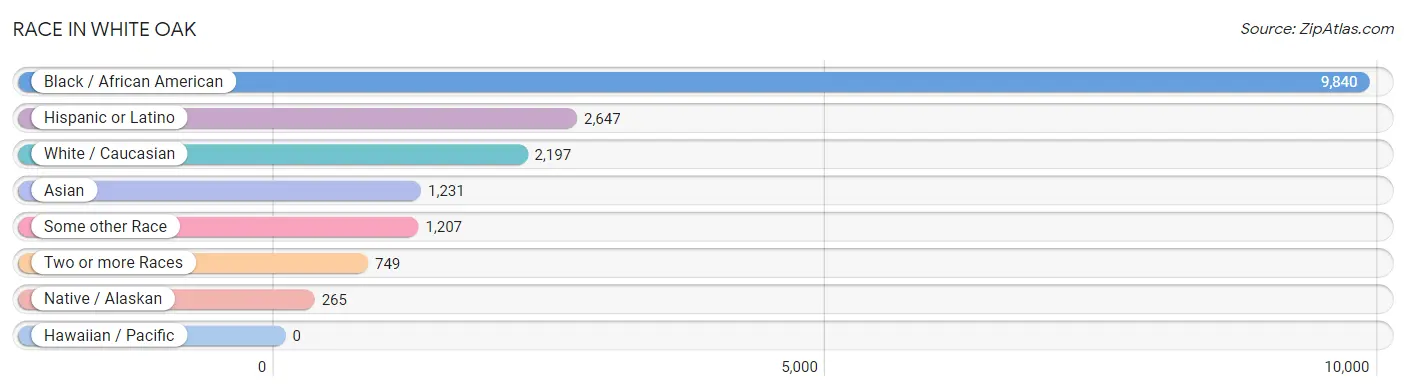
| Race | # Population | % Population |
| Asian | 1,231 | 8.0% |
| Black / African American | 9,840 | 63.5% |
| Hawaiian / Pacific | 0 | 0.0% |
| Hispanic or Latino | 2,647 | 17.1% |
| Native / Alaskan | 265 | 1.7% |
| White / Caucasian | 2,197 | 14.2% |
| Two or more Races | 749 | 4.8% |
| Some other Race | 1,207 | 7.8% |
| Total | 15,489 | 100.0% |
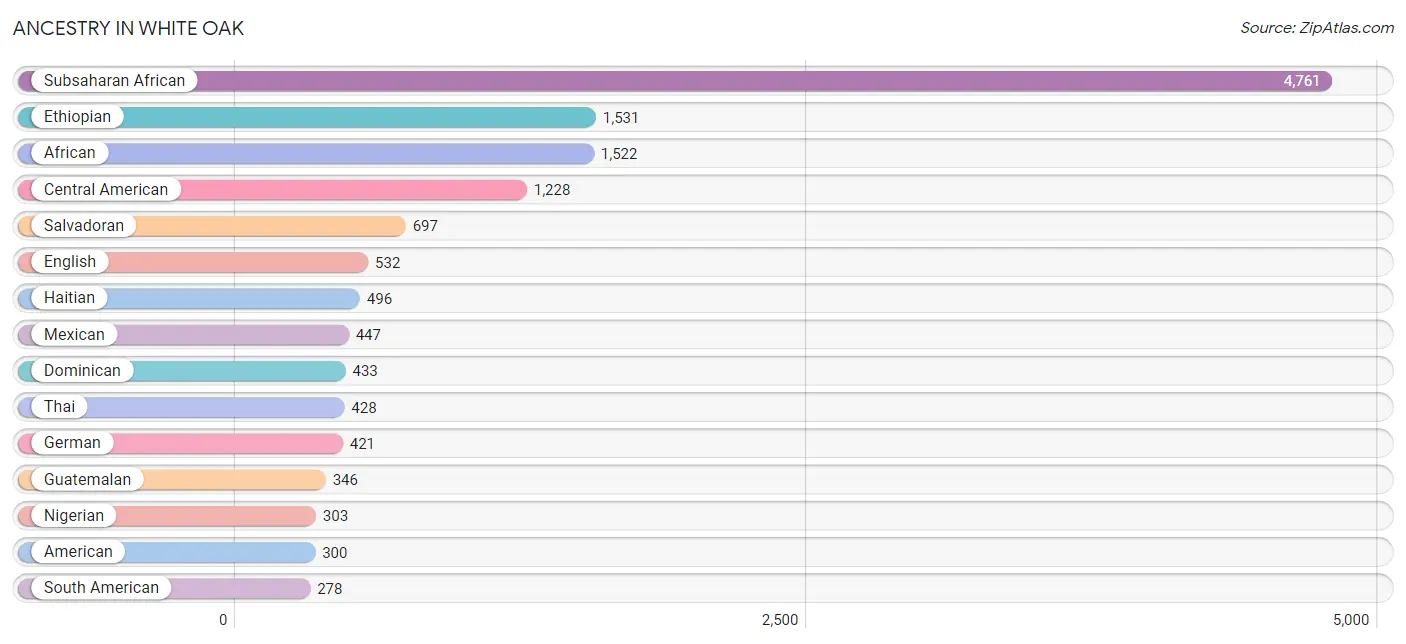
Ancestry in White Oak
The most populous ancestries reported in White Oak are Subsaharan African (4,761 | 30.7%), Ethiopian (1,531 | 9.9%), African (1,522 | 9.8%), Central American (1,228 | 7.9%), and Salvadoran (697 | 4.5%), together accounting for 62.9% of all White Oak residents.
| Ancestry | # Population | % Population |
| Afghan | 87 | 0.6% |
| African | 1,522 | 9.8% |
| American | 300 | 1.9% |
| Apache | 51 | 0.3% |
| Arab | 11 | 0.1% |
| Argentinean | 108 | 0.7% |
| Austrian | 17 | 0.1% |
| Barbadian | 11 | 0.1% |
| Bhutanese | 110 | 0.7% |
| Bolivian | 101 | 0.6% |
| Brazilian | 13 | 0.1% |
| Bulgarian | 9 | 0.1% |
| Burmese | 51 | 0.3% |
| Cambodian | 45 | 0.3% |
| Central American | 1,228 | 7.9% |
| Central American Indian | 113 | 0.7% |
| Cherokee | 88 | 0.6% |
| Colombian | 37 | 0.2% |
| Dominican | 433 | 2.8% |
| Eastern European | 13 | 0.1% |
| English | 532 | 3.4% |
| Ethiopian | 1,531 | 9.9% |
| European | 17 | 0.1% |
| French | 26 | 0.2% |
| French Canadian | 8 | 0.1% |
| German | 421 | 2.7% |
| Ghanaian | 98 | 0.6% |
| Greek | 10 | 0.1% |
| Guatemalan | 346 | 2.2% |
| Haitian | 496 | 3.2% |
| Honduran | 53 | 0.3% |
| Indian (Asian) | 130 | 0.8% |
| Iranian | 58 | 0.4% |
| Irish | 224 | 1.5% |
| Israeli | 12 | 0.1% |
| Italian | 212 | 1.4% |
| Jamaican | 226 | 1.5% |
| Korean | 134 | 0.9% |
| Laotian | 71 | 0.5% |
| Latvian | 40 | 0.3% |
| Lebanese | 11 | 0.1% |
| Liberian | 133 | 0.9% |
| Macedonian | 8 | 0.1% |
| Mexican | 447 | 2.9% |
| Mexican American Indian | 135 | 0.9% |
| Nicaraguan | 132 | 0.9% |
| Nigerian | 303 | 2.0% |
| Northern European | 17 | 0.1% |
| Norwegian | 12 | 0.1% |
| Peruvian | 32 | 0.2% |
| Polish | 99 | 0.6% |
| Portuguese | 21 | 0.1% |
| Puerto Rican | 60 | 0.4% |
| Romanian | 3 | 0.0% |
| Russian | 77 | 0.5% |
| Salvadoran | 697 | 4.5% |
| Scotch-Irish | 42 | 0.3% |
| Scottish | 84 | 0.5% |
| Senegalese | 112 | 0.7% |
| Sierra Leonean | 28 | 0.2% |
| Slavic | 10 | 0.1% |
| South American | 278 | 1.8% |
| South American Indian | 27 | 0.2% |
| Spaniard | 19 | 0.1% |
| Sri Lankan | 115 | 0.7% |
| Subsaharan African | 4,761 | 30.7% |
| Swedish | 11 | 0.1% |
| Swiss | 21 | 0.1% |
| Thai | 428 | 2.8% |
| Turkish | 27 | 0.2% |
| Ukrainian | 31 | 0.2% |
| Vietnamese | 46 | 0.3% | View All 72 Rows |
Immigrants in White Oak
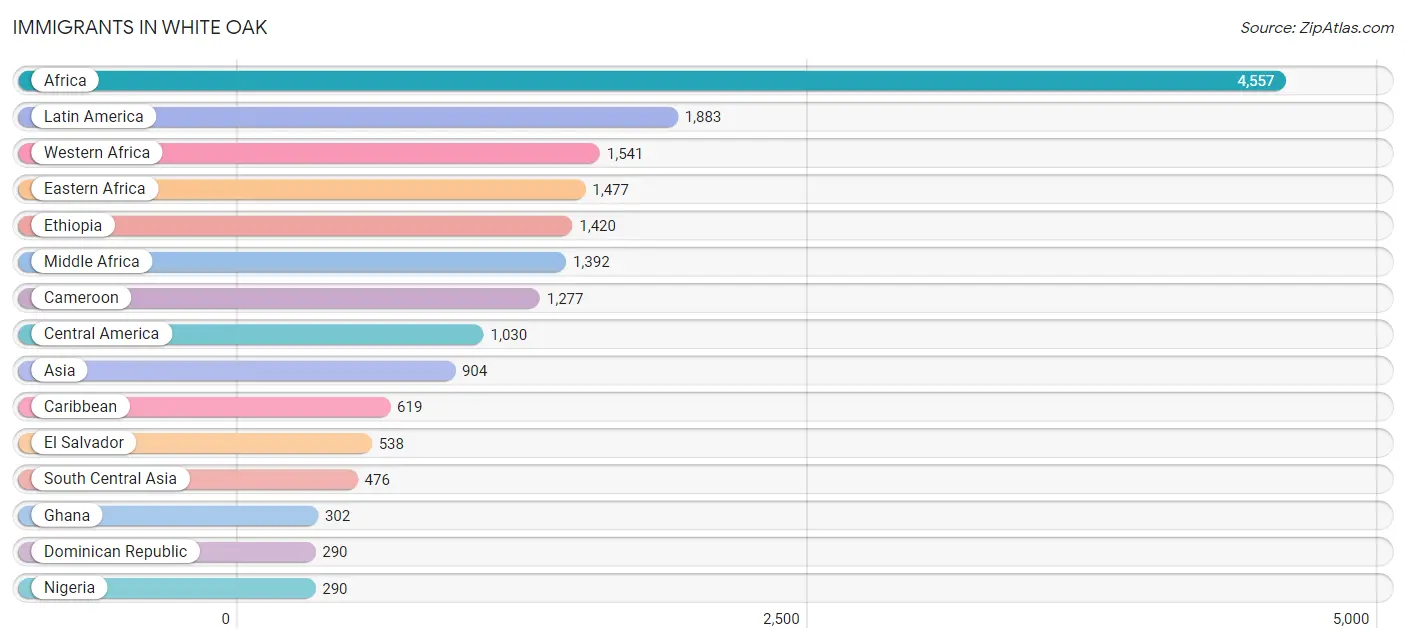
The most numerous immigrant groups reported in White Oak came from Africa (4,557 | 29.4%), Latin America (1,883 | 12.2%), Western Africa (1,541 | 10.0%), Eastern Africa (1,477 | 9.5%), and Ethiopia (1,420 | 9.2%), together accounting for 70.2% of all White Oak residents.
| Immigration Origin | # Population | % Population |
| Afghanistan | 49 | 0.3% |
| Africa | 4,557 | 29.4% |
| Asia | 904 | 5.8% |
| Bangladesh | 215 | 1.4% |
| Belgium | 17 | 0.1% |
| Bolivia | 76 | 0.5% |
| Brazil | 54 | 0.4% |
| Cameroon | 1,277 | 8.2% |
| Canada | 19 | 0.1% |
| Caribbean | 619 | 4.0% |
| Central America | 1,030 | 6.7% |
| China | 136 | 0.9% |
| Colombia | 37 | 0.2% |
| Dominican Republic | 290 | 1.9% |
| Eastern Africa | 1,477 | 9.5% |
| Eastern Asia | 265 | 1.7% |
| Eastern Europe | 8 | 0.1% |
| El Salvador | 538 | 3.5% |
| Eritrea | 35 | 0.2% |
| Ethiopia | 1,420 | 9.2% |
| Europe | 33 | 0.2% |
| Ghana | 302 | 1.9% |
| Guatemala | 154 | 1.0% |
| Guyana | 57 | 0.4% |
| Haiti | 240 | 1.5% |
| India | 183 | 1.2% |
| Indonesia | 18 | 0.1% |
| Iran | 28 | 0.2% |
| Jamaica | 74 | 0.5% |
| Japan | 29 | 0.2% |
| Korea | 55 | 0.4% |
| Latin America | 1,883 | 12.2% |
| Liberia | 85 | 0.5% |
| Mexico | 238 | 1.5% |
| Middle Africa | 1,392 | 9.0% |
| Nicaragua | 100 | 0.6% |
| Nigeria | 290 | 1.9% |
| North Macedonia | 8 | 0.1% |
| Northern Europe | 8 | 0.1% |
| Pakistan | 1 | 0.0% |
| Peru | 10 | 0.1% |
| Philippines | 102 | 0.7% |
| Senegal | 160 | 1.0% |
| Sierra Leone | 243 | 1.6% |
| South America | 234 | 1.5% |
| South Central Asia | 476 | 3.1% |
| South Eastern Asia | 144 | 0.9% |
| Taiwan | 30 | 0.2% |
| Trinidad and Tobago | 15 | 0.1% |
| Turkey | 19 | 0.1% |
| Uganda | 22 | 0.1% |
| Vietnam | 24 | 0.2% |
| Western Africa | 1,541 | 10.0% |
| Western Asia | 19 | 0.1% |
| Western Europe | 17 | 0.1% |
| Zaire | 66 | 0.4% | View All 56 Rows |
Sex and Age in White Oak
Sex and Age in White Oak
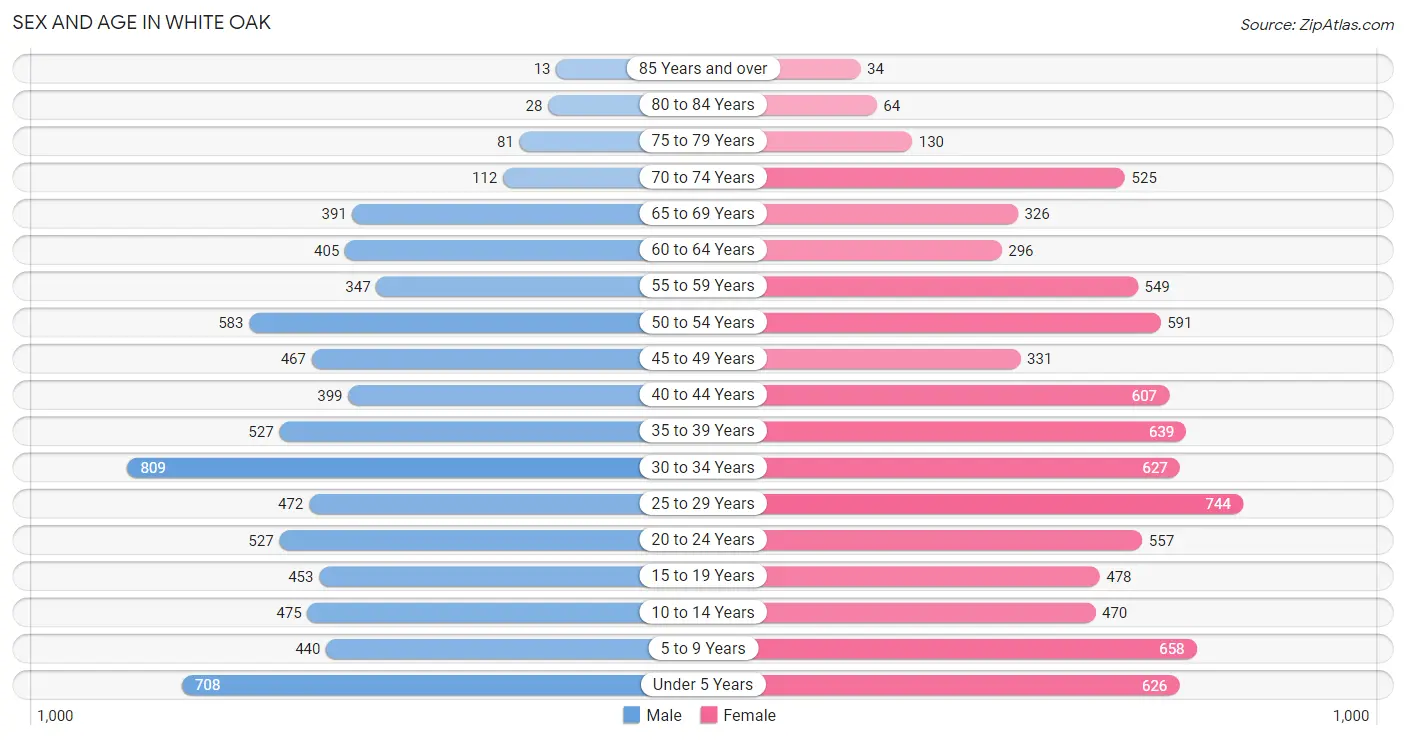
The most populous age groups in White Oak are 30 to 34 Years (809 | 11.2%) for men and 25 to 29 Years (744 | 9.0%) for women.
| Age Bracket | Male | Female |
| Under 5 Years | 708 (9.8%) | 626 (7.6%) |
| 5 to 9 Years | 440 (6.1%) | 658 (8.0%) |
| 10 to 14 Years | 475 (6.6%) | 470 (5.7%) |
| 15 to 19 Years | 453 (6.3%) | 478 (5.8%) |
| 20 to 24 Years | 527 (7.3%) | 557 (6.8%) |
| 25 to 29 Years | 472 (6.5%) | 744 (9.0%) |
| 30 to 34 Years | 809 (11.2%) | 627 (7.6%) |
| 35 to 39 Years | 527 (7.3%) | 639 (7.7%) |
| 40 to 44 Years | 399 (5.5%) | 607 (7.4%) |
| 45 to 49 Years | 467 (6.5%) | 331 (4.0%) |
| 50 to 54 Years | 583 (8.1%) | 591 (7.2%) |
| 55 to 59 Years | 347 (4.8%) | 549 (6.7%) |
| 60 to 64 Years | 405 (5.6%) | 296 (3.6%) |
| 65 to 69 Years | 391 (5.4%) | 326 (4.0%) |
| 70 to 74 Years | 112 (1.5%) | 525 (6.4%) |
| 75 to 79 Years | 81 (1.1%) | 130 (1.6%) |
| 80 to 84 Years | 28 (0.4%) | 64 (0.8%) |
| 85 Years and over | 13 (0.2%) | 34 (0.4%) |
| Total | 7,237 (100.0%) | 8,252 (100.0%) |
Families and Households in White Oak
Median Family Size in White Oak
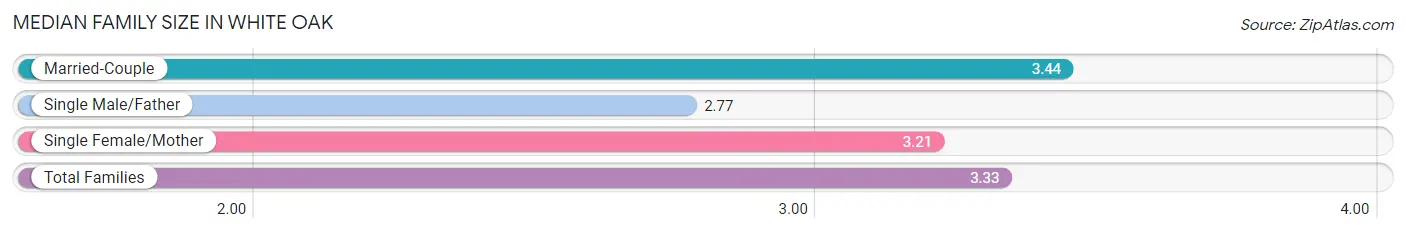
The median family size in White Oak is 3.33 persons per family, with married-couple families (2,327 | 62.1%) accounting for the largest median family size of 3.44 persons per family. On the other hand, single male/father families (180 | 4.8%) represent the smallest median family size with 2.77 persons per family.
| Family Type | # Families | Family Size |
| Married-Couple | 2,327 (62.1%) | 3.44 |
| Single Male/Father | 180 (4.8%) | 2.77 |
| Single Female/Mother | 1,240 (33.1%) | 3.21 |
| Total Families | 3,747 (100.0%) | 3.33 |
Median Household Size in White Oak
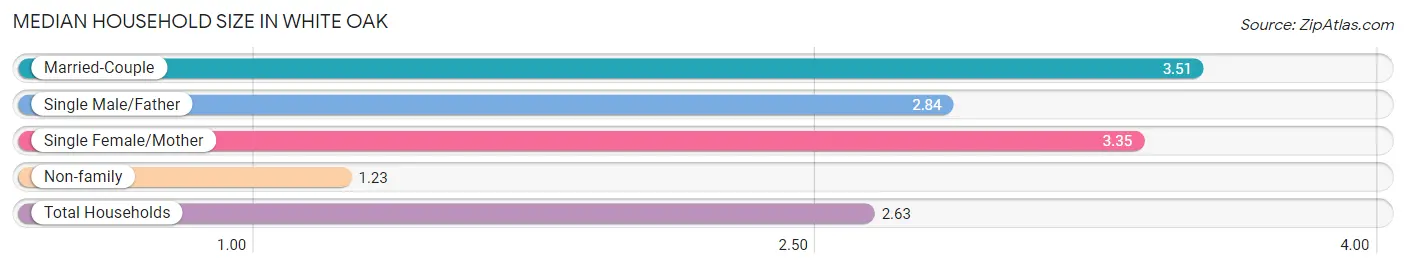
The median household size in White Oak is 2.63 persons per household, with married-couple households (2,327 | 39.6%) accounting for the largest median household size of 3.51 persons per household. non-family households (2,129 | 36.2%) represent the smallest median household size with 1.23 persons per household.
| Household Type | # Households | Household Size |
| Married-Couple | 2,327 (39.6%) | 3.51 |
| Single Male/Father | 180 (3.1%) | 2.84 |
| Single Female/Mother | 1,240 (21.1%) | 3.35 |
| Non-family | 2,129 (36.2%) | 1.23 |
| Total Households | 5,876 (100.0%) | 2.63 |
Household Size by Marriage Status in White Oak
Out of a total of 5,876 households in White Oak, 3,747 (63.8%) are family households, while 2,129 (36.2%) are nonfamily households. The most numerous type of family households are 4-person households, comprising 1,111, and the most common type of nonfamily households are 1-person households, comprising 1,794.
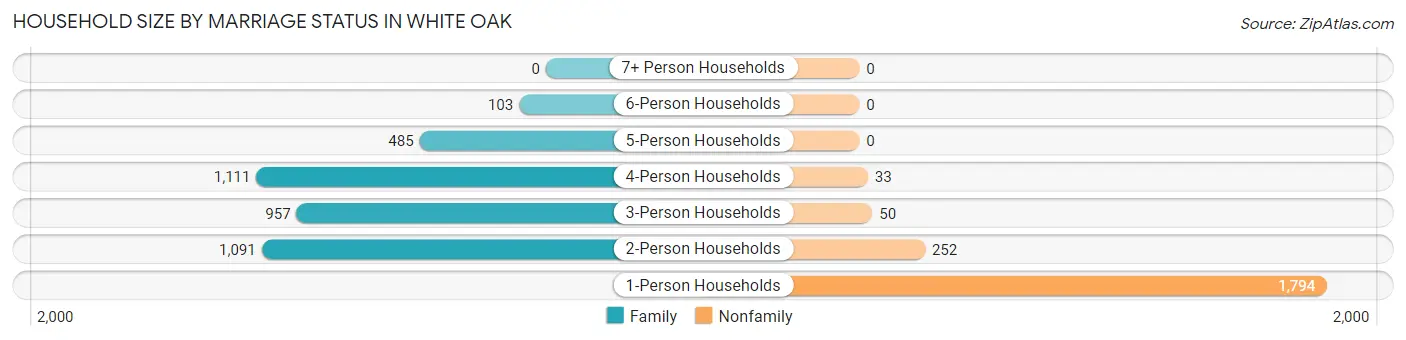
| Household Size | Family Households | Nonfamily Households |
| 1-Person Households | - | 1,794 (30.5%) |
| 2-Person Households | 1,091 (18.6%) | 252 (4.3%) |
| 3-Person Households | 957 (16.3%) | 50 (0.9%) |
| 4-Person Households | 1,111 (18.9%) | 33 (0.6%) |
| 5-Person Households | 485 (8.3%) | 0 (0.0%) |
| 6-Person Households | 103 (1.8%) | 0 (0.0%) |
| 7+ Person Households | 0 (0.0%) | 0 (0.0%) |
| Total | 3,747 (63.8%) | 2,129 (36.2%) |
Female Fertility in White Oak
Fertility by Age in White Oak
Average fertility rate in White Oak is 82.0 births per 1,000 women. Women in the age bracket of 20 to 34 years have the highest fertility rate with 121.0 births per 1,000 women. Women in the age bracket of 20 to 34 years acount for 70.2% of all women with births.
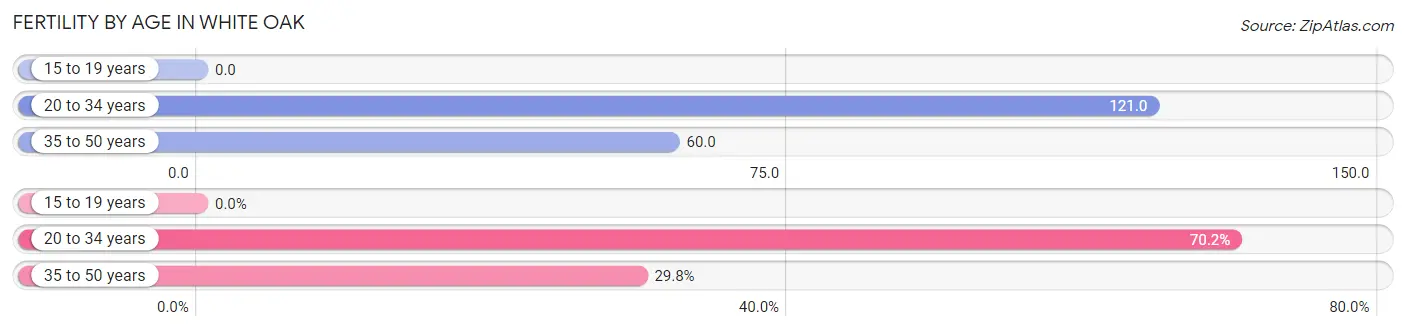
| Age Bracket | Women with Births | Births / 1,000 Women |
| 15 to 19 years | 0 (0.0%) | 0.0 |
| 20 to 34 years | 233 (70.2%) | 121.0 |
| 35 to 50 years | 99 (29.8%) | 60.0 |
| Total | 332 (100.0%) | 82.0 |
Fertility by Age by Marriage Status in White Oak
88.9% of women with births (332) in White Oak are married. The highest percentage of unmarried women with births falls into 35 to 50 years age bracket with 23.2% of them unmarried at the time of birth, while the lowest percentage of unmarried women with births belong to 20 to 34 years age bracket with 6.0% of them unmarried.
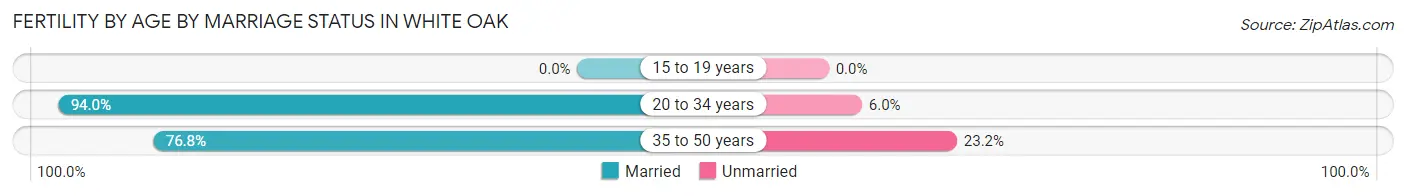
| Age Bracket | Married | Unmarried |
| 15 to 19 years | 0 (0.0%) | 0 (0.0%) |
| 20 to 34 years | 219 (94.0%) | 14 (6.0%) |
| 35 to 50 years | 76 (76.8%) | 23 (23.2%) |
| Total | 295 (88.9%) | 37 (11.1%) |
Fertility by Education in White Oak
Average fertility rate in White Oak is 82.0 births per 1,000 women. Women with the education attainment of high school diploma have the highest fertility rate of 138.0 births per 1,000 women, while women with the education attainment of graduate degree have the lowest fertility at 46.0 births per 1,000 women. Women with the education attainment of college or associate's degree represent 29.8% of all women with births.
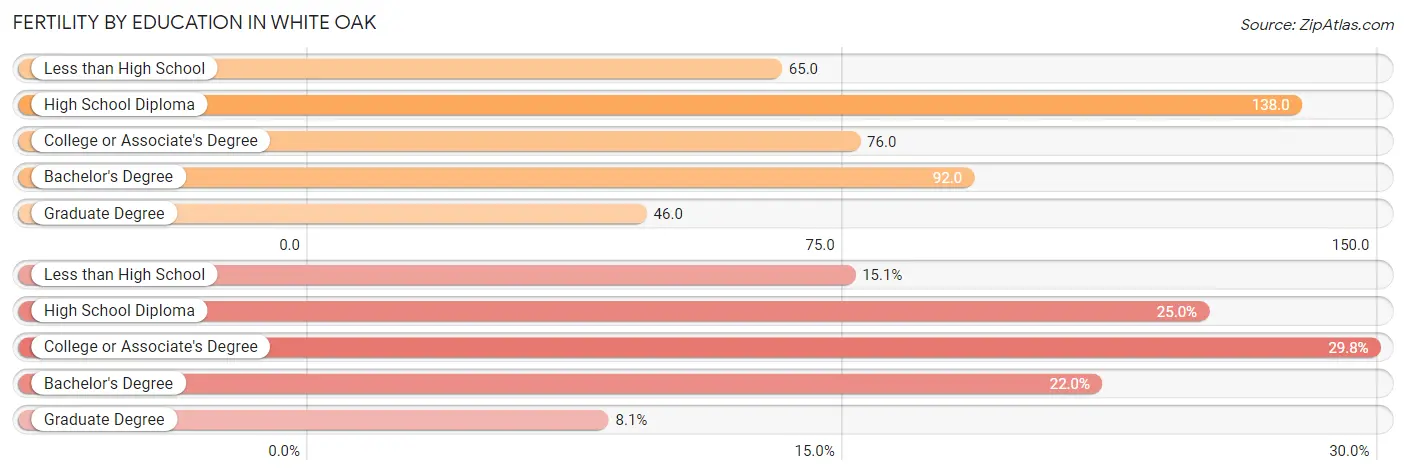
| Educational Attainment | Women with Births | Births / 1,000 Women |
| Less than High School | 50 (15.1%) | 65.0 |
| High School Diploma | 83 (25.0%) | 138.0 |
| College or Associate's Degree | 99 (29.8%) | 76.0 |
| Bachelor's Degree | 73 (22.0%) | 92.0 |
| Graduate Degree | 27 (8.1%) | 46.0 |
| Total | 332 (100.0%) | 82.0 |
Fertility by Education by Marriage Status in White Oak
11.1% of women with births in White Oak are unmarried. Women with the educational attainment of less than high school are most likely to be married with 100.0% of them married at childbirth, while women with the educational attainment of high school diploma are least likely to be married with 27.7% of them unmarried at childbirth.
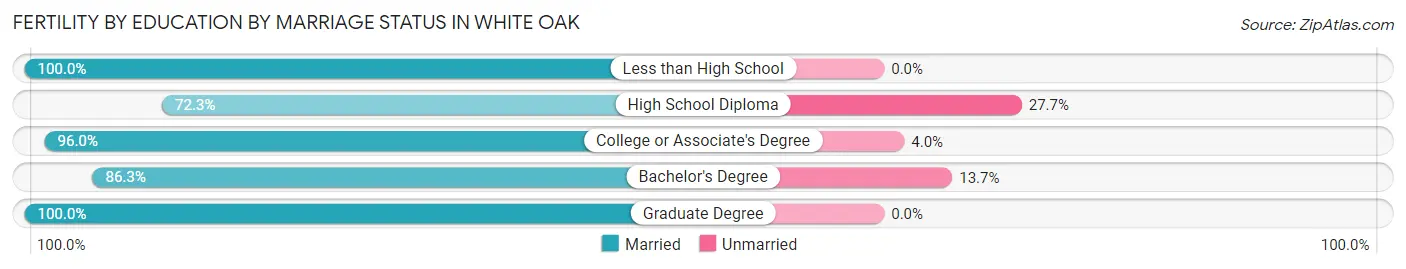
| Educational Attainment | Married | Unmarried |
| Less than High School | 50 (100.0%) | 0 (0.0%) |
| High School Diploma | 60 (72.3%) | 23 (27.7%) |
| College or Associate's Degree | 95 (96.0%) | 4 (4.0%) |
| Bachelor's Degree | 63 (86.3%) | 10 (13.7%) |
| Graduate Degree | 27 (100.0%) | 0 (0.0%) |
| Total | 295 (88.9%) | 37 (11.1%) |
Employment Characteristics in White Oak
Employment by Class of Employer in White Oak
Among the 7,493 employed individuals in White Oak, private company employees (5,055 | 67.5%), not-for-profit organizations (669 | 8.9%), and federal government employees (543 | 7.2%) make up the most common classes of employment.
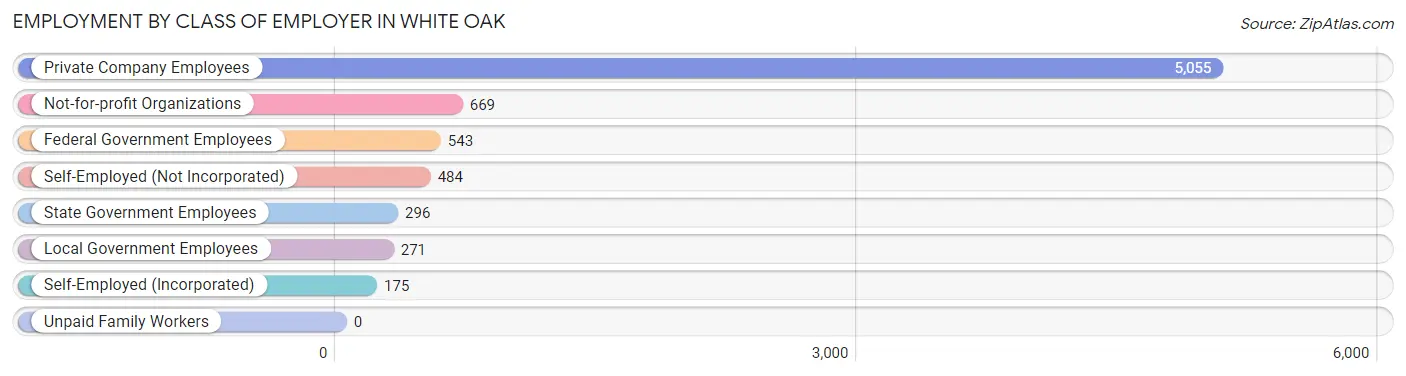
| Employer Class | # Employees | % Employees |
| Private Company Employees | 5,055 | 67.5% |
| Self-Employed (Incorporated) | 175 | 2.3% |
| Self-Employed (Not Incorporated) | 484 | 6.5% |
| Not-for-profit Organizations | 669 | 8.9% |
| Local Government Employees | 271 | 3.6% |
| State Government Employees | 296 | 4.0% |
| Federal Government Employees | 543 | 7.2% |
| Unpaid Family Workers | 0 | 0.0% |
| Total | 7,493 | 100.0% |
Employment Status by Age in White Oak
According to the labor force statistics for White Oak, out of the total population over 16 years of age (11,944), 70.4% or 8,409 individuals are in the labor force, with 7.3% or 614 of them unemployed. The age group with the highest labor force participation rate is 55 to 59 years, with 95.1% or 852 individuals in the labor force. Within the labor force, the 16 to 19 years age range has the highest percentage of unemployed individuals, with 49.3% or 221 of them being unemployed.
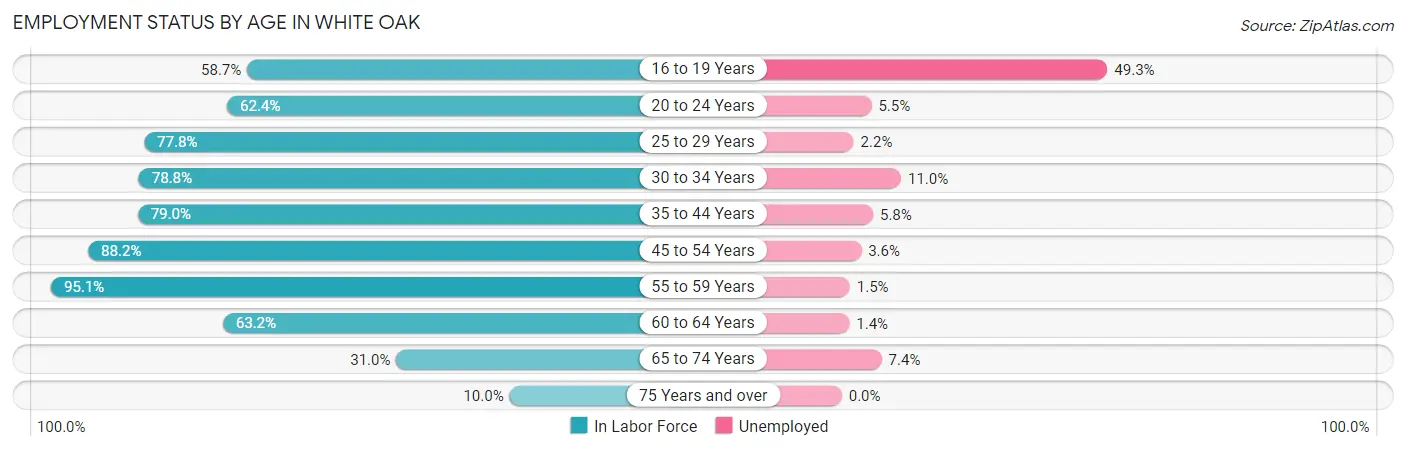
| Age Bracket | In Labor Force | Unemployed |
| 16 to 19 Years | 448 (58.7%) | 221 (49.3%) |
| 20 to 24 Years | 676 (62.4%) | 37 (5.5%) |
| 25 to 29 Years | 946 (77.8%) | 21 (2.2%) |
| 30 to 34 Years | 1,132 (78.8%) | 125 (11.0%) |
| 35 to 44 Years | 1,716 (79.0%) | 100 (5.8%) |
| 45 to 54 Years | 1,739 (88.2%) | 63 (3.6%) |
| 55 to 59 Years | 852 (95.1%) | 13 (1.5%) |
| 60 to 64 Years | 443 (63.2%) | 6 (1.4%) |
| 65 to 74 Years | 420 (31.0%) | 31 (7.4%) |
| 75 Years and over | 35 (10.0%) | 0 (0.0%) |
| Total | 8,409 (70.4%) | 614 (7.3%) |
Employment Status by Educational Attainment in White Oak
According to labor force statistics for White Oak, 81.3% of individuals (6,824) out of the total population between 25 and 64 years of age (8,393) are in the labor force, with 4.8% or 328 of them being unemployed. The group with the highest labor force participation rate are those with the educational attainment of bachelor's degree or higher, with 85.7% or 3,079 individuals in the labor force. Within the labor force, individuals with high school diploma education have the highest percentage of unemployment, with 6.0% or 83 of them being unemployed.
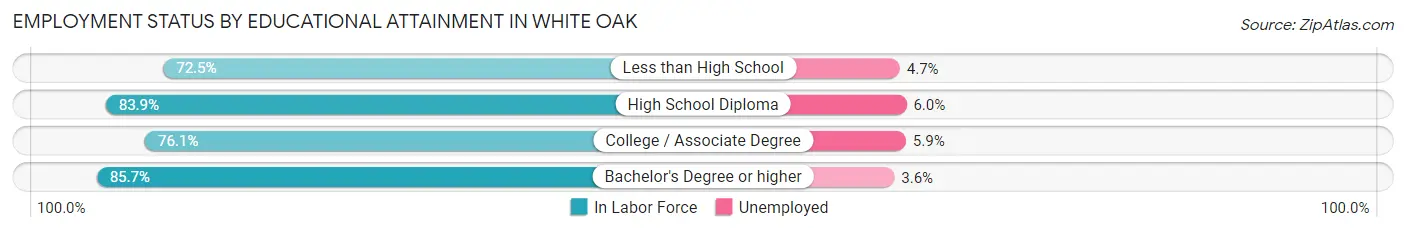
| Educational Attainment | In Labor Force | Unemployed |
| Less than High School | 701 (72.5%) | 45 (4.7%) |
| High School Diploma | 1,379 (83.9%) | 99 (6.0%) |
| College / Associate Degree | 1,666 (76.1%) | 129 (5.9%) |
| Bachelor's Degree or higher | 3,079 (85.7%) | 129 (3.6%) |
| Total | 6,824 (81.3%) | 403 (4.8%) |
Employment Occupations by Sex in White Oak
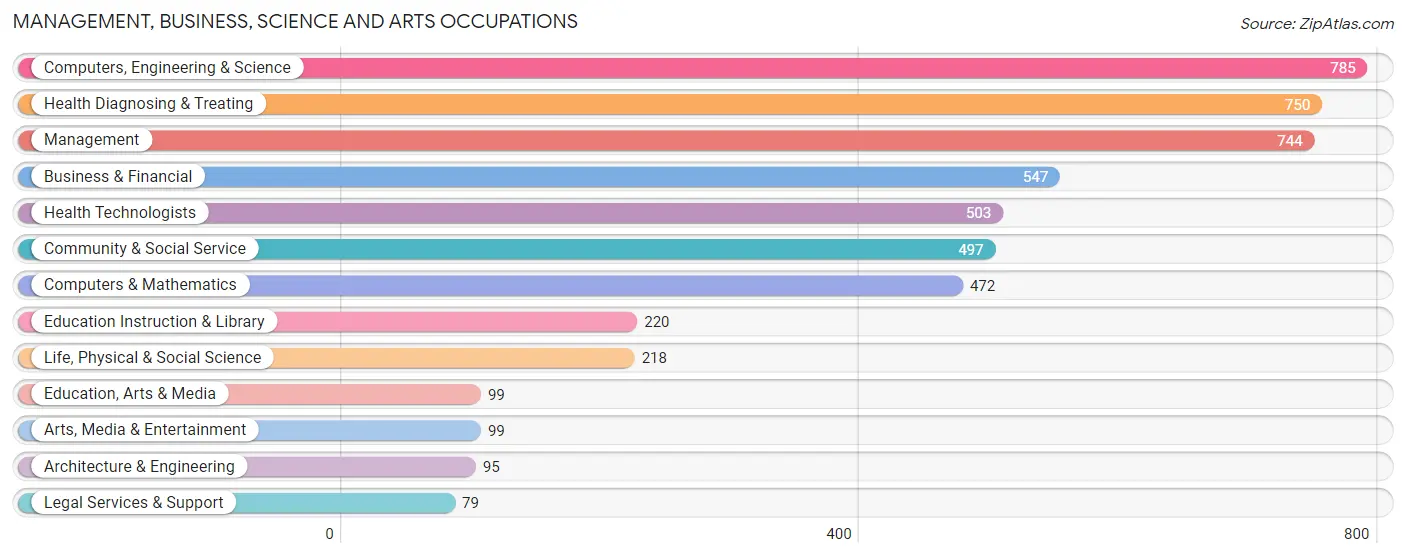
Management, Business, Science and Arts Occupations
The most common Management, Business, Science and Arts occupations in White Oak are Computers, Engineering & Science (785 | 10.1%), Health Diagnosing & Treating (750 | 9.6%), Management (744 | 9.6%), Business & Financial (547 | 7.0%), and Health Technologists (503 | 6.5%).
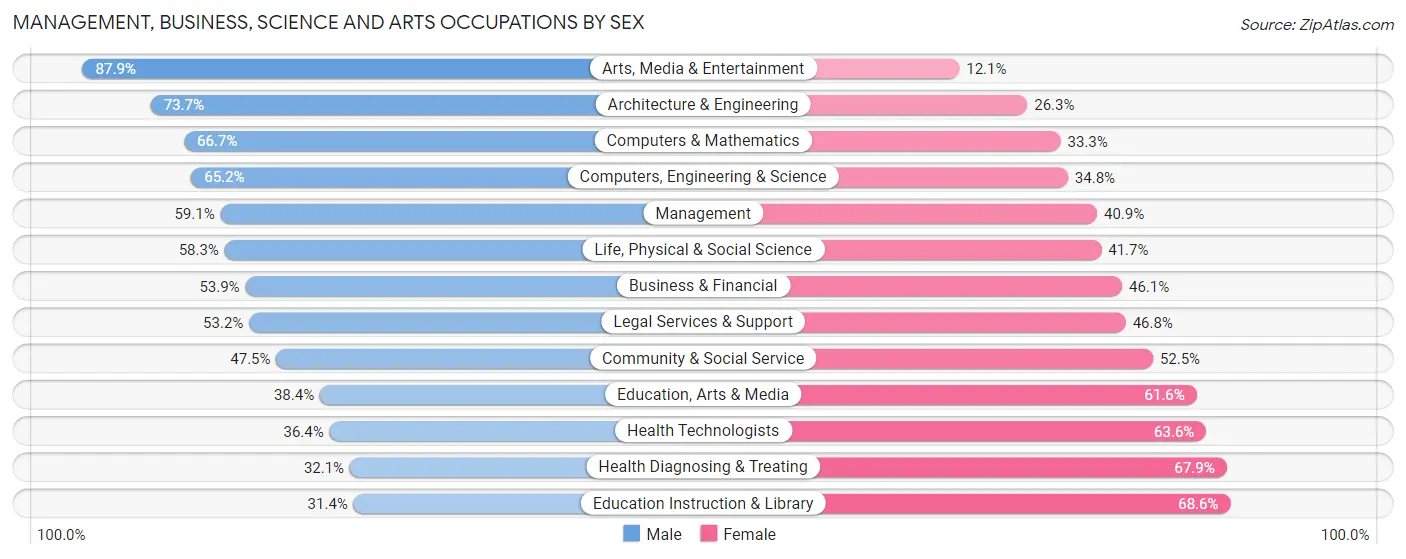
Management, Business, Science and Arts Occupations by Sex
Within the Management, Business, Science and Arts occupations in White Oak, the most male-oriented occupations are Arts, Media & Entertainment (87.9%), Architecture & Engineering (73.7%), and Computers & Mathematics (66.7%), while the most female-oriented occupations are Education Instruction & Library (68.6%), Health Diagnosing & Treating (67.9%), and Health Technologists (63.6%).
| Occupation | Male | Female |
| Management | 440 (59.1%) | 304 (40.9%) |
| Business & Financial | 295 (53.9%) | 252 (46.1%) |
| Computers, Engineering & Science | 512 (65.2%) | 273 (34.8%) |
| Computers & Mathematics | 315 (66.7%) | 157 (33.3%) |
| Architecture & Engineering | 70 (73.7%) | 25 (26.3%) |
| Life, Physical & Social Science | 127 (58.3%) | 91 (41.7%) |
| Community & Social Service | 236 (47.5%) | 261 (52.5%) |
| Education, Arts & Media | 38 (38.4%) | 61 (61.6%) |
| Legal Services & Support | 42 (53.2%) | 37 (46.8%) |
| Education Instruction & Library | 69 (31.4%) | 151 (68.6%) |
| Arts, Media & Entertainment | 87 (87.9%) | 12 (12.1%) |
| Health Diagnosing & Treating | 241 (32.1%) | 509 (67.9%) |
| Health Technologists | 183 (36.4%) | 320 (63.6%) |
| Total (Category) | 1,724 (51.9%) | 1,599 (48.1%) |
| Total (Overall) | 3,993 (51.3%) | 3,793 (48.7%) |
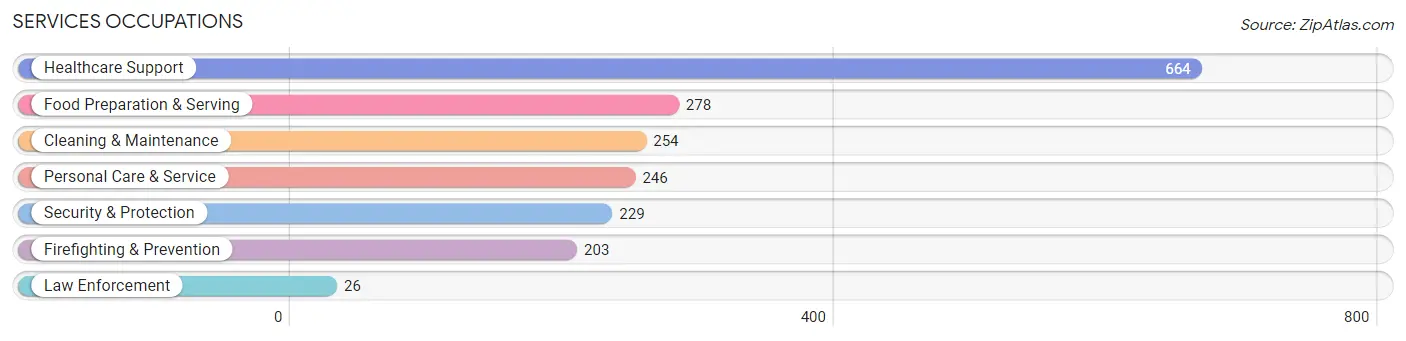
Services Occupations
The most common Services occupations in White Oak are Healthcare Support (664 | 8.5%), Food Preparation & Serving (278 | 3.6%), Cleaning & Maintenance (254 | 3.3%), Personal Care & Service (246 | 3.2%), and Security & Protection (229 | 2.9%).
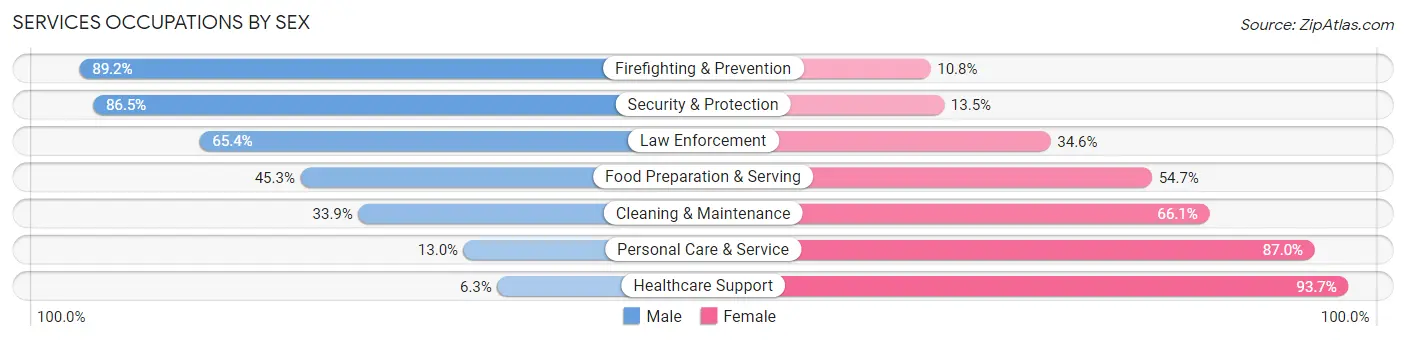
Services Occupations by Sex
Within the Services occupations in White Oak, the most male-oriented occupations are Firefighting & Prevention (89.2%), Security & Protection (86.5%), and Law Enforcement (65.4%), while the most female-oriented occupations are Healthcare Support (93.7%), Personal Care & Service (87.0%), and Cleaning & Maintenance (66.1%).
| Occupation | Male | Female |
| Healthcare Support | 42 (6.3%) | 622 (93.7%) |
| Security & Protection | 198 (86.5%) | 31 (13.5%) |
| Firefighting & Prevention | 181 (89.2%) | 22 (10.8%) |
| Law Enforcement | 17 (65.4%) | 9 (34.6%) |
| Food Preparation & Serving | 126 (45.3%) | 152 (54.7%) |
| Cleaning & Maintenance | 86 (33.9%) | 168 (66.1%) |
| Personal Care & Service | 32 (13.0%) | 214 (87.0%) |
| Total (Category) | 484 (29.0%) | 1,187 (71.0%) |
| Total (Overall) | 3,993 (51.3%) | 3,793 (48.7%) |
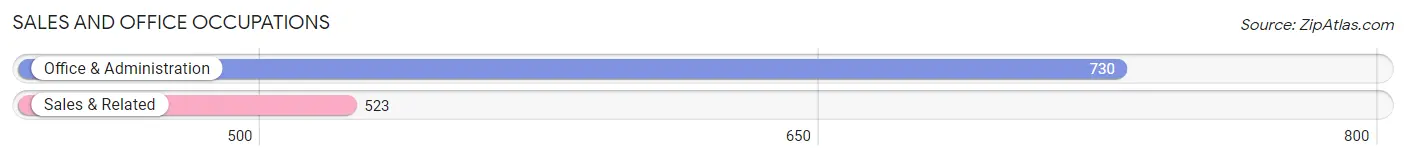
Sales and Office Occupations
The most common Sales and Office occupations in White Oak are Office & Administration (730 | 9.4%), and Sales & Related (523 | 6.7%).
Sales and Office Occupations by Sex
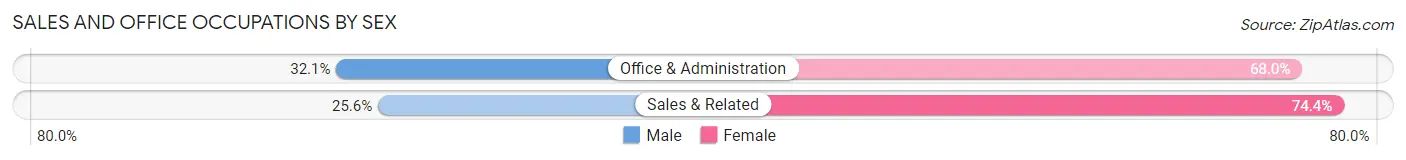
| Occupation | Male | Female |
| Sales & Related | 134 (25.6%) | 389 (74.4%) |
| Office & Administration | 234 (32.1%) | 496 (67.9%) |
| Total (Category) | 368 (29.4%) | 885 (70.6%) |
| Total (Overall) | 3,993 (51.3%) | 3,793 (48.7%) |
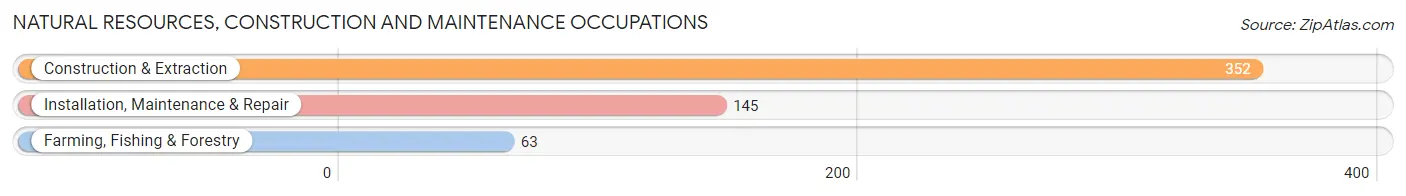
Natural Resources, Construction and Maintenance Occupations
The most common Natural Resources, Construction and Maintenance occupations in White Oak are Construction & Extraction (352 | 4.5%), Installation, Maintenance & Repair (145 | 1.9%), and Farming, Fishing & Forestry (63 | 0.8%).
Natural Resources, Construction and Maintenance Occupations by Sex
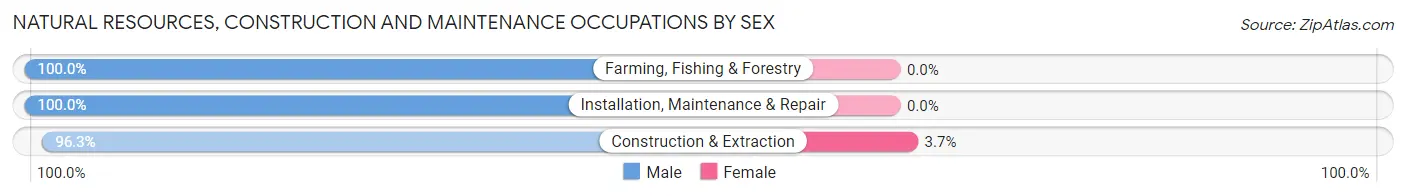
| Occupation | Male | Female |
| Farming, Fishing & Forestry | 63 (100.0%) | 0 (0.0%) |
| Construction & Extraction | 339 (96.3%) | 13 (3.7%) |
| Installation, Maintenance & Repair | 145 (100.0%) | 0 (0.0%) |
| Total (Category) | 547 (97.7%) | 13 (2.3%) |
| Total (Overall) | 3,993 (51.3%) | 3,793 (48.7%) |
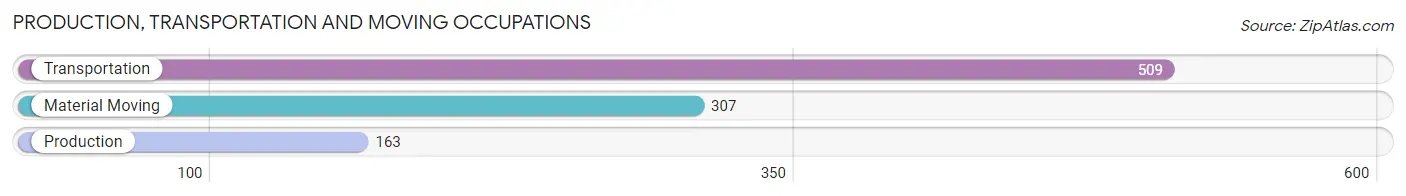
Production, Transportation and Moving Occupations
The most common Production, Transportation and Moving occupations in White Oak are Transportation (509 | 6.5%), Material Moving (307 | 3.9%), and Production (163 | 2.1%).
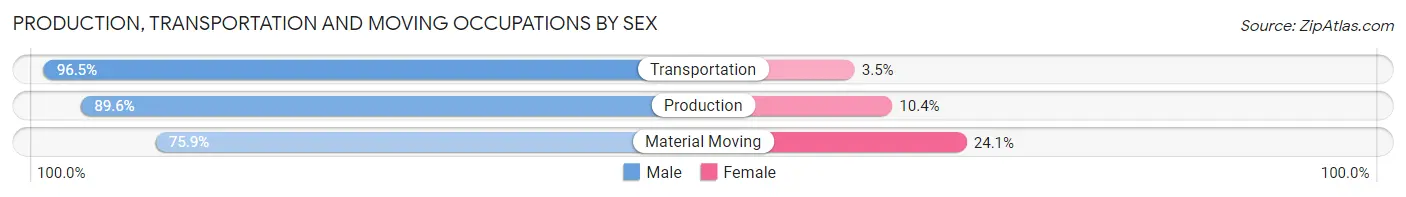
Production, Transportation and Moving Occupations by Sex
| Occupation | Male | Female |
| Production | 146 (89.6%) | 17 (10.4%) |
| Transportation | 491 (96.5%) | 18 (3.5%) |
| Material Moving | 233 (75.9%) | 74 (24.1%) |
| Total (Category) | 870 (88.9%) | 109 (11.1%) |
| Total (Overall) | 3,993 (51.3%) | 3,793 (48.7%) |
Employment Industries by Sex in White Oak
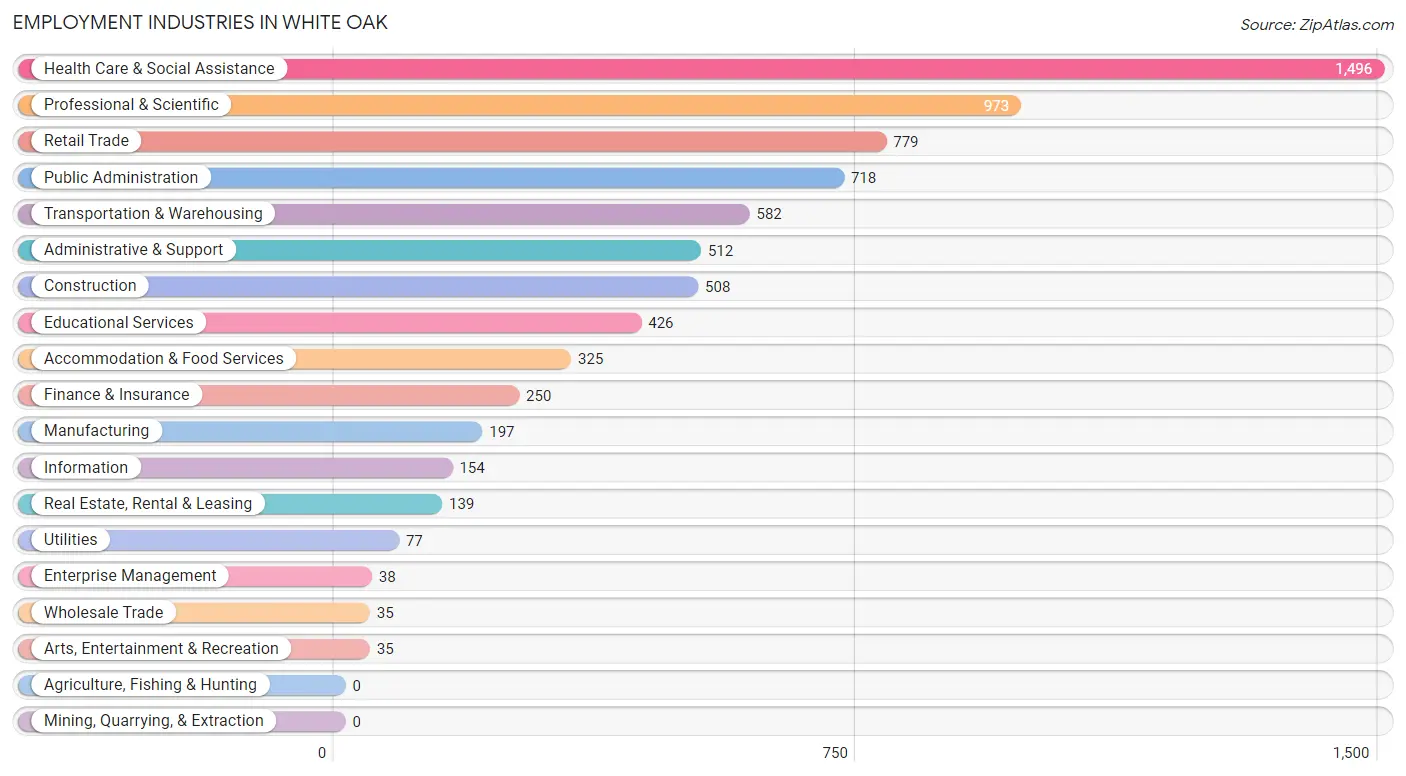
Employment Industries in White Oak
The major employment industries in White Oak include Health Care & Social Assistance (1,496 | 19.2%), Professional & Scientific (973 | 12.5%), Retail Trade (779 | 10.0%), Public Administration (718 | 9.2%), and Transportation & Warehousing (582 | 7.5%).
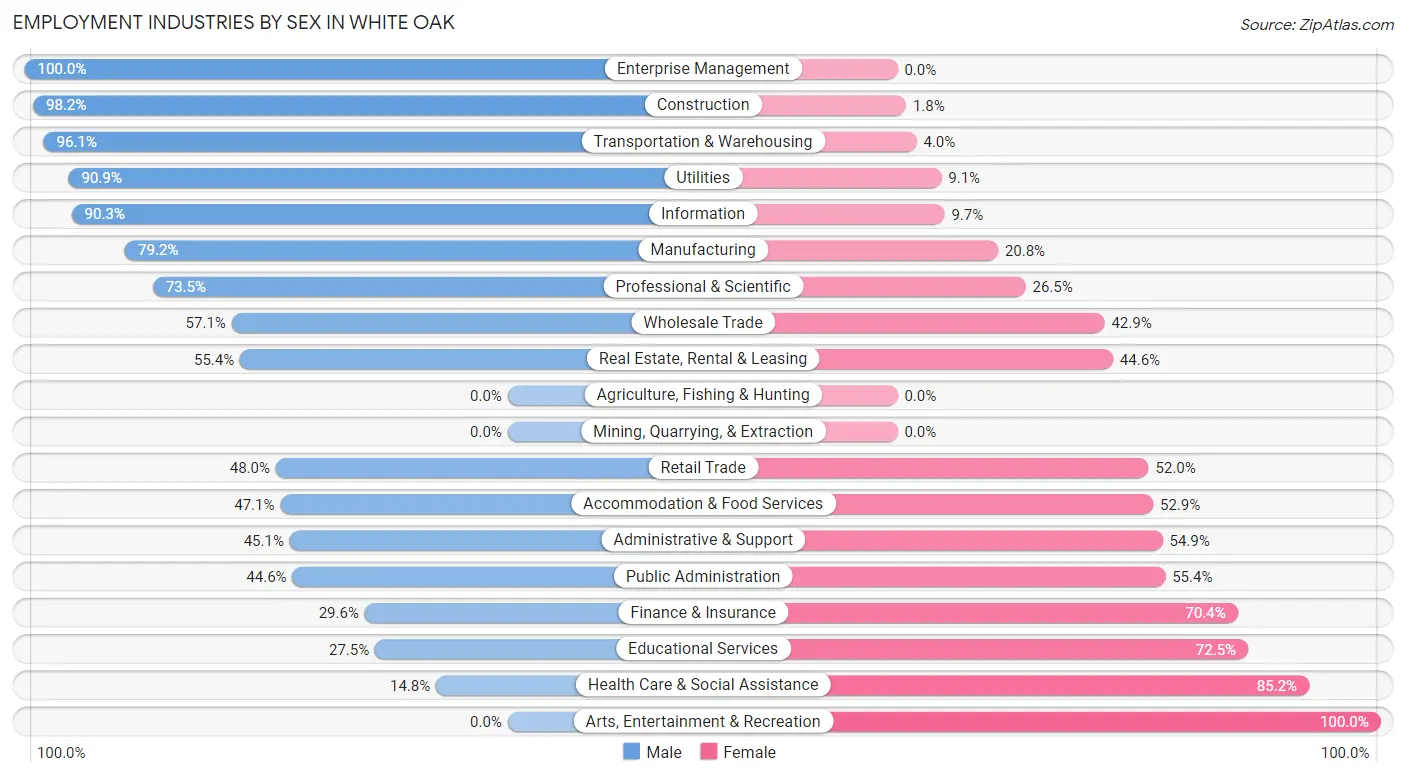
Employment Industries by Sex in White Oak
The White Oak industries that see more men than women are Enterprise Management (100.0%), Construction (98.2%), and Transportation & Warehousing (96.1%), whereas the industries that tend to have a higher number of women are Arts, Entertainment & Recreation (100.0%), Health Care & Social Assistance (85.2%), and Educational Services (72.5%).
| Industry | Male | Female |
| Agriculture, Fishing & Hunting | 0 (0.0%) | 0 (0.0%) |
| Mining, Quarrying, & Extraction | 0 (0.0%) | 0 (0.0%) |
| Construction | 499 (98.2%) | 9 (1.8%) |
| Manufacturing | 156 (79.2%) | 41 (20.8%) |
| Wholesale Trade | 20 (57.1%) | 15 (42.9%) |
| Retail Trade | 374 (48.0%) | 405 (52.0%) |
| Transportation & Warehousing | 559 (96.1%) | 23 (4.0%) |
| Utilities | 70 (90.9%) | 7 (9.1%) |
| Information | 139 (90.3%) | 15 (9.7%) |
| Finance & Insurance | 74 (29.6%) | 176 (70.4%) |
| Real Estate, Rental & Leasing | 77 (55.4%) | 62 (44.6%) |
| Professional & Scientific | 715 (73.5%) | 258 (26.5%) |
| Enterprise Management | 38 (100.0%) | 0 (0.0%) |
| Administrative & Support | 231 (45.1%) | 281 (54.9%) |
| Educational Services | 117 (27.5%) | 309 (72.5%) |
| Health Care & Social Assistance | 222 (14.8%) | 1,274 (85.2%) |
| Arts, Entertainment & Recreation | 0 (0.0%) | 35 (100.0%) |
| Accommodation & Food Services | 153 (47.1%) | 172 (52.9%) |
| Public Administration | 320 (44.6%) | 398 (55.4%) |
| Total | 3,993 (51.3%) | 3,793 (48.7%) |
Education in White Oak
School Enrollment in White Oak
The most common levels of schooling among the 4,340 students in White Oak are college / undergraduate (1,249 | 28.8%), elementary school (874 | 20.1%), and high school (869 | 20.0%).
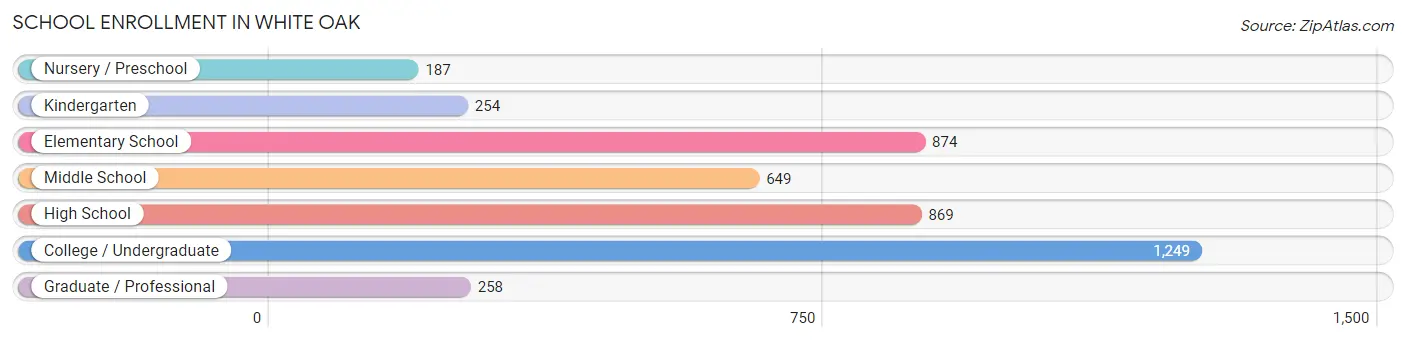
| School Level | # Students | % Students |
| Nursery / Preschool | 187 | 4.3% |
| Kindergarten | 254 | 5.9% |
| Elementary School | 874 | 20.1% |
| Middle School | 649 | 14.9% |
| High School | 869 | 20.0% |
| College / Undergraduate | 1,249 | 28.8% |
| Graduate / Professional | 258 | 5.9% |
| Total | 4,340 | 100.0% |
School Enrollment by Age by Funding Source in White Oak
Out of a total of 4,340 students who are enrolled in schools in White Oak, 655 (15.1%) attend a private institution, while the remaining 3,685 (84.9%) are enrolled in public schools. The age group of 3 to 4 year olds has the highest likelihood of being enrolled in private schools, with 78 (56.5% in the age bracket) enrolled. Conversely, the age group of 15 to 17 year olds has the lowest likelihood of being enrolled in a private school, with 519 (93.7% in the age bracket) attending a public institution.
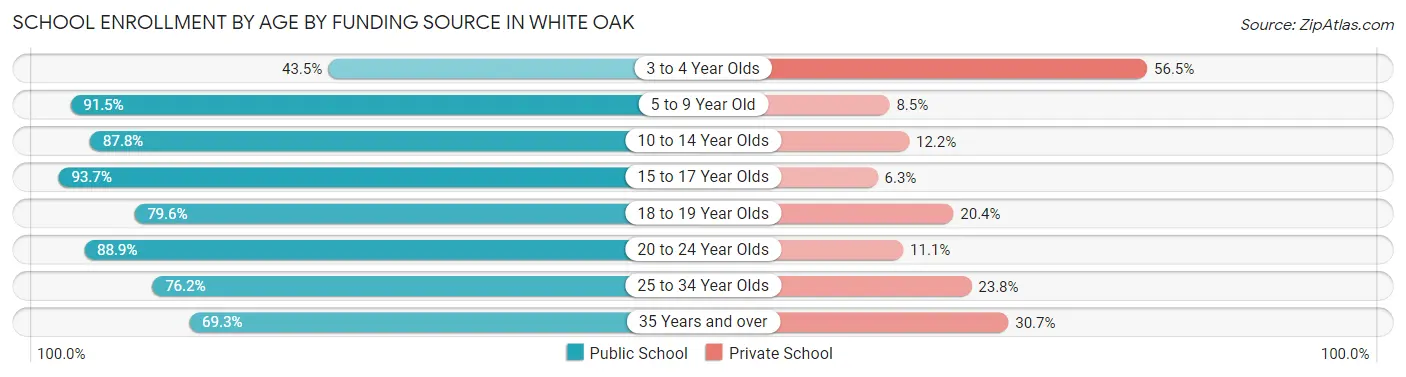
| Age Bracket | Public School | Private School |
| 3 to 4 Year Olds | 60 (43.5%) | 78 (56.5%) |
| 5 to 9 Year Old | 890 (91.5%) | 83 (8.5%) |
| 10 to 14 Year Olds | 830 (87.8%) | 115 (12.2%) |
| 15 to 17 Year Olds | 519 (93.7%) | 35 (6.3%) |
| 18 to 19 Year Olds | 257 (79.6%) | 66 (20.4%) |
| 20 to 24 Year Olds | 594 (88.9%) | 74 (11.1%) |
| 25 to 34 Year Olds | 250 (76.2%) | 78 (23.8%) |
| 35 Years and over | 285 (69.3%) | 126 (30.7%) |
| Total | 3,685 (84.9%) | 655 (15.1%) |
Educational Attainment by Field of Study in White Oak
Business (993 | 21.9%), science & technology (613 | 13.5%), engineering (438 | 9.7%), social sciences (400 | 8.8%), and bio, nature & agricultural (345 | 7.6%) are the most common fields of study among 4,534 individuals in White Oak who have obtained a bachelor's degree or higher.
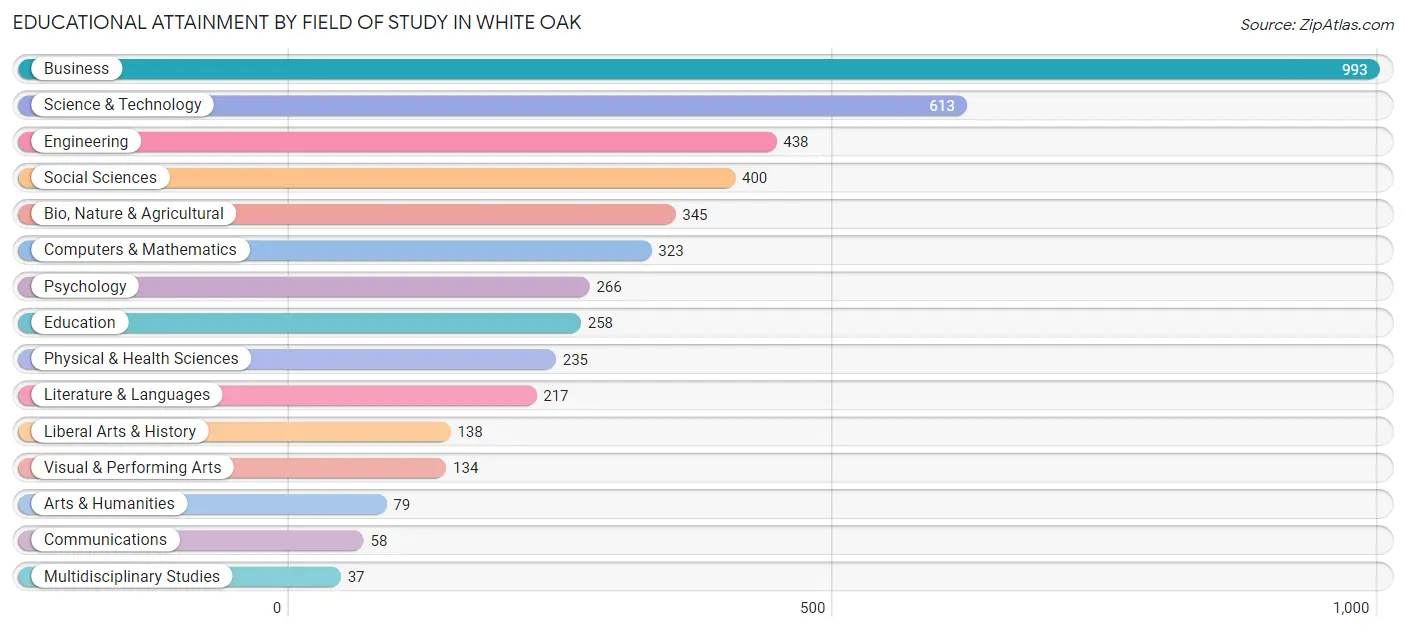
| Field of Study | # Graduates | % Graduates |
| Computers & Mathematics | 323 | 7.1% |
| Bio, Nature & Agricultural | 345 | 7.6% |
| Physical & Health Sciences | 235 | 5.2% |
| Psychology | 266 | 5.9% |
| Social Sciences | 400 | 8.8% |
| Engineering | 438 | 9.7% |
| Multidisciplinary Studies | 37 | 0.8% |
| Science & Technology | 613 | 13.5% |
| Business | 993 | 21.9% |
| Education | 258 | 5.7% |
| Literature & Languages | 217 | 4.8% |
| Liberal Arts & History | 138 | 3.0% |
| Visual & Performing Arts | 134 | 3.0% |
| Communications | 58 | 1.3% |
| Arts & Humanities | 79 | 1.7% |
| Total | 4,534 | 100.0% |
Transportation & Commute in White Oak
Vehicle Availability by Sex in White Oak
The most prevalent vehicle ownership categories in White Oak are males with 2 vehicles (1,515, accounting for 38.0%) and females with 2 vehicles (1,116, making up 43.2%).
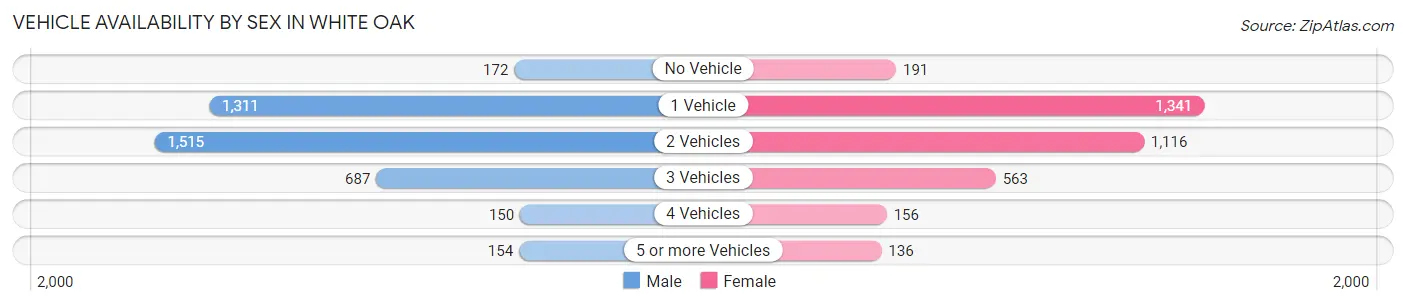
| Vehicles Available | Male | Female |
| No Vehicle | 172 (4.3%) | 191 (5.4%) |
| 1 Vehicle | 1,311 (32.9%) | 1,341 (38.3%) |
| 2 Vehicles | 1,515 (38.0%) | 1,116 (31.9%) |
| 3 Vehicles | 687 (17.2%) | 563 (16.1%) |
| 4 Vehicles | 150 (3.8%) | 156 (4.4%) |
| 5 or more Vehicles | 154 (3.9%) | 136 (3.9%) |
| Total | 3,989 (100.0%) | 3,503 (100.0%) |
Commute Time in White Oak
The most frequently occuring commute durations in White Oak are 30 to 34 minutes (1,268 commuters, 19.1%), 45 to 59 minutes (896 commuters, 13.5%), and 60 to 89 minutes (843 commuters, 12.7%).
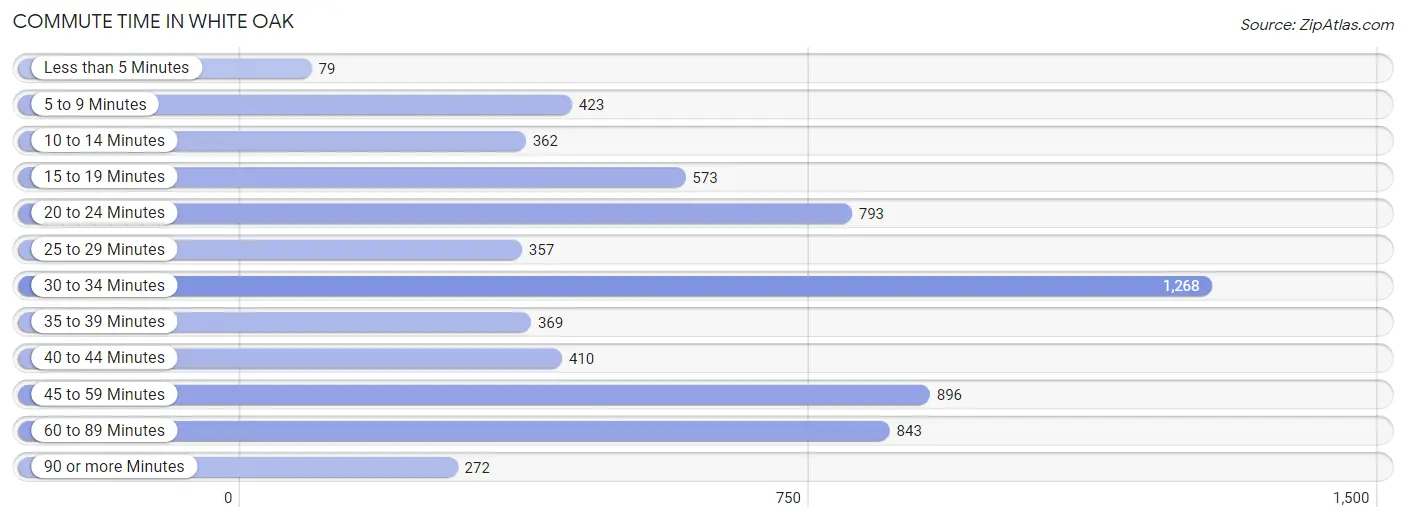
| Commute Time | # Commuters | % Commuters |
| Less than 5 Minutes | 79 | 1.2% |
| 5 to 9 Minutes | 423 | 6.4% |
| 10 to 14 Minutes | 362 | 5.4% |
| 15 to 19 Minutes | 573 | 8.6% |
| 20 to 24 Minutes | 793 | 11.9% |
| 25 to 29 Minutes | 357 | 5.4% |
| 30 to 34 Minutes | 1,268 | 19.1% |
| 35 to 39 Minutes | 369 | 5.6% |
| 40 to 44 Minutes | 410 | 6.2% |
| 45 to 59 Minutes | 896 | 13.5% |
| 60 to 89 Minutes | 843 | 12.7% |
| 90 or more Minutes | 272 | 4.1% |
Commute Time by Sex in White Oak
The most common commute times in White Oak are 30 to 34 minutes (571 commuters, 16.2%) for males and 30 to 34 minutes (697 commuters, 22.4%) for females.
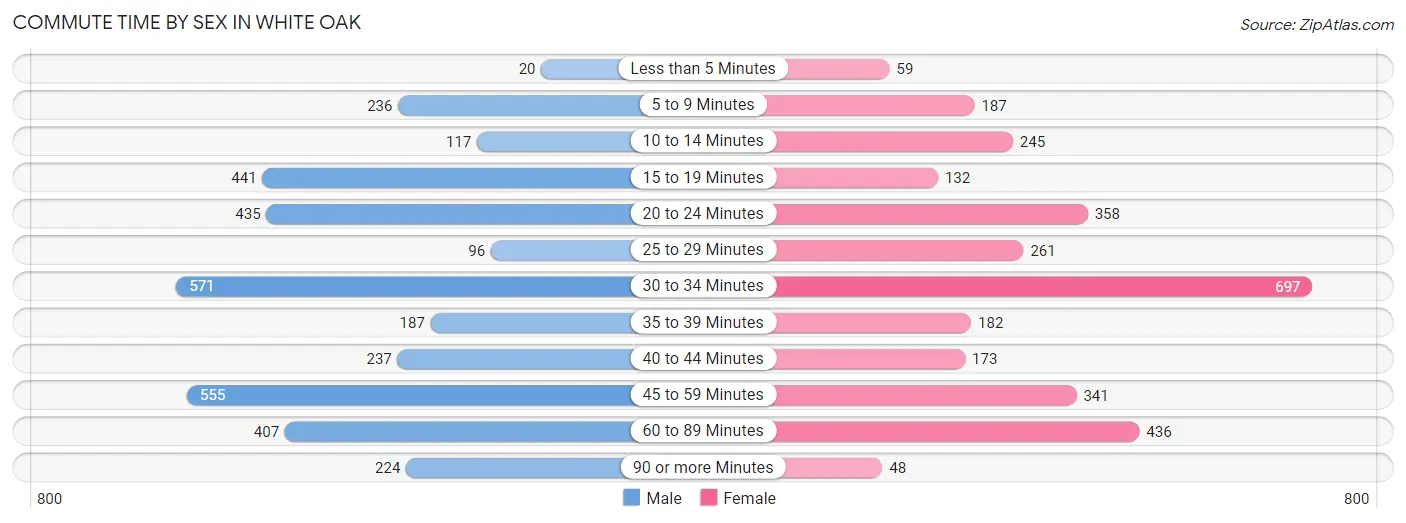
| Commute Time | Male | Female |
| Less than 5 Minutes | 20 (0.6%) | 59 (1.9%) |
| 5 to 9 Minutes | 236 (6.7%) | 187 (6.0%) |
| 10 to 14 Minutes | 117 (3.3%) | 245 (7.9%) |
| 15 to 19 Minutes | 441 (12.5%) | 132 (4.2%) |
| 20 to 24 Minutes | 435 (12.3%) | 358 (11.5%) |
| 25 to 29 Minutes | 96 (2.7%) | 261 (8.4%) |
| 30 to 34 Minutes | 571 (16.2%) | 697 (22.4%) |
| 35 to 39 Minutes | 187 (5.3%) | 182 (5.8%) |
| 40 to 44 Minutes | 237 (6.7%) | 173 (5.6%) |
| 45 to 59 Minutes | 555 (15.7%) | 341 (10.9%) |
| 60 to 89 Minutes | 407 (11.5%) | 436 (14.0%) |
| 90 or more Minutes | 224 (6.4%) | 48 (1.5%) |
Time of Departure to Work by Sex in White Oak
The most frequent times of departure to work in White Oak are 7:00 AM to 7:29 AM (599, 17.0%) for males and 4:00 PM to 11:59 PM (542, 17.4%) for females.
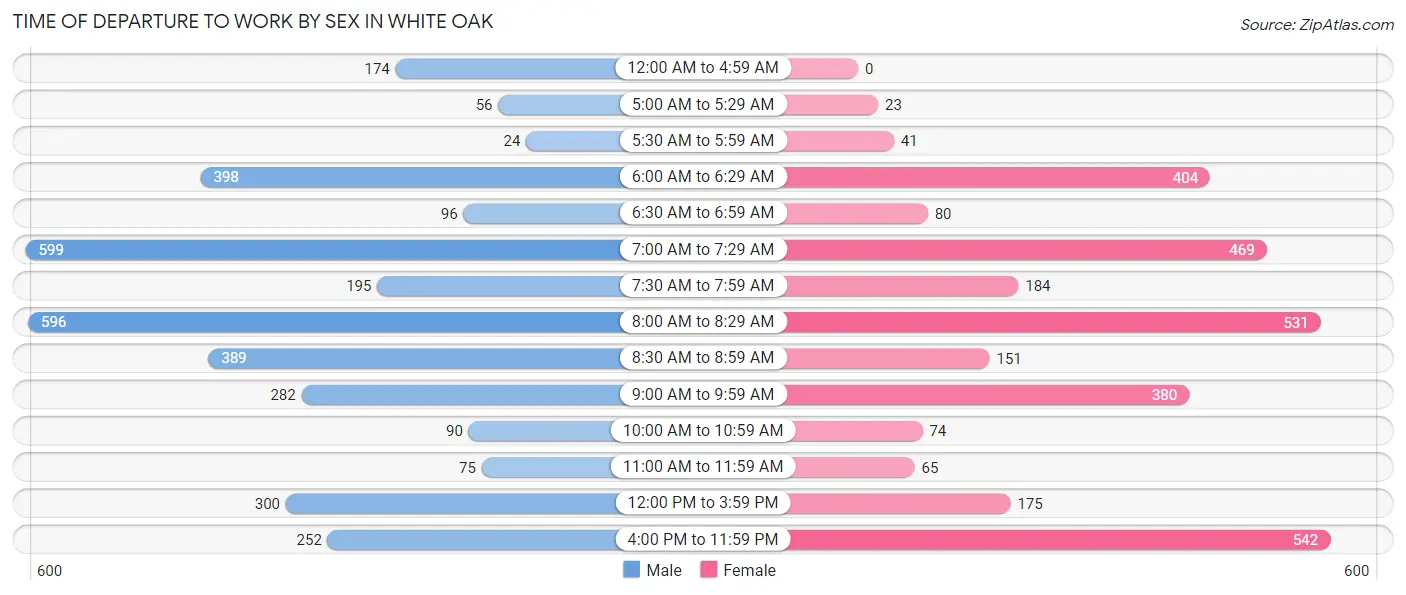
| Time of Departure | Male | Female |
| 12:00 AM to 4:59 AM | 174 (4.9%) | 0 (0.0%) |
| 5:00 AM to 5:29 AM | 56 (1.6%) | 23 (0.7%) |
| 5:30 AM to 5:59 AM | 24 (0.7%) | 41 (1.3%) |
| 6:00 AM to 6:29 AM | 398 (11.3%) | 404 (13.0%) |
| 6:30 AM to 6:59 AM | 96 (2.7%) | 80 (2.6%) |
| 7:00 AM to 7:29 AM | 599 (17.0%) | 469 (15.0%) |
| 7:30 AM to 7:59 AM | 195 (5.5%) | 184 (5.9%) |
| 8:00 AM to 8:29 AM | 596 (16.9%) | 531 (17.0%) |
| 8:30 AM to 8:59 AM | 389 (11.0%) | 151 (4.8%) |
| 9:00 AM to 9:59 AM | 282 (8.0%) | 380 (12.2%) |
| 10:00 AM to 10:59 AM | 90 (2.5%) | 74 (2.4%) |
| 11:00 AM to 11:59 AM | 75 (2.1%) | 65 (2.1%) |
| 12:00 PM to 3:59 PM | 300 (8.5%) | 175 (5.6%) |
| 4:00 PM to 11:59 PM | 252 (7.1%) | 542 (17.4%) |
| Total | 3,526 (100.0%) | 3,119 (100.0%) |
Housing Occupancy in White Oak
Occupancy by Ownership in White Oak
Of the total 5,876 dwellings in White Oak, owner-occupied units account for 1,577 (26.8%), while renter-occupied units make up 4,299 (73.2%).
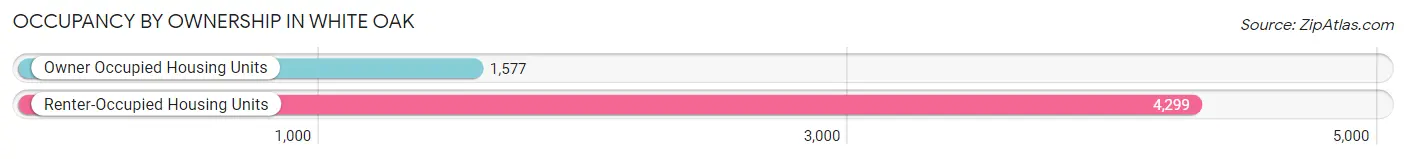
| Occupancy | # Housing Units | % Housing Units |
| Owner Occupied Housing Units | 1,577 | 26.8% |
| Renter-Occupied Housing Units | 4,299 | 73.2% |
| Total Occupied Housing Units | 5,876 | 100.0% |
Occupancy by Household Size in White Oak
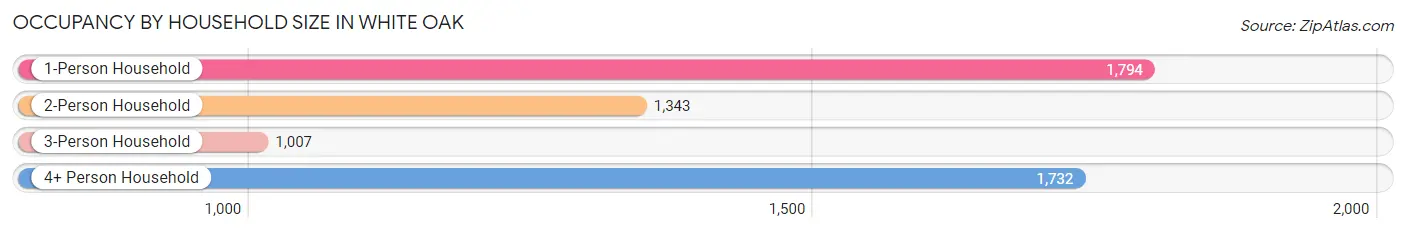
| Household Size | # Housing Units | % Housing Units |
| 1-Person Household | 1,794 | 30.5% |
| 2-Person Household | 1,343 | 22.9% |
| 3-Person Household | 1,007 | 17.1% |
| 4+ Person Household | 1,732 | 29.5% |
| Total Housing Units | 5,876 | 100.0% |
Occupancy by Ownership by Household Size in White Oak
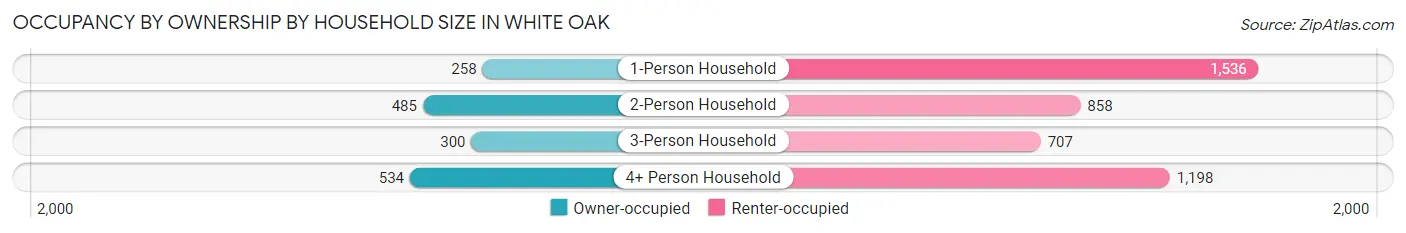
| Household Size | Owner-occupied | Renter-occupied |
| 1-Person Household | 258 (14.4%) | 1,536 (85.6%) |
| 2-Person Household | 485 (36.1%) | 858 (63.9%) |
| 3-Person Household | 300 (29.8%) | 707 (70.2%) |
| 4+ Person Household | 534 (30.8%) | 1,198 (69.2%) |
| Total Housing Units | 1,577 (26.8%) | 4,299 (73.2%) |
Occupancy by Educational Attainment in White Oak
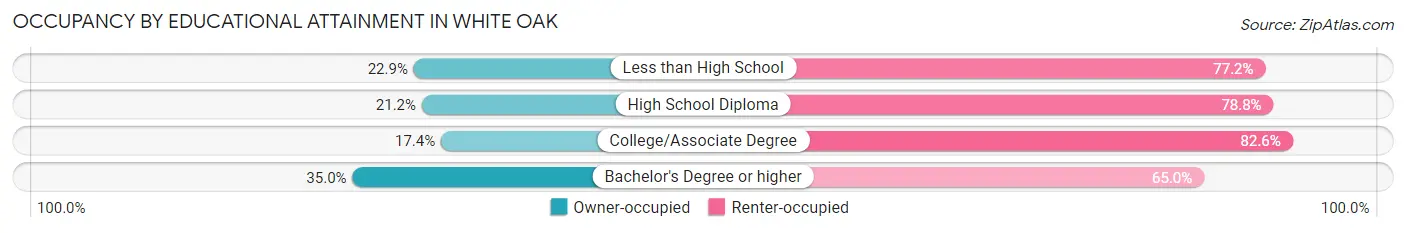
| Household Size | Owner-occupied | Renter-occupied |
| Less than High School | 157 (22.9%) | 530 (77.1%) |
| High School Diploma | 250 (21.2%) | 927 (78.8%) |
| College/Associate Degree | 233 (17.4%) | 1,103 (82.6%) |
| Bachelor's Degree or higher | 937 (35.0%) | 1,739 (65.0%) |
Occupancy by Age of Householder in White Oak
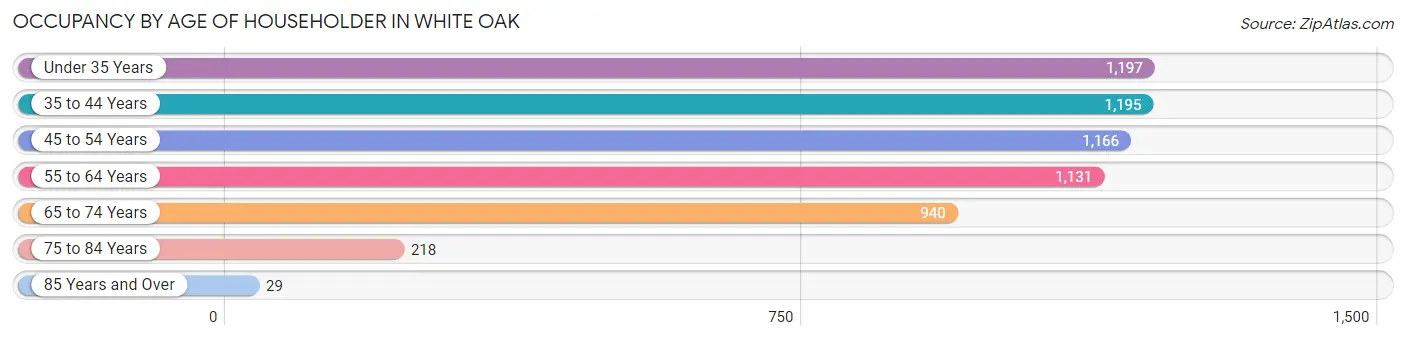
| Age Bracket | # Households | % Households |
| Under 35 Years | 1,197 | 20.4% |
| 35 to 44 Years | 1,195 | 20.3% |
| 45 to 54 Years | 1,166 | 19.8% |
| 55 to 64 Years | 1,131 | 19.3% |
| 65 to 74 Years | 940 | 16.0% |
| 75 to 84 Years | 218 | 3.7% |
| 85 Years and Over | 29 | 0.5% |
| Total | 5,876 | 100.0% |
Housing Finances in White Oak
Median Income by Occupancy in White Oak
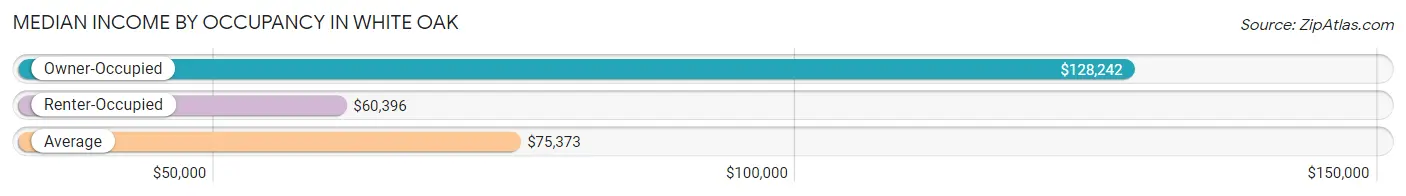
| Occupancy Type | # Households | Median Income |
| Owner-Occupied | 1,577 (26.8%) | $128,242 |
| Renter-Occupied | 4,299 (73.2%) | $60,396 |
| Average | 5,876 (100.0%) | $75,373 |
Occupancy by Householder Income Bracket in White Oak
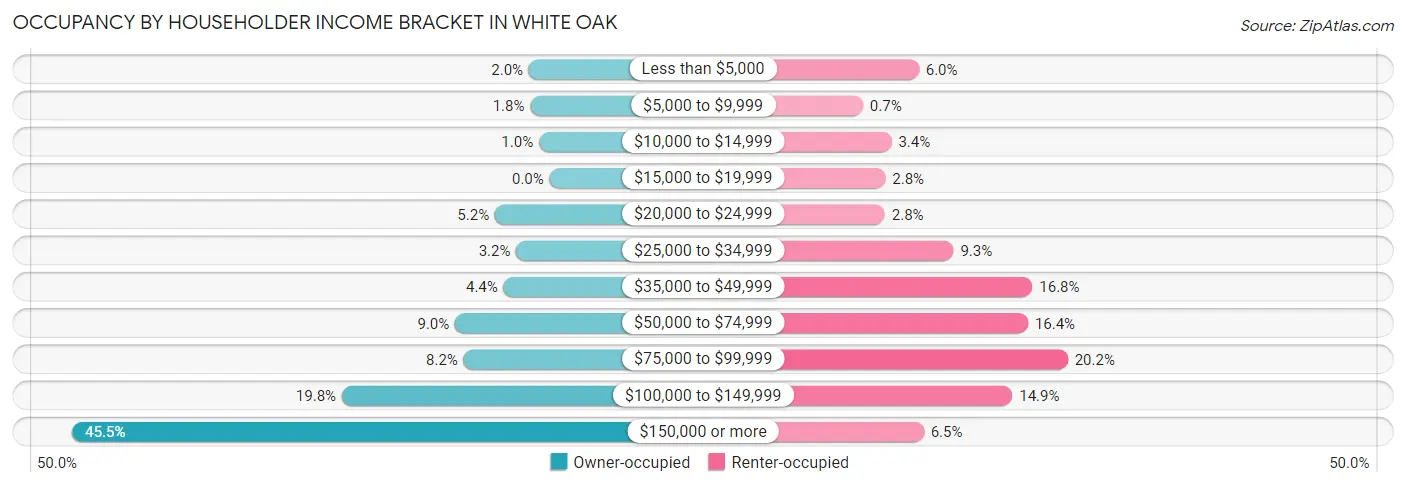
| Income Bracket | Owner-occupied | Renter-occupied |
| Less than $5,000 | 31 (2.0%) | 259 (6.0%) |
| $5,000 to $9,999 | 29 (1.8%) | 30 (0.7%) |
| $10,000 to $14,999 | 16 (1.0%) | 147 (3.4%) |
| $15,000 to $19,999 | 0 (0.0%) | 122 (2.8%) |
| $20,000 to $24,999 | 82 (5.2%) | 120 (2.8%) |
| $25,000 to $34,999 | 50 (3.2%) | 401 (9.3%) |
| $35,000 to $49,999 | 69 (4.4%) | 724 (16.8%) |
| $50,000 to $74,999 | 142 (9.0%) | 706 (16.4%) |
| $75,000 to $99,999 | 129 (8.2%) | 869 (20.2%) |
| $100,000 to $149,999 | 312 (19.8%) | 642 (14.9%) |
| $150,000 or more | 717 (45.5%) | 279 (6.5%) |
| Total | 1,577 (100.0%) | 4,299 (100.0%) |
Monthly Housing Cost Tiers in White Oak
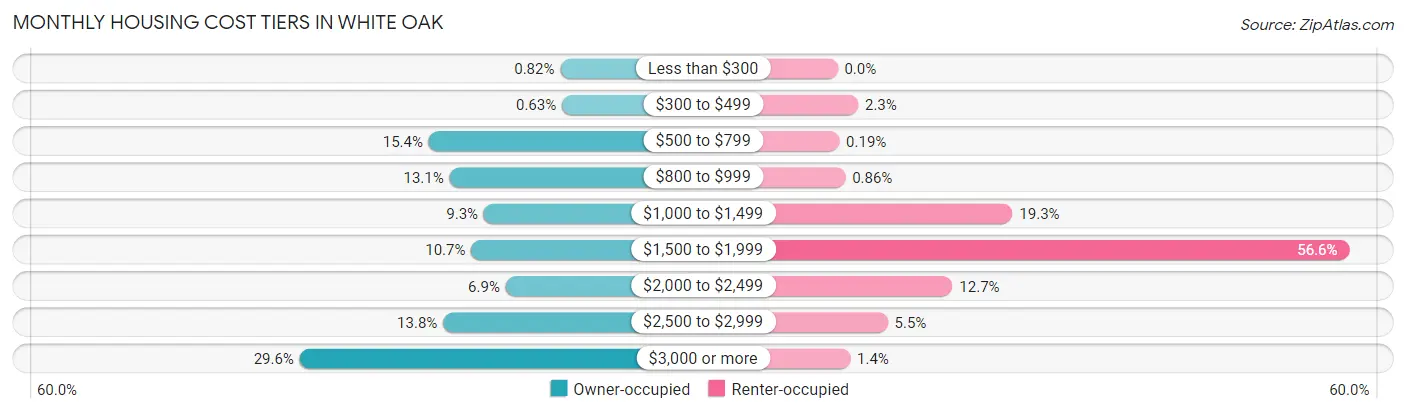
| Monthly Cost | Owner-occupied | Renter-occupied |
| Less than $300 | 13 (0.8%) | 0 (0.0%) |
| $300 to $499 | 10 (0.6%) | 98 (2.3%) |
| $500 to $799 | 242 (15.3%) | 8 (0.2%) |
| $800 to $999 | 206 (13.1%) | 37 (0.9%) |
| $1,000 to $1,499 | 146 (9.3%) | 831 (19.3%) |
| $1,500 to $1,999 | 168 (10.6%) | 2,431 (56.6%) |
| $2,000 to $2,499 | 108 (6.9%) | 546 (12.7%) |
| $2,500 to $2,999 | 217 (13.8%) | 238 (5.5%) |
| $3,000 or more | 467 (29.6%) | 60 (1.4%) |
| Total | 1,577 (100.0%) | 4,299 (100.0%) |
Physical Housing Characteristics in White Oak
Housing Structures in White Oak
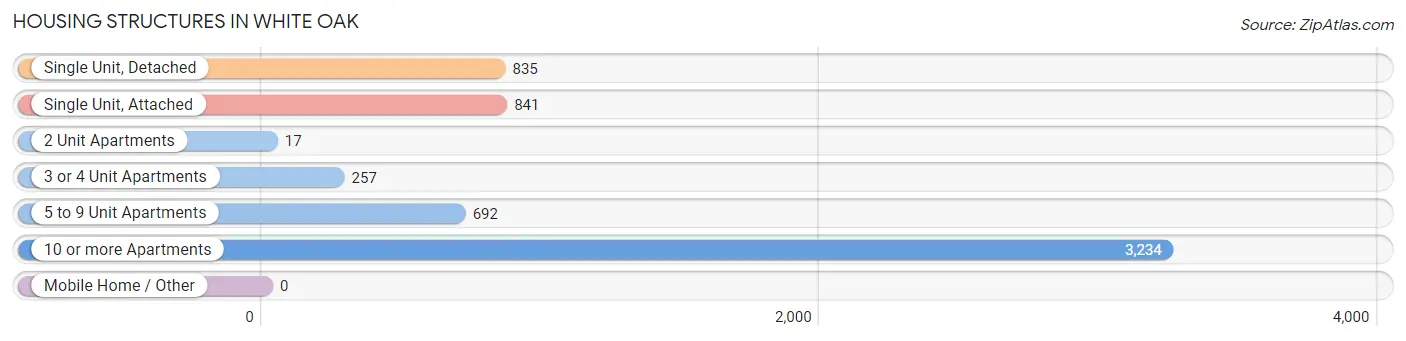
| Structure Type | # Housing Units | % Housing Units |
| Single Unit, Detached | 835 | 14.2% |
| Single Unit, Attached | 841 | 14.3% |
| 2 Unit Apartments | 17 | 0.3% |
| 3 or 4 Unit Apartments | 257 | 4.4% |
| 5 to 9 Unit Apartments | 692 | 11.8% |
| 10 or more Apartments | 3,234 | 55.0% |
| Mobile Home / Other | 0 | 0.0% |
| Total | 5,876 | 100.0% |
Housing Structures by Occupancy in White Oak
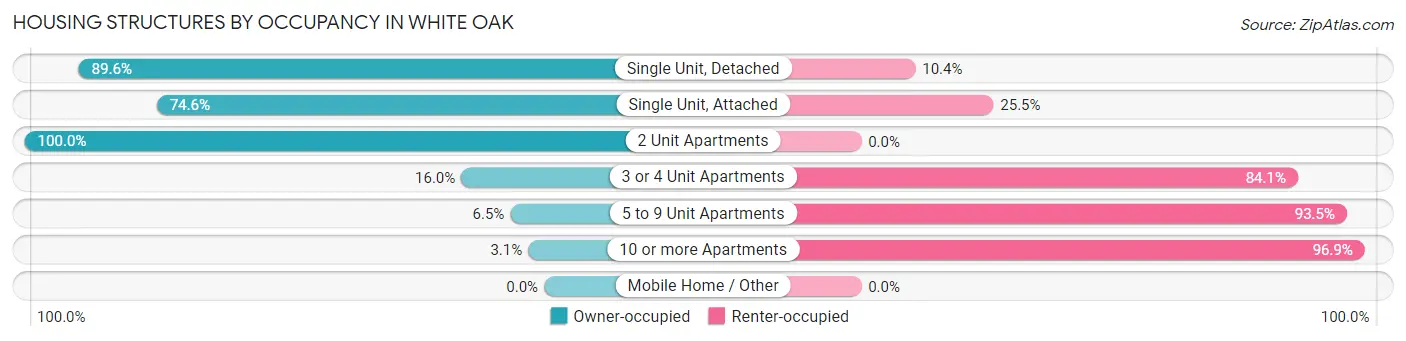
| Structure Type | Owner-occupied | Renter-occupied |
| Single Unit, Detached | 748 (89.6%) | 87 (10.4%) |
| Single Unit, Attached | 627 (74.6%) | 214 (25.5%) |
| 2 Unit Apartments | 17 (100.0%) | 0 (0.0%) |
| 3 or 4 Unit Apartments | 41 (16.0%) | 216 (84.1%) |
| 5 to 9 Unit Apartments | 45 (6.5%) | 647 (93.5%) |
| 10 or more Apartments | 99 (3.1%) | 3,135 (96.9%) |
| Mobile Home / Other | 0 (0.0%) | 0 (0.0%) |
| Total | 1,577 (26.8%) | 4,299 (73.2%) |
Housing Structures by Number of Rooms in White Oak
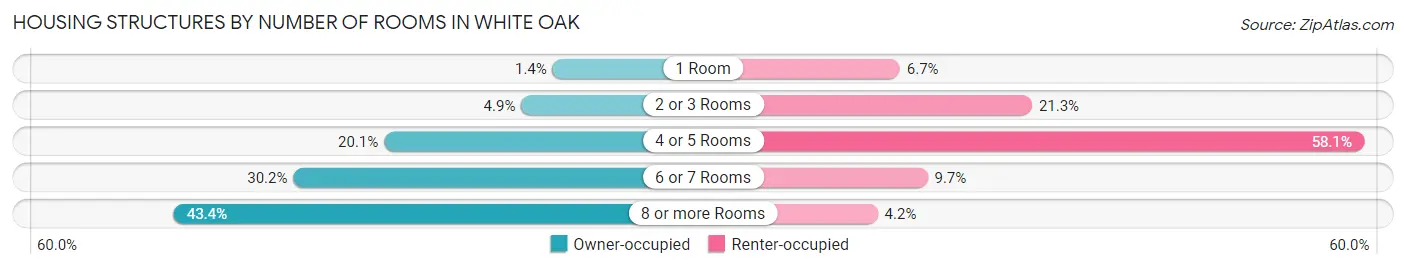
| Number of Rooms | Owner-occupied | Renter-occupied |
| 1 Room | 22 (1.4%) | 286 (6.7%) |
| 2 or 3 Rooms | 77 (4.9%) | 916 (21.3%) |
| 4 or 5 Rooms | 317 (20.1%) | 2,499 (58.1%) |
| 6 or 7 Rooms | 476 (30.2%) | 418 (9.7%) |
| 8 or more Rooms | 685 (43.4%) | 180 (4.2%) |
| Total | 1,577 (100.0%) | 4,299 (100.0%) |
Housing Structure by Heating Type in White Oak
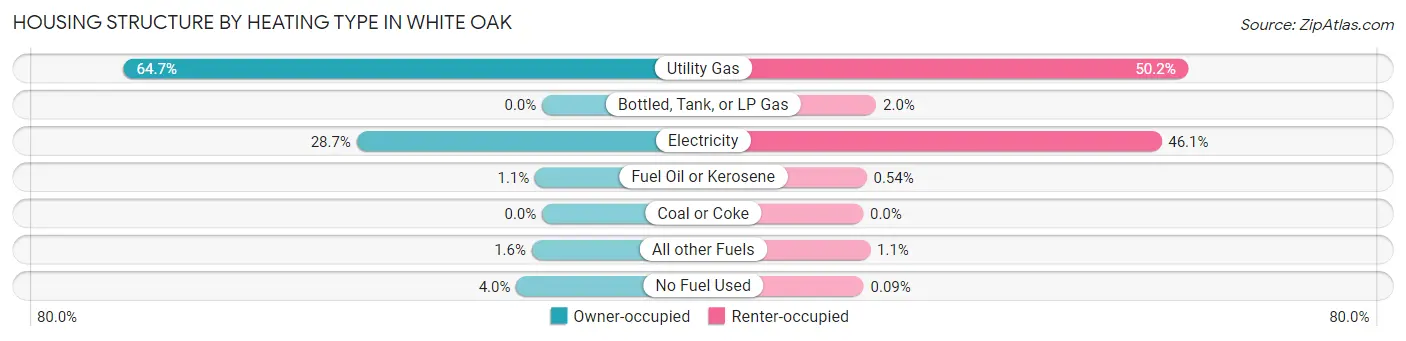
| Heating Type | Owner-occupied | Renter-occupied |
| Utility Gas | 1,020 (64.7%) | 2,156 (50.1%) |
| Bottled, Tank, or LP Gas | 0 (0.0%) | 87 (2.0%) |
| Electricity | 452 (28.7%) | 1,982 (46.1%) |
| Fuel Oil or Kerosene | 17 (1.1%) | 23 (0.5%) |
| Coal or Coke | 0 (0.0%) | 0 (0.0%) |
| All other Fuels | 25 (1.6%) | 47 (1.1%) |
| No Fuel Used | 63 (4.0%) | 4 (0.1%) |
| Total | 1,577 (100.0%) | 4,299 (100.0%) |
Household Vehicle Usage in White Oak
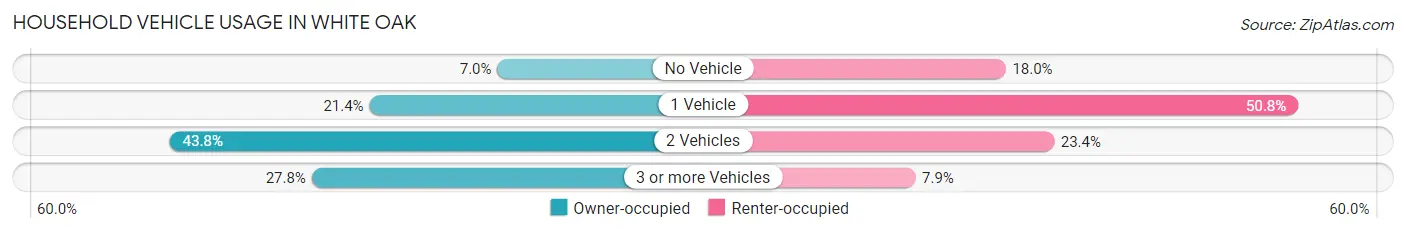
| Vehicles per Household | Owner-occupied | Renter-occupied |
| No Vehicle | 111 (7.0%) | 773 (18.0%) |
| 1 Vehicle | 337 (21.4%) | 2,182 (50.8%) |
| 2 Vehicles | 690 (43.8%) | 1,006 (23.4%) |
| 3 or more Vehicles | 439 (27.8%) | 338 (7.9%) |
| Total | 1,577 (100.0%) | 4,299 (100.0%) |
Real Estate & Mortgages in White Oak
Real Estate and Mortgage Overview in White Oak
| Characteristic | Without Mortgage | With Mortgage |
| Housing Units | 535 | 1,042 |
| Median Property Value | $445,700 | $500,000 |
| Median Household Income | $101,179 | $486 |
| Monthly Housing Costs | $817 | $404 |
| Real Estate Taxes | $4,441 | $17 |
Property Value by Mortgage Status in White Oak
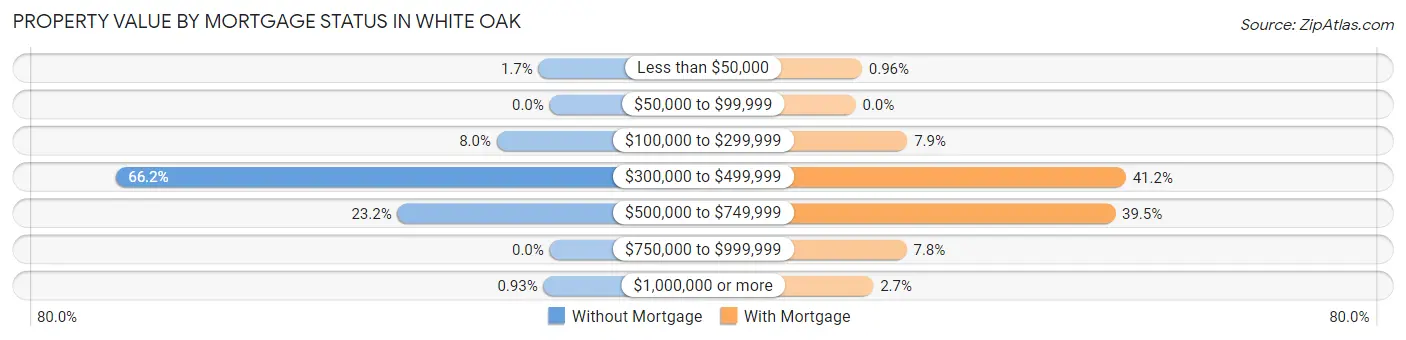
| Property Value | Without Mortgage | With Mortgage |
| Less than $50,000 | 9 (1.7%) | 10 (1.0%) |
| $50,000 to $99,999 | 0 (0.0%) | 0 (0.0%) |
| $100,000 to $299,999 | 43 (8.0%) | 82 (7.9%) |
| $300,000 to $499,999 | 354 (66.2%) | 429 (41.2%) |
| $500,000 to $749,999 | 124 (23.2%) | 412 (39.5%) |
| $750,000 to $999,999 | 0 (0.0%) | 81 (7.8%) |
| $1,000,000 or more | 5 (0.9%) | 28 (2.7%) |
| Total | 535 (100.0%) | 1,042 (100.0%) |
Household Income by Mortgage Status in White Oak
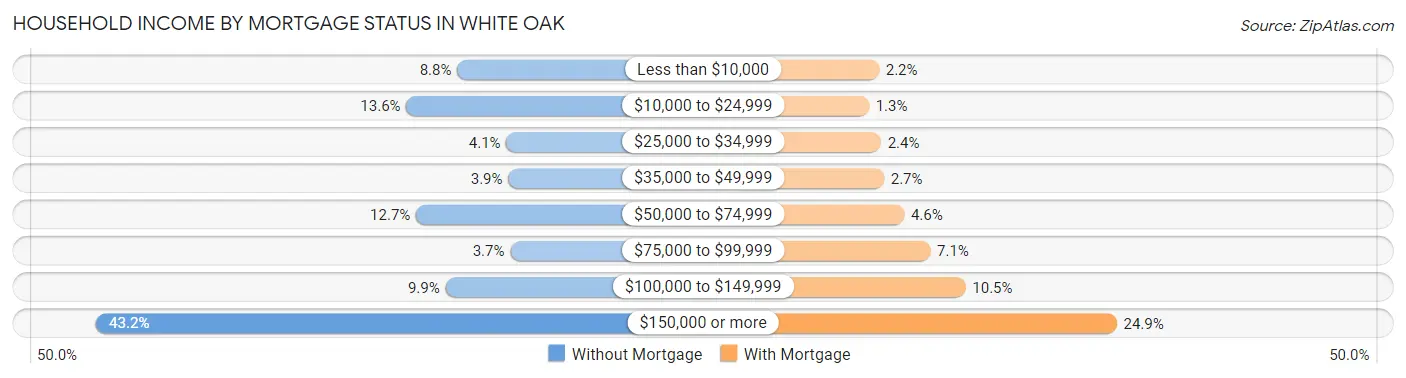
| Household Income | Without Mortgage | With Mortgage |
| Less than $10,000 | 47 (8.8%) | 23 (2.2%) |
| $10,000 to $24,999 | 73 (13.6%) | 13 (1.3%) |
| $25,000 to $34,999 | 22 (4.1%) | 25 (2.4%) |
| $35,000 to $49,999 | 21 (3.9%) | 28 (2.7%) |
| $50,000 to $74,999 | 68 (12.7%) | 48 (4.6%) |
| $75,000 to $99,999 | 20 (3.7%) | 74 (7.1%) |
| $100,000 to $149,999 | 53 (9.9%) | 109 (10.5%) |
| $150,000 or more | 231 (43.2%) | 259 (24.9%) |
| Total | 535 (100.0%) | 1,042 (100.0%) |
Property Value to Household Income Ratio in White Oak
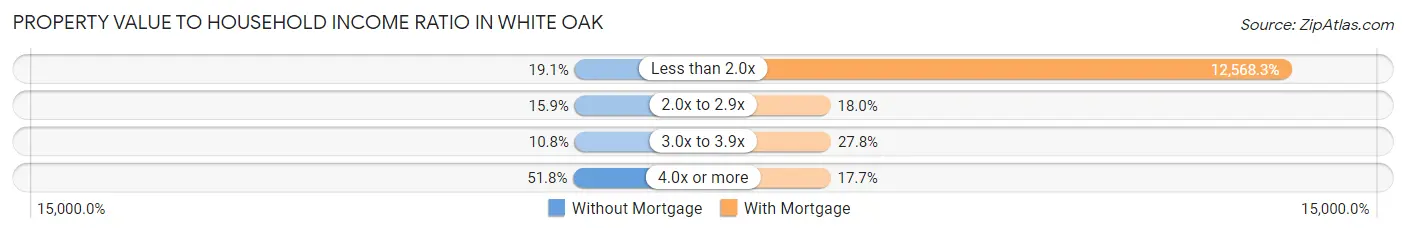
| Value-to-Income Ratio | Without Mortgage | With Mortgage |
| Less than 2.0x | 102 (19.1%) | 130,962 (12,568.3%) |
| 2.0x to 2.9x | 85 (15.9%) | 188 (18.0%) |
| 3.0x to 3.9x | 58 (10.8%) | 290 (27.8%) |
| 4.0x or more | 277 (51.8%) | 184 (17.7%) |
| Total | 535 (100.0%) | 1,042 (100.0%) |
Real Estate Taxes by Mortgage Status in White Oak
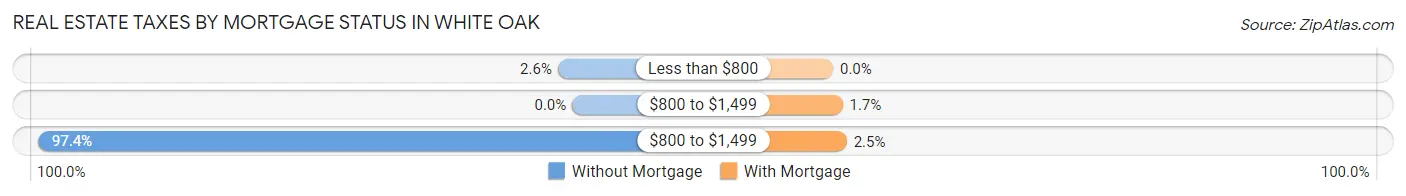
| Property Taxes | Without Mortgage | With Mortgage |
| Less than $800 | 14 (2.6%) | 0 (0.0%) |
| $800 to $1,499 | 0 (0.0%) | 18 (1.7%) |
| $800 to $1,499 | 521 (97.4%) | 26 (2.5%) |
| Total | 535 (100.0%) | 1,042 (100.0%) |
Health & Disability in White Oak
Health Insurance Coverage by Age in White Oak
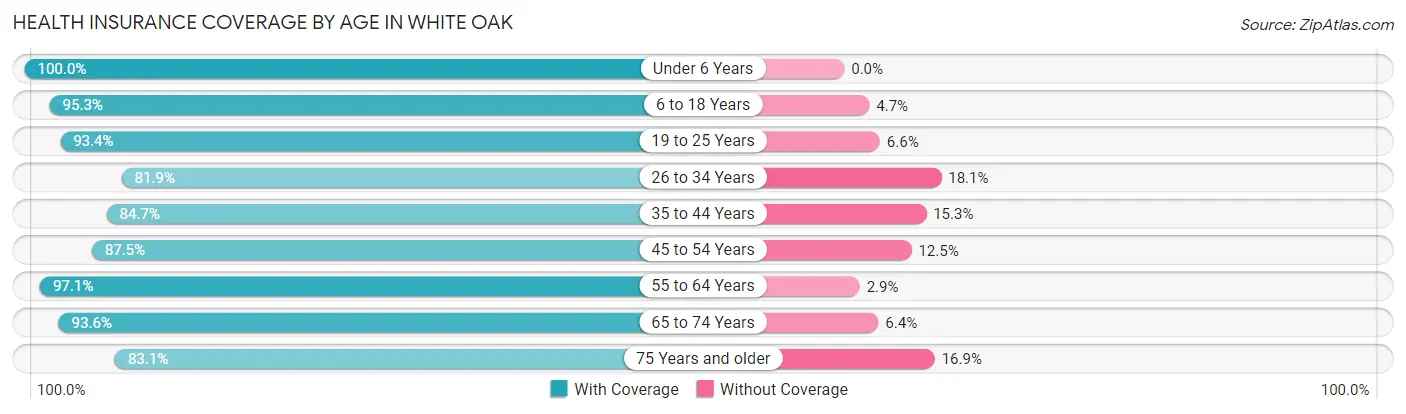
| Age Bracket | With Coverage | Without Coverage |
| Under 6 Years | 1,588 (100.0%) | 0 (0.0%) |
| 6 to 18 Years | 2,465 (95.3%) | 121 (4.7%) |
| 19 to 25 Years | 1,238 (93.4%) | 88 (6.6%) |
| 26 to 34 Years | 2,084 (81.9%) | 460 (18.1%) |
| 35 to 44 Years | 1,835 (84.7%) | 331 (15.3%) |
| 45 to 54 Years | 1,725 (87.5%) | 247 (12.5%) |
| 55 to 64 Years | 1,551 (97.1%) | 46 (2.9%) |
| 65 to 74 Years | 1,266 (93.6%) | 86 (6.4%) |
| 75 Years and older | 291 (83.1%) | 59 (16.9%) |
| Total | 14,043 (90.7%) | 1,438 (9.3%) |
Health Insurance Coverage by Citizenship Status in White Oak
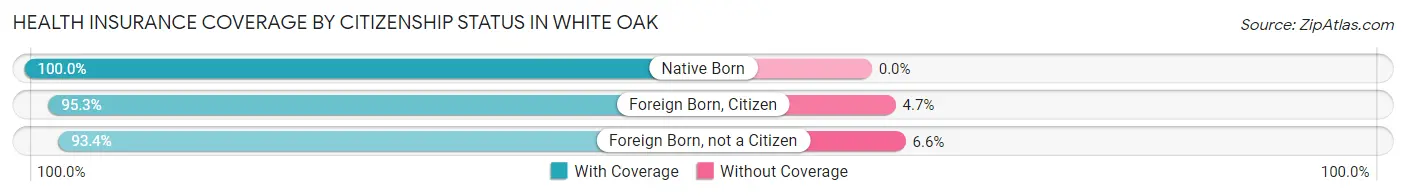
| Citizenship Status | With Coverage | Without Coverage |
| Native Born | 1,588 (100.0%) | 0 (0.0%) |
| Foreign Born, Citizen | 2,465 (95.3%) | 121 (4.7%) |
| Foreign Born, not a Citizen | 1,238 (93.4%) | 88 (6.6%) |
Health Insurance Coverage by Household Income in White Oak
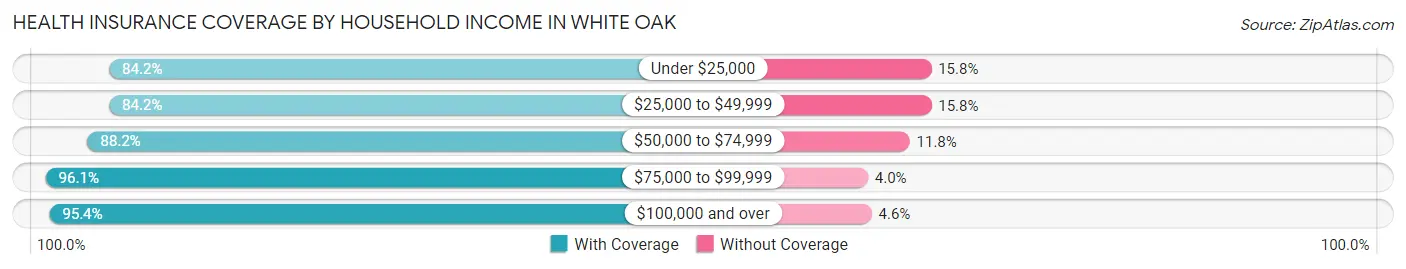
| Household Income | With Coverage | Without Coverage |
| Under $25,000 | 1,309 (84.2%) | 246 (15.8%) |
| $25,000 to $49,999 | 3,020 (84.2%) | 568 (15.8%) |
| $50,000 to $74,999 | 2,001 (88.2%) | 267 (11.8%) |
| $75,000 to $99,999 | 2,285 (96.1%) | 94 (4.0%) |
| $100,000 and over | 5,407 (95.4%) | 263 (4.6%) |
Public vs Private Health Insurance Coverage by Age in White Oak
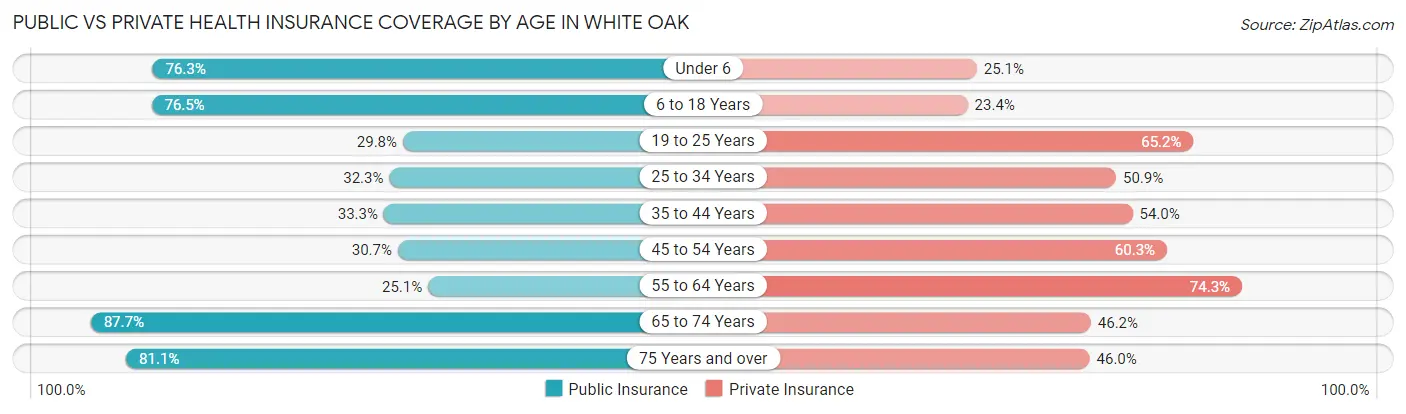
| Age Bracket | Public Insurance | Private Insurance |
| Under 6 | 1,211 (76.3%) | 398 (25.1%) |
| 6 to 18 Years | 1,977 (76.4%) | 604 (23.4%) |
| 19 to 25 Years | 395 (29.8%) | 865 (65.2%) |
| 25 to 34 Years | 822 (32.3%) | 1,295 (50.9%) |
| 35 to 44 Years | 722 (33.3%) | 1,169 (54.0%) |
| 45 to 54 Years | 606 (30.7%) | 1,190 (60.3%) |
| 55 to 64 Years | 401 (25.1%) | 1,186 (74.3%) |
| 65 to 74 Years | 1,186 (87.7%) | 625 (46.2%) |
| 75 Years and over | 284 (81.1%) | 161 (46.0%) |
| Total | 7,604 (49.1%) | 7,493 (48.4%) |
Disability Status by Sex by Age in White Oak
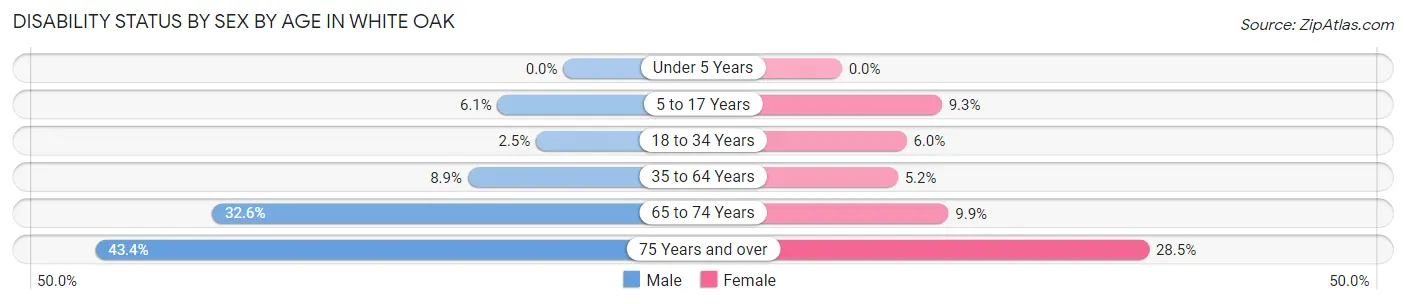
| Age Bracket | Male | Female |
| Under 5 Years | 0 (0.0%) | 0 (0.0%) |
| 5 to 17 Years | 71 (6.1%) | 133 (9.3%) |
| 18 to 34 Years | 51 (2.5%) | 126 (6.0%) |
| 35 to 64 Years | 242 (8.9%) | 156 (5.2%) |
| 65 to 74 Years | 164 (32.6%) | 84 (9.9%) |
| 75 Years and over | 53 (43.4%) | 65 (28.5%) |
Disability Class by Sex by Age in White Oak
Disability Class: Hearing Difficulty
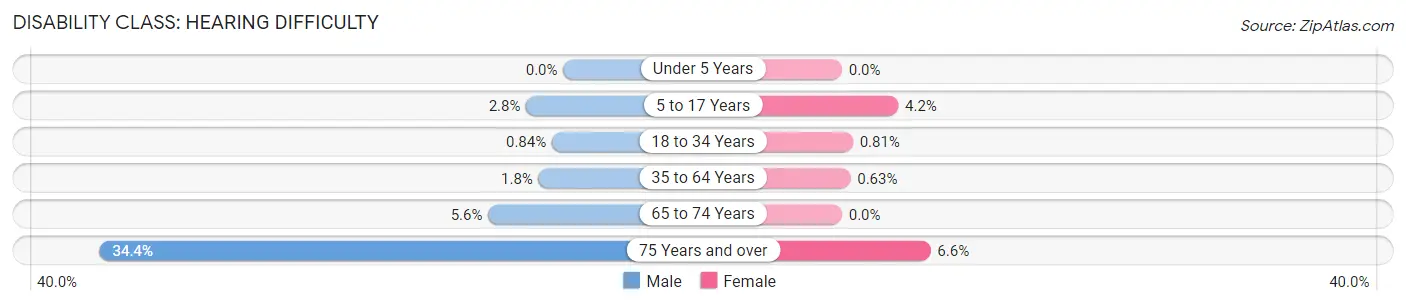
| Age Bracket | Male | Female |
| Under 5 Years | 0 (0.0%) | 0 (0.0%) |
| 5 to 17 Years | 32 (2.8%) | 60 (4.2%) |
| 18 to 34 Years | 17 (0.8%) | 17 (0.8%) |
| 35 to 64 Years | 50 (1.8%) | 19 (0.6%) |
| 65 to 74 Years | 28 (5.6%) | 0 (0.0%) |
| 75 Years and over | 42 (34.4%) | 15 (6.6%) |
Disability Class: Vision Difficulty
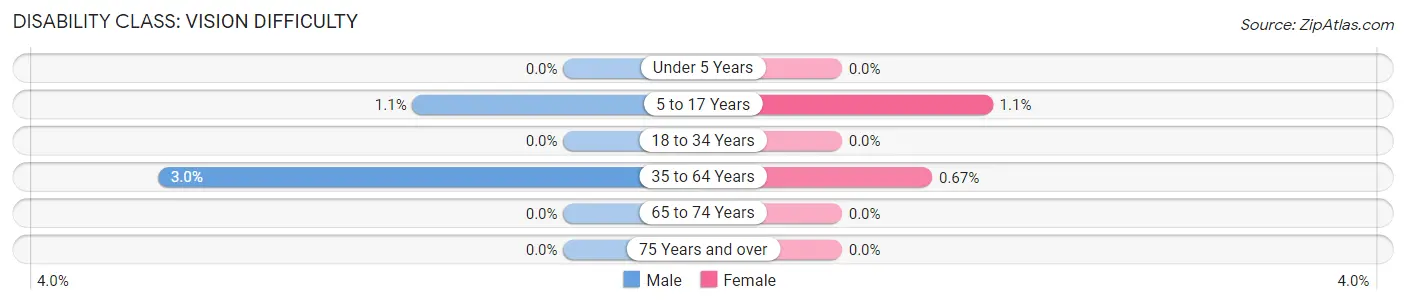
| Age Bracket | Male | Female |
| Under 5 Years | 0 (0.0%) | 0 (0.0%) |
| 5 to 17 Years | 13 (1.1%) | 16 (1.1%) |
| 18 to 34 Years | 0 (0.0%) | 0 (0.0%) |
| 35 to 64 Years | 82 (3.0%) | 20 (0.7%) |
| 65 to 74 Years | 0 (0.0%) | 0 (0.0%) |
| 75 Years and over | 0 (0.0%) | 0 (0.0%) |
Disability Class: Cognitive Difficulty
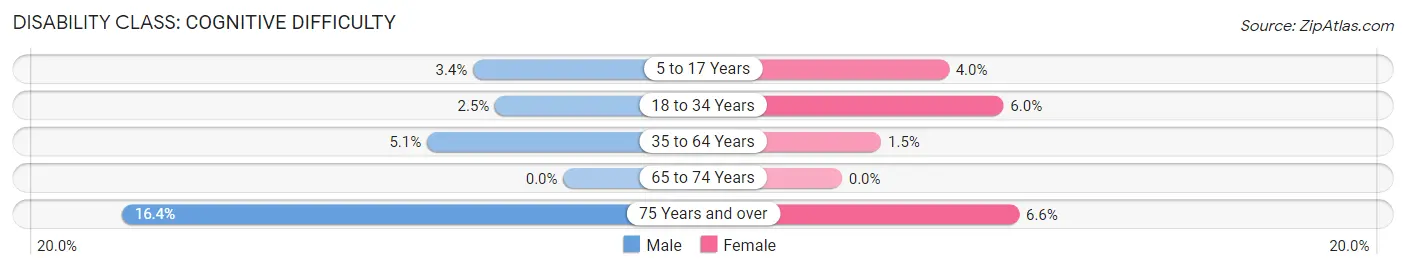
| Age Bracket | Male | Female |
| 5 to 17 Years | 39 (3.4%) | 57 (4.0%) |
| 18 to 34 Years | 51 (2.5%) | 126 (6.0%) |
| 35 to 64 Years | 138 (5.1%) | 44 (1.5%) |
| 65 to 74 Years | 0 (0.0%) | 0 (0.0%) |
| 75 Years and over | 20 (16.4%) | 15 (6.6%) |
Disability Class: Ambulatory Difficulty
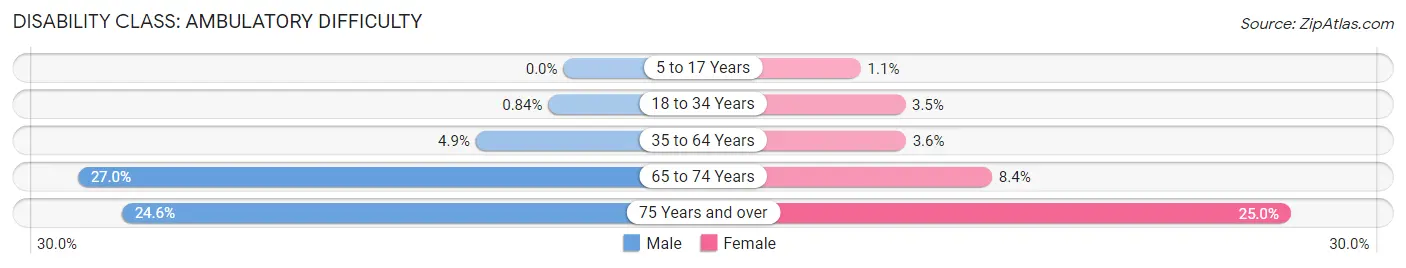
| Age Bracket | Male | Female |
| 5 to 17 Years | 0 (0.0%) | 15 (1.1%) |
| 18 to 34 Years | 17 (0.8%) | 74 (3.5%) |
| 35 to 64 Years | 133 (4.9%) | 107 (3.6%) |
| 65 to 74 Years | 136 (27.0%) | 71 (8.4%) |
| 75 Years and over | 30 (24.6%) | 57 (25.0%) |
Disability Class: Self-Care Difficulty
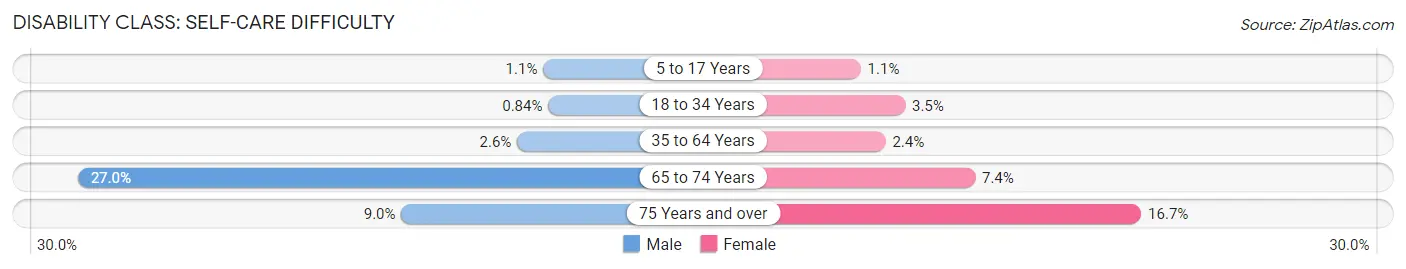
| Age Bracket | Male | Female |
| 5 to 17 Years | 13 (1.1%) | 15 (1.1%) |
| 18 to 34 Years | 17 (0.8%) | 74 (3.5%) |
| 35 to 64 Years | 70 (2.6%) | 73 (2.4%) |
| 65 to 74 Years | 136 (27.0%) | 63 (7.4%) |
| 75 Years and over | 11 (9.0%) | 38 (16.7%) |
Technology Access in White Oak
Computing Device Access in White Oak
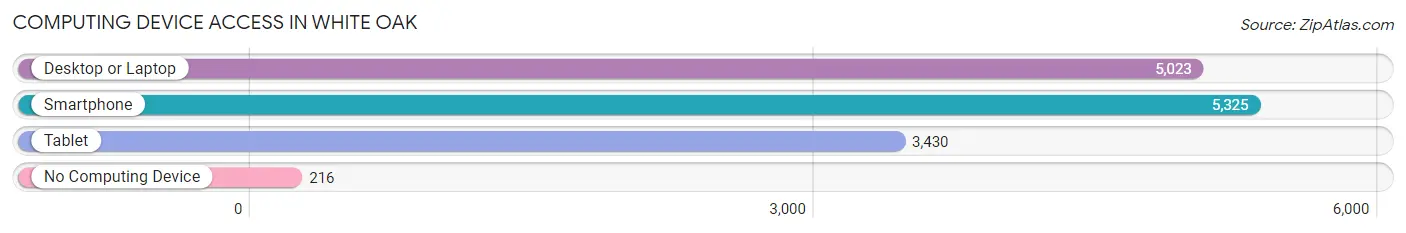
| Device Type | # Households | % Households |
| Desktop or Laptop | 5,023 | 85.5% |
| Smartphone | 5,325 | 90.6% |
| Tablet | 3,430 | 58.4% |
| No Computing Device | 216 | 3.7% |
| Total | 5,876 | 100.0% |
Internet Access in White Oak
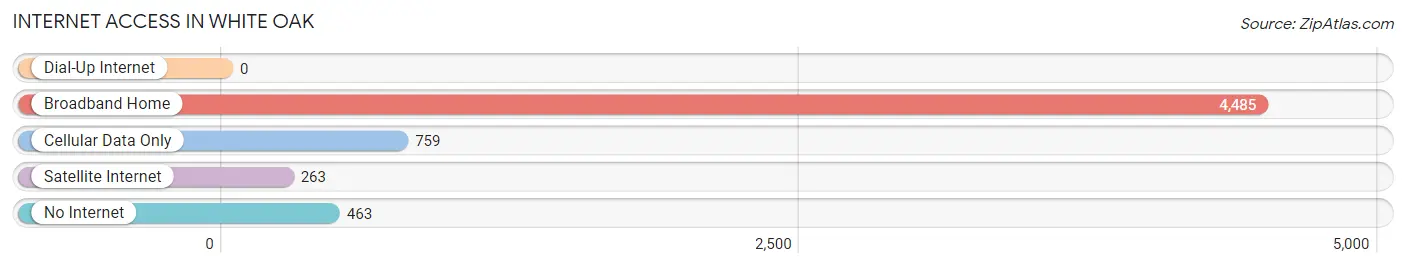
| Internet Type | # Households | % Households |
| Dial-Up Internet | 0 | 0.0% |
| Broadband Home | 4,485 | 76.3% |
| Cellular Data Only | 759 | 12.9% |
| Satellite Internet | 263 | 4.5% |
| No Internet | 463 | 7.9% |
| Total | 5,876 | 100.0% |
White Oak Summary
White Oak is a census-designated place (CDP) located in Montgomery County, Maryland, United States. It is a suburban community located just outside of Washington, D.C. and is part of the Washington metropolitan area. As of the 2010 census, the population of White Oak was 16,098.
History
White Oak was first settled in the late 1700s by a group of German immigrants. The area was originally known as “White Oak Grove” and was part of a larger tract of land owned by the German settlers. The area was primarily used for farming and the settlers built a small church in the area.
In the early 1900s, the area began to develop as a residential community. The area was annexed by Montgomery County in 1952 and the White Oak CDP was established in the 1970s.
Geography
White Oak is located at 39°3'25"N 76°59'45"W (39.056944, -76.995833). It is situated in the northern part of Montgomery County, just south of the Washington, D.C. border. The CDP has a total area of 4.2 square miles, all of which is land.
Economy
White Oak is primarily a residential community, but it does have some commercial and industrial businesses. The area is home to several large employers, including the National Institutes of Health, the Food and Drug Administration, and the National Security Agency.
Demographics
As of the 2010 census, there were 16,098 people, 6,717 households, and 4,092 families residing in the CDP. The population density was 3,817.3 people per square mile. The racial makeup of the CDP was 57.3% White, 24.2% African American, 0.4% Native American, 11.2% Asian, 0.1% Pacific Islander, 3.2% from other races, and 3.7% from two or more races. Hispanic or Latino of any race were 8.2% of the population.
The median income for a household in the CDP was $76,945, and the median income for a family was $90,945. Males had a median income of $60,945 versus $45,945 for females. The per capita income for the CDP was $35,945. About 4.2% of families and 6.2% of the population were below the poverty line, including 8.2% of those under age 18 and 4.2% of those age 65 or over.
Common Questions
What is Per Capita Income in White Oak?
Per Capita income in White Oak is $36,944.
What is the Median Family Income in White Oak?
Median Family Income in White Oak is $77,435.
What is the Median Household income in White Oak?
Median Household Income in White Oak is $75,373.
What is Income or Wage Gap in White Oak?
Income or Wage Gap in White Oak is 25.9%.
Women in White Oak earn 74.1 cents for every dollar earned by a man.
What is Family Income Deficit in White Oak?
Family Income Deficit in White Oak is $12,114.
Families that are below poverty line in White Oak earn $12,114 less on average than the poverty threshold level.
What is Inequality or Gini Index in White Oak?
Inequality or Gini Index in White Oak is 0.45.
What is the Total Population of White Oak?
Total Population of White Oak is 15,489.
What is the Total Male Population of White Oak?
Total Male Population of White Oak is 7,237.
What is the Total Female Population of White Oak?
Total Female Population of White Oak is 8,252.
What is the Ratio of Males per 100 Females in White Oak?
There are 87.70 Males per 100 Females in White Oak.
What is the Ratio of Females per 100 Males in White Oak?
There are 114.03 Females per 100 Males in White Oak.
What is the Median Population Age in White Oak?
Median Population Age in White Oak is 33.5 Years.
What is the Average Family Size in White Oak
Average Family Size in White Oak is 3.3 People.
What is the Average Household Size in White Oak
Average Household Size in White Oak is 2.6 People.
How Large is the Labor Force in White Oak?
There are 8,409 People in the Labor Forcein in White Oak.
What is the Percentage of People in the Labor Force in White Oak?
70.4% of People are in the Labor Force in White Oak.
What is the Unemployment Rate in White Oak?
Unemployment Rate in White Oak is 7.3%.