Kemp Mill, MD Map & Demographics
Kemp Mill Map
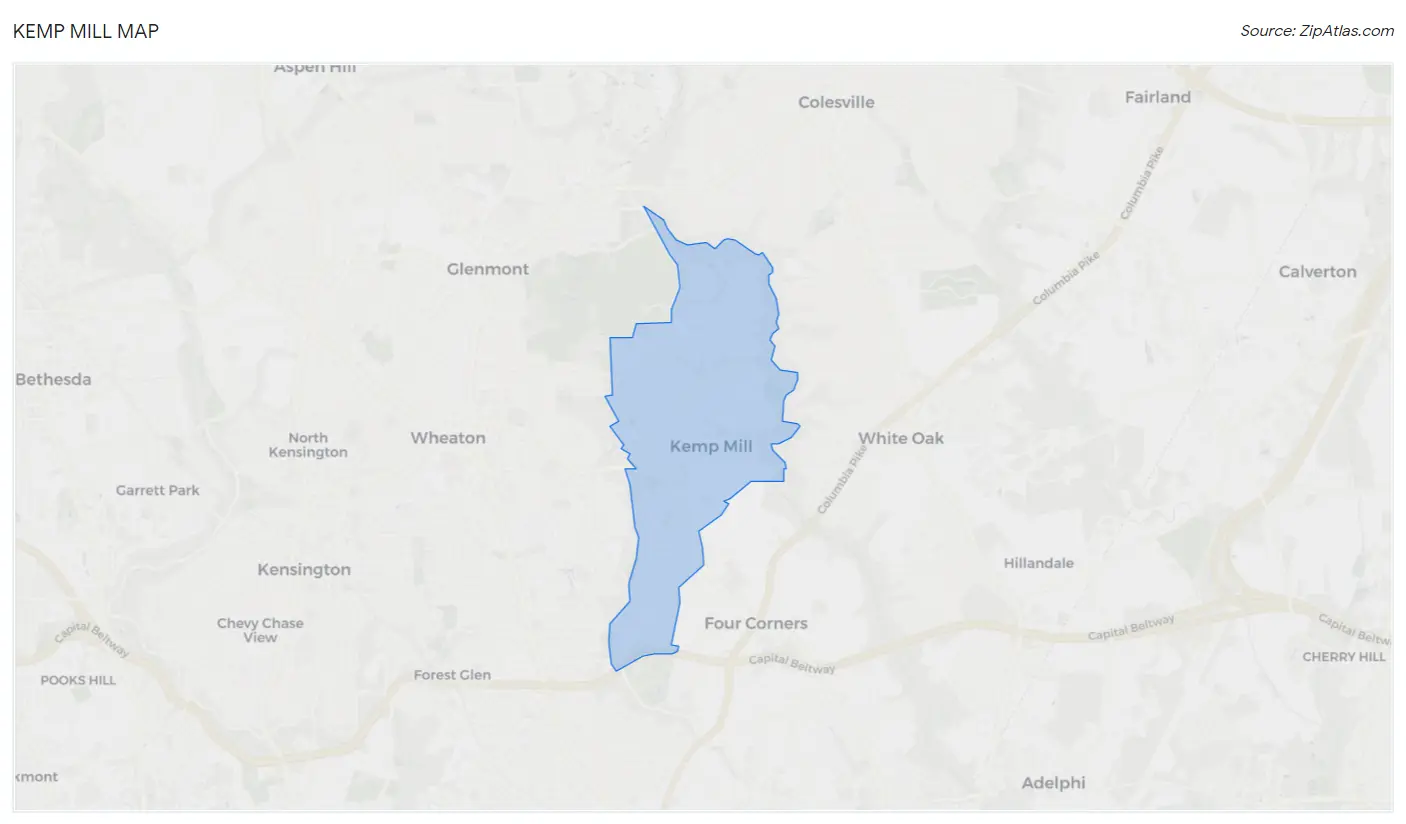
Kemp Mill Overview
$60,348
PER CAPITA INCOME
$168,594
AVG FAMILY INCOME
$151,943
AVG HOUSEHOLD INCOME
32.7%
WAGE / INCOME GAP [ % ]
67.3¢/ $1
WAGE / INCOME GAP [ $ ]
0.43
INEQUALITY / GINI INDEX
14,098
TOTAL POPULATION
7,032
MALE POPULATION
7,066
FEMALE POPULATION
99.52
MALES / 100 FEMALES
100.48
FEMALES / 100 MALES
39.7
MEDIAN AGE
3.5
AVG FAMILY SIZE
3.0
AVG HOUSEHOLD SIZE
7,636
LABOR FORCE [ PEOPLE ]
69.9%
PERCENT IN LABOR FORCE
3.9%
UNEMPLOYMENT RATE
Income in Kemp Mill
Income Overview in Kemp Mill
Per Capita Income in Kemp Mill is $60,348, while median incomes of families and households are $168,594 and $151,943 respectively.
| Characteristic | Number | Measure |
| Per Capita Income | 14,098 | $60,348 |
| Median Family Income | 3,574 | $168,594 |
| Mean Family Income | 3,574 | $195,260 |
| Median Household Income | 4,713 | $151,943 |
| Mean Household Income | 4,713 | $175,610 |
| Income Deficit | 3,574 | $0 |
| Wage / Income Gap (%) | 14,098 | 32.69% |
| Wage / Income Gap ($) | 14,098 | 67.31¢ per $1 |
| Gini / Inequality Index | 14,098 | 0.43 |
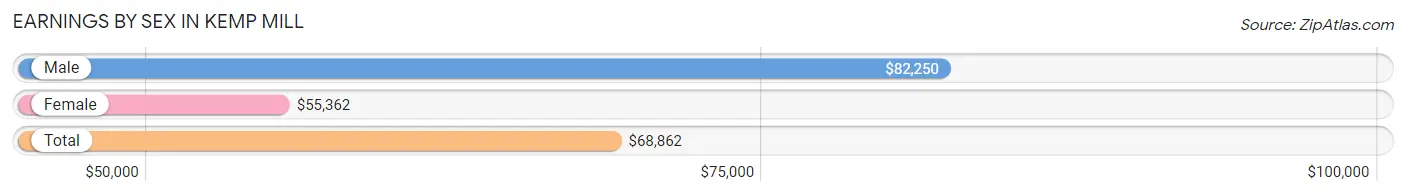
Earnings by Sex in Kemp Mill
Average Earnings in Kemp Mill are $68,862, $82,250 for men and $55,362 for women, a difference of 32.7%.
| Sex | Number | Average Earnings |
| Male | 4,117 (52.3%) | $82,250 |
| Female | 3,750 (47.7%) | $55,362 |
| Total | 7,867 (100.0%) | $68,862 |
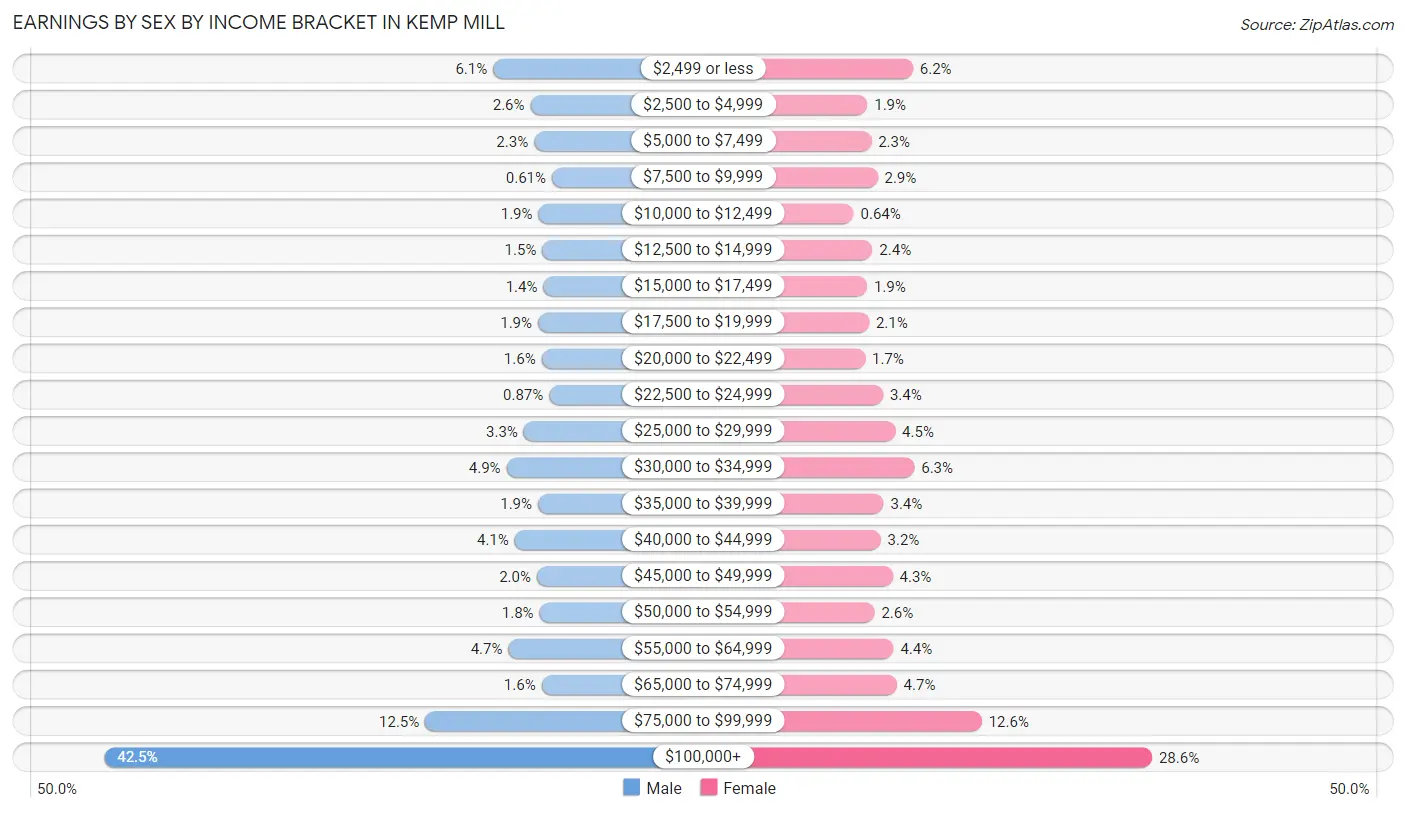
Earnings by Sex by Income Bracket in Kemp Mill
The most common earnings brackets in Kemp Mill are $100,000+ for men (1,751 | 42.5%) and $100,000+ for women (1,072 | 28.6%).
| Income | Male | Female |
| $2,499 or less | 252 (6.1%) | 232 (6.2%) |
| $2,500 to $4,999 | 108 (2.6%) | 72 (1.9%) |
| $5,000 to $7,499 | 94 (2.3%) | 86 (2.3%) |
| $7,500 to $9,999 | 25 (0.6%) | 108 (2.9%) |
| $10,000 to $12,499 | 77 (1.9%) | 24 (0.6%) |
| $12,500 to $14,999 | 62 (1.5%) | 90 (2.4%) |
| $15,000 to $17,499 | 58 (1.4%) | 71 (1.9%) |
| $17,500 to $19,999 | 79 (1.9%) | 78 (2.1%) |
| $20,000 to $22,499 | 65 (1.6%) | 64 (1.7%) |
| $22,500 to $24,999 | 36 (0.9%) | 127 (3.4%) |
| $25,000 to $29,999 | 134 (3.3%) | 170 (4.5%) |
| $30,000 to $34,999 | 200 (4.9%) | 237 (6.3%) |
| $35,000 to $39,999 | 79 (1.9%) | 129 (3.4%) |
| $40,000 to $44,999 | 169 (4.1%) | 119 (3.2%) |
| $45,000 to $49,999 | 83 (2.0%) | 161 (4.3%) |
| $50,000 to $54,999 | 73 (1.8%) | 97 (2.6%) |
| $55,000 to $64,999 | 193 (4.7%) | 164 (4.4%) |
| $65,000 to $74,999 | 65 (1.6%) | 175 (4.7%) |
| $75,000 to $99,999 | 514 (12.5%) | 474 (12.6%) |
| $100,000+ | 1,751 (42.5%) | 1,072 (28.6%) |
| Total | 4,117 (100.0%) | 3,750 (100.0%) |
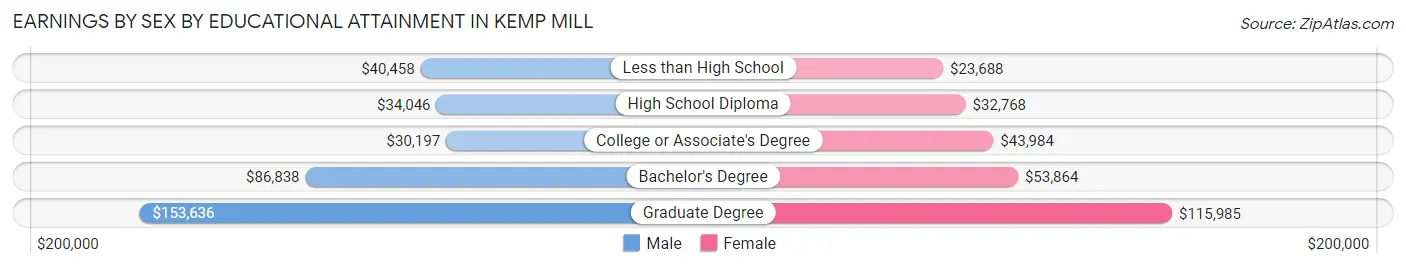
Earnings by Sex by Educational Attainment in Kemp Mill
Average earnings in Kemp Mill are $90,015 for men and $67,381 for women, a difference of 25.1%. Men with an educational attainment of graduate degree enjoy the highest average annual earnings of $153,636, while those with college or associate's degree education earn the least with $30,197. Women with an educational attainment of graduate degree earn the most with the average annual earnings of $115,985, while those with less than high school education have the smallest earnings of $23,688.
| Educational Attainment | Male Income | Female Income |
| Less than High School | $40,458 | $23,688 |
| High School Diploma | $34,046 | $32,768 |
| College or Associate's Degree | $30,197 | $43,984 |
| Bachelor's Degree | $86,838 | $53,864 |
| Graduate Degree | $153,636 | $115,985 |
| Total | $90,015 | $67,381 |
Family Income in Kemp Mill
Family Income Brackets in Kemp Mill
According to the Kemp Mill family income data, there are 1,397 families falling into the $200,000+ income range, which is the most common income bracket and makes up 39.1% of all families. Conversely, the $10,000 to $14,999 income bracket is the least frequent group with only 29 families (0.8%) belonging to this category.
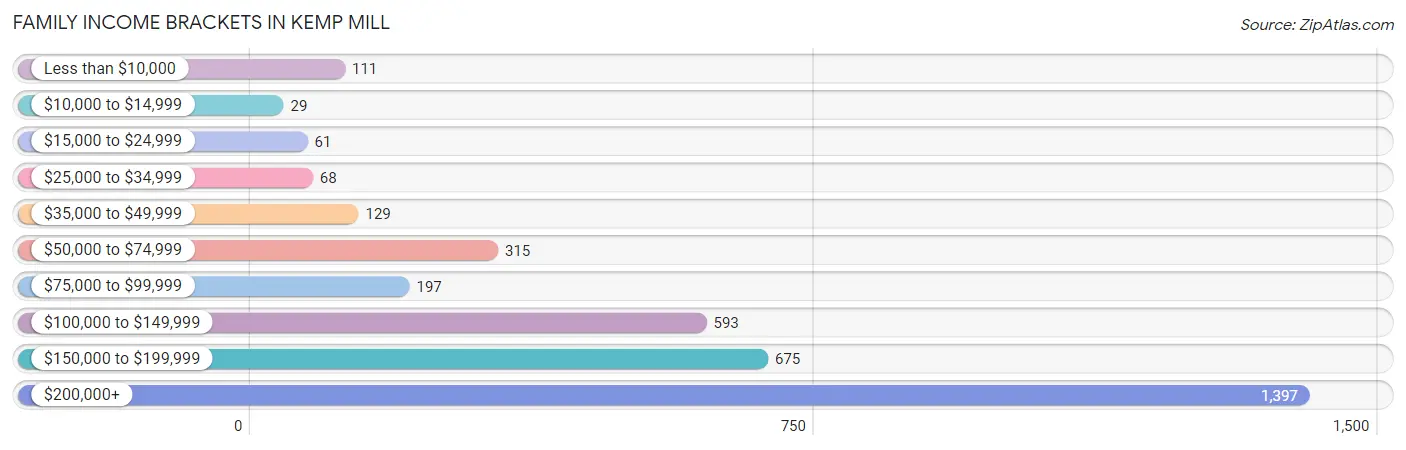
| Income Bracket | # Families | % Families |
| Less than $10,000 | 111 | 3.1% |
| $10,000 to $14,999 | 29 | 0.8% |
| $15,000 to $24,999 | 61 | 1.7% |
| $25,000 to $34,999 | 68 | 1.9% |
| $35,000 to $49,999 | 129 | 3.6% |
| $50,000 to $74,999 | 315 | 8.8% |
| $75,000 to $99,999 | 197 | 5.5% |
| $100,000 to $149,999 | 593 | 16.6% |
| $150,000 to $199,999 | 675 | 18.9% |
| $200,000+ | 1,397 | 39.1% |
Family Income by Famaliy Size in Kemp Mill
5-person families (373 | 10.4%) account for the highest median family income in Kemp Mill with $250,001 per family, while 2-person families (1,354 | 37.9%) have the highest median income of $65,334 per family member.
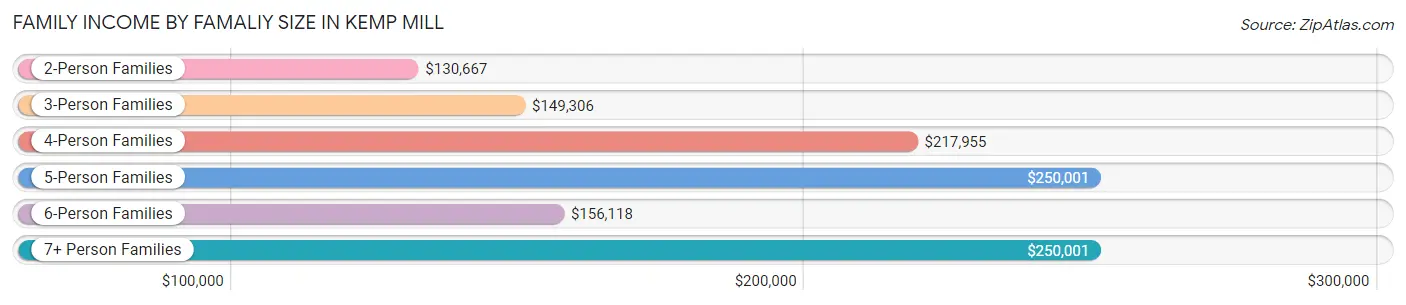
| Income Bracket | # Families | Median Income |
| 2-Person Families | 1,354 (37.9%) | $130,667 |
| 3-Person Families | 701 (19.6%) | $149,306 |
| 4-Person Families | 914 (25.6%) | $217,955 |
| 5-Person Families | 373 (10.4%) | $250,001 |
| 6-Person Families | 153 (4.3%) | $156,118 |
| 7+ Person Families | 79 (2.2%) | $250,001 |
| Total | 3,574 (100.0%) | $168,594 |
Family Income by Number of Earners in Kemp Mill
The median family income in Kemp Mill is $168,594, with families comprising 3+ earners (671) having the highest median family income of $242,356, while families with no earners (327) have the lowest median family income of $72,386, accounting for 18.8% and 9.1% of families, respectively.
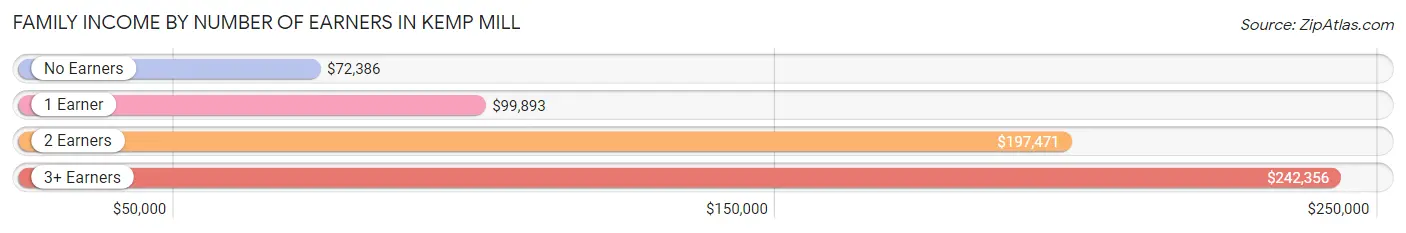
| Number of Earners | # Families | Median Income |
| No Earners | 327 (9.1%) | $72,386 |
| 1 Earner | 743 (20.8%) | $99,893 |
| 2 Earners | 1,833 (51.3%) | $197,471 |
| 3+ Earners | 671 (18.8%) | $242,356 |
| Total | 3,574 (100.0%) | $168,594 |
Household Income in Kemp Mill
Household Income Brackets in Kemp Mill
With 1,588 households falling in the category, the $200,000+ income range is the most frequent in Kemp Mill, accounting for 33.7% of all households. In contrast, only 94 households (2.0%) fall into the $25,000 to $34,999 income bracket, making it the least populous group.
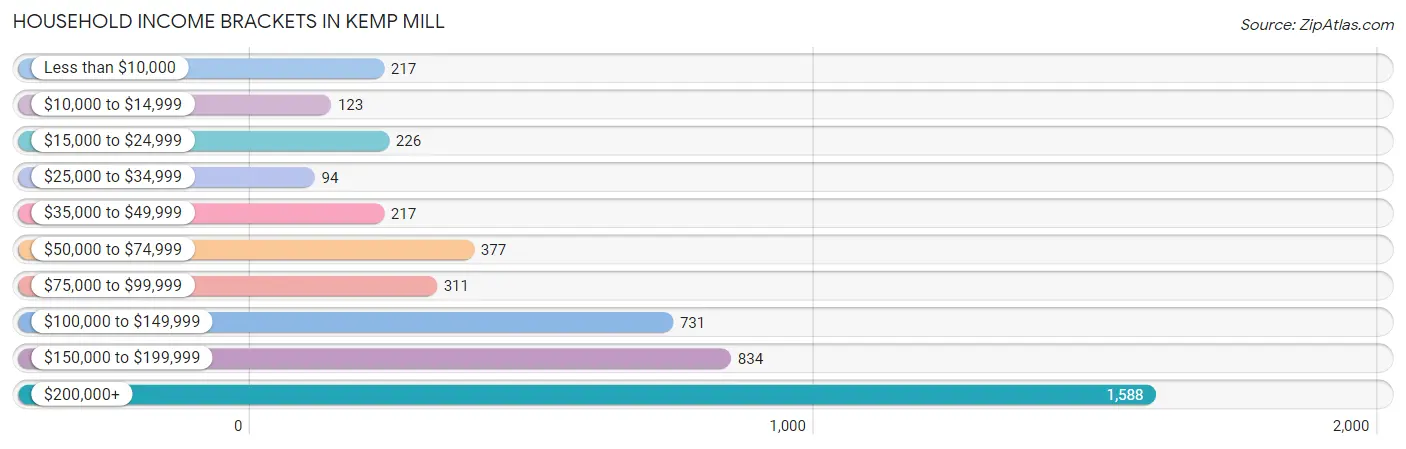
| Income Bracket | # Households | % Households |
| Less than $10,000 | 217 | 4.6% |
| $10,000 to $14,999 | 123 | 2.6% |
| $15,000 to $24,999 | 226 | 4.8% |
| $25,000 to $34,999 | 94 | 2.0% |
| $35,000 to $49,999 | 217 | 4.6% |
| $50,000 to $74,999 | 377 | 8.0% |
| $75,000 to $99,999 | 311 | 6.6% |
| $100,000 to $149,999 | 731 | 15.5% |
| $150,000 to $199,999 | 834 | 17.7% |
| $200,000+ | 1,588 | 33.7% |
Household Income by Householder Age in Kemp Mill
The median household income in Kemp Mill is $151,943, with the highest median household income of $177,052 found in the 25 to 44 years age bracket for the primary householder. A total of 1,536 households (32.6%) fall into this category.
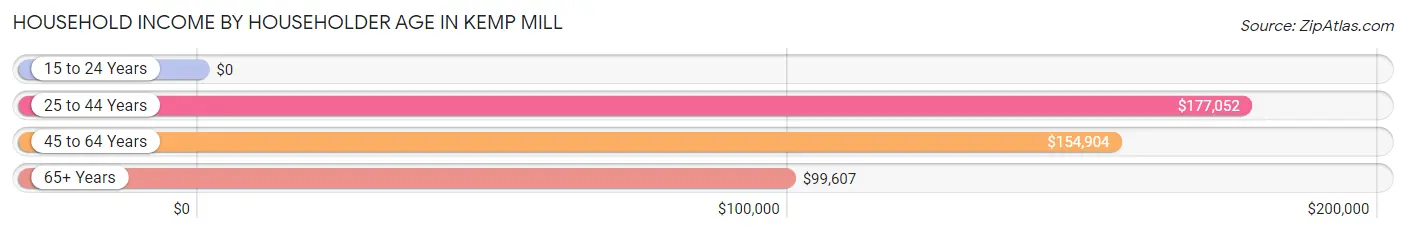
| Income Bracket | # Households | Median Income |
| 15 to 24 Years | 0 (0.0%) | $0 |
| 25 to 44 Years | 1,536 (32.6%) | $177,052 |
| 45 to 64 Years | 1,880 (39.9%) | $154,904 |
| 65+ Years | 1,297 (27.5%) | $99,607 |
| Total | 4,713 (100.0%) | $151,943 |
Poverty in Kemp Mill
Income Below Poverty by Sex and Age in Kemp Mill
With 6.9% poverty level for males and 7.0% for females among the residents of Kemp Mill, 15 year old males and under 5 year old females are the most vulnerable to poverty, with 47 males (56.6%) and 174 females (40.2%) in their respective age groups living below the poverty level.
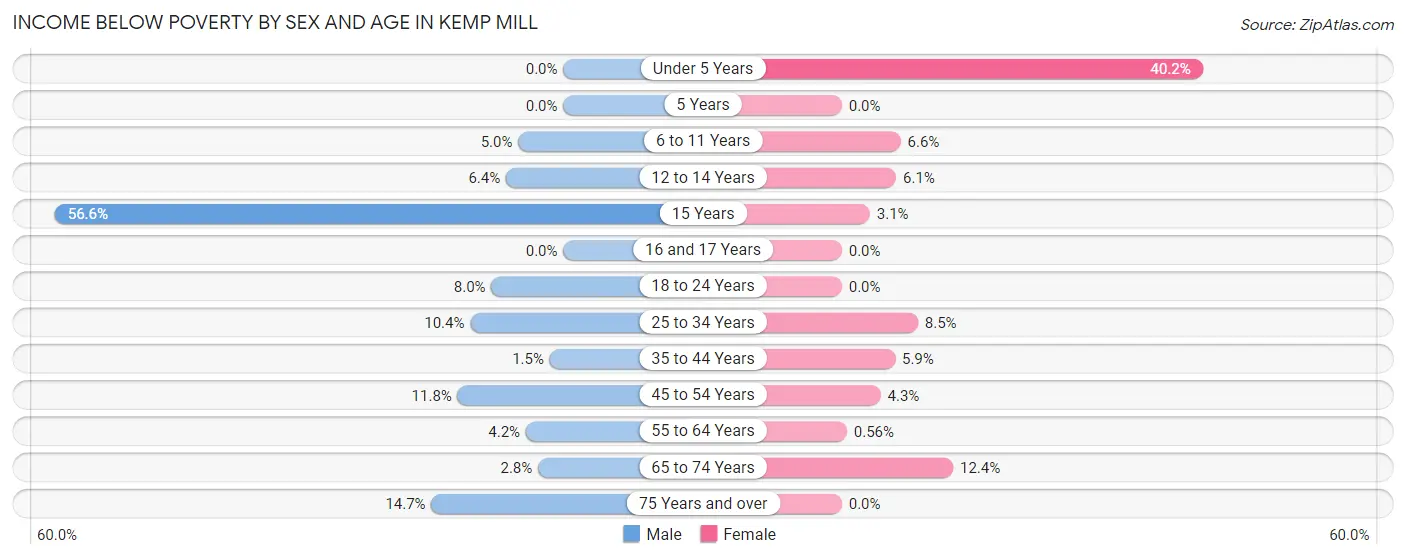
| Age Bracket | Male | Female |
| Under 5 Years | 0 (0.0%) | 174 (40.2%) |
| 5 Years | 0 (0.0%) | 0 (0.0%) |
| 6 to 11 Years | 30 (5.0%) | 42 (6.6%) |
| 12 to 14 Years | 18 (6.4%) | 29 (6.0%) |
| 15 Years | 47 (56.6%) | 3 (3.1%) |
| 16 and 17 Years | 0 (0.0%) | 0 (0.0%) |
| 18 to 24 Years | 39 (8.0%) | 0 (0.0%) |
| 25 to 34 Years | 95 (10.4%) | 61 (8.5%) |
| 35 to 44 Years | 18 (1.5%) | 56 (5.9%) |
| 45 to 54 Years | 119 (11.8%) | 31 (4.3%) |
| 55 to 64 Years | 29 (4.2%) | 6 (0.6%) |
| 65 to 74 Years | 14 (2.8%) | 88 (12.4%) |
| 75 Years and over | 67 (14.7%) | 0 (0.0%) |
| Total | 476 (6.9%) | 490 (7.0%) |
Income Above Poverty by Sex and Age in Kemp Mill
According to the poverty statistics in Kemp Mill, males aged under 5 years and females aged 5 years are the age groups that are most secure financially, with 100.0% of males and 100.0% of females in these age groups living above the poverty line.
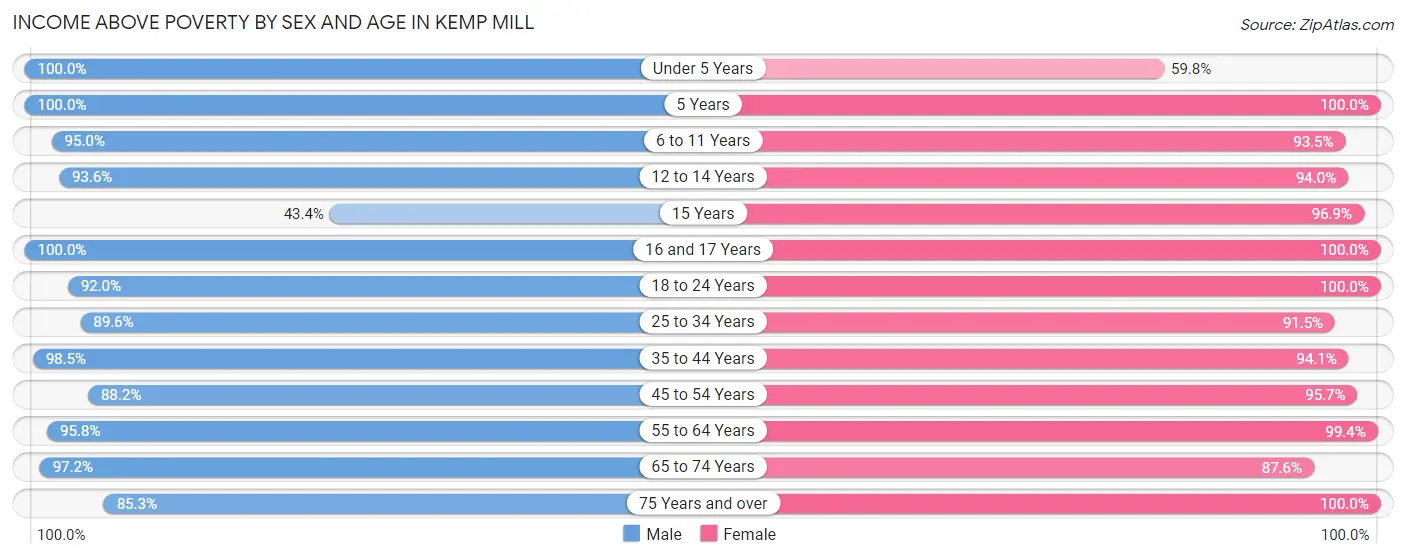
| Age Bracket | Male | Female |
| Under 5 Years | 437 (100.0%) | 259 (59.8%) |
| 5 Years | 72 (100.0%) | 45 (100.0%) |
| 6 to 11 Years | 568 (95.0%) | 599 (93.4%) |
| 12 to 14 Years | 264 (93.6%) | 450 (94.0%) |
| 15 Years | 36 (43.4%) | 93 (96.9%) |
| 16 and 17 Years | 212 (100.0%) | 123 (100.0%) |
| 18 to 24 Years | 448 (92.0%) | 534 (100.0%) |
| 25 to 34 Years | 822 (89.6%) | 659 (91.5%) |
| 35 to 44 Years | 1,171 (98.5%) | 888 (94.1%) |
| 45 to 54 Years | 892 (88.2%) | 687 (95.7%) |
| 55 to 64 Years | 667 (95.8%) | 1,056 (99.4%) |
| 65 to 74 Years | 485 (97.2%) | 622 (87.6%) |
| 75 Years and over | 389 (85.3%) | 460 (100.0%) |
| Total | 6,463 (93.1%) | 6,475 (93.0%) |
Income Below Poverty Among Married-Couple Families in Kemp Mill
The poverty statistics for married-couple families in Kemp Mill show that 4.4% or 125 of the total 2,816 families live below the poverty line. Families with 1 or 2 children have the highest poverty rate of 4.9%, comprising of 45 families. On the other hand, families with 5 or more children have the lowest poverty rate of 0.0%, which includes 0 families.
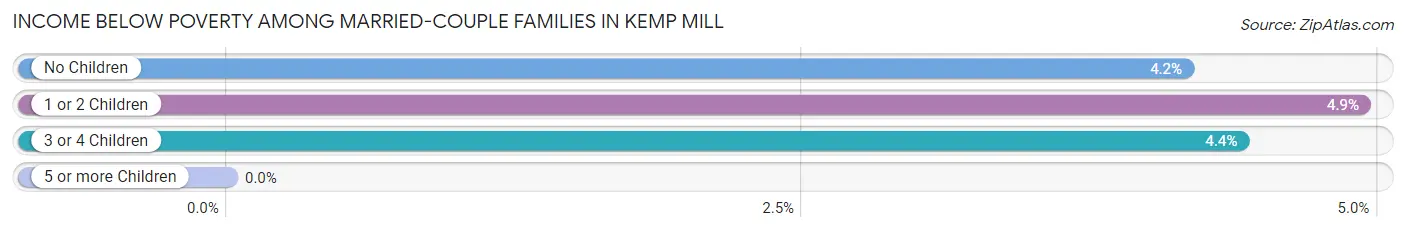
| Children | Above Poverty | Below Poverty |
| No Children | 1,427 (95.8%) | 62 (4.2%) |
| 1 or 2 Children | 867 (95.1%) | 45 (4.9%) |
| 3 or 4 Children | 391 (95.6%) | 18 (4.4%) |
| 5 or more Children | 6 (100.0%) | 0 (0.0%) |
| Total | 2,691 (95.6%) | 125 (4.4%) |
Income Below Poverty Among Single-Parent Households in Kemp Mill
According to the poverty data in Kemp Mill, 3.2% or 7 single-father households and 13.9% or 75 single-mother households are living below the poverty line. Among single-father households, those with 1 or 2 children have the highest poverty rate, with 7 households (7.7%) experiencing poverty. Likewise, among single-mother households, those with 1 or 2 children have the highest poverty rate, with 67 households (34.2%) falling below the poverty line.
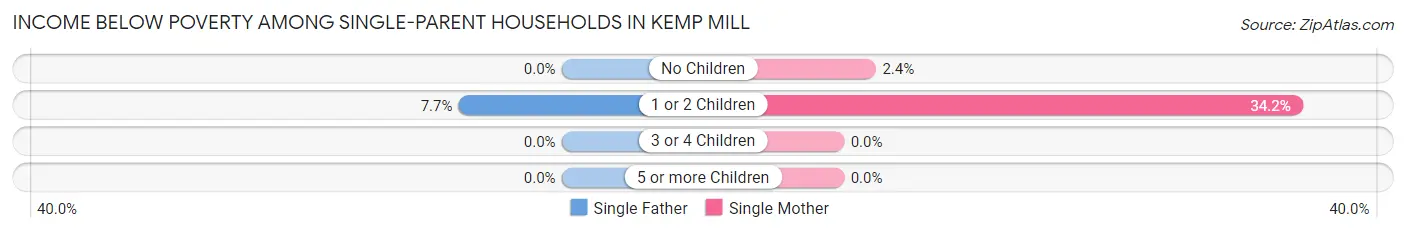
| Children | Single Father | Single Mother |
| No Children | 0 (0.0%) | 8 (2.4%) |
| 1 or 2 Children | 7 (7.7%) | 67 (34.2%) |
| 3 or 4 Children | 0 (0.0%) | 0 (0.0%) |
| 5 or more Children | 0 (0.0%) | 0 (0.0%) |
| Total | 7 (3.2%) | 75 (13.9%) |
Income Below Poverty Among Married-Couple vs Single-Parent Households in Kemp Mill
The poverty data for Kemp Mill shows that 125 of the married-couple family households (4.4%) and 82 of the single-parent households (10.8%) are living below the poverty level. Within the married-couple family households, those with 1 or 2 children have the highest poverty rate, with 45 households (4.9%) falling below the poverty line. Among the single-parent households, those with 1 or 2 children have the highest poverty rate, with 74 household (25.8%) living below poverty.
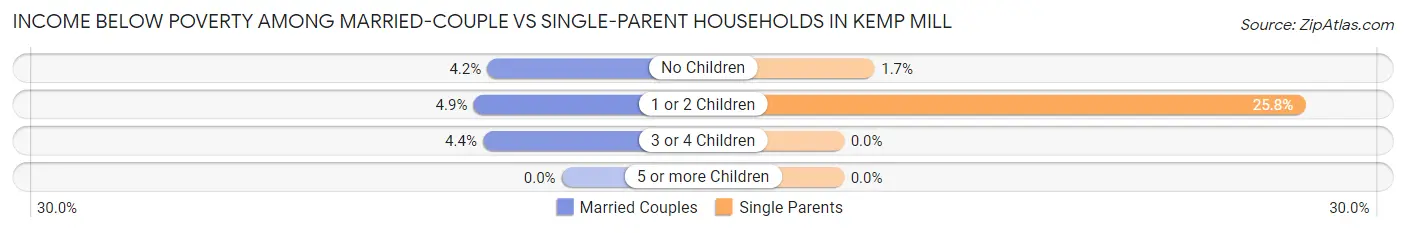
| Children | Married-Couple Families | Single-Parent Households |
| No Children | 62 (4.2%) | 8 (1.7%) |
| 1 or 2 Children | 45 (4.9%) | 74 (25.8%) |
| 3 or 4 Children | 18 (4.4%) | 0 (0.0%) |
| 5 or more Children | 0 (0.0%) | 0 (0.0%) |
| Total | 125 (4.4%) | 82 (10.8%) |
Race in Kemp Mill
The most populous races in Kemp Mill are White / Caucasian (8,392 | 59.5%), Black / African American (2,549 | 18.1%), and Hispanic or Latino (1,903 | 13.5%).
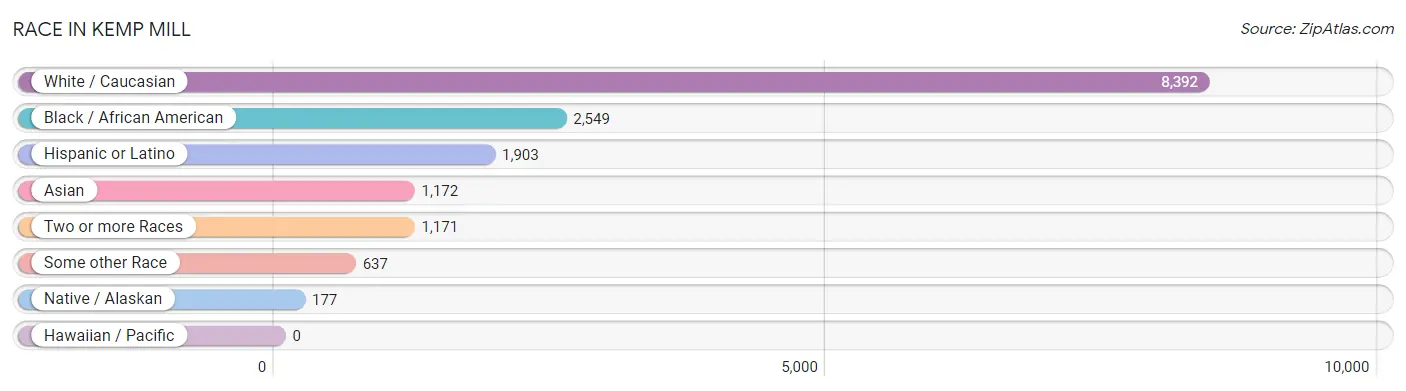
| Race | # Population | % Population |
| Asian | 1,172 | 8.3% |
| Black / African American | 2,549 | 18.1% |
| Hawaiian / Pacific | 0 | 0.0% |
| Hispanic or Latino | 1,903 | 13.5% |
| Native / Alaskan | 177 | 1.3% |
| White / Caucasian | 8,392 | 59.5% |
| Two or more Races | 1,171 | 8.3% |
| Some other Race | 637 | 4.5% |
| Total | 14,098 | 100.0% |
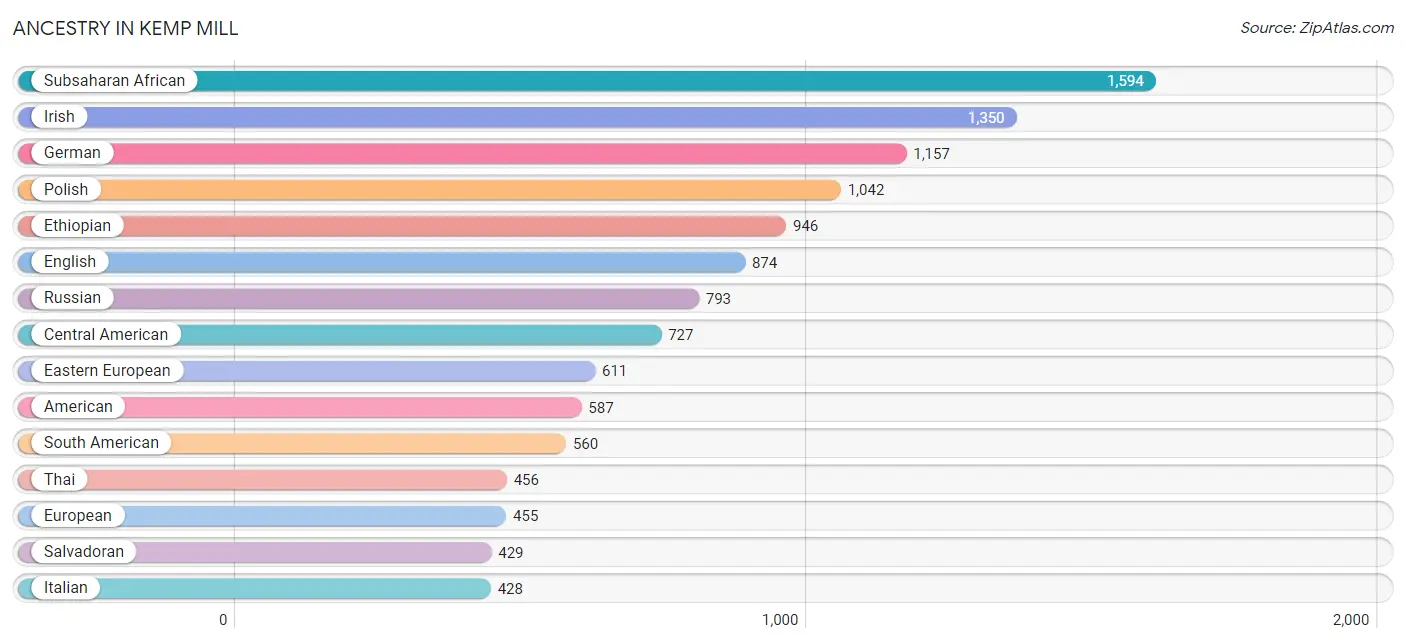
Ancestry in Kemp Mill
The most populous ancestries reported in Kemp Mill are Subsaharan African (1,594 | 11.3%), Irish (1,350 | 9.6%), German (1,157 | 8.2%), Polish (1,042 | 7.4%), and Ethiopian (946 | 6.7%), together accounting for 43.2% of all Kemp Mill residents.
| Ancestry | # Population | % Population |
| African | 291 | 2.1% |
| American | 587 | 4.2% |
| Arab | 418 | 3.0% |
| Argentinean | 20 | 0.1% |
| Austrian | 174 | 1.2% |
| Belgian | 2 | 0.0% |
| Bhutanese | 222 | 1.6% |
| Blackfeet | 5 | 0.0% |
| Bolivian | 201 | 1.4% |
| British | 183 | 1.3% |
| Burmese | 69 | 0.5% |
| Cape Verdean | 8 | 0.1% |
| Central American | 727 | 5.2% |
| Central American Indian | 22 | 0.2% |
| Cherokee | 83 | 0.6% |
| Chilean | 14 | 0.1% |
| Colombian | 64 | 0.4% |
| Croatian | 11 | 0.1% |
| Cuban | 4 | 0.0% |
| Czechoslovakian | 17 | 0.1% |
| Danish | 32 | 0.2% |
| Dominican | 191 | 1.3% |
| Dutch | 125 | 0.9% |
| Eastern European | 611 | 4.3% |
| Ecuadorian | 52 | 0.4% |
| Egyptian | 45 | 0.3% |
| English | 874 | 6.2% |
| Ethiopian | 946 | 6.7% |
| European | 455 | 3.2% |
| Filipino | 11 | 0.1% |
| Finnish | 8 | 0.1% |
| French | 169 | 1.2% |
| French Canadian | 93 | 0.7% |
| German | 1,157 | 8.2% |
| Ghanaian | 66 | 0.5% |
| Greek | 28 | 0.2% |
| Guatemalan | 298 | 2.1% |
| Haitian | 20 | 0.1% |
| Hungarian | 91 | 0.6% |
| Indian (Asian) | 169 | 1.2% |
| Iranian | 68 | 0.5% |
| Iraqi | 6 | 0.0% |
| Irish | 1,350 | 9.6% |
| Israeli | 86 | 0.6% |
| Italian | 428 | 3.0% |
| Jamaican | 95 | 0.7% |
| Japanese | 12 | 0.1% |
| Kenyan | 10 | 0.1% |
| Korean | 187 | 1.3% |
| Latvian | 53 | 0.4% |
| Lebanese | 47 | 0.3% |
| Liberian | 1 | 0.0% |
| Lithuanian | 71 | 0.5% |
| Maltese | 6 | 0.0% |
| Mexican | 126 | 0.9% |
| Moroccan | 20 | 0.1% |
| Norwegian | 59 | 0.4% |
| Pakistani | 125 | 0.9% |
| Paraguayan | 141 | 1.0% |
| Peruvian | 68 | 0.5% |
| Polish | 1,042 | 7.4% |
| Portuguese | 48 | 0.3% |
| Puerto Rican | 138 | 1.0% |
| Romanian | 50 | 0.4% |
| Russian | 793 | 5.6% |
| Salvadoran | 429 | 3.0% |
| Scandinavian | 83 | 0.6% |
| Scotch-Irish | 93 | 0.7% |
| Scottish | 168 | 1.2% |
| Sierra Leonean | 3 | 0.0% |
| Slovak | 53 | 0.4% |
| Slovene | 11 | 0.1% |
| South American | 560 | 4.0% |
| Spaniard | 20 | 0.1% |
| Spanish | 31 | 0.2% |
| Sri Lankan | 202 | 1.4% |
| Subsaharan African | 1,594 | 11.3% |
| Swedish | 23 | 0.2% |
| Swiss | 52 | 0.4% |
| Syrian | 19 | 0.1% |
| Thai | 456 | 3.2% |
| Turkish | 24 | 0.2% |
| Ukrainian | 63 | 0.4% |
| Vietnamese | 5 | 0.0% |
| Welsh | 21 | 0.2% |
| West Indian | 4 | 0.0% | View All 86 Rows |
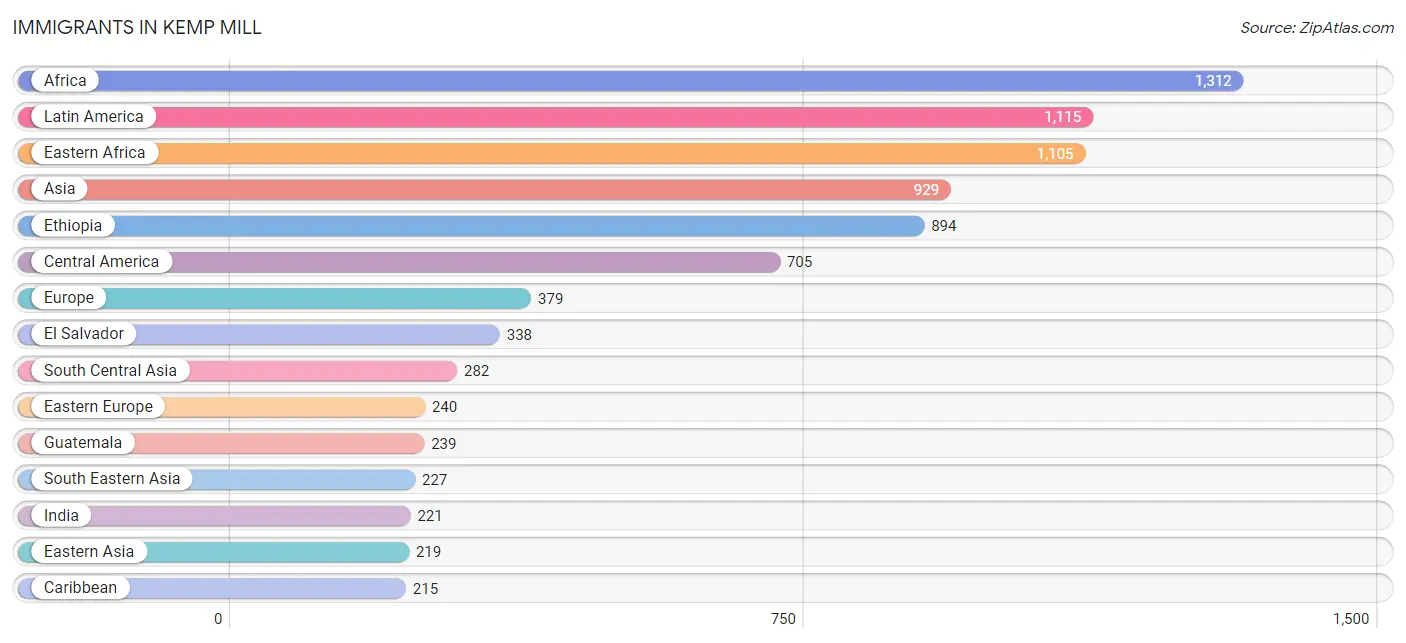
Immigrants in Kemp Mill
The most numerous immigrant groups reported in Kemp Mill came from Africa (1,312 | 9.3%), Latin America (1,115 | 7.9%), Eastern Africa (1,105 | 7.8%), Asia (929 | 6.6%), and Ethiopia (894 | 6.3%), together accounting for 38.0% of all Kemp Mill residents.
| Immigration Origin | # Population | % Population |
| Africa | 1,312 | 9.3% |
| Asia | 929 | 6.6% |
| Australia | 7 | 0.1% |
| Bangladesh | 5 | 0.0% |
| Belgium | 2 | 0.0% |
| Bolivia | 78 | 0.5% |
| Cambodia | 12 | 0.1% |
| Cameroon | 12 | 0.1% |
| Canada | 84 | 0.6% |
| Caribbean | 215 | 1.5% |
| Central America | 705 | 5.0% |
| Chile | 4 | 0.0% |
| China | 157 | 1.1% |
| Colombia | 50 | 0.4% |
| Croatia | 4 | 0.0% |
| Czechoslovakia | 17 | 0.1% |
| Dominican Republic | 161 | 1.1% |
| Eastern Africa | 1,105 | 7.8% |
| Eastern Asia | 219 | 1.5% |
| Eastern Europe | 240 | 1.7% |
| El Salvador | 338 | 2.4% |
| Eritrea | 27 | 0.2% |
| Ethiopia | 894 | 6.3% |
| Europe | 379 | 2.7% |
| France | 6 | 0.0% |
| Germany | 76 | 0.5% |
| Ghana | 66 | 0.5% |
| Greece | 12 | 0.1% |
| Guatemala | 239 | 1.7% |
| Honduras | 36 | 0.3% |
| Hungary | 9 | 0.1% |
| India | 221 | 1.6% |
| Iran | 28 | 0.2% |
| Iraq | 14 | 0.1% |
| Ireland | 4 | 0.0% |
| Israel | 149 | 1.1% |
| Italy | 14 | 0.1% |
| Jamaica | 50 | 0.4% |
| Kazakhstan | 12 | 0.1% |
| Kenya | 144 | 1.0% |
| Korea | 62 | 0.4% |
| Latin America | 1,115 | 7.9% |
| Lebanon | 30 | 0.2% |
| Liberia | 1 | 0.0% |
| Lithuania | 10 | 0.1% |
| Malaysia | 2 | 0.0% |
| Mexico | 92 | 0.6% |
| Middle Africa | 12 | 0.1% |
| Netherlands | 25 | 0.2% |
| Northern Europe | 4 | 0.0% |
| Oceania | 7 | 0.1% |
| Peru | 18 | 0.1% |
| Philippines | 58 | 0.4% |
| Poland | 25 | 0.2% |
| Romania | 27 | 0.2% |
| Russia | 101 | 0.7% |
| Sierra Leone | 3 | 0.0% |
| South Africa | 24 | 0.2% |
| South America | 195 | 1.4% |
| South Central Asia | 282 | 2.0% |
| South Eastern Asia | 227 | 1.6% |
| Southern Europe | 26 | 0.2% |
| Sri Lanka | 16 | 0.1% |
| Thailand | 91 | 0.6% |
| Trinidad and Tobago | 4 | 0.0% |
| Turkey | 8 | 0.1% |
| Ukraine | 10 | 0.1% |
| Vietnam | 64 | 0.4% |
| Western Africa | 155 | 1.1% |
| Western Asia | 201 | 1.4% |
| Western Europe | 109 | 0.8% | View All 71 Rows |
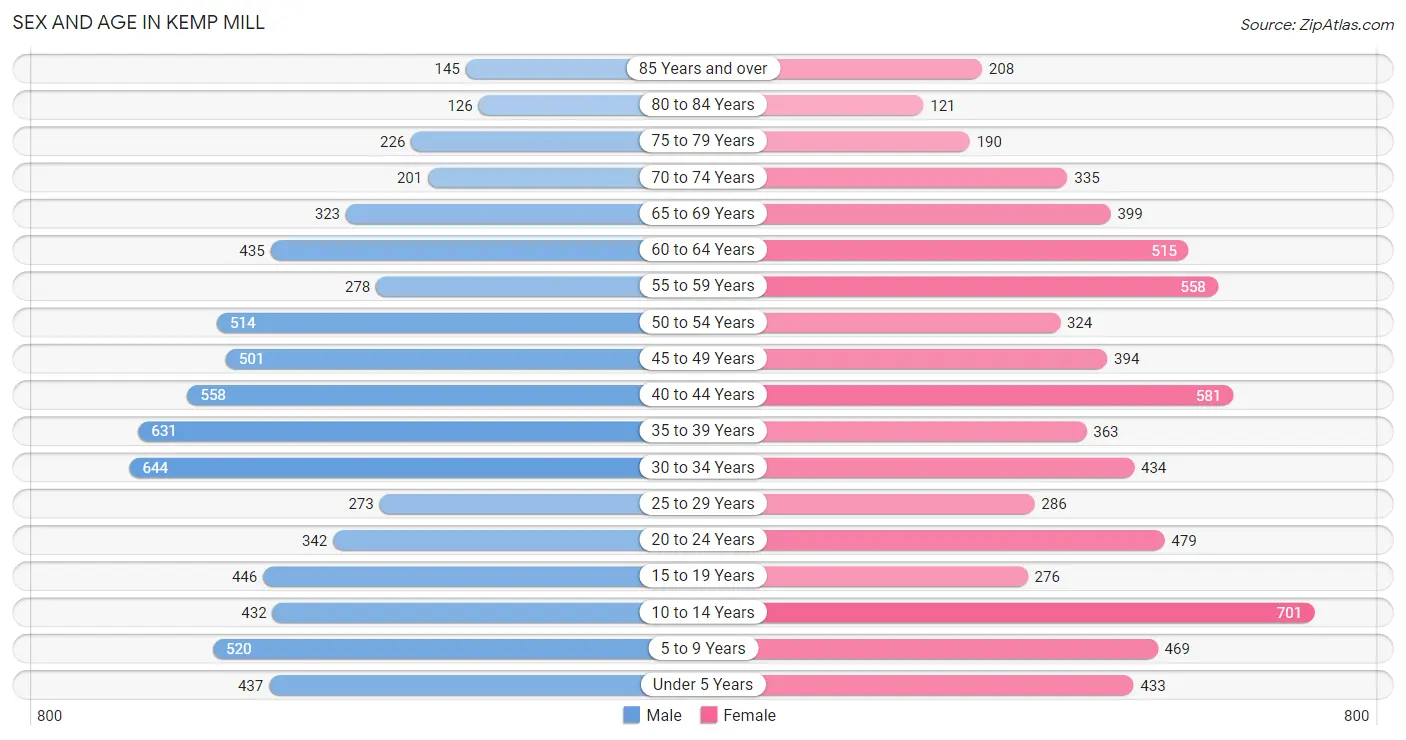
Sex and Age in Kemp Mill
Sex and Age in Kemp Mill
The most populous age groups in Kemp Mill are 30 to 34 Years (644 | 9.2%) for men and 10 to 14 Years (701 | 9.9%) for women.
| Age Bracket | Male | Female |
| Under 5 Years | 437 (6.2%) | 433 (6.1%) |
| 5 to 9 Years | 520 (7.4%) | 469 (6.6%) |
| 10 to 14 Years | 432 (6.1%) | 701 (9.9%) |
| 15 to 19 Years | 446 (6.3%) | 276 (3.9%) |
| 20 to 24 Years | 342 (4.9%) | 479 (6.8%) |
| 25 to 29 Years | 273 (3.9%) | 286 (4.1%) |
| 30 to 34 Years | 644 (9.2%) | 434 (6.1%) |
| 35 to 39 Years | 631 (9.0%) | 363 (5.1%) |
| 40 to 44 Years | 558 (7.9%) | 581 (8.2%) |
| 45 to 49 Years | 501 (7.1%) | 394 (5.6%) |
| 50 to 54 Years | 514 (7.3%) | 324 (4.6%) |
| 55 to 59 Years | 278 (4.0%) | 558 (7.9%) |
| 60 to 64 Years | 435 (6.2%) | 515 (7.3%) |
| 65 to 69 Years | 323 (4.6%) | 399 (5.7%) |
| 70 to 74 Years | 201 (2.9%) | 335 (4.7%) |
| 75 to 79 Years | 226 (3.2%) | 190 (2.7%) |
| 80 to 84 Years | 126 (1.8%) | 121 (1.7%) |
| 85 Years and over | 145 (2.1%) | 208 (2.9%) |
| Total | 7,032 (100.0%) | 7,066 (100.0%) |
Families and Households in Kemp Mill
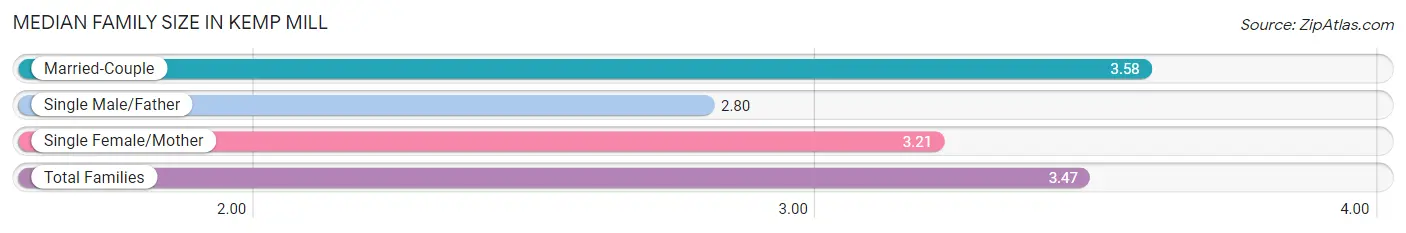
Median Family Size in Kemp Mill
The median family size in Kemp Mill is 3.47 persons per family, with married-couple families (2,816 | 78.8%) accounting for the largest median family size of 3.58 persons per family. On the other hand, single male/father families (220 | 6.2%) represent the smallest median family size with 2.80 persons per family.
| Family Type | # Families | Family Size |
| Married-Couple | 2,816 (78.8%) | 3.58 |
| Single Male/Father | 220 (6.2%) | 2.80 |
| Single Female/Mother | 538 (15.0%) | 3.21 |
| Total Families | 3,574 (100.0%) | 3.47 |
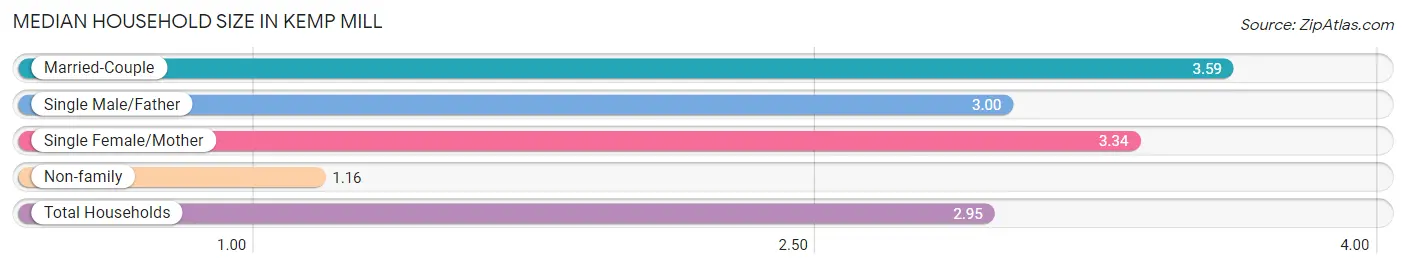
Median Household Size in Kemp Mill
The median household size in Kemp Mill is 2.95 persons per household, with married-couple households (2,816 | 59.8%) accounting for the largest median household size of 3.59 persons per household. non-family households (1,139 | 24.2%) represent the smallest median household size with 1.16 persons per household.
| Household Type | # Households | Household Size |
| Married-Couple | 2,816 (59.8%) | 3.59 |
| Single Male/Father | 220 (4.7%) | 3.00 |
| Single Female/Mother | 538 (11.4%) | 3.34 |
| Non-family | 1,139 (24.2%) | 1.16 |
| Total Households | 4,713 (100.0%) | 2.95 |
Household Size by Marriage Status in Kemp Mill
Out of a total of 4,713 households in Kemp Mill, 3,574 (75.8%) are family households, while 1,139 (24.2%) are nonfamily households. The most numerous type of family households are 2-person households, comprising 1,302, and the most common type of nonfamily households are 1-person households, comprising 1,012.
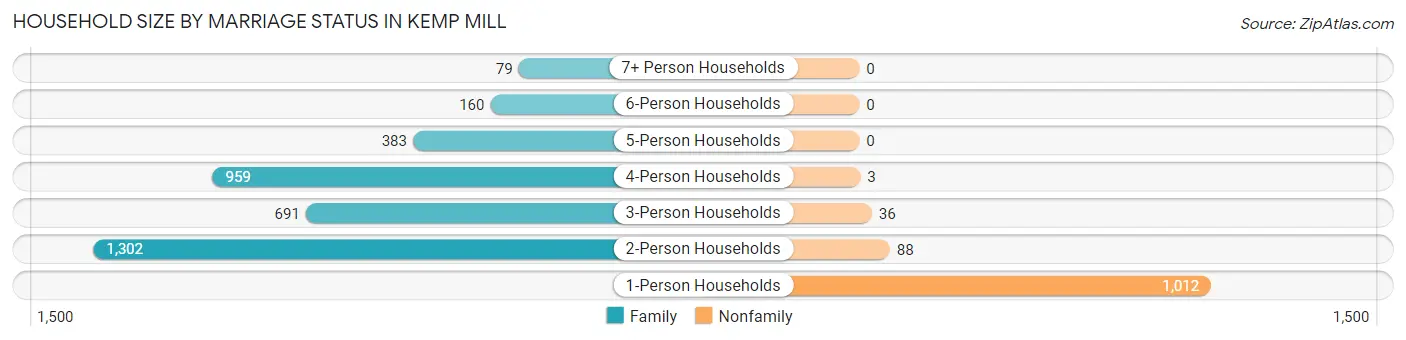
| Household Size | Family Households | Nonfamily Households |
| 1-Person Households | - | 1,012 (21.5%) |
| 2-Person Households | 1,302 (27.6%) | 88 (1.9%) |
| 3-Person Households | 691 (14.7%) | 36 (0.8%) |
| 4-Person Households | 959 (20.3%) | 3 (0.1%) |
| 5-Person Households | 383 (8.1%) | 0 (0.0%) |
| 6-Person Households | 160 (3.4%) | 0 (0.0%) |
| 7+ Person Households | 79 (1.7%) | 0 (0.0%) |
| Total | 3,574 (75.8%) | 1,139 (24.2%) |
Female Fertility in Kemp Mill
Fertility by Age in Kemp Mill
Average fertility rate in Kemp Mill is 55.0 births per 1,000 women. Women in the age bracket of 20 to 34 years have the highest fertility rate with 68.0 births per 1,000 women. Women in the age bracket of 20 to 34 years acount for 51.9% of all women with births.
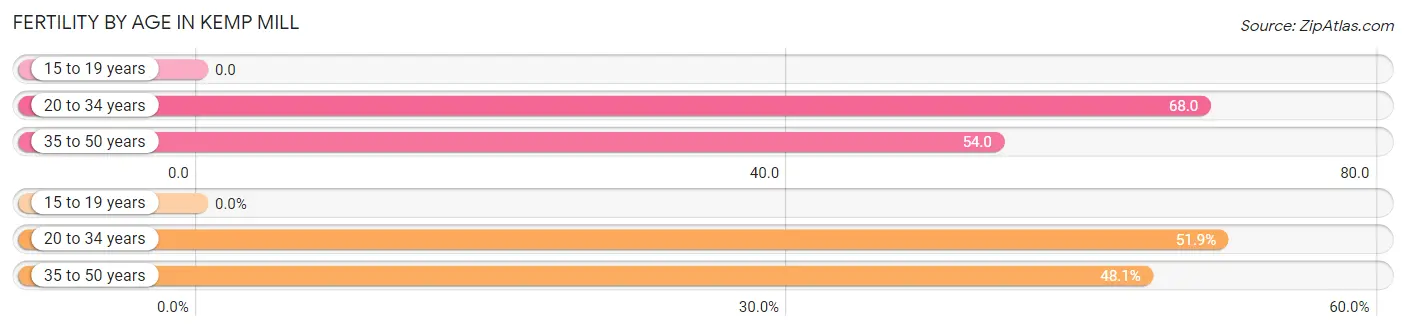
| Age Bracket | Women with Births | Births / 1,000 Women |
| 15 to 19 years | 0 (0.0%) | 0.0 |
| 20 to 34 years | 81 (51.9%) | 68.0 |
| 35 to 50 years | 75 (48.1%) | 54.0 |
| Total | 156 (100.0%) | 55.0 |
Fertility by Age by Marriage Status in Kemp Mill
75.6% of women with births (156) in Kemp Mill are married. The highest percentage of unmarried women with births falls into 35 to 50 years age bracket with 50.7% of them unmarried at the time of birth, while the lowest percentage of unmarried women with births belong to 20 to 34 years age bracket with 0.0% of them unmarried.
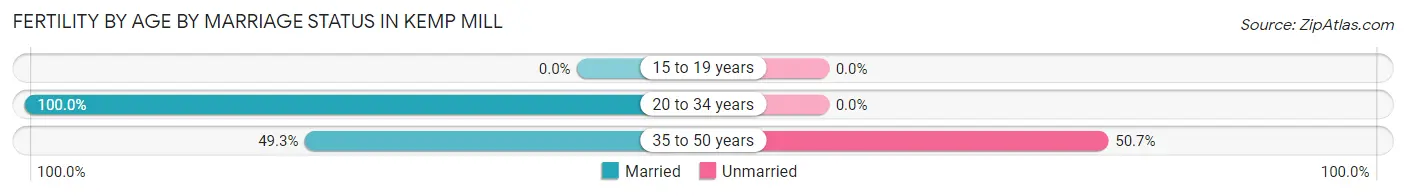
| Age Bracket | Married | Unmarried |
| 15 to 19 years | 0 (0.0%) | 0 (0.0%) |
| 20 to 34 years | 81 (100.0%) | 0 (0.0%) |
| 35 to 50 years | 37 (49.3%) | 38 (50.7%) |
| Total | 118 (75.6%) | 38 (24.4%) |
Fertility by Education in Kemp Mill
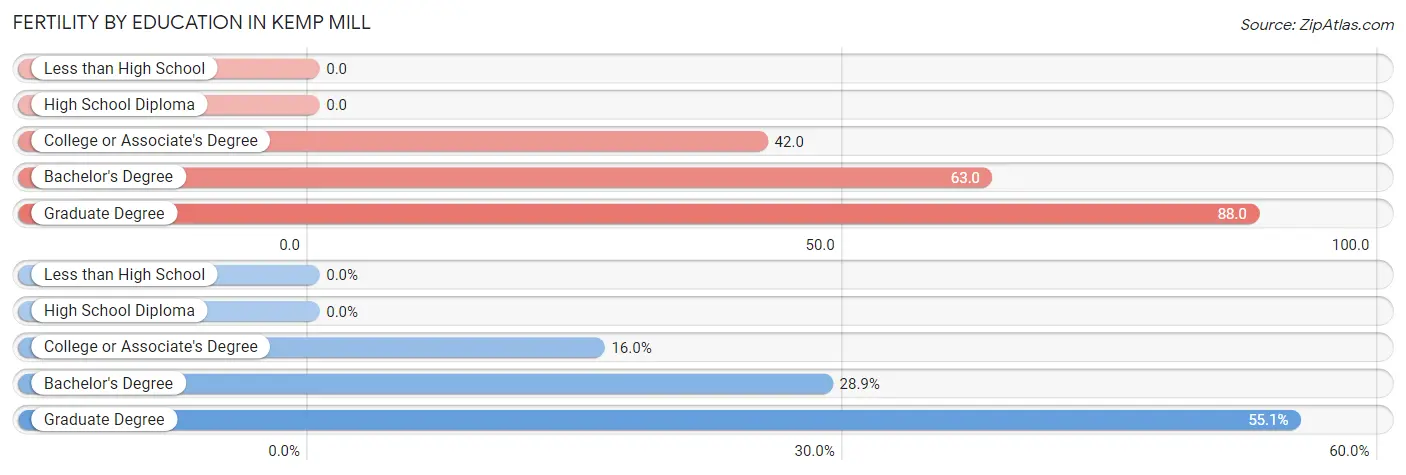
| Educational Attainment | Women with Births | Births / 1,000 Women |
| Less than High School | 0 (0.0%) | 0.0 |
| High School Diploma | 0 (0.0%) | 0.0 |
| College or Associate's Degree | 25 (16.0%) | 42.0 |
| Bachelor's Degree | 45 (28.8%) | 63.0 |
| Graduate Degree | 86 (55.1%) | 88.0 |
| Total | 156 (100.0%) | 55.0 |
Fertility by Education by Marriage Status in Kemp Mill
24.4% of women with births in Kemp Mill are unmarried. Women with the educational attainment of college or associate's degree are most likely to be married with 100.0% of them married at childbirth, while women with the educational attainment of graduate degree are least likely to be married with 44.2% of them unmarried at childbirth.
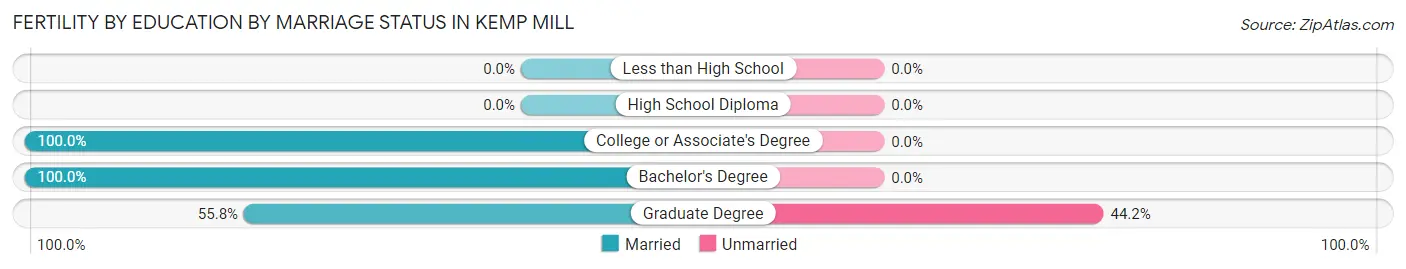
| Educational Attainment | Married | Unmarried |
| Less than High School | 0 (0.0%) | 0 (0.0%) |
| High School Diploma | 0 (0.0%) | 0 (0.0%) |
| College or Associate's Degree | 25 (100.0%) | 0 (0.0%) |
| Bachelor's Degree | 45 (100.0%) | 0 (0.0%) |
| Graduate Degree | 48 (55.8%) | 38 (44.2%) |
| Total | 118 (75.6%) | 38 (24.4%) |
Employment Characteristics in Kemp Mill
Employment by Class of Employer in Kemp Mill
Among the 7,224 employed individuals in Kemp Mill, private company employees (3,314 | 45.9%), not-for-profit organizations (1,248 | 17.3%), and federal government employees (1,021 | 14.1%) make up the most common classes of employment.
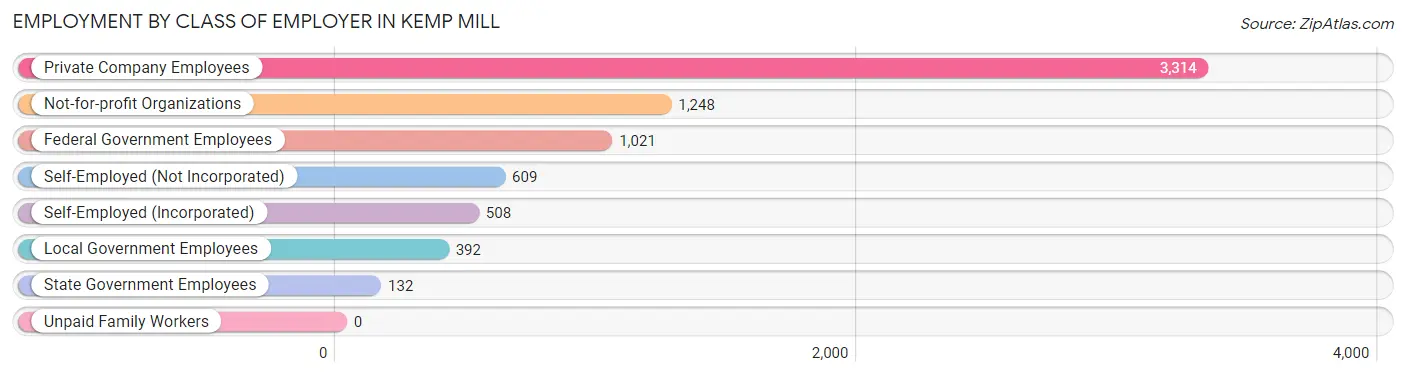
| Employer Class | # Employees | % Employees |
| Private Company Employees | 3,314 | 45.9% |
| Self-Employed (Incorporated) | 508 | 7.0% |
| Self-Employed (Not Incorporated) | 609 | 8.4% |
| Not-for-profit Organizations | 1,248 | 17.3% |
| Local Government Employees | 392 | 5.4% |
| State Government Employees | 132 | 1.8% |
| Federal Government Employees | 1,021 | 14.1% |
| Unpaid Family Workers | 0 | 0.0% |
| Total | 7,224 | 100.0% |
Employment Status by Age in Kemp Mill
According to the labor force statistics for Kemp Mill, out of the total population over 16 years of age (10,924), 69.9% or 7,636 individuals are in the labor force, with 3.9% or 298 of them unemployed. The age group with the highest labor force participation rate is 30 to 34 years, with 94.3% or 1,017 individuals in the labor force. Within the labor force, the 20 to 24 years age range has the highest percentage of unemployed individuals, with 18.1% or 84 of them being unemployed.
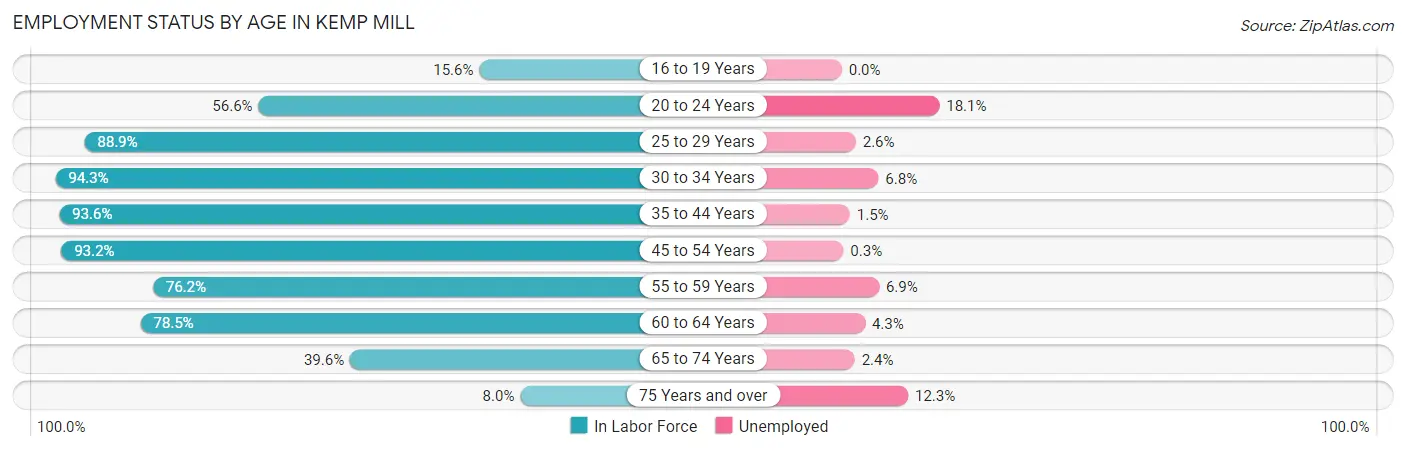
| Age Bracket | In Labor Force | Unemployed |
| 16 to 19 Years | 84 (15.6%) | 0 (0.0%) |
| 20 to 24 Years | 465 (56.6%) | 84 (18.1%) |
| 25 to 29 Years | 497 (88.9%) | 13 (2.6%) |
| 30 to 34 Years | 1,017 (94.3%) | 69 (6.8%) |
| 35 to 44 Years | 1,996 (93.6%) | 30 (1.5%) |
| 45 to 54 Years | 1,615 (93.2%) | 5 (0.3%) |
| 55 to 59 Years | 637 (76.2%) | 44 (6.9%) |
| 60 to 64 Years | 746 (78.5%) | 32 (4.3%) |
| 65 to 74 Years | 498 (39.6%) | 12 (2.4%) |
| 75 Years and over | 81 (8.0%) | 10 (12.3%) |
| Total | 7,636 (69.9%) | 298 (3.9%) |
Employment Status by Educational Attainment in Kemp Mill
According to labor force statistics for Kemp Mill, 89.3% of individuals (6,509) out of the total population between 25 and 64 years of age (7,289) are in the labor force, with 2.9% or 189 of them being unemployed. The group with the highest labor force participation rate are those with the educational attainment of bachelor's degree or higher, with 92.4% or 4,262 individuals in the labor force. Within the labor force, individuals with college / associate degree education have the highest percentage of unemployment, with 5.8% or 80 of them being unemployed.
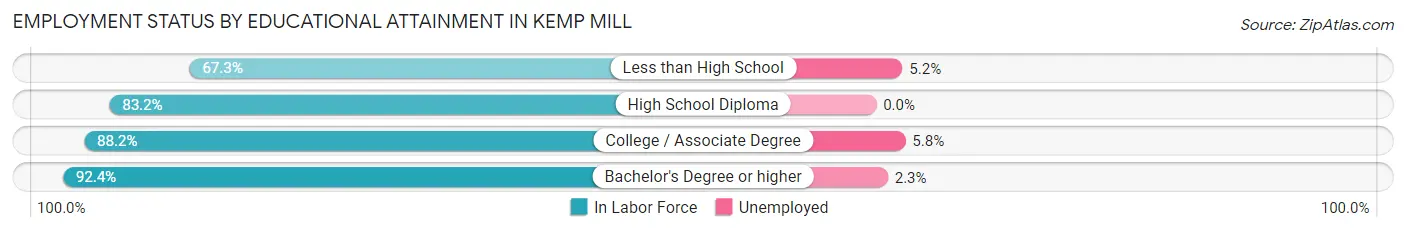
| Educational Attainment | In Labor Force | Unemployed |
| Less than High School | 249 (67.3%) | 19 (5.2%) |
| High School Diploma | 623 (83.2%) | 0 (0.0%) |
| College / Associate Degree | 1,373 (88.2%) | 90 (5.8%) |
| Bachelor's Degree or higher | 4,262 (92.4%) | 106 (2.3%) |
| Total | 6,509 (89.3%) | 211 (2.9%) |
Employment Occupations by Sex in Kemp Mill
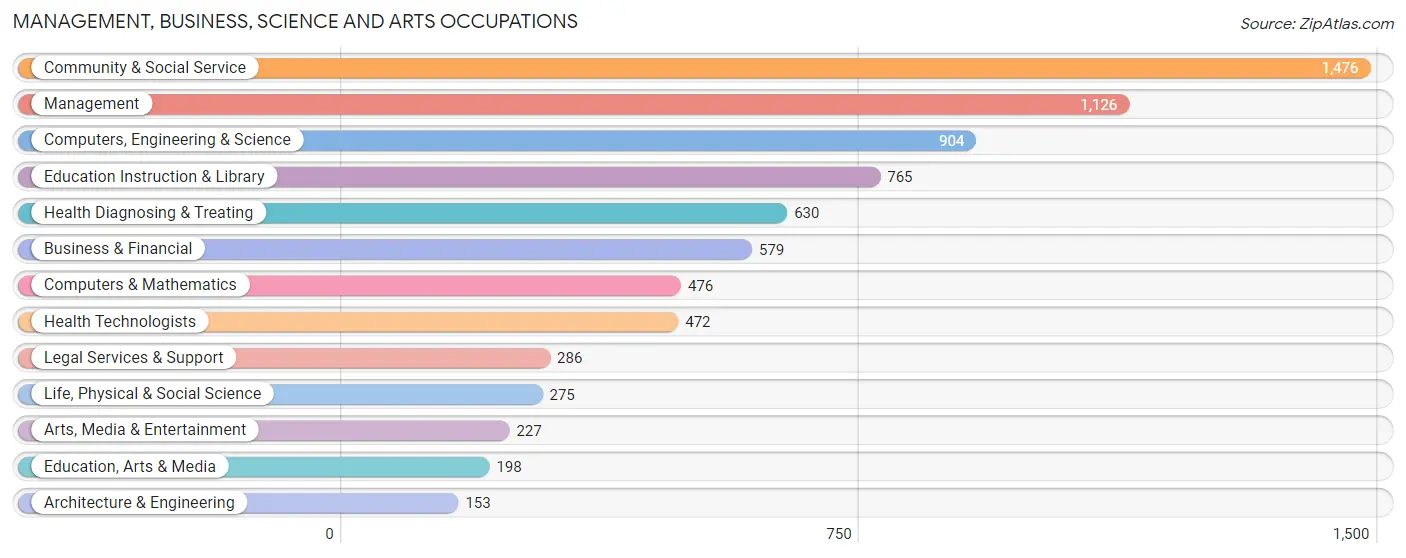
Management, Business, Science and Arts Occupations
The most common Management, Business, Science and Arts occupations in Kemp Mill are Community & Social Service (1,476 | 20.2%), Management (1,126 | 15.4%), Computers, Engineering & Science (904 | 12.4%), Education Instruction & Library (765 | 10.5%), and Health Diagnosing & Treating (630 | 8.6%).
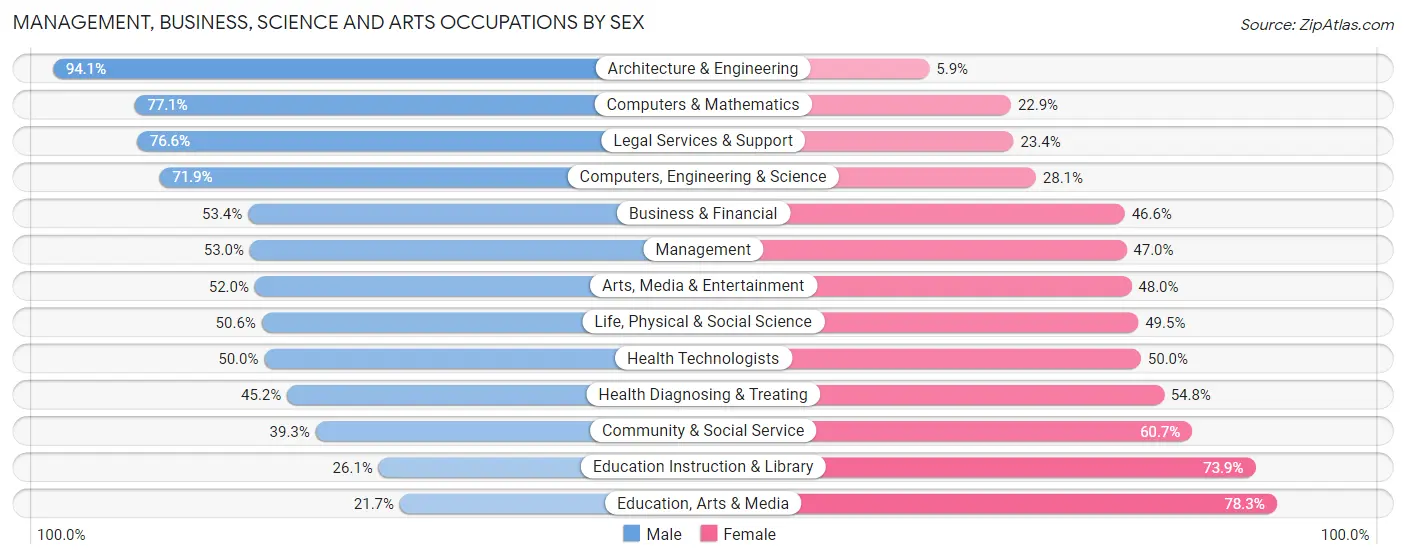
Management, Business, Science and Arts Occupations by Sex
Within the Management, Business, Science and Arts occupations in Kemp Mill, the most male-oriented occupations are Architecture & Engineering (94.1%), Computers & Mathematics (77.1%), and Legal Services & Support (76.6%), while the most female-oriented occupations are Education, Arts & Media (78.3%), Education Instruction & Library (73.9%), and Community & Social Service (60.7%).
| Occupation | Male | Female |
| Management | 597 (53.0%) | 529 (47.0%) |
| Business & Financial | 309 (53.4%) | 270 (46.6%) |
| Computers, Engineering & Science | 650 (71.9%) | 254 (28.1%) |
| Computers & Mathematics | 367 (77.1%) | 109 (22.9%) |
| Architecture & Engineering | 144 (94.1%) | 9 (5.9%) |
| Life, Physical & Social Science | 139 (50.5%) | 136 (49.4%) |
| Community & Social Service | 580 (39.3%) | 896 (60.7%) |
| Education, Arts & Media | 43 (21.7%) | 155 (78.3%) |
| Legal Services & Support | 219 (76.6%) | 67 (23.4%) |
| Education Instruction & Library | 200 (26.1%) | 565 (73.9%) |
| Arts, Media & Entertainment | 118 (52.0%) | 109 (48.0%) |
| Health Diagnosing & Treating | 285 (45.2%) | 345 (54.8%) |
| Health Technologists | 236 (50.0%) | 236 (50.0%) |
| Total (Category) | 2,421 (51.3%) | 2,294 (48.6%) |
| Total (Overall) | 3,897 (53.3%) | 3,412 (46.7%) |
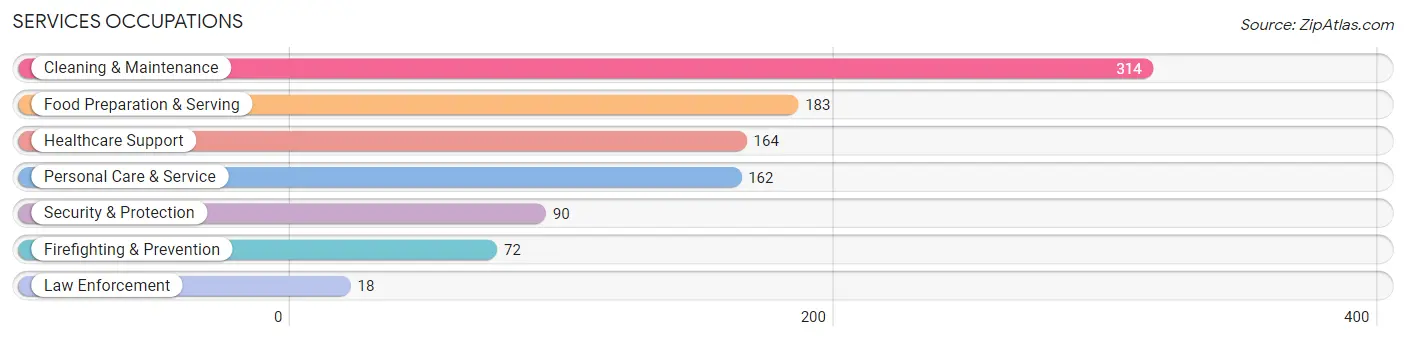
Services Occupations
The most common Services occupations in Kemp Mill are Cleaning & Maintenance (314 | 4.3%), Food Preparation & Serving (183 | 2.5%), Healthcare Support (164 | 2.2%), Personal Care & Service (162 | 2.2%), and Security & Protection (90 | 1.2%).
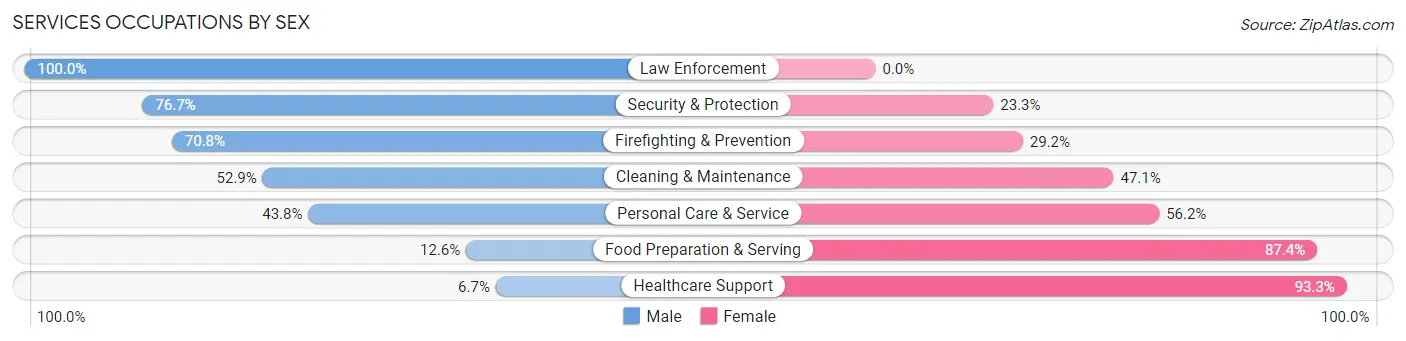
Services Occupations by Sex
Within the Services occupations in Kemp Mill, the most male-oriented occupations are Law Enforcement (100.0%), Security & Protection (76.7%), and Firefighting & Prevention (70.8%), while the most female-oriented occupations are Healthcare Support (93.3%), Food Preparation & Serving (87.4%), and Personal Care & Service (56.2%).
| Occupation | Male | Female |
| Healthcare Support | 11 (6.7%) | 153 (93.3%) |
| Security & Protection | 69 (76.7%) | 21 (23.3%) |
| Firefighting & Prevention | 51 (70.8%) | 21 (29.2%) |
| Law Enforcement | 18 (100.0%) | 0 (0.0%) |
| Food Preparation & Serving | 23 (12.6%) | 160 (87.4%) |
| Cleaning & Maintenance | 166 (52.9%) | 148 (47.1%) |
| Personal Care & Service | 71 (43.8%) | 91 (56.2%) |
| Total (Category) | 340 (37.2%) | 573 (62.8%) |
| Total (Overall) | 3,897 (53.3%) | 3,412 (46.7%) |
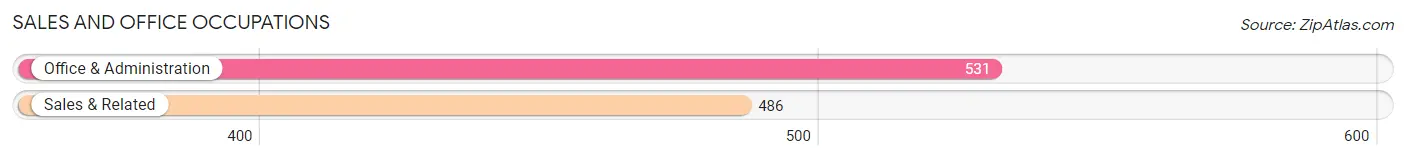
Sales and Office Occupations
The most common Sales and Office occupations in Kemp Mill are Office & Administration (531 | 7.3%), and Sales & Related (486 | 6.7%).
Sales and Office Occupations by Sex
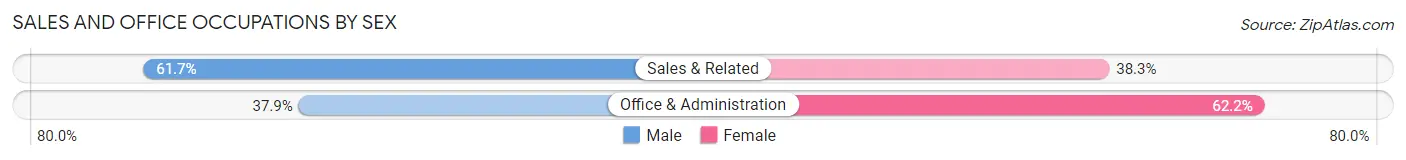
| Occupation | Male | Female |
| Sales & Related | 300 (61.7%) | 186 (38.3%) |
| Office & Administration | 201 (37.9%) | 330 (62.2%) |
| Total (Category) | 501 (49.3%) | 516 (50.7%) |
| Total (Overall) | 3,897 (53.3%) | 3,412 (46.7%) |
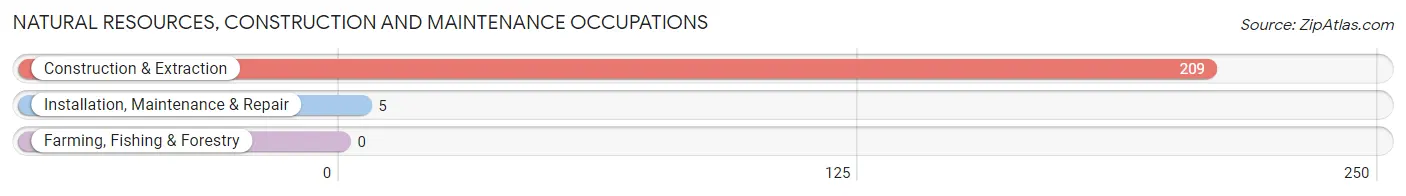
Natural Resources, Construction and Maintenance Occupations
The most common Natural Resources, Construction and Maintenance occupations in Kemp Mill are Construction & Extraction (209 | 2.9%), and Installation, Maintenance & Repair (5 | 0.1%).
Natural Resources, Construction and Maintenance Occupations by Sex
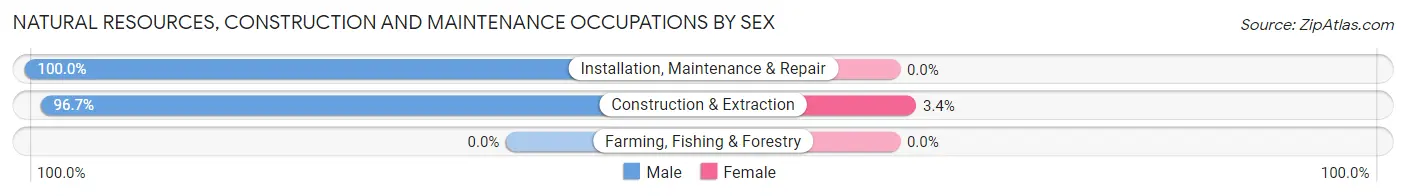
| Occupation | Male | Female |
| Farming, Fishing & Forestry | 0 (0.0%) | 0 (0.0%) |
| Construction & Extraction | 202 (96.7%) | 7 (3.4%) |
| Installation, Maintenance & Repair | 5 (100.0%) | 0 (0.0%) |
| Total (Category) | 207 (96.7%) | 7 (3.3%) |
| Total (Overall) | 3,897 (53.3%) | 3,412 (46.7%) |
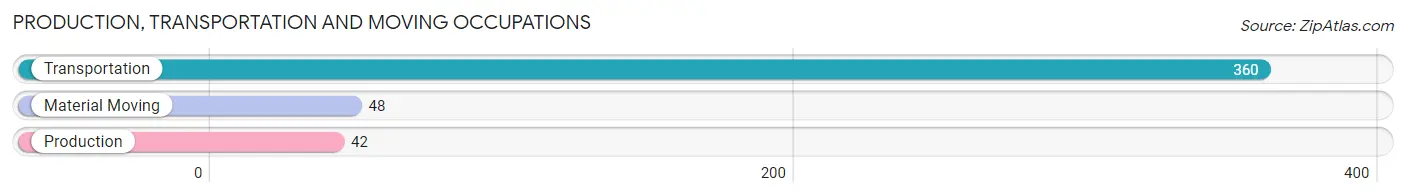
Production, Transportation and Moving Occupations
The most common Production, Transportation and Moving occupations in Kemp Mill are Transportation (360 | 4.9%), Material Moving (48 | 0.7%), and Production (42 | 0.6%).
Production, Transportation and Moving Occupations by Sex
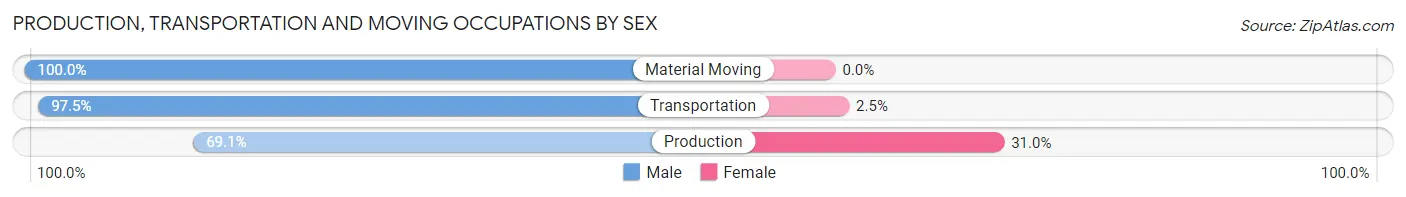
| Occupation | Male | Female |
| Production | 29 (69.1%) | 13 (30.9%) |
| Transportation | 351 (97.5%) | 9 (2.5%) |
| Material Moving | 48 (100.0%) | 0 (0.0%) |
| Total (Category) | 428 (95.1%) | 22 (4.9%) |
| Total (Overall) | 3,897 (53.3%) | 3,412 (46.7%) |
Employment Industries by Sex in Kemp Mill
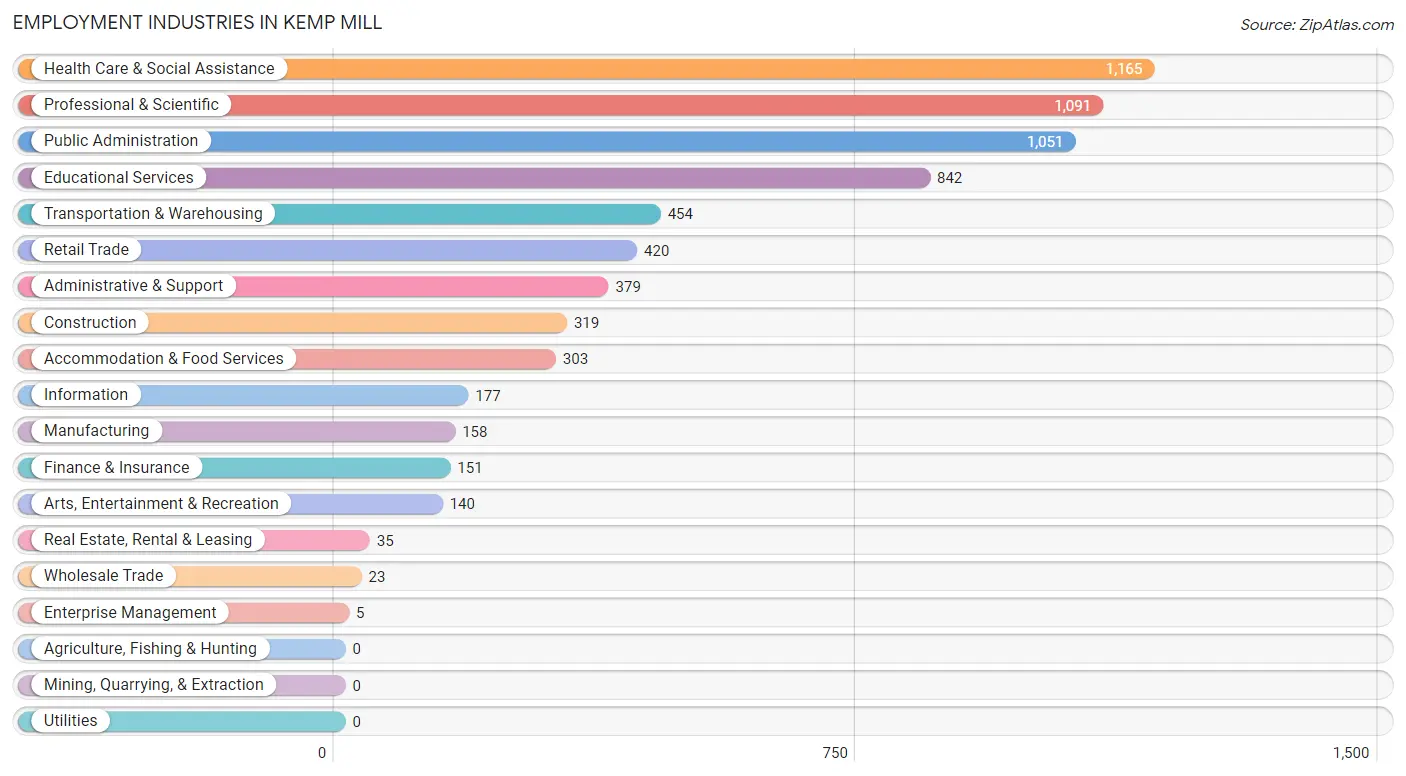
Employment Industries in Kemp Mill
The major employment industries in Kemp Mill include Health Care & Social Assistance (1,165 | 15.9%), Professional & Scientific (1,091 | 14.9%), Public Administration (1,051 | 14.4%), Educational Services (842 | 11.5%), and Transportation & Warehousing (454 | 6.2%).
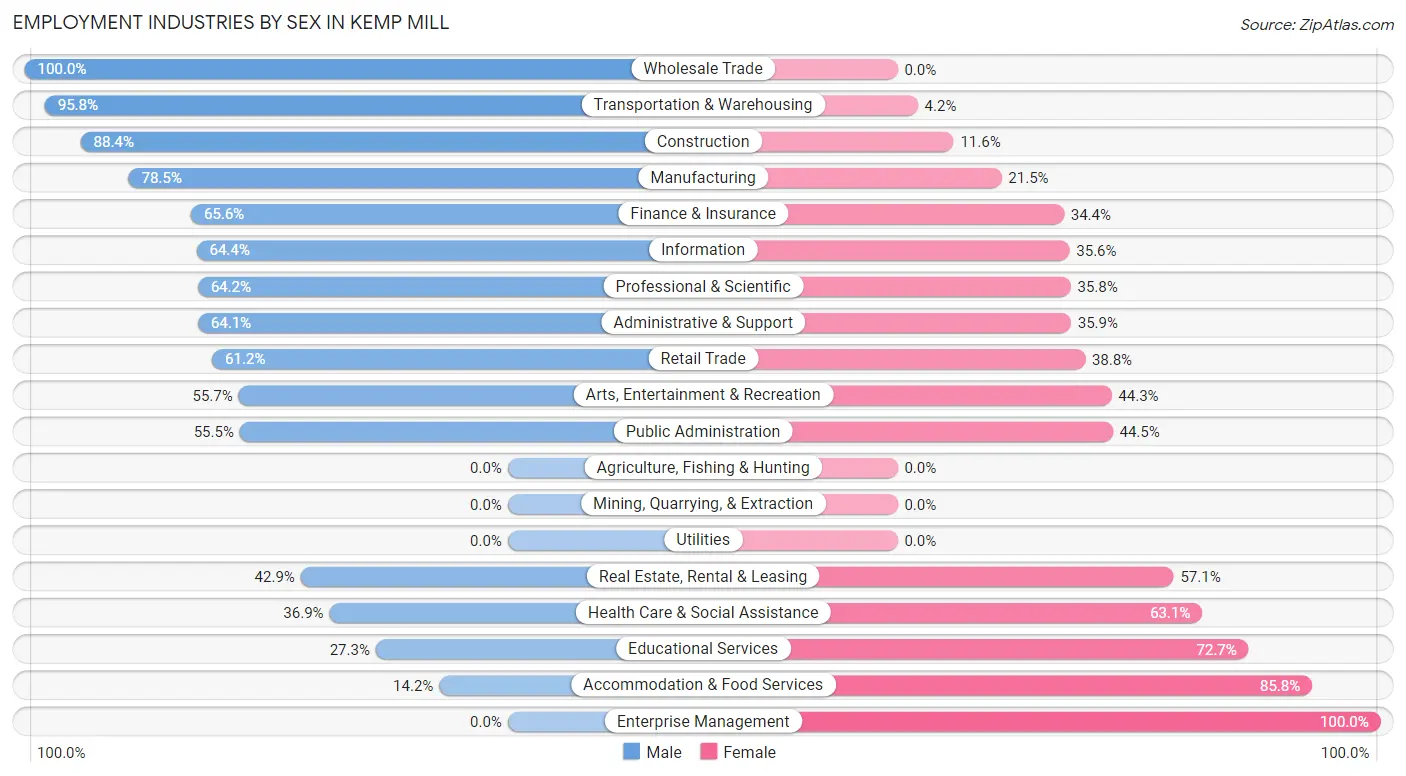
Employment Industries by Sex in Kemp Mill
The Kemp Mill industries that see more men than women are Wholesale Trade (100.0%), Transportation & Warehousing (95.8%), and Construction (88.4%), whereas the industries that tend to have a higher number of women are Enterprise Management (100.0%), Accommodation & Food Services (85.8%), and Educational Services (72.7%).
| Industry | Male | Female |
| Agriculture, Fishing & Hunting | 0 (0.0%) | 0 (0.0%) |
| Mining, Quarrying, & Extraction | 0 (0.0%) | 0 (0.0%) |
| Construction | 282 (88.4%) | 37 (11.6%) |
| Manufacturing | 124 (78.5%) | 34 (21.5%) |
| Wholesale Trade | 23 (100.0%) | 0 (0.0%) |
| Retail Trade | 257 (61.2%) | 163 (38.8%) |
| Transportation & Warehousing | 435 (95.8%) | 19 (4.2%) |
| Utilities | 0 (0.0%) | 0 (0.0%) |
| Information | 114 (64.4%) | 63 (35.6%) |
| Finance & Insurance | 99 (65.6%) | 52 (34.4%) |
| Real Estate, Rental & Leasing | 15 (42.9%) | 20 (57.1%) |
| Professional & Scientific | 700 (64.2%) | 391 (35.8%) |
| Enterprise Management | 0 (0.0%) | 5 (100.0%) |
| Administrative & Support | 243 (64.1%) | 136 (35.9%) |
| Educational Services | 230 (27.3%) | 612 (72.7%) |
| Health Care & Social Assistance | 430 (36.9%) | 735 (63.1%) |
| Arts, Entertainment & Recreation | 78 (55.7%) | 62 (44.3%) |
| Accommodation & Food Services | 43 (14.2%) | 260 (85.8%) |
| Public Administration | 583 (55.5%) | 468 (44.5%) |
| Total | 3,897 (53.3%) | 3,412 (46.7%) |
Education in Kemp Mill
School Enrollment in Kemp Mill
The most common levels of schooling among the 4,447 students in Kemp Mill are elementary school (1,013 | 22.8%), high school (867 | 19.5%), and middle school (835 | 18.8%).
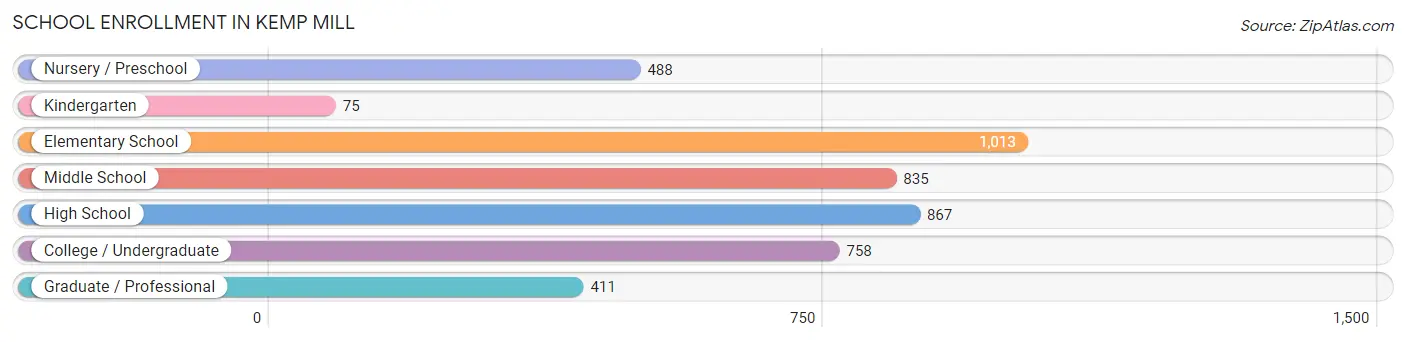
| School Level | # Students | % Students |
| Nursery / Preschool | 488 | 11.0% |
| Kindergarten | 75 | 1.7% |
| Elementary School | 1,013 | 22.8% |
| Middle School | 835 | 18.8% |
| High School | 867 | 19.5% |
| College / Undergraduate | 758 | 17.1% |
| Graduate / Professional | 411 | 9.2% |
| Total | 4,447 | 100.0% |
School Enrollment by Age by Funding Source in Kemp Mill
Out of a total of 4,447 students who are enrolled in schools in Kemp Mill, 2,455 (55.2%) attend a private institution, while the remaining 1,992 (44.8%) are enrolled in public schools. The age group of 3 to 4 year olds has the highest likelihood of being enrolled in private schools, with 368 (88.0% in the age bracket) enrolled. Conversely, the age group of 20 to 24 year olds has the lowest likelihood of being enrolled in a private school, with 525 (82.7% in the age bracket) attending a public institution.
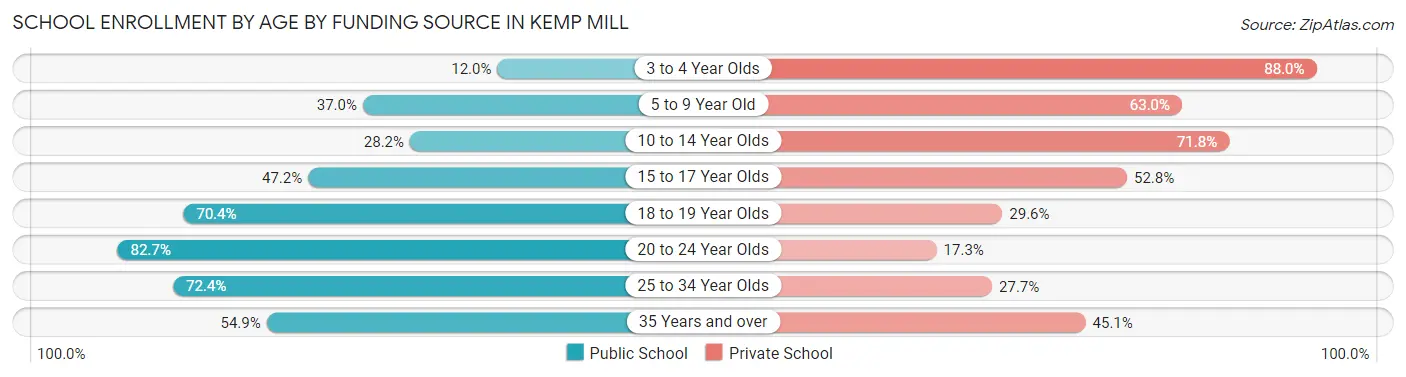
| Age Bracket | Public School | Private School |
| 3 to 4 Year Olds | 50 (12.0%) | 368 (88.0%) |
| 5 to 9 Year Old | 362 (37.0%) | 616 (63.0%) |
| 10 to 14 Year Olds | 320 (28.2%) | 813 (71.8%) |
| 15 to 17 Year Olds | 245 (47.2%) | 274 (52.8%) |
| 18 to 19 Year Olds | 143 (70.4%) | 60 (29.6%) |
| 20 to 24 Year Olds | 525 (82.7%) | 110 (17.3%) |
| 25 to 34 Year Olds | 157 (72.4%) | 60 (27.7%) |
| 35 Years and over | 189 (54.9%) | 155 (45.1%) |
| Total | 1,992 (44.8%) | 2,455 (55.2%) |
Educational Attainment by Field of Study in Kemp Mill
Social sciences (1,133 | 17.8%), business (909 | 14.3%), bio, nature & agricultural (556 | 8.7%), literature & languages (505 | 8.0%), and liberal arts & history (439 | 6.9%) are the most common fields of study among 6,356 individuals in Kemp Mill who have obtained a bachelor's degree or higher.
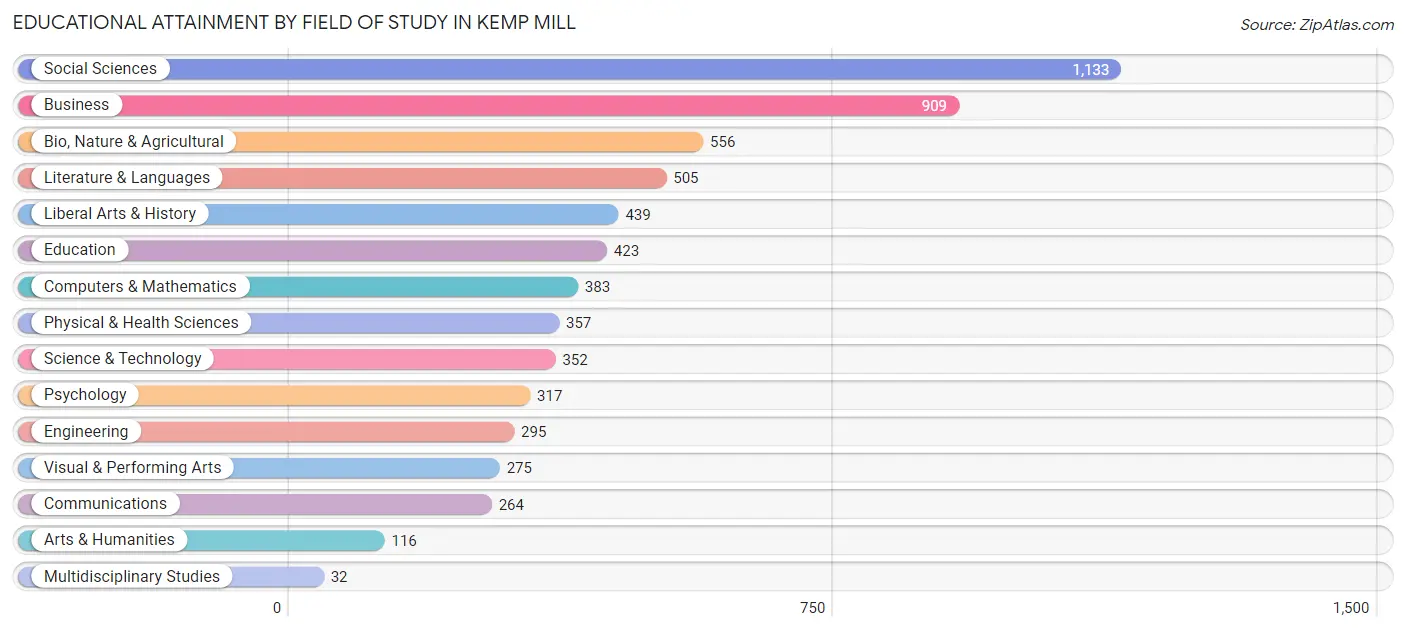
| Field of Study | # Graduates | % Graduates |
| Computers & Mathematics | 383 | 6.0% |
| Bio, Nature & Agricultural | 556 | 8.7% |
| Physical & Health Sciences | 357 | 5.6% |
| Psychology | 317 | 5.0% |
| Social Sciences | 1,133 | 17.8% |
| Engineering | 295 | 4.6% |
| Multidisciplinary Studies | 32 | 0.5% |
| Science & Technology | 352 | 5.5% |
| Business | 909 | 14.3% |
| Education | 423 | 6.7% |
| Literature & Languages | 505 | 8.0% |
| Liberal Arts & History | 439 | 6.9% |
| Visual & Performing Arts | 275 | 4.3% |
| Communications | 264 | 4.2% |
| Arts & Humanities | 116 | 1.8% |
| Total | 6,356 | 100.0% |
Transportation & Commute in Kemp Mill
Vehicle Availability by Sex in Kemp Mill
The most prevalent vehicle ownership categories in Kemp Mill are males with 2 vehicles (1,714, accounting for 44.0%) and females with 2 vehicles (1,532, making up 51.5%).
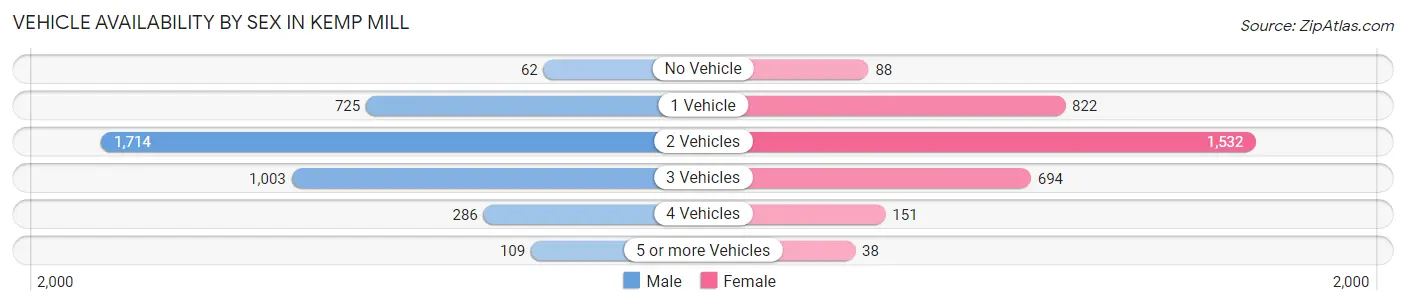
| Vehicles Available | Male | Female |
| No Vehicle | 62 (1.6%) | 88 (2.6%) |
| 1 Vehicle | 725 (18.6%) | 822 (24.7%) |
| 2 Vehicles | 1,714 (44.0%) | 1,532 (46.1%) |
| 3 Vehicles | 1,003 (25.7%) | 694 (20.9%) |
| 4 Vehicles | 286 (7.3%) | 151 (4.5%) |
| 5 or more Vehicles | 109 (2.8%) | 38 (1.1%) |
| Total | 3,899 (100.0%) | 3,325 (100.0%) |
Commute Time in Kemp Mill
The most frequently occuring commute durations in Kemp Mill are 20 to 24 minutes (899 commuters, 15.3%), 45 to 59 minutes (869 commuters, 14.8%), and 60 to 89 minutes (862 commuters, 14.7%).
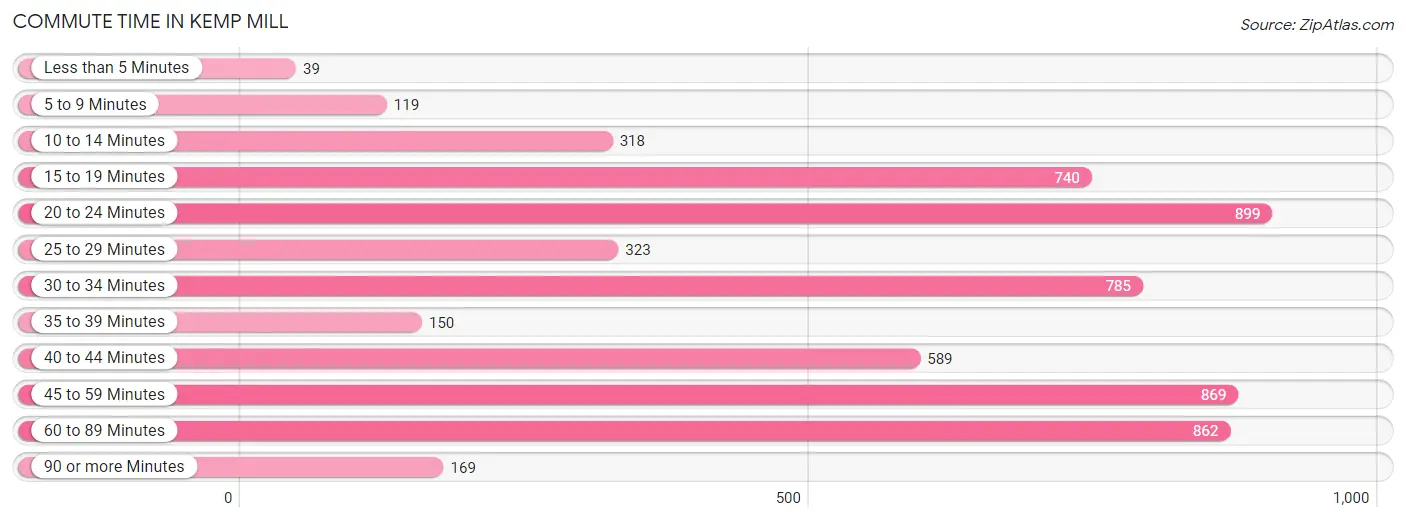
| Commute Time | # Commuters | % Commuters |
| Less than 5 Minutes | 39 | 0.7% |
| 5 to 9 Minutes | 119 | 2.0% |
| 10 to 14 Minutes | 318 | 5.4% |
| 15 to 19 Minutes | 740 | 12.6% |
| 20 to 24 Minutes | 899 | 15.3% |
| 25 to 29 Minutes | 323 | 5.5% |
| 30 to 34 Minutes | 785 | 13.4% |
| 35 to 39 Minutes | 150 | 2.6% |
| 40 to 44 Minutes | 589 | 10.1% |
| 45 to 59 Minutes | 869 | 14.8% |
| 60 to 89 Minutes | 862 | 14.7% |
| 90 or more Minutes | 169 | 2.9% |
Commute Time by Sex in Kemp Mill
The most common commute times in Kemp Mill are 45 to 59 minutes (527 commuters, 16.6%) for males and 20 to 24 minutes (536 commuters, 20.0%) for females.
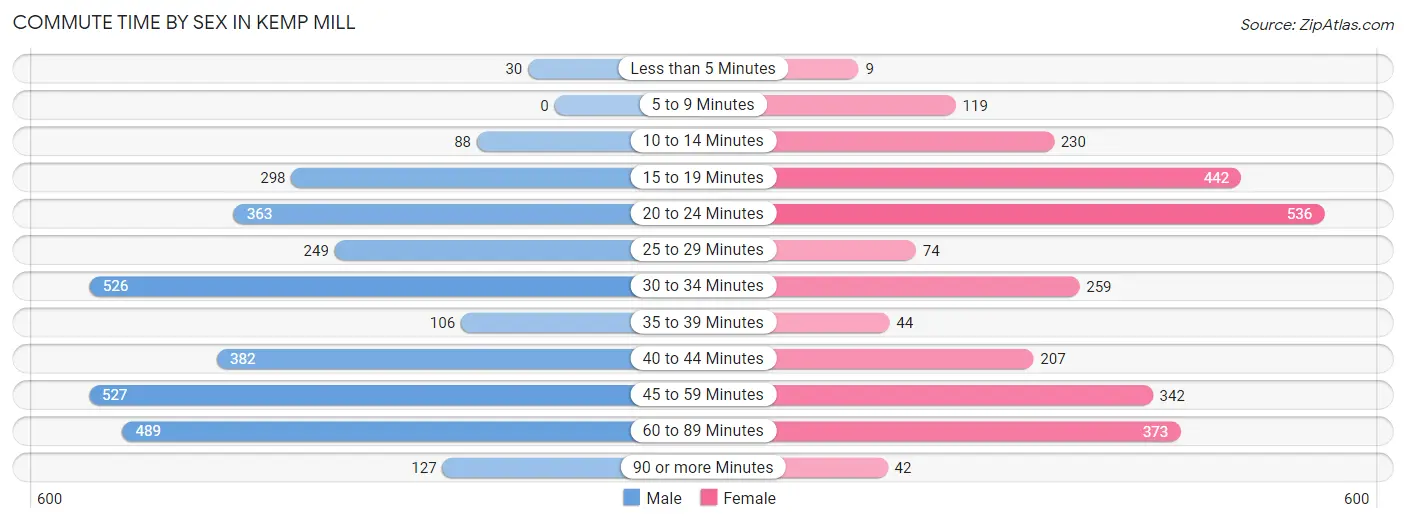
| Commute Time | Male | Female |
| Less than 5 Minutes | 30 (0.9%) | 9 (0.3%) |
| 5 to 9 Minutes | 0 (0.0%) | 119 (4.4%) |
| 10 to 14 Minutes | 88 (2.8%) | 230 (8.6%) |
| 15 to 19 Minutes | 298 (9.4%) | 442 (16.5%) |
| 20 to 24 Minutes | 363 (11.4%) | 536 (20.0%) |
| 25 to 29 Minutes | 249 (7.8%) | 74 (2.8%) |
| 30 to 34 Minutes | 526 (16.5%) | 259 (9.7%) |
| 35 to 39 Minutes | 106 (3.3%) | 44 (1.6%) |
| 40 to 44 Minutes | 382 (12.0%) | 207 (7.7%) |
| 45 to 59 Minutes | 527 (16.6%) | 342 (12.8%) |
| 60 to 89 Minutes | 489 (15.3%) | 373 (13.9%) |
| 90 or more Minutes | 127 (4.0%) | 42 (1.6%) |
Time of Departure to Work by Sex in Kemp Mill
The most frequent times of departure to work in Kemp Mill are 7:00 AM to 7:29 AM (502, 15.8%) for males and 8:00 AM to 8:29 AM (550, 20.5%) for females.
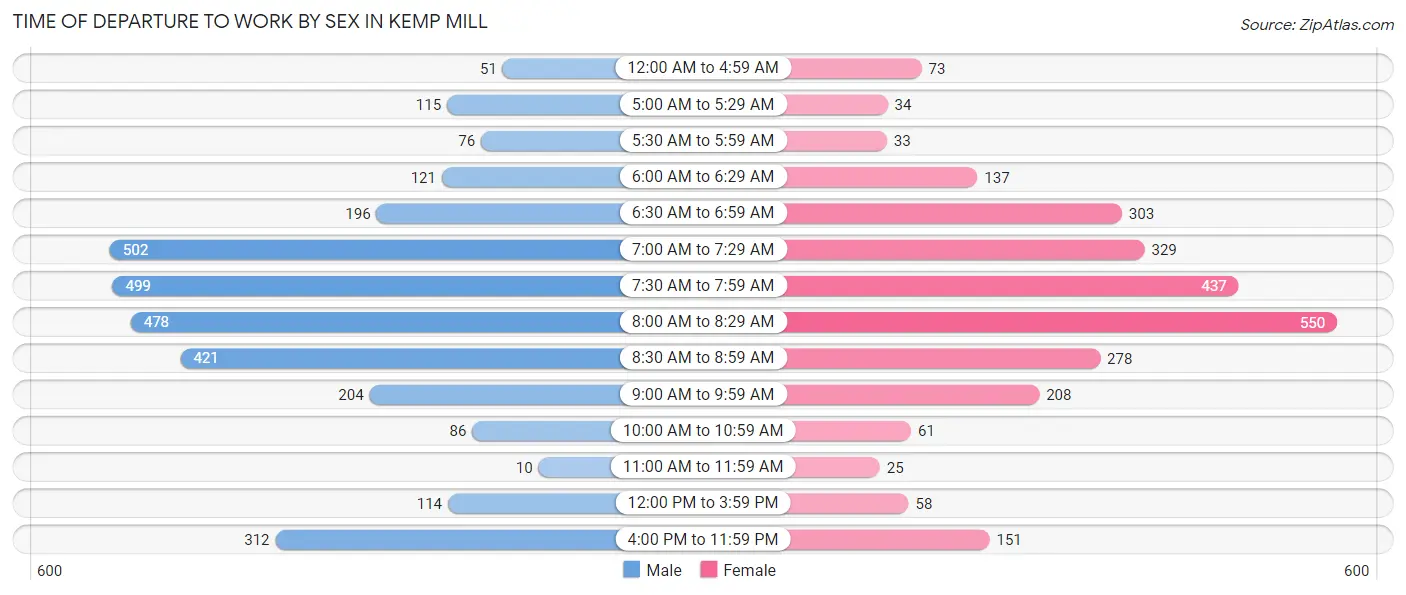
| Time of Departure | Male | Female |
| 12:00 AM to 4:59 AM | 51 (1.6%) | 73 (2.7%) |
| 5:00 AM to 5:29 AM | 115 (3.6%) | 34 (1.3%) |
| 5:30 AM to 5:59 AM | 76 (2.4%) | 33 (1.2%) |
| 6:00 AM to 6:29 AM | 121 (3.8%) | 137 (5.1%) |
| 6:30 AM to 6:59 AM | 196 (6.1%) | 303 (11.3%) |
| 7:00 AM to 7:29 AM | 502 (15.8%) | 329 (12.3%) |
| 7:30 AM to 7:59 AM | 499 (15.7%) | 437 (16.3%) |
| 8:00 AM to 8:29 AM | 478 (15.0%) | 550 (20.5%) |
| 8:30 AM to 8:59 AM | 421 (13.2%) | 278 (10.4%) |
| 9:00 AM to 9:59 AM | 204 (6.4%) | 208 (7.8%) |
| 10:00 AM to 10:59 AM | 86 (2.7%) | 61 (2.3%) |
| 11:00 AM to 11:59 AM | 10 (0.3%) | 25 (0.9%) |
| 12:00 PM to 3:59 PM | 114 (3.6%) | 58 (2.2%) |
| 4:00 PM to 11:59 PM | 312 (9.8%) | 151 (5.6%) |
| Total | 3,185 (100.0%) | 2,677 (100.0%) |
Housing Occupancy in Kemp Mill
Occupancy by Ownership in Kemp Mill
Of the total 4,713 dwellings in Kemp Mill, owner-occupied units account for 3,946 (83.7%), while renter-occupied units make up 767 (16.3%).
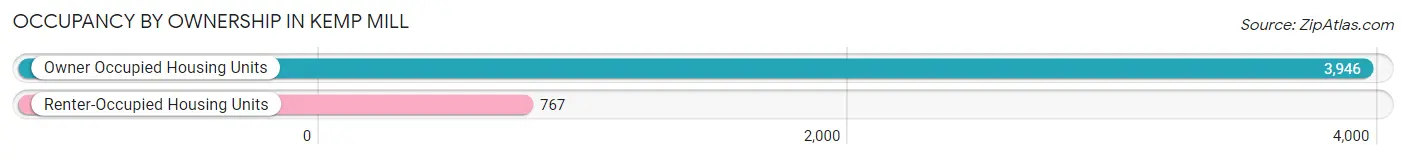
| Occupancy | # Housing Units | % Housing Units |
| Owner Occupied Housing Units | 3,946 | 83.7% |
| Renter-Occupied Housing Units | 767 | 16.3% |
| Total Occupied Housing Units | 4,713 | 100.0% |
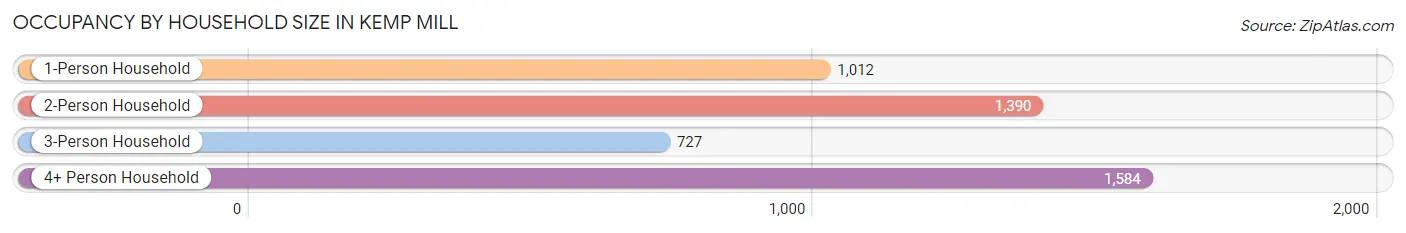
Occupancy by Household Size in Kemp Mill
| Household Size | # Housing Units | % Housing Units |
| 1-Person Household | 1,012 | 21.5% |
| 2-Person Household | 1,390 | 29.5% |
| 3-Person Household | 727 | 15.4% |
| 4+ Person Household | 1,584 | 33.6% |
| Total Housing Units | 4,713 | 100.0% |
Occupancy by Ownership by Household Size in Kemp Mill
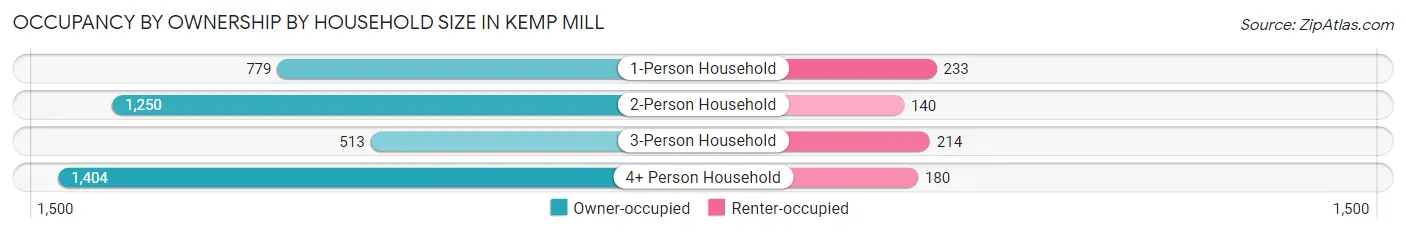
| Household Size | Owner-occupied | Renter-occupied |
| 1-Person Household | 779 (77.0%) | 233 (23.0%) |
| 2-Person Household | 1,250 (89.9%) | 140 (10.1%) |
| 3-Person Household | 513 (70.6%) | 214 (29.4%) |
| 4+ Person Household | 1,404 (88.6%) | 180 (11.4%) |
| Total Housing Units | 3,946 (83.7%) | 767 (16.3%) |
Occupancy by Educational Attainment in Kemp Mill
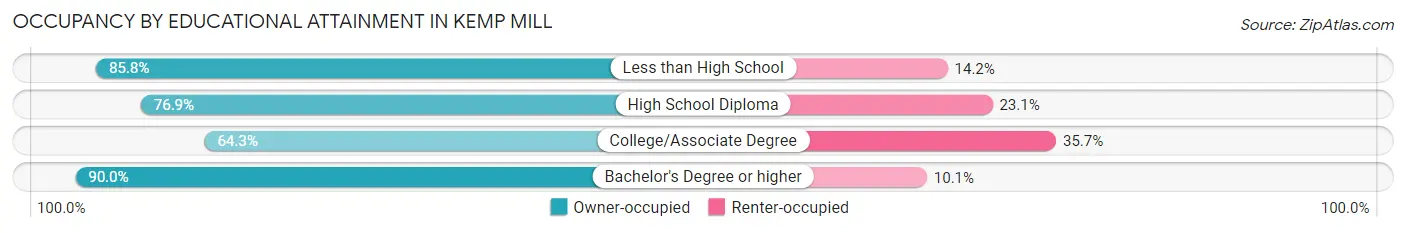
| Household Size | Owner-occupied | Renter-occupied |
| Less than High School | 200 (85.8%) | 33 (14.2%) |
| High School Diploma | 447 (76.9%) | 134 (23.1%) |
| College/Associate Degree | 523 (64.3%) | 290 (35.7%) |
| Bachelor's Degree or higher | 2,776 (89.9%) | 310 (10.1%) |
Occupancy by Age of Householder in Kemp Mill
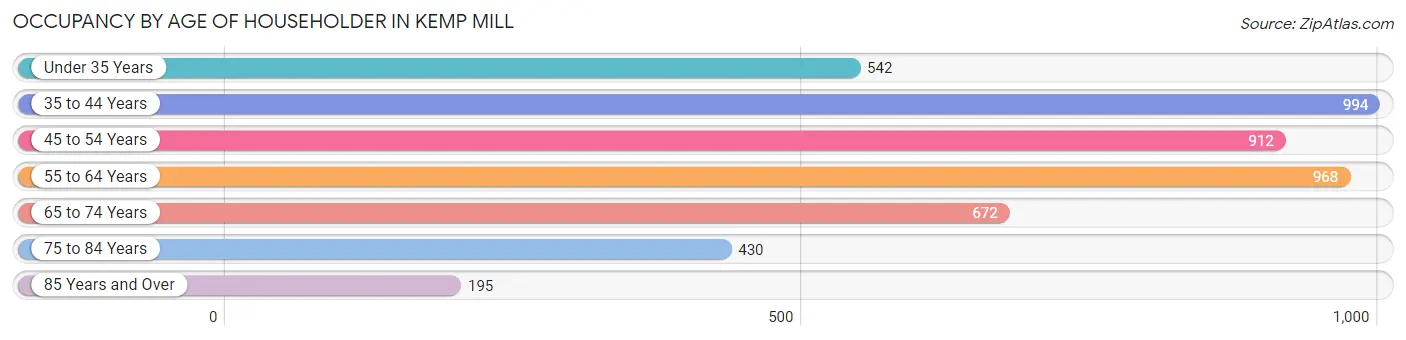
| Age Bracket | # Households | % Households |
| Under 35 Years | 542 | 11.5% |
| 35 to 44 Years | 994 | 21.1% |
| 45 to 54 Years | 912 | 19.4% |
| 55 to 64 Years | 968 | 20.5% |
| 65 to 74 Years | 672 | 14.3% |
| 75 to 84 Years | 430 | 9.1% |
| 85 Years and Over | 195 | 4.1% |
| Total | 4,713 | 100.0% |
Housing Finances in Kemp Mill
Median Income by Occupancy in Kemp Mill
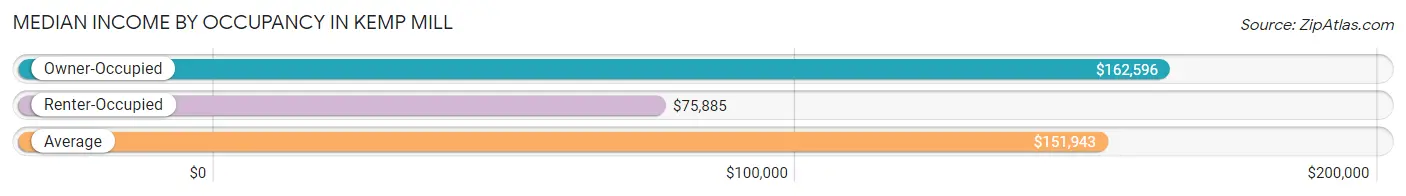
| Occupancy Type | # Households | Median Income |
| Owner-Occupied | 3,946 (83.7%) | $162,596 |
| Renter-Occupied | 767 (16.3%) | $75,885 |
| Average | 4,713 (100.0%) | $151,943 |
Occupancy by Householder Income Bracket in Kemp Mill
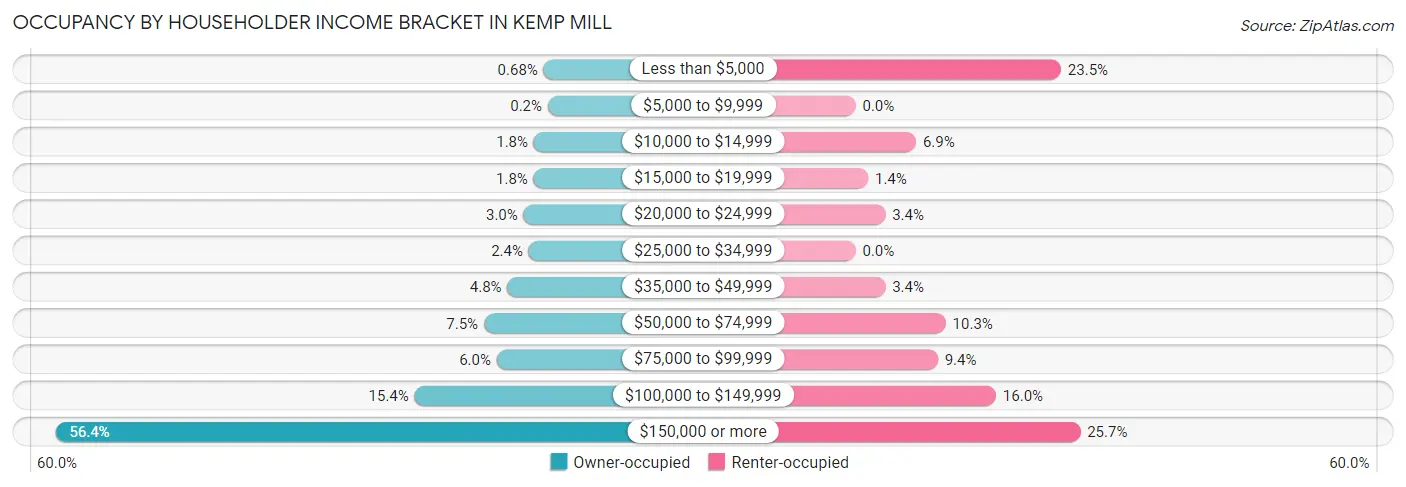
| Income Bracket | Owner-occupied | Renter-occupied |
| Less than $5,000 | 27 (0.7%) | 180 (23.5%) |
| $5,000 to $9,999 | 8 (0.2%) | 0 (0.0%) |
| $10,000 to $14,999 | 71 (1.8%) | 53 (6.9%) |
| $15,000 to $19,999 | 72 (1.8%) | 11 (1.4%) |
| $20,000 to $24,999 | 117 (3.0%) | 26 (3.4%) |
| $25,000 to $34,999 | 94 (2.4%) | 0 (0.0%) |
| $35,000 to $49,999 | 190 (4.8%) | 26 (3.4%) |
| $50,000 to $74,999 | 296 (7.5%) | 79 (10.3%) |
| $75,000 to $99,999 | 238 (6.0%) | 72 (9.4%) |
| $100,000 to $149,999 | 609 (15.4%) | 123 (16.0%) |
| $150,000 or more | 2,224 (56.4%) | 197 (25.7%) |
| Total | 3,946 (100.0%) | 767 (100.0%) |
Monthly Housing Cost Tiers in Kemp Mill
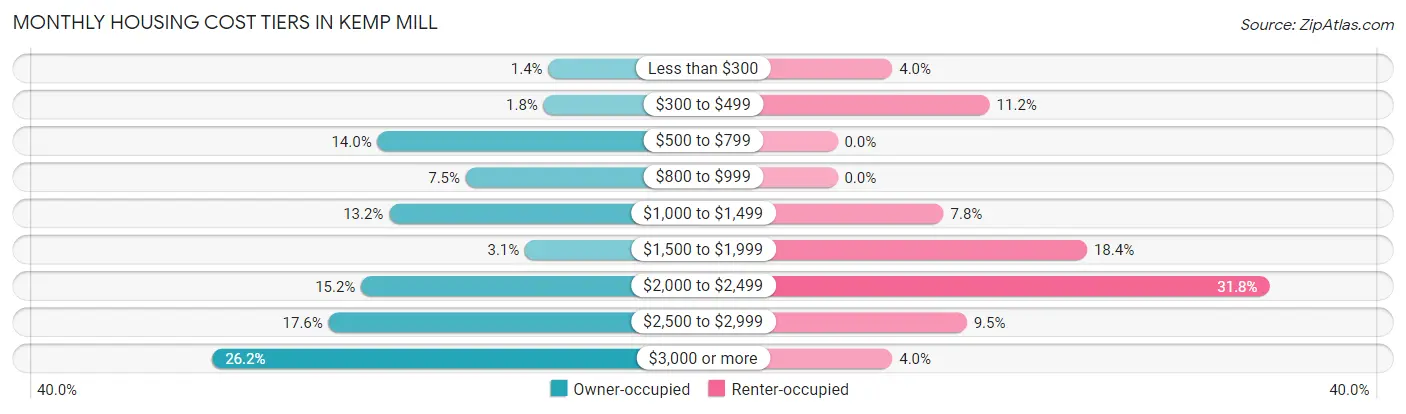
| Monthly Cost | Owner-occupied | Renter-occupied |
| Less than $300 | 56 (1.4%) | 31 (4.0%) |
| $300 to $499 | 70 (1.8%) | 86 (11.2%) |
| $500 to $799 | 553 (14.0%) | 0 (0.0%) |
| $800 to $999 | 296 (7.5%) | 0 (0.0%) |
| $1,000 to $1,499 | 519 (13.2%) | 60 (7.8%) |
| $1,500 to $1,999 | 124 (3.1%) | 141 (18.4%) |
| $2,000 to $2,499 | 600 (15.2%) | 244 (31.8%) |
| $2,500 to $2,999 | 695 (17.6%) | 73 (9.5%) |
| $3,000 or more | 1,033 (26.2%) | 31 (4.0%) |
| Total | 3,946 (100.0%) | 767 (100.0%) |
Physical Housing Characteristics in Kemp Mill
Housing Structures in Kemp Mill
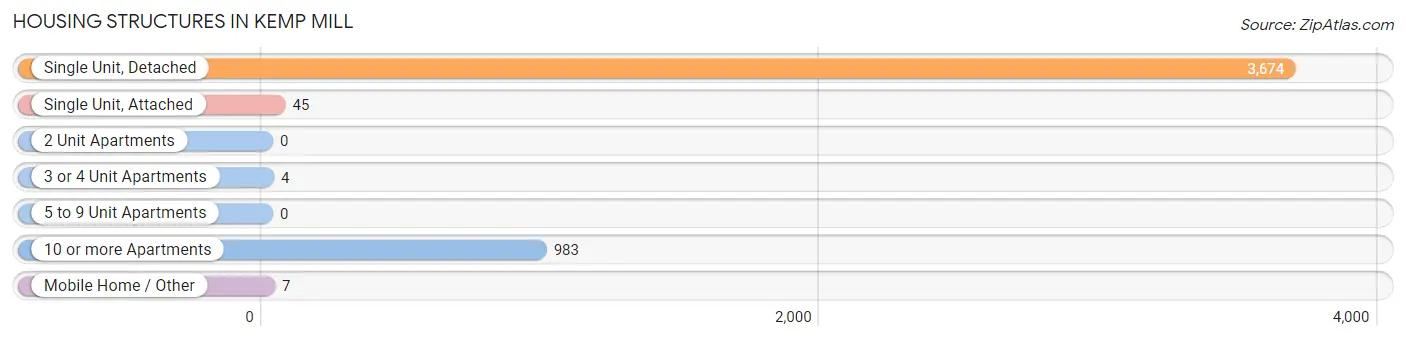
| Structure Type | # Housing Units | % Housing Units |
| Single Unit, Detached | 3,674 | 77.9% |
| Single Unit, Attached | 45 | 0.9% |
| 2 Unit Apartments | 0 | 0.0% |
| 3 or 4 Unit Apartments | 4 | 0.1% |
| 5 to 9 Unit Apartments | 0 | 0.0% |
| 10 or more Apartments | 983 | 20.9% |
| Mobile Home / Other | 7 | 0.2% |
| Total | 4,713 | 100.0% |
Housing Structures by Occupancy in Kemp Mill
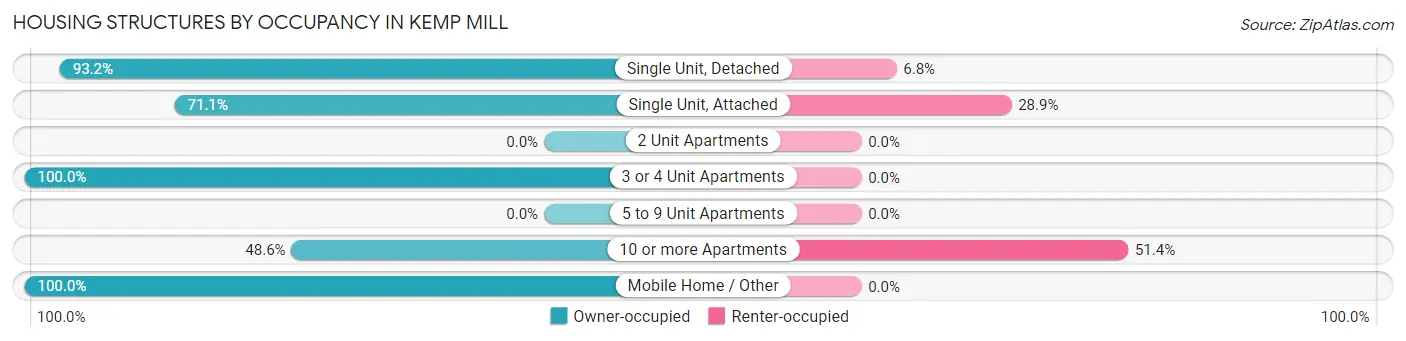
| Structure Type | Owner-occupied | Renter-occupied |
| Single Unit, Detached | 3,425 (93.2%) | 249 (6.8%) |
| Single Unit, Attached | 32 (71.1%) | 13 (28.9%) |
| 2 Unit Apartments | 0 (0.0%) | 0 (0.0%) |
| 3 or 4 Unit Apartments | 4 (100.0%) | 0 (0.0%) |
| 5 to 9 Unit Apartments | 0 (0.0%) | 0 (0.0%) |
| 10 or more Apartments | 478 (48.6%) | 505 (51.4%) |
| Mobile Home / Other | 7 (100.0%) | 0 (0.0%) |
| Total | 3,946 (83.7%) | 767 (16.3%) |
Housing Structures by Number of Rooms in Kemp Mill
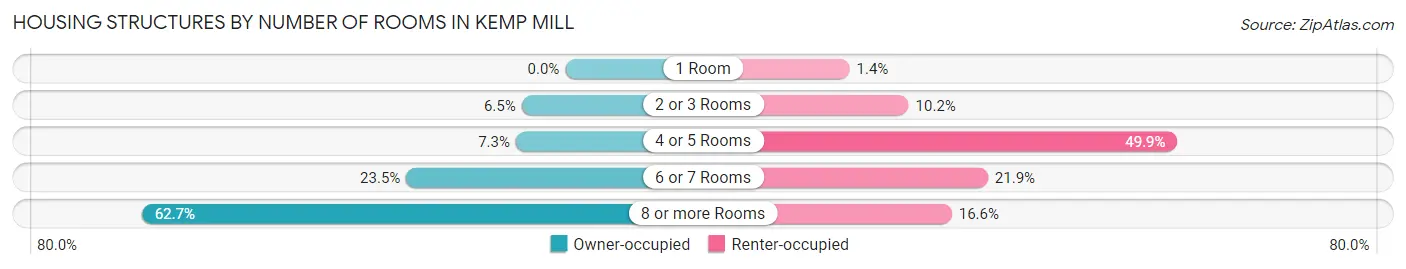
| Number of Rooms | Owner-occupied | Renter-occupied |
| 1 Room | 0 (0.0%) | 11 (1.4%) |
| 2 or 3 Rooms | 255 (6.5%) | 78 (10.2%) |
| 4 or 5 Rooms | 289 (7.3%) | 383 (49.9%) |
| 6 or 7 Rooms | 929 (23.5%) | 168 (21.9%) |
| 8 or more Rooms | 2,473 (62.7%) | 127 (16.6%) |
| Total | 3,946 (100.0%) | 767 (100.0%) |
Housing Structure by Heating Type in Kemp Mill
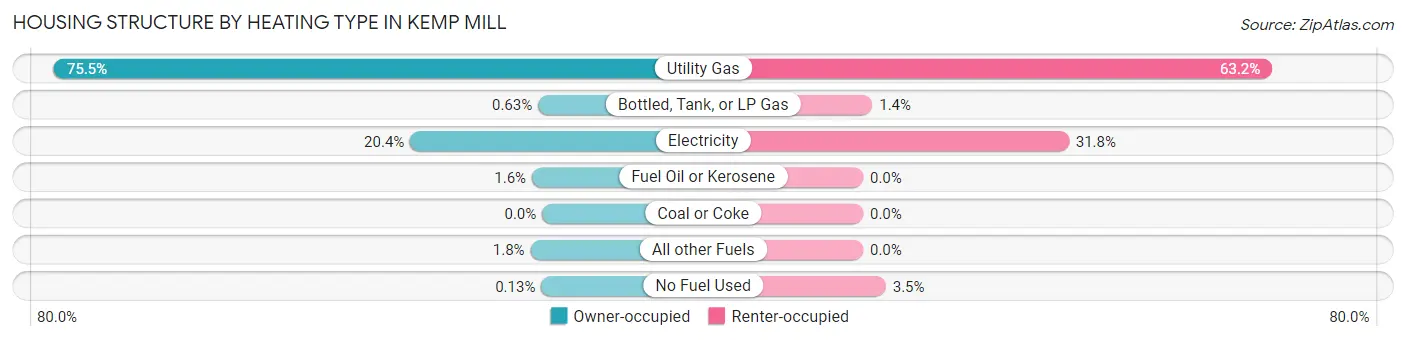
| Heating Type | Owner-occupied | Renter-occupied |
| Utility Gas | 2,978 (75.5%) | 485 (63.2%) |
| Bottled, Tank, or LP Gas | 25 (0.6%) | 11 (1.4%) |
| Electricity | 805 (20.4%) | 244 (31.8%) |
| Fuel Oil or Kerosene | 62 (1.6%) | 0 (0.0%) |
| Coal or Coke | 0 (0.0%) | 0 (0.0%) |
| All other Fuels | 71 (1.8%) | 0 (0.0%) |
| No Fuel Used | 5 (0.1%) | 27 (3.5%) |
| Total | 3,946 (100.0%) | 767 (100.0%) |
Household Vehicle Usage in Kemp Mill
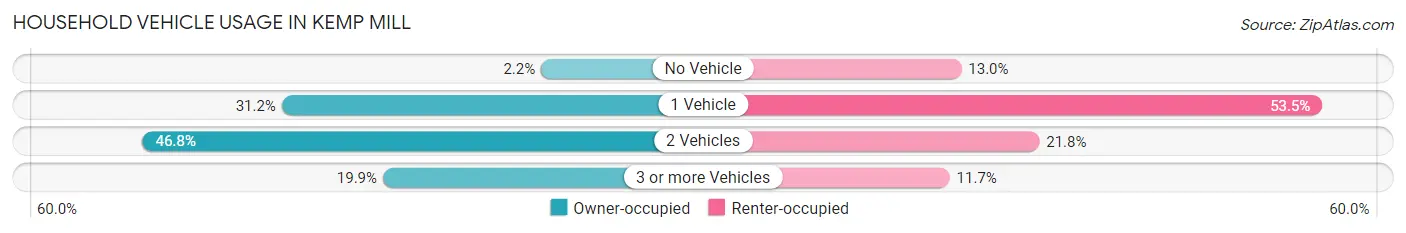
| Vehicles per Household | Owner-occupied | Renter-occupied |
| No Vehicle | 85 (2.1%) | 100 (13.0%) |
| 1 Vehicle | 1,231 (31.2%) | 410 (53.5%) |
| 2 Vehicles | 1,846 (46.8%) | 167 (21.8%) |
| 3 or more Vehicles | 784 (19.9%) | 90 (11.7%) |
| Total | 3,946 (100.0%) | 767 (100.0%) |
Real Estate & Mortgages in Kemp Mill
Real Estate and Mortgage Overview in Kemp Mill
| Characteristic | Without Mortgage | With Mortgage |
| Housing Units | 1,167 | 2,779 |
| Median Property Value | $435,300 | $557,700 |
| Median Household Income | $145,368 | $1,684 |
| Monthly Housing Costs | $771 | $1,033 |
| Real Estate Taxes | $3,684 | $112 |
Property Value by Mortgage Status in Kemp Mill
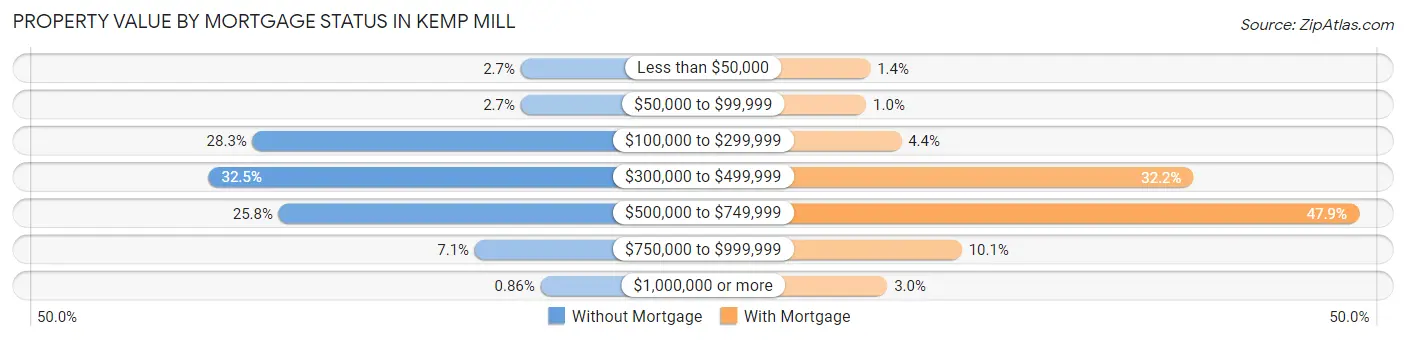
| Property Value | Without Mortgage | With Mortgage |
| Less than $50,000 | 32 (2.7%) | 39 (1.4%) |
| $50,000 to $99,999 | 32 (2.7%) | 28 (1.0%) |
| $100,000 to $299,999 | 330 (28.3%) | 121 (4.3%) |
| $300,000 to $499,999 | 379 (32.5%) | 894 (32.2%) |
| $500,000 to $749,999 | 301 (25.8%) | 1,332 (47.9%) |
| $750,000 to $999,999 | 83 (7.1%) | 281 (10.1%) |
| $1,000,000 or more | 10 (0.9%) | 84 (3.0%) |
| Total | 1,167 (100.0%) | 2,779 (100.0%) |
Household Income by Mortgage Status in Kemp Mill
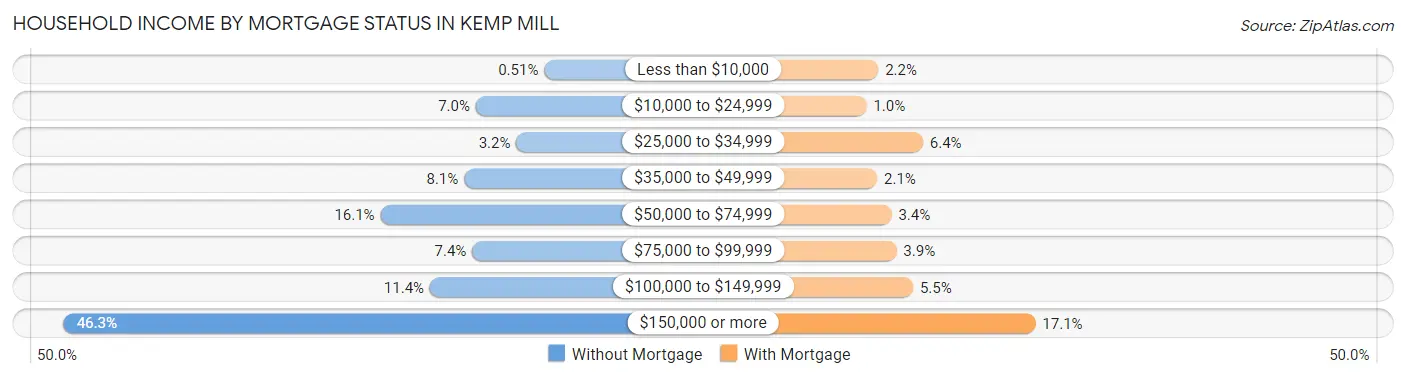
| Household Income | Without Mortgage | With Mortgage |
| Less than $10,000 | 6 (0.5%) | 60 (2.2%) |
| $10,000 to $24,999 | 82 (7.0%) | 29 (1.0%) |
| $25,000 to $34,999 | 37 (3.2%) | 178 (6.4%) |
| $35,000 to $49,999 | 95 (8.1%) | 57 (2.1%) |
| $50,000 to $74,999 | 188 (16.1%) | 95 (3.4%) |
| $75,000 to $99,999 | 86 (7.4%) | 108 (3.9%) |
| $100,000 to $149,999 | 133 (11.4%) | 152 (5.5%) |
| $150,000 or more | 540 (46.3%) | 476 (17.1%) |
| Total | 1,167 (100.0%) | 2,779 (100.0%) |
Property Value to Household Income Ratio in Kemp Mill
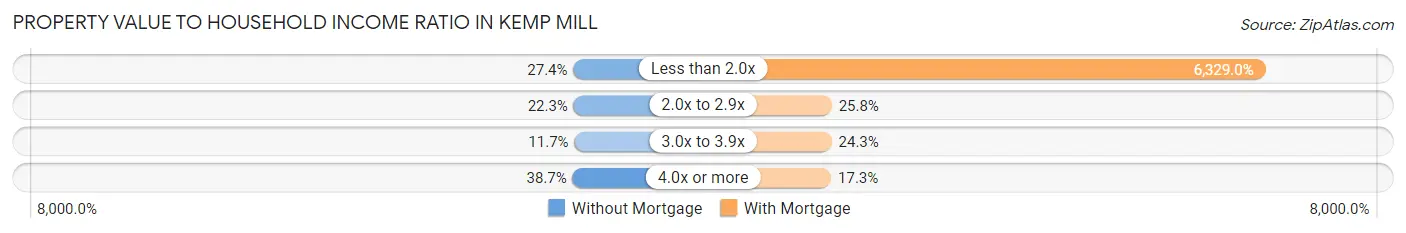
| Value-to-Income Ratio | Without Mortgage | With Mortgage |
| Less than 2.0x | 320 (27.4%) | 175,882 (6,329.0%) |
| 2.0x to 2.9x | 260 (22.3%) | 716 (25.8%) |
| 3.0x to 3.9x | 136 (11.7%) | 676 (24.3%) |
| 4.0x or more | 451 (38.7%) | 482 (17.3%) |
| Total | 1,167 (100.0%) | 2,779 (100.0%) |
Real Estate Taxes by Mortgage Status in Kemp Mill
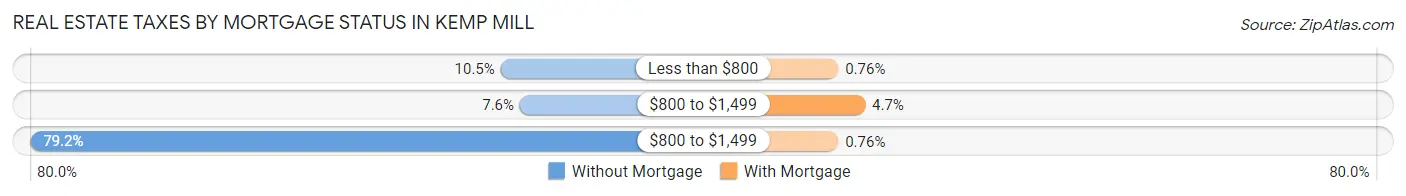
| Property Taxes | Without Mortgage | With Mortgage |
| Less than $800 | 122 (10.4%) | 21 (0.8%) |
| $800 to $1,499 | 89 (7.6%) | 130 (4.7%) |
| $800 to $1,499 | 924 (79.2%) | 21 (0.8%) |
| Total | 1,167 (100.0%) | 2,779 (100.0%) |
Health & Disability in Kemp Mill
Health Insurance Coverage by Age in Kemp Mill
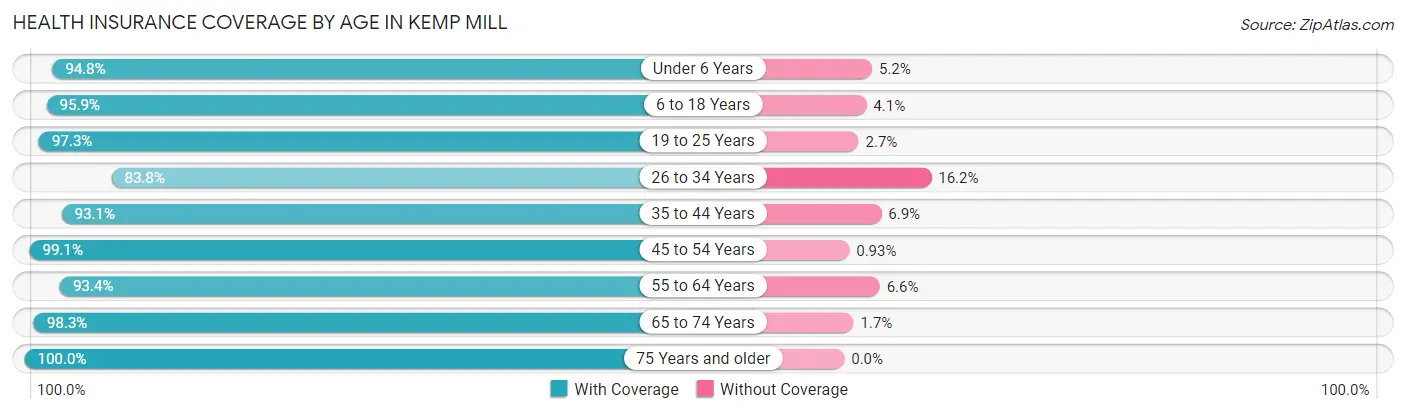
| Age Bracket | With Coverage | Without Coverage |
| Under 6 Years | 936 (94.8%) | 51 (5.2%) |
| 6 to 18 Years | 2,582 (95.9%) | 111 (4.1%) |
| 19 to 25 Years | 911 (97.3%) | 25 (2.7%) |
| 26 to 34 Years | 1,286 (83.8%) | 249 (16.2%) |
| 35 to 44 Years | 1,966 (93.1%) | 146 (6.9%) |
| 45 to 54 Years | 1,713 (99.1%) | 16 (0.9%) |
| 55 to 64 Years | 1,642 (93.4%) | 116 (6.6%) |
| 65 to 74 Years | 1,188 (98.3%) | 21 (1.7%) |
| 75 Years and older | 916 (100.0%) | 0 (0.0%) |
| Total | 13,140 (94.7%) | 735 (5.3%) |
Health Insurance Coverage by Citizenship Status in Kemp Mill
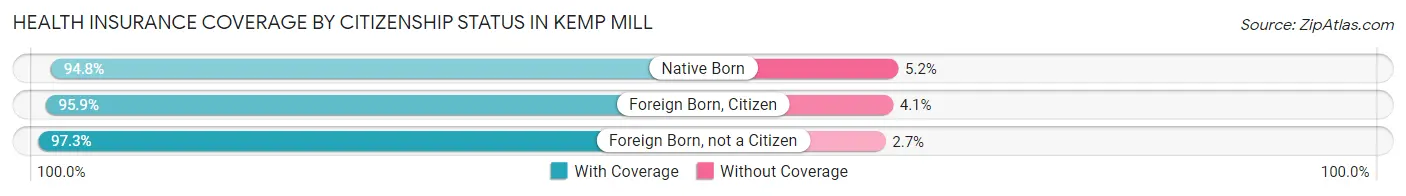
| Citizenship Status | With Coverage | Without Coverage |
| Native Born | 936 (94.8%) | 51 (5.2%) |
| Foreign Born, Citizen | 2,582 (95.9%) | 111 (4.1%) |
| Foreign Born, not a Citizen | 911 (97.3%) | 25 (2.7%) |
Health Insurance Coverage by Household Income in Kemp Mill
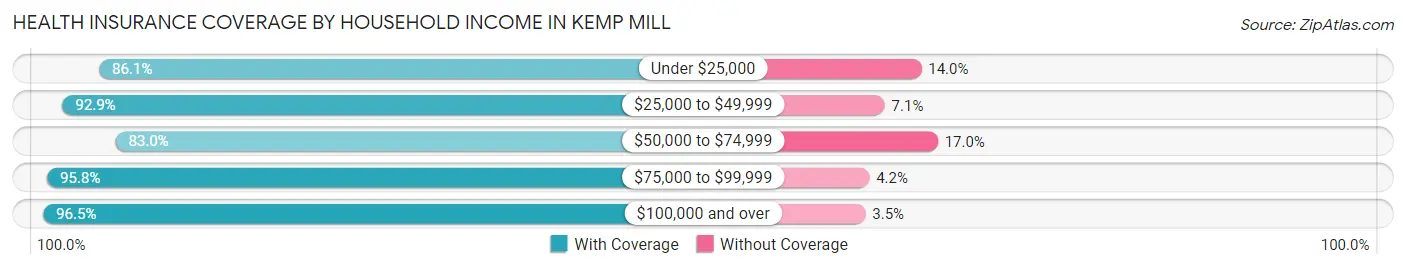
| Household Income | With Coverage | Without Coverage |
| Under $25,000 | 888 (86.1%) | 144 (14.0%) |
| $25,000 to $49,999 | 537 (92.9%) | 41 (7.1%) |
| $50,000 to $74,999 | 726 (83.0%) | 149 (17.0%) |
| $75,000 to $99,999 | 775 (95.8%) | 34 (4.2%) |
| $100,000 and over | 10,192 (96.5%) | 367 (3.5%) |
Public vs Private Health Insurance Coverage by Age in Kemp Mill
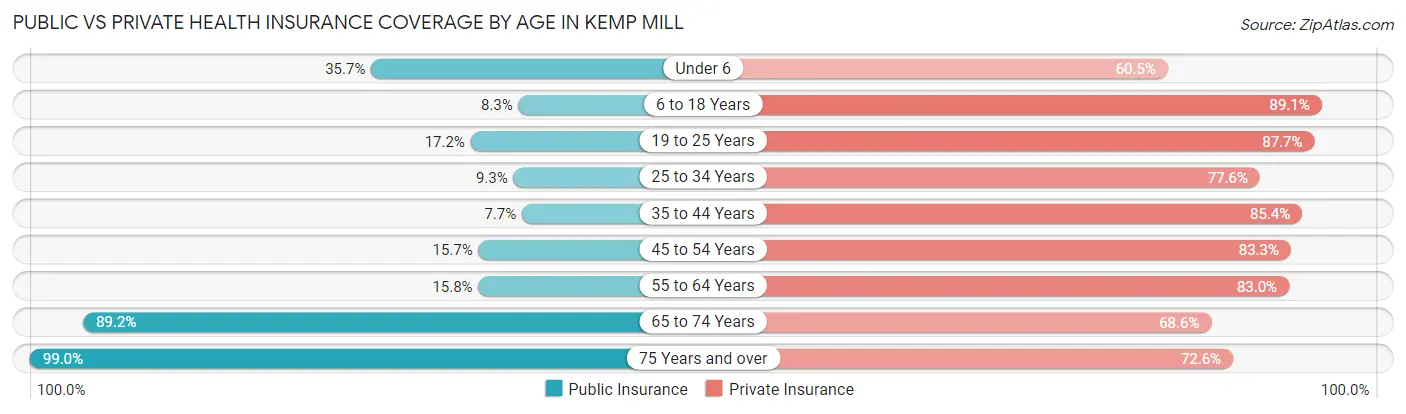
| Age Bracket | Public Insurance | Private Insurance |
| Under 6 | 352 (35.7%) | 597 (60.5%) |
| 6 to 18 Years | 224 (8.3%) | 2,398 (89.0%) |
| 19 to 25 Years | 161 (17.2%) | 821 (87.7%) |
| 25 to 34 Years | 142 (9.2%) | 1,191 (77.6%) |
| 35 to 44 Years | 162 (7.7%) | 1,804 (85.4%) |
| 45 to 54 Years | 272 (15.7%) | 1,441 (83.3%) |
| 55 to 64 Years | 277 (15.8%) | 1,459 (83.0%) |
| 65 to 74 Years | 1,078 (89.2%) | 829 (68.6%) |
| 75 Years and over | 907 (99.0%) | 665 (72.6%) |
| Total | 3,575 (25.8%) | 11,205 (80.8%) |
Disability Status by Sex by Age in Kemp Mill
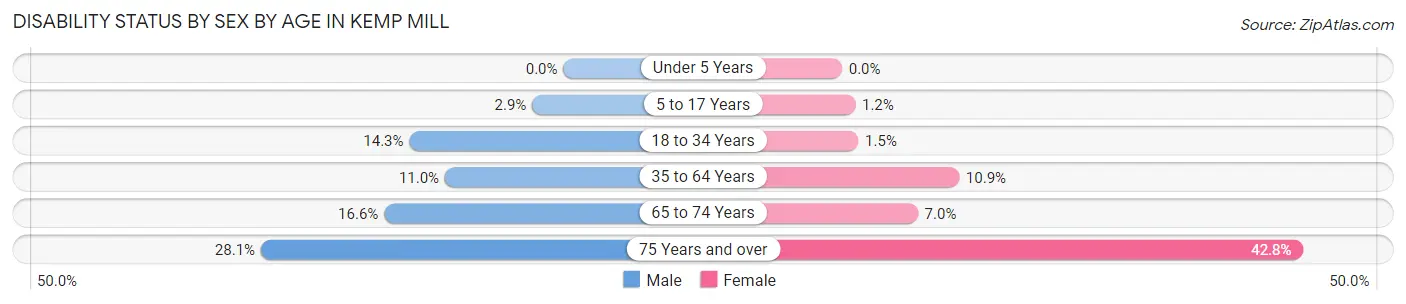
| Age Bracket | Male | Female |
| Under 5 Years | 0 (0.0%) | 0 (0.0%) |
| 5 to 17 Years | 36 (2.9%) | 17 (1.2%) |
| 18 to 34 Years | 199 (14.3%) | 19 (1.5%) |
| 35 to 64 Years | 316 (11.0%) | 296 (10.9%) |
| 65 to 74 Years | 83 (16.6%) | 50 (7.0%) |
| 75 Years and over | 128 (28.1%) | 197 (42.8%) |
Disability Class by Sex by Age in Kemp Mill
Disability Class: Hearing Difficulty
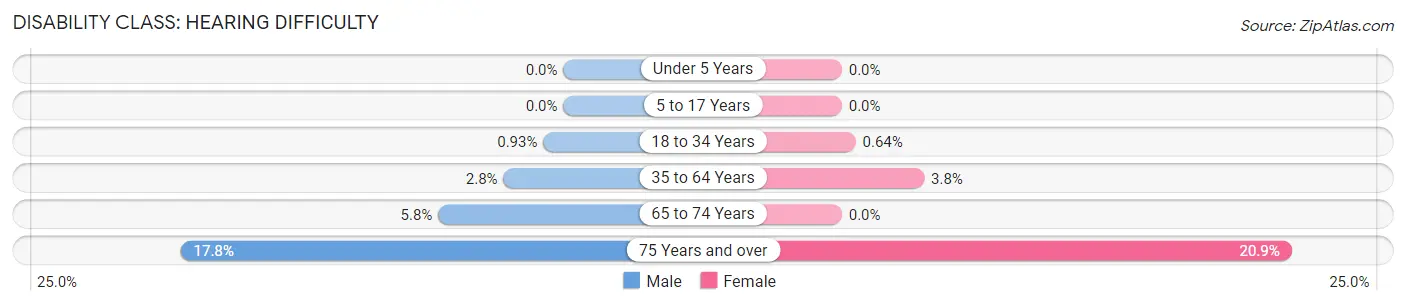
| Age Bracket | Male | Female |
| Under 5 Years | 0 (0.0%) | 0 (0.0%) |
| 5 to 17 Years | 0 (0.0%) | 0 (0.0%) |
| 18 to 34 Years | 13 (0.9%) | 8 (0.6%) |
| 35 to 64 Years | 80 (2.8%) | 104 (3.8%) |
| 65 to 74 Years | 29 (5.8%) | 0 (0.0%) |
| 75 Years and over | 81 (17.8%) | 96 (20.9%) |
Disability Class: Vision Difficulty
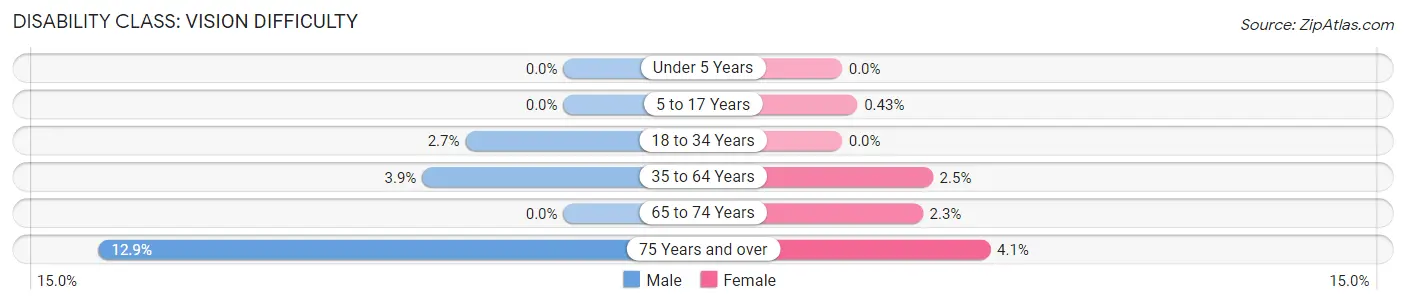
| Age Bracket | Male | Female |
| Under 5 Years | 0 (0.0%) | 0 (0.0%) |
| 5 to 17 Years | 0 (0.0%) | 6 (0.4%) |
| 18 to 34 Years | 38 (2.7%) | 0 (0.0%) |
| 35 to 64 Years | 113 (3.9%) | 69 (2.5%) |
| 65 to 74 Years | 0 (0.0%) | 16 (2.2%) |
| 75 Years and over | 59 (12.9%) | 19 (4.1%) |
Disability Class: Cognitive Difficulty
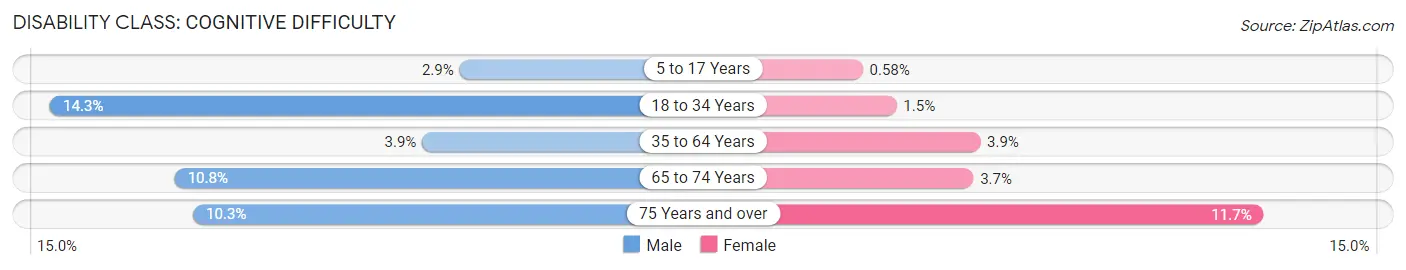
| Age Bracket | Male | Female |
| 5 to 17 Years | 36 (2.9%) | 8 (0.6%) |
| 18 to 34 Years | 199 (14.3%) | 19 (1.5%) |
| 35 to 64 Years | 113 (3.9%) | 105 (3.8%) |
| 65 to 74 Years | 54 (10.8%) | 26 (3.7%) |
| 75 Years and over | 47 (10.3%) | 54 (11.7%) |
Disability Class: Ambulatory Difficulty
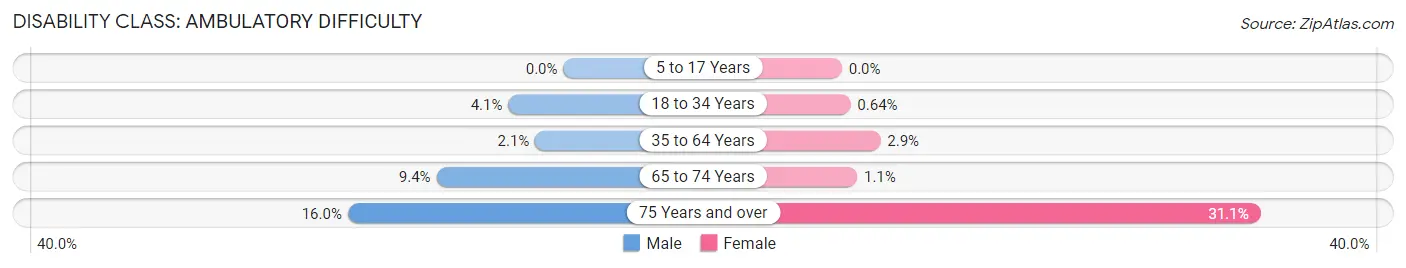
| Age Bracket | Male | Female |
| 5 to 17 Years | 0 (0.0%) | 0 (0.0%) |
| 18 to 34 Years | 57 (4.1%) | 8 (0.6%) |
| 35 to 64 Years | 60 (2.1%) | 78 (2.9%) |
| 65 to 74 Years | 47 (9.4%) | 8 (1.1%) |
| 75 Years and over | 73 (16.0%) | 143 (31.1%) |
Disability Class: Self-Care Difficulty
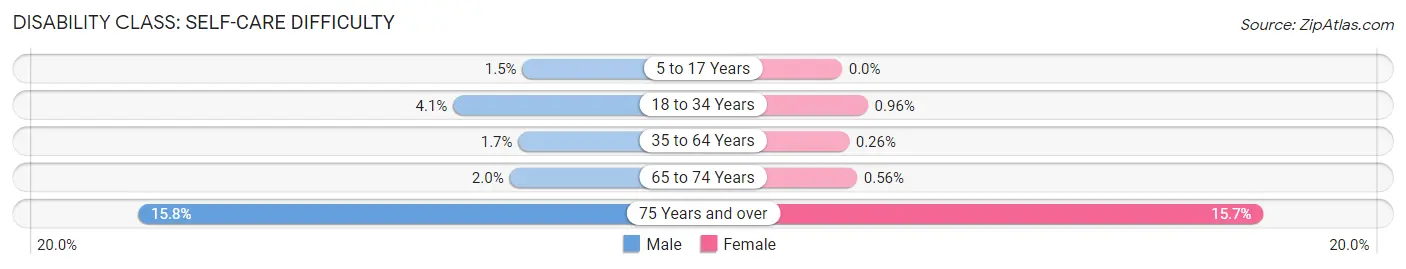
| Age Bracket | Male | Female |
| 5 to 17 Years | 19 (1.5%) | 0 (0.0%) |
| 18 to 34 Years | 57 (4.1%) | 12 (1.0%) |
| 35 to 64 Years | 48 (1.7%) | 7 (0.3%) |
| 65 to 74 Years | 10 (2.0%) | 4 (0.6%) |
| 75 Years and over | 72 (15.8%) | 72 (15.7%) |
Technology Access in Kemp Mill
Computing Device Access in Kemp Mill
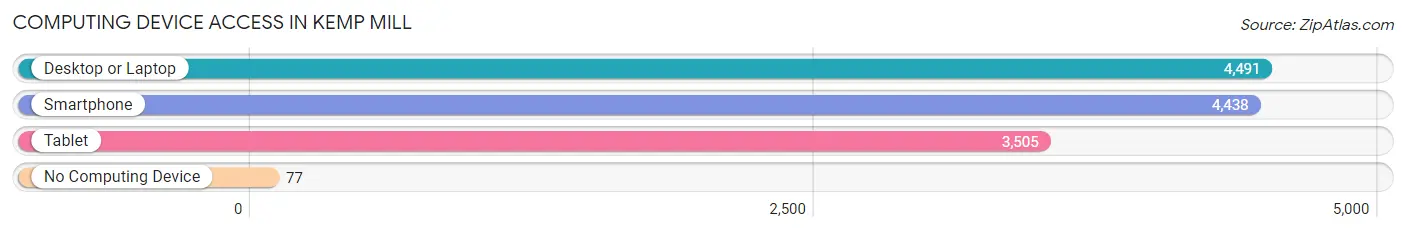
| Device Type | # Households | % Households |
| Desktop or Laptop | 4,491 | 95.3% |
| Smartphone | 4,438 | 94.2% |
| Tablet | 3,505 | 74.4% |
| No Computing Device | 77 | 1.6% |
| Total | 4,713 | 100.0% |
Internet Access in Kemp Mill
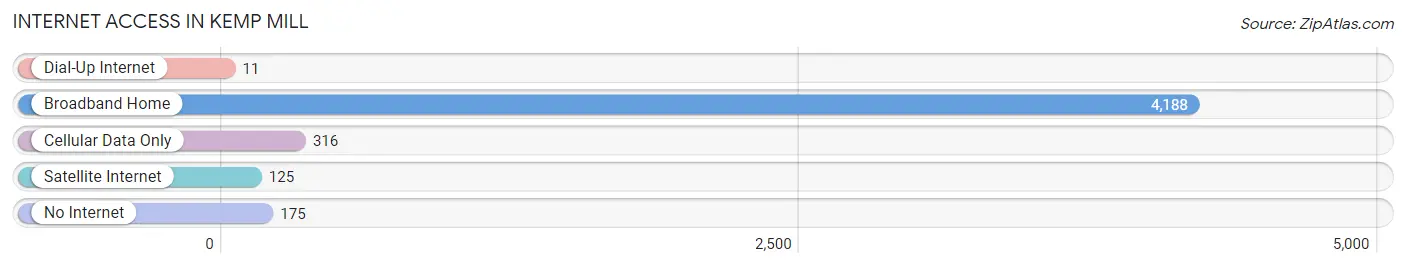
| Internet Type | # Households | % Households |
| Dial-Up Internet | 11 | 0.2% |
| Broadband Home | 4,188 | 88.9% |
| Cellular Data Only | 316 | 6.7% |
| Satellite Internet | 125 | 2.6% |
| No Internet | 175 | 3.7% |
| Total | 4,713 | 100.0% |
Kemp Mill Summary
Kemp Mill is an unincorporated area located in Montgomery County, Maryland. It is located in the northern part of the county, just south of the city of Silver Spring. The area is bordered by the communities of Wheaton, White Oak, and Aspen Hill. The population of Kemp Mill was estimated to be 8,845 in 2019.
History
Kemp Mill was originally part of a large tract of land owned by the Kemp family in the late 1700s. The area was known as Kemp's Mill, and the family operated a grist mill on the property. The mill was destroyed by fire in 1864, and the family sold the land to the Washington and Rockville Railroad in 1873. The railroad built a station in the area, and the area became known as Kemp Mill Station.
The area began to develop in the early 1900s, with the construction of single-family homes and small businesses. The area was annexed by the city of Silver Spring in 1938, and the Kemp Mill Shopping Center was built in the 1950s. The shopping center was the first of its kind in the area, and it helped to spur further development in the area.
Geography
Kemp Mill is located in the northern part of Montgomery County, Maryland. It is bordered by the communities of Wheaton, White Oak, and Aspen Hill. The area is located just south of the city of Silver Spring, and it is approximately 8 miles from downtown Washington, D.C.
The area is located in the Piedmont region of Maryland, and it is characterized by rolling hills and valleys. The area is located in the watershed of the Anacostia River, and it is part of the Chesapeake Bay watershed.
Economy
Kemp Mill is primarily a residential area, but it does have a few small businesses. The Kemp Mill Shopping Center is the largest commercial center in the area, and it includes a variety of stores and restaurants. The shopping center also includes a movie theater and a bowling alley.
The area is also home to a number of medical facilities, including the Shady Grove Adventist Hospital and the Suburban Hospital. The area is also home to a number of government offices, including the Montgomery County Department of Health and Human Services and the Montgomery County Department of Transportation.
Demographics
Kemp Mill is a diverse area, with a population that is approximately 50% white, 25% African American, 15% Hispanic, and 10% Asian. The median household income in the area is $76,000, and the median home value is $400,000. The area is served by the Montgomery County Public Schools system, and the area is home to several public and private schools.
Common Questions
What is Per Capita Income in Kemp Mill?
Per Capita income in Kemp Mill is $60,348.
What is the Median Family Income in Kemp Mill?
Median Family Income in Kemp Mill is $168,594.
What is the Median Household income in Kemp Mill?
Median Household Income in Kemp Mill is $151,943.
What is Income or Wage Gap in Kemp Mill?
Income or Wage Gap in Kemp Mill is 32.7%.
Women in Kemp Mill earn 67.3 cents for every dollar earned by a man.
What is Inequality or Gini Index in Kemp Mill?
Inequality or Gini Index in Kemp Mill is 0.43.
What is the Total Population of Kemp Mill?
Total Population of Kemp Mill is 14,098.
What is the Total Male Population of Kemp Mill?
Total Male Population of Kemp Mill is 7,032.
What is the Total Female Population of Kemp Mill?
Total Female Population of Kemp Mill is 7,066.
What is the Ratio of Males per 100 Females in Kemp Mill?
There are 99.52 Males per 100 Females in Kemp Mill.
What is the Ratio of Females per 100 Males in Kemp Mill?
There are 100.48 Females per 100 Males in Kemp Mill.
What is the Median Population Age in Kemp Mill?
Median Population Age in Kemp Mill is 39.7 Years.
What is the Average Family Size in Kemp Mill
Average Family Size in Kemp Mill is 3.5 People.
What is the Average Household Size in Kemp Mill
Average Household Size in Kemp Mill is 3.0 People.
How Large is the Labor Force in Kemp Mill?
There are 7,636 People in the Labor Forcein in Kemp Mill.
What is the Percentage of People in the Labor Force in Kemp Mill?
69.9% of People are in the Labor Force in Kemp Mill.
What is the Unemployment Rate in Kemp Mill?
Unemployment Rate in Kemp Mill is 3.9%.