Mount Lena, MD Map & Demographics
Mount Lena Map
Mount Lena Overview
$36,071
PER CAPITA INCOME
$51,625
AVG HOUSEHOLD INCOME
0.43
INEQUALITY / GINI INDEX
343
TOTAL POPULATION
170
MALE POPULATION
173
FEMALE POPULATION
98.27
MALES / 100 FEMALES
101.76
FEMALES / 100 MALES
47.4
MEDIAN AGE
3.1
AVG FAMILY SIZE
2.5
AVG HOUSEHOLD SIZE
179
LABOR FORCE [ PEOPLE ]
67.8%
PERCENT IN LABOR FORCE
Income in Mount Lena
Income Overview in Mount Lena
| Characteristic | Number | Measure |
| Per Capita Income | 343 | $36,071 |
| Median Family Income | 90 | $0 |
| Mean Family Income | 90 | $120,461 |
| Median Household Income | 137 | $51,625 |
| Mean Household Income | 137 | $96,418 |
| Income Deficit | 90 | $0 |
| Wage / Income Gap (%) | 343 | 0.00% |
| Wage / Income Gap ($) | 343 | 100.00¢ per $1 |
| Gini / Inequality Index | 343 | 0.43 |
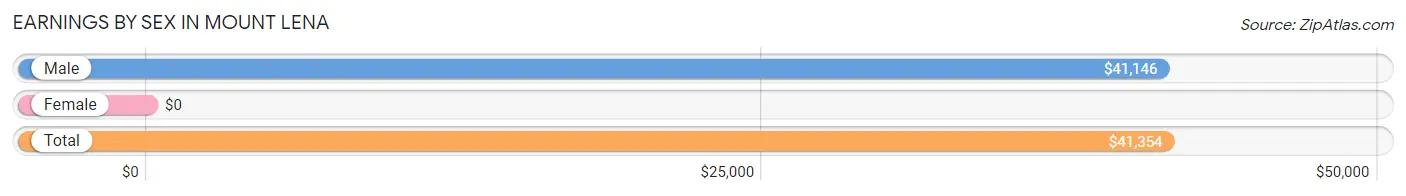
Earnings by Sex in Mount Lena
| Sex | Number | Average Earnings |
| Male | 115 (64.2%) | $41,146 |
| Female | 64 (35.7%) | $0 |
| Total | 179 (100.0%) | $41,354 |
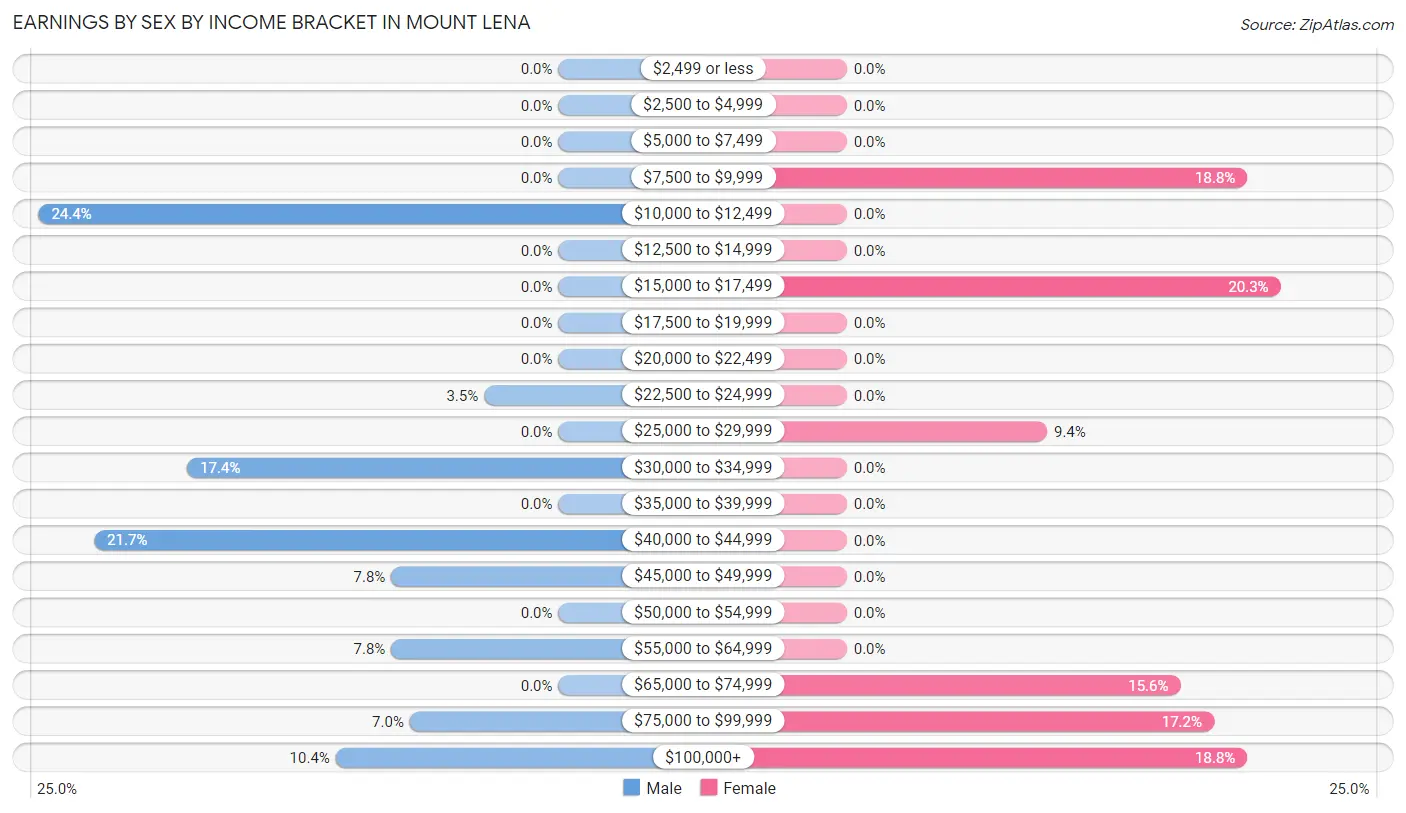
Earnings by Sex by Income Bracket in Mount Lena
The most common earnings brackets in Mount Lena are $10,000 to $12,499 for men (28 | 24.3%) and $15,000 to $17,499 for women (13 | 20.3%).
| Income | Male | Female |
| $2,499 or less | 0 (0.0%) | 0 (0.0%) |
| $2,500 to $4,999 | 0 (0.0%) | 0 (0.0%) |
| $5,000 to $7,499 | 0 (0.0%) | 0 (0.0%) |
| $7,500 to $9,999 | 0 (0.0%) | 12 (18.8%) |
| $10,000 to $12,499 | 28 (24.3%) | 0 (0.0%) |
| $12,500 to $14,999 | 0 (0.0%) | 0 (0.0%) |
| $15,000 to $17,499 | 0 (0.0%) | 13 (20.3%) |
| $17,500 to $19,999 | 0 (0.0%) | 0 (0.0%) |
| $20,000 to $22,499 | 0 (0.0%) | 0 (0.0%) |
| $22,500 to $24,999 | 4 (3.5%) | 0 (0.0%) |
| $25,000 to $29,999 | 0 (0.0%) | 6 (9.4%) |
| $30,000 to $34,999 | 20 (17.4%) | 0 (0.0%) |
| $35,000 to $39,999 | 0 (0.0%) | 0 (0.0%) |
| $40,000 to $44,999 | 25 (21.7%) | 0 (0.0%) |
| $45,000 to $49,999 | 9 (7.8%) | 0 (0.0%) |
| $50,000 to $54,999 | 0 (0.0%) | 0 (0.0%) |
| $55,000 to $64,999 | 9 (7.8%) | 0 (0.0%) |
| $65,000 to $74,999 | 0 (0.0%) | 10 (15.6%) |
| $75,000 to $99,999 | 8 (7.0%) | 11 (17.2%) |
| $100,000+ | 12 (10.4%) | 12 (18.8%) |
| Total | 115 (100.0%) | 64 (100.0%) |
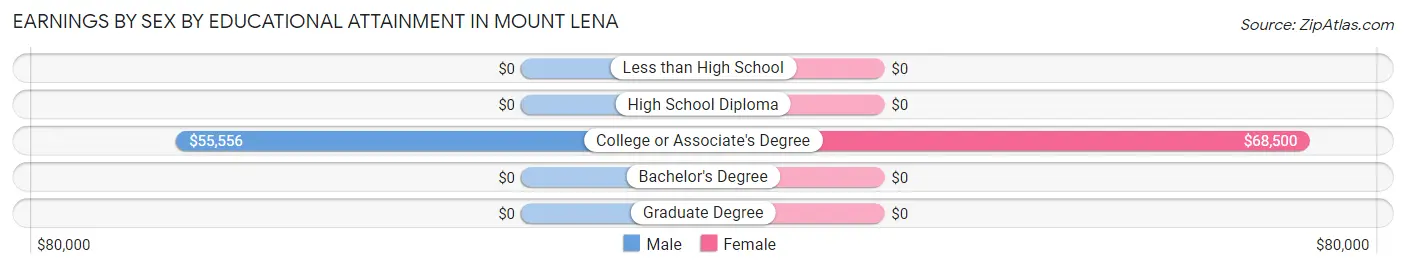
Earnings by Sex by Educational Attainment in Mount Lena
| Educational Attainment | Male Income | Female Income |
| Less than High School | - | - |
| High School Diploma | - | - |
| College or Associate's Degree | $55,556 | $68,500 |
| Bachelor's Degree | - | - |
| Graduate Degree | - | - |
| Total | $41,146 | $0 |
Family Income in Mount Lena
Family Income Brackets in Mount Lena
According to the Mount Lena family income data, there are 28 families falling into the $200,000+ income range, which is the most common income bracket and makes up 31.1% of all families.
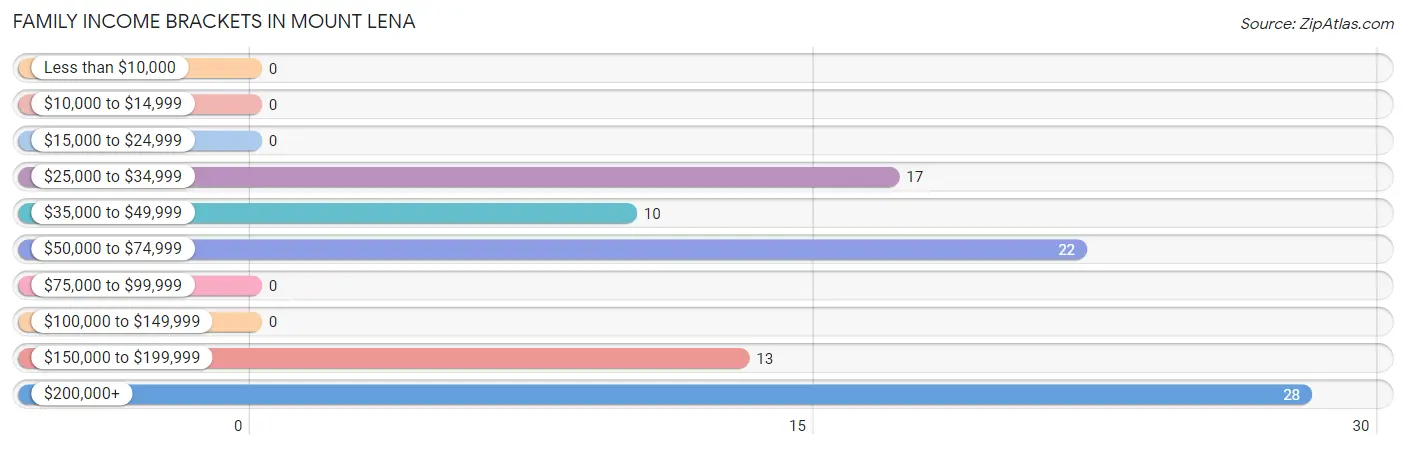
| Income Bracket | # Families | % Families |
| Less than $10,000 | 0 | 0.0% |
| $10,000 to $14,999 | 0 | 0.0% |
| $15,000 to $24,999 | 0 | 0.0% |
| $25,000 to $34,999 | 17 | 18.9% |
| $35,000 to $49,999 | 10 | 11.1% |
| $50,000 to $74,999 | 22 | 24.4% |
| $75,000 to $99,999 | 0 | 0.0% |
| $100,000 to $149,999 | 0 | 0.0% |
| $150,000 to $199,999 | 13 | 14.4% |
| $200,000+ | 28 | 31.1% |
Family Income by Famaliy Size in Mount Lena
2-person families (57 | 63.3%) account for the highest median family income in Mount Lena with $51,375 per family, while 2-person families (57 | 63.3%) have the highest median income of $25,688 per family member.
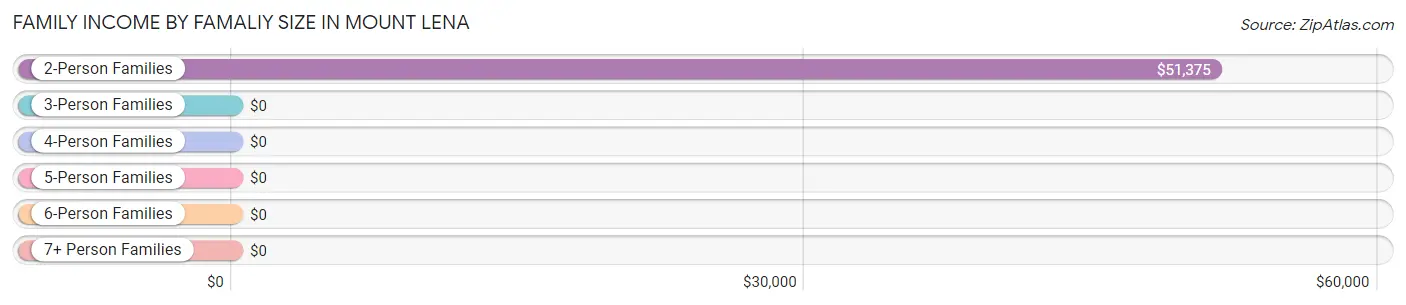
| Income Bracket | # Families | Median Income |
| 2-Person Families | 57 (63.3%) | $51,375 |
| 3-Person Families | 17 (18.9%) | $0 |
| 4-Person Families | 7 (7.8%) | $0 |
| 5-Person Families | 0 (0.0%) | $0 |
| 6-Person Families | 0 (0.0%) | $0 |
| 7+ Person Families | 9 (10.0%) | $0 |
| Total | 90 (100.0%) | $0 |
Family Income by Number of Earners in Mount Lena
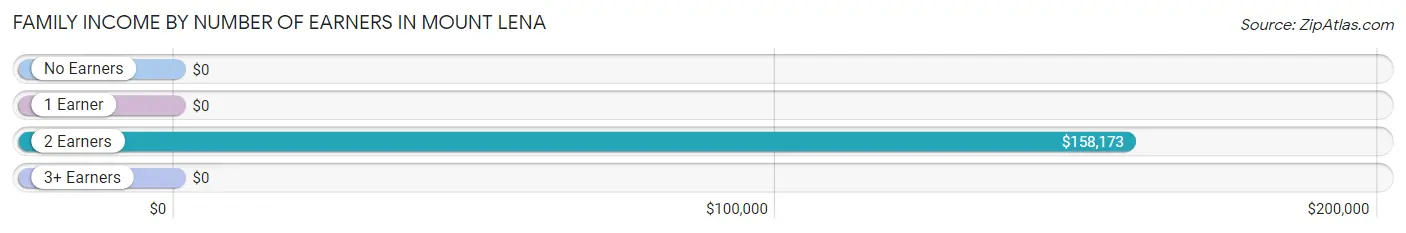
| Number of Earners | # Families | Median Income |
| No Earners | 20 (22.2%) | $0 |
| 1 Earner | 4 (4.4%) | $0 |
| 2 Earners | 57 (63.3%) | $158,173 |
| 3+ Earners | 9 (10.0%) | $0 |
| Total | 90 (100.0%) | $0 |
Household Income in Mount Lena
Household Income Brackets in Mount Lena
With 37 households falling in the category, the $35,000 to $49,999 income range is the most frequent in Mount Lena, accounting for 27.0% of all households.
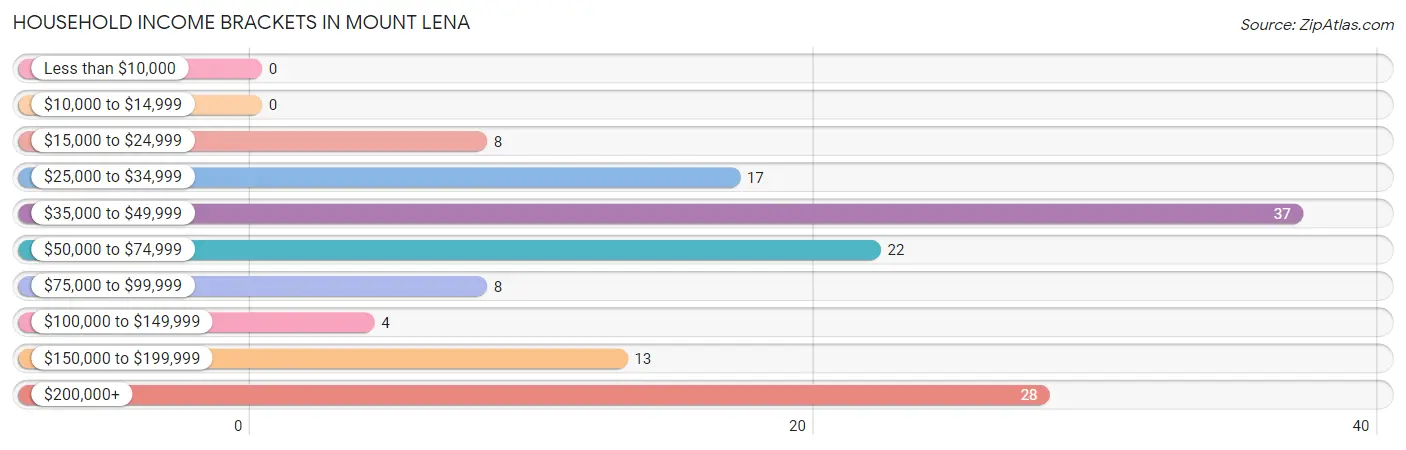
| Income Bracket | # Households | % Households |
| Less than $10,000 | 0 | 0.0% |
| $10,000 to $14,999 | 0 | 0.0% |
| $15,000 to $24,999 | 8 | 5.8% |
| $25,000 to $34,999 | 17 | 12.4% |
| $35,000 to $49,999 | 37 | 27.0% |
| $50,000 to $74,999 | 22 | 16.1% |
| $75,000 to $99,999 | 8 | 5.8% |
| $100,000 to $149,999 | 4 | 2.9% |
| $150,000 to $199,999 | 13 | 9.5% |
| $200,000+ | 28 | 20.4% |
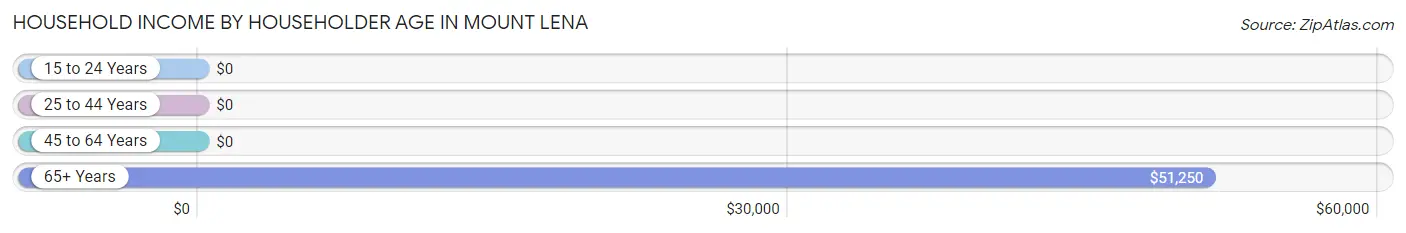
Household Income by Householder Age in Mount Lena
The median household income in Mount Lena is $51,625, with the highest median household income of $51,250 found in the 65+ years age bracket for the primary householder. A total of 60 households (43.8%) fall into this category.
| Income Bracket | # Households | Median Income |
| 15 to 24 Years | 0 (0.0%) | $0 |
| 25 to 44 Years | 26 (19.0%) | $0 |
| 45 to 64 Years | 51 (37.2%) | $0 |
| 65+ Years | 60 (43.8%) | $51,250 |
| Total | 137 (100.0%) | $51,625 |
Poverty in Mount Lena
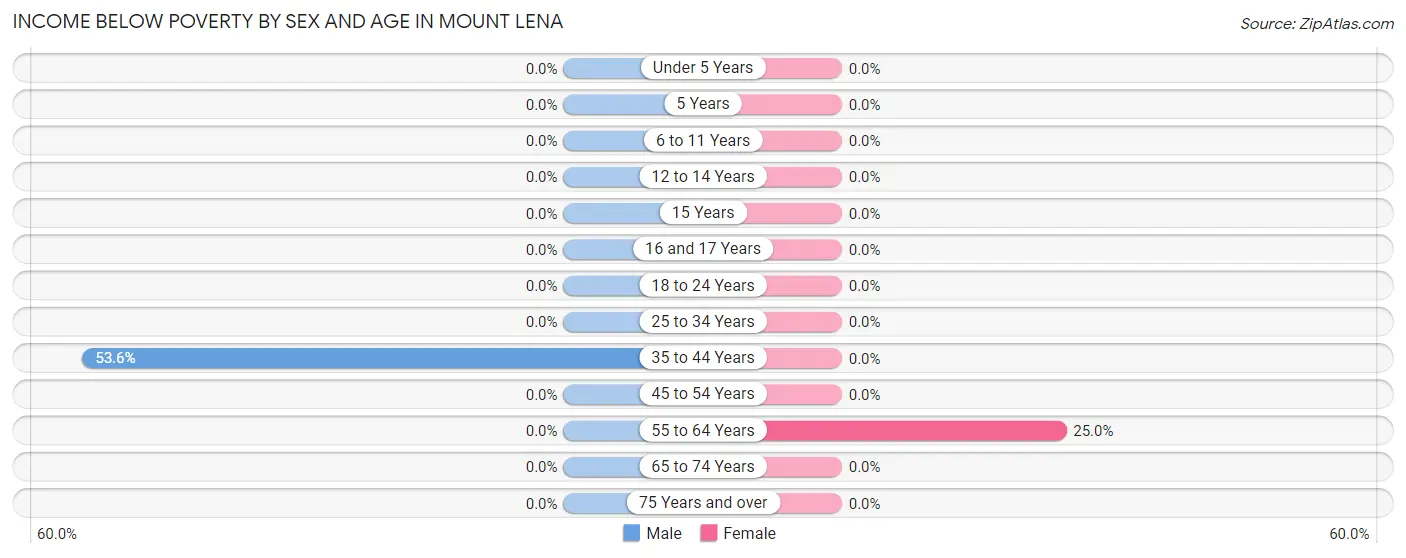
Income Below Poverty by Sex and Age in Mount Lena
With 8.8% poverty level for males and 2.3% for females among the residents of Mount Lena, 35 to 44 year old males and 55 to 64 year old females are the most vulnerable to poverty, with 15 males (53.6%) and 4 females (25.0%) in their respective age groups living below the poverty level.
| Age Bracket | Male | Female |
| Under 5 Years | 0 (0.0%) | 0 (0.0%) |
| 5 Years | 0 (0.0%) | 0 (0.0%) |
| 6 to 11 Years | 0 (0.0%) | 0 (0.0%) |
| 12 to 14 Years | 0 (0.0%) | 0 (0.0%) |
| 15 Years | 0 (0.0%) | 0 (0.0%) |
| 16 and 17 Years | 0 (0.0%) | 0 (0.0%) |
| 18 to 24 Years | 0 (0.0%) | 0 (0.0%) |
| 25 to 34 Years | 0 (0.0%) | 0 (0.0%) |
| 35 to 44 Years | 15 (53.6%) | 0 (0.0%) |
| 45 to 54 Years | 0 (0.0%) | 0 (0.0%) |
| 55 to 64 Years | 0 (0.0%) | 4 (25.0%) |
| 65 to 74 Years | 0 (0.0%) | 0 (0.0%) |
| 75 Years and over | 0 (0.0%) | 0 (0.0%) |
| Total | 15 (8.8%) | 4 (2.3%) |
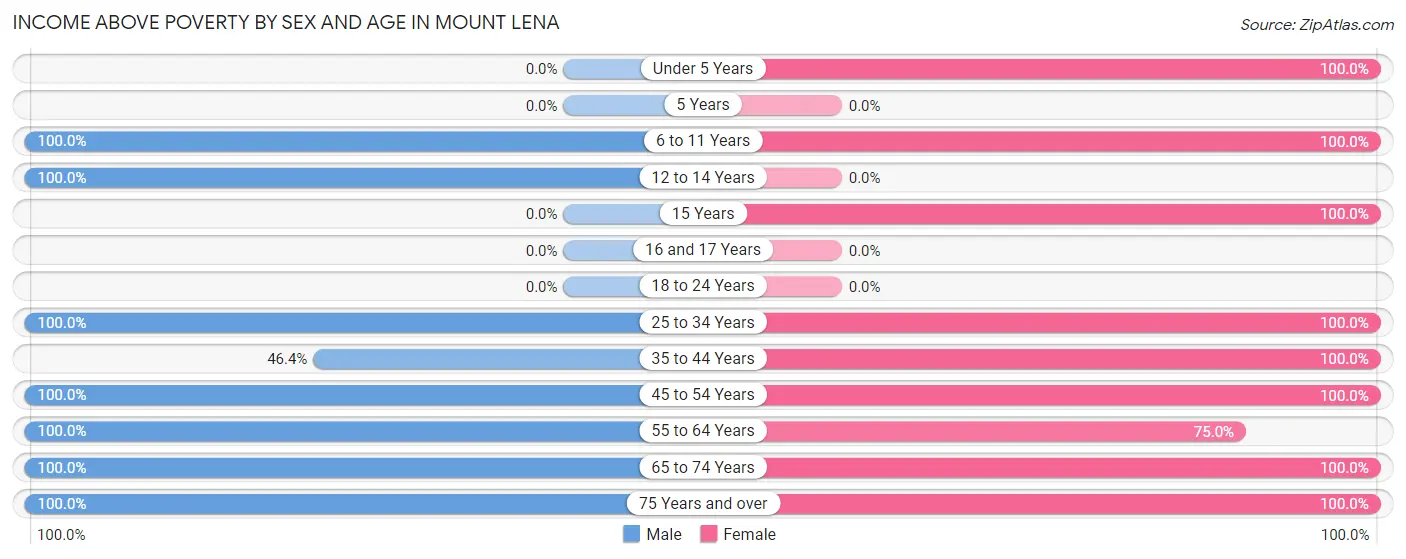
Income Above Poverty by Sex and Age in Mount Lena
According to the poverty statistics in Mount Lena, males aged 6 to 11 years and females aged under 5 years are the age groups that are most secure financially, with 100.0% of males and 100.0% of females in these age groups living above the poverty line.
| Age Bracket | Male | Female |
| Under 5 Years | 0 (0.0%) | 36 (100.0%) |
| 5 Years | 0 (0.0%) | 0 (0.0%) |
| 6 to 11 Years | 21 (100.0%) | 10 (100.0%) |
| 12 to 14 Years | 7 (100.0%) | 0 (0.0%) |
| 15 Years | 0 (0.0%) | 5 (100.0%) |
| 16 and 17 Years | 0 (0.0%) | 0 (0.0%) |
| 18 to 24 Years | 0 (0.0%) | 0 (0.0%) |
| 25 to 34 Years | 9 (100.0%) | 29 (100.0%) |
| 35 to 44 Years | 13 (46.4%) | 4 (100.0%) |
| 45 to 54 Years | 53 (100.0%) | 11 (100.0%) |
| 55 to 64 Years | 13 (100.0%) | 12 (75.0%) |
| 65 to 74 Years | 23 (100.0%) | 44 (100.0%) |
| 75 Years and over | 16 (100.0%) | 18 (100.0%) |
| Total | 155 (91.2%) | 169 (97.7%) |
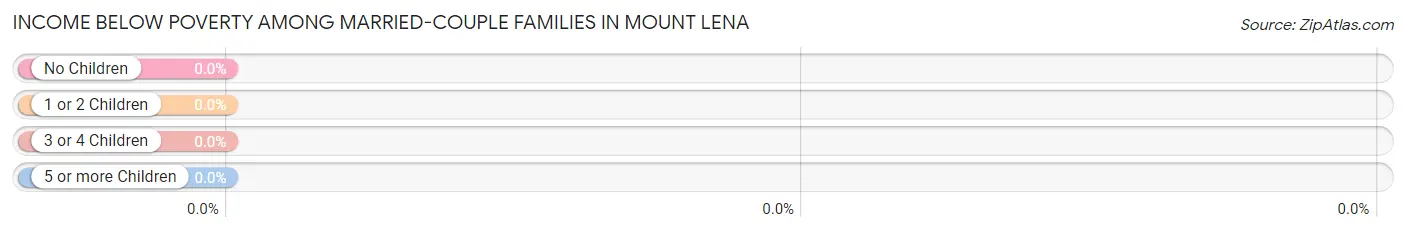
Income Below Poverty Among Married-Couple Families in Mount Lena
| Children | Above Poverty | Below Poverty |
| No Children | 57 (100.0%) | 0 (0.0%) |
| 1 or 2 Children | 11 (100.0%) | 0 (0.0%) |
| 3 or 4 Children | 9 (100.0%) | 0 (0.0%) |
| 5 or more Children | 0 (0.0%) | 0 (0.0%) |
| Total | 77 (100.0%) | 0 (0.0%) |
Income Below Poverty Among Single-Parent Households in Mount Lena
| Children | Single Father | Single Mother |
| No Children | 0 (0.0%) | 0 (0.0%) |
| 1 or 2 Children | 0 (0.0%) | 0 (0.0%) |
| 3 or 4 Children | 0 (0.0%) | 0 (0.0%) |
| 5 or more Children | 0 (0.0%) | 0 (0.0%) |
| Total | 0 (0.0%) | 0 (0.0%) |
Income Below Poverty Among Married-Couple vs Single-Parent Households in Mount Lena
| Children | Married-Couple Families | Single-Parent Households |
| No Children | 0 (0.0%) | 0 (0.0%) |
| 1 or 2 Children | 0 (0.0%) | 0 (0.0%) |
| 3 or 4 Children | 0 (0.0%) | 0 (0.0%) |
| 5 or more Children | 0 (0.0%) | 0 (0.0%) |
| Total | 0 (0.0%) | 0 (0.0%) |
Race in Mount Lena
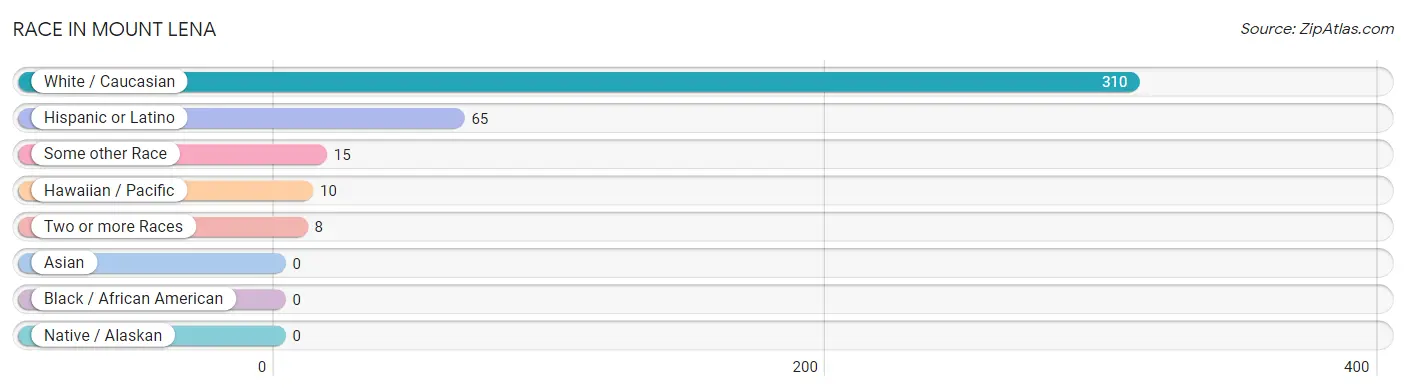
The most populous races in Mount Lena are White / Caucasian (310 | 90.4%), Hispanic or Latino (65 | 19.0%), and Some other Race (15 | 4.4%).
| Race | # Population | % Population |
| Asian | 0 | 0.0% |
| Black / African American | 0 | 0.0% |
| Hawaiian / Pacific | 10 | 2.9% |
| Hispanic or Latino | 65 | 19.0% |
| Native / Alaskan | 0 | 0.0% |
| White / Caucasian | 310 | 90.4% |
| Two or more Races | 8 | 2.3% |
| Some other Race | 15 | 4.4% |
| Total | 343 | 100.0% |
Ancestry in Mount Lena
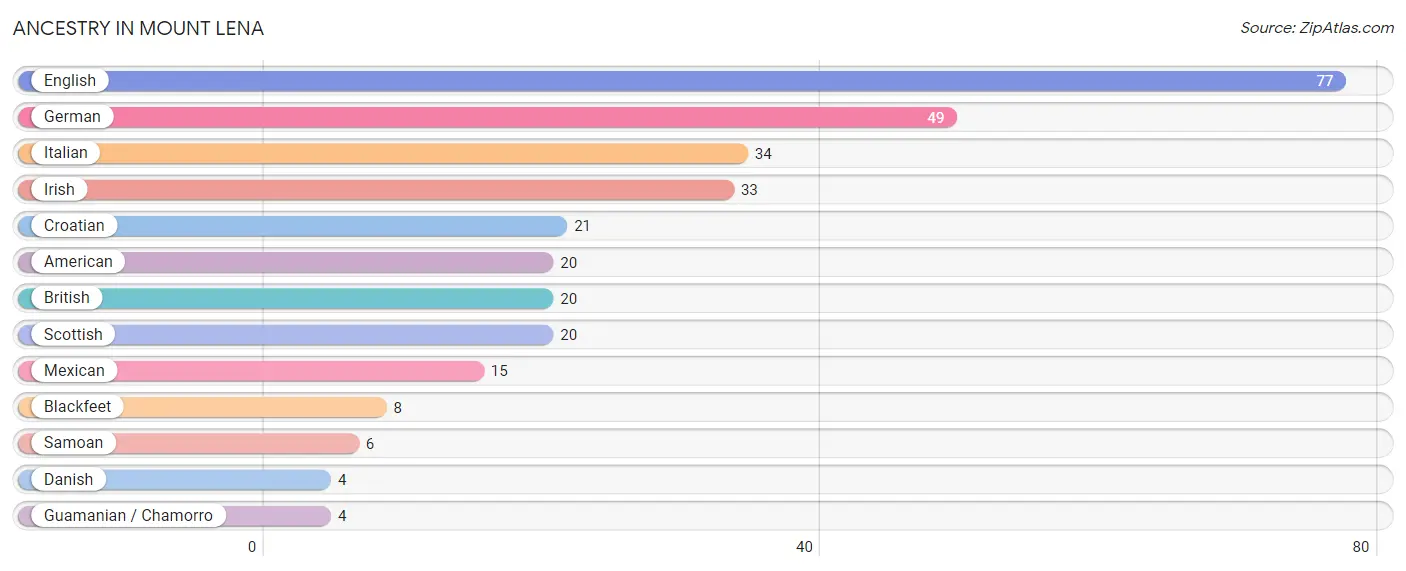
The most populous ancestries reported in Mount Lena are English (77 | 22.5%), German (49 | 14.3%), Italian (34 | 9.9%), Irish (33 | 9.6%), and Croatian (21 | 6.1%), together accounting for 62.4% of all Mount Lena residents.
| Ancestry | # Population | % Population |
| American | 20 | 5.8% |
| Blackfeet | 8 | 2.3% |
| British | 20 | 5.8% |
| Croatian | 21 | 6.1% |
| Danish | 4 | 1.2% |
| English | 77 | 22.5% |
| German | 49 | 14.3% |
| Guamanian / Chamorro | 4 | 1.2% |
| Irish | 33 | 9.6% |
| Italian | 34 | 9.9% |
| Mexican | 15 | 4.4% |
| Samoan | 6 | 1.8% |
| Scottish | 20 | 5.8% | View All 13 Rows |
Immigrants in Mount Lena
The most numerous immigrant groups reported in Mount Lena came from Central America (15 | 4.4%), Latin America (15 | 4.4%), Mexico (15 | 4.4%), Europe (4 | 1.2%), and Germany (4 | 1.2%), together accounting for 15.4% of all Mount Lena residents.
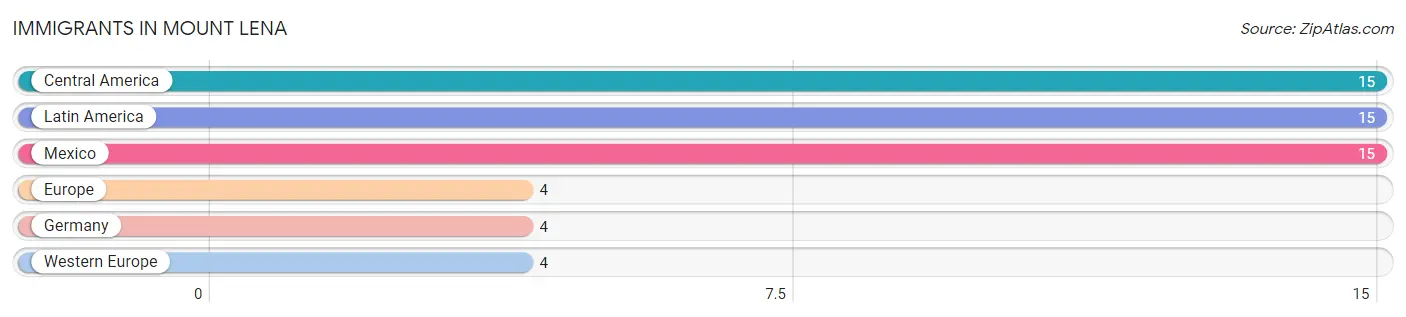
| Immigration Origin | # Population | % Population |
| Central America | 15 | 4.4% |
| Europe | 4 | 1.2% |
| Germany | 4 | 1.2% |
| Latin America | 15 | 4.4% |
| Mexico | 15 | 4.4% |
| Western Europe | 4 | 1.2% | View All 6 Rows |
Sex and Age in Mount Lena
Sex and Age in Mount Lena
The most populous age groups in Mount Lena are 45 to 49 Years (33 | 19.4%) for men and Under 5 Years (36 | 20.8%) for women.
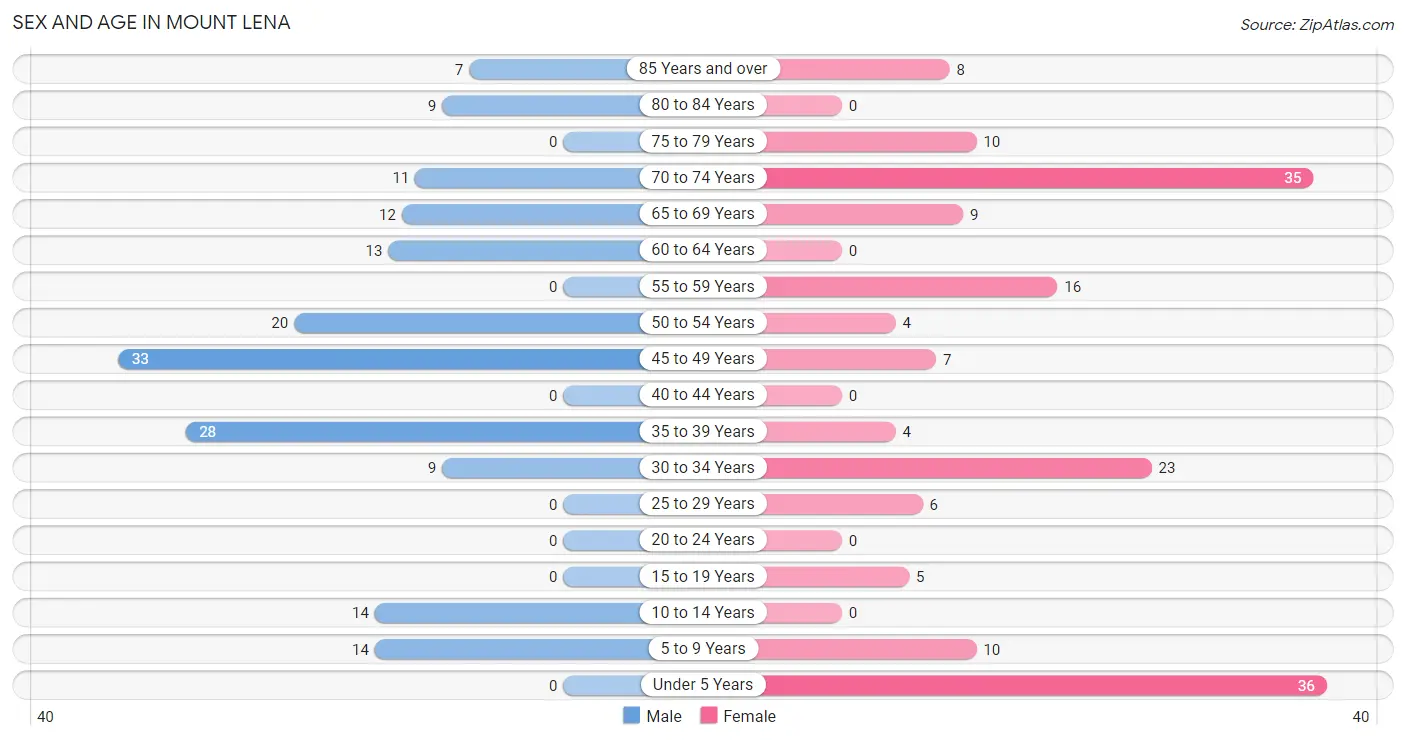
| Age Bracket | Male | Female |
| Under 5 Years | 0 (0.0%) | 36 (20.8%) |
| 5 to 9 Years | 14 (8.2%) | 10 (5.8%) |
| 10 to 14 Years | 14 (8.2%) | 0 (0.0%) |
| 15 to 19 Years | 0 (0.0%) | 5 (2.9%) |
| 20 to 24 Years | 0 (0.0%) | 0 (0.0%) |
| 25 to 29 Years | 0 (0.0%) | 6 (3.5%) |
| 30 to 34 Years | 9 (5.3%) | 23 (13.3%) |
| 35 to 39 Years | 28 (16.5%) | 4 (2.3%) |
| 40 to 44 Years | 0 (0.0%) | 0 (0.0%) |
| 45 to 49 Years | 33 (19.4%) | 7 (4.1%) |
| 50 to 54 Years | 20 (11.8%) | 4 (2.3%) |
| 55 to 59 Years | 0 (0.0%) | 16 (9.2%) |
| 60 to 64 Years | 13 (7.6%) | 0 (0.0%) |
| 65 to 69 Years | 12 (7.1%) | 9 (5.2%) |
| 70 to 74 Years | 11 (6.5%) | 35 (20.2%) |
| 75 to 79 Years | 0 (0.0%) | 10 (5.8%) |
| 80 to 84 Years | 9 (5.3%) | 0 (0.0%) |
| 85 Years and over | 7 (4.1%) | 8 (4.6%) |
| Total | 170 (100.0%) | 173 (100.0%) |
Families and Households in Mount Lena
Median Family Size in Mount Lena
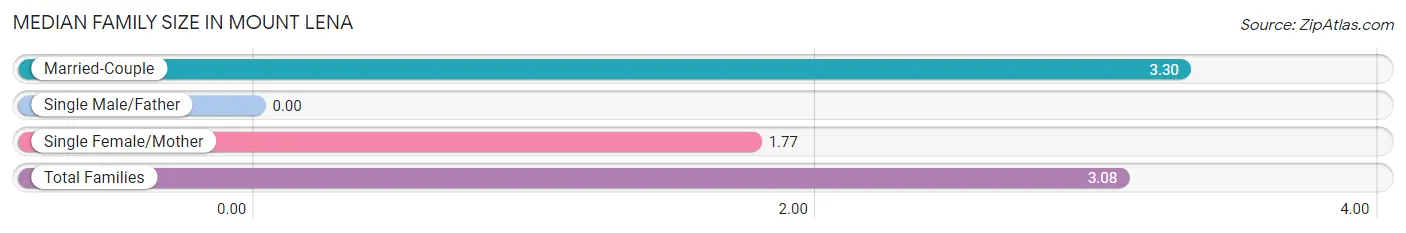
| Family Type | # Families | Family Size |
| Married-Couple | 77 (85.6%) | 3.30 |
| Single Male/Father | 0 (0.0%) | - |
| Single Female/Mother | 13 (14.4%) | 1.77 |
| Total Families | 90 (100.0%) | 3.08 |
Median Household Size in Mount Lena
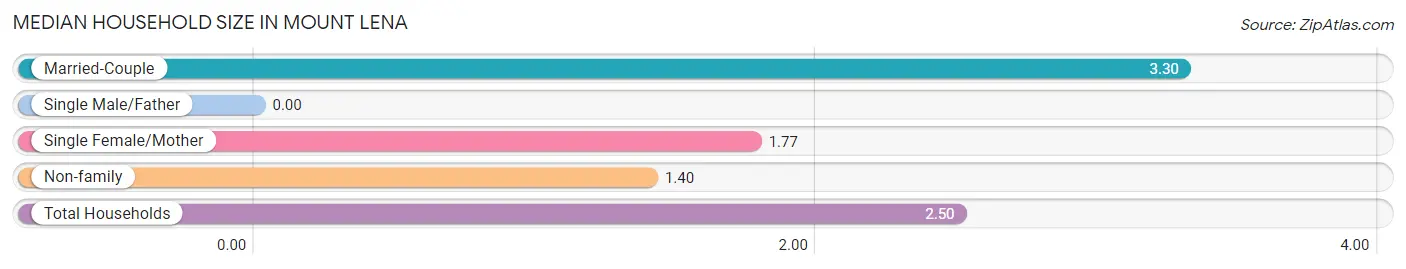
| Household Type | # Households | Household Size |
| Married-Couple | 77 (56.2%) | 3.30 |
| Single Male/Father | 0 (0.0%) | - |
| Single Female/Mother | 13 (9.5%) | 1.77 |
| Non-family | 47 (34.3%) | 1.40 |
| Total Households | 137 (100.0%) | 2.50 |
Household Size by Marriage Status in Mount Lena
Out of a total of 137 households in Mount Lena, 90 (65.7%) are family households, while 47 (34.3%) are nonfamily households. The most numerous type of family households are 2-person households, comprising 57, and the most common type of nonfamily households are 2-person households, comprising 24.
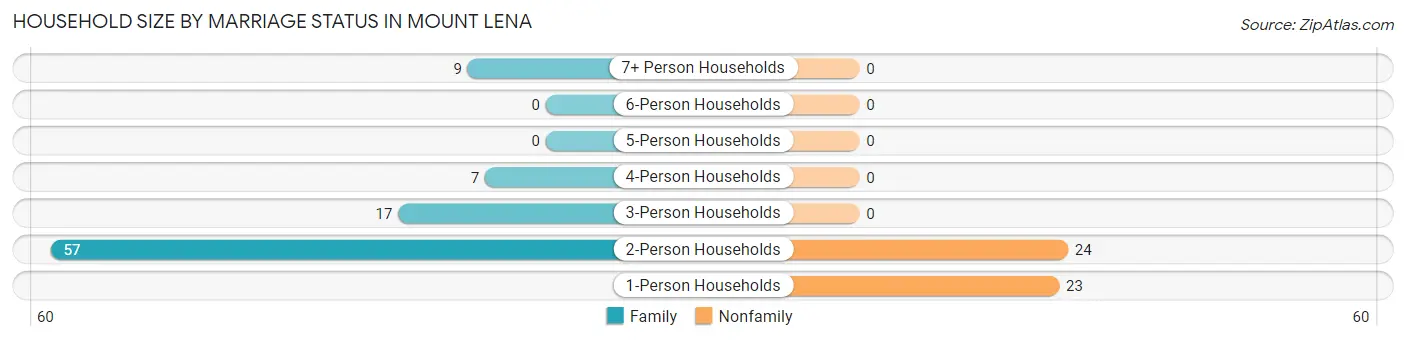
| Household Size | Family Households | Nonfamily Households |
| 1-Person Households | - | 23 (16.8%) |
| 2-Person Households | 57 (41.6%) | 24 (17.5%) |
| 3-Person Households | 17 (12.4%) | 0 (0.0%) |
| 4-Person Households | 7 (5.1%) | 0 (0.0%) |
| 5-Person Households | 0 (0.0%) | 0 (0.0%) |
| 6-Person Households | 0 (0.0%) | 0 (0.0%) |
| 7+ Person Households | 9 (6.6%) | 0 (0.0%) |
| Total | 90 (65.7%) | 47 (34.3%) |
Female Fertility in Mount Lena
Fertility by Age in Mount Lena
| Age Bracket | Women with Births | Births / 1,000 Women |
| 15 to 19 years | 0 (0.0%) | 0.0 |
| 20 to 34 years | 0 (0.0%) | 0.0 |
| 35 to 50 years | 0 (0.0%) | 0.0 |
| Total | 0 (0.0%) | 0.0 |
Fertility by Age by Marriage Status in Mount Lena
| Age Bracket | Married | Unmarried |
| 15 to 19 years | 0 (0.0%) | 0 (0.0%) |
| 20 to 34 years | 0 (0.0%) | 0 (0.0%) |
| 35 to 50 years | 0 (0.0%) | 0 (0.0%) |
| Total | 0 (0.0%) | 0 (0.0%) |
Fertility by Education in Mount Lena
| Educational Attainment | Women with Births | Births / 1,000 Women |
| Less than High School | 0 (0.0%) | 0.0 |
| High School Diploma | 0 (0.0%) | 0.0 |
| College or Associate's Degree | 0 (0.0%) | 0.0 |
| Bachelor's Degree | 0 (0.0%) | 0.0 |
| Graduate Degree | 0 (0.0%) | 0.0 |
| Total | 0 (0.0%) | 0.0 |
Fertility by Education by Marriage Status in Mount Lena
| Educational Attainment | Married | Unmarried |
| Less than High School | 0 (0.0%) | 0 (0.0%) |
| High School Diploma | 0 (0.0%) | 0 (0.0%) |
| College or Associate's Degree | 0 (0.0%) | 0 (0.0%) |
| Bachelor's Degree | 0 (0.0%) | 0 (0.0%) |
| Graduate Degree | 0 (0.0%) | 0 (0.0%) |
| Total | 0 (0.0%) | 0 (0.0%) |
Employment Characteristics in Mount Lena
Employment by Class of Employer in Mount Lena
Among the 171 employed individuals in Mount Lena, private company employees (135 | 78.9%), not-for-profit organizations (24 | 14.0%), and federal government employees (12 | 7.0%) make up the most common classes of employment.
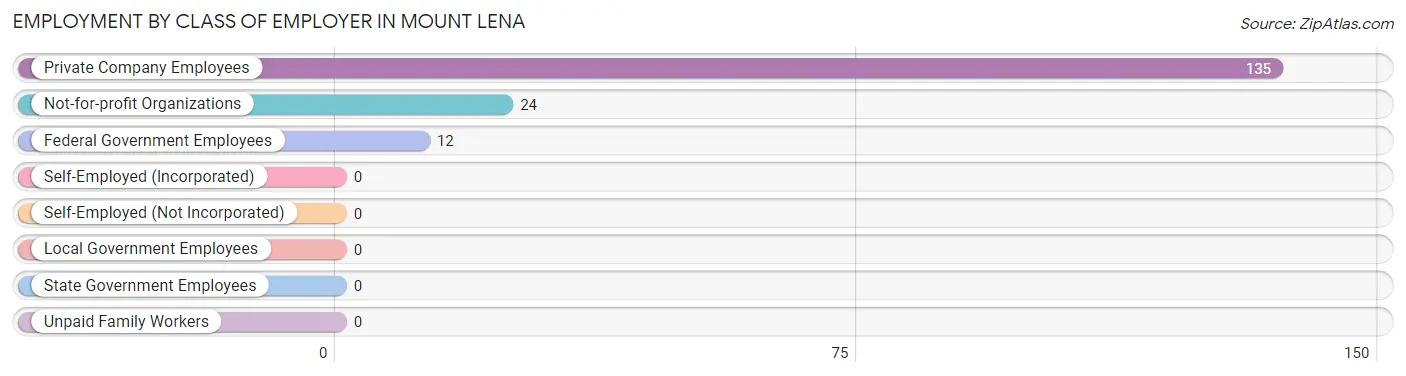
| Employer Class | # Employees | % Employees |
| Private Company Employees | 135 | 78.9% |
| Self-Employed (Incorporated) | 0 | 0.0% |
| Self-Employed (Not Incorporated) | 0 | 0.0% |
| Not-for-profit Organizations | 24 | 14.0% |
| Local Government Employees | 0 | 0.0% |
| State Government Employees | 0 | 0.0% |
| Federal Government Employees | 12 | 7.0% |
| Unpaid Family Workers | 0 | 0.0% |
| Total | 171 | 100.0% |
Employment Status by Age in Mount Lena
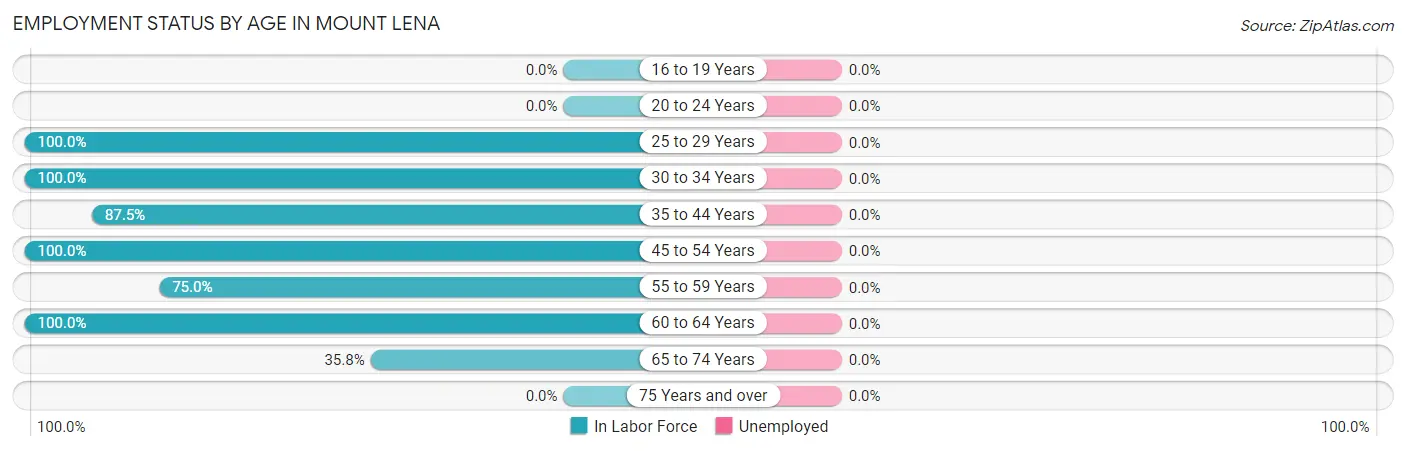
| Age Bracket | In Labor Force | Unemployed |
| 16 to 19 Years | 0 (0.0%) | 0 (0.0%) |
| 20 to 24 Years | 0 (0.0%) | 0 (0.0%) |
| 25 to 29 Years | 6 (100.0%) | 0 (0.0%) |
| 30 to 34 Years | 32 (100.0%) | 0 (0.0%) |
| 35 to 44 Years | 28 (87.5%) | 0 (0.0%) |
| 45 to 54 Years | 64 (100.0%) | 0 (0.0%) |
| 55 to 59 Years | 12 (75.0%) | 0 (0.0%) |
| 60 to 64 Years | 13 (100.0%) | 0 (0.0%) |
| 65 to 74 Years | 24 (35.8%) | 0 (0.0%) |
| 75 Years and over | 0 (0.0%) | 0 (0.0%) |
| Total | 179 (67.8%) | 0 (0.0%) |
Employment Status by Educational Attainment in Mount Lena
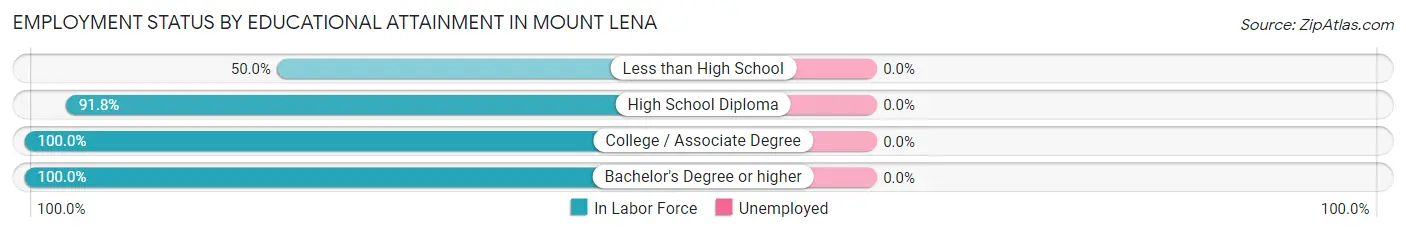
| Educational Attainment | In Labor Force | Unemployed |
| Less than High School | 4 (50.0%) | 0 (0.0%) |
| High School Diploma | 45 (91.8%) | 0 (0.0%) |
| College / Associate Degree | 54 (100.0%) | 0 (0.0%) |
| Bachelor's Degree or higher | 52 (100.0%) | 0 (0.0%) |
| Total | 155 (95.1%) | 0 (0.0%) |
Employment Occupations by Sex in Mount Lena
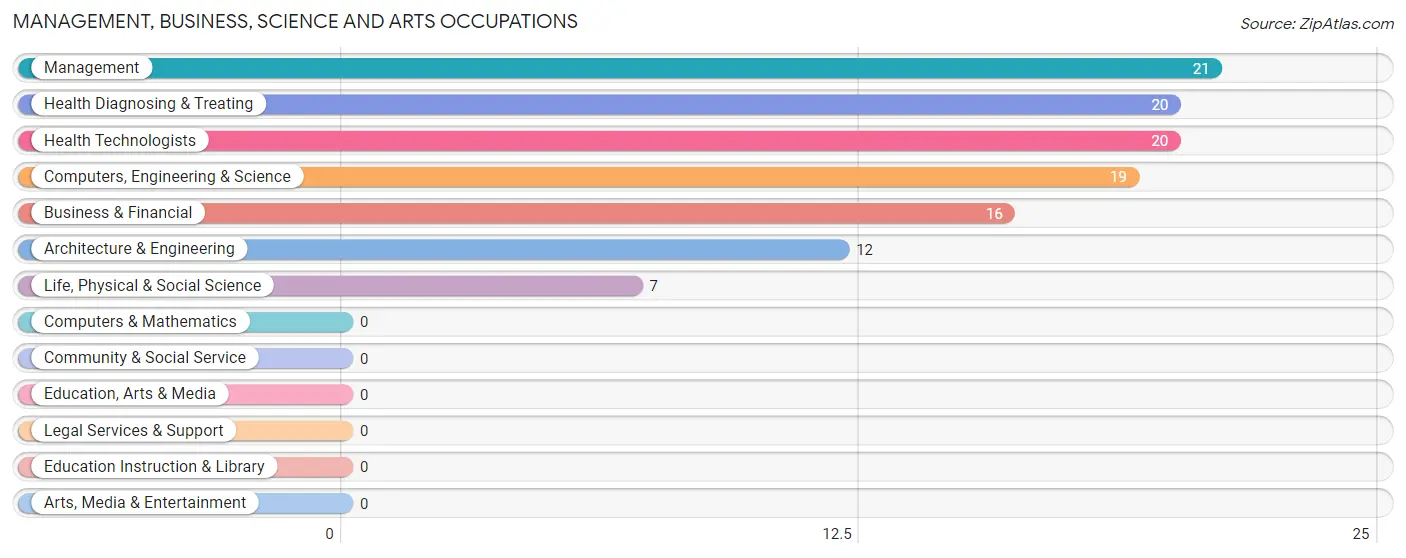
Management, Business, Science and Arts Occupations
The most common Management, Business, Science and Arts occupations in Mount Lena are Management (21 | 11.7%), Health Diagnosing & Treating (20 | 11.2%), Health Technologists (20 | 11.2%), Computers, Engineering & Science (19 | 10.6%), and Business & Financial (16 | 8.9%).
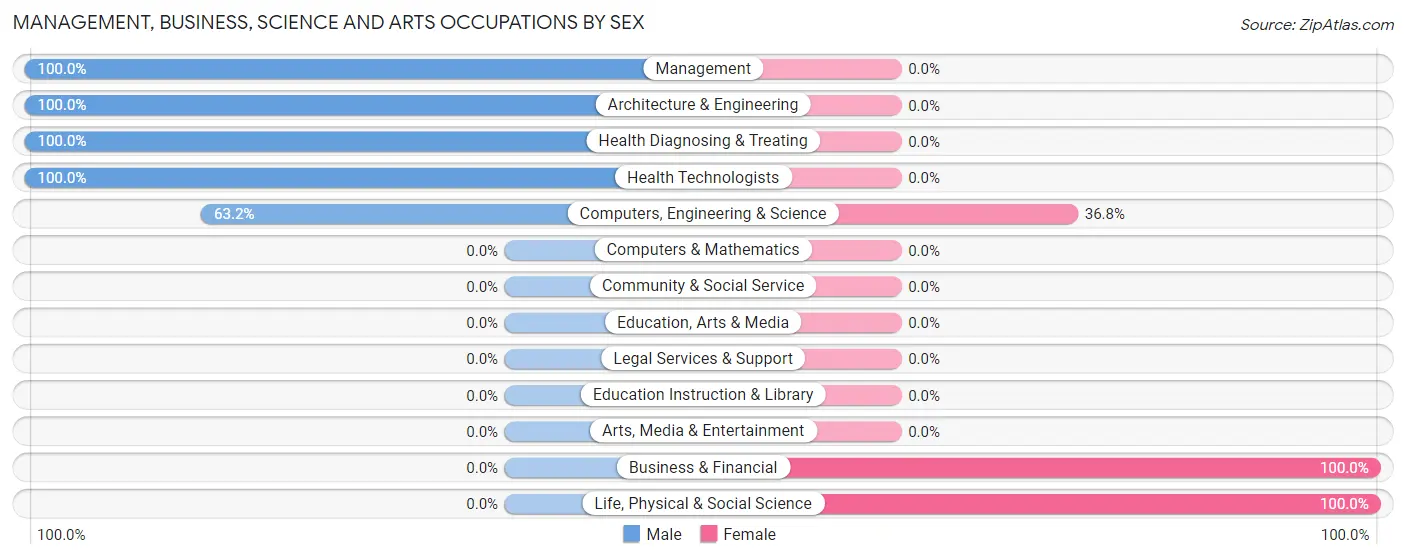
Management, Business, Science and Arts Occupations by Sex
Within the Management, Business, Science and Arts occupations in Mount Lena, the most male-oriented occupations are Management (100.0%), Architecture & Engineering (100.0%), and Health Diagnosing & Treating (100.0%), while the most female-oriented occupations are Business & Financial (100.0%), Life, Physical & Social Science (100.0%), and Computers, Engineering & Science (36.8%).
| Occupation | Male | Female |
| Management | 21 (100.0%) | 0 (0.0%) |
| Business & Financial | 0 (0.0%) | 16 (100.0%) |
| Computers, Engineering & Science | 12 (63.2%) | 7 (36.8%) |
| Computers & Mathematics | 0 (0.0%) | 0 (0.0%) |
| Architecture & Engineering | 12 (100.0%) | 0 (0.0%) |
| Life, Physical & Social Science | 0 (0.0%) | 7 (100.0%) |
| Community & Social Service | 0 (0.0%) | 0 (0.0%) |
| Education, Arts & Media | 0 (0.0%) | 0 (0.0%) |
| Legal Services & Support | 0 (0.0%) | 0 (0.0%) |
| Education Instruction & Library | 0 (0.0%) | 0 (0.0%) |
| Arts, Media & Entertainment | 0 (0.0%) | 0 (0.0%) |
| Health Diagnosing & Treating | 20 (100.0%) | 0 (0.0%) |
| Health Technologists | 20 (100.0%) | 0 (0.0%) |
| Total (Category) | 53 (69.7%) | 23 (30.3%) |
| Total (Overall) | 115 (64.2%) | 64 (35.7%) |
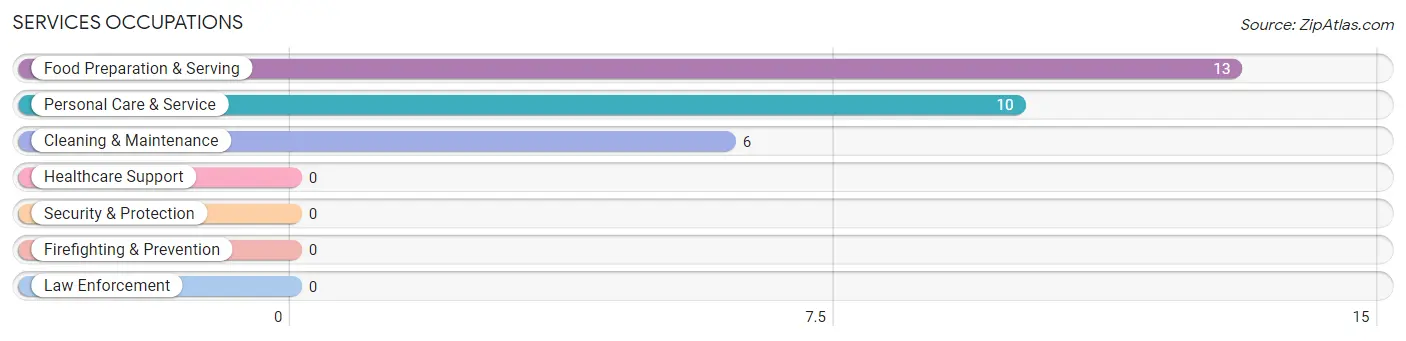
Services Occupations
The most common Services occupations in Mount Lena are Food Preparation & Serving (13 | 7.3%), Personal Care & Service (10 | 5.6%), and Cleaning & Maintenance (6 | 3.4%).
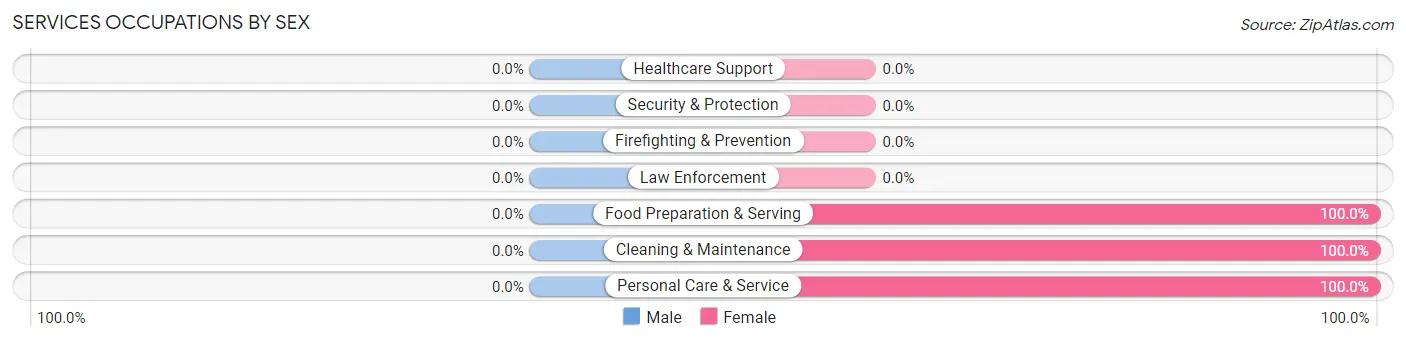
Services Occupations by Sex
| Occupation | Male | Female |
| Healthcare Support | 0 (0.0%) | 0 (0.0%) |
| Security & Protection | 0 (0.0%) | 0 (0.0%) |
| Firefighting & Prevention | 0 (0.0%) | 0 (0.0%) |
| Law Enforcement | 0 (0.0%) | 0 (0.0%) |
| Food Preparation & Serving | 0 (0.0%) | 13 (100.0%) |
| Cleaning & Maintenance | 0 (0.0%) | 6 (100.0%) |
| Personal Care & Service | 0 (0.0%) | 10 (100.0%) |
| Total (Category) | 0 (0.0%) | 29 (100.0%) |
| Total (Overall) | 115 (64.2%) | 64 (35.7%) |
Sales and Office Occupations
The most common Sales and Office occupations in Mount Lena are Sales & Related (13 | 7.3%), and Office & Administration (12 | 6.7%).
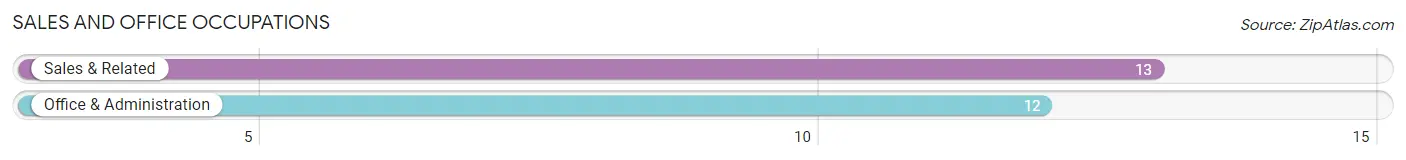
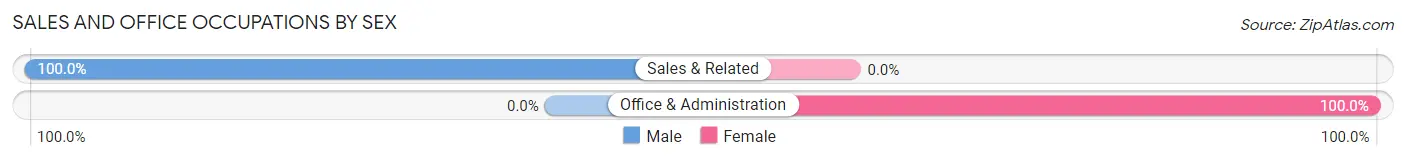
Sales and Office Occupations by Sex
| Occupation | Male | Female |
| Sales & Related | 13 (100.0%) | 0 (0.0%) |
| Office & Administration | 0 (0.0%) | 12 (100.0%) |
| Total (Category) | 13 (52.0%) | 12 (48.0%) |
| Total (Overall) | 115 (64.2%) | 64 (35.7%) |
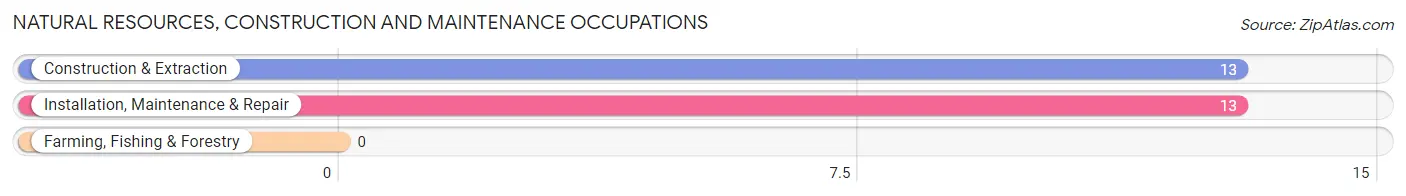
Natural Resources, Construction and Maintenance Occupations
The most common Natural Resources, Construction and Maintenance occupations in Mount Lena are Construction & Extraction (13 | 7.3%), and Installation, Maintenance & Repair (13 | 7.3%).
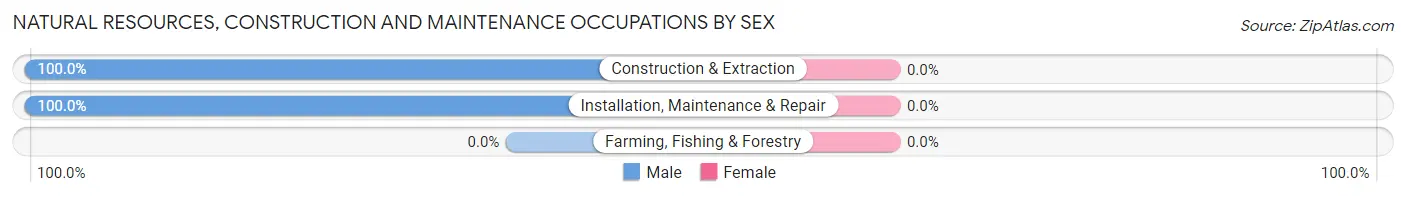
Natural Resources, Construction and Maintenance Occupations by Sex
| Occupation | Male | Female |
| Farming, Fishing & Forestry | 0 (0.0%) | 0 (0.0%) |
| Construction & Extraction | 13 (100.0%) | 0 (0.0%) |
| Installation, Maintenance & Repair | 13 (100.0%) | 0 (0.0%) |
| Total (Category) | 26 (100.0%) | 0 (0.0%) |
| Total (Overall) | 115 (64.2%) | 64 (35.7%) |
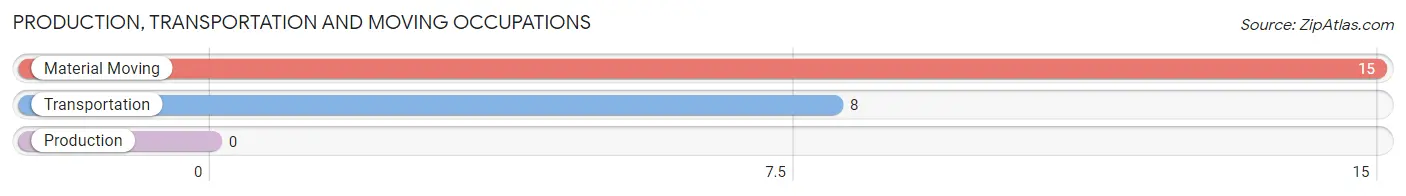
Production, Transportation and Moving Occupations
The most common Production, Transportation and Moving occupations in Mount Lena are Material Moving (15 | 8.4%), and Transportation (8 | 4.5%).
Production, Transportation and Moving Occupations by Sex
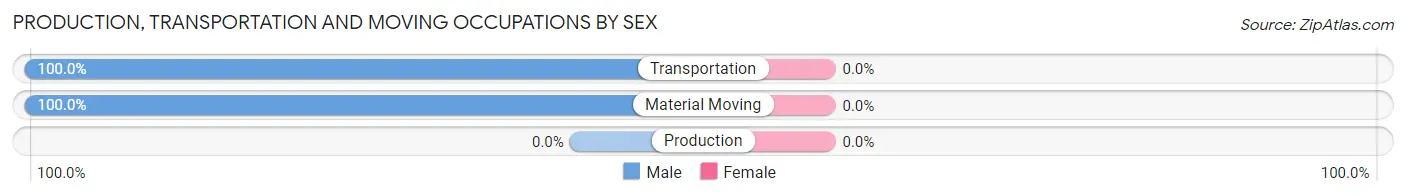
| Occupation | Male | Female |
| Production | 0 (0.0%) | 0 (0.0%) |
| Transportation | 8 (100.0%) | 0 (0.0%) |
| Material Moving | 15 (100.0%) | 0 (0.0%) |
| Total (Category) | 23 (100.0%) | 0 (0.0%) |
| Total (Overall) | 115 (64.2%) | 64 (35.7%) |
Employment Industries by Sex in Mount Lena
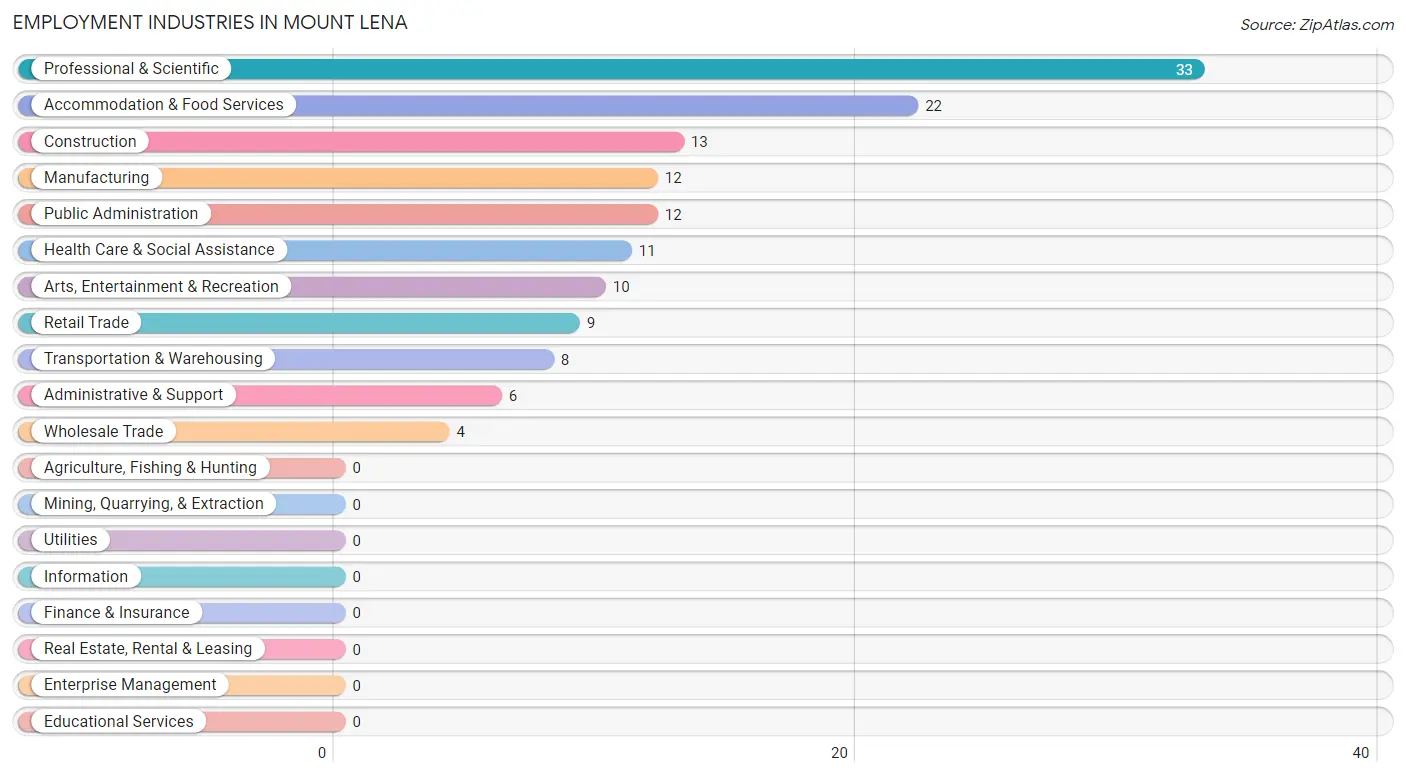
Employment Industries in Mount Lena
The major employment industries in Mount Lena include Professional & Scientific (33 | 18.4%), Accommodation & Food Services (22 | 12.3%), Construction (13 | 7.3%), Manufacturing (12 | 6.7%), and Public Administration (12 | 6.7%).
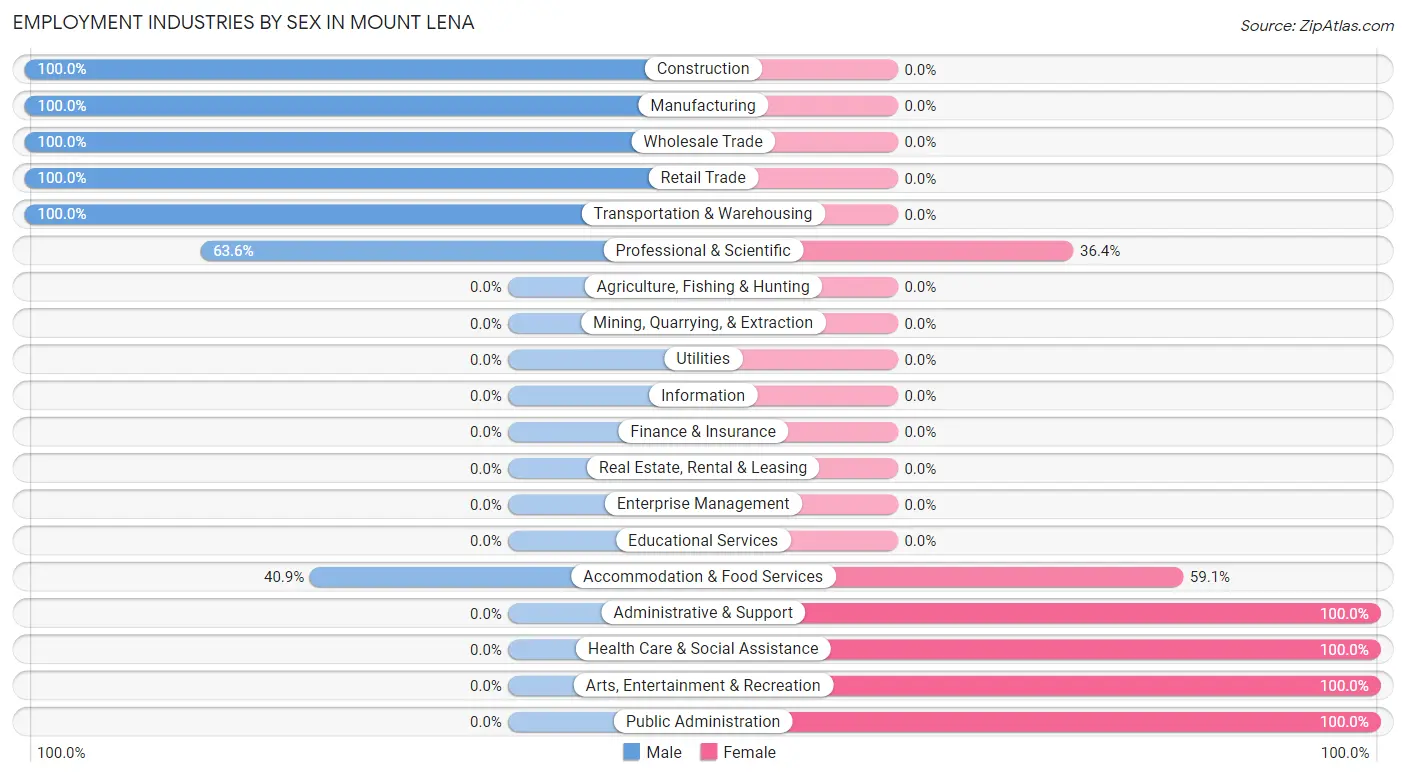
Employment Industries by Sex in Mount Lena
The Mount Lena industries that see more men than women are Construction (100.0%), Manufacturing (100.0%), and Wholesale Trade (100.0%), whereas the industries that tend to have a higher number of women are Administrative & Support (100.0%), Health Care & Social Assistance (100.0%), and Arts, Entertainment & Recreation (100.0%).
| Industry | Male | Female |
| Agriculture, Fishing & Hunting | 0 (0.0%) | 0 (0.0%) |
| Mining, Quarrying, & Extraction | 0 (0.0%) | 0 (0.0%) |
| Construction | 13 (100.0%) | 0 (0.0%) |
| Manufacturing | 12 (100.0%) | 0 (0.0%) |
| Wholesale Trade | 4 (100.0%) | 0 (0.0%) |
| Retail Trade | 9 (100.0%) | 0 (0.0%) |
| Transportation & Warehousing | 8 (100.0%) | 0 (0.0%) |
| Utilities | 0 (0.0%) | 0 (0.0%) |
| Information | 0 (0.0%) | 0 (0.0%) |
| Finance & Insurance | 0 (0.0%) | 0 (0.0%) |
| Real Estate, Rental & Leasing | 0 (0.0%) | 0 (0.0%) |
| Professional & Scientific | 21 (63.6%) | 12 (36.4%) |
| Enterprise Management | 0 (0.0%) | 0 (0.0%) |
| Administrative & Support | 0 (0.0%) | 6 (100.0%) |
| Educational Services | 0 (0.0%) | 0 (0.0%) |
| Health Care & Social Assistance | 0 (0.0%) | 11 (100.0%) |
| Arts, Entertainment & Recreation | 0 (0.0%) | 10 (100.0%) |
| Accommodation & Food Services | 9 (40.9%) | 13 (59.1%) |
| Public Administration | 0 (0.0%) | 12 (100.0%) |
| Total | 115 (64.2%) | 64 (35.7%) |
Education in Mount Lena
School Enrollment in Mount Lena
The most common levels of schooling among the 43 students in Mount Lena are elementary school (14 | 32.6%), middle school (14 | 32.6%), and kindergarten (10 | 23.3%).
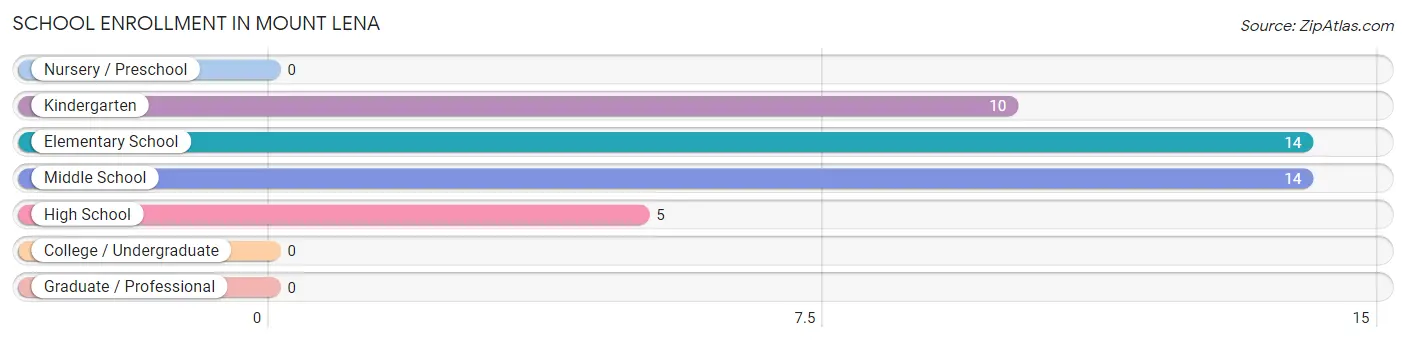
| School Level | # Students | % Students |
| Nursery / Preschool | 0 | 0.0% |
| Kindergarten | 10 | 23.3% |
| Elementary School | 14 | 32.6% |
| Middle School | 14 | 32.6% |
| High School | 5 | 11.6% |
| College / Undergraduate | 0 | 0.0% |
| Graduate / Professional | 0 | 0.0% |
| Total | 43 | 100.0% |
School Enrollment by Age by Funding Source in Mount Lena
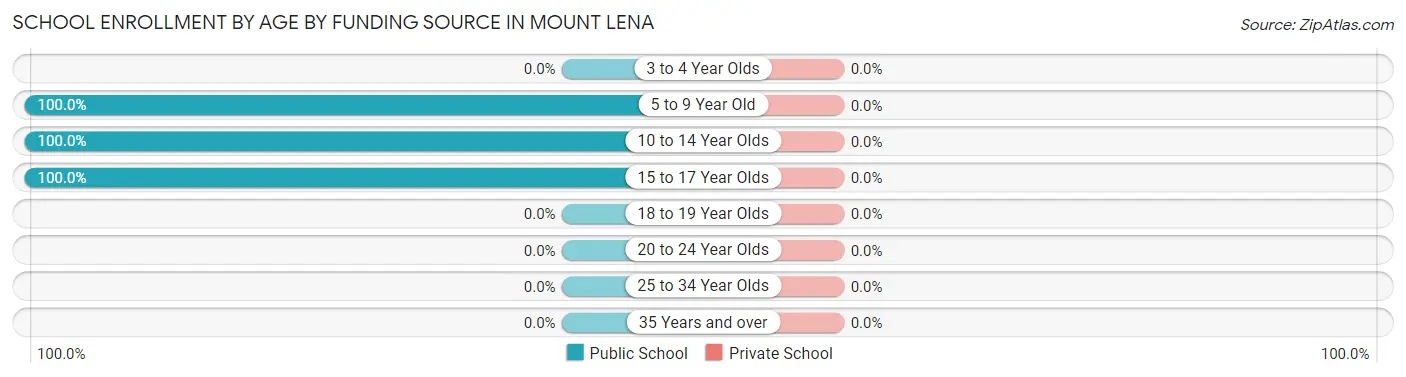
| Age Bracket | Public School | Private School |
| 3 to 4 Year Olds | 0 (0.0%) | 0 (0.0%) |
| 5 to 9 Year Old | 24 (100.0%) | 0 (0.0%) |
| 10 to 14 Year Olds | 14 (100.0%) | 0 (0.0%) |
| 15 to 17 Year Olds | 5 (100.0%) | 0 (0.0%) |
| 18 to 19 Year Olds | 0 (0.0%) | 0 (0.0%) |
| 20 to 24 Year Olds | 0 (0.0%) | 0 (0.0%) |
| 25 to 34 Year Olds | 0 (0.0%) | 0 (0.0%) |
| 35 Years and over | 0 (0.0%) | 0 (0.0%) |
| Total | 43 (100.0%) | 0 (0.0%) |
Educational Attainment by Field of Study in Mount Lena
Business (32 | 61.5%), visual & performing arts (13 | 25.0%), and literature & languages (7 | 13.5%) are the most common fields of study among 52 individuals in Mount Lena who have obtained a bachelor's degree or higher.
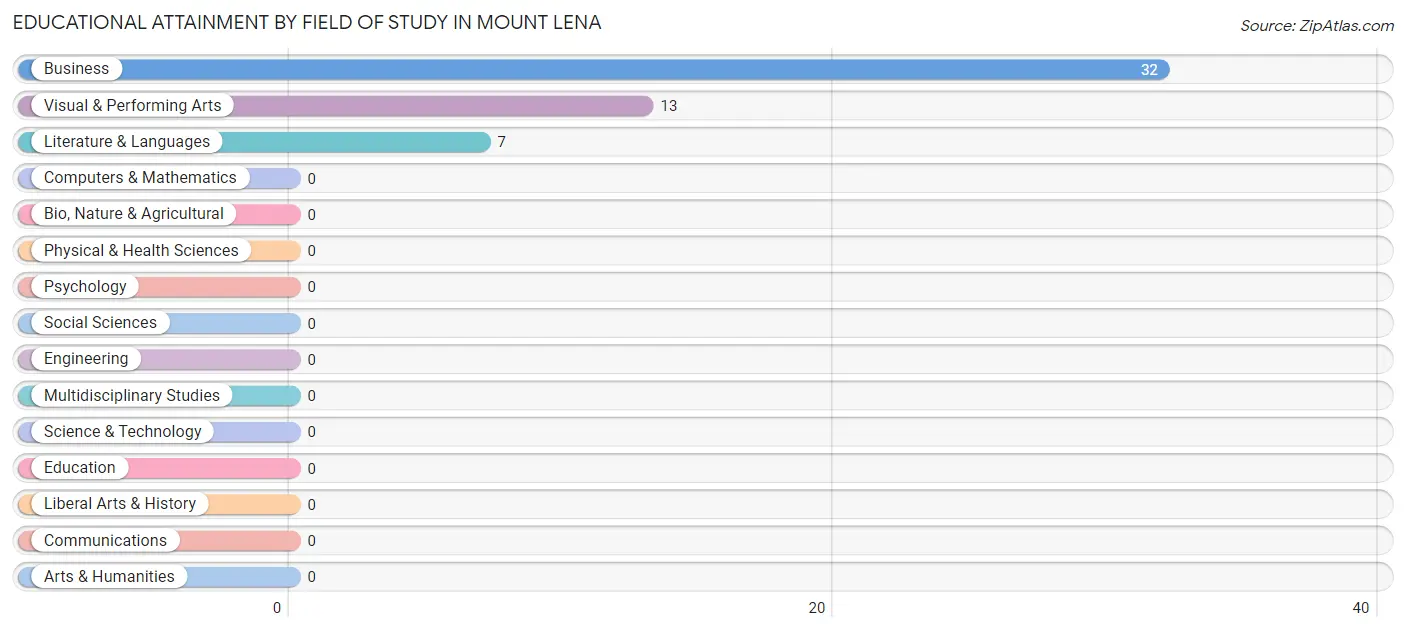
| Field of Study | # Graduates | % Graduates |
| Computers & Mathematics | 0 | 0.0% |
| Bio, Nature & Agricultural | 0 | 0.0% |
| Physical & Health Sciences | 0 | 0.0% |
| Psychology | 0 | 0.0% |
| Social Sciences | 0 | 0.0% |
| Engineering | 0 | 0.0% |
| Multidisciplinary Studies | 0 | 0.0% |
| Science & Technology | 0 | 0.0% |
| Business | 32 | 61.5% |
| Education | 0 | 0.0% |
| Literature & Languages | 7 | 13.5% |
| Liberal Arts & History | 0 | 0.0% |
| Visual & Performing Arts | 13 | 25.0% |
| Communications | 0 | 0.0% |
| Arts & Humanities | 0 | 0.0% |
| Total | 52 | 100.0% |
Transportation & Commute in Mount Lena
Vehicle Availability by Sex in Mount Lena
The most prevalent vehicle ownership categories in Mount Lena are males with 2 vehicles (64, accounting for 59.8%) and females with 2 vehicles (25, making up 100.0%).
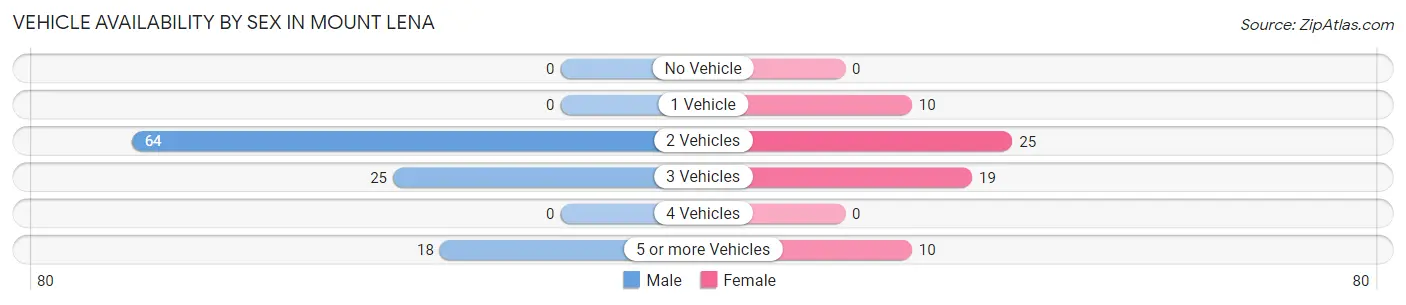
| Vehicles Available | Male | Female |
| No Vehicle | 0 (0.0%) | 0 (0.0%) |
| 1 Vehicle | 0 (0.0%) | 10 (15.6%) |
| 2 Vehicles | 64 (59.8%) | 25 (39.1%) |
| 3 Vehicles | 25 (23.4%) | 19 (29.7%) |
| 4 Vehicles | 0 (0.0%) | 0 (0.0%) |
| 5 or more Vehicles | 18 (16.8%) | 10 (15.6%) |
| Total | 107 (100.0%) | 64 (100.0%) |
Commute Time in Mount Lena
The most frequently occuring commute durations in Mount Lena are 30 to 34 minutes (45 commuters, 34.6%), 20 to 24 minutes (32 commuters, 24.6%), and 90 or more minutes (24 commuters, 18.5%).
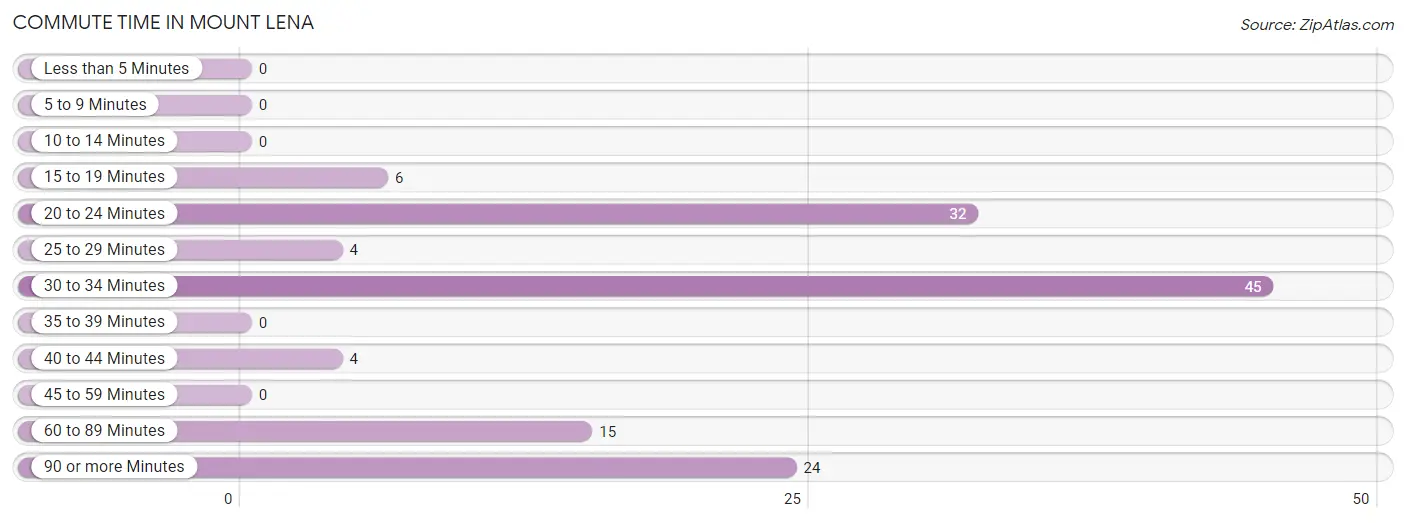
| Commute Time | # Commuters | % Commuters |
| Less than 5 Minutes | 0 | 0.0% |
| 5 to 9 Minutes | 0 | 0.0% |
| 10 to 14 Minutes | 0 | 0.0% |
| 15 to 19 Minutes | 6 | 4.6% |
| 20 to 24 Minutes | 32 | 24.6% |
| 25 to 29 Minutes | 4 | 3.1% |
| 30 to 34 Minutes | 45 | 34.6% |
| 35 to 39 Minutes | 0 | 0.0% |
| 40 to 44 Minutes | 4 | 3.1% |
| 45 to 59 Minutes | 0 | 0.0% |
| 60 to 89 Minutes | 15 | 11.5% |
| 90 or more Minutes | 24 | 18.5% |
Commute Time by Sex in Mount Lena
The most common commute times in Mount Lena are 30 to 34 minutes (35 commuters, 53.0%) for males and 20 to 24 minutes (32 commuters, 50.0%) for females.
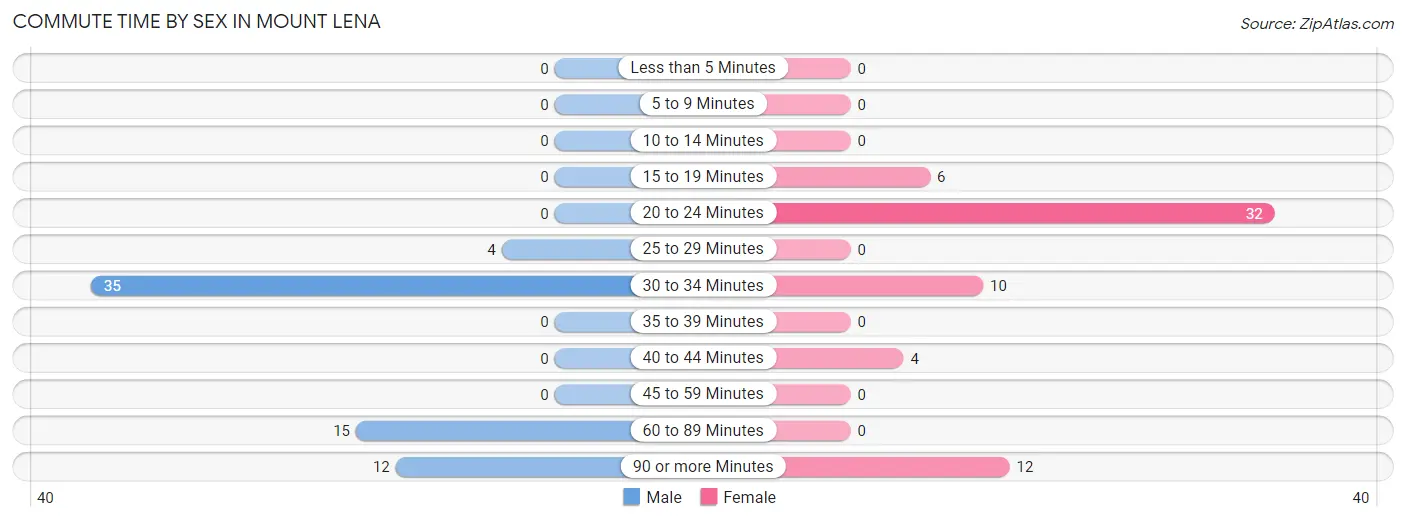
| Commute Time | Male | Female |
| Less than 5 Minutes | 0 (0.0%) | 0 (0.0%) |
| 5 to 9 Minutes | 0 (0.0%) | 0 (0.0%) |
| 10 to 14 Minutes | 0 (0.0%) | 0 (0.0%) |
| 15 to 19 Minutes | 0 (0.0%) | 6 (9.4%) |
| 20 to 24 Minutes | 0 (0.0%) | 32 (50.0%) |
| 25 to 29 Minutes | 4 (6.1%) | 0 (0.0%) |
| 30 to 34 Minutes | 35 (53.0%) | 10 (15.6%) |
| 35 to 39 Minutes | 0 (0.0%) | 0 (0.0%) |
| 40 to 44 Minutes | 0 (0.0%) | 4 (6.2%) |
| 45 to 59 Minutes | 0 (0.0%) | 0 (0.0%) |
| 60 to 89 Minutes | 15 (22.7%) | 0 (0.0%) |
| 90 or more Minutes | 12 (18.2%) | 12 (18.8%) |
Time of Departure to Work by Sex in Mount Lena
The most frequent times of departure to work in Mount Lena are 5:30 AM to 5:59 AM (37, 56.1%) for males and 9:00 AM to 9:59 AM (19, 29.7%) for females.
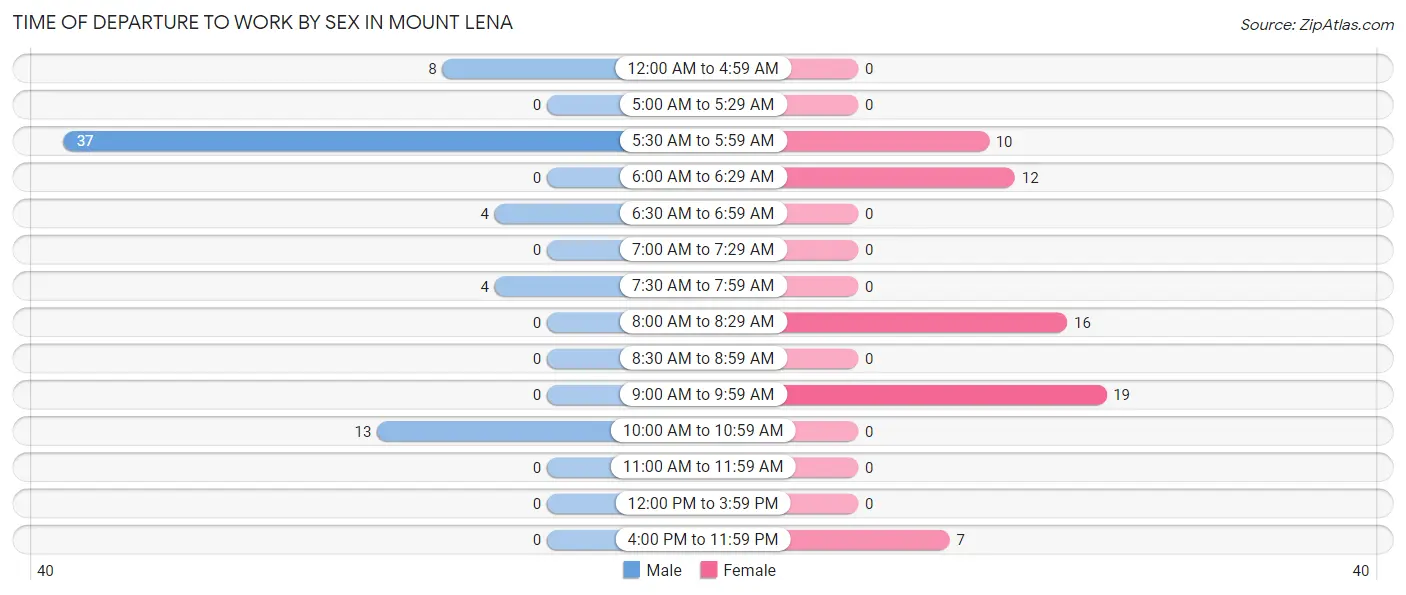
| Time of Departure | Male | Female |
| 12:00 AM to 4:59 AM | 8 (12.1%) | 0 (0.0%) |
| 5:00 AM to 5:29 AM | 0 (0.0%) | 0 (0.0%) |
| 5:30 AM to 5:59 AM | 37 (56.1%) | 10 (15.6%) |
| 6:00 AM to 6:29 AM | 0 (0.0%) | 12 (18.8%) |
| 6:30 AM to 6:59 AM | 4 (6.1%) | 0 (0.0%) |
| 7:00 AM to 7:29 AM | 0 (0.0%) | 0 (0.0%) |
| 7:30 AM to 7:59 AM | 4 (6.1%) | 0 (0.0%) |
| 8:00 AM to 8:29 AM | 0 (0.0%) | 16 (25.0%) |
| 8:30 AM to 8:59 AM | 0 (0.0%) | 0 (0.0%) |
| 9:00 AM to 9:59 AM | 0 (0.0%) | 19 (29.7%) |
| 10:00 AM to 10:59 AM | 13 (19.7%) | 0 (0.0%) |
| 11:00 AM to 11:59 AM | 0 (0.0%) | 0 (0.0%) |
| 12:00 PM to 3:59 PM | 0 (0.0%) | 0 (0.0%) |
| 4:00 PM to 11:59 PM | 0 (0.0%) | 7 (10.9%) |
| Total | 66 (100.0%) | 64 (100.0%) |
Housing Occupancy in Mount Lena
Occupancy by Ownership in Mount Lena
Of the total 137 dwellings in Mount Lena, owner-occupied units account for 125 (91.2%), while renter-occupied units make up 12 (8.8%).
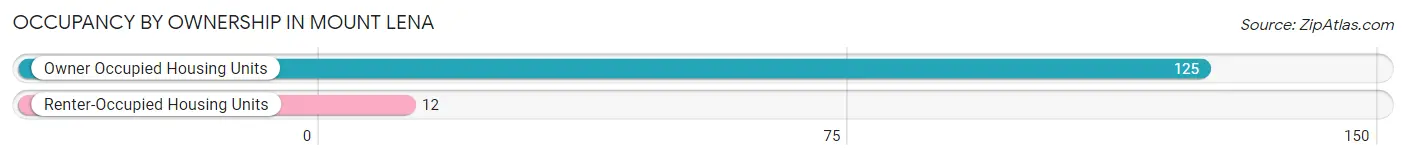
| Occupancy | # Housing Units | % Housing Units |
| Owner Occupied Housing Units | 125 | 91.2% |
| Renter-Occupied Housing Units | 12 | 8.8% |
| Total Occupied Housing Units | 137 | 100.0% |
Occupancy by Household Size in Mount Lena
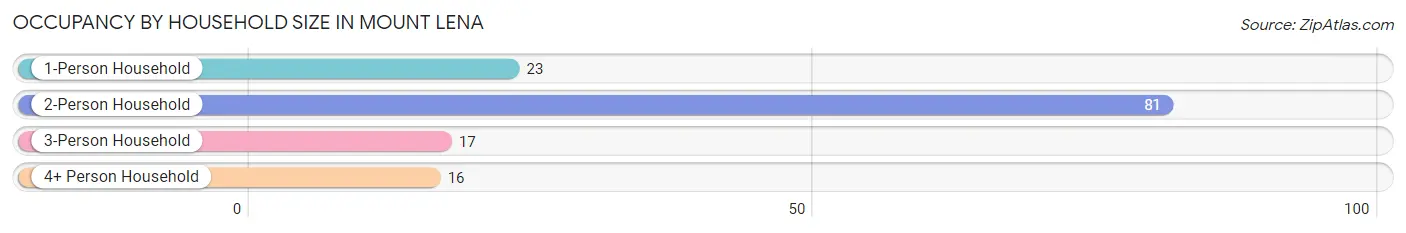
| Household Size | # Housing Units | % Housing Units |
| 1-Person Household | 23 | 16.8% |
| 2-Person Household | 81 | 59.1% |
| 3-Person Household | 17 | 12.4% |
| 4+ Person Household | 16 | 11.7% |
| Total Housing Units | 137 | 100.0% |
Occupancy by Ownership by Household Size in Mount Lena
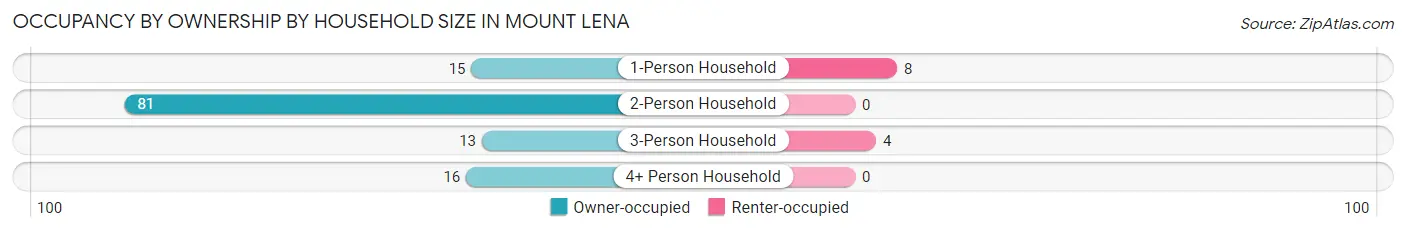
| Household Size | Owner-occupied | Renter-occupied |
| 1-Person Household | 15 (65.2%) | 8 (34.8%) |
| 2-Person Household | 81 (100.0%) | 0 (0.0%) |
| 3-Person Household | 13 (76.5%) | 4 (23.5%) |
| 4+ Person Household | 16 (100.0%) | 0 (0.0%) |
| Total Housing Units | 125 (91.2%) | 12 (8.8%) |
Occupancy by Educational Attainment in Mount Lena
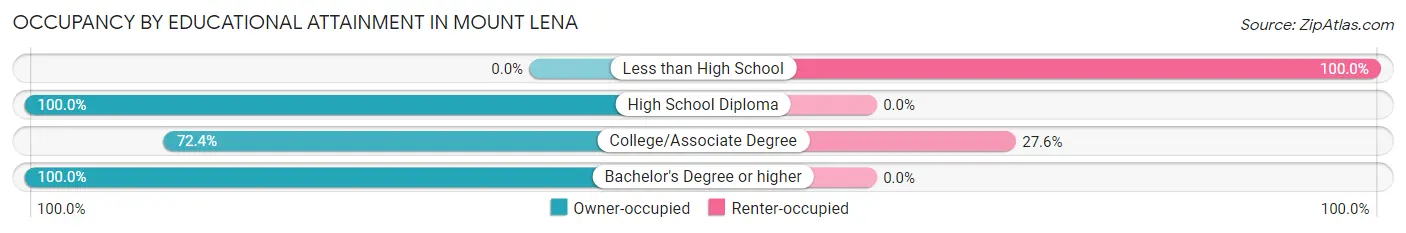
| Household Size | Owner-occupied | Renter-occupied |
| Less than High School | 0 (0.0%) | 4 (100.0%) |
| High School Diploma | 52 (100.0%) | 0 (0.0%) |
| College/Associate Degree | 21 (72.4%) | 8 (27.6%) |
| Bachelor's Degree or higher | 52 (100.0%) | 0 (0.0%) |
Occupancy by Age of Householder in Mount Lena
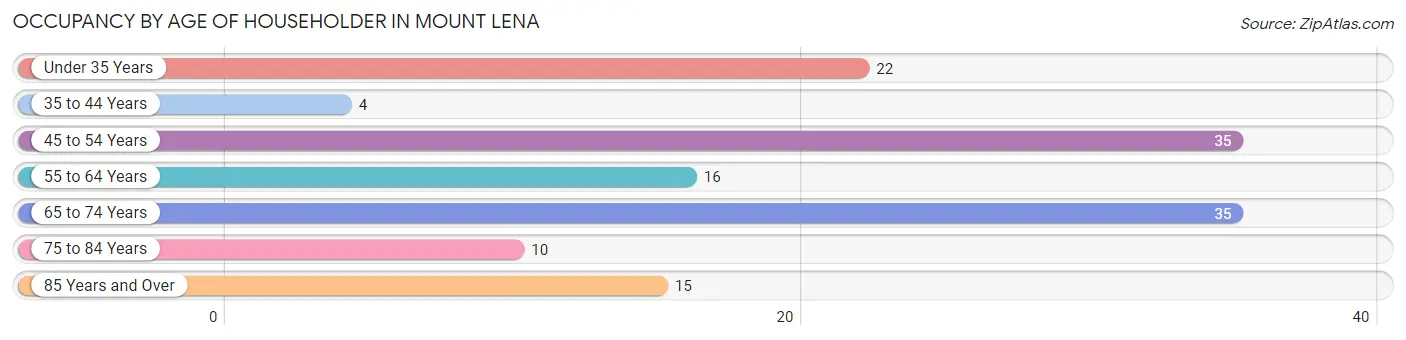
| Age Bracket | # Households | % Households |
| Under 35 Years | 22 | 16.1% |
| 35 to 44 Years | 4 | 2.9% |
| 45 to 54 Years | 35 | 25.6% |
| 55 to 64 Years | 16 | 11.7% |
| 65 to 74 Years | 35 | 25.6% |
| 75 to 84 Years | 10 | 7.3% |
| 85 Years and Over | 15 | 11.0% |
| Total | 137 | 100.0% |
Housing Finances in Mount Lena
Median Income by Occupancy in Mount Lena
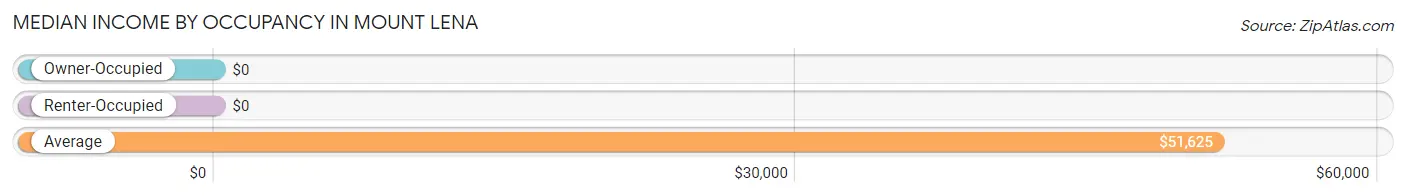
| Occupancy Type | # Households | Median Income |
| Owner-Occupied | 125 (91.2%) | $0 |
| Renter-Occupied | 12 (8.8%) | $0 |
| Average | 137 (100.0%) | $51,625 |
Occupancy by Householder Income Bracket in Mount Lena
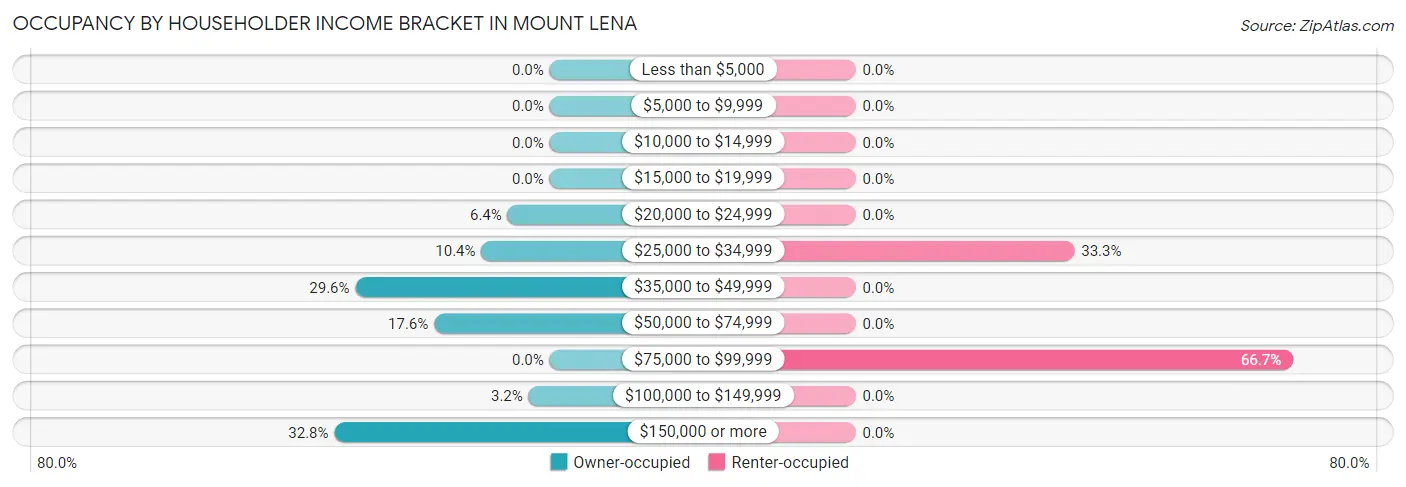
| Income Bracket | Owner-occupied | Renter-occupied |
| Less than $5,000 | 0 (0.0%) | 0 (0.0%) |
| $5,000 to $9,999 | 0 (0.0%) | 0 (0.0%) |
| $10,000 to $14,999 | 0 (0.0%) | 0 (0.0%) |
| $15,000 to $19,999 | 0 (0.0%) | 0 (0.0%) |
| $20,000 to $24,999 | 8 (6.4%) | 0 (0.0%) |
| $25,000 to $34,999 | 13 (10.4%) | 4 (33.3%) |
| $35,000 to $49,999 | 37 (29.6%) | 0 (0.0%) |
| $50,000 to $74,999 | 22 (17.6%) | 0 (0.0%) |
| $75,000 to $99,999 | 0 (0.0%) | 8 (66.7%) |
| $100,000 to $149,999 | 4 (3.2%) | 0 (0.0%) |
| $150,000 or more | 41 (32.8%) | 0 (0.0%) |
| Total | 125 (100.0%) | 12 (100.0%) |
Monthly Housing Cost Tiers in Mount Lena
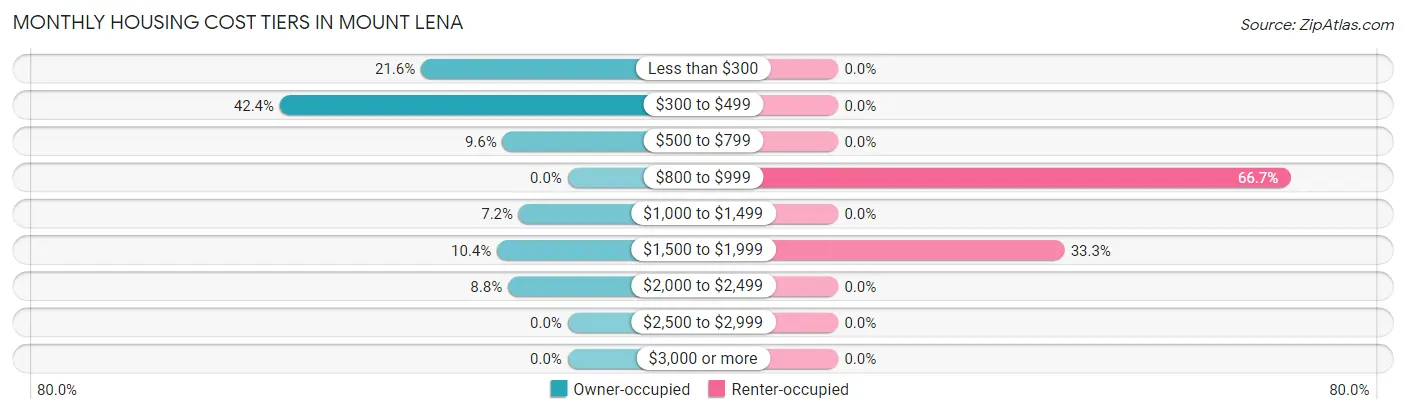
| Monthly Cost | Owner-occupied | Renter-occupied |
| Less than $300 | 27 (21.6%) | 0 (0.0%) |
| $300 to $499 | 53 (42.4%) | 0 (0.0%) |
| $500 to $799 | 12 (9.6%) | 0 (0.0%) |
| $800 to $999 | 0 (0.0%) | 8 (66.7%) |
| $1,000 to $1,499 | 9 (7.2%) | 0 (0.0%) |
| $1,500 to $1,999 | 13 (10.4%) | 4 (33.3%) |
| $2,000 to $2,499 | 11 (8.8%) | 0 (0.0%) |
| $2,500 to $2,999 | 0 (0.0%) | 0 (0.0%) |
| $3,000 or more | 0 (0.0%) | 0 (0.0%) |
| Total | 125 (100.0%) | 12 (100.0%) |
Physical Housing Characteristics in Mount Lena
Housing Structures in Mount Lena
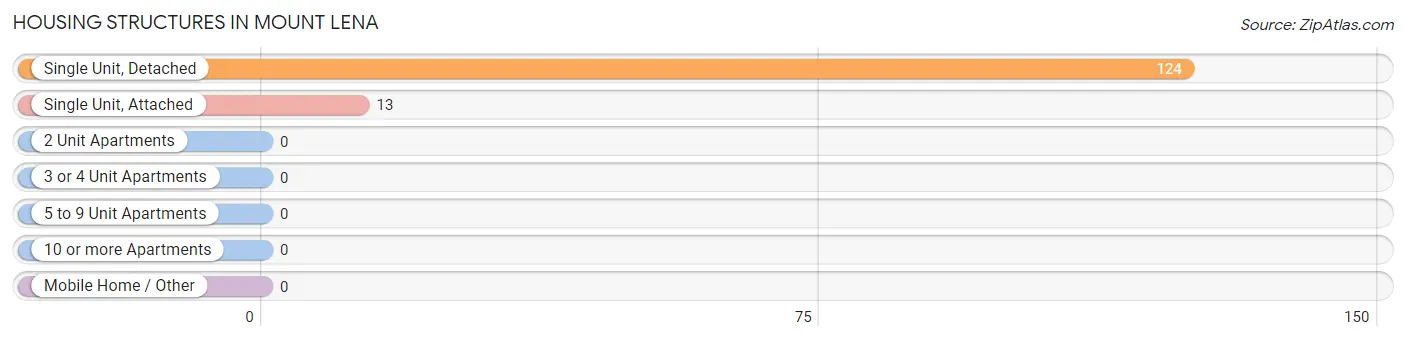
| Structure Type | # Housing Units | % Housing Units |
| Single Unit, Detached | 124 | 90.5% |
| Single Unit, Attached | 13 | 9.5% |
| 2 Unit Apartments | 0 | 0.0% |
| 3 or 4 Unit Apartments | 0 | 0.0% |
| 5 to 9 Unit Apartments | 0 | 0.0% |
| 10 or more Apartments | 0 | 0.0% |
| Mobile Home / Other | 0 | 0.0% |
| Total | 137 | 100.0% |
Housing Structures by Occupancy in Mount Lena
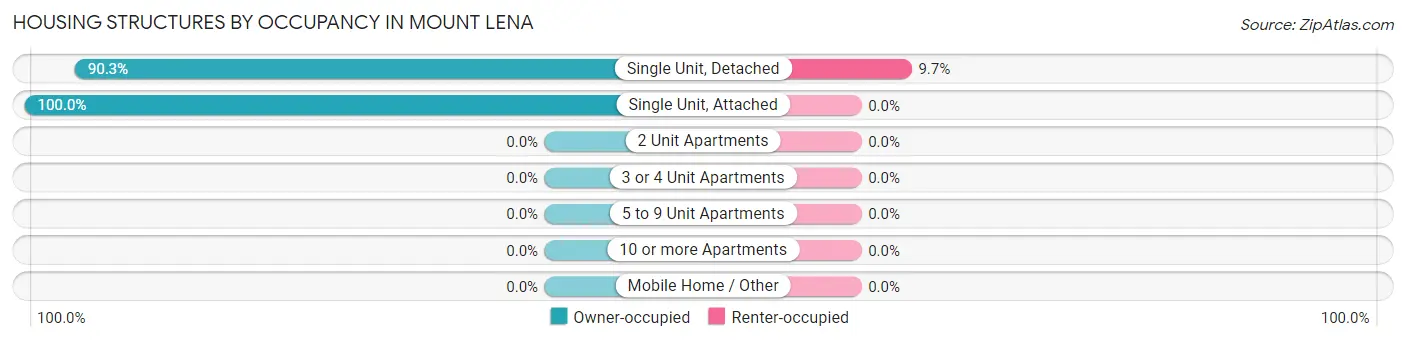
| Structure Type | Owner-occupied | Renter-occupied |
| Single Unit, Detached | 112 (90.3%) | 12 (9.7%) |
| Single Unit, Attached | 13 (100.0%) | 0 (0.0%) |
| 2 Unit Apartments | 0 (0.0%) | 0 (0.0%) |
| 3 or 4 Unit Apartments | 0 (0.0%) | 0 (0.0%) |
| 5 to 9 Unit Apartments | 0 (0.0%) | 0 (0.0%) |
| 10 or more Apartments | 0 (0.0%) | 0 (0.0%) |
| Mobile Home / Other | 0 (0.0%) | 0 (0.0%) |
| Total | 125 (91.2%) | 12 (8.8%) |
Housing Structures by Number of Rooms in Mount Lena
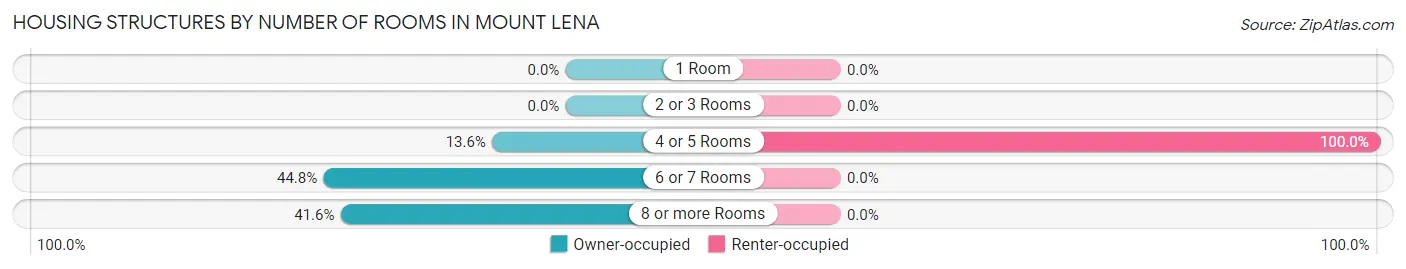
| Number of Rooms | Owner-occupied | Renter-occupied |
| 1 Room | 0 (0.0%) | 0 (0.0%) |
| 2 or 3 Rooms | 0 (0.0%) | 0 (0.0%) |
| 4 or 5 Rooms | 17 (13.6%) | 12 (100.0%) |
| 6 or 7 Rooms | 56 (44.8%) | 0 (0.0%) |
| 8 or more Rooms | 52 (41.6%) | 0 (0.0%) |
| Total | 125 (100.0%) | 12 (100.0%) |
Housing Structure by Heating Type in Mount Lena
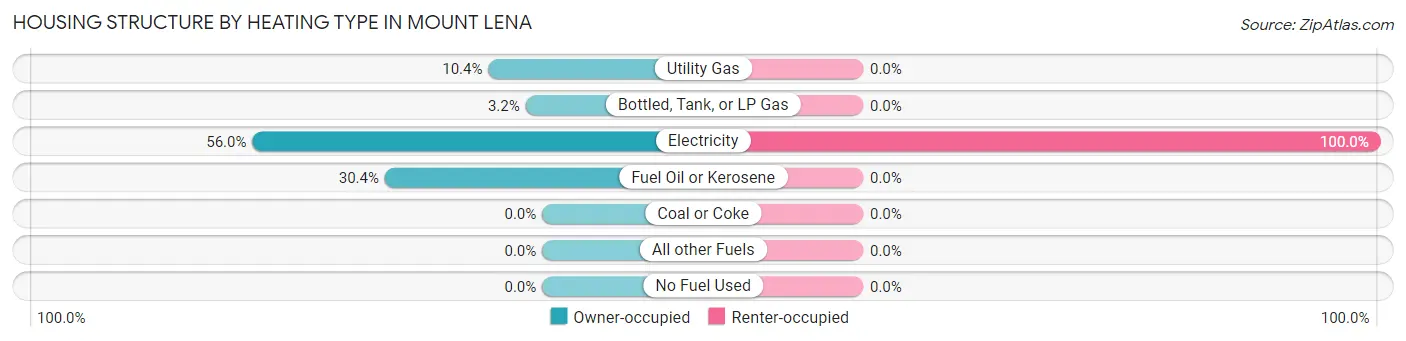
| Heating Type | Owner-occupied | Renter-occupied |
| Utility Gas | 13 (10.4%) | 0 (0.0%) |
| Bottled, Tank, or LP Gas | 4 (3.2%) | 0 (0.0%) |
| Electricity | 70 (56.0%) | 12 (100.0%) |
| Fuel Oil or Kerosene | 38 (30.4%) | 0 (0.0%) |
| Coal or Coke | 0 (0.0%) | 0 (0.0%) |
| All other Fuels | 0 (0.0%) | 0 (0.0%) |
| No Fuel Used | 0 (0.0%) | 0 (0.0%) |
| Total | 125 (100.0%) | 12 (100.0%) |
Household Vehicle Usage in Mount Lena
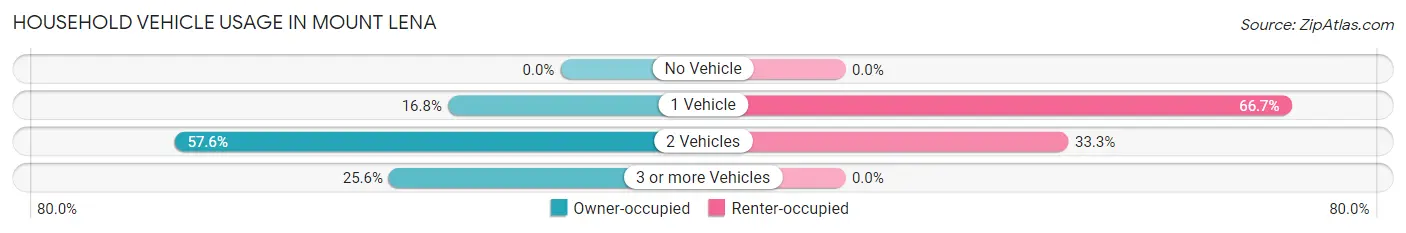
| Vehicles per Household | Owner-occupied | Renter-occupied |
| No Vehicle | 0 (0.0%) | 0 (0.0%) |
| 1 Vehicle | 21 (16.8%) | 8 (66.7%) |
| 2 Vehicles | 72 (57.6%) | 4 (33.3%) |
| 3 or more Vehicles | 32 (25.6%) | 0 (0.0%) |
| Total | 125 (100.0%) | 12 (100.0%) |
Real Estate & Mortgages in Mount Lena
Real Estate and Mortgage Overview in Mount Lena
| Characteristic | Without Mortgage | With Mortgage |
| Housing Units | 68 | 57 |
| Median Property Value | $220,700 | $293,800 |
| Median Household Income | $41,481 | $28 |
| Monthly Housing Costs | $436 | $0 |
| Real Estate Taxes | $1,486 | $0 |
Property Value by Mortgage Status in Mount Lena
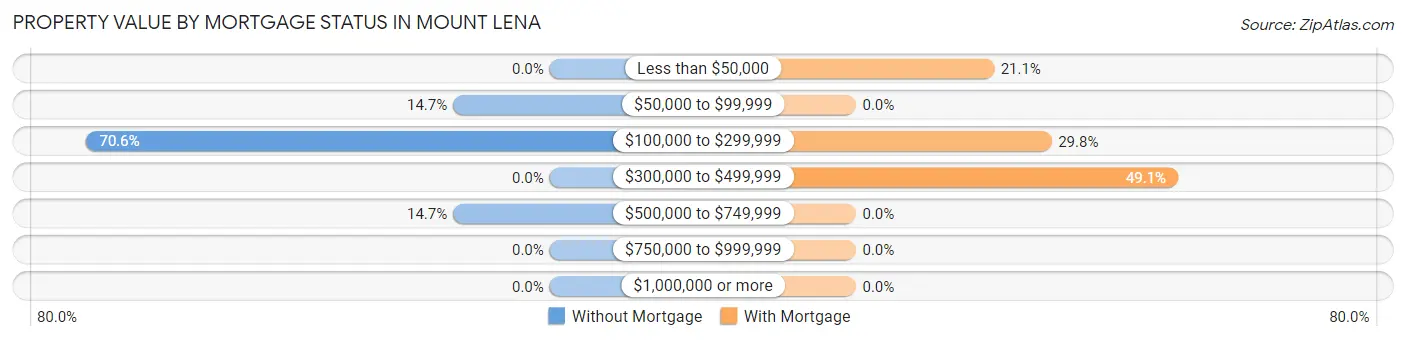
| Property Value | Without Mortgage | With Mortgage |
| Less than $50,000 | 0 (0.0%) | 12 (21.0%) |
| $50,000 to $99,999 | 10 (14.7%) | 0 (0.0%) |
| $100,000 to $299,999 | 48 (70.6%) | 17 (29.8%) |
| $300,000 to $499,999 | 0 (0.0%) | 28 (49.1%) |
| $500,000 to $749,999 | 10 (14.7%) | 0 (0.0%) |
| $750,000 to $999,999 | 0 (0.0%) | 0 (0.0%) |
| $1,000,000 or more | 0 (0.0%) | 0 (0.0%) |
| Total | 68 (100.0%) | 57 (100.0%) |
Household Income by Mortgage Status in Mount Lena
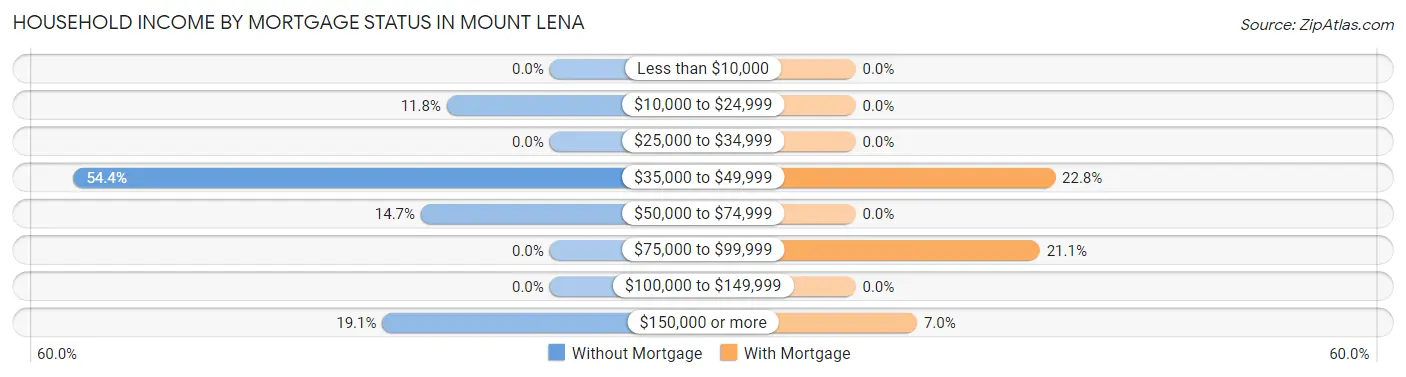
| Household Income | Without Mortgage | With Mortgage |
| Less than $10,000 | 0 (0.0%) | 0 (0.0%) |
| $10,000 to $24,999 | 8 (11.8%) | 0 (0.0%) |
| $25,000 to $34,999 | 0 (0.0%) | 0 (0.0%) |
| $35,000 to $49,999 | 37 (54.4%) | 13 (22.8%) |
| $50,000 to $74,999 | 10 (14.7%) | 0 (0.0%) |
| $75,000 to $99,999 | 0 (0.0%) | 12 (21.0%) |
| $100,000 to $149,999 | 0 (0.0%) | 0 (0.0%) |
| $150,000 or more | 13 (19.1%) | 4 (7.0%) |
| Total | 68 (100.0%) | 57 (100.0%) |
Property Value to Household Income Ratio in Mount Lena
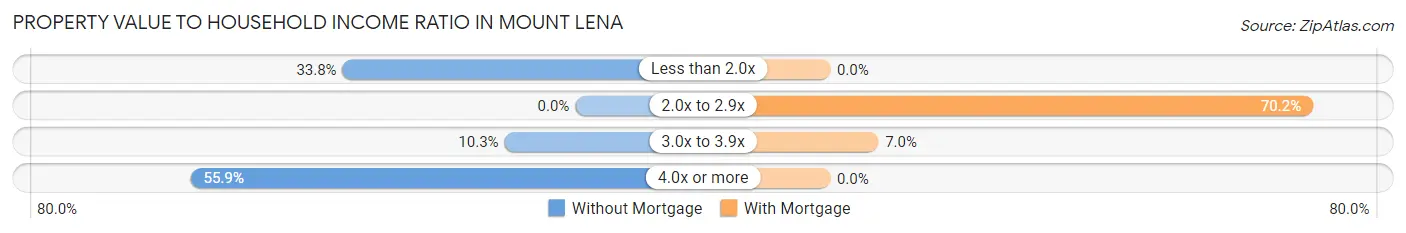
| Value-to-Income Ratio | Without Mortgage | With Mortgage |
| Less than 2.0x | 23 (33.8%) | 0 (0.0%) |
| 2.0x to 2.9x | 0 (0.0%) | 40 (70.2%) |
| 3.0x to 3.9x | 7 (10.3%) | 4 (7.0%) |
| 4.0x or more | 38 (55.9%) | 0 (0.0%) |
| Total | 68 (100.0%) | 57 (100.0%) |
Real Estate Taxes by Mortgage Status in Mount Lena
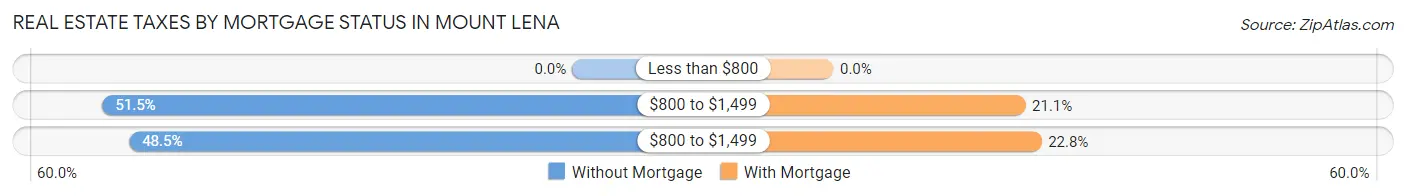
| Property Taxes | Without Mortgage | With Mortgage |
| Less than $800 | 0 (0.0%) | 0 (0.0%) |
| $800 to $1,499 | 35 (51.5%) | 12 (21.0%) |
| $800 to $1,499 | 33 (48.5%) | 13 (22.8%) |
| Total | 68 (100.0%) | 57 (100.0%) |
Health & Disability in Mount Lena
Health Insurance Coverage by Age in Mount Lena
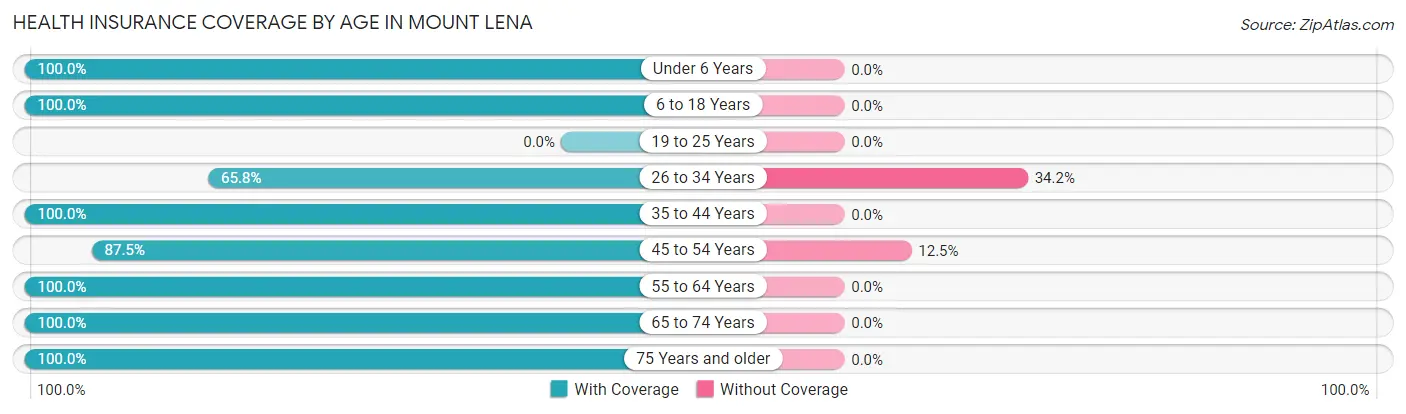
| Age Bracket | With Coverage | Without Coverage |
| Under 6 Years | 36 (100.0%) | 0 (0.0%) |
| 6 to 18 Years | 43 (100.0%) | 0 (0.0%) |
| 19 to 25 Years | 0 (0.0%) | 0 (0.0%) |
| 26 to 34 Years | 25 (65.8%) | 13 (34.2%) |
| 35 to 44 Years | 32 (100.0%) | 0 (0.0%) |
| 45 to 54 Years | 56 (87.5%) | 8 (12.5%) |
| 55 to 64 Years | 29 (100.0%) | 0 (0.0%) |
| 65 to 74 Years | 67 (100.0%) | 0 (0.0%) |
| 75 Years and older | 34 (100.0%) | 0 (0.0%) |
| Total | 322 (93.9%) | 21 (6.1%) |
Health Insurance Coverage by Citizenship Status in Mount Lena
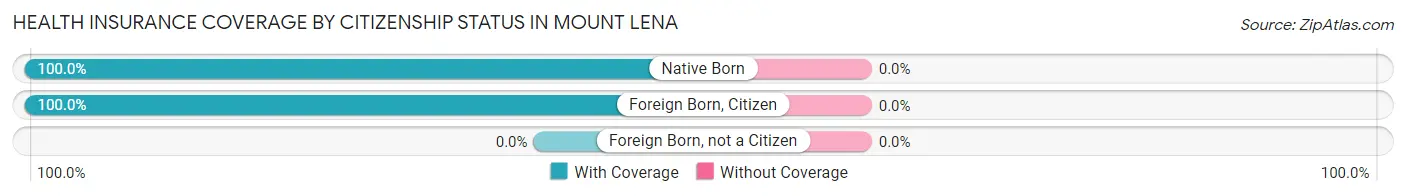
| Citizenship Status | With Coverage | Without Coverage |
| Native Born | 36 (100.0%) | 0 (0.0%) |
| Foreign Born, Citizen | 43 (100.0%) | 0 (0.0%) |
| Foreign Born, not a Citizen | 0 (0.0%) | 0 (0.0%) |
Health Insurance Coverage by Household Income in Mount Lena
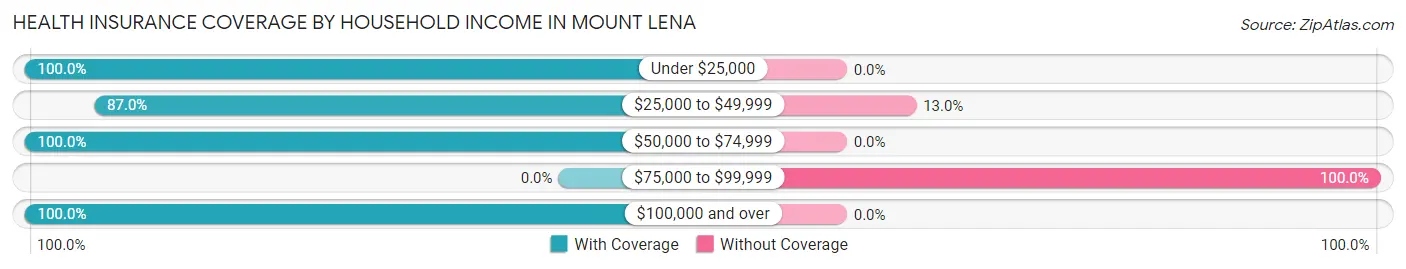
| Household Income | With Coverage | Without Coverage |
| Under $25,000 | 8 (100.0%) | 0 (0.0%) |
| $25,000 to $49,999 | 87 (87.0%) | 13 (13.0%) |
| $50,000 to $74,999 | 45 (100.0%) | 0 (0.0%) |
| $75,000 to $99,999 | 0 (0.0%) | 8 (100.0%) |
| $100,000 and over | 182 (100.0%) | 0 (0.0%) |
Public vs Private Health Insurance Coverage by Age in Mount Lena
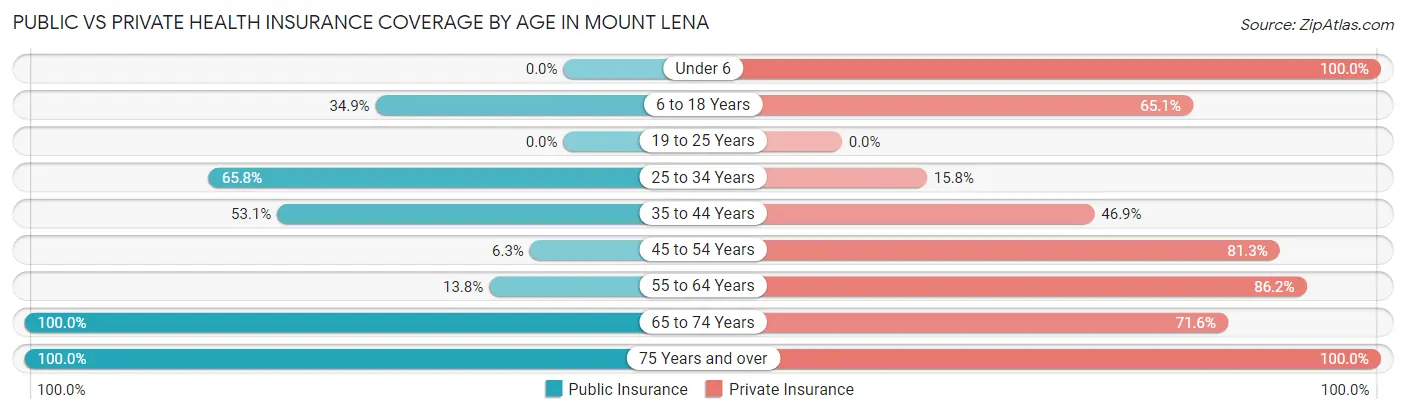
| Age Bracket | Public Insurance | Private Insurance |
| Under 6 | 0 (0.0%) | 36 (100.0%) |
| 6 to 18 Years | 15 (34.9%) | 28 (65.1%) |
| 19 to 25 Years | 0 (0.0%) | 0 (0.0%) |
| 25 to 34 Years | 25 (65.8%) | 6 (15.8%) |
| 35 to 44 Years | 17 (53.1%) | 15 (46.9%) |
| 45 to 54 Years | 4 (6.2%) | 52 (81.2%) |
| 55 to 64 Years | 4 (13.8%) | 25 (86.2%) |
| 65 to 74 Years | 67 (100.0%) | 48 (71.6%) |
| 75 Years and over | 34 (100.0%) | 34 (100.0%) |
| Total | 166 (48.4%) | 244 (71.1%) |
Disability Status by Sex by Age in Mount Lena
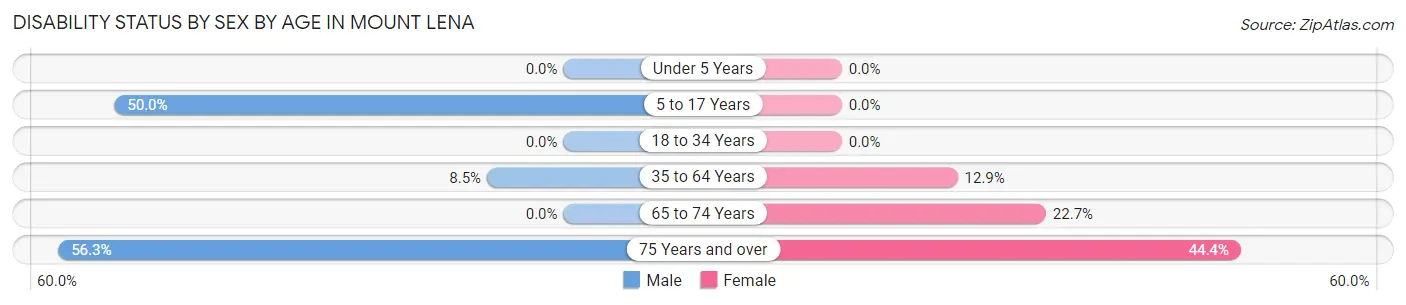
| Age Bracket | Male | Female |
| Under 5 Years | 0 (0.0%) | 0 (0.0%) |
| 5 to 17 Years | 14 (50.0%) | 0 (0.0%) |
| 18 to 34 Years | 0 (0.0%) | 0 (0.0%) |
| 35 to 64 Years | 8 (8.5%) | 4 (12.9%) |
| 65 to 74 Years | 0 (0.0%) | 10 (22.7%) |
| 75 Years and over | 9 (56.2%) | 8 (44.4%) |
Disability Class by Sex by Age in Mount Lena
Disability Class: Hearing Difficulty
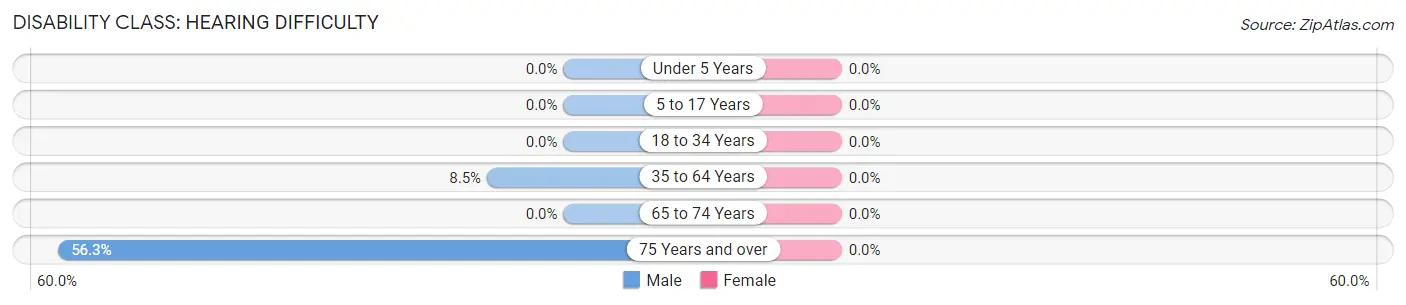
| Age Bracket | Male | Female |
| Under 5 Years | 0 (0.0%) | 0 (0.0%) |
| 5 to 17 Years | 0 (0.0%) | 0 (0.0%) |
| 18 to 34 Years | 0 (0.0%) | 0 (0.0%) |
| 35 to 64 Years | 8 (8.5%) | 0 (0.0%) |
| 65 to 74 Years | 0 (0.0%) | 0 (0.0%) |
| 75 Years and over | 9 (56.2%) | 0 (0.0%) |
Disability Class: Vision Difficulty
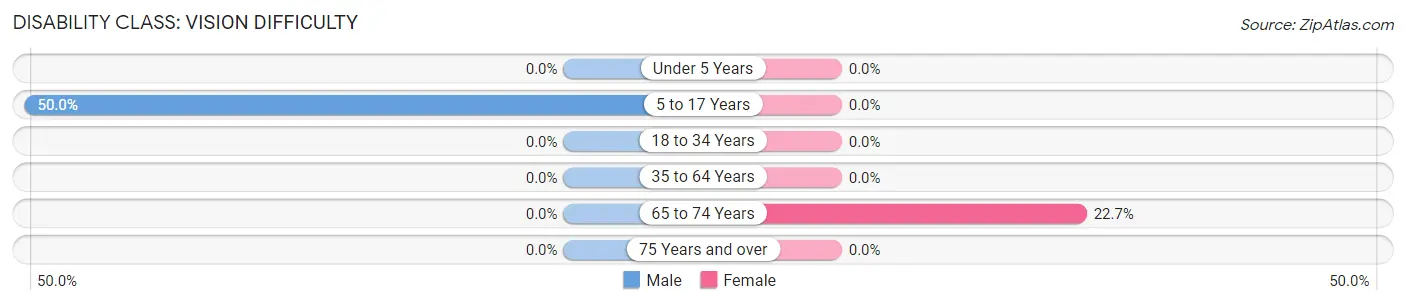
| Age Bracket | Male | Female |
| Under 5 Years | 0 (0.0%) | 0 (0.0%) |
| 5 to 17 Years | 14 (50.0%) | 0 (0.0%) |
| 18 to 34 Years | 0 (0.0%) | 0 (0.0%) |
| 35 to 64 Years | 0 (0.0%) | 0 (0.0%) |
| 65 to 74 Years | 0 (0.0%) | 10 (22.7%) |
| 75 Years and over | 0 (0.0%) | 0 (0.0%) |
Disability Class: Cognitive Difficulty
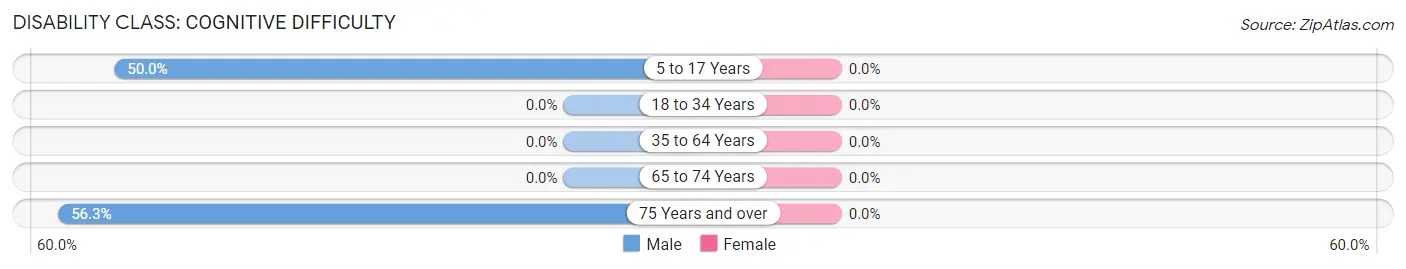
| Age Bracket | Male | Female |
| 5 to 17 Years | 14 (50.0%) | 0 (0.0%) |
| 18 to 34 Years | 0 (0.0%) | 0 (0.0%) |
| 35 to 64 Years | 0 (0.0%) | 0 (0.0%) |
| 65 to 74 Years | 0 (0.0%) | 0 (0.0%) |
| 75 Years and over | 9 (56.2%) | 0 (0.0%) |
Disability Class: Ambulatory Difficulty
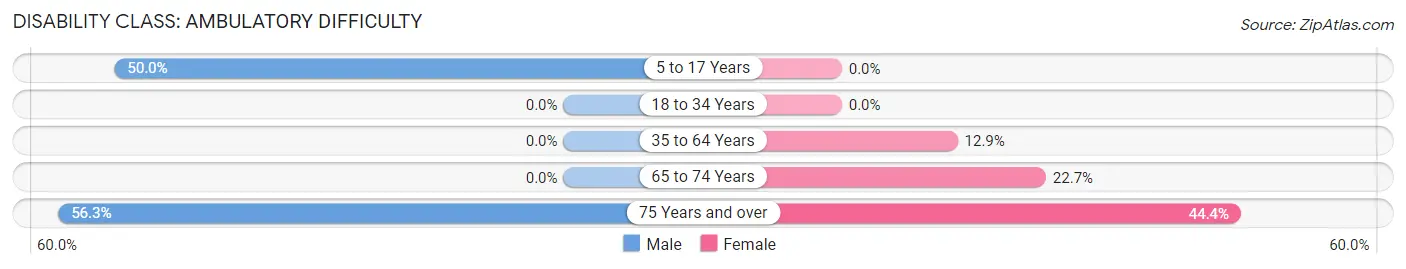
| Age Bracket | Male | Female |
| 5 to 17 Years | 14 (50.0%) | 0 (0.0%) |
| 18 to 34 Years | 0 (0.0%) | 0 (0.0%) |
| 35 to 64 Years | 0 (0.0%) | 4 (12.9%) |
| 65 to 74 Years | 0 (0.0%) | 10 (22.7%) |
| 75 Years and over | 9 (56.2%) | 8 (44.4%) |
Disability Class: Self-Care Difficulty
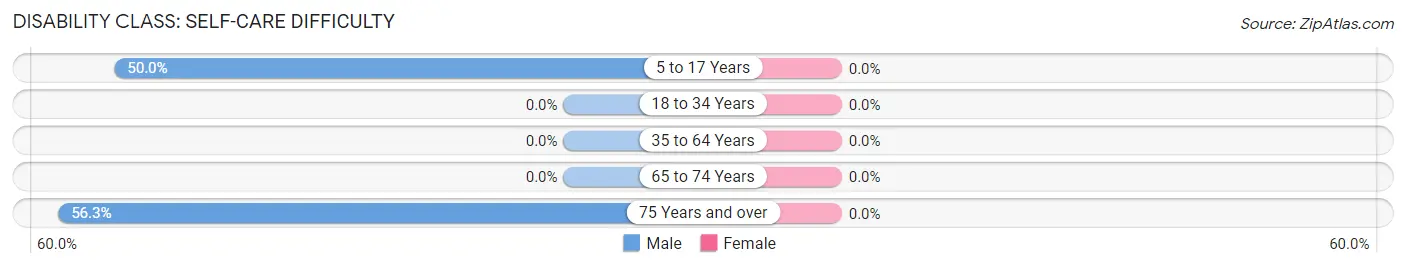
| Age Bracket | Male | Female |
| 5 to 17 Years | 14 (50.0%) | 0 (0.0%) |
| 18 to 34 Years | 0 (0.0%) | 0 (0.0%) |
| 35 to 64 Years | 0 (0.0%) | 0 (0.0%) |
| 65 to 74 Years | 0 (0.0%) | 0 (0.0%) |
| 75 Years and over | 9 (56.2%) | 0 (0.0%) |
Technology Access in Mount Lena
Computing Device Access in Mount Lena
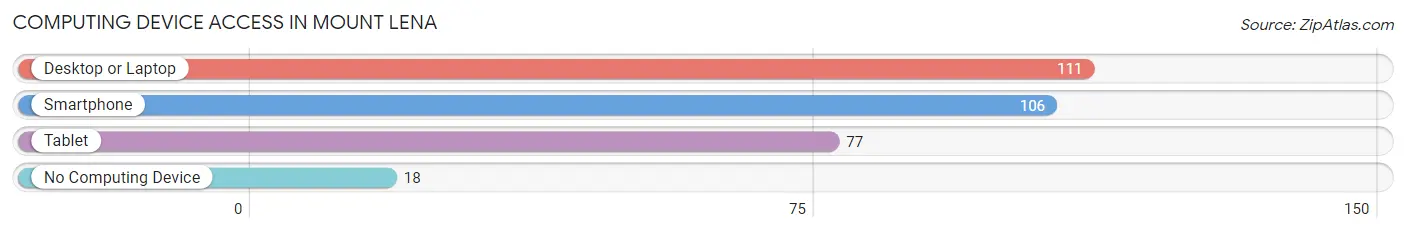
| Device Type | # Households | % Households |
| Desktop or Laptop | 111 | 81.0% |
| Smartphone | 106 | 77.4% |
| Tablet | 77 | 56.2% |
| No Computing Device | 18 | 13.1% |
| Total | 137 | 100.0% |
Internet Access in Mount Lena
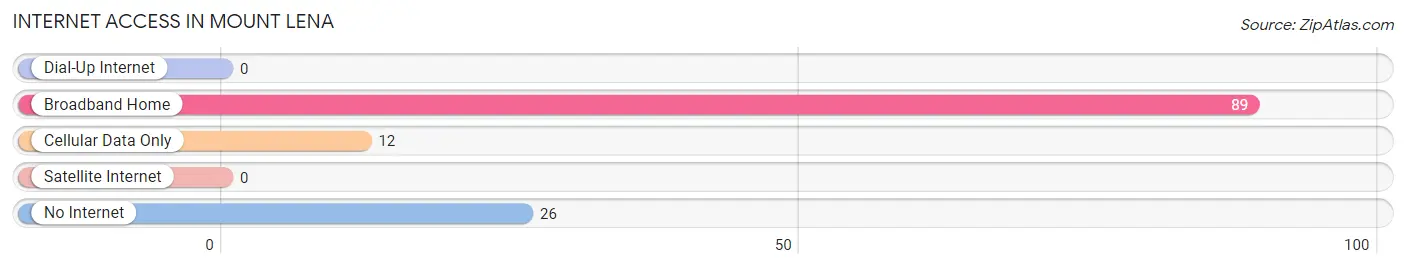
| Internet Type | # Households | % Households |
| Dial-Up Internet | 0 | 0.0% |
| Broadband Home | 89 | 65.0% |
| Cellular Data Only | 12 | 8.8% |
| Satellite Internet | 0 | 0.0% |
| No Internet | 26 | 19.0% |
| Total | 137 | 100.0% |
Mount Lena Summary
Lena, Maryland is a small unincorporated community located in Washington County, Maryland. It is situated in the northern part of the county, near the Pennsylvania border. The community is located along the Potomac River, and is home to a variety of businesses, including a winery, a golf course, and a number of small farms.
History
The area that is now known as Lena was first settled in the late 1700s by German immigrants. The community was originally known as “Lena’s Crossroads”, and was named after the daughter of one of the first settlers. The area was primarily agricultural, and the main crops grown were wheat, corn, and oats.
In the early 1900s, the area began to experience a period of growth and development. The town of Lena was officially incorporated in 1910, and the first post office was established in 1911. The town was home to a variety of businesses, including a general store, a blacksmith shop, and a hotel.
Geography
Lena is located in northern Washington County, Maryland, near the Pennsylvania border. The community is situated along the Potomac River, and is surrounded by rolling hills and farmland. The area is known for its scenic beauty, and is home to a variety of wildlife, including deer, foxes, and wild turkeys.
The climate in Lena is temperate, with hot summers and cold winters. The average annual temperature is around 50 degrees Fahrenheit, and the average annual precipitation is around 40 inches.
Economy
The economy of Lena is primarily based on agriculture and tourism. The area is home to a number of small farms, which produce a variety of crops, including wheat, corn, and oats. The town is also home to a winery, a golf course, and a number of other businesses.
In addition to agriculture and tourism, Lena is home to a number of manufacturing and service-based businesses. These businesses include a printing company, a machine shop, and a variety of other businesses.
Demographics
As of the 2010 census, the population of Lena was 1,845. The racial makeup of the town was 97.3% White, 0.7% African American, 0.2% Native American, 0.2% Asian, 0.1% Pacific Islander, and 1.5% from other races. The median household income was $45,000, and the median family income was $50,000.
Conclusion
Lena, Maryland is a small unincorporated community located in Washington County, Maryland. It is situated in the northern part of the county, near the Pennsylvania border. The community is located along the Potomac River, and is home to a variety of businesses, including a winery, a golf course, and a number of small farms. The economy of Lena is primarily based on agriculture and tourism, and the town is home to a variety of manufacturing and service-based businesses. As of the 2010 census, the population of Lena was 1,845. The racial makeup of the town was 97.3% White, 0.7% African American, 0.2% Native American, 0.2% Asian, 0.1% Pacific Islander, and 1.5% from other races. The median household income was $45,000, and the median family income was $50,000.
Common Questions
What is Per Capita Income in Mount Lena?
Per Capita income in Mount Lena is $36,071.
What is the Median Household income in Mount Lena?
Median Household Income in Mount Lena is $51,625.
What is Inequality or Gini Index in Mount Lena?
Inequality or Gini Index in Mount Lena is 0.43.
What is the Total Population of Mount Lena?
Total Population of Mount Lena is 343.
What is the Total Male Population of Mount Lena?
Total Male Population of Mount Lena is 170.
What is the Total Female Population of Mount Lena?
Total Female Population of Mount Lena is 173.
What is the Ratio of Males per 100 Females in Mount Lena?
There are 98.27 Males per 100 Females in Mount Lena.
What is the Ratio of Females per 100 Males in Mount Lena?
There are 101.76 Females per 100 Males in Mount Lena.
What is the Median Population Age in Mount Lena?
Median Population Age in Mount Lena is 47.4 Years.
What is the Average Family Size in Mount Lena
Average Family Size in Mount Lena is 3.1 People.
What is the Average Household Size in Mount Lena
Average Household Size in Mount Lena is 2.5 People.
How Large is the Labor Force in Mount Lena?
There are 179 People in the Labor Forcein in Mount Lena.
What is the Percentage of People in the Labor Force in Mount Lena?
67.8% of People are in the Labor Force in Mount Lena.