Cloverly, MD Map & Demographics
Cloverly Map
Cloverly Overview
$55,997
PER CAPITA INCOME
$151,954
AVG FAMILY INCOME
$144,003
AVG HOUSEHOLD INCOME
20.2%
WAGE / INCOME GAP [ % ]
79.8¢/ $1
WAGE / INCOME GAP [ $ ]
0.38
INEQUALITY / GINI INDEX
16,436
TOTAL POPULATION
8,363
MALE POPULATION
8,073
FEMALE POPULATION
103.59
MALES / 100 FEMALES
96.53
FEMALES / 100 MALES
42.1
MEDIAN AGE
3.5
AVG FAMILY SIZE
3.2
AVG HOUSEHOLD SIZE
8,778
LABOR FORCE [ PEOPLE ]
65.5%
PERCENT IN LABOR FORCE
7.7%
UNEMPLOYMENT RATE
Income in Cloverly
Income Overview in Cloverly
Per Capita Income in Cloverly is $55,997, while median incomes of families and households are $151,954 and $144,003 respectively.
| Characteristic | Number | Measure |
| Per Capita Income | 16,436 | $55,997 |
| Median Family Income | 4,441 | $151,954 |
| Mean Family Income | 4,441 | $188,013 |
| Median Household Income | 5,047 | $144,003 |
| Mean Household Income | 5,047 | $178,897 |
| Income Deficit | 4,441 | $0 |
| Wage / Income Gap (%) | 16,436 | 20.15% |
| Wage / Income Gap ($) | 16,436 | 79.85¢ per $1 |
| Gini / Inequality Index | 16,436 | 0.38 |
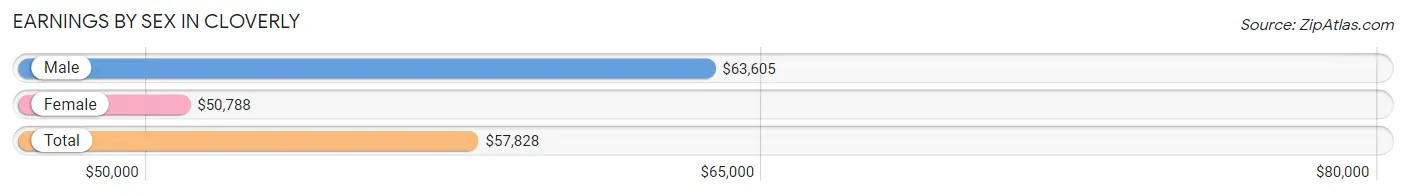
Earnings by Sex in Cloverly
Average Earnings in Cloverly are $57,828, $63,605 for men and $50,788 for women, a difference of 20.2%.
| Sex | Number | Average Earnings |
| Male | 5,085 (56.7%) | $63,605 |
| Female | 3,882 (43.3%) | $50,788 |
| Total | 8,967 (100.0%) | $57,828 |
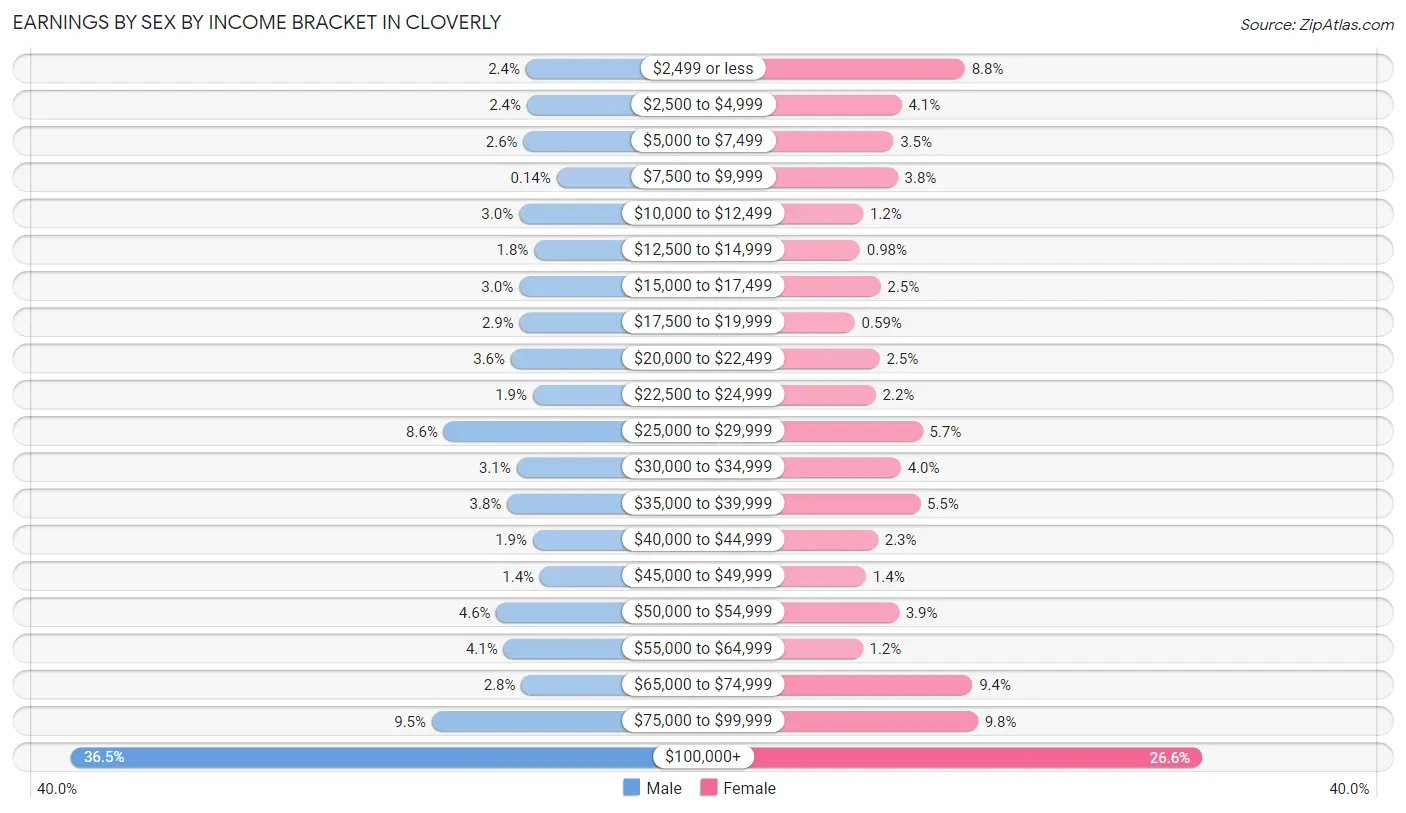
Earnings by Sex by Income Bracket in Cloverly
The most common earnings brackets in Cloverly are $100,000+ for men (1,857 | 36.5%) and $100,000+ for women (1,033 | 26.6%).
| Income | Male | Female |
| $2,499 or less | 124 (2.4%) | 343 (8.8%) |
| $2,500 to $4,999 | 120 (2.4%) | 159 (4.1%) |
| $5,000 to $7,499 | 133 (2.6%) | 135 (3.5%) |
| $7,500 to $9,999 | 7 (0.1%) | 148 (3.8%) |
| $10,000 to $12,499 | 150 (2.9%) | 47 (1.2%) |
| $12,500 to $14,999 | 92 (1.8%) | 38 (1.0%) |
| $15,000 to $17,499 | 150 (2.9%) | 98 (2.5%) |
| $17,500 to $19,999 | 148 (2.9%) | 23 (0.6%) |
| $20,000 to $22,499 | 181 (3.6%) | 95 (2.5%) |
| $22,500 to $24,999 | 97 (1.9%) | 84 (2.2%) |
| $25,000 to $29,999 | 437 (8.6%) | 220 (5.7%) |
| $30,000 to $34,999 | 159 (3.1%) | 157 (4.0%) |
| $35,000 to $39,999 | 195 (3.8%) | 213 (5.5%) |
| $40,000 to $44,999 | 97 (1.9%) | 90 (2.3%) |
| $45,000 to $49,999 | 70 (1.4%) | 56 (1.4%) |
| $50,000 to $54,999 | 236 (4.6%) | 151 (3.9%) |
| $55,000 to $64,999 | 209 (4.1%) | 46 (1.2%) |
| $65,000 to $74,999 | 141 (2.8%) | 365 (9.4%) |
| $75,000 to $99,999 | 482 (9.5%) | 381 (9.8%) |
| $100,000+ | 1,857 (36.5%) | 1,033 (26.6%) |
| Total | 5,085 (100.0%) | 3,882 (100.0%) |
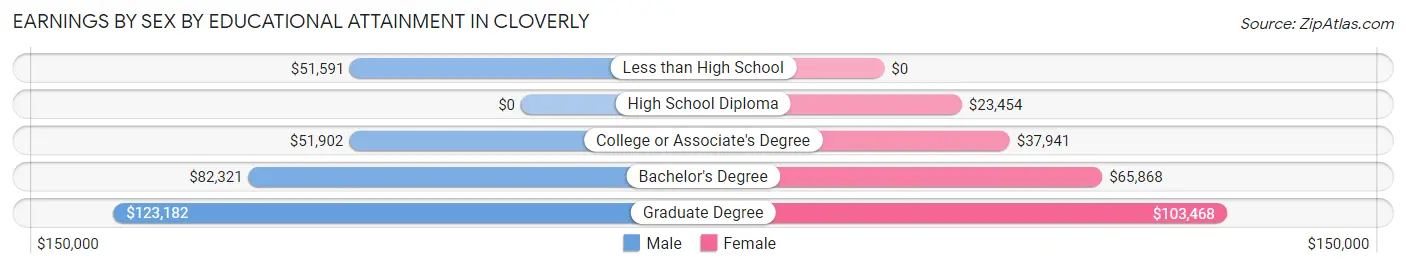
Earnings by Sex by Educational Attainment in Cloverly
Average earnings in Cloverly are $76,870 for men and $65,126 for women, a difference of 15.3%. Men with an educational attainment of graduate degree enjoy the highest average annual earnings of $123,182, while those with less than high school education earn the least with $51,591. Women with an educational attainment of graduate degree earn the most with the average annual earnings of $103,468, while those with high school diploma education have the smallest earnings of $23,454.
| Educational Attainment | Male Income | Female Income |
| Less than High School | $51,591 | $0 |
| High School Diploma | - | - |
| College or Associate's Degree | $51,902 | $37,941 |
| Bachelor's Degree | $82,321 | $65,868 |
| Graduate Degree | $123,182 | $103,468 |
| Total | $76,870 | $65,126 |
Family Income in Cloverly
Family Income Brackets in Cloverly
According to the Cloverly family income data, there are 1,656 families falling into the $200,000+ income range, which is the most common income bracket and makes up 37.3% of all families. Conversely, the $15,000 to $24,999 income bracket is the least frequent group with only 22 families (0.5%) belonging to this category.
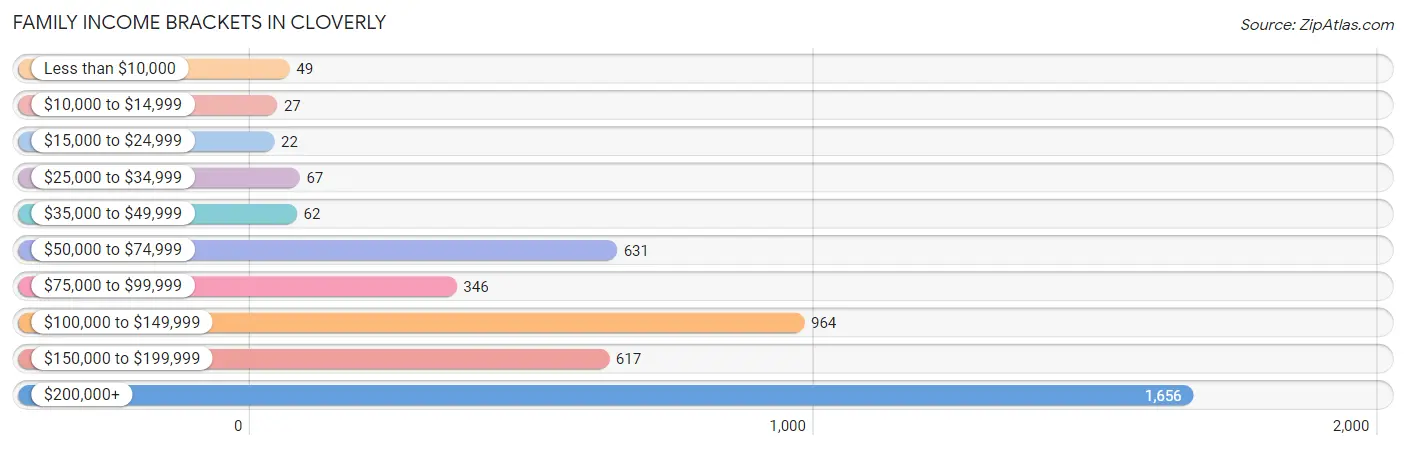
| Income Bracket | # Families | % Families |
| Less than $10,000 | 49 | 1.1% |
| $10,000 to $14,999 | 27 | 0.6% |
| $15,000 to $24,999 | 22 | 0.5% |
| $25,000 to $34,999 | 67 | 1.5% |
| $35,000 to $49,999 | 62 | 1.4% |
| $50,000 to $74,999 | 631 | 14.2% |
| $75,000 to $99,999 | 346 | 7.8% |
| $100,000 to $149,999 | 964 | 21.7% |
| $150,000 to $199,999 | 617 | 13.9% |
| $200,000+ | 1,656 | 37.3% |
Family Income by Famaliy Size in Cloverly
7+ person families (66 | 1.5%) account for the highest median family income in Cloverly with $250,001 per family, while 2-person families (1,384 | 31.2%) have the highest median income of $75,166 per family member.
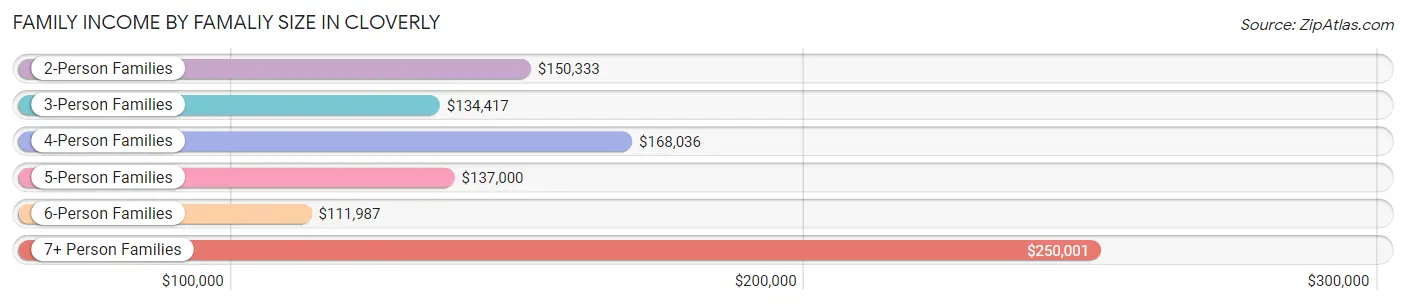
| Income Bracket | # Families | Median Income |
| 2-Person Families | 1,384 (31.2%) | $150,333 |
| 3-Person Families | 1,323 (29.8%) | $134,417 |
| 4-Person Families | 916 (20.6%) | $168,036 |
| 5-Person Families | 328 (7.4%) | $137,000 |
| 6-Person Families | 424 (9.6%) | $111,987 |
| 7+ Person Families | 66 (1.5%) | $250,001 |
| Total | 4,441 (100.0%) | $151,954 |
Family Income by Number of Earners in Cloverly
The median family income in Cloverly is $151,954, with families comprising 3+ earners (936) having the highest median family income of $205,848, while families with no earners (527) have the lowest median family income of $74,804, accounting for 21.1% and 11.9% of families, respectively.
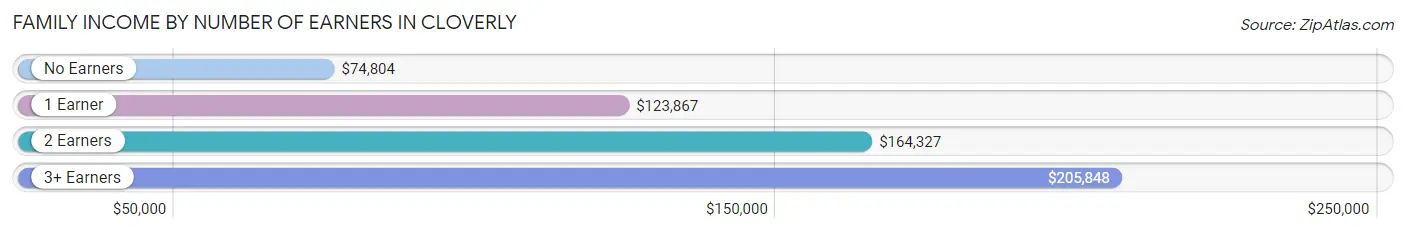
| Number of Earners | # Families | Median Income |
| No Earners | 527 (11.9%) | $74,804 |
| 1 Earner | 1,051 (23.7%) | $123,867 |
| 2 Earners | 1,927 (43.4%) | $164,327 |
| 3+ Earners | 936 (21.1%) | $205,848 |
| Total | 4,441 (100.0%) | $151,954 |
Household Income in Cloverly
Household Income Brackets in Cloverly
With 1,711 households falling in the category, the $200,000+ income range is the most frequent in Cloverly, accounting for 33.9% of all households. In contrast, only 25 households (0.5%) fall into the $10,000 to $14,999 income bracket, making it the least populous group.
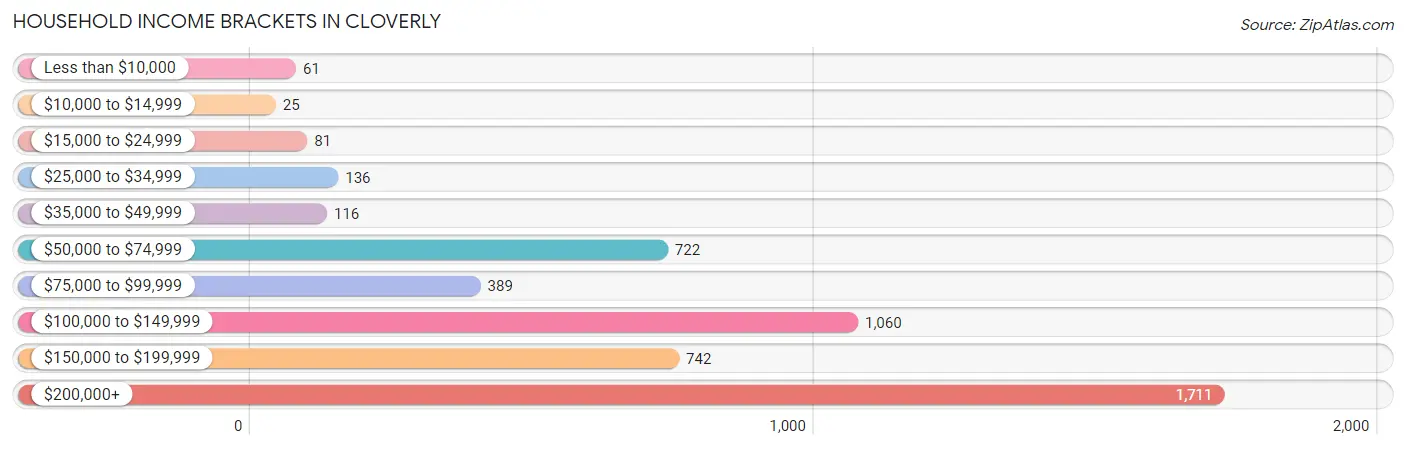
| Income Bracket | # Households | % Households |
| Less than $10,000 | 61 | 1.2% |
| $10,000 to $14,999 | 25 | 0.5% |
| $15,000 to $24,999 | 81 | 1.6% |
| $25,000 to $34,999 | 136 | 2.7% |
| $35,000 to $49,999 | 116 | 2.3% |
| $50,000 to $74,999 | 722 | 14.3% |
| $75,000 to $99,999 | 389 | 7.7% |
| $100,000 to $149,999 | 1,060 | 21.0% |
| $150,000 to $199,999 | 742 | 14.7% |
| $200,000+ | 1,711 | 33.9% |
Household Income by Householder Age in Cloverly
The median household income in Cloverly is $144,003, with the highest median household income of $162,115 found in the 25 to 44 years age bracket for the primary householder. A total of 1,098 households (21.8%) fall into this category. Meanwhile, the 15 to 24 years age bracket for the primary householder has the lowest median household income of $0, with 28 households (0.5%) in this group.
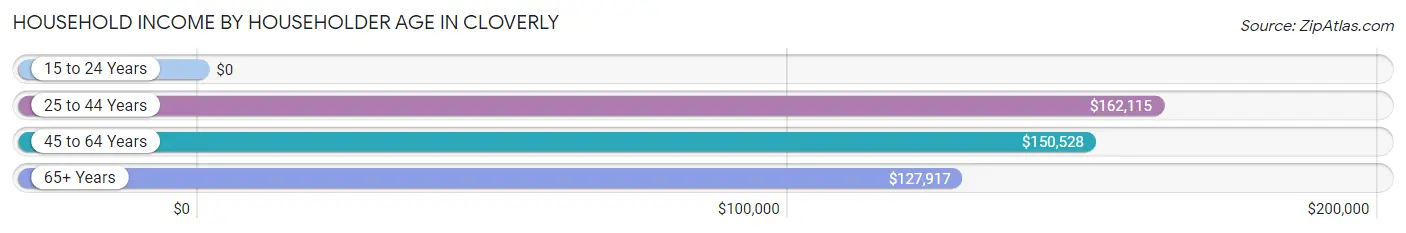
| Income Bracket | # Households | Median Income |
| 15 to 24 Years | 28 (0.5%) | $0 |
| 25 to 44 Years | 1,098 (21.8%) | $162,115 |
| 45 to 64 Years | 2,379 (47.1%) | $150,528 |
| 65+ Years | 1,542 (30.5%) | $127,917 |
| Total | 5,047 (100.0%) | $144,003 |
Poverty in Cloverly
Income Below Poverty by Sex and Age in Cloverly
With 3.2% poverty level for males and 3.4% for females among the residents of Cloverly, 16 and 17 year old males and 18 to 24 year old females are the most vulnerable to poverty, with 66 males (20.2%) and 92 females (12.0%) in their respective age groups living below the poverty level.
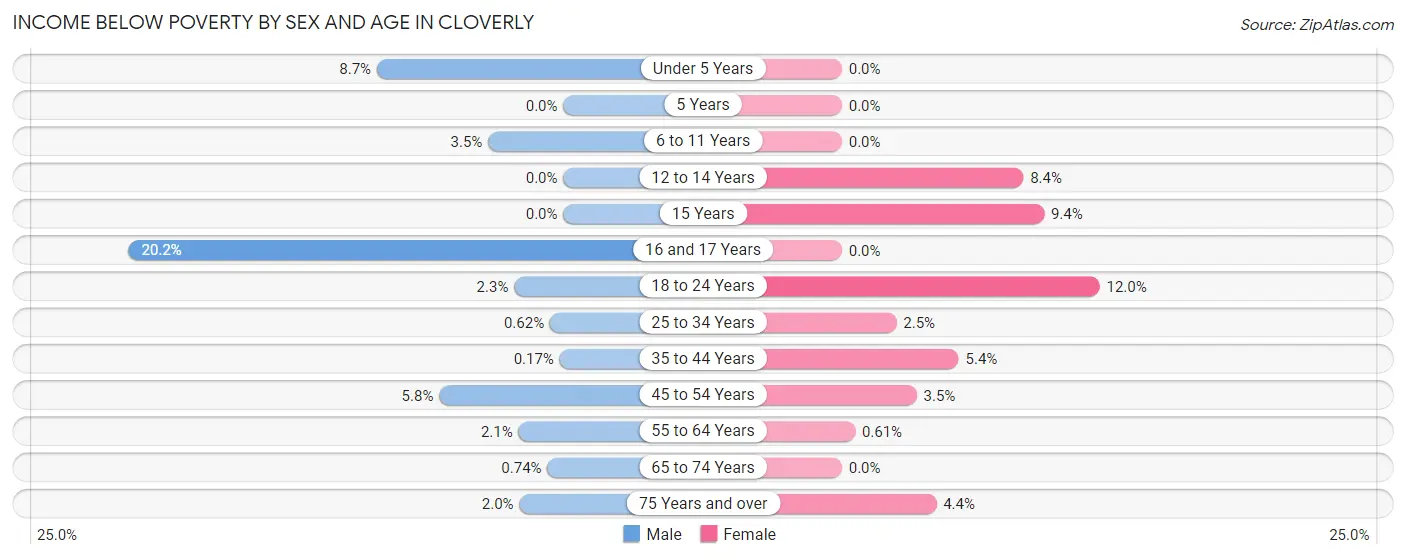
| Age Bracket | Male | Female |
| Under 5 Years | 45 (8.6%) | 0 (0.0%) |
| 5 Years | 0 (0.0%) | 0 (0.0%) |
| 6 to 11 Years | 18 (3.5%) | 0 (0.0%) |
| 12 to 14 Years | 0 (0.0%) | 25 (8.4%) |
| 15 Years | 0 (0.0%) | 9 (9.4%) |
| 16 and 17 Years | 66 (20.2%) | 0 (0.0%) |
| 18 to 24 Years | 16 (2.3%) | 92 (12.0%) |
| 25 to 34 Years | 5 (0.6%) | 16 (2.5%) |
| 35 to 44 Years | 2 (0.2%) | 57 (5.4%) |
| 45 to 54 Years | 65 (5.8%) | 35 (3.5%) |
| 55 to 64 Years | 27 (2.1%) | 7 (0.6%) |
| 65 to 74 Years | 7 (0.7%) | 0 (0.0%) |
| 75 Years and over | 11 (2.0%) | 34 (4.4%) |
| Total | 262 (3.2%) | 275 (3.4%) |
Income Above Poverty by Sex and Age in Cloverly
According to the poverty statistics in Cloverly, males aged 5 years and females aged under 5 years are the age groups that are most secure financially, with 100.0% of males and 100.0% of females in these age groups living above the poverty line.
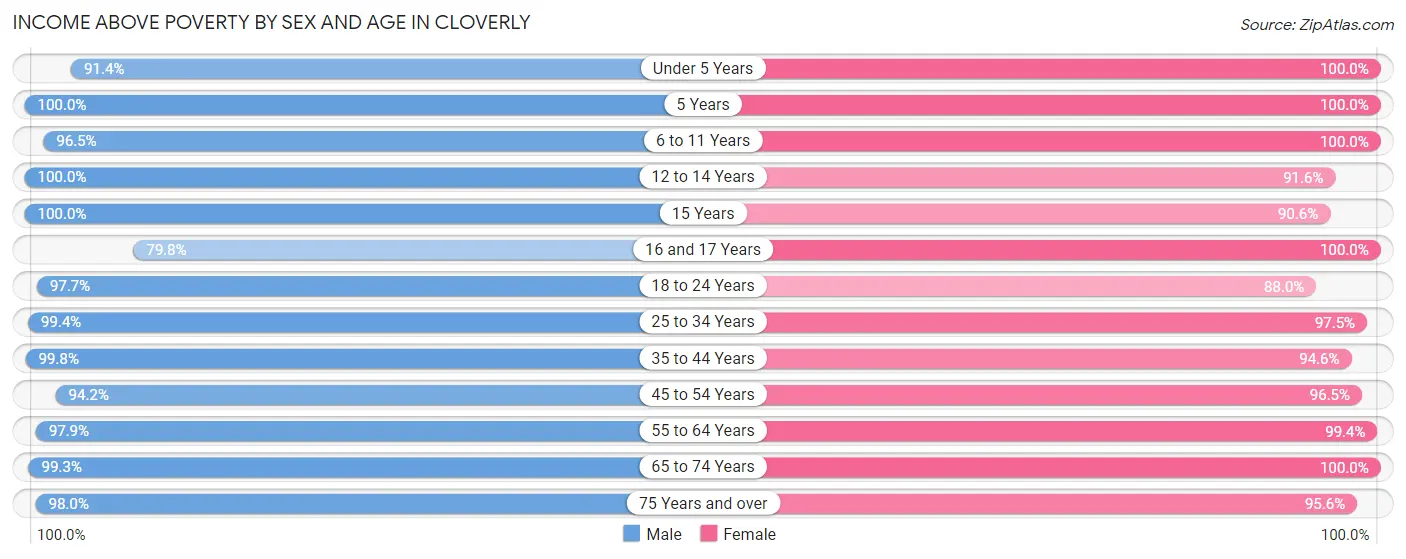
| Age Bracket | Male | Female |
| Under 5 Years | 475 (91.3%) | 390 (100.0%) |
| 5 Years | 108 (100.0%) | 61 (100.0%) |
| 6 to 11 Years | 498 (96.5%) | 667 (100.0%) |
| 12 to 14 Years | 115 (100.0%) | 272 (91.6%) |
| 15 Years | 156 (100.0%) | 87 (90.6%) |
| 16 and 17 Years | 261 (79.8%) | 249 (100.0%) |
| 18 to 24 Years | 687 (97.7%) | 677 (88.0%) |
| 25 to 34 Years | 806 (99.4%) | 616 (97.5%) |
| 35 to 44 Years | 1,146 (99.8%) | 994 (94.6%) |
| 45 to 54 Years | 1,063 (94.2%) | 975 (96.5%) |
| 55 to 64 Years | 1,270 (97.9%) | 1,138 (99.4%) |
| 65 to 74 Years | 934 (99.3%) | 873 (100.0%) |
| 75 Years and over | 528 (98.0%) | 743 (95.6%) |
| Total | 8,047 (96.9%) | 7,742 (96.6%) |
Income Below Poverty Among Married-Couple Families in Cloverly
The poverty statistics for married-couple families in Cloverly show that 2.2% or 87 of the total 3,906 families live below the poverty line. Families with 1 or 2 children have the highest poverty rate of 6.1%, comprising of 77 families. On the other hand, families with 3 or 4 children have the lowest poverty rate of 0.0%, which includes 0 families.
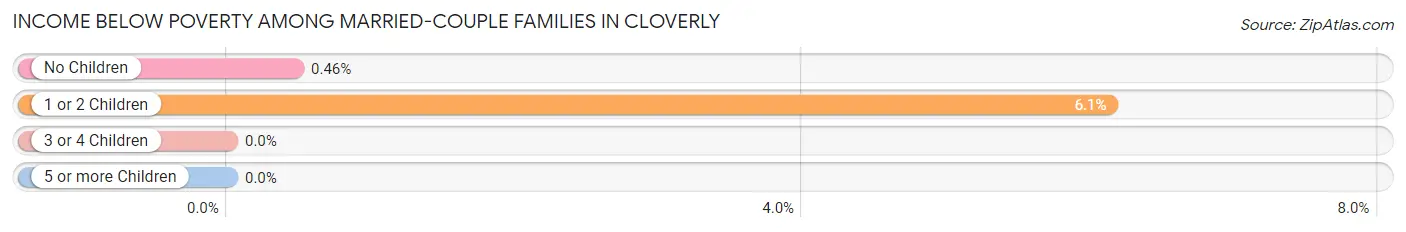
| Children | Above Poverty | Below Poverty |
| No Children | 2,160 (99.5%) | 10 (0.5%) |
| 1 or 2 Children | 1,180 (93.9%) | 77 (6.1%) |
| 3 or 4 Children | 460 (100.0%) | 0 (0.0%) |
| 5 or more Children | 19 (100.0%) | 0 (0.0%) |
| Total | 3,819 (97.8%) | 87 (2.2%) |
Income Below Poverty Among Single-Parent Households in Cloverly
According to the poverty data in Cloverly, 3.6% or 6 single-father households and 14.4% or 53 single-mother households are living below the poverty line. Among single-father households, those with 1 or 2 children have the highest poverty rate, with 6 households (7.6%) experiencing poverty. Likewise, among single-mother households, those with 1 or 2 children have the highest poverty rate, with 53 households (39.3%) falling below the poverty line.
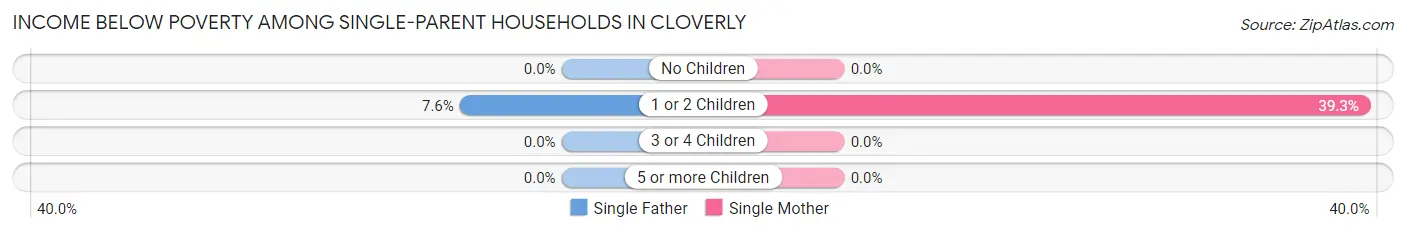
| Children | Single Father | Single Mother |
| No Children | 0 (0.0%) | 0 (0.0%) |
| 1 or 2 Children | 6 (7.6%) | 53 (39.3%) |
| 3 or 4 Children | 0 (0.0%) | 0 (0.0%) |
| 5 or more Children | 0 (0.0%) | 0 (0.0%) |
| Total | 6 (3.6%) | 53 (14.4%) |
Income Below Poverty Among Married-Couple vs Single-Parent Households in Cloverly
The poverty data for Cloverly shows that 87 of the married-couple family households (2.2%) and 59 of the single-parent households (11.0%) are living below the poverty level. Within the married-couple family households, those with 1 or 2 children have the highest poverty rate, with 77 households (6.1%) falling below the poverty line. Among the single-parent households, those with 1 or 2 children have the highest poverty rate, with 59 household (27.6%) living below poverty.
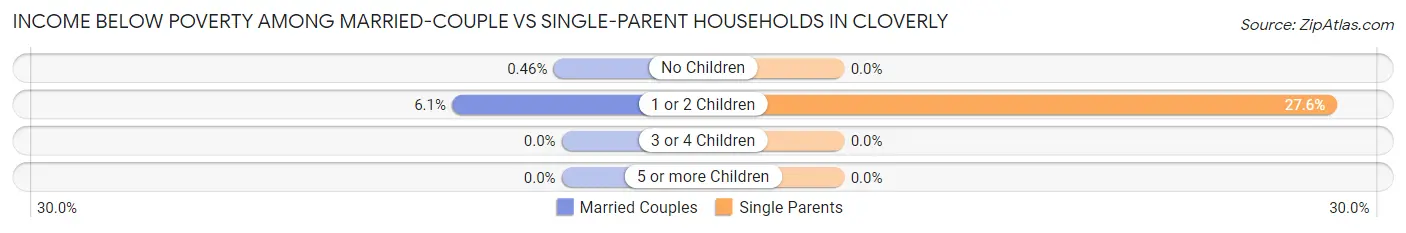
| Children | Married-Couple Families | Single-Parent Households |
| No Children | 10 (0.5%) | 0 (0.0%) |
| 1 or 2 Children | 77 (6.1%) | 59 (27.6%) |
| 3 or 4 Children | 0 (0.0%) | 0 (0.0%) |
| 5 or more Children | 0 (0.0%) | 0 (0.0%) |
| Total | 87 (2.2%) | 59 (11.0%) |
Race in Cloverly
The most populous races in Cloverly are White / Caucasian (5,663 | 34.4%), Black / African American (4,283 | 26.1%), and Hispanic or Latino (2,959 | 18.0%).
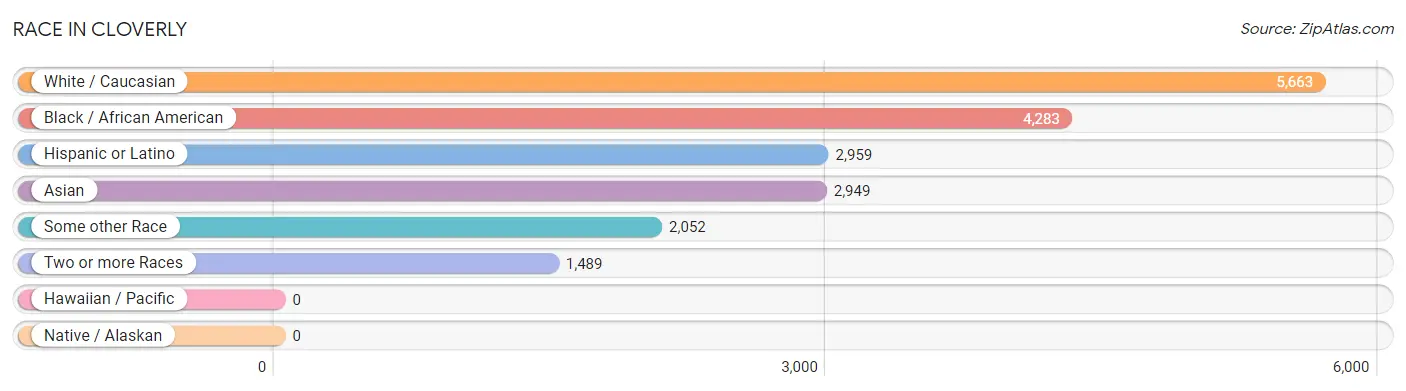
| Race | # Population | % Population |
| Asian | 2,949 | 17.9% |
| Black / African American | 4,283 | 26.1% |
| Hawaiian / Pacific | 0 | 0.0% |
| Hispanic or Latino | 2,959 | 18.0% |
| Native / Alaskan | 0 | 0.0% |
| White / Caucasian | 5,663 | 34.4% |
| Two or more Races | 1,489 | 9.1% |
| Some other Race | 2,052 | 12.5% |
| Total | 16,436 | 100.0% |
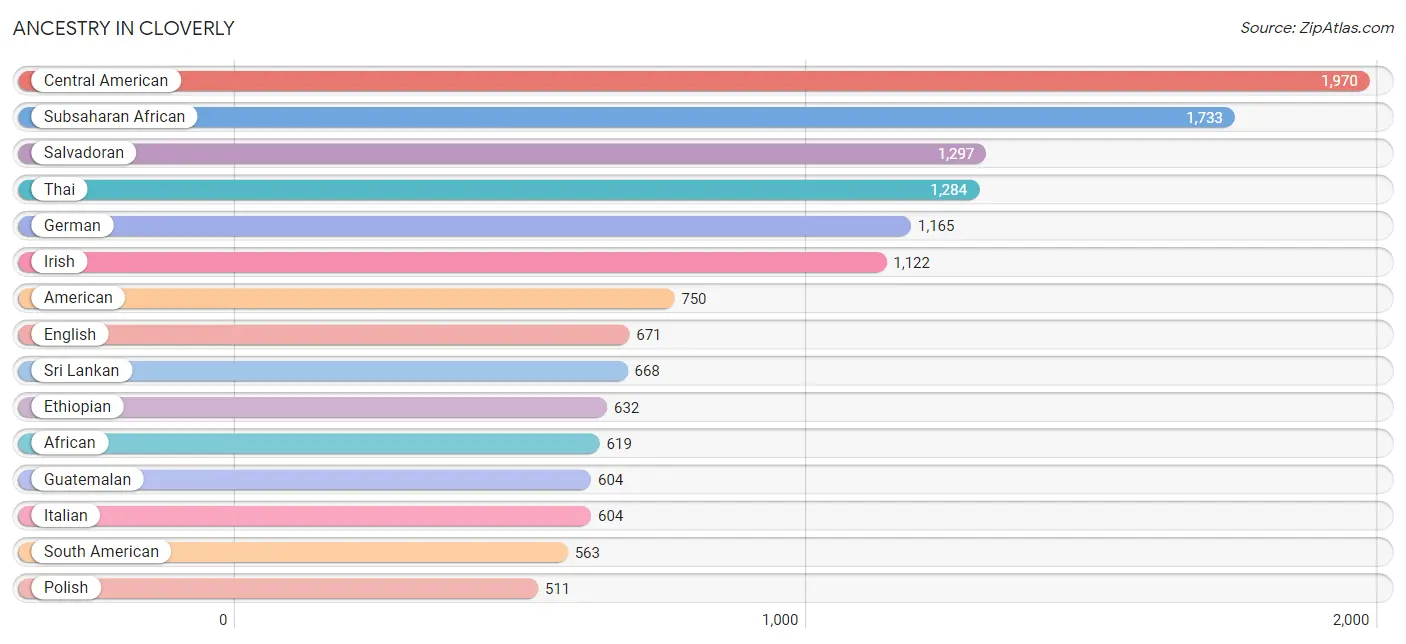
Ancestry in Cloverly
The most populous ancestries reported in Cloverly are Central American (1,970 | 12.0%), Subsaharan African (1,733 | 10.5%), Salvadoran (1,297 | 7.9%), Thai (1,284 | 7.8%), and German (1,165 | 7.1%), together accounting for 45.3% of all Cloverly residents.
| Ancestry | # Population | % Population |
| Afghan | 2 | 0.0% |
| African | 619 | 3.8% |
| Albanian | 6 | 0.0% |
| Alsatian | 7 | 0.0% |
| American | 750 | 4.6% |
| Arab | 184 | 1.1% |
| Austrian | 44 | 0.3% |
| Belgian | 13 | 0.1% |
| Belizean | 43 | 0.3% |
| Bhutanese | 26 | 0.2% |
| Bolivian | 26 | 0.2% |
| Brazilian | 11 | 0.1% |
| British | 105 | 0.6% |
| Burmese | 146 | 0.9% |
| Central American | 1,970 | 12.0% |
| Colombian | 204 | 1.2% |
| Croatian | 10 | 0.1% |
| Czech | 44 | 0.3% |
| Danish | 30 | 0.2% |
| Dominican | 35 | 0.2% |
| Dutch | 44 | 0.3% |
| Eastern European | 51 | 0.3% |
| Ecuadorian | 241 | 1.5% |
| Egyptian | 3 | 0.0% |
| English | 671 | 4.1% |
| Ethiopian | 632 | 3.8% |
| European | 187 | 1.1% |
| Filipino | 19 | 0.1% |
| French | 358 | 2.2% |
| German | 1,165 | 7.1% |
| Ghanaian | 39 | 0.2% |
| Greek | 180 | 1.1% |
| Guatemalan | 604 | 3.7% |
| Guyanese | 12 | 0.1% |
| Haitian | 203 | 1.2% |
| Hungarian | 90 | 0.5% |
| Indian (Asian) | 369 | 2.2% |
| Indonesian | 30 | 0.2% |
| Iranian | 38 | 0.2% |
| Irish | 1,122 | 6.8% |
| Italian | 604 | 3.7% |
| Jamaican | 121 | 0.7% |
| Japanese | 2 | 0.0% |
| Kenyan | 28 | 0.2% |
| Korean | 147 | 0.9% |
| Lebanese | 25 | 0.2% |
| Lithuanian | 33 | 0.2% |
| Mexican | 164 | 1.0% |
| Mexican American Indian | 5 | 0.0% |
| Moroccan | 13 | 0.1% |
| Nicaraguan | 69 | 0.4% |
| Nigerian | 51 | 0.3% |
| Norwegian | 57 | 0.4% |
| Pakistani | 43 | 0.3% |
| Peruvian | 38 | 0.2% |
| Polish | 511 | 3.1% |
| Portuguese | 9 | 0.1% |
| Puerto Rican | 96 | 0.6% |
| Romanian | 32 | 0.2% |
| Russian | 365 | 2.2% |
| Salvadoran | 1,297 | 7.9% |
| Scandinavian | 20 | 0.1% |
| Scotch-Irish | 28 | 0.2% |
| Scottish | 130 | 0.8% |
| Slovak | 4 | 0.0% |
| Somali | 16 | 0.1% |
| South African | 14 | 0.1% |
| South American | 563 | 3.4% |
| Spaniard | 20 | 0.1% |
| Spanish | 3 | 0.0% |
| Sri Lankan | 668 | 4.1% |
| Subsaharan African | 1,733 | 10.5% |
| Swedish | 53 | 0.3% |
| Swiss | 72 | 0.4% |
| Syrian | 9 | 0.1% |
| Thai | 1,284 | 7.8% |
| Trinidadian and Tobagonian | 125 | 0.8% |
| Turkish | 57 | 0.4% |
| Ukrainian | 47 | 0.3% |
| Venezuelan | 35 | 0.2% |
| Vietnamese | 66 | 0.4% |
| Welsh | 79 | 0.5% |
| West Indian | 37 | 0.2% | View All 83 Rows |
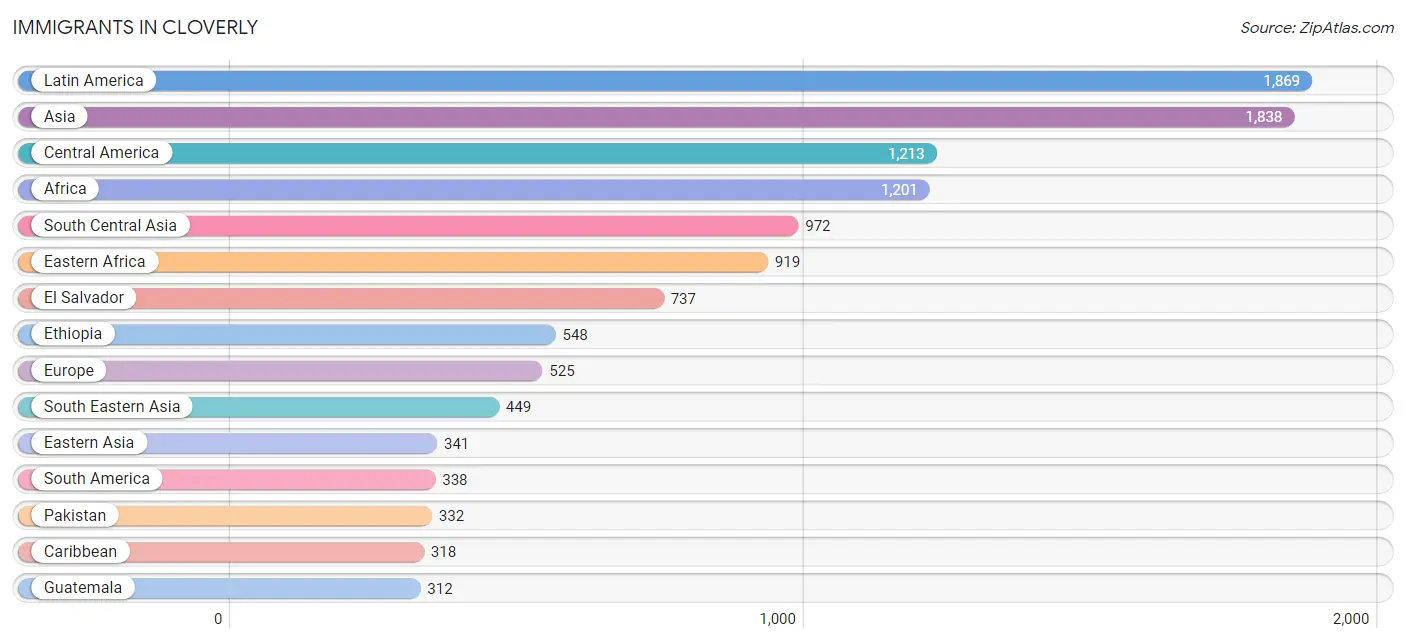
Immigrants in Cloverly
The most numerous immigrant groups reported in Cloverly came from Latin America (1,869 | 11.4%), Asia (1,838 | 11.2%), Central America (1,213 | 7.4%), Africa (1,201 | 7.3%), and South Central Asia (972 | 5.9%), together accounting for 43.1% of all Cloverly residents.
| Immigration Origin | # Population | % Population |
| Afghanistan | 2 | 0.0% |
| Africa | 1,201 | 7.3% |
| Albania | 18 | 0.1% |
| Asia | 1,838 | 11.2% |
| Bangladesh | 138 | 0.8% |
| Belize | 43 | 0.3% |
| Brazil | 31 | 0.2% |
| Cambodia | 2 | 0.0% |
| Cameroon | 19 | 0.1% |
| Canada | 6 | 0.0% |
| Caribbean | 318 | 1.9% |
| Central America | 1,213 | 7.4% |
| China | 216 | 1.3% |
| Colombia | 120 | 0.7% |
| Dominican Republic | 17 | 0.1% |
| Eastern Africa | 919 | 5.6% |
| Eastern Asia | 341 | 2.1% |
| Eastern Europe | 273 | 1.7% |
| Ecuador | 94 | 0.6% |
| El Salvador | 737 | 4.5% |
| England | 15 | 0.1% |
| Eritrea | 65 | 0.4% |
| Ethiopia | 548 | 3.3% |
| Europe | 525 | 3.2% |
| Germany | 22 | 0.1% |
| Greece | 16 | 0.1% |
| Guatemala | 312 | 1.9% |
| Guyana | 12 | 0.1% |
| Haiti | 60 | 0.4% |
| Hong Kong | 6 | 0.0% |
| India | 282 | 1.7% |
| Iran | 38 | 0.2% |
| Israel | 8 | 0.1% |
| Italy | 144 | 0.9% |
| Jamaica | 116 | 0.7% |
| Jordan | 53 | 0.3% |
| Kenya | 14 | 0.1% |
| Korea | 125 | 0.8% |
| Latin America | 1,869 | 11.4% |
| Mexico | 52 | 0.3% |
| Middle Africa | 123 | 0.7% |
| Moldova | 18 | 0.1% |
| Morocco | 13 | 0.1% |
| Netherlands | 19 | 0.1% |
| Nicaragua | 69 | 0.4% |
| Nigeria | 64 | 0.4% |
| Northern Africa | 52 | 0.3% |
| Northern Europe | 31 | 0.2% |
| Pakistan | 332 | 2.0% |
| Peru | 38 | 0.2% |
| Philippines | 84 | 0.5% |
| Poland | 39 | 0.2% |
| Russia | 198 | 1.2% |
| Somalia | 11 | 0.1% |
| South Africa | 29 | 0.2% |
| South America | 338 | 2.1% |
| South Central Asia | 972 | 5.9% |
| South Eastern Asia | 449 | 2.7% |
| Southern Europe | 167 | 1.0% |
| Spain | 7 | 0.0% |
| Sudan | 23 | 0.1% |
| Sweden | 16 | 0.1% |
| Switzerland | 13 | 0.1% |
| Taiwan | 154 | 0.9% |
| Thailand | 16 | 0.1% |
| Trinidad and Tobago | 125 | 0.8% |
| Turkey | 15 | 0.1% |
| Uganda | 47 | 0.3% |
| Uzbekistan | 180 | 1.1% |
| Venezuela | 18 | 0.1% |
| Vietnam | 282 | 1.7% |
| Western Africa | 78 | 0.5% |
| Western Asia | 76 | 0.5% |
| Western Europe | 54 | 0.3% | View All 74 Rows |
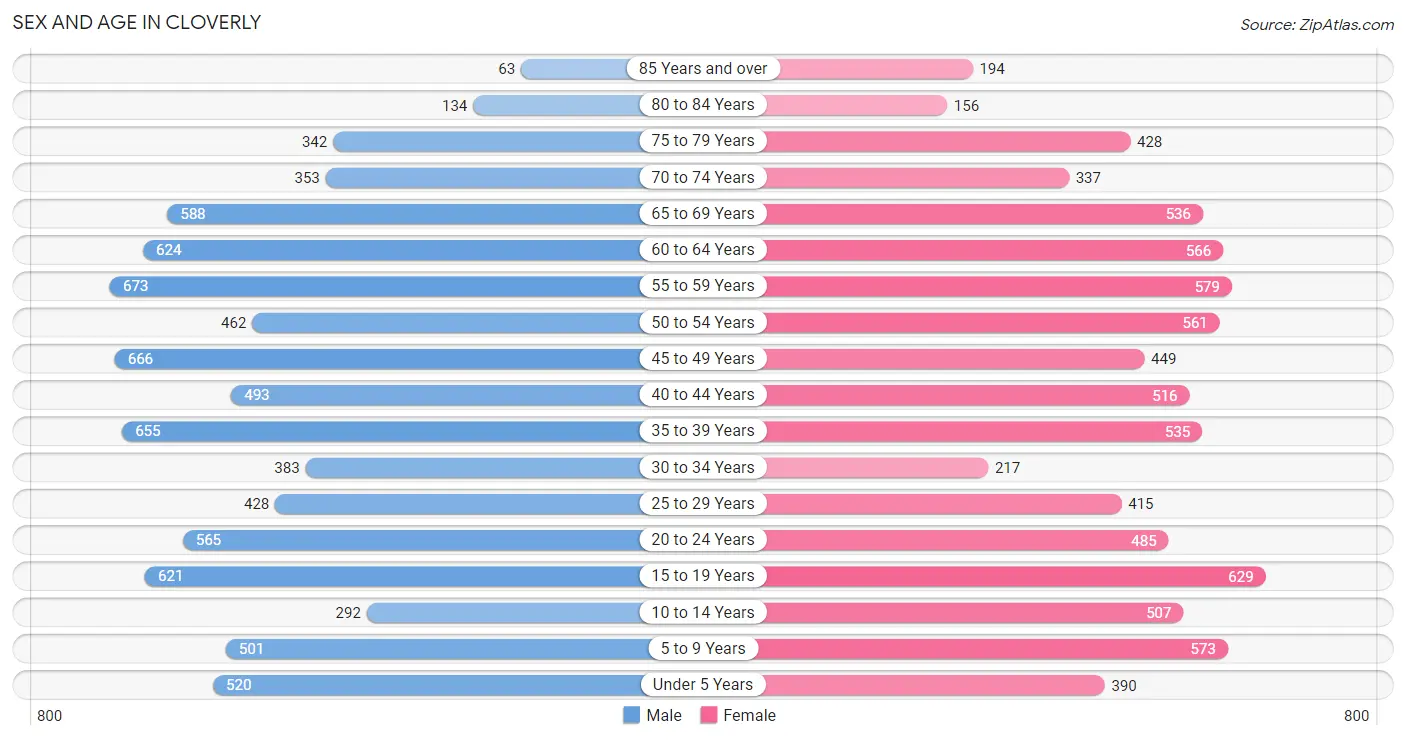
Sex and Age in Cloverly
Sex and Age in Cloverly
The most populous age groups in Cloverly are 55 to 59 Years (673 | 8.1%) for men and 15 to 19 Years (629 | 7.8%) for women.
| Age Bracket | Male | Female |
| Under 5 Years | 520 (6.2%) | 390 (4.8%) |
| 5 to 9 Years | 501 (6.0%) | 573 (7.1%) |
| 10 to 14 Years | 292 (3.5%) | 507 (6.3%) |
| 15 to 19 Years | 621 (7.4%) | 629 (7.8%) |
| 20 to 24 Years | 565 (6.8%) | 485 (6.0%) |
| 25 to 29 Years | 428 (5.1%) | 415 (5.1%) |
| 30 to 34 Years | 383 (4.6%) | 217 (2.7%) |
| 35 to 39 Years | 655 (7.8%) | 535 (6.6%) |
| 40 to 44 Years | 493 (5.9%) | 516 (6.4%) |
| 45 to 49 Years | 666 (8.0%) | 449 (5.6%) |
| 50 to 54 Years | 462 (5.5%) | 561 (7.0%) |
| 55 to 59 Years | 673 (8.1%) | 579 (7.2%) |
| 60 to 64 Years | 624 (7.5%) | 566 (7.0%) |
| 65 to 69 Years | 588 (7.0%) | 536 (6.6%) |
| 70 to 74 Years | 353 (4.2%) | 337 (4.2%) |
| 75 to 79 Years | 342 (4.1%) | 428 (5.3%) |
| 80 to 84 Years | 134 (1.6%) | 156 (1.9%) |
| 85 Years and over | 63 (0.7%) | 194 (2.4%) |
| Total | 8,363 (100.0%) | 8,073 (100.0%) |
Families and Households in Cloverly
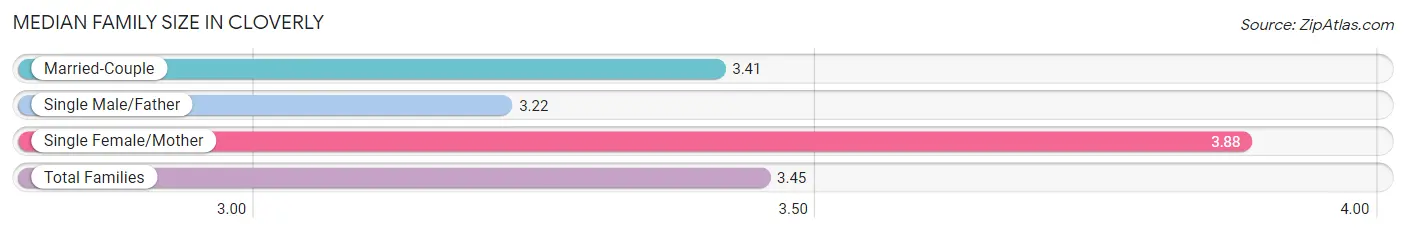
Median Family Size in Cloverly
The median family size in Cloverly is 3.45 persons per family, with single female/mother families (368 | 8.3%) accounting for the largest median family size of 3.88 persons per family. On the other hand, single male/father families (167 | 3.8%) represent the smallest median family size with 3.22 persons per family.
| Family Type | # Families | Family Size |
| Married-Couple | 3,906 (87.9%) | 3.41 |
| Single Male/Father | 167 (3.8%) | 3.22 |
| Single Female/Mother | 368 (8.3%) | 3.88 |
| Total Families | 4,441 (100.0%) | 3.45 |
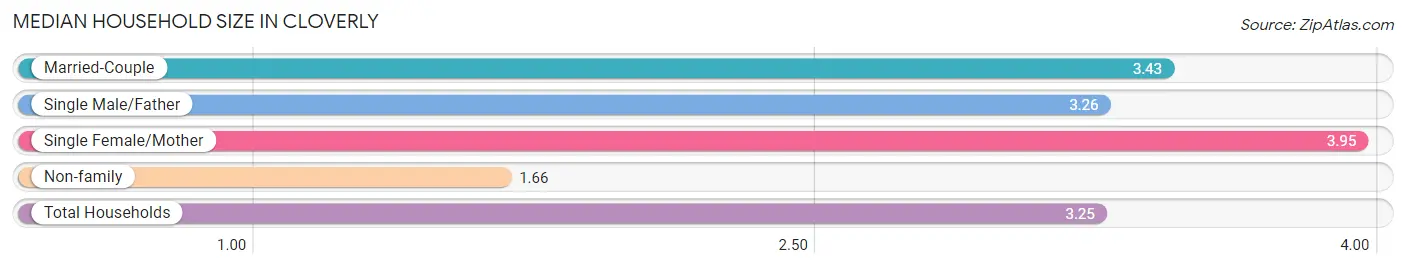
Median Household Size in Cloverly
The median household size in Cloverly is 3.25 persons per household, with single female/mother households (368 | 7.3%) accounting for the largest median household size of 3.95 persons per household. non-family households (606 | 12.0%) represent the smallest median household size with 1.66 persons per household.
| Household Type | # Households | Household Size |
| Married-Couple | 3,906 (77.4%) | 3.43 |
| Single Male/Father | 167 (3.3%) | 3.26 |
| Single Female/Mother | 368 (7.3%) | 3.95 |
| Non-family | 606 (12.0%) | 1.66 |
| Total Households | 5,047 (100.0%) | 3.25 |
Household Size by Marriage Status in Cloverly
Out of a total of 5,047 households in Cloverly, 4,441 (88.0%) are family households, while 606 (12.0%) are nonfamily households. The most numerous type of family households are 2-person households, comprising 1,378, and the most common type of nonfamily households are 1-person households, comprising 414.
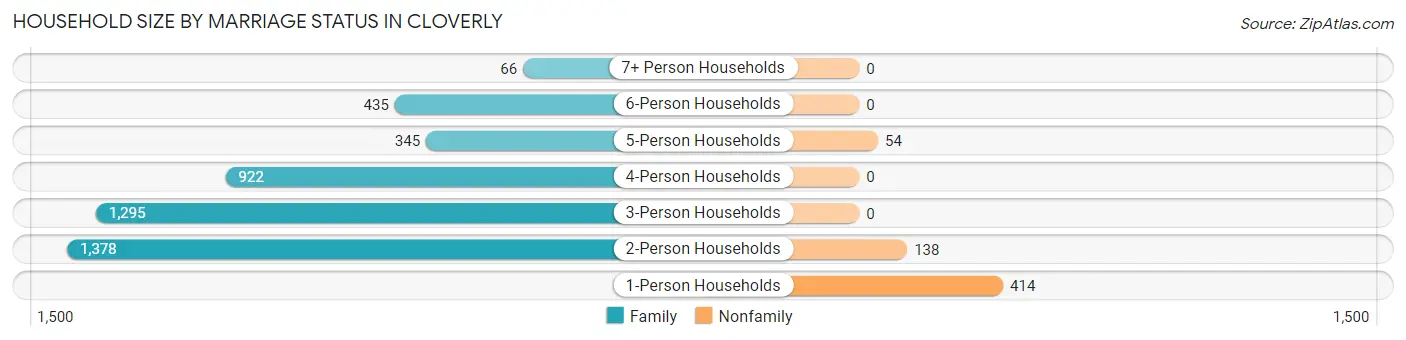
| Household Size | Family Households | Nonfamily Households |
| 1-Person Households | - | 414 (8.2%) |
| 2-Person Households | 1,378 (27.3%) | 138 (2.7%) |
| 3-Person Households | 1,295 (25.7%) | 0 (0.0%) |
| 4-Person Households | 922 (18.3%) | 0 (0.0%) |
| 5-Person Households | 345 (6.8%) | 54 (1.1%) |
| 6-Person Households | 435 (8.6%) | 0 (0.0%) |
| 7+ Person Households | 66 (1.3%) | 0 (0.0%) |
| Total | 4,441 (88.0%) | 606 (12.0%) |
Female Fertility in Cloverly
Fertility by Age in Cloverly
Average fertility rate in Cloverly is 14.0 births per 1,000 women. Women in the age bracket of 35 to 50 years have the highest fertility rate with 22.0 births per 1,000 women. Women in the age bracket of 35 to 50 years acount for 72.9% of all women with births.
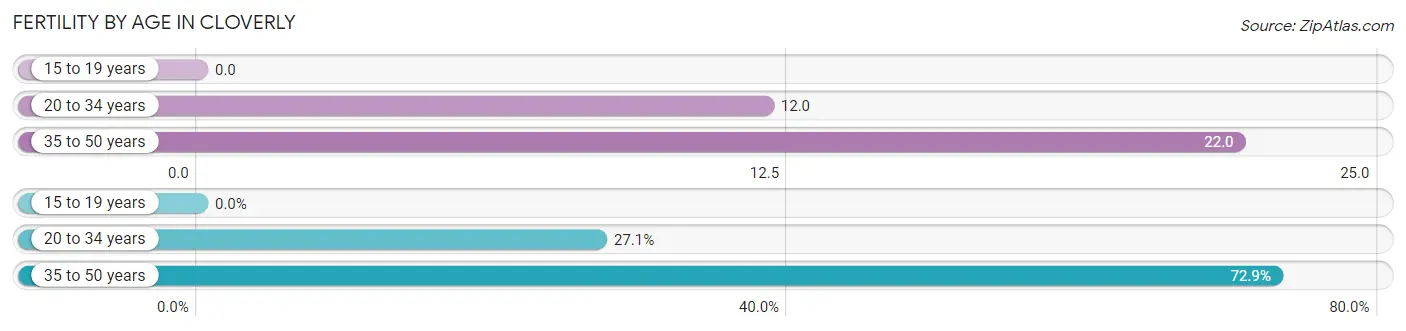
| Age Bracket | Women with Births | Births / 1,000 Women |
| 15 to 19 years | 0 (0.0%) | 0.0 |
| 20 to 34 years | 13 (27.1%) | 12.0 |
| 35 to 50 years | 35 (72.9%) | 22.0 |
| Total | 48 (100.0%) | 14.0 |
Fertility by Age by Marriage Status in Cloverly
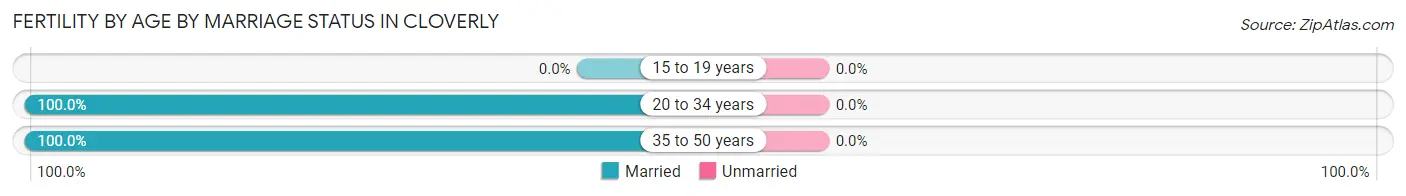
| Age Bracket | Married | Unmarried |
| 15 to 19 years | 0 (0.0%) | 0 (0.0%) |
| 20 to 34 years | 13 (100.0%) | 0 (0.0%) |
| 35 to 50 years | 35 (100.0%) | 0 (0.0%) |
| Total | 48 (100.0%) | 0 (0.0%) |
Fertility by Education in Cloverly
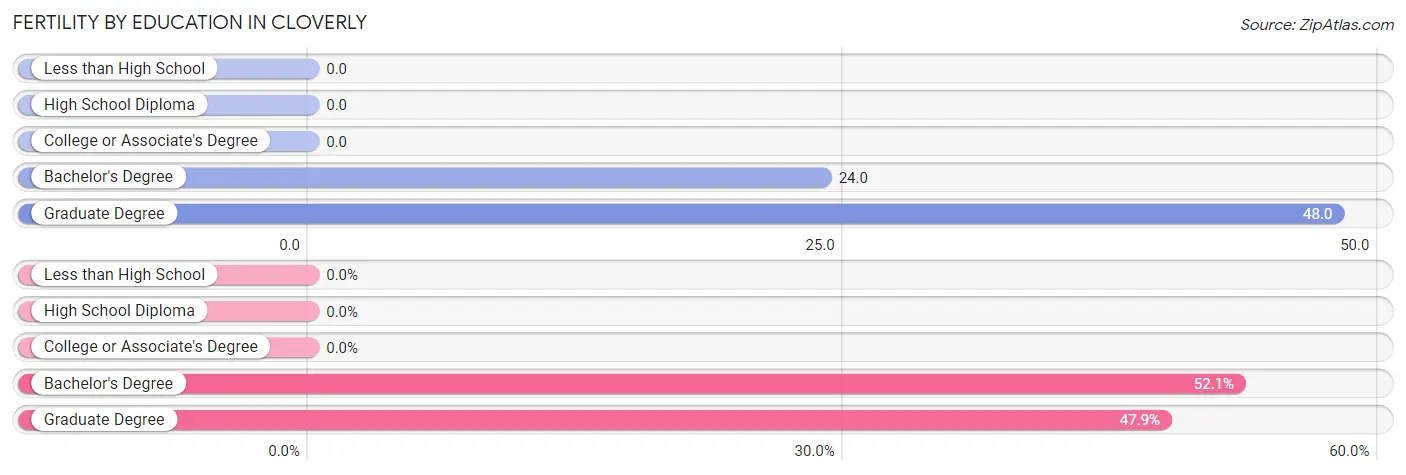
| Educational Attainment | Women with Births | Births / 1,000 Women |
| Less than High School | 0 (0.0%) | 0.0 |
| High School Diploma | 0 (0.0%) | 0.0 |
| College or Associate's Degree | 0 (0.0%) | 0.0 |
| Bachelor's Degree | 25 (52.1%) | 24.0 |
| Graduate Degree | 23 (47.9%) | 48.0 |
| Total | 48 (100.0%) | 14.0 |
Fertility by Education by Marriage Status in Cloverly
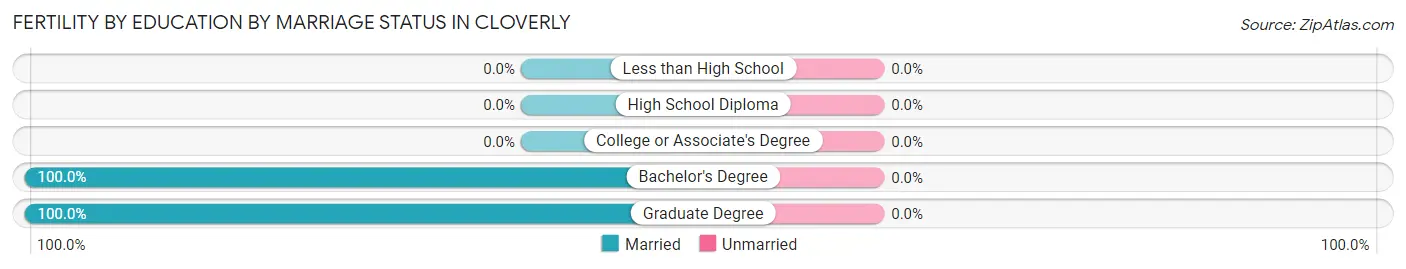
| Educational Attainment | Married | Unmarried |
| Less than High School | 0 (0.0%) | 0 (0.0%) |
| High School Diploma | 0 (0.0%) | 0 (0.0%) |
| College or Associate's Degree | 0 (0.0%) | 0 (0.0%) |
| Bachelor's Degree | 25 (100.0%) | 0 (0.0%) |
| Graduate Degree | 23 (100.0%) | 0 (0.0%) |
| Total | 48 (100.0%) | 0 (0.0%) |
Employment Characteristics in Cloverly
Employment by Class of Employer in Cloverly
Among the 7,723 employed individuals in Cloverly, private company employees (3,849 | 49.8%), federal government employees (1,092 | 14.1%), and not-for-profit organizations (693 | 9.0%) make up the most common classes of employment.
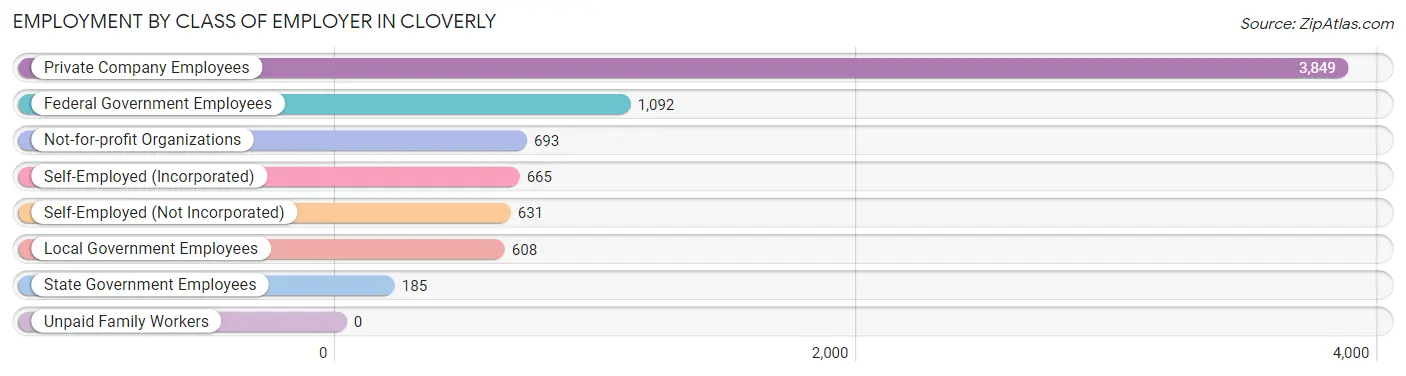
| Employer Class | # Employees | % Employees |
| Private Company Employees | 3,849 | 49.8% |
| Self-Employed (Incorporated) | 665 | 8.6% |
| Self-Employed (Not Incorporated) | 631 | 8.2% |
| Not-for-profit Organizations | 693 | 9.0% |
| Local Government Employees | 608 | 7.9% |
| State Government Employees | 185 | 2.4% |
| Federal Government Employees | 1,092 | 14.1% |
| Unpaid Family Workers | 0 | 0.0% |
| Total | 7,723 | 100.0% |
Employment Status by Age in Cloverly
According to the labor force statistics for Cloverly, out of the total population over 16 years of age (13,401), 65.5% or 8,778 individuals are in the labor force, with 7.7% or 676 of them unemployed. The age group with the highest labor force participation rate is 25 to 29 years, with 93.6% or 789 individuals in the labor force. Within the labor force, the 16 to 19 years age range has the highest percentage of unemployed individuals, with 53.2% or 164 of them being unemployed.
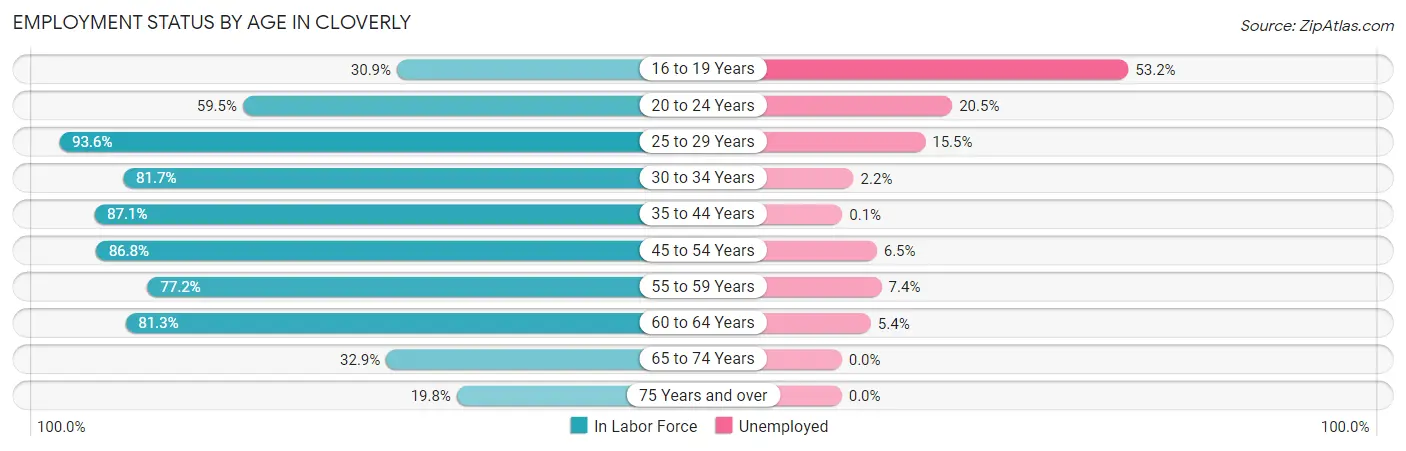
| Age Bracket | In Labor Force | Unemployed |
| 16 to 19 Years | 308 (30.9%) | 164 (53.2%) |
| 20 to 24 Years | 625 (59.5%) | 128 (20.5%) |
| 25 to 29 Years | 789 (93.6%) | 122 (15.5%) |
| 30 to 34 Years | 490 (81.7%) | 11 (2.2%) |
| 35 to 44 Years | 1,915 (87.1%) | 2 (0.1%) |
| 45 to 54 Years | 1,856 (86.8%) | 121 (6.5%) |
| 55 to 59 Years | 967 (77.2%) | 72 (7.4%) |
| 60 to 64 Years | 967 (81.3%) | 52 (5.4%) |
| 65 to 74 Years | 597 (32.9%) | 0 (0.0%) |
| 75 Years and over | 261 (19.8%) | 0 (0.0%) |
| Total | 8,778 (65.5%) | 676 (7.7%) |
Employment Status by Educational Attainment in Cloverly
According to labor force statistics for Cloverly, 84.9% of individuals (6,980) out of the total population between 25 and 64 years of age (8,222) are in the labor force, with 5.4% or 377 of them being unemployed. The group with the highest labor force participation rate are those with the educational attainment of bachelor's degree or higher, with 87.4% or 4,154 individuals in the labor force. Within the labor force, individuals with less than high school education have the highest percentage of unemployment, with 20.4% or 66 of them being unemployed.
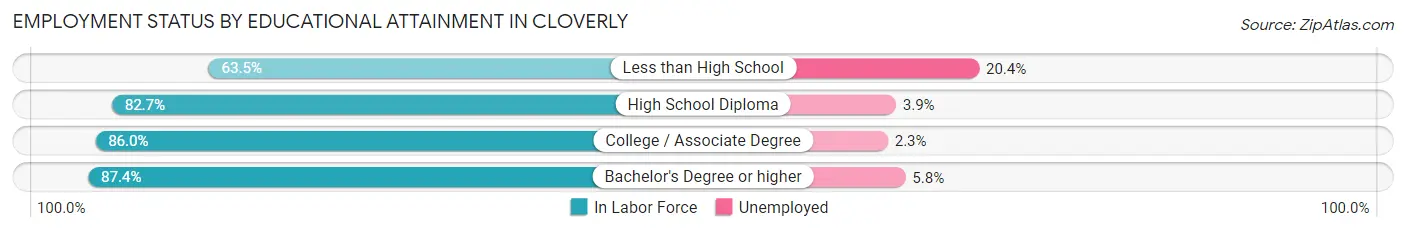
| Educational Attainment | In Labor Force | Unemployed |
| Less than High School | 324 (63.5%) | 104 (20.4%) |
| High School Diploma | 920 (82.7%) | 43 (3.9%) |
| College / Associate Degree | 1,588 (86.0%) | 42 (2.3%) |
| Bachelor's Degree or higher | 4,154 (87.4%) | 276 (5.8%) |
| Total | 6,980 (84.9%) | 444 (5.4%) |
Employment Occupations by Sex in Cloverly
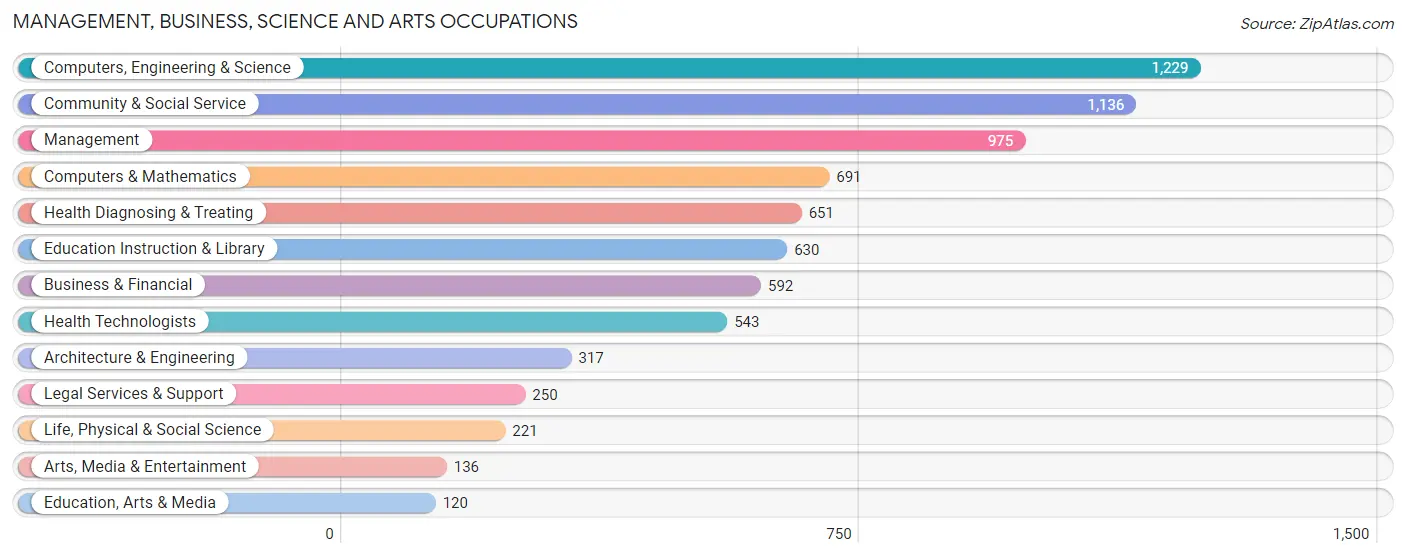
Management, Business, Science and Arts Occupations
The most common Management, Business, Science and Arts occupations in Cloverly are Computers, Engineering & Science (1,229 | 15.2%), Community & Social Service (1,136 | 14.0%), Management (975 | 12.0%), Computers & Mathematics (691 | 8.5%), and Health Diagnosing & Treating (651 | 8.0%).
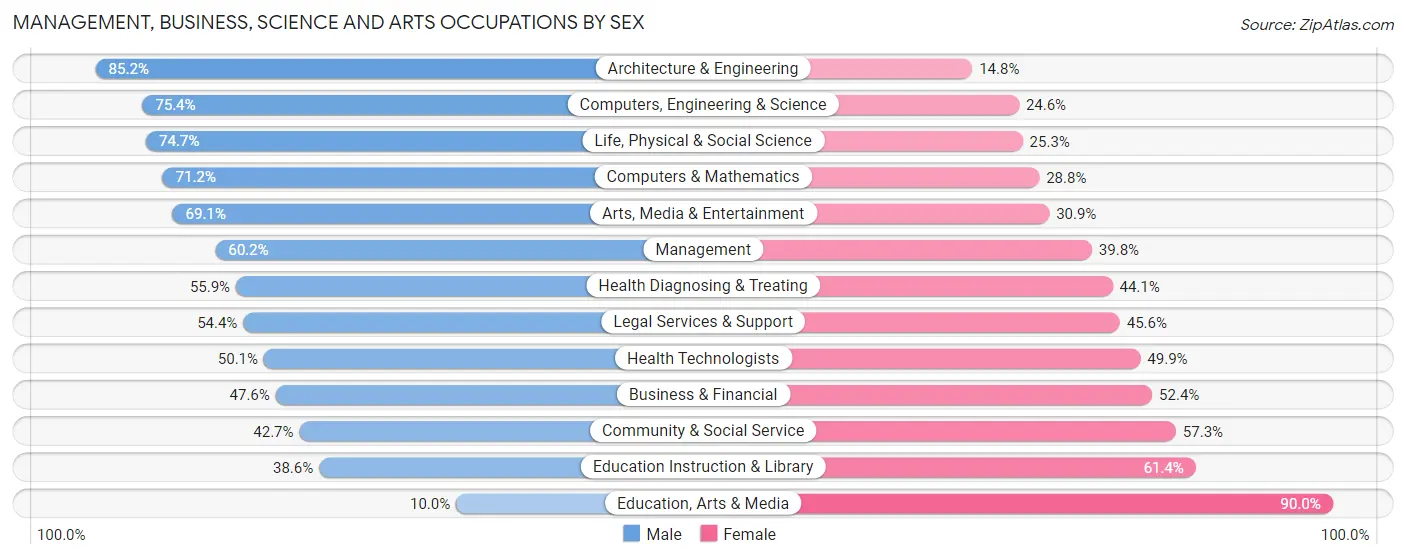
Management, Business, Science and Arts Occupations by Sex
Within the Management, Business, Science and Arts occupations in Cloverly, the most male-oriented occupations are Architecture & Engineering (85.2%), Computers, Engineering & Science (75.4%), and Life, Physical & Social Science (74.7%), while the most female-oriented occupations are Education, Arts & Media (90.0%), Education Instruction & Library (61.4%), and Community & Social Service (57.3%).
| Occupation | Male | Female |
| Management | 587 (60.2%) | 388 (39.8%) |
| Business & Financial | 282 (47.6%) | 310 (52.4%) |
| Computers, Engineering & Science | 927 (75.4%) | 302 (24.6%) |
| Computers & Mathematics | 492 (71.2%) | 199 (28.8%) |
| Architecture & Engineering | 270 (85.2%) | 47 (14.8%) |
| Life, Physical & Social Science | 165 (74.7%) | 56 (25.3%) |
| Community & Social Service | 485 (42.7%) | 651 (57.3%) |
| Education, Arts & Media | 12 (10.0%) | 108 (90.0%) |
| Legal Services & Support | 136 (54.4%) | 114 (45.6%) |
| Education Instruction & Library | 243 (38.6%) | 387 (61.4%) |
| Arts, Media & Entertainment | 94 (69.1%) | 42 (30.9%) |
| Health Diagnosing & Treating | 364 (55.9%) | 287 (44.1%) |
| Health Technologists | 272 (50.1%) | 271 (49.9%) |
| Total (Category) | 2,645 (57.7%) | 1,938 (42.3%) |
| Total (Overall) | 4,613 (57.0%) | 3,484 (43.0%) |
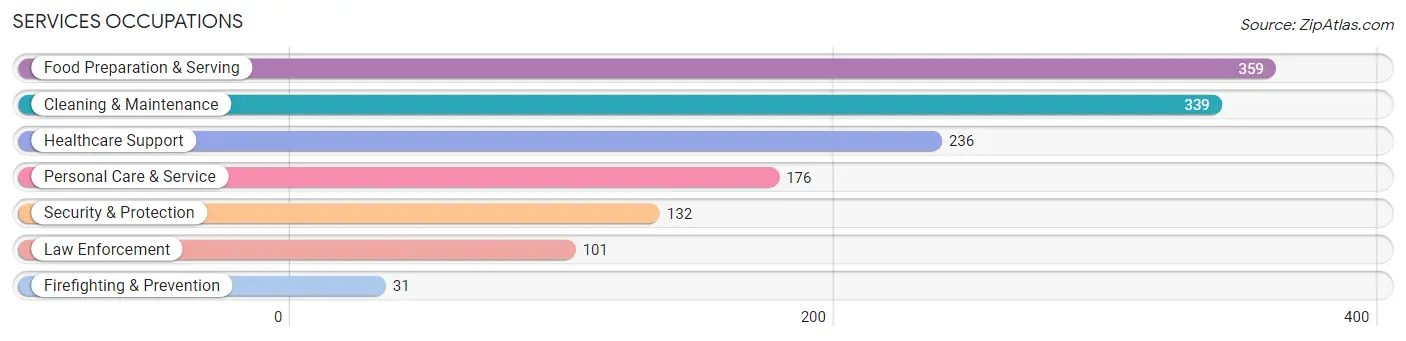
Services Occupations
The most common Services occupations in Cloverly are Food Preparation & Serving (359 | 4.4%), Cleaning & Maintenance (339 | 4.2%), Healthcare Support (236 | 2.9%), Personal Care & Service (176 | 2.2%), and Security & Protection (132 | 1.6%).
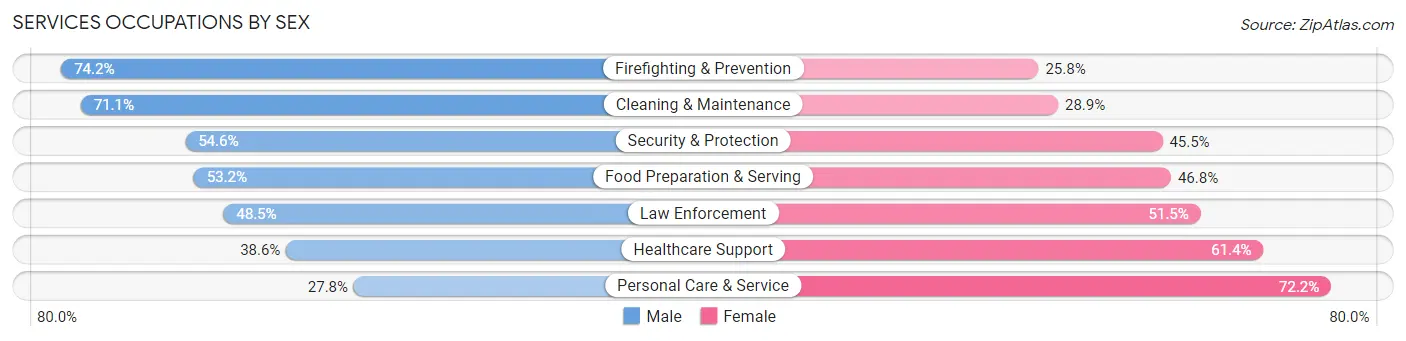
Services Occupations by Sex
Within the Services occupations in Cloverly, the most male-oriented occupations are Firefighting & Prevention (74.2%), Cleaning & Maintenance (71.1%), and Security & Protection (54.5%), while the most female-oriented occupations are Personal Care & Service (72.2%), Healthcare Support (61.4%), and Law Enforcement (51.5%).
| Occupation | Male | Female |
| Healthcare Support | 91 (38.6%) | 145 (61.4%) |
| Security & Protection | 72 (54.5%) | 60 (45.5%) |
| Firefighting & Prevention | 23 (74.2%) | 8 (25.8%) |
| Law Enforcement | 49 (48.5%) | 52 (51.5%) |
| Food Preparation & Serving | 191 (53.2%) | 168 (46.8%) |
| Cleaning & Maintenance | 241 (71.1%) | 98 (28.9%) |
| Personal Care & Service | 49 (27.8%) | 127 (72.2%) |
| Total (Category) | 644 (51.8%) | 598 (48.1%) |
| Total (Overall) | 4,613 (57.0%) | 3,484 (43.0%) |
Sales and Office Occupations
The most common Sales and Office occupations in Cloverly are Office & Administration (709 | 8.8%), and Sales & Related (557 | 6.9%).
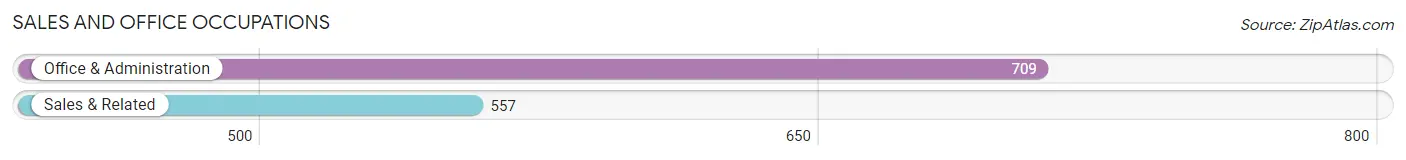
Sales and Office Occupations by Sex

| Occupation | Male | Female |
| Sales & Related | 434 (77.9%) | 123 (22.1%) |
| Office & Administration | 82 (11.6%) | 627 (88.4%) |
| Total (Category) | 516 (40.8%) | 750 (59.2%) |
| Total (Overall) | 4,613 (57.0%) | 3,484 (43.0%) |
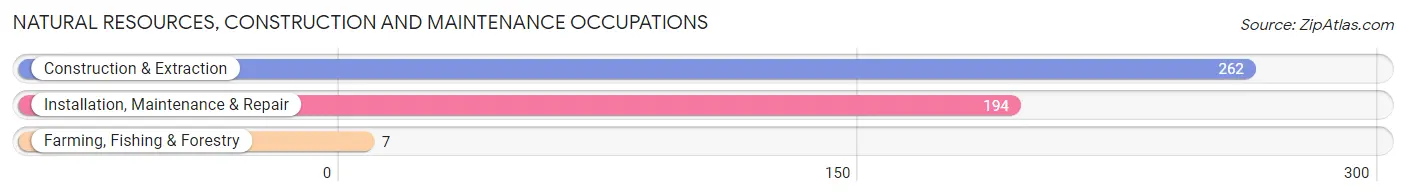
Natural Resources, Construction and Maintenance Occupations
The most common Natural Resources, Construction and Maintenance occupations in Cloverly are Construction & Extraction (262 | 3.2%), Installation, Maintenance & Repair (194 | 2.4%), and Farming, Fishing & Forestry (7 | 0.1%).
Natural Resources, Construction and Maintenance Occupations by Sex
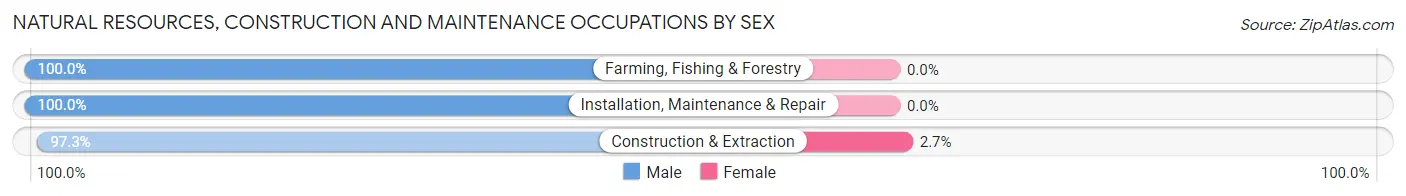
| Occupation | Male | Female |
| Farming, Fishing & Forestry | 7 (100.0%) | 0 (0.0%) |
| Construction & Extraction | 255 (97.3%) | 7 (2.7%) |
| Installation, Maintenance & Repair | 194 (100.0%) | 0 (0.0%) |
| Total (Category) | 456 (98.5%) | 7 (1.5%) |
| Total (Overall) | 4,613 (57.0%) | 3,484 (43.0%) |
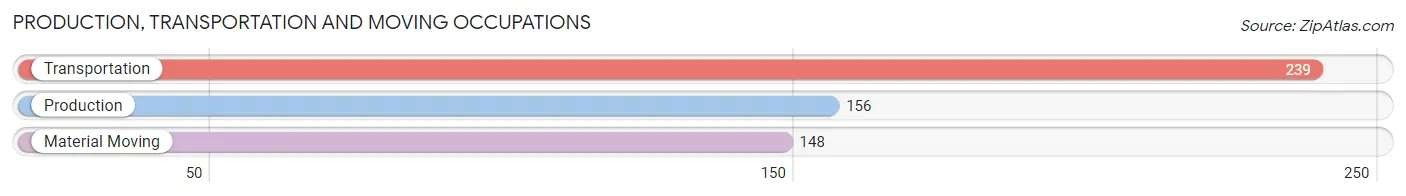
Production, Transportation and Moving Occupations
The most common Production, Transportation and Moving occupations in Cloverly are Transportation (239 | 2.9%), Production (156 | 1.9%), and Material Moving (148 | 1.8%).
Production, Transportation and Moving Occupations by Sex
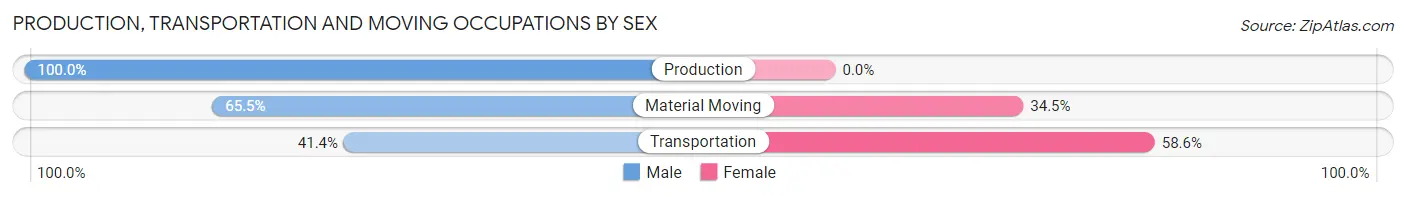
| Occupation | Male | Female |
| Production | 156 (100.0%) | 0 (0.0%) |
| Transportation | 99 (41.4%) | 140 (58.6%) |
| Material Moving | 97 (65.5%) | 51 (34.5%) |
| Total (Category) | 352 (64.8%) | 191 (35.2%) |
| Total (Overall) | 4,613 (57.0%) | 3,484 (43.0%) |
Employment Industries by Sex in Cloverly
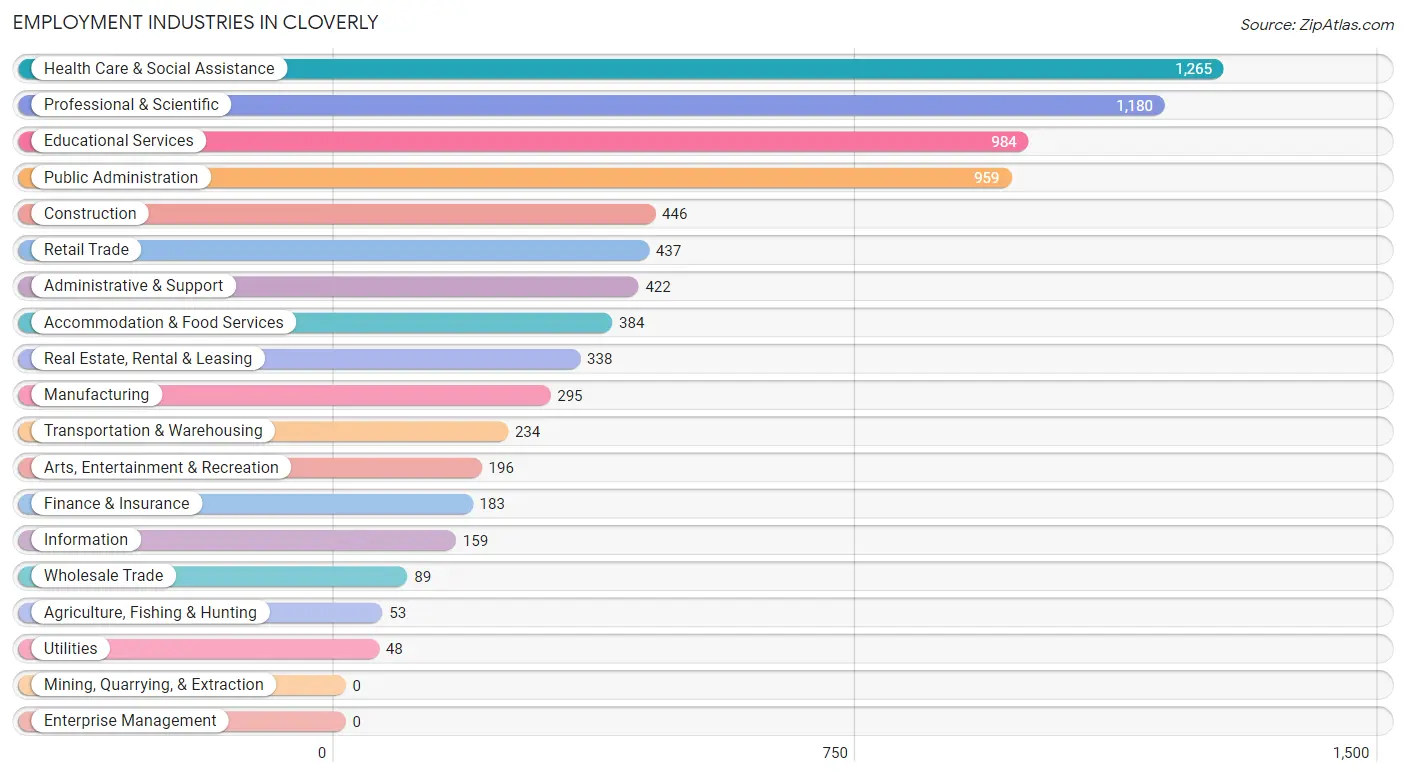
Employment Industries in Cloverly
The major employment industries in Cloverly include Health Care & Social Assistance (1,265 | 15.6%), Professional & Scientific (1,180 | 14.6%), Educational Services (984 | 12.1%), Public Administration (959 | 11.8%), and Construction (446 | 5.5%).
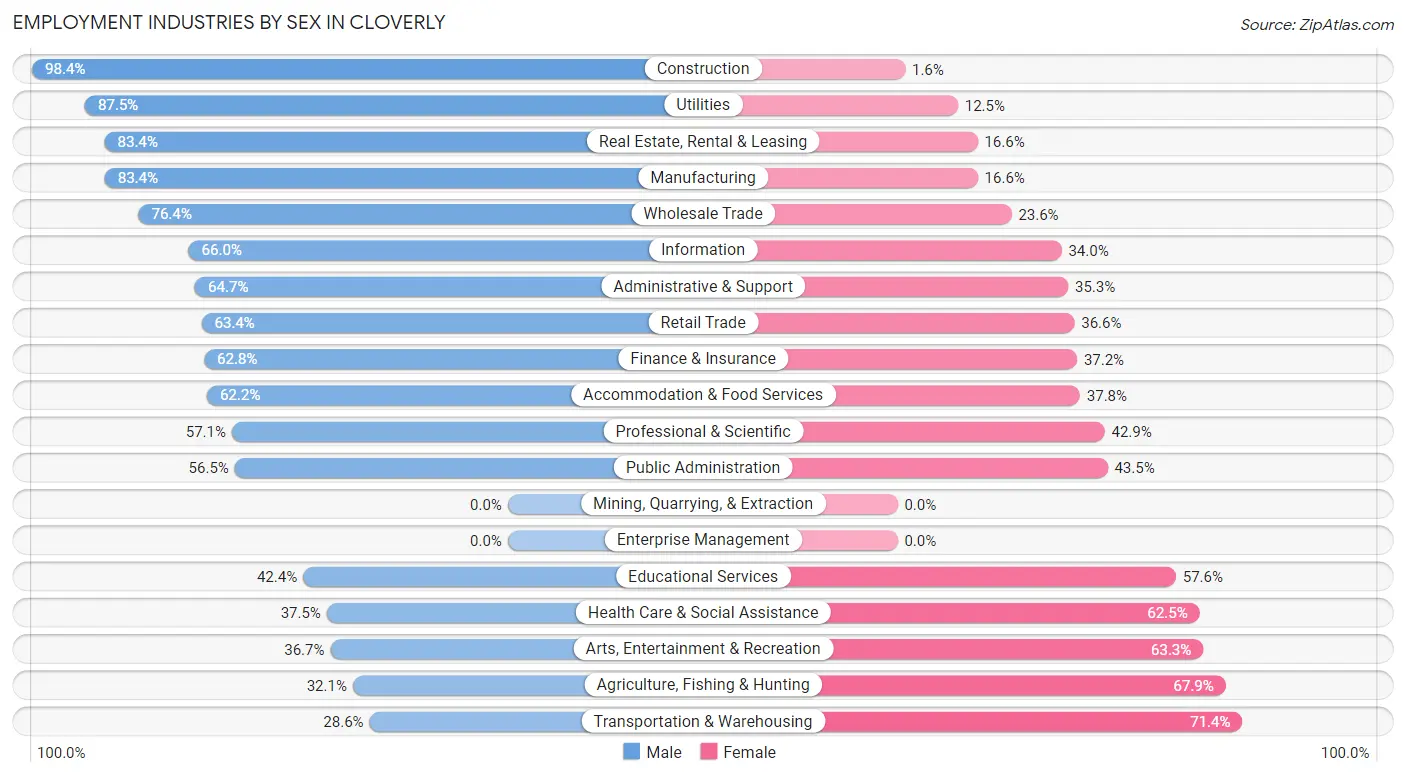
Employment Industries by Sex in Cloverly
The Cloverly industries that see more men than women are Construction (98.4%), Utilities (87.5%), and Real Estate, Rental & Leasing (83.4%), whereas the industries that tend to have a higher number of women are Transportation & Warehousing (71.4%), Agriculture, Fishing & Hunting (67.9%), and Arts, Entertainment & Recreation (63.3%).
| Industry | Male | Female |
| Agriculture, Fishing & Hunting | 17 (32.1%) | 36 (67.9%) |
| Mining, Quarrying, & Extraction | 0 (0.0%) | 0 (0.0%) |
| Construction | 439 (98.4%) | 7 (1.6%) |
| Manufacturing | 246 (83.4%) | 49 (16.6%) |
| Wholesale Trade | 68 (76.4%) | 21 (23.6%) |
| Retail Trade | 277 (63.4%) | 160 (36.6%) |
| Transportation & Warehousing | 67 (28.6%) | 167 (71.4%) |
| Utilities | 42 (87.5%) | 6 (12.5%) |
| Information | 105 (66.0%) | 54 (34.0%) |
| Finance & Insurance | 115 (62.8%) | 68 (37.2%) |
| Real Estate, Rental & Leasing | 282 (83.4%) | 56 (16.6%) |
| Professional & Scientific | 674 (57.1%) | 506 (42.9%) |
| Enterprise Management | 0 (0.0%) | 0 (0.0%) |
| Administrative & Support | 273 (64.7%) | 149 (35.3%) |
| Educational Services | 417 (42.4%) | 567 (57.6%) |
| Health Care & Social Assistance | 474 (37.5%) | 791 (62.5%) |
| Arts, Entertainment & Recreation | 72 (36.7%) | 124 (63.3%) |
| Accommodation & Food Services | 239 (62.2%) | 145 (37.8%) |
| Public Administration | 542 (56.5%) | 417 (43.5%) |
| Total | 4,613 (57.0%) | 3,484 (43.0%) |
Education in Cloverly
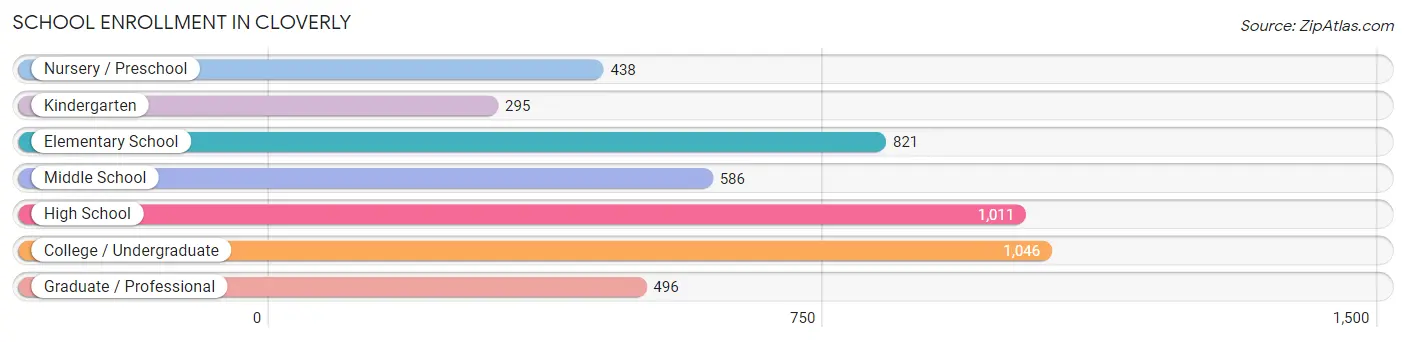
School Enrollment in Cloverly
The most common levels of schooling among the 4,693 students in Cloverly are college / undergraduate (1,046 | 22.3%), high school (1,011 | 21.5%), and elementary school (821 | 17.5%).
| School Level | # Students | % Students |
| Nursery / Preschool | 438 | 9.3% |
| Kindergarten | 295 | 6.3% |
| Elementary School | 821 | 17.5% |
| Middle School | 586 | 12.5% |
| High School | 1,011 | 21.5% |
| College / Undergraduate | 1,046 | 22.3% |
| Graduate / Professional | 496 | 10.6% |
| Total | 4,693 | 100.0% |
School Enrollment by Age by Funding Source in Cloverly
Out of a total of 4,693 students who are enrolled in schools in Cloverly, 1,051 (22.4%) attend a private institution, while the remaining 3,642 (77.6%) are enrolled in public schools. The age group of 3 to 4 year olds has the highest likelihood of being enrolled in private schools, with 322 (80.9% in the age bracket) enrolled. Conversely, the age group of 18 to 19 year olds has the lowest likelihood of being enrolled in a private school, with 391 (95.4% in the age bracket) attending a public institution.
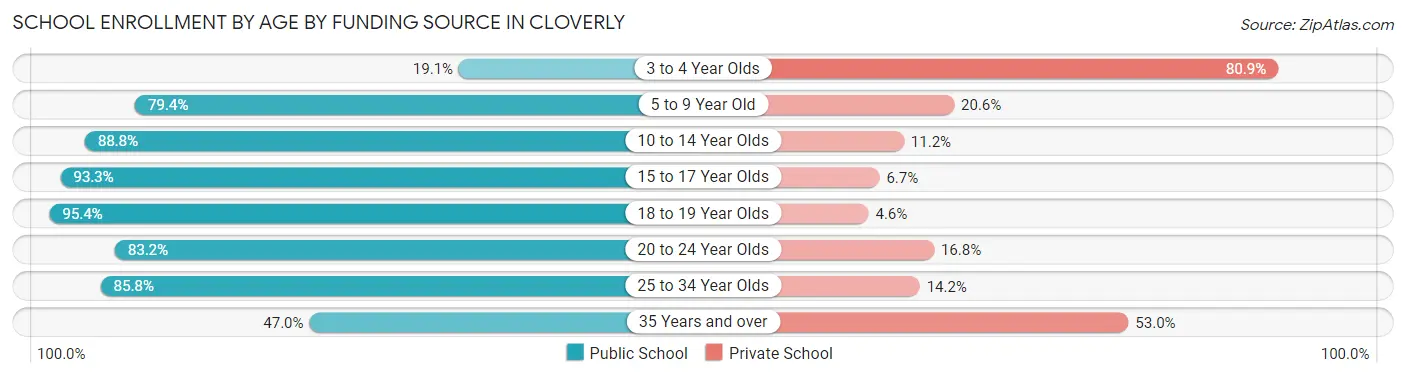
| Age Bracket | Public School | Private School |
| 3 to 4 Year Olds | 76 (19.1%) | 322 (80.9%) |
| 5 to 9 Year Old | 842 (79.4%) | 218 (20.6%) |
| 10 to 14 Year Olds | 649 (88.8%) | 82 (11.2%) |
| 15 to 17 Year Olds | 756 (93.3%) | 54 (6.7%) |
| 18 to 19 Year Olds | 391 (95.4%) | 19 (4.6%) |
| 20 to 24 Year Olds | 450 (83.2%) | 91 (16.8%) |
| 25 to 34 Year Olds | 285 (85.8%) | 47 (14.2%) |
| 35 Years and over | 193 (47.0%) | 218 (53.0%) |
| Total | 3,642 (77.6%) | 1,051 (22.4%) |
Educational Attainment by Field of Study in Cloverly
Business (1,237 | 17.1%), science & technology (814 | 11.3%), engineering (803 | 11.1%), social sciences (691 | 9.6%), and education (674 | 9.3%) are the most common fields of study among 7,225 individuals in Cloverly who have obtained a bachelor's degree or higher.
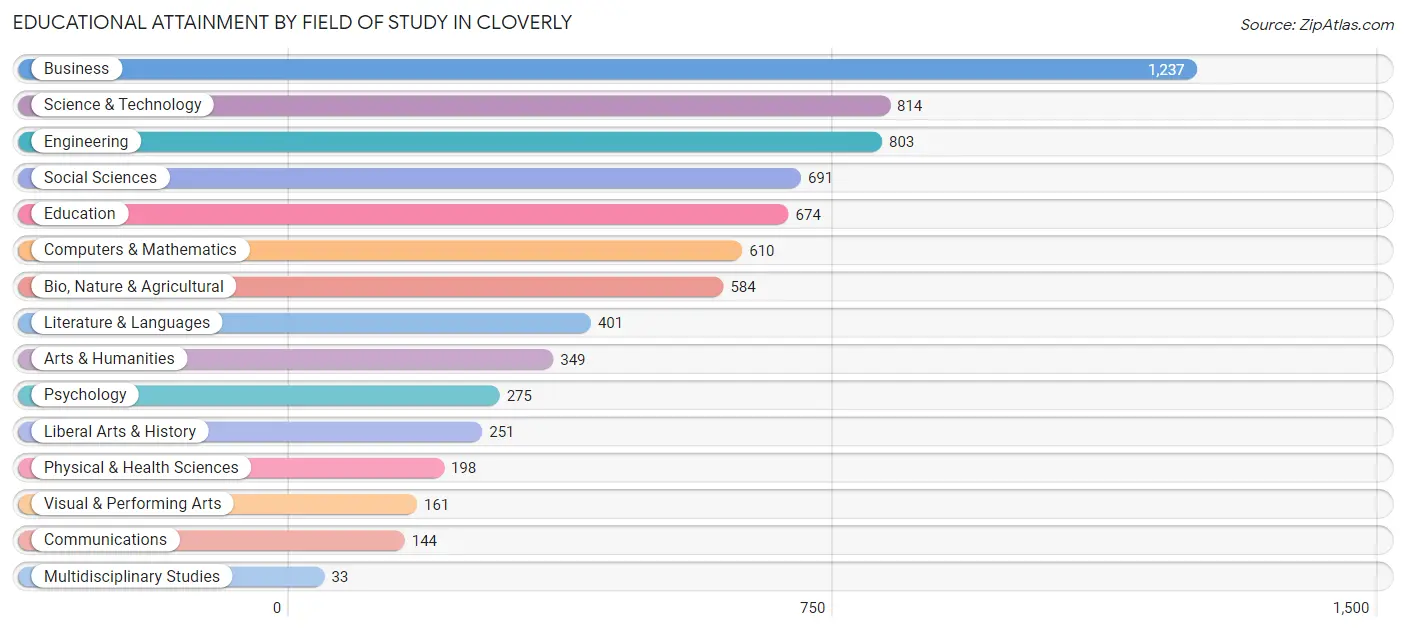
| Field of Study | # Graduates | % Graduates |
| Computers & Mathematics | 610 | 8.4% |
| Bio, Nature & Agricultural | 584 | 8.1% |
| Physical & Health Sciences | 198 | 2.7% |
| Psychology | 275 | 3.8% |
| Social Sciences | 691 | 9.6% |
| Engineering | 803 | 11.1% |
| Multidisciplinary Studies | 33 | 0.5% |
| Science & Technology | 814 | 11.3% |
| Business | 1,237 | 17.1% |
| Education | 674 | 9.3% |
| Literature & Languages | 401 | 5.6% |
| Liberal Arts & History | 251 | 3.5% |
| Visual & Performing Arts | 161 | 2.2% |
| Communications | 144 | 2.0% |
| Arts & Humanities | 349 | 4.8% |
| Total | 7,225 | 100.0% |
Transportation & Commute in Cloverly
Vehicle Availability by Sex in Cloverly
The most prevalent vehicle ownership categories in Cloverly are males with 2 vehicles (1,574, accounting for 36.1%) and females with 2 vehicles (1,240, making up 47.0%).
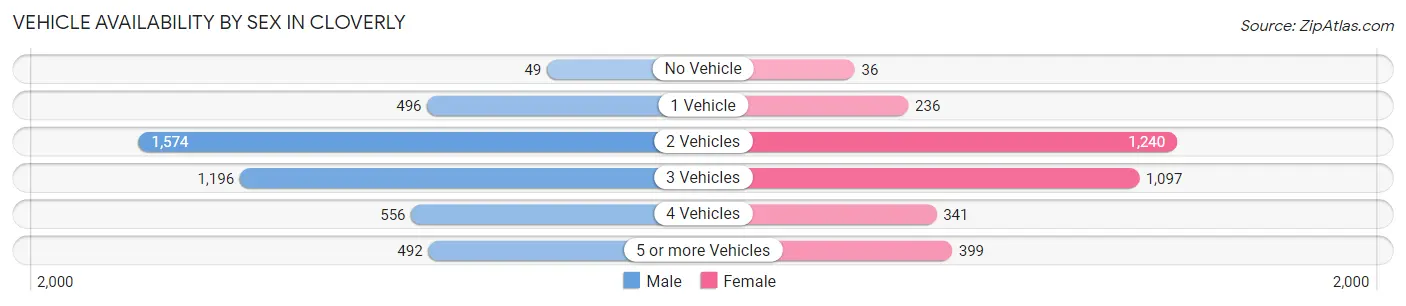
| Vehicles Available | Male | Female |
| No Vehicle | 49 (1.1%) | 36 (1.1%) |
| 1 Vehicle | 496 (11.4%) | 236 (7.0%) |
| 2 Vehicles | 1,574 (36.1%) | 1,240 (37.0%) |
| 3 Vehicles | 1,196 (27.4%) | 1,097 (32.8%) |
| 4 Vehicles | 556 (12.7%) | 341 (10.2%) |
| 5 or more Vehicles | 492 (11.3%) | 399 (11.9%) |
| Total | 4,363 (100.0%) | 3,349 (100.0%) |
Commute Time in Cloverly
The most frequently occuring commute durations in Cloverly are 30 to 34 minutes (820 commuters, 13.9%), 60 to 89 minutes (763 commuters, 13.0%), and 20 to 24 minutes (716 commuters, 12.2%).
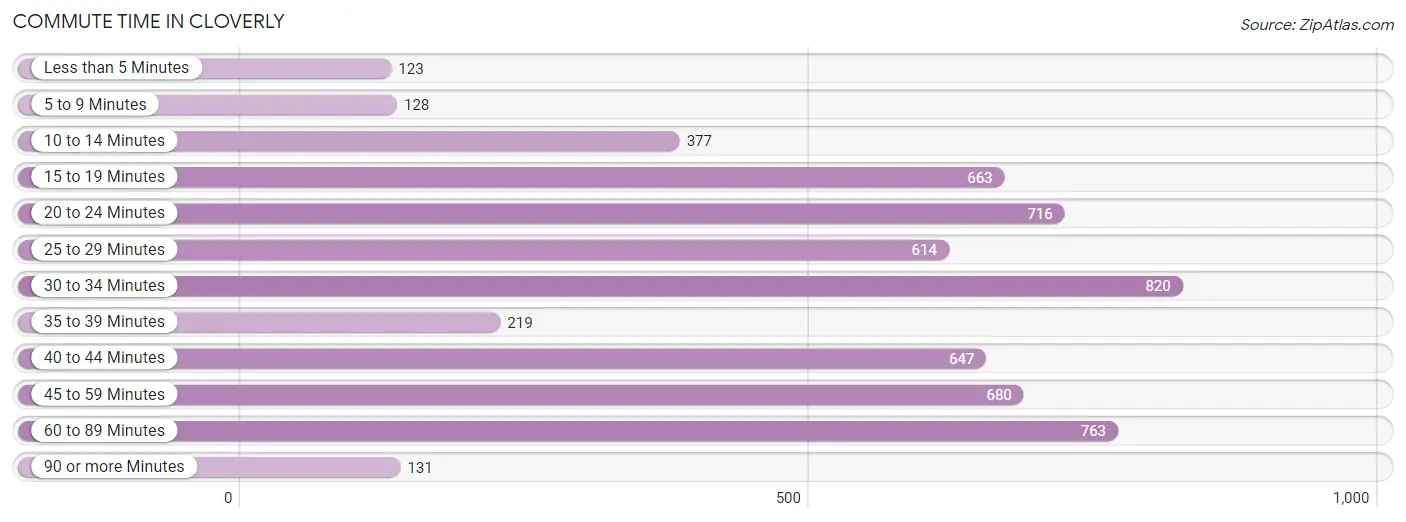
| Commute Time | # Commuters | % Commuters |
| Less than 5 Minutes | 123 | 2.1% |
| 5 to 9 Minutes | 128 | 2.2% |
| 10 to 14 Minutes | 377 | 6.4% |
| 15 to 19 Minutes | 663 | 11.3% |
| 20 to 24 Minutes | 716 | 12.2% |
| 25 to 29 Minutes | 614 | 10.4% |
| 30 to 34 Minutes | 820 | 13.9% |
| 35 to 39 Minutes | 219 | 3.7% |
| 40 to 44 Minutes | 647 | 11.0% |
| 45 to 59 Minutes | 680 | 11.6% |
| 60 to 89 Minutes | 763 | 13.0% |
| 90 or more Minutes | 131 | 2.2% |
Commute Time by Sex in Cloverly
The most common commute times in Cloverly are 60 to 89 minutes (510 commuters, 14.4%) for males and 30 to 34 minutes (352 commuters, 15.0%) for females.
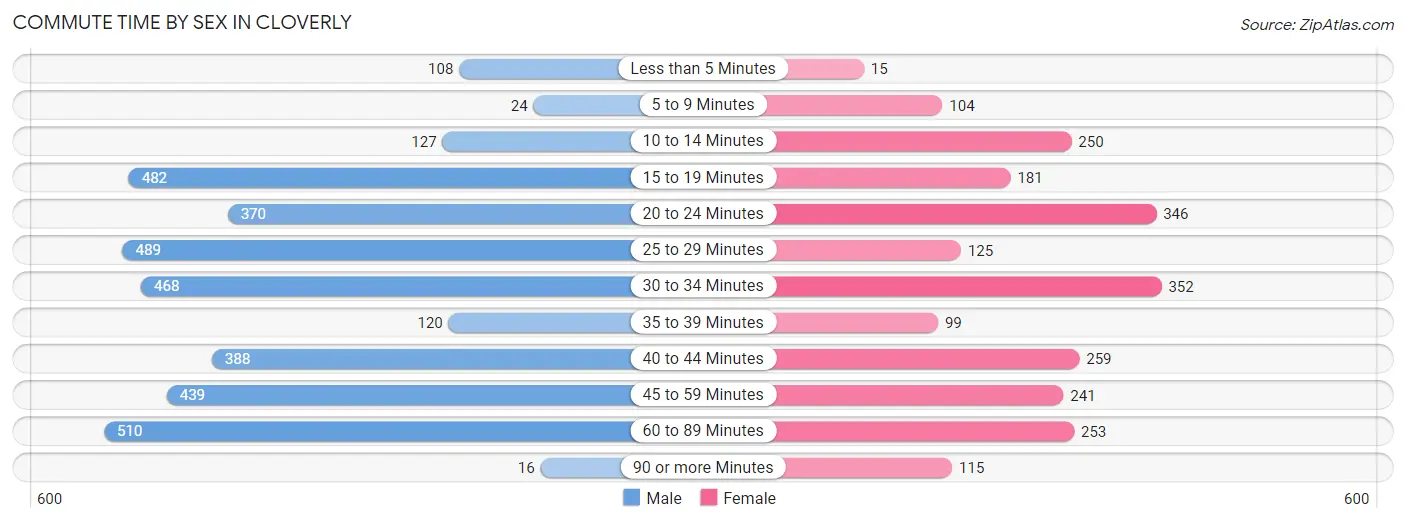
| Commute Time | Male | Female |
| Less than 5 Minutes | 108 (3.0%) | 15 (0.6%) |
| 5 to 9 Minutes | 24 (0.7%) | 104 (4.4%) |
| 10 to 14 Minutes | 127 (3.6%) | 250 (10.7%) |
| 15 to 19 Minutes | 482 (13.6%) | 181 (7.7%) |
| 20 to 24 Minutes | 370 (10.4%) | 346 (14.8%) |
| 25 to 29 Minutes | 489 (13.8%) | 125 (5.3%) |
| 30 to 34 Minutes | 468 (13.2%) | 352 (15.0%) |
| 35 to 39 Minutes | 120 (3.4%) | 99 (4.2%) |
| 40 to 44 Minutes | 388 (11.0%) | 259 (11.1%) |
| 45 to 59 Minutes | 439 (12.4%) | 241 (10.3%) |
| 60 to 89 Minutes | 510 (14.4%) | 253 (10.8%) |
| 90 or more Minutes | 16 (0.4%) | 115 (4.9%) |
Time of Departure to Work by Sex in Cloverly
The most frequent times of departure to work in Cloverly are 7:00 AM to 7:29 AM (533, 15.0%) for males and 7:30 AM to 7:59 AM (462, 19.7%) for females.
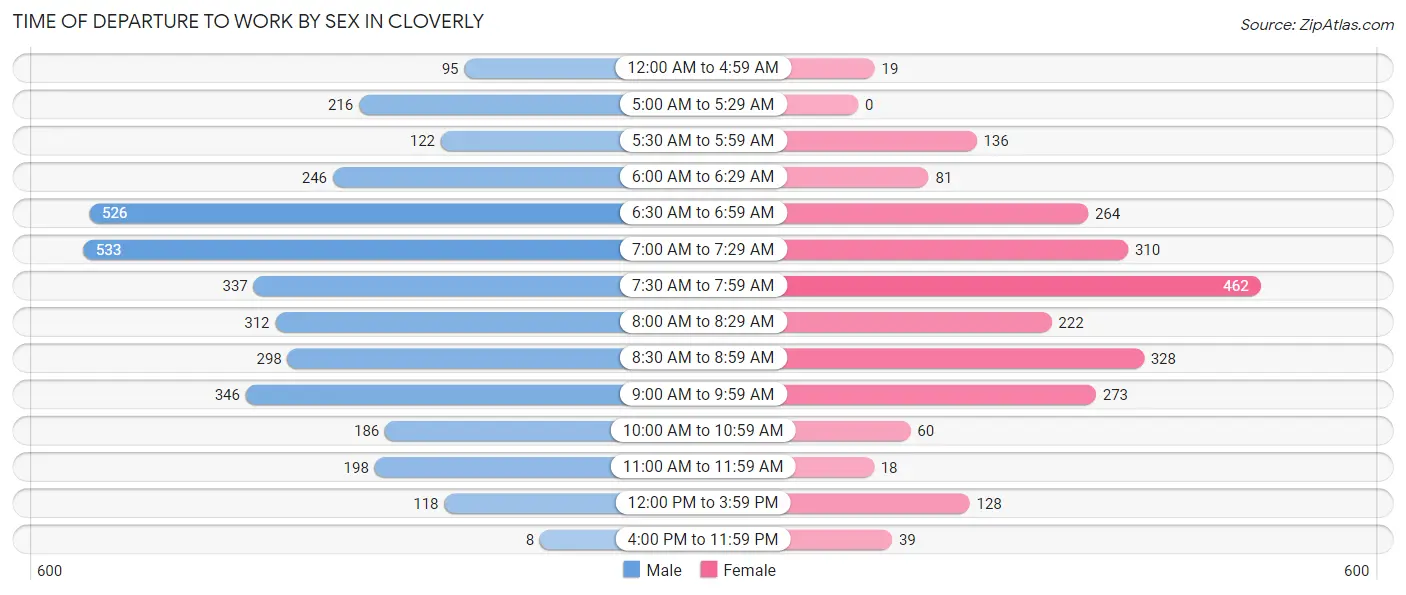
| Time of Departure | Male | Female |
| 12:00 AM to 4:59 AM | 95 (2.7%) | 19 (0.8%) |
| 5:00 AM to 5:29 AM | 216 (6.1%) | 0 (0.0%) |
| 5:30 AM to 5:59 AM | 122 (3.5%) | 136 (5.8%) |
| 6:00 AM to 6:29 AM | 246 (7.0%) | 81 (3.5%) |
| 6:30 AM to 6:59 AM | 526 (14.8%) | 264 (11.3%) |
| 7:00 AM to 7:29 AM | 533 (15.0%) | 310 (13.3%) |
| 7:30 AM to 7:59 AM | 337 (9.5%) | 462 (19.7%) |
| 8:00 AM to 8:29 AM | 312 (8.8%) | 222 (9.5%) |
| 8:30 AM to 8:59 AM | 298 (8.4%) | 328 (14.0%) |
| 9:00 AM to 9:59 AM | 346 (9.8%) | 273 (11.7%) |
| 10:00 AM to 10:59 AM | 186 (5.2%) | 60 (2.6%) |
| 11:00 AM to 11:59 AM | 198 (5.6%) | 18 (0.8%) |
| 12:00 PM to 3:59 PM | 118 (3.3%) | 128 (5.5%) |
| 4:00 PM to 11:59 PM | 8 (0.2%) | 39 (1.7%) |
| Total | 3,541 (100.0%) | 2,340 (100.0%) |
Housing Occupancy in Cloverly
Occupancy by Ownership in Cloverly
Of the total 5,047 dwellings in Cloverly, owner-occupied units account for 4,441 (88.0%), while renter-occupied units make up 606 (12.0%).
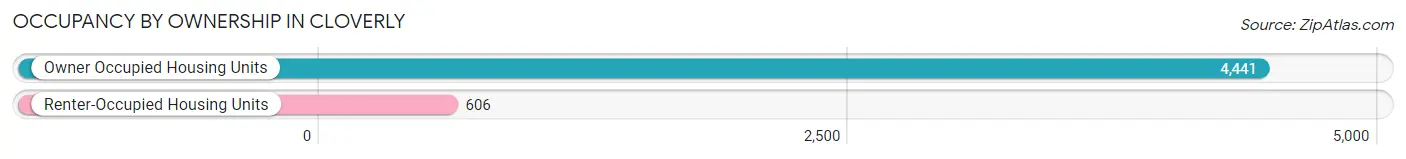
| Occupancy | # Housing Units | % Housing Units |
| Owner Occupied Housing Units | 4,441 | 88.0% |
| Renter-Occupied Housing Units | 606 | 12.0% |
| Total Occupied Housing Units | 5,047 | 100.0% |
Occupancy by Household Size in Cloverly
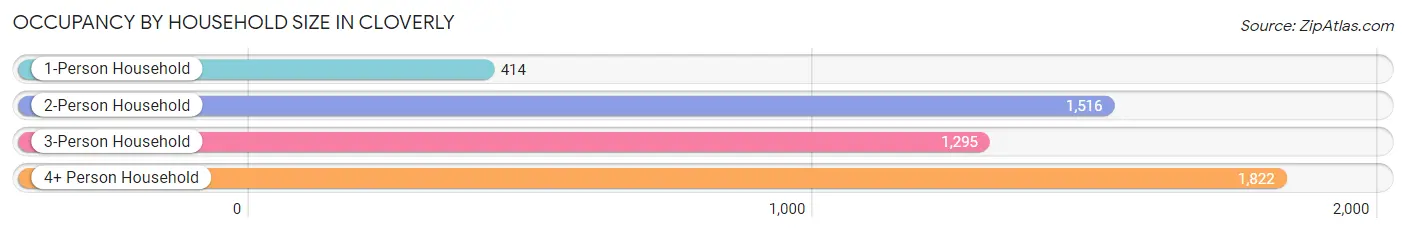
| Household Size | # Housing Units | % Housing Units |
| 1-Person Household | 414 | 8.2% |
| 2-Person Household | 1,516 | 30.0% |
| 3-Person Household | 1,295 | 25.7% |
| 4+ Person Household | 1,822 | 36.1% |
| Total Housing Units | 5,047 | 100.0% |
Occupancy by Ownership by Household Size in Cloverly
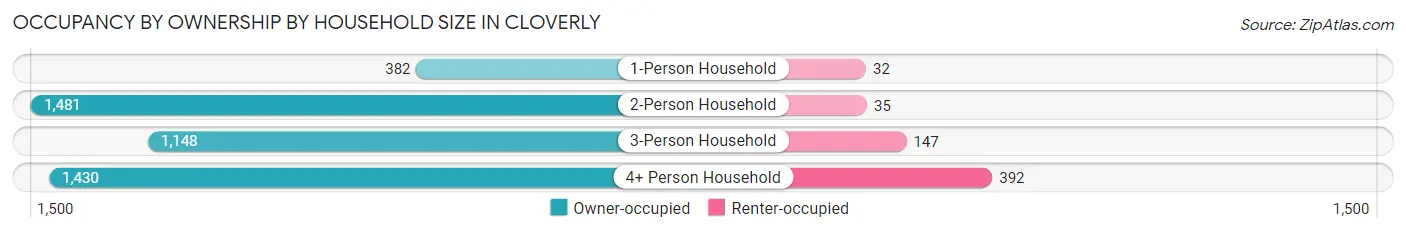
| Household Size | Owner-occupied | Renter-occupied |
| 1-Person Household | 382 (92.3%) | 32 (7.7%) |
| 2-Person Household | 1,481 (97.7%) | 35 (2.3%) |
| 3-Person Household | 1,148 (88.6%) | 147 (11.4%) |
| 4+ Person Household | 1,430 (78.5%) | 392 (21.5%) |
| Total Housing Units | 4,441 (88.0%) | 606 (12.0%) |
Occupancy by Educational Attainment in Cloverly
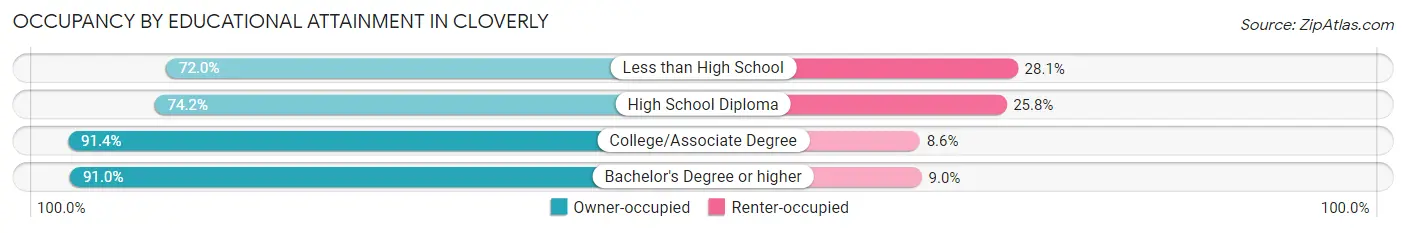
| Household Size | Owner-occupied | Renter-occupied |
| Less than High School | 177 (72.0%) | 69 (28.1%) |
| High School Diploma | 478 (74.2%) | 166 (25.8%) |
| College/Associate Degree | 899 (91.4%) | 85 (8.6%) |
| Bachelor's Degree or higher | 2,887 (91.0%) | 286 (9.0%) |
Occupancy by Age of Householder in Cloverly
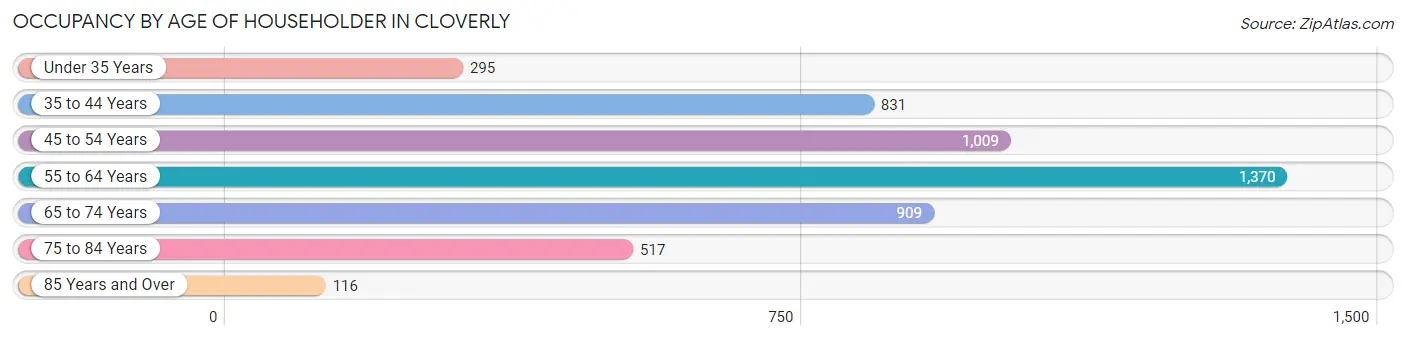
| Age Bracket | # Households | % Households |
| Under 35 Years | 295 | 5.9% |
| 35 to 44 Years | 831 | 16.5% |
| 45 to 54 Years | 1,009 | 20.0% |
| 55 to 64 Years | 1,370 | 27.1% |
| 65 to 74 Years | 909 | 18.0% |
| 75 to 84 Years | 517 | 10.2% |
| 85 Years and Over | 116 | 2.3% |
| Total | 5,047 | 100.0% |
Housing Finances in Cloverly
Median Income by Occupancy in Cloverly
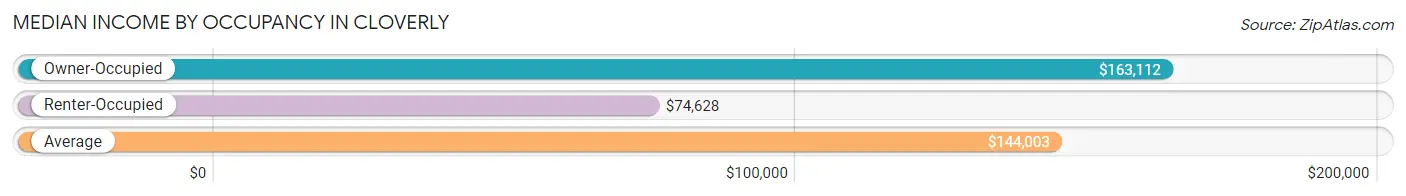
| Occupancy Type | # Households | Median Income |
| Owner-Occupied | 4,441 (88.0%) | $163,112 |
| Renter-Occupied | 606 (12.0%) | $74,628 |
| Average | 5,047 (100.0%) | $144,003 |
Occupancy by Householder Income Bracket in Cloverly
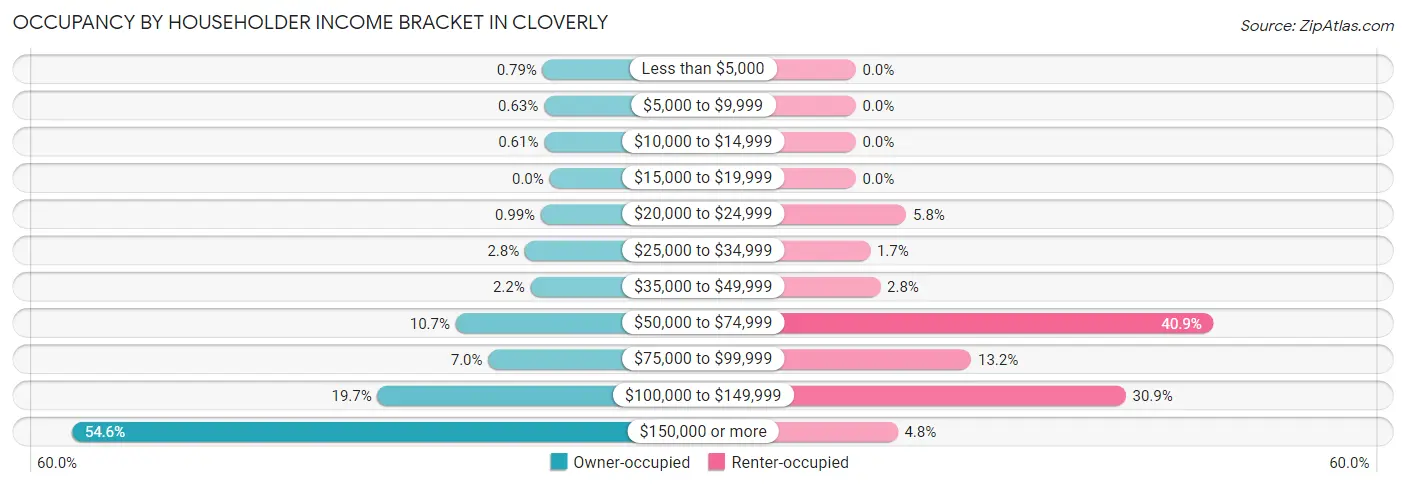
| Income Bracket | Owner-occupied | Renter-occupied |
| Less than $5,000 | 35 (0.8%) | 0 (0.0%) |
| $5,000 to $9,999 | 28 (0.6%) | 0 (0.0%) |
| $10,000 to $14,999 | 27 (0.6%) | 0 (0.0%) |
| $15,000 to $19,999 | 0 (0.0%) | 0 (0.0%) |
| $20,000 to $24,999 | 44 (1.0%) | 35 (5.8%) |
| $25,000 to $34,999 | 125 (2.8%) | 10 (1.7%) |
| $35,000 to $49,999 | 97 (2.2%) | 17 (2.8%) |
| $50,000 to $74,999 | 476 (10.7%) | 248 (40.9%) |
| $75,000 to $99,999 | 311 (7.0%) | 80 (13.2%) |
| $100,000 to $149,999 | 873 (19.7%) | 187 (30.9%) |
| $150,000 or more | 2,425 (54.6%) | 29 (4.8%) |
| Total | 4,441 (100.0%) | 606 (100.0%) |
Monthly Housing Cost Tiers in Cloverly
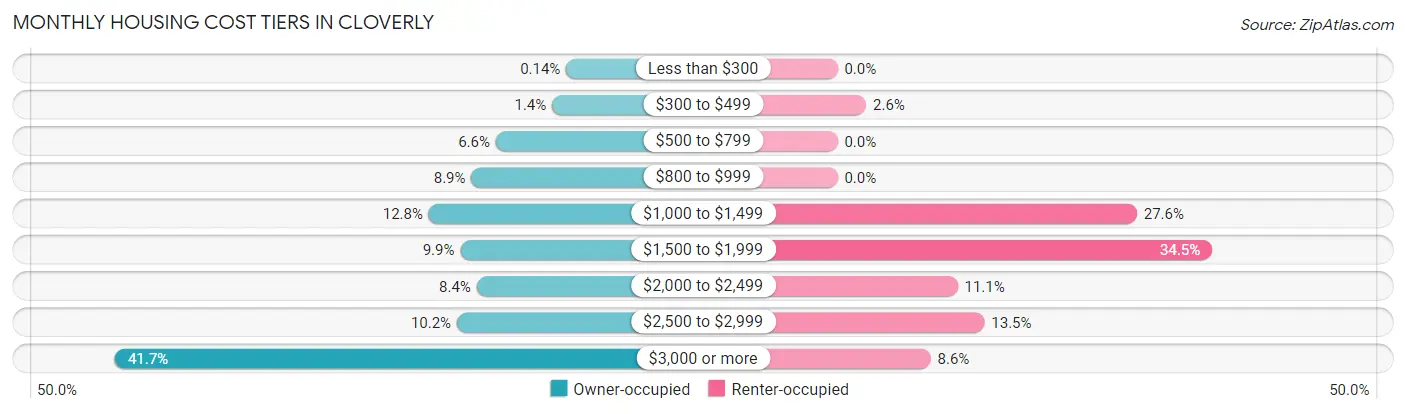
| Monthly Cost | Owner-occupied | Renter-occupied |
| Less than $300 | 6 (0.1%) | 0 (0.0%) |
| $300 to $499 | 64 (1.4%) | 16 (2.6%) |
| $500 to $799 | 294 (6.6%) | 0 (0.0%) |
| $800 to $999 | 394 (8.9%) | 0 (0.0%) |
| $1,000 to $1,499 | 568 (12.8%) | 167 (27.6%) |
| $1,500 to $1,999 | 439 (9.9%) | 209 (34.5%) |
| $2,000 to $2,499 | 372 (8.4%) | 67 (11.1%) |
| $2,500 to $2,999 | 453 (10.2%) | 82 (13.5%) |
| $3,000 or more | 1,851 (41.7%) | 52 (8.6%) |
| Total | 4,441 (100.0%) | 606 (100.0%) |
Physical Housing Characteristics in Cloverly
Housing Structures in Cloverly
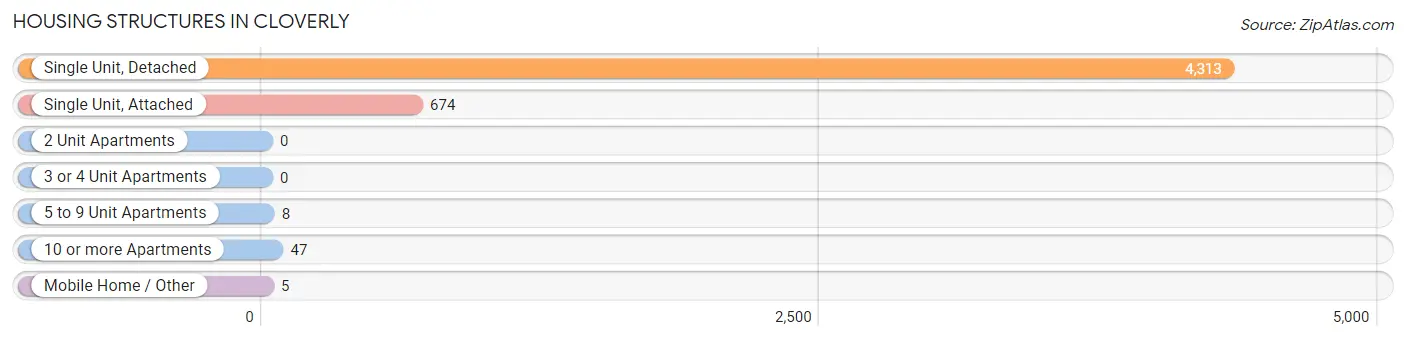
| Structure Type | # Housing Units | % Housing Units |
| Single Unit, Detached | 4,313 | 85.5% |
| Single Unit, Attached | 674 | 13.4% |
| 2 Unit Apartments | 0 | 0.0% |
| 3 or 4 Unit Apartments | 0 | 0.0% |
| 5 to 9 Unit Apartments | 8 | 0.2% |
| 10 or more Apartments | 47 | 0.9% |
| Mobile Home / Other | 5 | 0.1% |
| Total | 5,047 | 100.0% |
Housing Structures by Occupancy in Cloverly
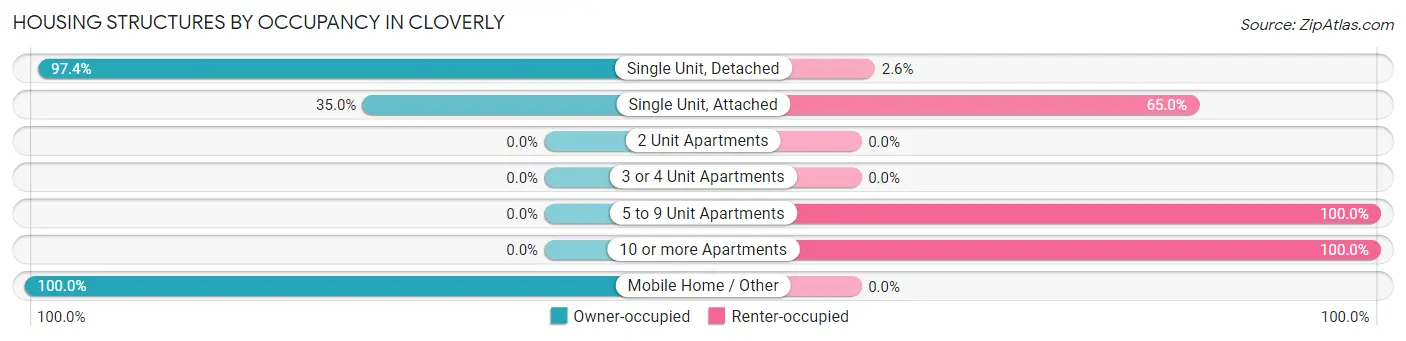
| Structure Type | Owner-occupied | Renter-occupied |
| Single Unit, Detached | 4,200 (97.4%) | 113 (2.6%) |
| Single Unit, Attached | 236 (35.0%) | 438 (65.0%) |
| 2 Unit Apartments | 0 (0.0%) | 0 (0.0%) |
| 3 or 4 Unit Apartments | 0 (0.0%) | 0 (0.0%) |
| 5 to 9 Unit Apartments | 0 (0.0%) | 8 (100.0%) |
| 10 or more Apartments | 0 (0.0%) | 47 (100.0%) |
| Mobile Home / Other | 5 (100.0%) | 0 (0.0%) |
| Total | 4,441 (88.0%) | 606 (12.0%) |
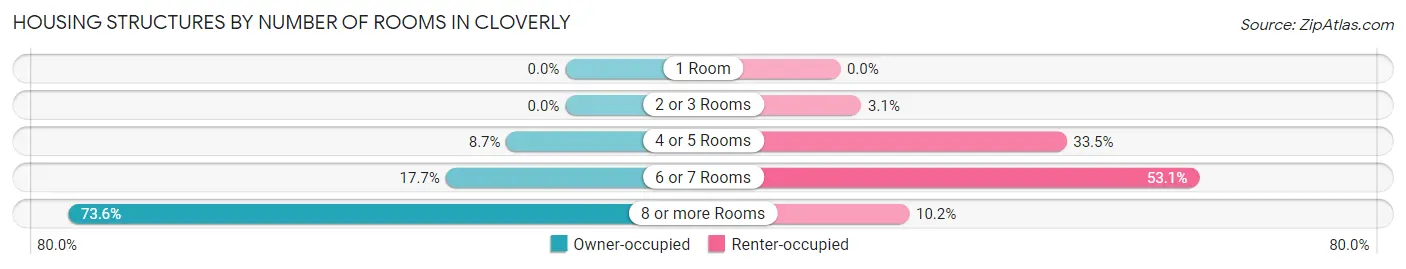
Housing Structures by Number of Rooms in Cloverly
| Number of Rooms | Owner-occupied | Renter-occupied |
| 1 Room | 0 (0.0%) | 0 (0.0%) |
| 2 or 3 Rooms | 0 (0.0%) | 19 (3.1%) |
| 4 or 5 Rooms | 387 (8.7%) | 203 (33.5%) |
| 6 or 7 Rooms | 786 (17.7%) | 322 (53.1%) |
| 8 or more Rooms | 3,268 (73.6%) | 62 (10.2%) |
| Total | 4,441 (100.0%) | 606 (100.0%) |
Housing Structure by Heating Type in Cloverly
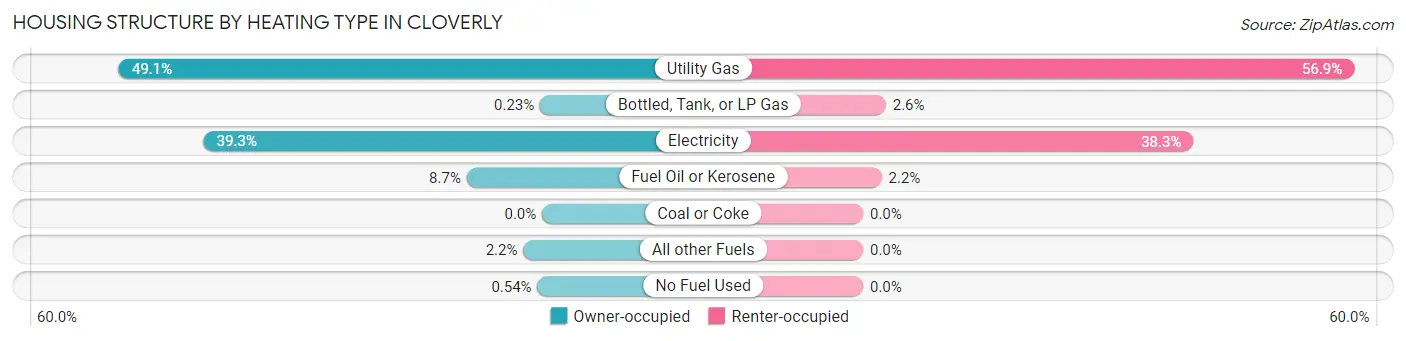
| Heating Type | Owner-occupied | Renter-occupied |
| Utility Gas | 2,179 (49.1%) | 345 (56.9%) |
| Bottled, Tank, or LP Gas | 10 (0.2%) | 16 (2.6%) |
| Electricity | 1,743 (39.3%) | 232 (38.3%) |
| Fuel Oil or Kerosene | 388 (8.7%) | 13 (2.1%) |
| Coal or Coke | 0 (0.0%) | 0 (0.0%) |
| All other Fuels | 97 (2.2%) | 0 (0.0%) |
| No Fuel Used | 24 (0.5%) | 0 (0.0%) |
| Total | 4,441 (100.0%) | 606 (100.0%) |
Household Vehicle Usage in Cloverly
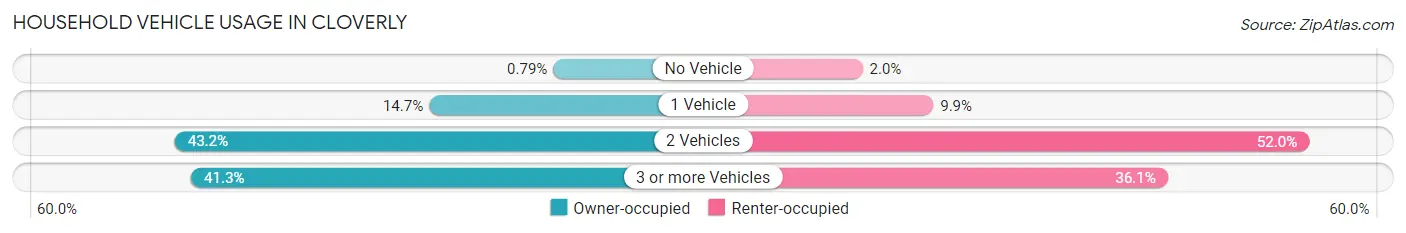
| Vehicles per Household | Owner-occupied | Renter-occupied |
| No Vehicle | 35 (0.8%) | 12 (2.0%) |
| 1 Vehicle | 653 (14.7%) | 60 (9.9%) |
| 2 Vehicles | 1,917 (43.2%) | 315 (52.0%) |
| 3 or more Vehicles | 1,836 (41.3%) | 219 (36.1%) |
| Total | 4,441 (100.0%) | 606 (100.0%) |
Real Estate & Mortgages in Cloverly
Real Estate and Mortgage Overview in Cloverly
| Characteristic | Without Mortgage | With Mortgage |
| Housing Units | 1,134 | 3,307 |
| Median Property Value | $633,200 | $623,900 |
| Median Household Income | $123,393 | $1,985 |
| Monthly Housing Costs | $891 | $1,851 |
| Real Estate Taxes | $5,791 | $18 |
Property Value by Mortgage Status in Cloverly
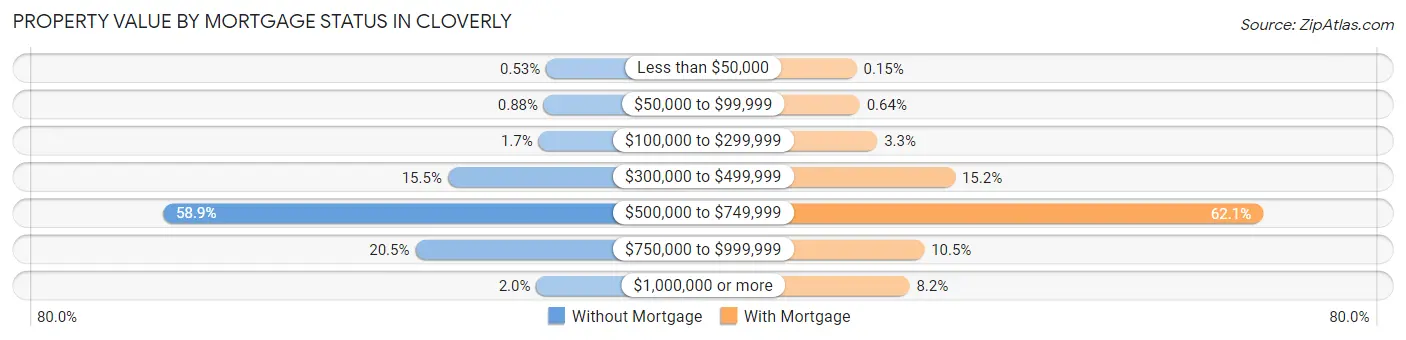
| Property Value | Without Mortgage | With Mortgage |
| Less than $50,000 | 6 (0.5%) | 5 (0.2%) |
| $50,000 to $99,999 | 10 (0.9%) | 21 (0.6%) |
| $100,000 to $299,999 | 19 (1.7%) | 109 (3.3%) |
| $300,000 to $499,999 | 176 (15.5%) | 501 (15.1%) |
| $500,000 to $749,999 | 668 (58.9%) | 2,053 (62.1%) |
| $750,000 to $999,999 | 232 (20.5%) | 346 (10.5%) |
| $1,000,000 or more | 23 (2.0%) | 272 (8.2%) |
| Total | 1,134 (100.0%) | 3,307 (100.0%) |
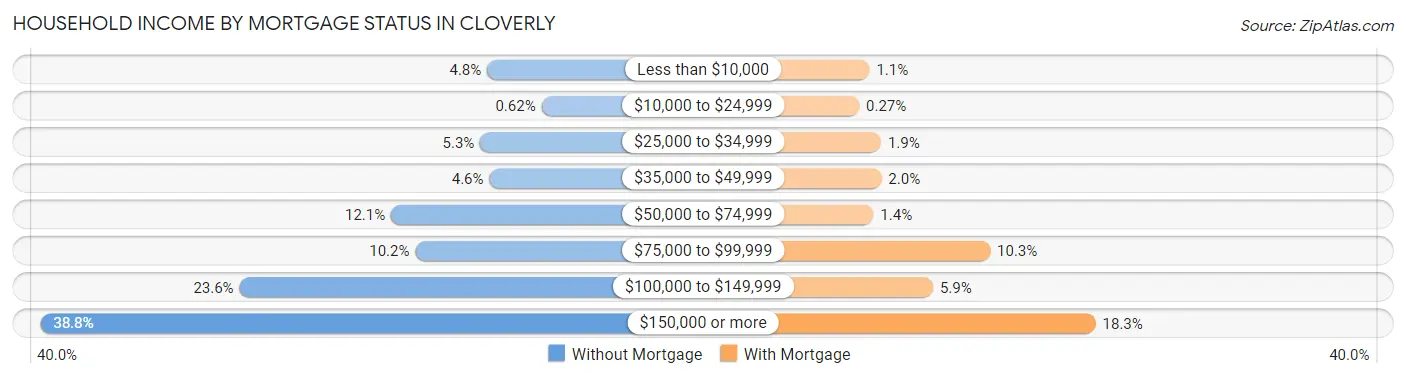
Household Income by Mortgage Status in Cloverly
| Household Income | Without Mortgage | With Mortgage |
| Less than $10,000 | 54 (4.8%) | 35 (1.1%) |
| $10,000 to $24,999 | 7 (0.6%) | 9 (0.3%) |
| $25,000 to $34,999 | 60 (5.3%) | 64 (1.9%) |
| $35,000 to $49,999 | 52 (4.6%) | 65 (2.0%) |
| $50,000 to $74,999 | 137 (12.1%) | 45 (1.4%) |
| $75,000 to $99,999 | 116 (10.2%) | 339 (10.2%) |
| $100,000 to $149,999 | 268 (23.6%) | 195 (5.9%) |
| $150,000 or more | 440 (38.8%) | 605 (18.3%) |
| Total | 1,134 (100.0%) | 3,307 (100.0%) |
Property Value to Household Income Ratio in Cloverly
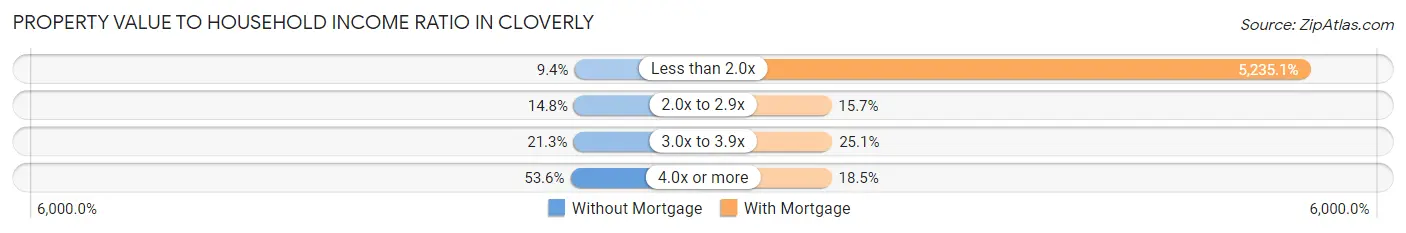
| Value-to-Income Ratio | Without Mortgage | With Mortgage |
| Less than 2.0x | 106 (9.3%) | 173,125 (5,235.1%) |
| 2.0x to 2.9x | 168 (14.8%) | 518 (15.7%) |
| 3.0x to 3.9x | 242 (21.3%) | 829 (25.1%) |
| 4.0x or more | 608 (53.6%) | 611 (18.5%) |
| Total | 1,134 (100.0%) | 3,307 (100.0%) |
Real Estate Taxes by Mortgage Status in Cloverly
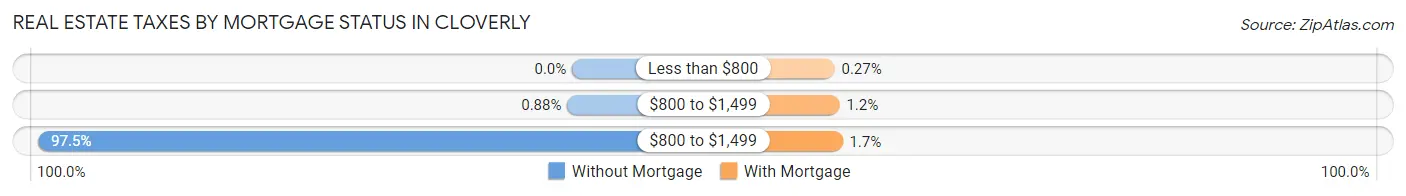
| Property Taxes | Without Mortgage | With Mortgage |
| Less than $800 | 0 (0.0%) | 9 (0.3%) |
| $800 to $1,499 | 10 (0.9%) | 39 (1.2%) |
| $800 to $1,499 | 1,106 (97.5%) | 57 (1.7%) |
| Total | 1,134 (100.0%) | 3,307 (100.0%) |
Health & Disability in Cloverly
Health Insurance Coverage by Age in Cloverly
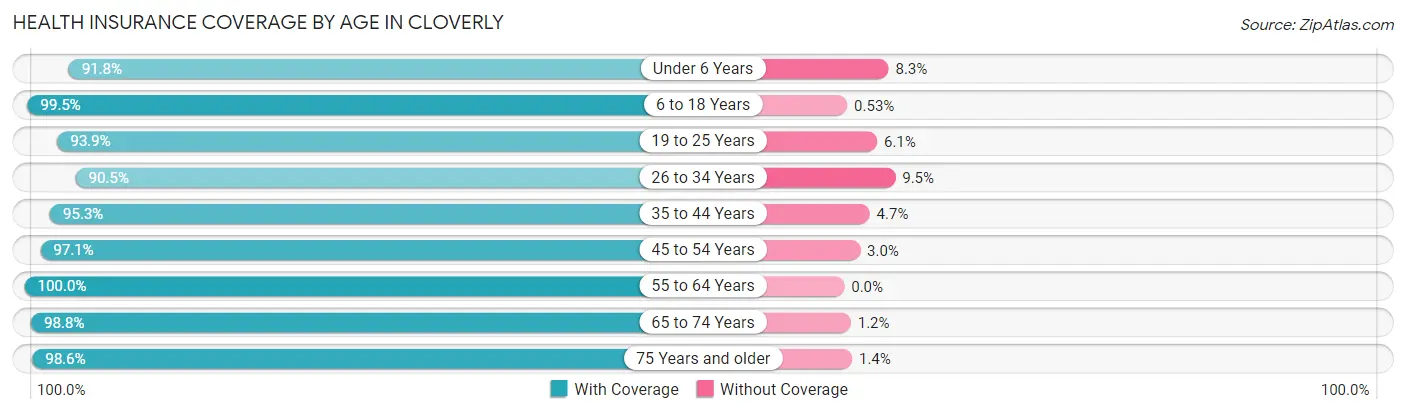
| Age Bracket | With Coverage | Without Coverage |
| Under 6 Years | 990 (91.7%) | 89 (8.3%) |
| 6 to 18 Years | 2,830 (99.5%) | 15 (0.5%) |
| 19 to 25 Years | 1,322 (93.9%) | 86 (6.1%) |
| 26 to 34 Years | 1,075 (90.5%) | 113 (9.5%) |
| 35 to 44 Years | 2,095 (95.3%) | 104 (4.7%) |
| 45 to 54 Years | 2,075 (97.1%) | 63 (2.9%) |
| 55 to 64 Years | 2,442 (100.0%) | 0 (0.0%) |
| 65 to 74 Years | 1,792 (98.8%) | 22 (1.2%) |
| 75 Years and older | 1,297 (98.6%) | 19 (1.4%) |
| Total | 15,918 (96.9%) | 511 (3.1%) |
Health Insurance Coverage by Citizenship Status in Cloverly
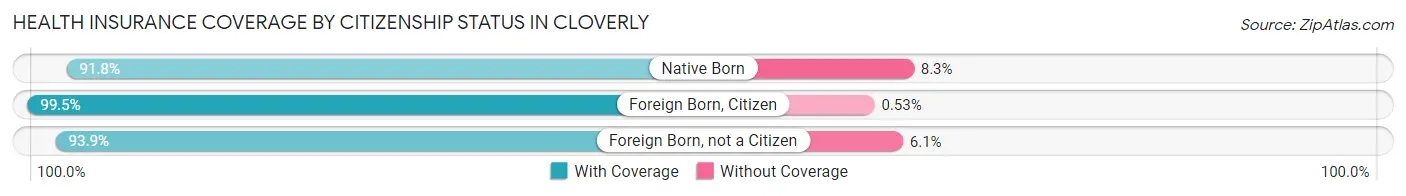
| Citizenship Status | With Coverage | Without Coverage |
| Native Born | 990 (91.7%) | 89 (8.3%) |
| Foreign Born, Citizen | 2,830 (99.5%) | 15 (0.5%) |
| Foreign Born, not a Citizen | 1,322 (93.9%) | 86 (6.1%) |
Health Insurance Coverage by Household Income in Cloverly
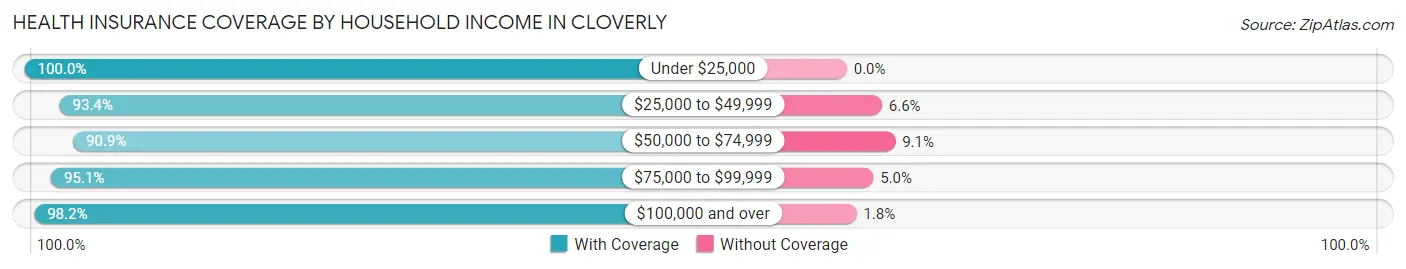
| Household Income | With Coverage | Without Coverage |
| Under $25,000 | 321 (100.0%) | 0 (0.0%) |
| $25,000 to $49,999 | 569 (93.4%) | 40 (6.6%) |
| $50,000 to $74,999 | 1,885 (90.9%) | 188 (9.1%) |
| $75,000 to $99,999 | 1,229 (95.1%) | 64 (5.0%) |
| $100,000 and over | 11,873 (98.2%) | 219 (1.8%) |
Public vs Private Health Insurance Coverage by Age in Cloverly
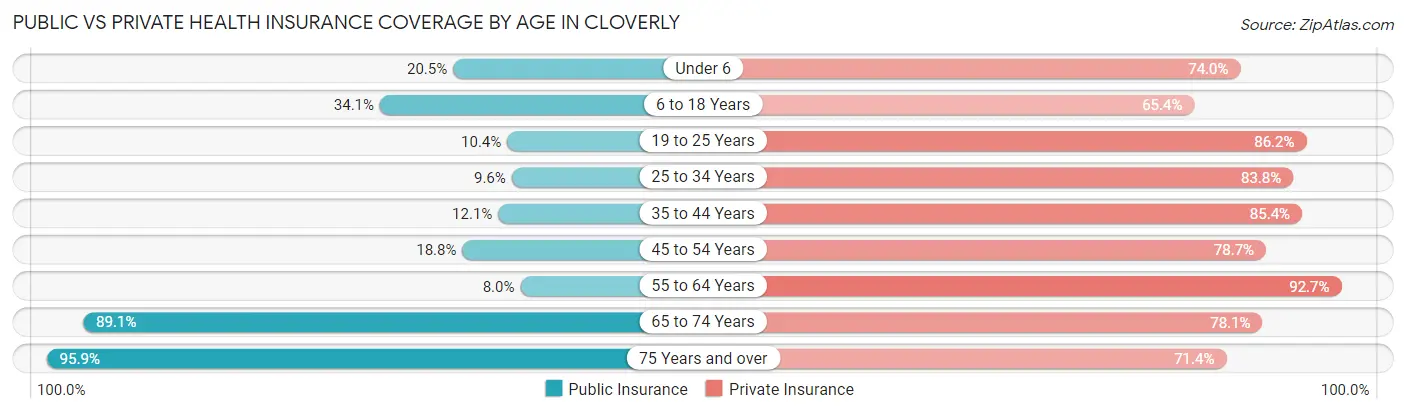
| Age Bracket | Public Insurance | Private Insurance |
| Under 6 | 221 (20.5%) | 798 (74.0%) |
| 6 to 18 Years | 969 (34.1%) | 1,861 (65.4%) |
| 19 to 25 Years | 147 (10.4%) | 1,214 (86.2%) |
| 25 to 34 Years | 114 (9.6%) | 995 (83.8%) |
| 35 to 44 Years | 266 (12.1%) | 1,878 (85.4%) |
| 45 to 54 Years | 401 (18.8%) | 1,683 (78.7%) |
| 55 to 64 Years | 195 (8.0%) | 2,264 (92.7%) |
| 65 to 74 Years | 1,617 (89.1%) | 1,416 (78.1%) |
| 75 Years and over | 1,262 (95.9%) | 939 (71.4%) |
| Total | 5,192 (31.6%) | 13,048 (79.4%) |
Disability Status by Sex by Age in Cloverly
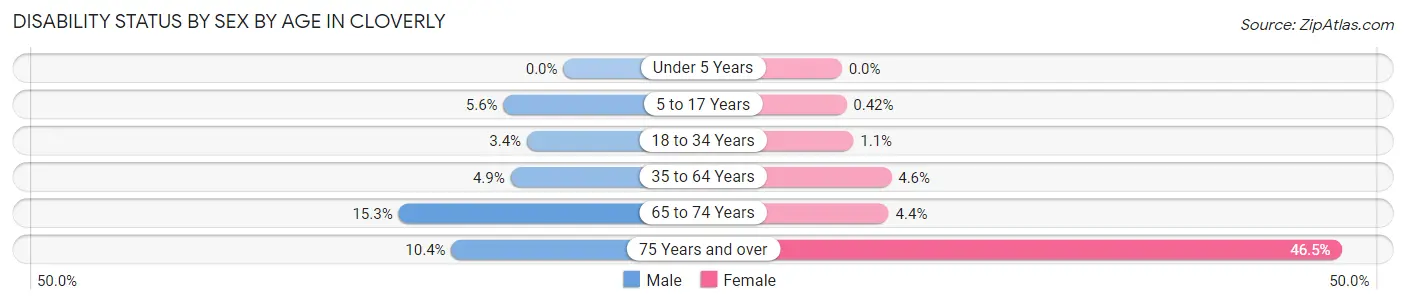
| Age Bracket | Male | Female |
| Under 5 Years | 0 (0.0%) | 0 (0.0%) |
| 5 to 17 Years | 71 (5.6%) | 6 (0.4%) |
| 18 to 34 Years | 51 (3.4%) | 15 (1.1%) |
| 35 to 64 Years | 175 (4.9%) | 147 (4.6%) |
| 65 to 74 Years | 144 (15.3%) | 38 (4.3%) |
| 75 Years and over | 56 (10.4%) | 361 (46.5%) |
Disability Class by Sex by Age in Cloverly
Disability Class: Hearing Difficulty
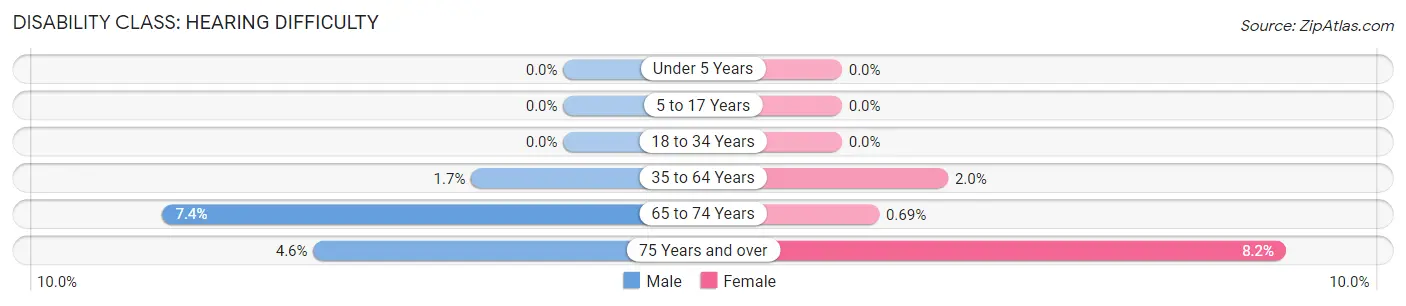
| Age Bracket | Male | Female |
| Under 5 Years | 0 (0.0%) | 0 (0.0%) |
| 5 to 17 Years | 0 (0.0%) | 0 (0.0%) |
| 18 to 34 Years | 0 (0.0%) | 0 (0.0%) |
| 35 to 64 Years | 61 (1.7%) | 63 (2.0%) |
| 65 to 74 Years | 70 (7.4%) | 6 (0.7%) |
| 75 Years and over | 25 (4.6%) | 64 (8.2%) |
Disability Class: Vision Difficulty
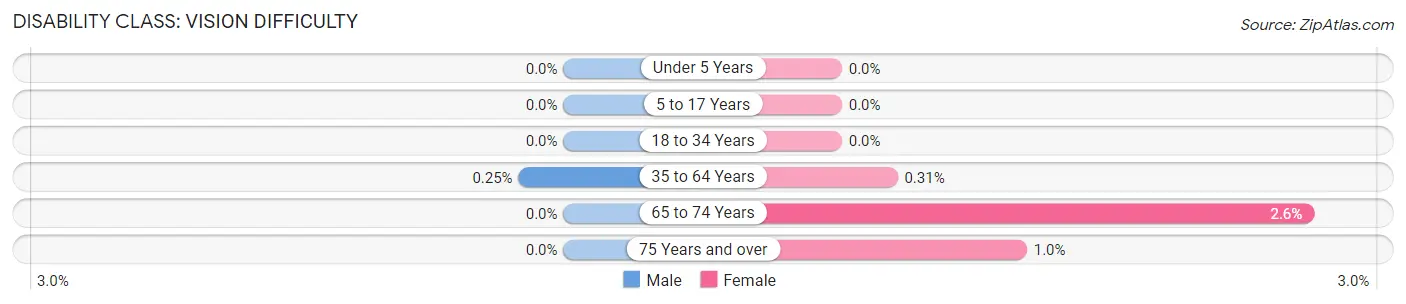
| Age Bracket | Male | Female |
| Under 5 Years | 0 (0.0%) | 0 (0.0%) |
| 5 to 17 Years | 0 (0.0%) | 0 (0.0%) |
| 18 to 34 Years | 0 (0.0%) | 0 (0.0%) |
| 35 to 64 Years | 9 (0.3%) | 10 (0.3%) |
| 65 to 74 Years | 0 (0.0%) | 23 (2.6%) |
| 75 Years and over | 0 (0.0%) | 8 (1.0%) |
Disability Class: Cognitive Difficulty
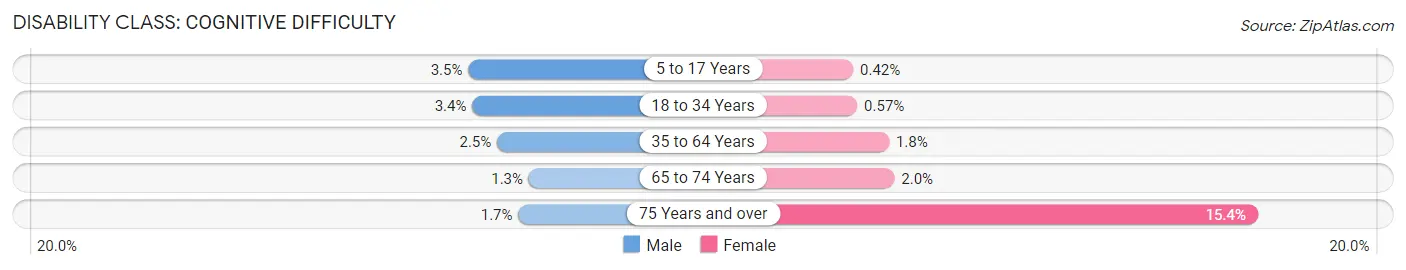
| Age Bracket | Male | Female |
| 5 to 17 Years | 45 (3.5%) | 6 (0.4%) |
| 18 to 34 Years | 51 (3.4%) | 8 (0.6%) |
| 35 to 64 Years | 88 (2.5%) | 56 (1.8%) |
| 65 to 74 Years | 12 (1.3%) | 17 (1.9%) |
| 75 Years and over | 9 (1.7%) | 120 (15.4%) |
Disability Class: Ambulatory Difficulty
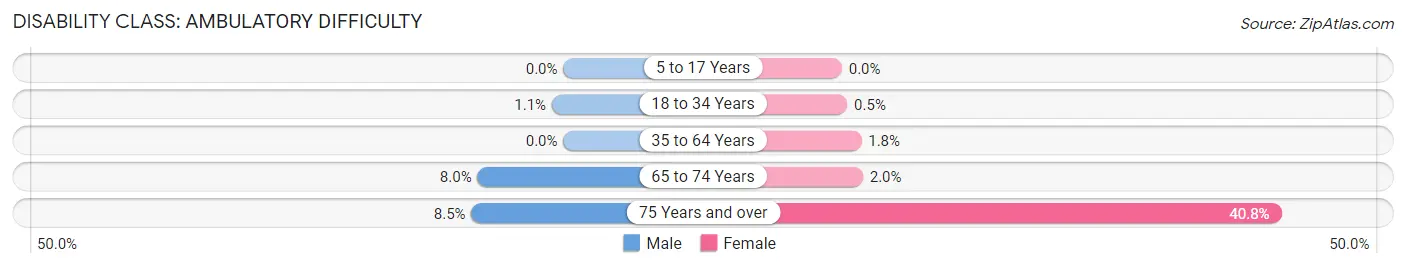
| Age Bracket | Male | Female |
| 5 to 17 Years | 0 (0.0%) | 0 (0.0%) |
| 18 to 34 Years | 16 (1.1%) | 7 (0.5%) |
| 35 to 64 Years | 0 (0.0%) | 58 (1.8%) |
| 65 to 74 Years | 75 (8.0%) | 17 (1.9%) |
| 75 Years and over | 46 (8.5%) | 317 (40.8%) |
Disability Class: Self-Care Difficulty
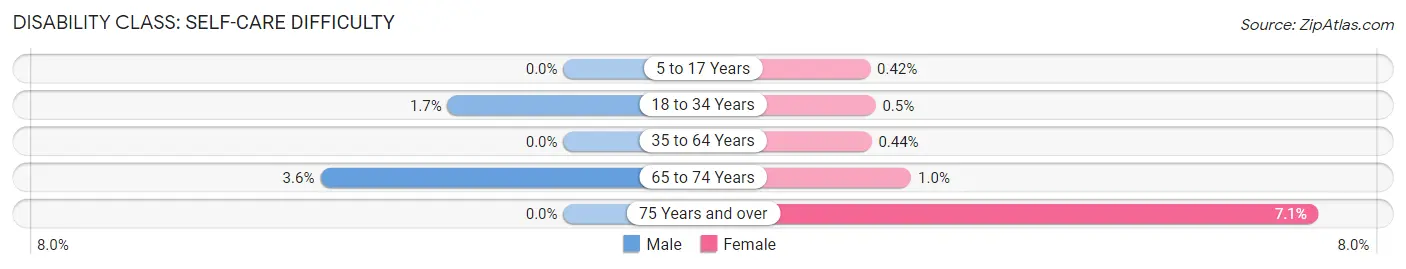
| Age Bracket | Male | Female |
| 5 to 17 Years | 0 (0.0%) | 6 (0.4%) |
| 18 to 34 Years | 26 (1.7%) | 7 (0.5%) |
| 35 to 64 Years | 0 (0.0%) | 14 (0.4%) |
| 65 to 74 Years | 34 (3.6%) | 9 (1.0%) |
| 75 Years and over | 0 (0.0%) | 55 (7.1%) |
Technology Access in Cloverly
Computing Device Access in Cloverly
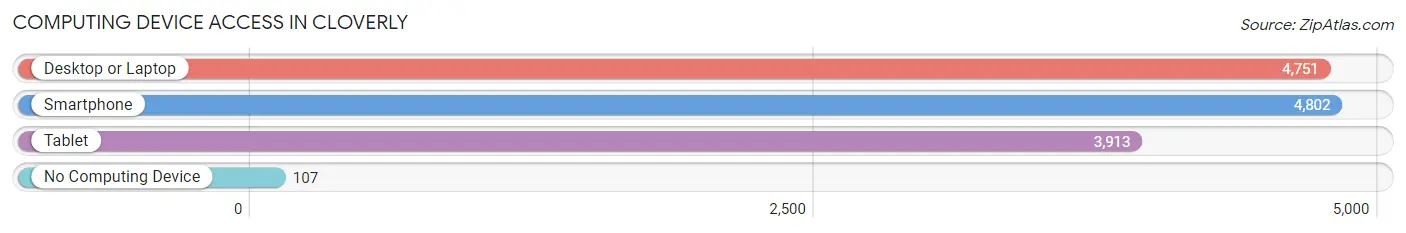
| Device Type | # Households | % Households |
| Desktop or Laptop | 4,751 | 94.1% |
| Smartphone | 4,802 | 95.2% |
| Tablet | 3,913 | 77.5% |
| No Computing Device | 107 | 2.1% |
| Total | 5,047 | 100.0% |
Internet Access in Cloverly
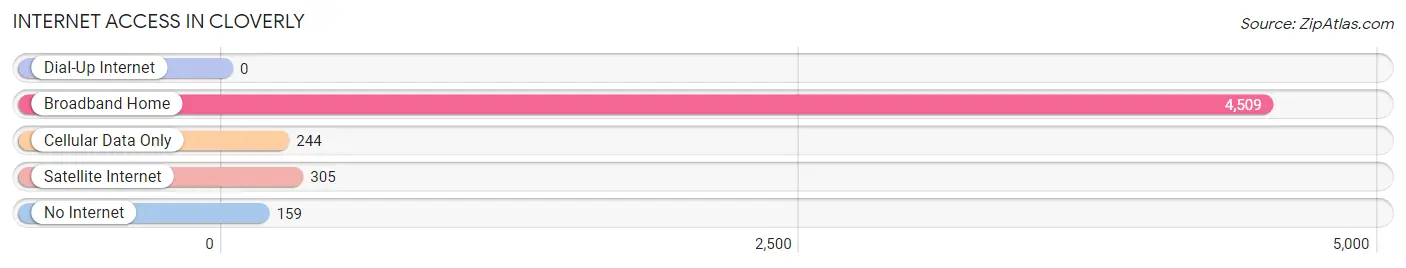
| Internet Type | # Households | % Households |
| Dial-Up Internet | 0 | 0.0% |
| Broadband Home | 4,509 | 89.3% |
| Cellular Data Only | 244 | 4.8% |
| Satellite Internet | 305 | 6.0% |
| No Internet | 159 | 3.2% |
| Total | 5,047 | 100.0% |
Cloverly Summary
Cloverly, Maryland is a small unincorporated community located in Montgomery County, Maryland. It is situated in the northern part of the county, just south of the Washington, D.C. border. The community is bordered by the towns of Olney, Sandy Spring, and Ashton. Cloverly is a rural area with a population of approximately 2,000 people.
History
Cloverly was first settled in the late 1700s by a group of Quakers from Pennsylvania. The Quakers named the area “Cloverly” after the abundance of clover that grew in the area. The community was officially established in 1810 and was home to a variety of small businesses, including a general store, a blacksmith, and a post office.
In the late 1800s, the area began to experience rapid growth due to the development of the B&O Railroad. The railroad brought new people and businesses to the area, and the population of Cloverly began to grow. By the early 1900s, the community had become a popular destination for weekend getaways and summer vacations.
Geography
Cloverly is located in the northern part of Montgomery County, Maryland. It is situated in the Piedmont region of the state, which is characterized by rolling hills and valleys. The area is home to a variety of wildlife, including deer, foxes, and wild turkeys.
The community is bordered by the towns of Olney, Sandy Spring, and Ashton. It is located approximately 25 miles from Washington, D.C. and is accessible via Interstate 270.
Economy
Cloverly is a primarily residential community, with most of its residents commuting to nearby cities for work. The area is home to a variety of small businesses, including restaurants, retail stores, and professional services.
The community is also home to a number of farms, which produce a variety of crops, including corn, soybeans, and hay. The area is also home to a number of wineries, which produce a variety of wines.
Demographics
As of the 2010 census, the population of Cloverly was 2,000. The racial makeup of the community was 94.5% White, 2.5% African American, 0.5% Asian, and 2.5% from other races. The median household income was $90,000, and the median home value was $400,000.
Conclusion
Cloverly, Maryland is a small unincorporated community located in Montgomery County, Maryland. It is situated in the northern part of the county, just south of the Washington, D.C. border. The community is bordered by the towns of Olney, Sandy Spring, and Ashton. Cloverly is a rural area with a population of approximately 2,000 people. The area is home to a variety of small businesses, including restaurants, retail stores, and professional services. The racial makeup of the community was 94.5% White, 2.5% African American, 0.5% Asian, and 2.5% from other races. The median household income was $90,000, and the median home value was $400,000.
Common Questions
What is Per Capita Income in Cloverly?
Per Capita income in Cloverly is $55,997.
What is the Median Family Income in Cloverly?
Median Family Income in Cloverly is $151,954.
What is the Median Household income in Cloverly?
Median Household Income in Cloverly is $144,003.
What is Income or Wage Gap in Cloverly?
Income or Wage Gap in Cloverly is 20.2%.
Women in Cloverly earn 79.8 cents for every dollar earned by a man.
What is Inequality or Gini Index in Cloverly?
Inequality or Gini Index in Cloverly is 0.38.
What is the Total Population of Cloverly?
Total Population of Cloverly is 16,436.
What is the Total Male Population of Cloverly?
Total Male Population of Cloverly is 8,363.
What is the Total Female Population of Cloverly?
Total Female Population of Cloverly is 8,073.
What is the Ratio of Males per 100 Females in Cloverly?
There are 103.59 Males per 100 Females in Cloverly.
What is the Ratio of Females per 100 Males in Cloverly?
There are 96.53 Females per 100 Males in Cloverly.
What is the Median Population Age in Cloverly?
Median Population Age in Cloverly is 42.1 Years.
What is the Average Family Size in Cloverly
Average Family Size in Cloverly is 3.5 People.
What is the Average Household Size in Cloverly
Average Household Size in Cloverly is 3.2 People.
How Large is the Labor Force in Cloverly?
There are 8,778 People in the Labor Forcein in Cloverly.
What is the Percentage of People in the Labor Force in Cloverly?
65.5% of People are in the Labor Force in Cloverly.
What is the Unemployment Rate in Cloverly?
Unemployment Rate in Cloverly is 7.7%.