Zip Codes with the Highest Percentage of Population Employed in Life, Physical & Social Science in Maryland
RELATED REPORTS & OPTIONS
Life, Physical & Social Science
Maryland
Compare Zip Codes
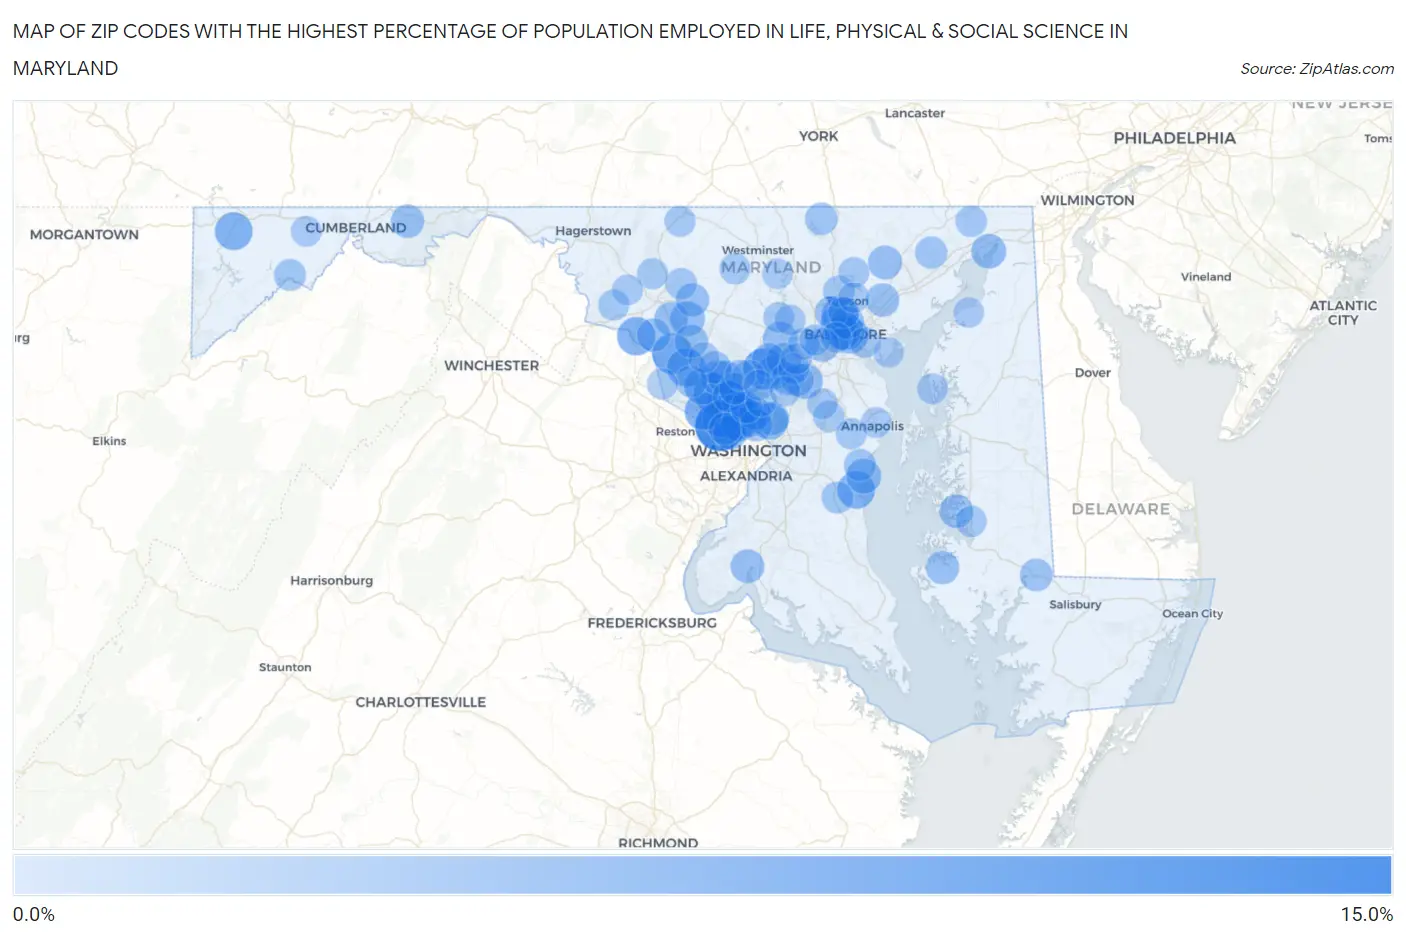
Map of Zip Codes with the Highest Percentage of Population Employed in Life, Physical & Social Science in Maryland
0.0%
15.0%
Zip Codes with the Highest Percentage of Population Employed in Life, Physical & Social Science in Maryland
| Zip Code | % Employed | vs State | vs National | |
| 1. | 20818 | 13.9% | 2.2%(+11.7)#1 | 1.1%(+12.8)#119 |
| 2. | 20814 | 11.2% | 2.2%(+9.04)#2 | 1.1%(+10.1)#164 |
| 3. | 20852 | 10.1% | 2.2%(+7.98)#3 | 1.1%(+9.04)#206 |
| 4. | 20777 | 8.8% | 2.2%(+6.62)#4 | 1.1%(+7.68)#268 |
| 5. | 20838 | 8.3% | 2.2%(+6.18)#5 | 1.1%(+7.24)#299 |
| 6. | 20896 | 8.2% | 2.2%(+6.00)#6 | 1.1%(+7.07)#310 |
| 7. | 20850 | 7.9% | 2.2%(+5.77)#7 | 1.1%(+6.83)#328 |
| 8. | 20895 | 7.5% | 2.2%(+5.37)#8 | 1.1%(+6.44)#359 |
| 9. | 20841 | 7.2% | 2.2%(+5.06)#9 | 1.1%(+6.12)#389 |
| 10. | 21777 | 7.0% | 2.2%(+4.89)#10 | 1.1%(+5.95)#401 |
| 11. | 20817 | 6.9% | 2.2%(+4.76)#11 | 1.1%(+5.82)#420 |
| 12. | 20854 | 6.9% | 2.2%(+4.71)#12 | 1.1%(+5.78)#423 |
| 13. | 21520 | 6.7% | 2.2%(+4.59)#13 | 1.1%(+5.65)#437 |
| 14. | 20779 | 6.7% | 2.2%(+4.53)#14 | 1.1%(+5.59)#444 |
| 15. | 20878 | 6.3% | 2.2%(+4.16)#15 | 1.1%(+5.22)#500 |
| 16. | 21231 | 6.3% | 2.2%(+4.14)#16 | 1.1%(+5.20)#505 |
| 17. | 21210 | 6.1% | 2.2%(+4.00)#17 | 1.1%(+5.06)#527 |
| 18. | 20742 | 6.0% | 2.2%(+3.86)#18 | 1.1%(+4.93)#547 |
| 19. | 21202 | 5.8% | 2.2%(+3.65)#19 | 1.1%(+4.71)#577 |
| 20. | 20910 | 5.7% | 2.2%(+3.55)#20 | 1.1%(+4.61)#590 |
| 21. | 21211 | 5.7% | 2.2%(+3.51)#21 | 1.1%(+4.57)#596 |
| 22. | 20701 | 5.4% | 2.2%(+3.25)#22 | 1.1%(+4.31)#650 |
| 23. | 20815 | 5.3% | 2.2%(+3.13)#23 | 1.1%(+4.19)#691 |
| 24. | 20733 | 5.2% | 2.2%(+3.00)#24 | 1.1%(+4.06)#719 |
| 25. | 21201 | 5.1% | 2.2%(+2.95)#25 | 1.1%(+4.01)#738 |
| 26. | 21754 | 5.0% | 2.2%(+2.80)#26 | 1.1%(+3.86)#773 |
| 27. | 20759 | 4.9% | 2.2%(+2.77)#27 | 1.1%(+3.83)#784 |
| 28. | 21914 | 4.9% | 2.2%(+2.76)#28 | 1.1%(+3.82)#788 |
| 29. | 20880 | 4.8% | 2.2%(+2.61)#29 | 1.1%(+3.67)#829 |
| 30. | 21042 | 4.7% | 2.2%(+2.58)#30 | 1.1%(+3.64)#838 |
| 31. | 21044 | 4.7% | 2.2%(+2.54)#31 | 1.1%(+3.61)#851 |
| 32. | 20816 | 4.6% | 2.2%(+2.40)#32 | 1.1%(+3.46)#907 |
| 33. | 20855 | 4.5% | 2.2%(+2.40)#33 | 1.1%(+3.46)#908 |
| 34. | 21047 | 4.5% | 2.2%(+2.37)#34 | 1.1%(+3.43)#921 |
| 35. | 21704 | 4.5% | 2.2%(+2.35)#35 | 1.1%(+3.42)#925 |
| 36. | 20677 | 4.4% | 2.2%(+2.29)#36 | 1.1%(+3.35)#951 |
| 37. | 21029 | 4.4% | 2.2%(+2.28)#37 | 1.1%(+3.34)#954 |
| 38. | 21250 | 4.3% | 2.2%(+2.17)#38 | 1.1%(+3.23)#993 |
| 39. | 21654 | 4.3% | 2.2%(+2.17)#39 | 1.1%(+3.23)#994 |
| 40. | 20871 | 4.2% | 2.2%(+2.08)#40 | 1.1%(+3.15)#1,030 |
| 41. | 21677 | 4.2% | 2.2%(+2.08)#41 | 1.1%(+3.15)#1,031 |
| 42. | 21128 | 4.2% | 2.2%(+2.08)#42 | 1.1%(+3.14)#1,034 |
| 43. | 21530 | 4.2% | 2.2%(+2.04)#43 | 1.1%(+3.11)#1,049 |
| 44. | 21774 | 4.2% | 2.2%(+2.03)#44 | 1.1%(+3.09)#1,060 |
| 45. | 21710 | 4.2% | 2.2%(+2.00)#45 | 1.1%(+3.07)#1,070 |
| 46. | 20740 | 4.1% | 2.2%(+1.97)#46 | 1.1%(+3.03)#1,091 |
| 47. | 21218 | 4.0% | 2.2%(+1.86)#47 | 1.1%(+2.92)#1,140 |
| 48. | 20901 | 3.8% | 2.2%(+1.68)#48 | 1.1%(+2.74)#1,243 |
| 49. | 20723 | 3.8% | 2.2%(+1.68)#49 | 1.1%(+2.74)#1,244 |
| 50. | 21209 | 3.8% | 2.2%(+1.68)#50 | 1.1%(+2.74)#1,245 |
| 51. | 20860 | 3.8% | 2.2%(+1.67)#51 | 1.1%(+2.74)#1,247 |
| 52. | 21837 | 3.8% | 2.2%(+1.63)#52 | 1.1%(+2.69)#1,273 |
| 53. | 20912 | 3.8% | 2.2%(+1.63)#53 | 1.1%(+2.69)#1,274 |
| 54. | 20879 | 3.7% | 2.2%(+1.57)#54 | 1.1%(+2.63)#1,302 |
| 55. | 20763 | 3.7% | 2.2%(+1.54)#55 | 1.1%(+2.60)#1,320 |
| 56. | 20812 | 3.6% | 2.2%(+1.50)#56 | 1.1%(+2.56)#1,345 |
| 57. | 21053 | 3.6% | 2.2%(+1.44)#57 | 1.1%(+2.50)#1,372 |
| 58. | 20851 | 3.6% | 2.2%(+1.43)#58 | 1.1%(+2.49)#1,376 |
| 59. | 21028 | 3.5% | 2.2%(+1.36)#59 | 1.1%(+2.42)#1,413 |
| 60. | 20765 | 3.3% | 2.2%(+1.18)#60 | 1.1%(+2.24)#1,546 |
| 61. | 20902 | 3.3% | 2.2%(+1.16)#61 | 1.1%(+2.22)#1,564 |
| 62. | 20874 | 3.3% | 2.2%(+1.15)#62 | 1.1%(+2.21)#1,573 |
| 63. | 21562 | 3.3% | 2.2%(+1.12)#63 | 1.1%(+2.18)#1,606 |
| 64. | 20754 | 3.2% | 2.2%(+1.08)#64 | 1.1%(+2.14)#1,637 |
| 65. | 20853 | 3.2% | 2.2%(+1.06)#65 | 1.1%(+2.12)#1,659 |
| 66. | 21701 | 3.1% | 2.2%(+0.986)#66 | 1.1%(+2.05)#1,714 |
| 67. | 21093 | 3.1% | 2.2%(+0.903)#67 | 1.1%(+1.97)#1,812 |
| 68. | 21043 | 3.0% | 2.2%(+0.864)#68 | 1.1%(+1.93)#1,854 |
| 69. | 21911 | 3.0% | 2.2%(+0.859)#69 | 1.1%(+1.92)#1,864 |
| 70. | 20904 | 2.9% | 2.2%(+0.779)#70 | 1.1%(+1.84)#1,959 |
| 71. | 21702 | 2.9% | 2.2%(+0.722)#71 | 1.1%(+1.78)#2,022 |
| 72. | 21114 | 2.9% | 2.2%(+0.717)#72 | 1.1%(+1.78)#2,031 |
| 73. | 21046 | 2.9% | 2.2%(+0.717)#73 | 1.1%(+1.78)#2,032 |
| 74. | 21673 | 2.9% | 2.2%(+0.709)#74 | 1.1%(+1.77)#2,040 |
| 75. | 21045 | 2.8% | 2.2%(+0.687)#75 | 1.1%(+1.75)#2,061 |
| 76. | 21727 | 2.8% | 2.2%(+0.680)#76 | 1.1%(+1.74)#2,073 |
| 77. | 21718 | 2.8% | 2.2%(+0.663)#77 | 1.1%(+1.73)#2,099 |
| 78. | 21228 | 2.8% | 2.2%(+0.657)#78 | 1.1%(+1.72)#2,106 |
| 79. | 21776 | 2.8% | 2.2%(+0.651)#79 | 1.1%(+1.71)#2,113 |
| 80. | 21212 | 2.8% | 2.2%(+0.603)#80 | 1.1%(+1.67)#2,167 |
| 81. | 21140 | 2.7% | 2.2%(+0.572)#81 | 1.1%(+1.63)#2,216 |
| 82. | 21131 | 2.7% | 2.2%(+0.562)#82 | 1.1%(+1.62)#2,231 |
| 83. | 21104 | 2.7% | 2.2%(+0.539)#83 | 1.1%(+1.60)#2,257 |
| 84. | 20876 | 2.7% | 2.2%(+0.535)#84 | 1.1%(+1.60)#2,261 |
| 85. | 21224 | 2.7% | 2.2%(+0.520)#85 | 1.1%(+1.58)#2,280 |
| 86. | 20837 | 2.7% | 2.2%(+0.508)#86 | 1.1%(+1.57)#2,295 |
| 87. | 21769 | 2.7% | 2.2%(+0.502)#87 | 1.1%(+1.57)#2,304 |
| 88. | 21402 | 2.7% | 2.2%(+0.501)#88 | 1.1%(+1.56)#2,306 |
| 89. | 21163 | 2.6% | 2.2%(+0.489)#89 | 1.1%(+1.55)#2,322 |
| 90. | 21223 | 2.6% | 2.2%(+0.484)#90 | 1.1%(+1.55)#2,332 |
| 91. | 21286 | 2.6% | 2.2%(+0.467)#91 | 1.1%(+1.53)#2,361 |
| 92. | 21532 | 2.6% | 2.2%(+0.451)#92 | 1.1%(+1.51)#2,384 |
| 93. | 21661 | 2.6% | 2.2%(+0.436)#93 | 1.1%(+1.50)#2,415 |
| 94. | 21113 | 2.6% | 2.2%(+0.417)#94 | 1.1%(+1.48)#2,447 |
| 95. | 20832 | 2.5% | 2.2%(+0.394)#95 | 1.1%(+1.46)#2,487 |
| 96. | 21048 | 2.5% | 2.2%(+0.369)#96 | 1.1%(+1.43)#2,531 |
| 97. | 21610 | 2.5% | 2.2%(+0.346)#97 | 1.1%(+1.41)#2,576 |
| 98. | 20905 | 2.4% | 2.2%(+0.267)#98 | 1.1%(+1.33)#2,718 |
| 99. | 20707 | 2.4% | 2.2%(+0.266)#99 | 1.1%(+1.33)#2,720 |
| 100. | 21219 | 2.3% | 2.2%(+0.190)#100 | 1.1%(+1.25)#2,854 |
Common Questions
What are the Top 10 Zip Codes with the Highest Percentage of Population Employed in Life, Physical & Social Science in Maryland?
Top 10 Zip Codes with the Highest Percentage of Population Employed in Life, Physical & Social Science in Maryland are:
What zip code has the Highest Percentage of Population Employed in Life, Physical & Social Science in Maryland?
20818 has the Highest Percentage of Population Employed in Life, Physical & Social Science in Maryland with 13.9%.
What is the Percentage of Population Employed in Life, Physical & Social Science in the State of Maryland?
Percentage of Population Employed in Life, Physical & Social Science in Maryland is 2.2%.
What is the Percentage of Population Employed in Life, Physical & Social Science in the United States?
Percentage of Population Employed in Life, Physical & Social Science in the United States is 1.1%.