North Potomac, MD Map & Demographics
North Potomac Map
North Potomac Overview
$71,327
PER CAPITA INCOME
$199,245
AVG FAMILY INCOME
$182,083
AVG HOUSEHOLD INCOME
44.1%
WAGE / INCOME GAP [ % ]
55.9¢/ $1
WAGE / INCOME GAP [ $ ]
$11,413
FAMILY INCOME DEFICIT
0.39
INEQUALITY / GINI INDEX
24,692
TOTAL POPULATION
12,191
MALE POPULATION
12,501
FEMALE POPULATION
97.52
MALES / 100 FEMALES
102.54
FEMALES / 100 MALES
44.4
MEDIAN AGE
3.3
AVG FAMILY SIZE
3.0
AVG HOUSEHOLD SIZE
13,283
LABOR FORCE [ PEOPLE ]
66.4%
PERCENT IN LABOR FORCE
4.8%
UNEMPLOYMENT RATE
Income in North Potomac
Income Overview in North Potomac
Per Capita Income in North Potomac is $71,327, while median incomes of families and households are $199,245 and $182,083 respectively.
| Characteristic | Number | Measure |
| Per Capita Income | 24,692 | $71,327 |
| Median Family Income | 6,776 | $199,245 |
| Mean Family Income | 6,776 | $229,200 |
| Median Household Income | 8,272 | $182,083 |
| Mean Household Income | 8,272 | $210,568 |
| Income Deficit | 6,776 | $11,413 |
| Wage / Income Gap (%) | 24,692 | 44.13% |
| Wage / Income Gap ($) | 24,692 | 55.87¢ per $1 |
| Gini / Inequality Index | 24,692 | 0.39 |
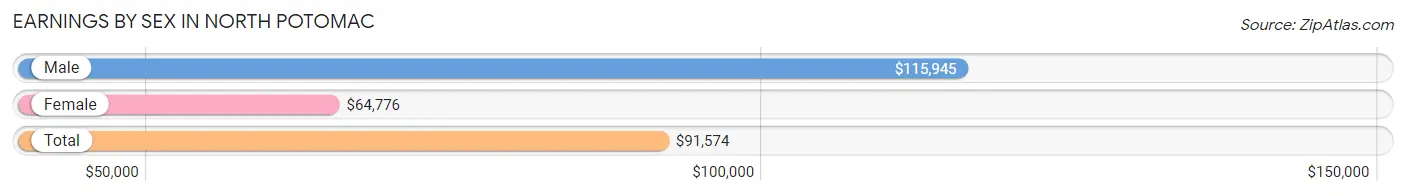
Earnings by Sex in North Potomac
Average Earnings in North Potomac are $91,574, $115,945 for men and $64,776 for women, a difference of 44.1%.
| Sex | Number | Average Earnings |
| Male | 7,632 (55.4%) | $115,945 |
| Female | 6,151 (44.6%) | $64,776 |
| Total | 13,783 (100.0%) | $91,574 |
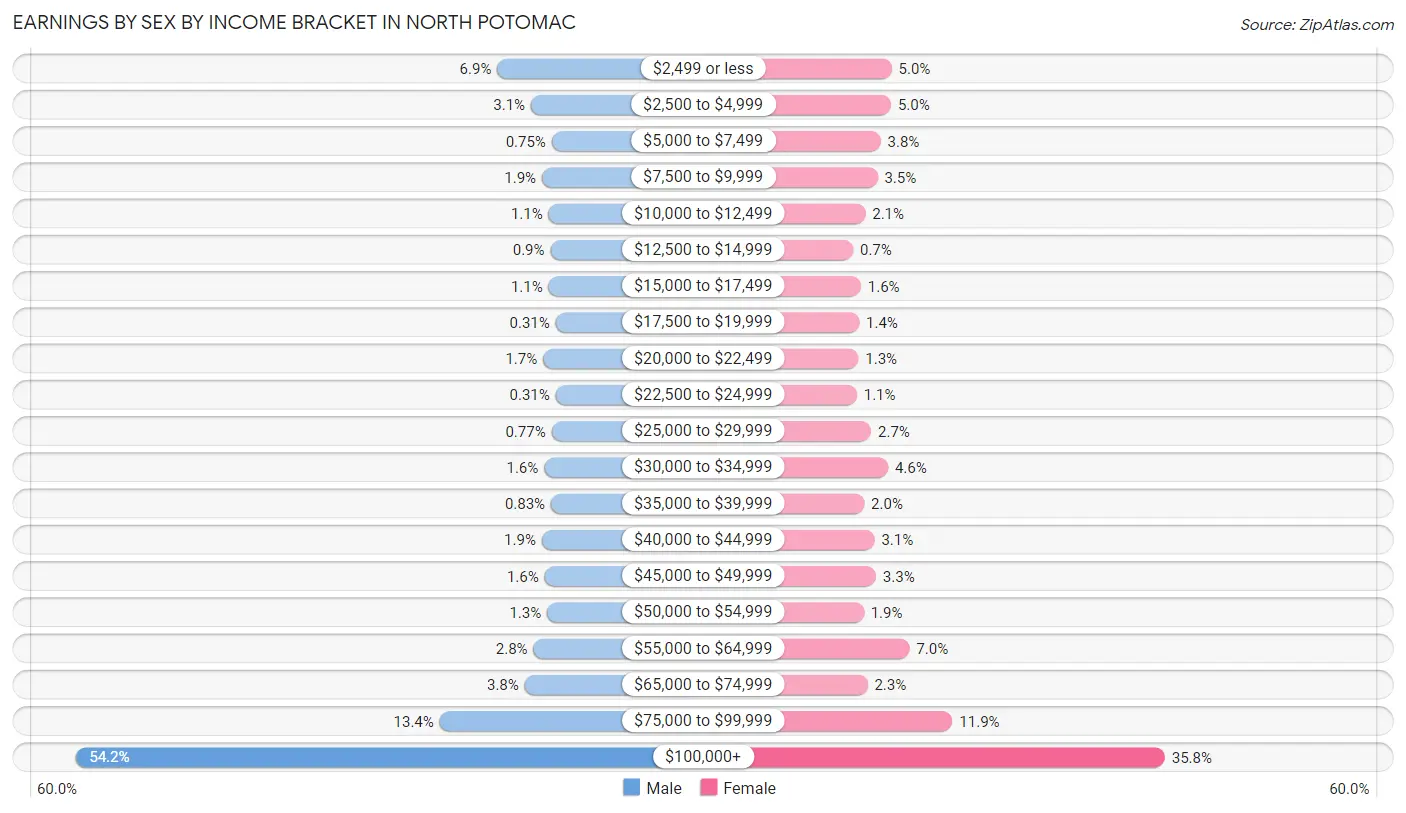
Earnings by Sex by Income Bracket in North Potomac
The most common earnings brackets in North Potomac are $100,000+ for men (4,135 | 54.2%) and $100,000+ for women (2,199 | 35.7%).
| Income | Male | Female |
| $2,499 or less | 524 (6.9%) | 310 (5.0%) |
| $2,500 to $4,999 | 235 (3.1%) | 306 (5.0%) |
| $5,000 to $7,499 | 57 (0.7%) | 234 (3.8%) |
| $7,500 to $9,999 | 141 (1.8%) | 212 (3.5%) |
| $10,000 to $12,499 | 84 (1.1%) | 128 (2.1%) |
| $12,500 to $14,999 | 69 (0.9%) | 43 (0.7%) |
| $15,000 to $17,499 | 84 (1.1%) | 97 (1.6%) |
| $17,500 to $19,999 | 24 (0.3%) | 85 (1.4%) |
| $20,000 to $22,499 | 131 (1.7%) | 80 (1.3%) |
| $22,500 to $24,999 | 24 (0.3%) | 69 (1.1%) |
| $25,000 to $29,999 | 59 (0.8%) | 168 (2.7%) |
| $30,000 to $34,999 | 122 (1.6%) | 285 (4.6%) |
| $35,000 to $39,999 | 63 (0.8%) | 120 (1.9%) |
| $40,000 to $44,999 | 143 (1.9%) | 191 (3.1%) |
| $45,000 to $49,999 | 118 (1.5%) | 201 (3.3%) |
| $50,000 to $54,999 | 97 (1.3%) | 117 (1.9%) |
| $55,000 to $64,999 | 214 (2.8%) | 433 (7.0%) |
| $65,000 to $74,999 | 289 (3.8%) | 143 (2.3%) |
| $75,000 to $99,999 | 1,019 (13.4%) | 730 (11.9%) |
| $100,000+ | 4,135 (54.2%) | 2,199 (35.7%) |
| Total | 7,632 (100.0%) | 6,151 (100.0%) |
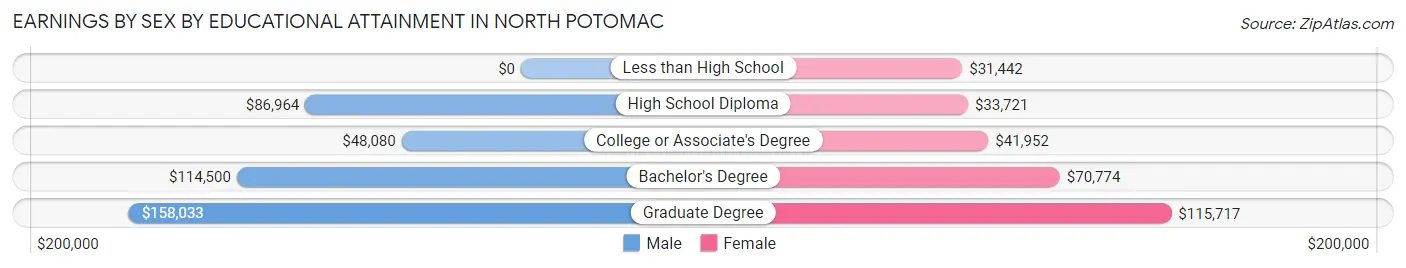
Earnings by Sex by Educational Attainment in North Potomac
Average earnings in North Potomac are $131,918 for men and $83,496 for women, a difference of 36.7%. Men with an educational attainment of graduate degree enjoy the highest average annual earnings of $158,033, while those with college or associate's degree education earn the least with $48,080. Women with an educational attainment of graduate degree earn the most with the average annual earnings of $115,717, while those with less than high school education have the smallest earnings of $31,442.
| Educational Attainment | Male Income | Female Income |
| Less than High School | - | - |
| High School Diploma | $86,964 | $33,721 |
| College or Associate's Degree | $48,080 | $41,952 |
| Bachelor's Degree | $114,500 | $70,774 |
| Graduate Degree | $158,033 | $115,717 |
| Total | $131,918 | $83,496 |
Family Income in North Potomac
Family Income Brackets in North Potomac
According to the North Potomac family income data, there are 3,374 families falling into the $200,000+ income range, which is the most common income bracket and makes up 49.8% of all families. Conversely, the $25,000 to $34,999 income bracket is the least frequent group with only 47 families (0.7%) belonging to this category.
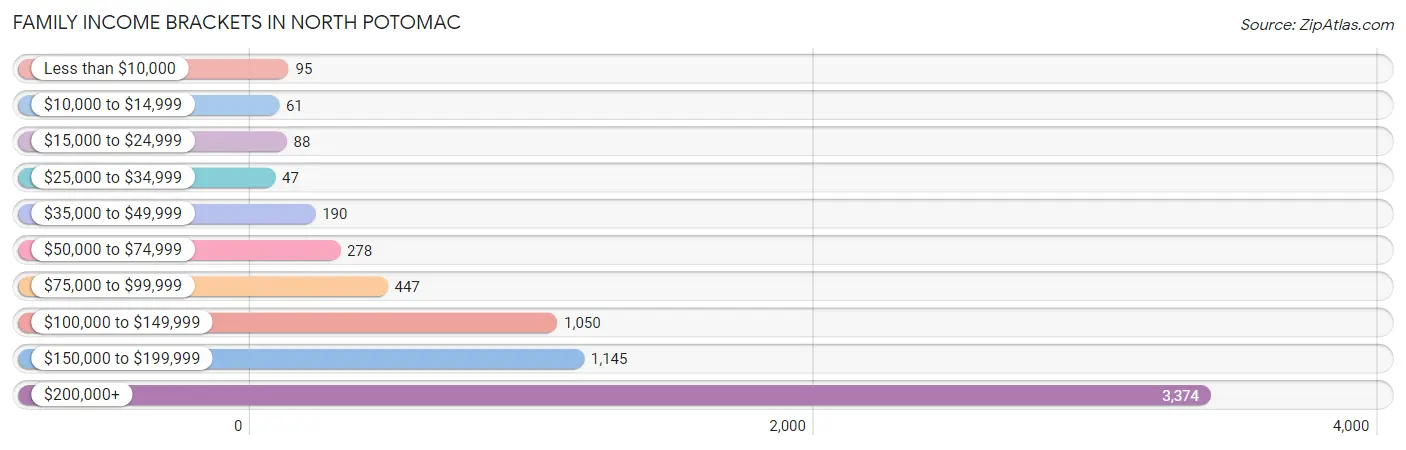
| Income Bracket | # Families | % Families |
| Less than $10,000 | 95 | 1.4% |
| $10,000 to $14,999 | 61 | 0.9% |
| $15,000 to $24,999 | 88 | 1.3% |
| $25,000 to $34,999 | 47 | 0.7% |
| $35,000 to $49,999 | 190 | 2.8% |
| $50,000 to $74,999 | 278 | 4.1% |
| $75,000 to $99,999 | 447 | 6.6% |
| $100,000 to $149,999 | 1,050 | 15.5% |
| $150,000 to $199,999 | 1,145 | 16.9% |
| $200,000+ | 3,374 | 49.8% |
Family Income by Famaliy Size in North Potomac
5-person families (623 | 9.2%) account for the highest median family income in North Potomac with $250,001 per family, while 2-person families (2,430 | 35.9%) have the highest median income of $88,496 per family member.
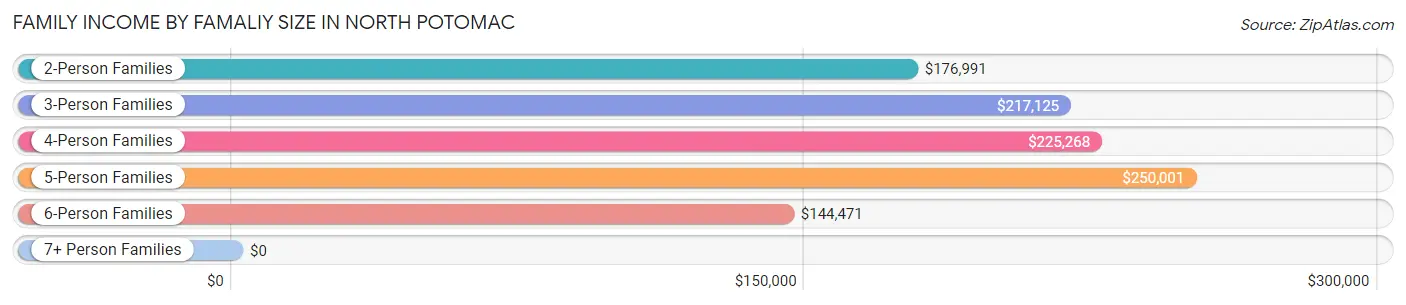
| Income Bracket | # Families | Median Income |
| 2-Person Families | 2,430 (35.9%) | $176,991 |
| 3-Person Families | 1,563 (23.1%) | $217,125 |
| 4-Person Families | 1,947 (28.7%) | $225,268 |
| 5-Person Families | 623 (9.2%) | $250,001 |
| 6-Person Families | 199 (2.9%) | $144,471 |
| 7+ Person Families | 14 (0.2%) | $0 |
| Total | 6,776 (100.0%) | $199,245 |
Family Income by Number of Earners in North Potomac
The median family income in North Potomac is $199,245, with families comprising 3+ earners (1,244) having the highest median family income of $250,001, while families with no earners (663) have the lowest median family income of $99,531, accounting for 18.4% and 9.8% of families, respectively.
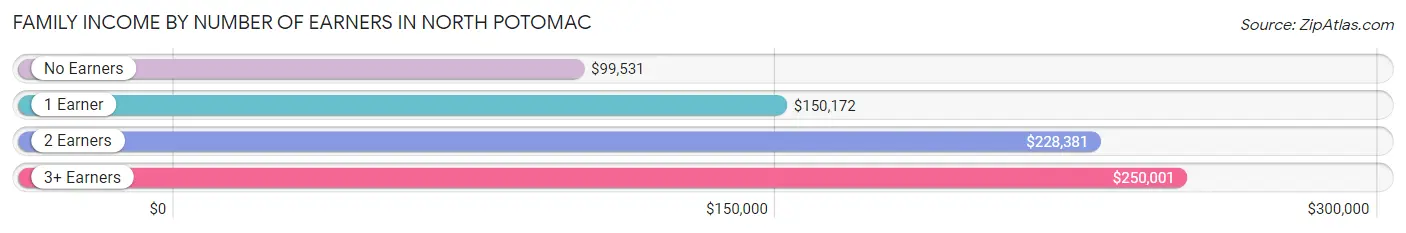
| Number of Earners | # Families | Median Income |
| No Earners | 663 (9.8%) | $99,531 |
| 1 Earner | 1,804 (26.6%) | $150,172 |
| 2 Earners | 3,065 (45.2%) | $228,381 |
| 3+ Earners | 1,244 (18.4%) | $250,001 |
| Total | 6,776 (100.0%) | $199,245 |
Household Income in North Potomac
Household Income Brackets in North Potomac
With 3,673 households falling in the category, the $200,000+ income range is the most frequent in North Potomac, accounting for 44.4% of all households. In contrast, only 99 households (1.2%) fall into the $25,000 to $34,999 income bracket, making it the least populous group.
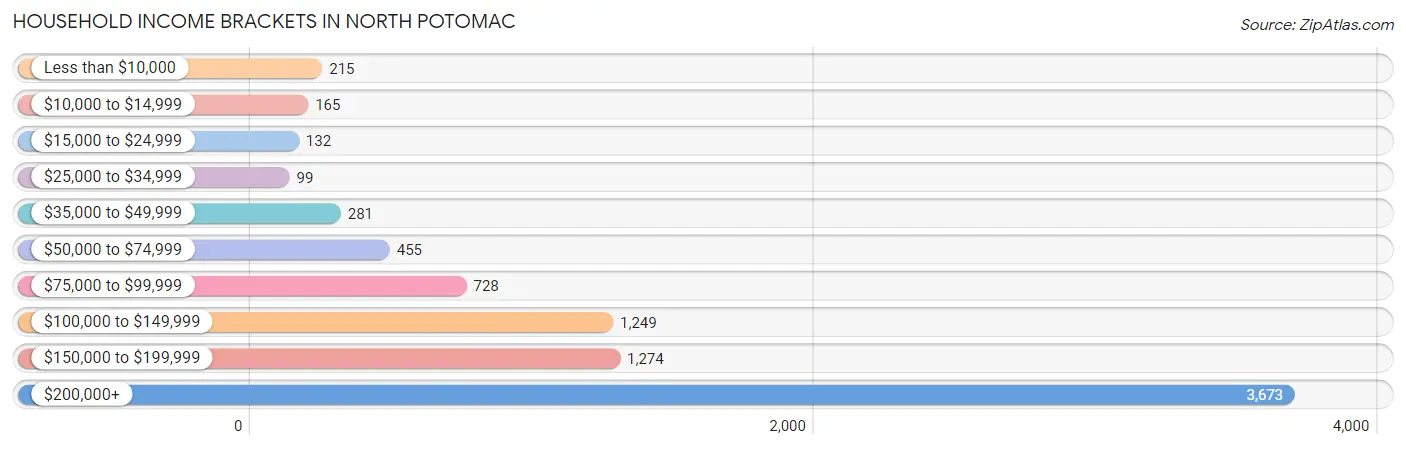
| Income Bracket | # Households | % Households |
| Less than $10,000 | 215 | 2.6% |
| $10,000 to $14,999 | 165 | 2.0% |
| $15,000 to $24,999 | 132 | 1.6% |
| $25,000 to $34,999 | 99 | 1.2% |
| $35,000 to $49,999 | 281 | 3.4% |
| $50,000 to $74,999 | 455 | 5.5% |
| $75,000 to $99,999 | 728 | 8.8% |
| $100,000 to $149,999 | 1,249 | 15.1% |
| $150,000 to $199,999 | 1,274 | 15.4% |
| $200,000+ | 3,673 | 44.4% |
Household Income by Householder Age in North Potomac
The median household income in North Potomac is $182,083, with the highest median household income of $205,083 found in the 45 to 64 years age bracket for the primary householder. A total of 4,164 households (50.3%) fall into this category. Meanwhile, the 15 to 24 years age bracket for the primary householder has the lowest median household income of $2,499, with 50 households (0.6%) in this group.
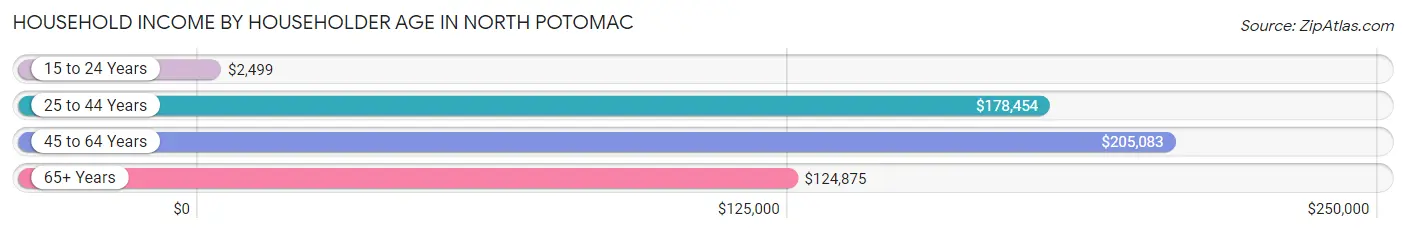
| Income Bracket | # Households | Median Income |
| 15 to 24 Years | 50 (0.6%) | $2,499 |
| 25 to 44 Years | 1,725 (20.8%) | $178,454 |
| 45 to 64 Years | 4,164 (50.3%) | $205,083 |
| 65+ Years | 2,333 (28.2%) | $124,875 |
| Total | 8,272 (100.0%) | $182,083 |
Poverty in North Potomac
Income Below Poverty by Sex and Age in North Potomac
With 3.8% poverty level for males and 5.6% for females among the residents of North Potomac, 5 year old males and 75 year old and over females are the most vulnerable to poverty, with 24 males (18.3%) and 237 females (22.1%) in their respective age groups living below the poverty level.
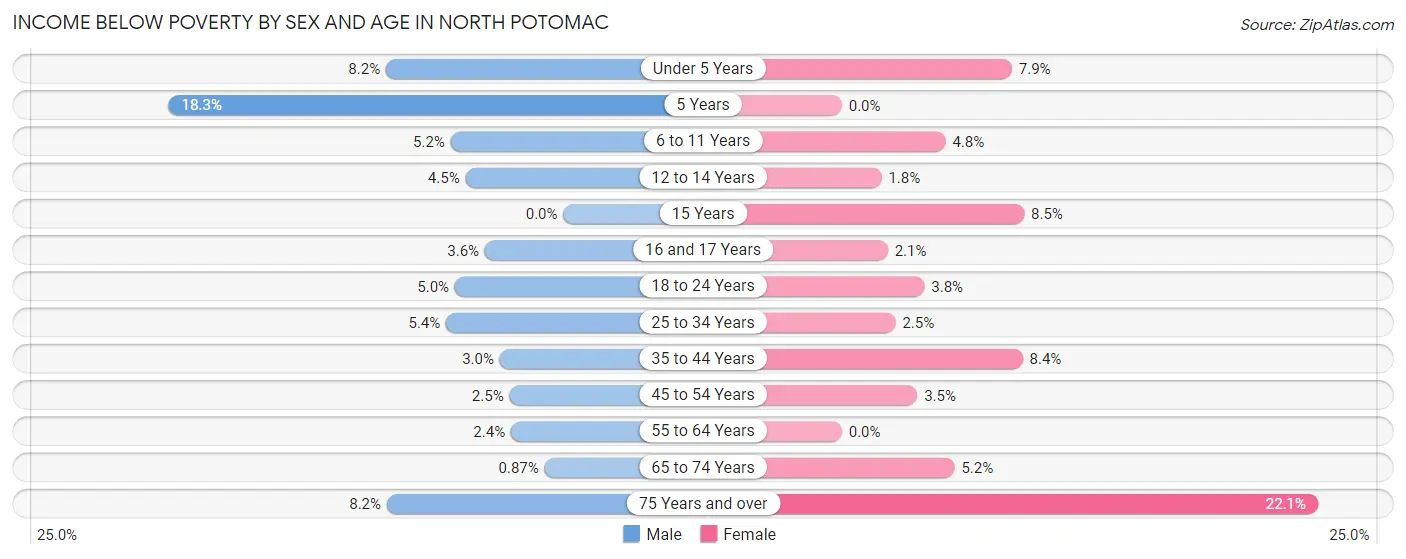
| Age Bracket | Male | Female |
| Under 5 Years | 39 (8.2%) | 36 (7.9%) |
| 5 Years | 24 (18.3%) | 0 (0.0%) |
| 6 to 11 Years | 57 (5.2%) | 45 (4.8%) |
| 12 to 14 Years | 21 (4.5%) | 9 (1.8%) |
| 15 Years | 0 (0.0%) | 11 (8.5%) |
| 16 and 17 Years | 12 (3.6%) | 8 (2.1%) |
| 18 to 24 Years | 58 (5.0%) | 50 (3.8%) |
| 25 to 34 Years | 60 (5.4%) | 17 (2.5%) |
| 35 to 44 Years | 41 (2.9%) | 129 (8.4%) |
| 45 to 54 Years | 46 (2.5%) | 86 (3.5%) |
| 55 to 64 Years | 46 (2.4%) | 0 (0.0%) |
| 65 to 74 Years | 12 (0.9%) | 70 (5.2%) |
| 75 Years and over | 49 (8.2%) | 237 (22.1%) |
| Total | 465 (3.8%) | 698 (5.6%) |
Income Above Poverty by Sex and Age in North Potomac
According to the poverty statistics in North Potomac, males aged 15 years and females aged 5 years are the age groups that are most secure financially, with 100.0% of males and 100.0% of females in these age groups living above the poverty line.
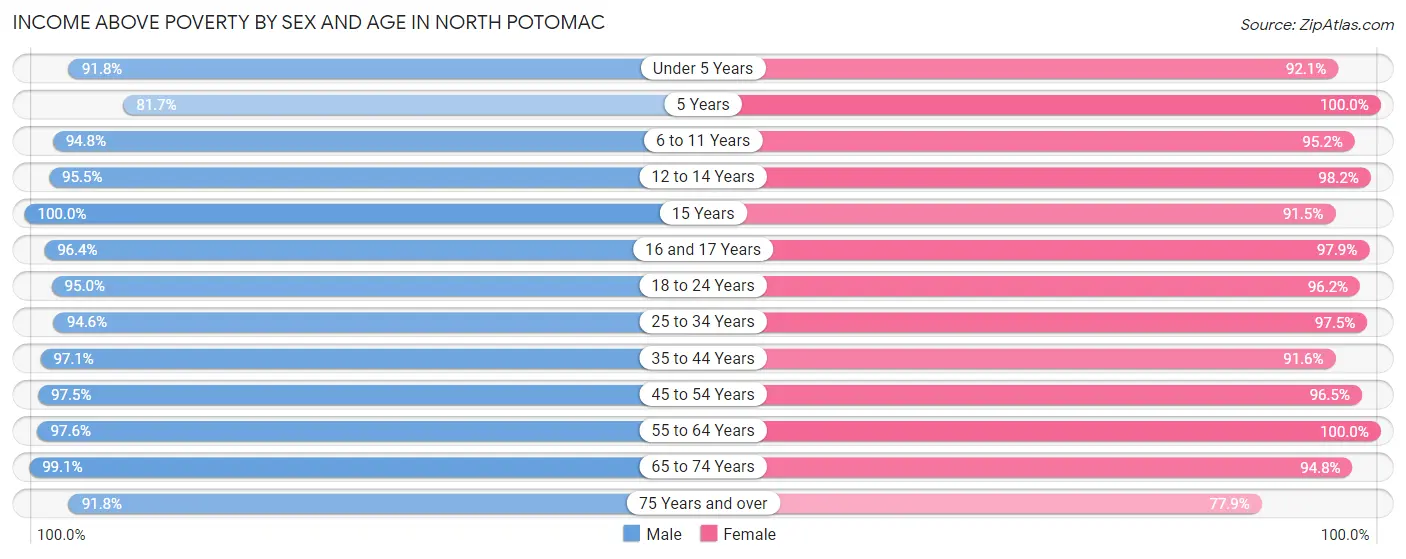
| Age Bracket | Male | Female |
| Under 5 Years | 435 (91.8%) | 420 (92.1%) |
| 5 Years | 107 (81.7%) | 173 (100.0%) |
| 6 to 11 Years | 1,032 (94.8%) | 891 (95.2%) |
| 12 to 14 Years | 442 (95.5%) | 481 (98.2%) |
| 15 Years | 333 (100.0%) | 119 (91.5%) |
| 16 and 17 Years | 318 (96.4%) | 367 (97.9%) |
| 18 to 24 Years | 1,095 (95.0%) | 1,257 (96.2%) |
| 25 to 34 Years | 1,042 (94.6%) | 666 (97.5%) |
| 35 to 44 Years | 1,351 (97.1%) | 1,408 (91.6%) |
| 45 to 54 Years | 1,795 (97.5%) | 2,370 (96.5%) |
| 55 to 64 Years | 1,850 (97.6%) | 1,534 (100.0%) |
| 65 to 74 Years | 1,374 (99.1%) | 1,268 (94.8%) |
| 75 Years and over | 549 (91.8%) | 836 (77.9%) |
| Total | 11,723 (96.2%) | 11,790 (94.4%) |
Income Below Poverty Among Married-Couple Families in North Potomac
The poverty statistics for married-couple families in North Potomac show that 2.6% or 158 of the total 5,952 families live below the poverty line. Families with no children have the highest poverty rate of 2.8%, comprising of 86 families. On the other hand, families with 3 or 4 children have the lowest poverty rate of 2.1%, which includes 8 families.
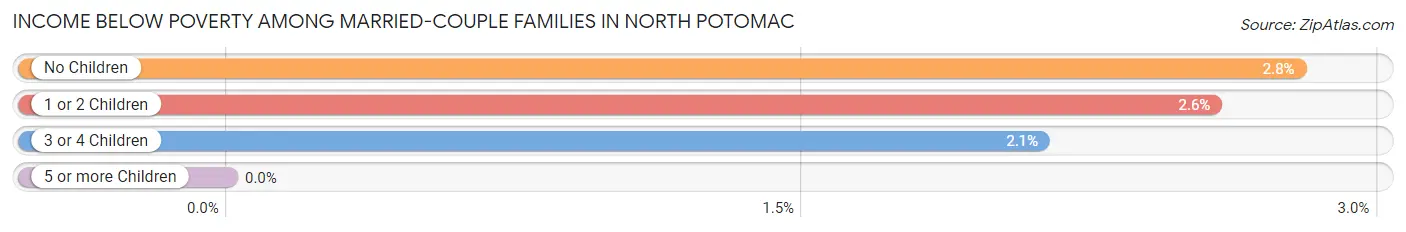
| Children | Above Poverty | Below Poverty |
| No Children | 3,001 (97.2%) | 86 (2.8%) |
| 1 or 2 Children | 2,423 (97.4%) | 64 (2.6%) |
| 3 or 4 Children | 370 (97.9%) | 8 (2.1%) |
| 5 or more Children | 0 (0.0%) | 0 (0.0%) |
| Total | 5,794 (97.4%) | 158 (2.6%) |
Income Below Poverty Among Single-Parent Households in North Potomac
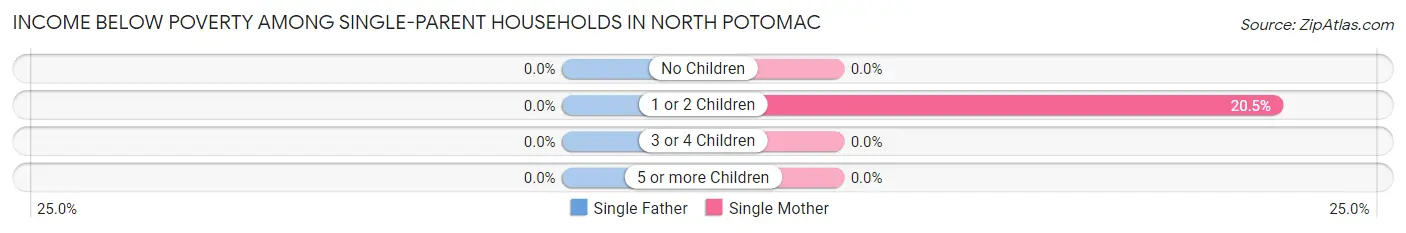
| Children | Single Father | Single Mother |
| No Children | 0 (0.0%) | 0 (0.0%) |
| 1 or 2 Children | 0 (0.0%) | 73 (20.4%) |
| 3 or 4 Children | 0 (0.0%) | 0 (0.0%) |
| 5 or more Children | 0 (0.0%) | 0 (0.0%) |
| Total | 0 (0.0%) | 73 (12.8%) |
Income Below Poverty Among Married-Couple vs Single-Parent Households in North Potomac
The poverty data for North Potomac shows that 158 of the married-couple family households (2.6%) and 73 of the single-parent households (8.9%) are living below the poverty level. Within the married-couple family households, those with no children have the highest poverty rate, with 86 households (2.8%) falling below the poverty line. Among the single-parent households, those with 1 or 2 children have the highest poverty rate, with 73 household (17.5%) living below poverty.
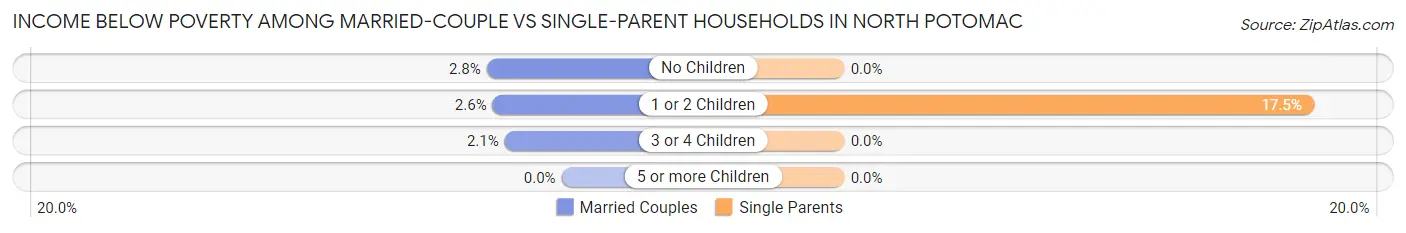
| Children | Married-Couple Families | Single-Parent Households |
| No Children | 86 (2.8%) | 0 (0.0%) |
| 1 or 2 Children | 64 (2.6%) | 73 (17.5%) |
| 3 or 4 Children | 8 (2.1%) | 0 (0.0%) |
| 5 or more Children | 0 (0.0%) | 0 (0.0%) |
| Total | 158 (2.6%) | 73 (8.9%) |
Race in North Potomac
The most populous races in North Potomac are White / Caucasian (10,764 | 43.6%), Asian (10,039 | 40.7%), and Black / African American (1,954 | 7.9%).
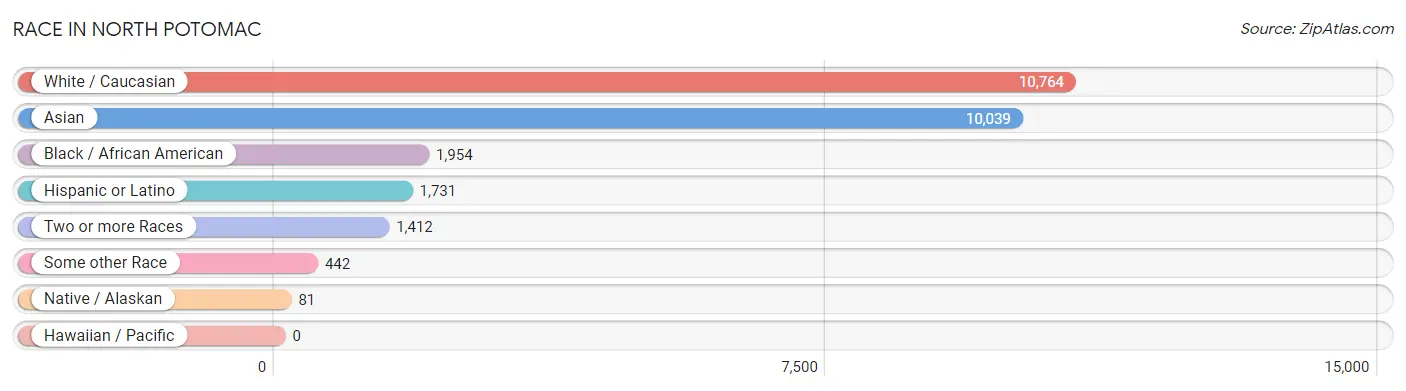
| Race | # Population | % Population |
| Asian | 10,039 | 40.7% |
| Black / African American | 1,954 | 7.9% |
| Hawaiian / Pacific | 0 | 0.0% |
| Hispanic or Latino | 1,731 | 7.0% |
| Native / Alaskan | 81 | 0.3% |
| White / Caucasian | 10,764 | 43.6% |
| Two or more Races | 1,412 | 5.7% |
| Some other Race | 442 | 1.8% |
| Total | 24,692 | 100.0% |
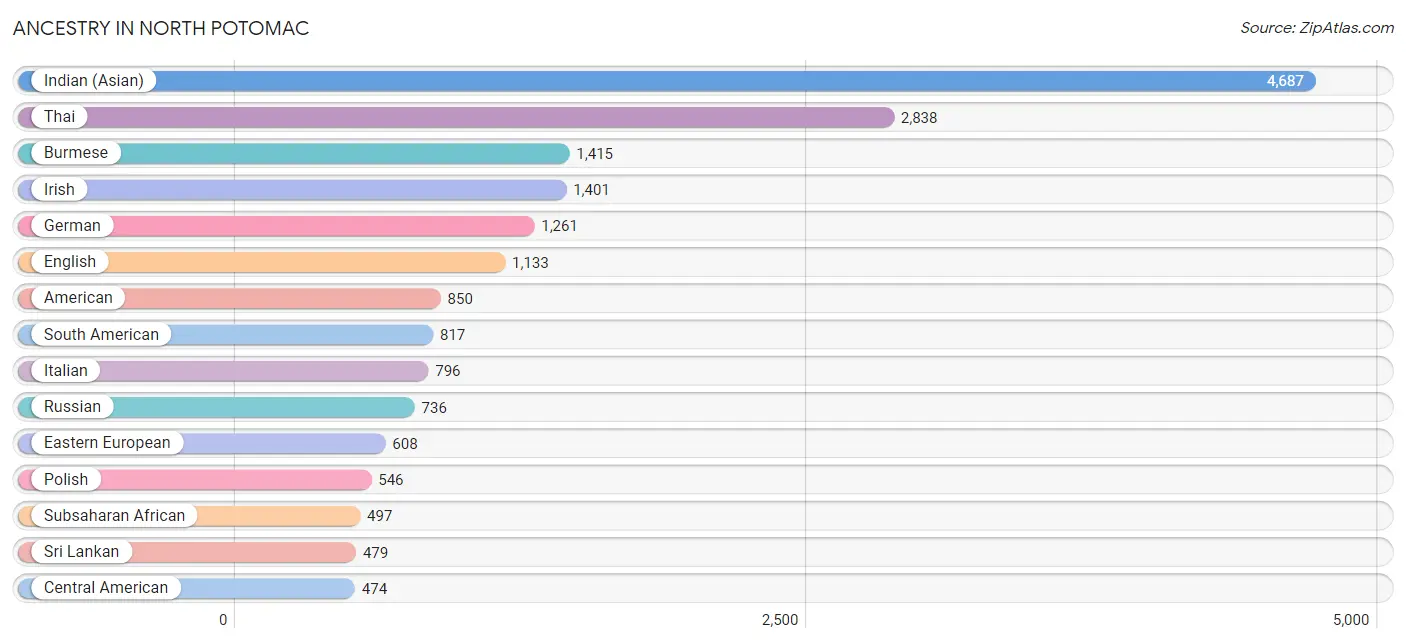
Ancestry in North Potomac
The most populous ancestries reported in North Potomac are Indian (Asian) (4,687 | 19.0%), Thai (2,838 | 11.5%), Burmese (1,415 | 5.7%), Irish (1,401 | 5.7%), and German (1,261 | 5.1%), together accounting for 47.0% of all North Potomac residents.
| Ancestry | # Population | % Population |
| African | 30 | 0.1% |
| American | 850 | 3.4% |
| Arab | 238 | 1.0% |
| Argentinean | 19 | 0.1% |
| Armenian | 140 | 0.6% |
| Australian | 7 | 0.0% |
| Austrian | 81 | 0.3% |
| Basque | 24 | 0.1% |
| Bhutanese | 112 | 0.4% |
| Bolivian | 79 | 0.3% |
| Brazilian | 153 | 0.6% |
| British | 96 | 0.4% |
| Burmese | 1,415 | 5.7% |
| Cambodian | 33 | 0.1% |
| Canadian | 40 | 0.2% |
| Carpatho Rusyn | 7 | 0.0% |
| Celtic | 7 | 0.0% |
| Central American | 474 | 1.9% |
| Cherokee | 9 | 0.0% |
| Chilean | 23 | 0.1% |
| Colombian | 212 | 0.9% |
| Costa Rican | 8 | 0.0% |
| Croatian | 6 | 0.0% |
| Cuban | 100 | 0.4% |
| Cypriot | 83 | 0.3% |
| Czech | 25 | 0.1% |
| Czechoslovakian | 5 | 0.0% |
| Danish | 119 | 0.5% |
| Dominican | 74 | 0.3% |
| Dutch | 244 | 1.0% |
| Eastern European | 608 | 2.5% |
| Ecuadorian | 185 | 0.7% |
| Egyptian | 42 | 0.2% |
| English | 1,133 | 4.6% |
| Ethiopian | 143 | 0.6% |
| European | 388 | 1.6% |
| Filipino | 465 | 1.9% |
| Finnish | 23 | 0.1% |
| French | 227 | 0.9% |
| French Canadian | 22 | 0.1% |
| German | 1,261 | 5.1% |
| Greek | 152 | 0.6% |
| Guatemalan | 214 | 0.9% |
| Guyanese | 69 | 0.3% |
| Haitian | 31 | 0.1% |
| Honduran | 37 | 0.2% |
| Hungarian | 73 | 0.3% |
| Icelander | 7 | 0.0% |
| Indian (Asian) | 4,687 | 19.0% |
| Iranian | 392 | 1.6% |
| Irish | 1,401 | 5.7% |
| Israeli | 69 | 0.3% |
| Italian | 796 | 3.2% |
| Jamaican | 8 | 0.0% |
| Kenyan | 192 | 0.8% |
| Korean | 367 | 1.5% |
| Laotian | 19 | 0.1% |
| Latvian | 19 | 0.1% |
| Lebanese | 64 | 0.3% |
| Lithuanian | 101 | 0.4% |
| Lumbee | 8 | 0.0% |
| Luxembourger | 9 | 0.0% |
| Mexican | 72 | 0.3% |
| Mexican American Indian | 6 | 0.0% |
| Mongolian | 17 | 0.1% |
| Moroccan | 112 | 0.4% |
| Native Hawaiian | 27 | 0.1% |
| Navajo | 12 | 0.1% |
| Nigerian | 32 | 0.1% |
| Northern European | 19 | 0.1% |
| Norwegian | 73 | 0.3% |
| Okinawan | 15 | 0.1% |
| Pakistani | 80 | 0.3% |
| Panamanian | 32 | 0.1% |
| Paraguayan | 59 | 0.2% |
| Peruvian | 240 | 1.0% |
| Polish | 546 | 2.2% |
| Portuguese | 113 | 0.5% |
| Puerto Rican | 61 | 0.3% |
| Romanian | 38 | 0.2% |
| Russian | 736 | 3.0% |
| Salvadoran | 183 | 0.7% |
| Scandinavian | 19 | 0.1% |
| Scotch-Irish | 158 | 0.6% |
| Scottish | 251 | 1.0% |
| Serbian | 123 | 0.5% |
| Slovak | 7 | 0.0% |
| South African | 6 | 0.0% |
| South American | 817 | 3.3% |
| Spaniard | 24 | 0.1% |
| Spanish | 48 | 0.2% |
| Sri Lankan | 479 | 1.9% |
| Subsaharan African | 497 | 2.0% |
| Swedish | 55 | 0.2% |
| Swiss | 31 | 0.1% |
| Syrian | 13 | 0.1% |
| Thai | 2,838 | 11.5% |
| Trinidadian and Tobagonian | 69 | 0.3% |
| Turkish | 8 | 0.0% |
| Ukrainian | 175 | 0.7% |
| Welsh | 122 | 0.5% |
| West Indian | 269 | 1.1% |
| Yugoslavian | 47 | 0.2% | View All 103 Rows |
Immigrants in North Potomac
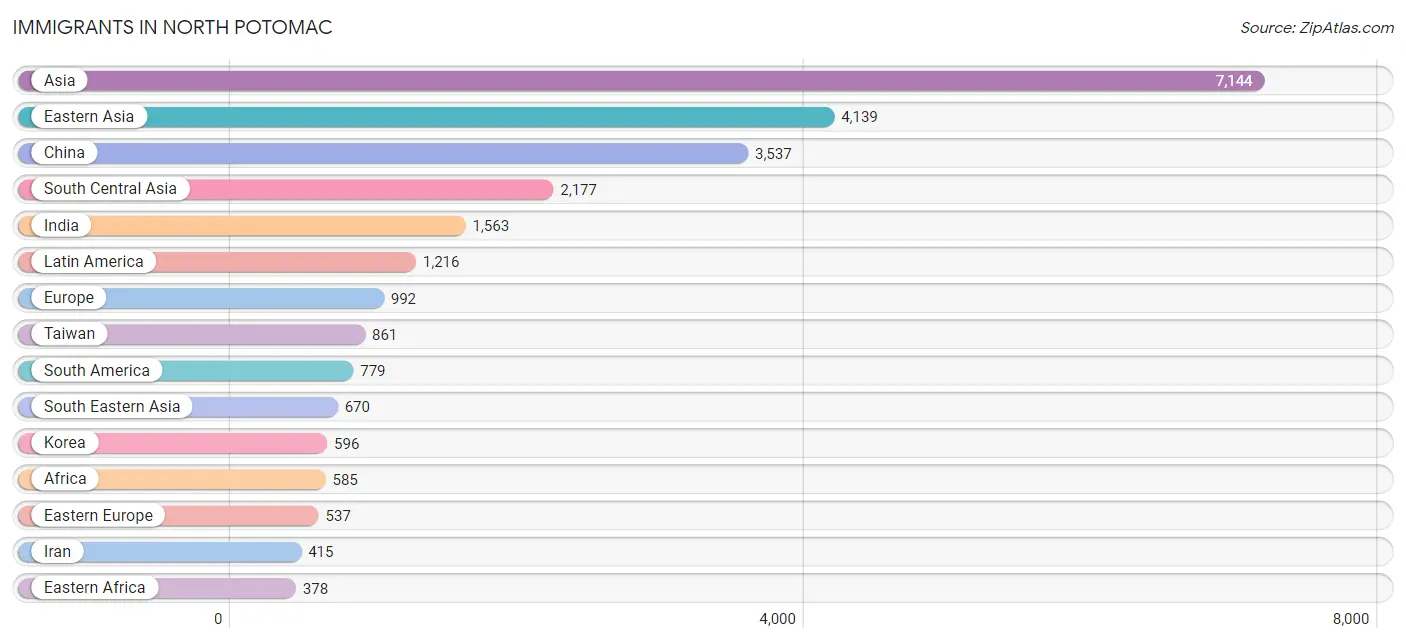
The most numerous immigrant groups reported in North Potomac came from Asia (7,144 | 28.9%), Eastern Asia (4,139 | 16.8%), China (3,537 | 14.3%), South Central Asia (2,177 | 8.8%), and India (1,563 | 6.3%), together accounting for 75.2% of all North Potomac residents.
| Immigration Origin | # Population | % Population |
| Africa | 585 | 2.4% |
| Argentina | 5 | 0.0% |
| Asia | 7,144 | 28.9% |
| Australia | 85 | 0.3% |
| Belgium | 7 | 0.0% |
| Bolivia | 61 | 0.3% |
| Bosnia and Herzegovina | 47 | 0.2% |
| Brazil | 99 | 0.4% |
| Canada | 54 | 0.2% |
| Caribbean | 235 | 0.9% |
| Central America | 202 | 0.8% |
| Chile | 14 | 0.1% |
| China | 3,537 | 14.3% |
| Colombia | 204 | 0.8% |
| Costa Rica | 8 | 0.0% |
| Cuba | 73 | 0.3% |
| Dominican Republic | 55 | 0.2% |
| Eastern Africa | 378 | 1.5% |
| Eastern Asia | 4,139 | 16.8% |
| Eastern Europe | 537 | 2.2% |
| Ecuador | 159 | 0.6% |
| Egypt | 43 | 0.2% |
| El Salvador | 100 | 0.4% |
| England | 92 | 0.4% |
| Ethiopia | 75 | 0.3% |
| Europe | 992 | 4.0% |
| France | 27 | 0.1% |
| Germany | 194 | 0.8% |
| Ghana | 6 | 0.0% |
| Greece | 8 | 0.0% |
| Guatemala | 43 | 0.2% |
| Guyana | 36 | 0.2% |
| Honduras | 8 | 0.0% |
| Hong Kong | 172 | 0.7% |
| India | 1,563 | 6.3% |
| Indonesia | 12 | 0.1% |
| Iran | 415 | 1.7% |
| Ireland | 8 | 0.0% |
| Israel | 19 | 0.1% |
| Italy | 36 | 0.2% |
| Jamaica | 5 | 0.0% |
| Japan | 6 | 0.0% |
| Kenya | 257 | 1.0% |
| Korea | 596 | 2.4% |
| Latin America | 1,216 | 4.9% |
| Lebanon | 20 | 0.1% |
| Lithuania | 6 | 0.0% |
| Malaysia | 14 | 0.1% |
| Mexico | 11 | 0.0% |
| Moldova | 11 | 0.0% |
| Nepal | 6 | 0.0% |
| Nigeria | 37 | 0.2% |
| Northern Africa | 75 | 0.3% |
| Northern Europe | 144 | 0.6% |
| Oceania | 85 | 0.3% |
| Pakistan | 172 | 0.7% |
| Panama | 32 | 0.1% |
| Peru | 168 | 0.7% |
| Philippines | 281 | 1.1% |
| Poland | 26 | 0.1% |
| Portugal | 31 | 0.1% |
| Romania | 15 | 0.1% |
| Russia | 214 | 0.9% |
| Sierra Leone | 5 | 0.0% |
| Singapore | 35 | 0.1% |
| South Africa | 72 | 0.3% |
| South America | 779 | 3.2% |
| South Central Asia | 2,177 | 8.8% |
| South Eastern Asia | 670 | 2.7% |
| Southern Europe | 75 | 0.3% |
| Sri Lanka | 21 | 0.1% |
| Sudan | 32 | 0.1% |
| Sweden | 6 | 0.0% |
| Switzerland | 8 | 0.0% |
| Syria | 26 | 0.1% |
| Taiwan | 861 | 3.5% |
| Thailand | 33 | 0.1% |
| Trinidad and Tobago | 19 | 0.1% |
| Ukraine | 187 | 0.8% |
| Vietnam | 295 | 1.2% |
| West Indies | 52 | 0.2% |
| Western Africa | 60 | 0.2% |
| Western Asia | 158 | 0.6% |
| Western Europe | 236 | 1.0% | View All 84 Rows |
Sex and Age in North Potomac
Sex and Age in North Potomac
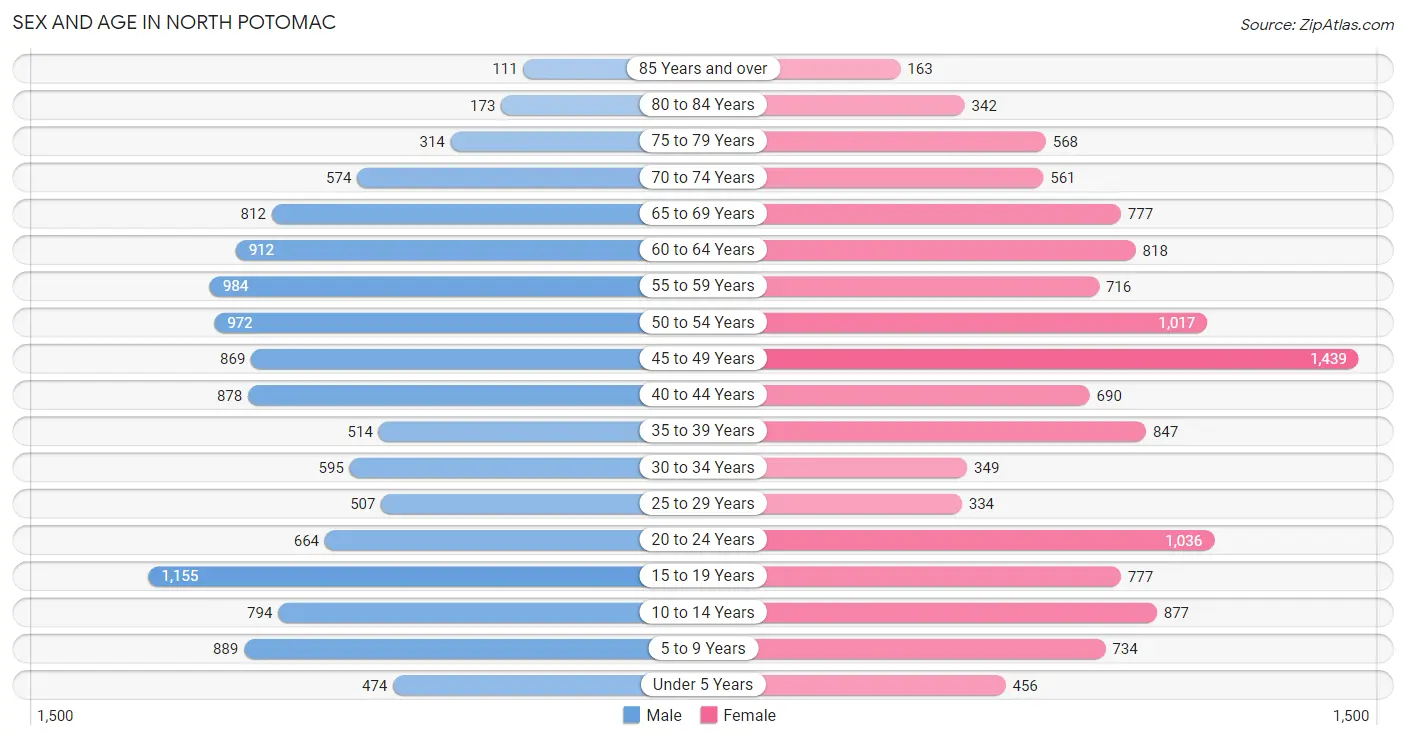
The most populous age groups in North Potomac are 15 to 19 Years (1,155 | 9.5%) for men and 45 to 49 Years (1,439 | 11.5%) for women.
| Age Bracket | Male | Female |
| Under 5 Years | 474 (3.9%) | 456 (3.6%) |
| 5 to 9 Years | 889 (7.3%) | 734 (5.9%) |
| 10 to 14 Years | 794 (6.5%) | 877 (7.0%) |
| 15 to 19 Years | 1,155 (9.5%) | 777 (6.2%) |
| 20 to 24 Years | 664 (5.4%) | 1,036 (8.3%) |
| 25 to 29 Years | 507 (4.2%) | 334 (2.7%) |
| 30 to 34 Years | 595 (4.9%) | 349 (2.8%) |
| 35 to 39 Years | 514 (4.2%) | 847 (6.8%) |
| 40 to 44 Years | 878 (7.2%) | 690 (5.5%) |
| 45 to 49 Years | 869 (7.1%) | 1,439 (11.5%) |
| 50 to 54 Years | 972 (8.0%) | 1,017 (8.1%) |
| 55 to 59 Years | 984 (8.1%) | 716 (5.7%) |
| 60 to 64 Years | 912 (7.5%) | 818 (6.5%) |
| 65 to 69 Years | 812 (6.7%) | 777 (6.2%) |
| 70 to 74 Years | 574 (4.7%) | 561 (4.5%) |
| 75 to 79 Years | 314 (2.6%) | 568 (4.5%) |
| 80 to 84 Years | 173 (1.4%) | 342 (2.7%) |
| 85 Years and over | 111 (0.9%) | 163 (1.3%) |
| Total | 12,191 (100.0%) | 12,501 (100.0%) |
Families and Households in North Potomac
Median Family Size in North Potomac
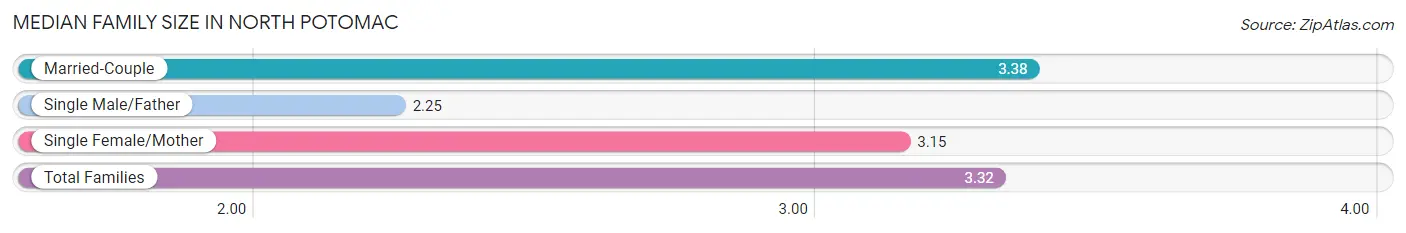
The median family size in North Potomac is 3.32 persons per family, with married-couple families (5,952 | 87.8%) accounting for the largest median family size of 3.38 persons per family. On the other hand, single male/father families (255 | 3.8%) represent the smallest median family size with 2.25 persons per family.
| Family Type | # Families | Family Size |
| Married-Couple | 5,952 (87.8%) | 3.38 |
| Single Male/Father | 255 (3.8%) | 2.25 |
| Single Female/Mother | 569 (8.4%) | 3.15 |
| Total Families | 6,776 (100.0%) | 3.32 |
Median Household Size in North Potomac
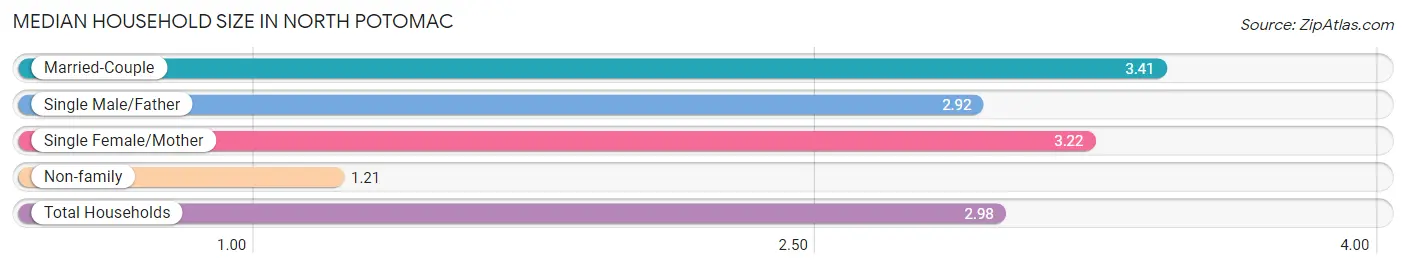
The median household size in North Potomac is 2.98 persons per household, with married-couple households (5,952 | 72.0%) accounting for the largest median household size of 3.41 persons per household. non-family households (1,496 | 18.1%) represent the smallest median household size with 1.21 persons per household.
| Household Type | # Households | Household Size |
| Married-Couple | 5,952 (72.0%) | 3.41 |
| Single Male/Father | 255 (3.1%) | 2.92 |
| Single Female/Mother | 569 (6.9%) | 3.22 |
| Non-family | 1,496 (18.1%) | 1.21 |
| Total Households | 8,272 (100.0%) | 2.98 |
Household Size by Marriage Status in North Potomac
Out of a total of 8,272 households in North Potomac, 6,776 (81.9%) are family households, while 1,496 (18.1%) are nonfamily households. The most numerous type of family households are 2-person households, comprising 2,345, and the most common type of nonfamily households are 1-person households, comprising 1,235.
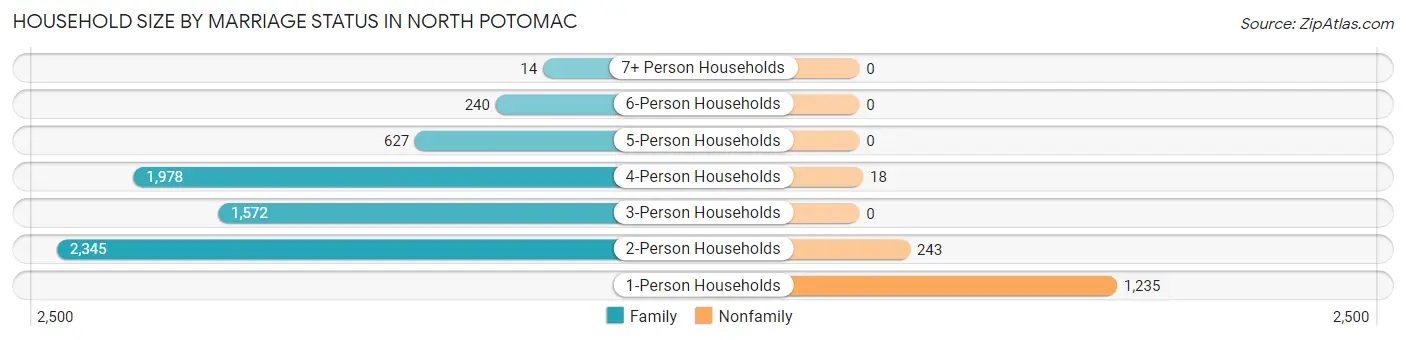
| Household Size | Family Households | Nonfamily Households |
| 1-Person Households | - | 1,235 (14.9%) |
| 2-Person Households | 2,345 (28.3%) | 243 (2.9%) |
| 3-Person Households | 1,572 (19.0%) | 0 (0.0%) |
| 4-Person Households | 1,978 (23.9%) | 18 (0.2%) |
| 5-Person Households | 627 (7.6%) | 0 (0.0%) |
| 6-Person Households | 240 (2.9%) | 0 (0.0%) |
| 7+ Person Households | 14 (0.2%) | 0 (0.0%) |
| Total | 6,776 (81.9%) | 1,496 (18.1%) |
Female Fertility in North Potomac
Fertility by Age in North Potomac
Average fertility rate in North Potomac is 33.0 births per 1,000 women. Women in the age bracket of 20 to 34 years have the highest fertility rate with 67.0 births per 1,000 women. Women in the age bracket of 20 to 34 years acount for 61.5% of all women with births.
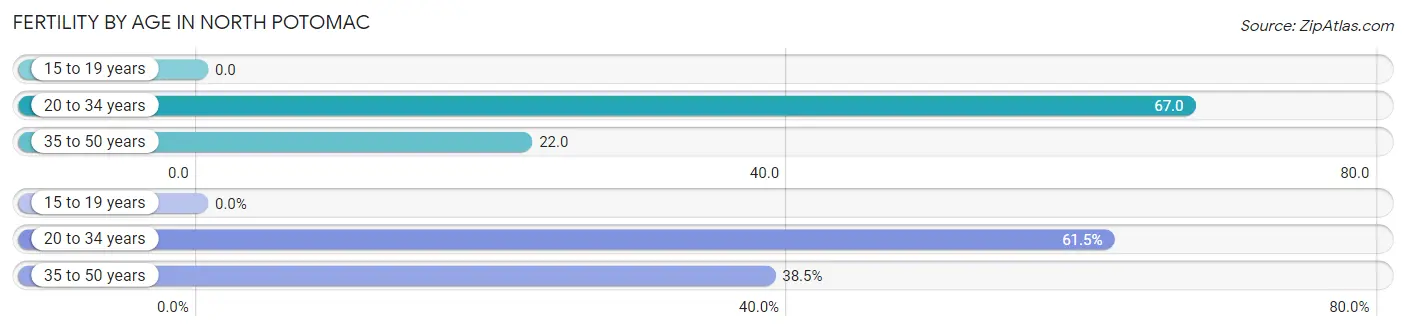
| Age Bracket | Women with Births | Births / 1,000 Women |
| 15 to 19 years | 0 (0.0%) | 0.0 |
| 20 to 34 years | 115 (61.5%) | 67.0 |
| 35 to 50 years | 72 (38.5%) | 22.0 |
| Total | 187 (100.0%) | 33.0 |
Fertility by Age by Marriage Status in North Potomac
44.4% of women with births (187) in North Potomac are married. The highest percentage of unmarried women with births falls into 20 to 34 years age bracket with 79.1% of them unmarried at the time of birth, while the lowest percentage of unmarried women with births belong to 35 to 50 years age bracket with 18.1% of them unmarried.
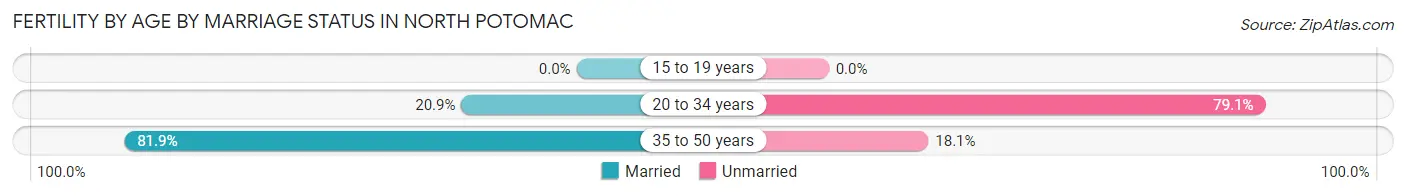
| Age Bracket | Married | Unmarried |
| 15 to 19 years | 0 (0.0%) | 0 (0.0%) |
| 20 to 34 years | 24 (20.9%) | 91 (79.1%) |
| 35 to 50 years | 59 (81.9%) | 13 (18.1%) |
| Total | 83 (44.4%) | 104 (55.6%) |
Fertility by Education in North Potomac
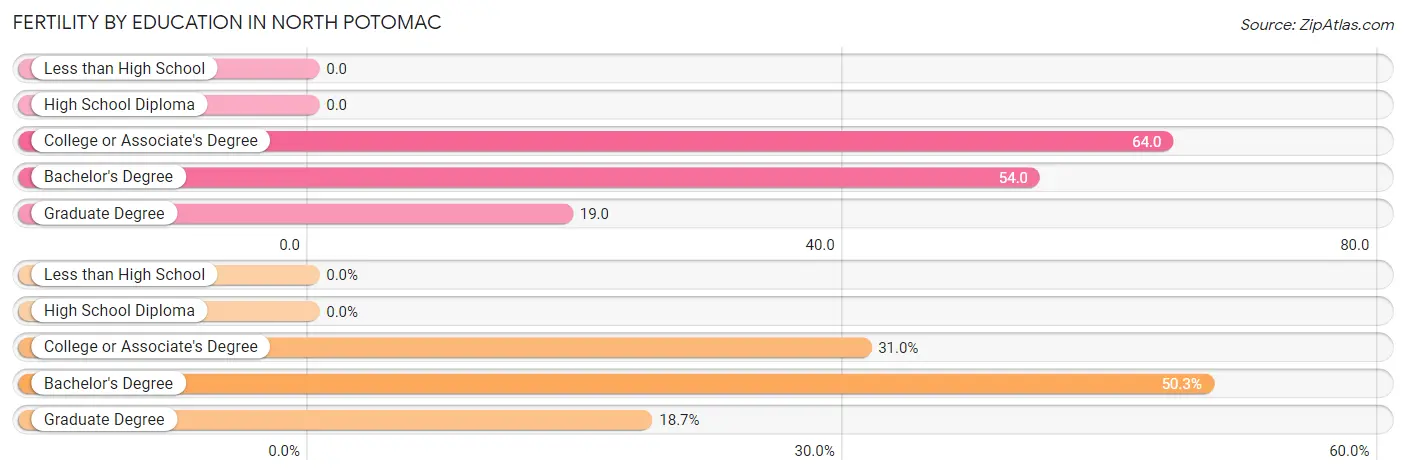
| Educational Attainment | Women with Births | Births / 1,000 Women |
| Less than High School | 0 (0.0%) | 0.0 |
| High School Diploma | 0 (0.0%) | 0.0 |
| College or Associate's Degree | 58 (31.0%) | 64.0 |
| Bachelor's Degree | 94 (50.3%) | 54.0 |
| Graduate Degree | 35 (18.7%) | 19.0 |
| Total | 187 (100.0%) | 33.0 |
Fertility by Education by Marriage Status in North Potomac
55.6% of women with births in North Potomac are unmarried. Women with the educational attainment of graduate degree are most likely to be married with 80.0% of them married at childbirth, while women with the educational attainment of college or associate's degree are least likely to be married with 100.0% of them unmarried at childbirth.
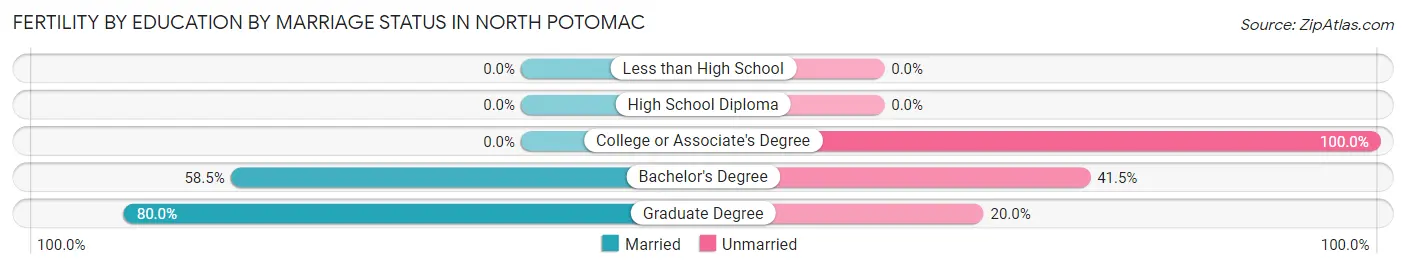
| Educational Attainment | Married | Unmarried |
| Less than High School | 0 (0.0%) | 0 (0.0%) |
| High School Diploma | 0 (0.0%) | 0 (0.0%) |
| College or Associate's Degree | 0 (0.0%) | 58 (100.0%) |
| Bachelor's Degree | 55 (58.5%) | 39 (41.5%) |
| Graduate Degree | 28 (80.0%) | 7 (20.0%) |
| Total | 83 (44.4%) | 104 (55.6%) |
Employment Characteristics in North Potomac
Employment by Class of Employer in North Potomac
Among the 12,553 employed individuals in North Potomac, private company employees (6,763 | 53.9%), federal government employees (2,476 | 19.7%), and not-for-profit organizations (1,203 | 9.6%) make up the most common classes of employment.
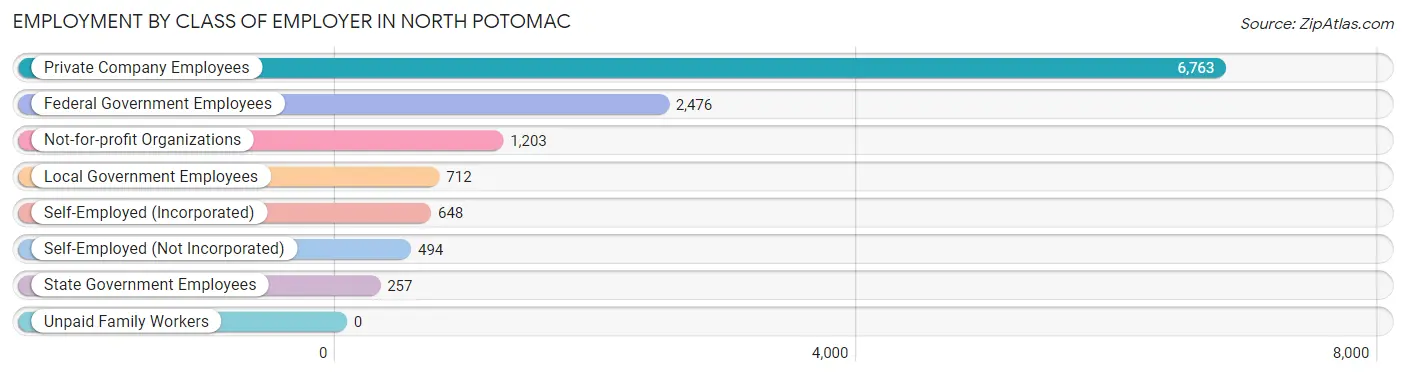
| Employer Class | # Employees | % Employees |
| Private Company Employees | 6,763 | 53.9% |
| Self-Employed (Incorporated) | 648 | 5.2% |
| Self-Employed (Not Incorporated) | 494 | 3.9% |
| Not-for-profit Organizations | 1,203 | 9.6% |
| Local Government Employees | 712 | 5.7% |
| State Government Employees | 257 | 2.1% |
| Federal Government Employees | 2,476 | 19.7% |
| Unpaid Family Workers | 0 | 0.0% |
| Total | 12,553 | 100.0% |
Employment Status by Age in North Potomac
According to the labor force statistics for North Potomac, out of the total population over 16 years of age (20,004), 66.4% or 13,283 individuals are in the labor force, with 4.8% or 638 of them unemployed. The age group with the highest labor force participation rate is 45 to 54 years, with 86.6% or 3,721 individuals in the labor force. Within the labor force, the 20 to 24 years age range has the highest percentage of unemployed individuals, with 19.2% or 194 of them being unemployed.
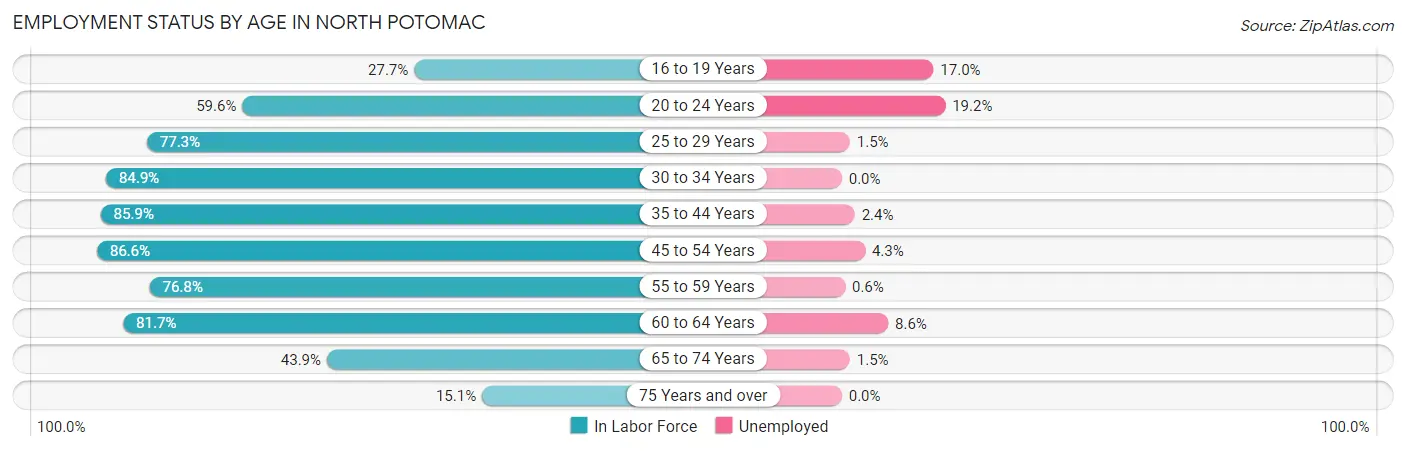
| Age Bracket | In Labor Force | Unemployed |
| 16 to 19 Years | 407 (27.7%) | 69 (17.0%) |
| 20 to 24 Years | 1,013 (59.6%) | 194 (19.2%) |
| 25 to 29 Years | 650 (77.3%) | 10 (1.5%) |
| 30 to 34 Years | 801 (84.9%) | 0 (0.0%) |
| 35 to 44 Years | 2,516 (85.9%) | 60 (2.4%) |
| 45 to 54 Years | 3,721 (86.6%) | 160 (4.3%) |
| 55 to 59 Years | 1,306 (76.8%) | 8 (0.6%) |
| 60 to 64 Years | 1,413 (81.7%) | 122 (8.6%) |
| 65 to 74 Years | 1,196 (43.9%) | 18 (1.5%) |
| 75 Years and over | 252 (15.1%) | 0 (0.0%) |
| Total | 13,283 (66.4%) | 638 (4.8%) |
Employment Status by Educational Attainment in North Potomac
According to labor force statistics for North Potomac, 83.7% of individuals (10,413) out of the total population between 25 and 64 years of age (12,441) are in the labor force, with 3.5% or 364 of them being unemployed. The group with the highest labor force participation rate are those with the educational attainment of bachelor's degree or higher, with 88.9% or 8,743 individuals in the labor force. Within the labor force, individuals with less than high school education have the highest percentage of unemployment, with 9.5% or 16 of them being unemployed.
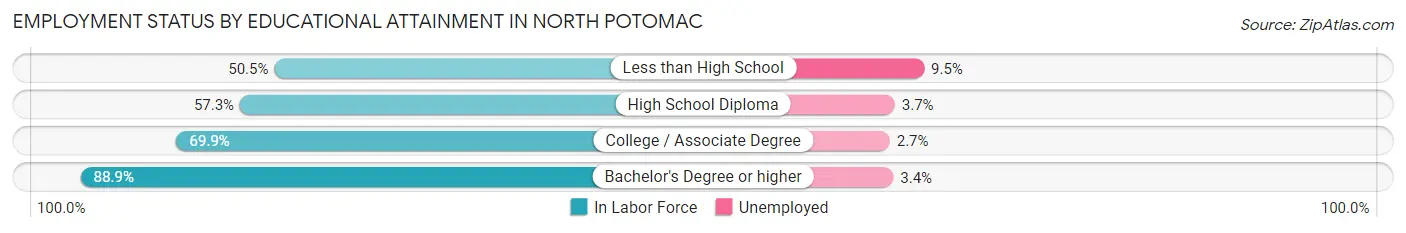
| Educational Attainment | In Labor Force | Unemployed |
| Less than High School | 168 (50.5%) | 32 (9.5%) |
| High School Diploma | 406 (57.3%) | 26 (3.7%) |
| College / Associate Degree | 1,093 (69.9%) | 42 (2.7%) |
| Bachelor's Degree or higher | 8,743 (88.9%) | 334 (3.4%) |
| Total | 10,413 (83.7%) | 435 (3.5%) |
Employment Occupations by Sex in North Potomac
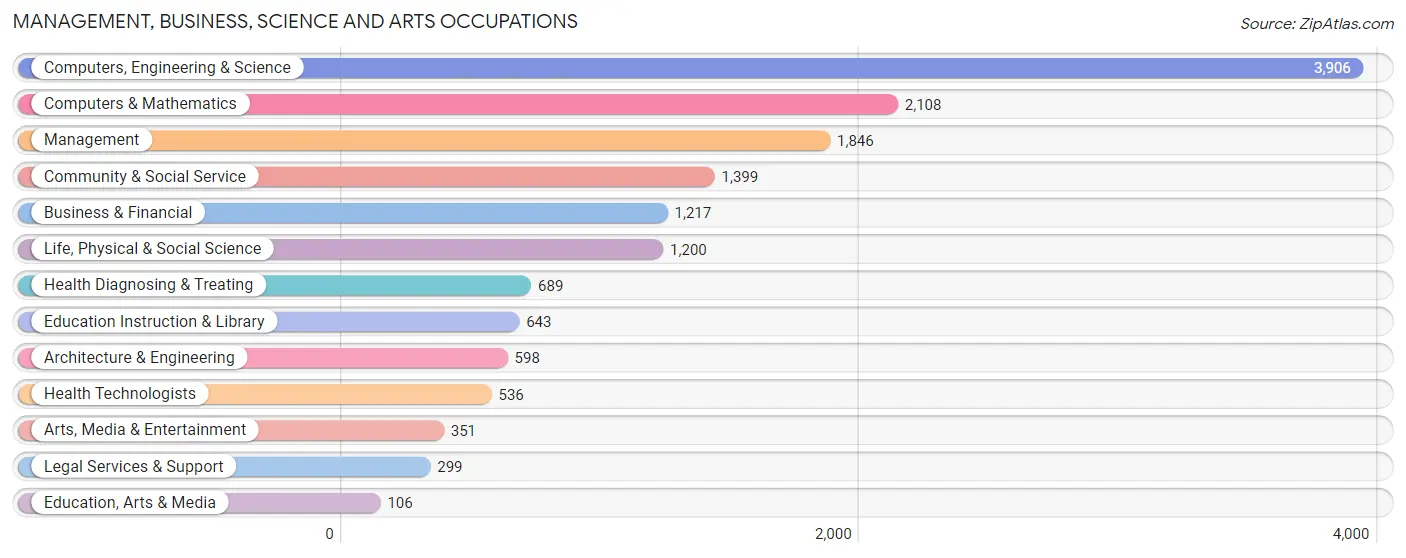
Management, Business, Science and Arts Occupations
The most common Management, Business, Science and Arts occupations in North Potomac are Computers, Engineering & Science (3,906 | 31.0%), Computers & Mathematics (2,108 | 16.7%), Management (1,846 | 14.7%), Community & Social Service (1,399 | 11.1%), and Business & Financial (1,217 | 9.7%).
Management, Business, Science and Arts Occupations by Sex
Within the Management, Business, Science and Arts occupations in North Potomac, the most male-oriented occupations are Legal Services & Support (86.3%), Architecture & Engineering (80.3%), and Computers, Engineering & Science (70.4%), while the most female-oriented occupations are Education Instruction & Library (77.8%), Arts, Media & Entertainment (68.4%), and Education, Arts & Media (67.0%).
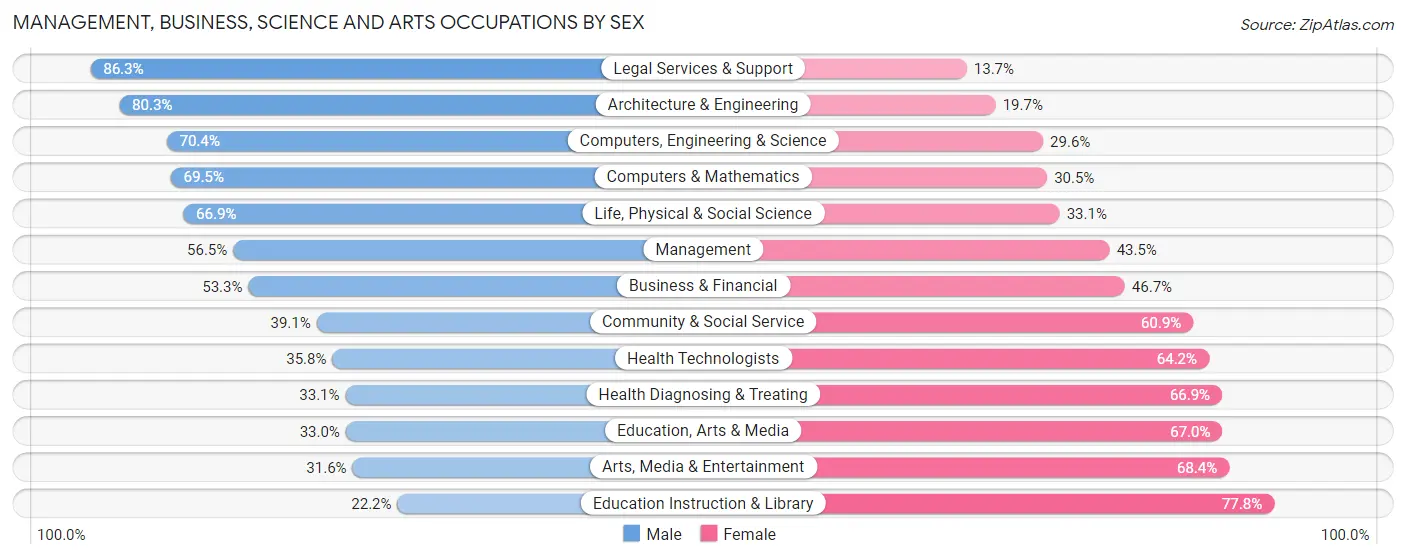
| Occupation | Male | Female |
| Management | 1,043 (56.5%) | 803 (43.5%) |
| Business & Financial | 649 (53.3%) | 568 (46.7%) |
| Computers, Engineering & Science | 2,749 (70.4%) | 1,157 (29.6%) |
| Computers & Mathematics | 1,466 (69.5%) | 642 (30.5%) |
| Architecture & Engineering | 480 (80.3%) | 118 (19.7%) |
| Life, Physical & Social Science | 803 (66.9%) | 397 (33.1%) |
| Community & Social Service | 547 (39.1%) | 852 (60.9%) |
| Education, Arts & Media | 35 (33.0%) | 71 (67.0%) |
| Legal Services & Support | 258 (86.3%) | 41 (13.7%) |
| Education Instruction & Library | 143 (22.2%) | 500 (77.8%) |
| Arts, Media & Entertainment | 111 (31.6%) | 240 (68.4%) |
| Health Diagnosing & Treating | 228 (33.1%) | 461 (66.9%) |
| Health Technologists | 192 (35.8%) | 344 (64.2%) |
| Total (Category) | 5,216 (57.6%) | 3,841 (42.4%) |
| Total (Overall) | 7,049 (56.0%) | 5,544 (44.0%) |
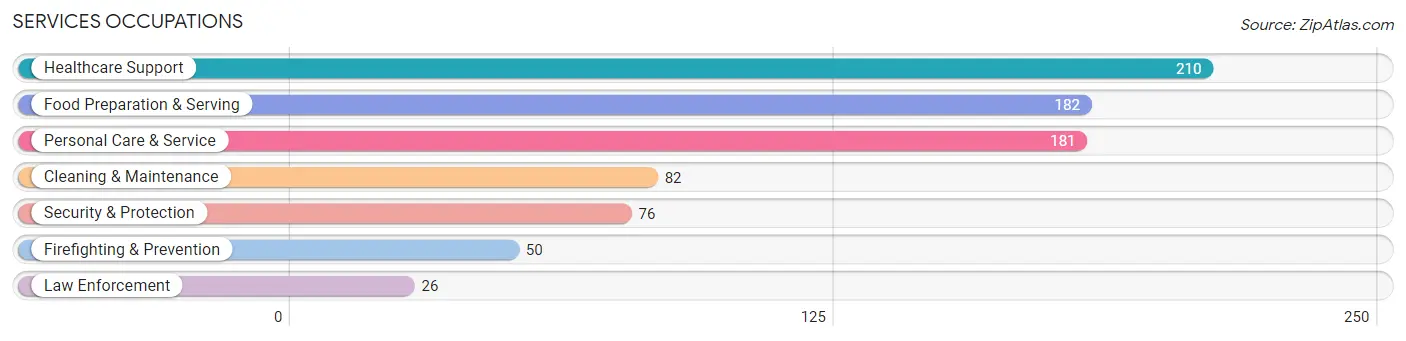
Services Occupations
The most common Services occupations in North Potomac are Healthcare Support (210 | 1.7%), Food Preparation & Serving (182 | 1.5%), Personal Care & Service (181 | 1.4%), Cleaning & Maintenance (82 | 0.6%), and Security & Protection (76 | 0.6%).
Services Occupations by Sex
Within the Services occupations in North Potomac, the most male-oriented occupations are Law Enforcement (73.1%), Food Preparation & Serving (65.4%), and Cleaning & Maintenance (40.2%), while the most female-oriented occupations are Healthcare Support (96.7%), Firefighting & Prevention (82.0%), and Personal Care & Service (74.0%).
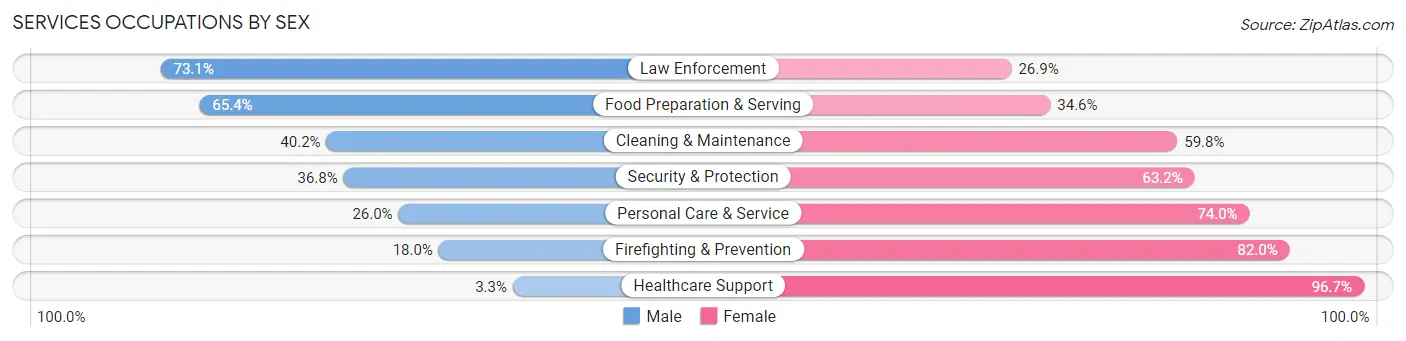
| Occupation | Male | Female |
| Healthcare Support | 7 (3.3%) | 203 (96.7%) |
| Security & Protection | 28 (36.8%) | 48 (63.2%) |
| Firefighting & Prevention | 9 (18.0%) | 41 (82.0%) |
| Law Enforcement | 19 (73.1%) | 7 (26.9%) |
| Food Preparation & Serving | 119 (65.4%) | 63 (34.6%) |
| Cleaning & Maintenance | 33 (40.2%) | 49 (59.8%) |
| Personal Care & Service | 47 (26.0%) | 134 (74.0%) |
| Total (Category) | 234 (32.0%) | 497 (68.0%) |
| Total (Overall) | 7,049 (56.0%) | 5,544 (44.0%) |
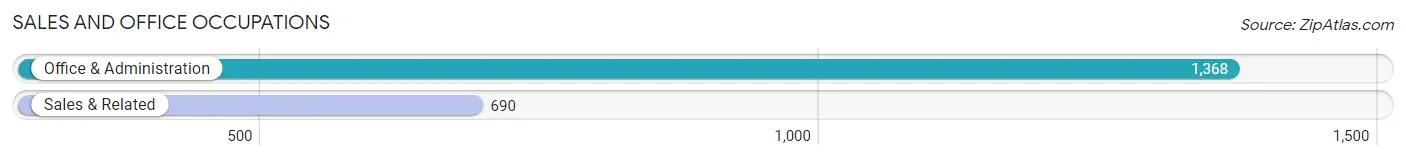
Sales and Office Occupations
The most common Sales and Office occupations in North Potomac are Office & Administration (1,368 | 10.9%), and Sales & Related (690 | 5.5%).
Sales and Office Occupations by Sex
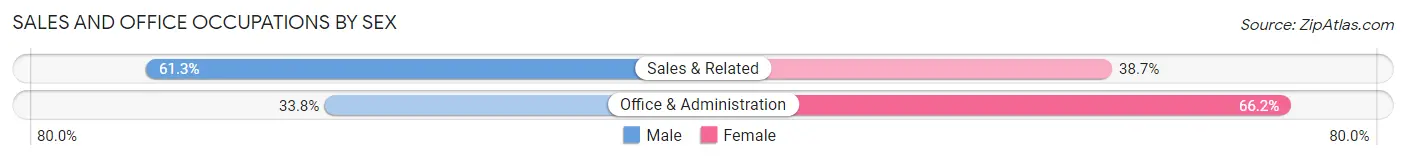
| Occupation | Male | Female |
| Sales & Related | 423 (61.3%) | 267 (38.7%) |
| Office & Administration | 462 (33.8%) | 906 (66.2%) |
| Total (Category) | 885 (43.0%) | 1,173 (57.0%) |
| Total (Overall) | 7,049 (56.0%) | 5,544 (44.0%) |
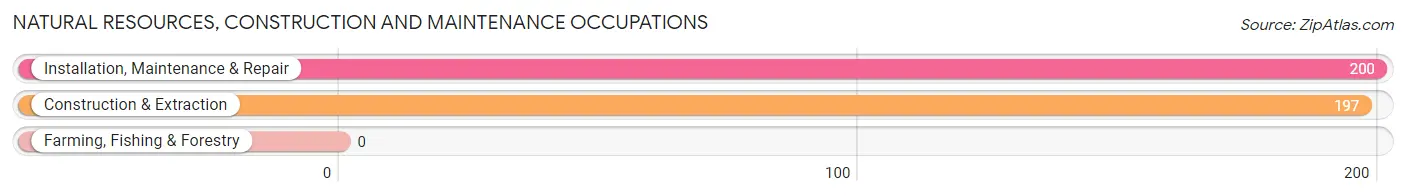
Natural Resources, Construction and Maintenance Occupations
The most common Natural Resources, Construction and Maintenance occupations in North Potomac are Installation, Maintenance & Repair (200 | 1.6%), and Construction & Extraction (197 | 1.6%).
Natural Resources, Construction and Maintenance Occupations by Sex
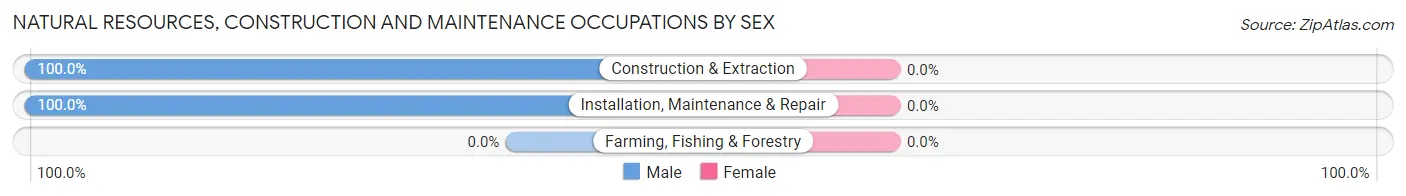
| Occupation | Male | Female |
| Farming, Fishing & Forestry | 0 (0.0%) | 0 (0.0%) |
| Construction & Extraction | 197 (100.0%) | 0 (0.0%) |
| Installation, Maintenance & Repair | 200 (100.0%) | 0 (0.0%) |
| Total (Category) | 397 (100.0%) | 0 (0.0%) |
| Total (Overall) | 7,049 (56.0%) | 5,544 (44.0%) |
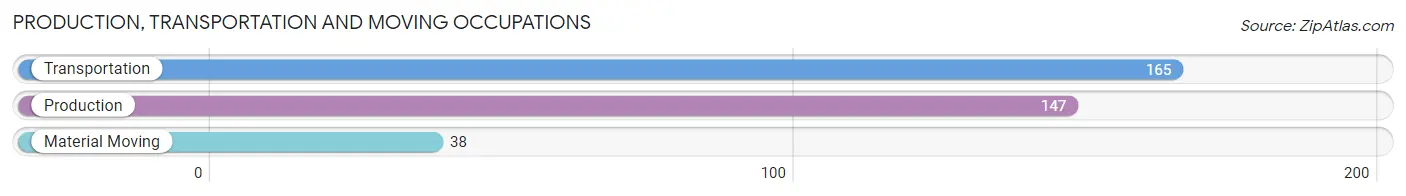
Production, Transportation and Moving Occupations
The most common Production, Transportation and Moving occupations in North Potomac are Transportation (165 | 1.3%), Production (147 | 1.2%), and Material Moving (38 | 0.3%).
Production, Transportation and Moving Occupations by Sex
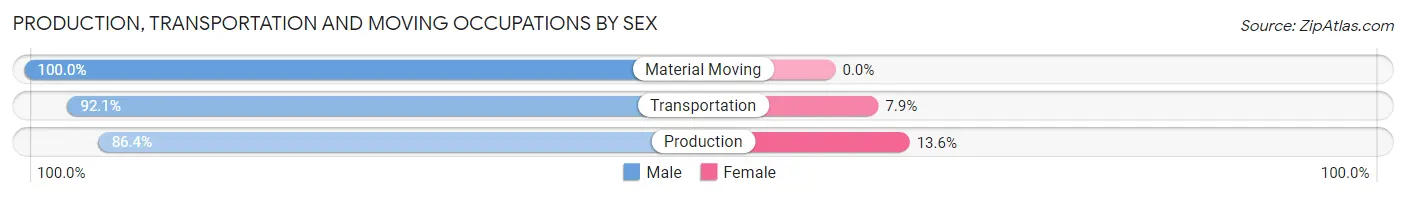
| Occupation | Male | Female |
| Production | 127 (86.4%) | 20 (13.6%) |
| Transportation | 152 (92.1%) | 13 (7.9%) |
| Material Moving | 38 (100.0%) | 0 (0.0%) |
| Total (Category) | 317 (90.6%) | 33 (9.4%) |
| Total (Overall) | 7,049 (56.0%) | 5,544 (44.0%) |
Employment Industries by Sex in North Potomac
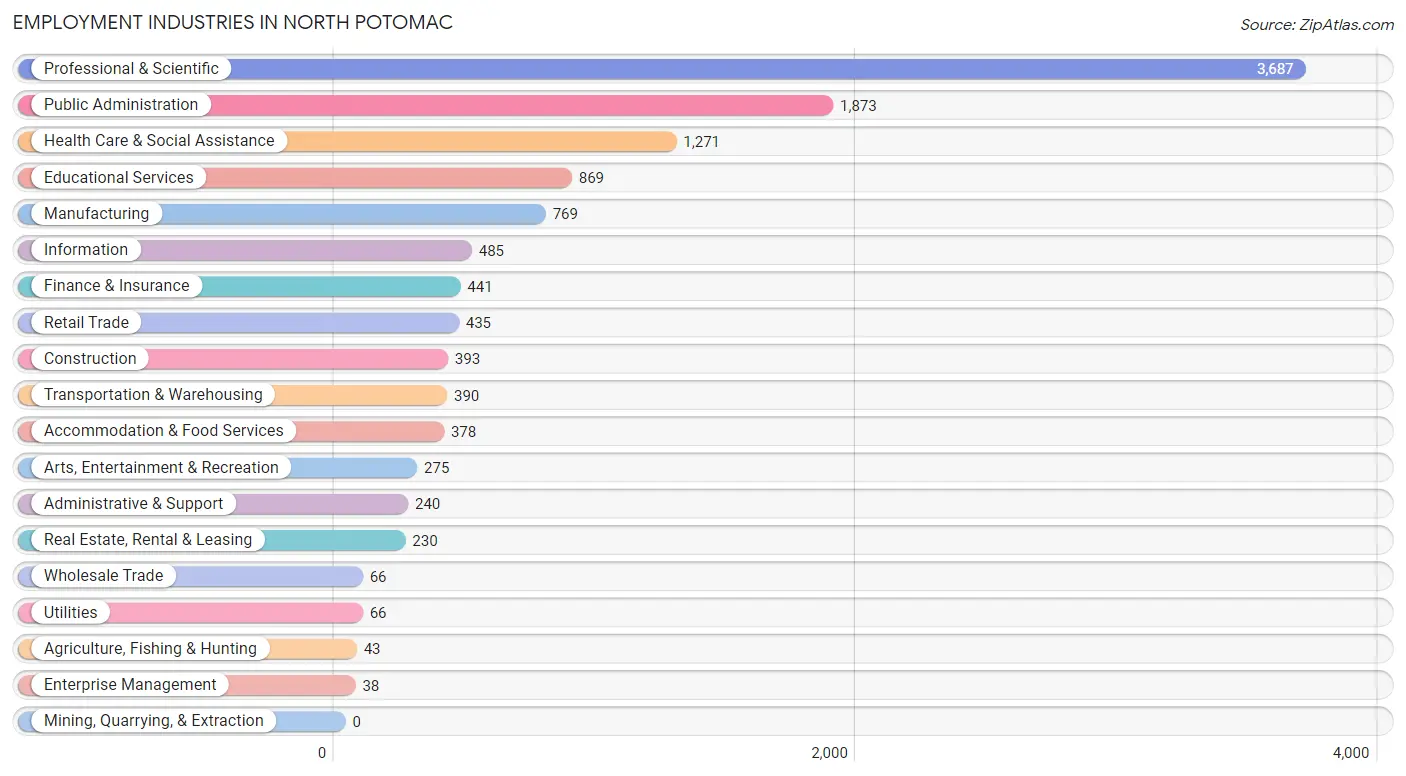
Employment Industries in North Potomac
The major employment industries in North Potomac include Professional & Scientific (3,687 | 29.3%), Public Administration (1,873 | 14.9%), Health Care & Social Assistance (1,271 | 10.1%), Educational Services (869 | 6.9%), and Manufacturing (769 | 6.1%).
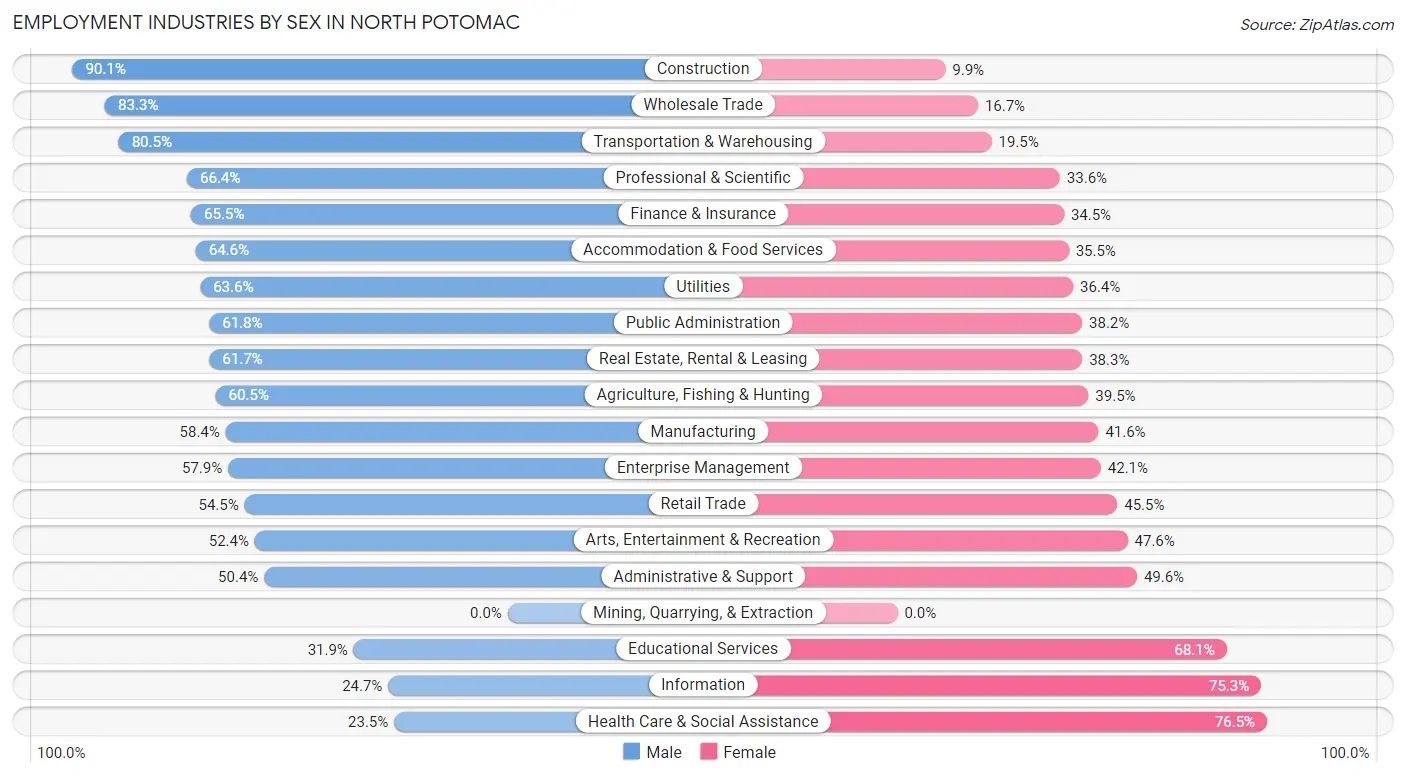
Employment Industries by Sex in North Potomac
The North Potomac industries that see more men than women are Construction (90.1%), Wholesale Trade (83.3%), and Transportation & Warehousing (80.5%), whereas the industries that tend to have a higher number of women are Health Care & Social Assistance (76.5%), Information (75.3%), and Educational Services (68.1%).
| Industry | Male | Female |
| Agriculture, Fishing & Hunting | 26 (60.5%) | 17 (39.5%) |
| Mining, Quarrying, & Extraction | 0 (0.0%) | 0 (0.0%) |
| Construction | 354 (90.1%) | 39 (9.9%) |
| Manufacturing | 449 (58.4%) | 320 (41.6%) |
| Wholesale Trade | 55 (83.3%) | 11 (16.7%) |
| Retail Trade | 237 (54.5%) | 198 (45.5%) |
| Transportation & Warehousing | 314 (80.5%) | 76 (19.5%) |
| Utilities | 42 (63.6%) | 24 (36.4%) |
| Information | 120 (24.7%) | 365 (75.3%) |
| Finance & Insurance | 289 (65.5%) | 152 (34.5%) |
| Real Estate, Rental & Leasing | 142 (61.7%) | 88 (38.3%) |
| Professional & Scientific | 2,447 (66.4%) | 1,240 (33.6%) |
| Enterprise Management | 22 (57.9%) | 16 (42.1%) |
| Administrative & Support | 121 (50.4%) | 119 (49.6%) |
| Educational Services | 277 (31.9%) | 592 (68.1%) |
| Health Care & Social Assistance | 299 (23.5%) | 972 (76.5%) |
| Arts, Entertainment & Recreation | 144 (52.4%) | 131 (47.6%) |
| Accommodation & Food Services | 244 (64.5%) | 134 (35.4%) |
| Public Administration | 1,157 (61.8%) | 716 (38.2%) |
| Total | 7,049 (56.0%) | 5,544 (44.0%) |
Education in North Potomac
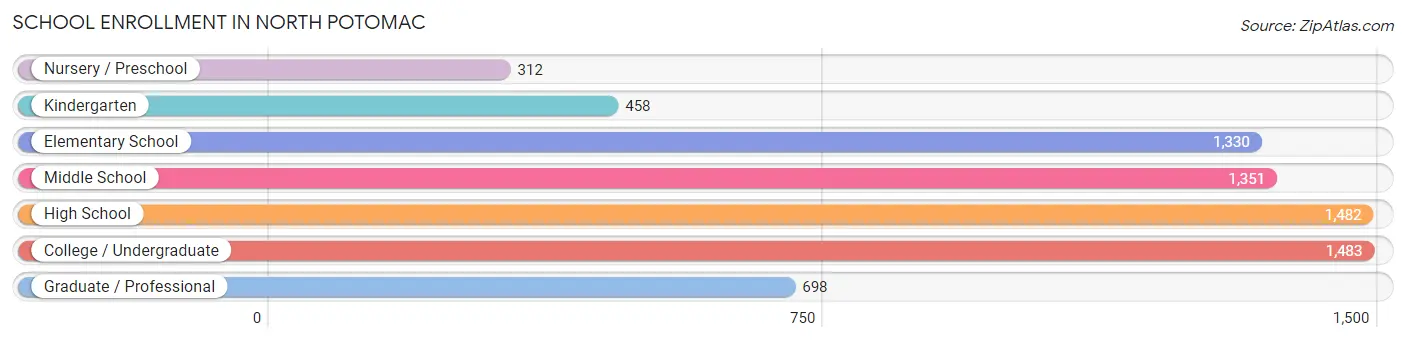
School Enrollment in North Potomac
The most common levels of schooling among the 7,114 students in North Potomac are college / undergraduate (1,483 | 20.8%), high school (1,482 | 20.8%), and middle school (1,351 | 19.0%).
| School Level | # Students | % Students |
| Nursery / Preschool | 312 | 4.4% |
| Kindergarten | 458 | 6.4% |
| Elementary School | 1,330 | 18.7% |
| Middle School | 1,351 | 19.0% |
| High School | 1,482 | 20.8% |
| College / Undergraduate | 1,483 | 20.8% |
| Graduate / Professional | 698 | 9.8% |
| Total | 7,114 | 100.0% |
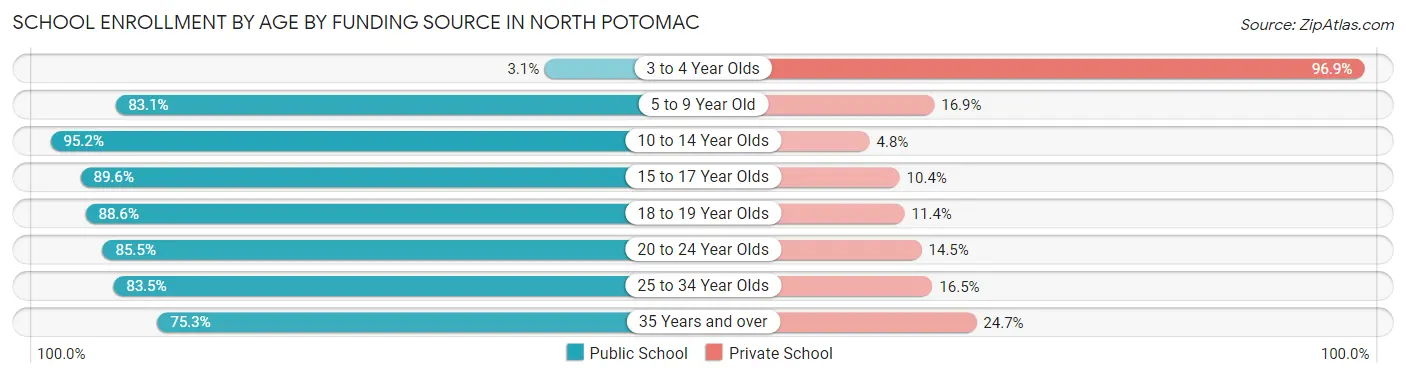
School Enrollment by Age by Funding Source in North Potomac
Out of a total of 7,114 students who are enrolled in schools in North Potomac, 1,174 (16.5%) attend a private institution, while the remaining 5,940 (83.5%) are enrolled in public schools. The age group of 3 to 4 year olds has the highest likelihood of being enrolled in private schools, with 317 (96.9% in the age bracket) enrolled. Conversely, the age group of 10 to 14 year olds has the lowest likelihood of being enrolled in a private school, with 1,576 (95.2% in the age bracket) attending a public institution.
| Age Bracket | Public School | Private School |
| 3 to 4 Year Olds | 10 (3.1%) | 317 (96.9%) |
| 5 to 9 Year Old | 1,315 (83.1%) | 267 (16.9%) |
| 10 to 14 Year Olds | 1,576 (95.2%) | 80 (4.8%) |
| 15 to 17 Year Olds | 1,039 (89.6%) | 121 (10.4%) |
| 18 to 19 Year Olds | 515 (88.6%) | 66 (11.4%) |
| 20 to 24 Year Olds | 777 (85.5%) | 132 (14.5%) |
| 25 to 34 Year Olds | 308 (83.5%) | 61 (16.5%) |
| 35 Years and over | 399 (75.3%) | 131 (24.7%) |
| Total | 5,940 (83.5%) | 1,174 (16.5%) |
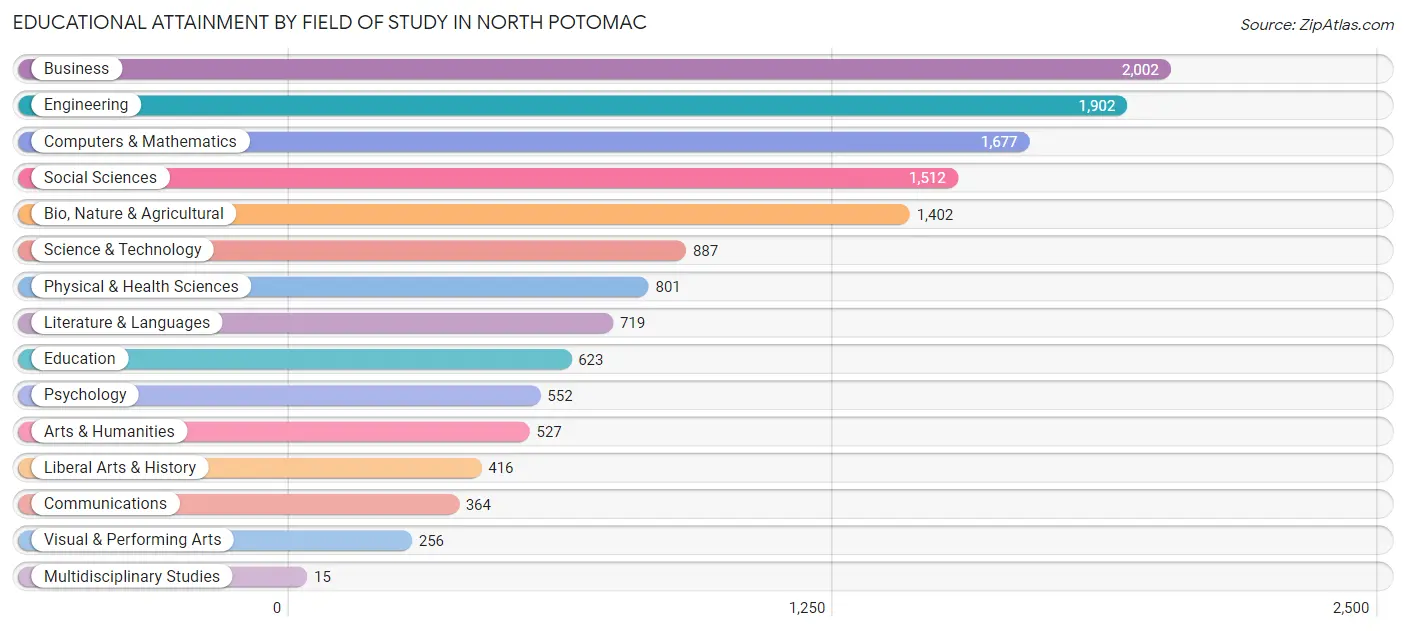
Educational Attainment by Field of Study in North Potomac
Business (2,002 | 14.7%), engineering (1,902 | 13.9%), computers & mathematics (1,677 | 12.3%), social sciences (1,512 | 11.1%), and bio, nature & agricultural (1,402 | 10.3%) are the most common fields of study among 13,655 individuals in North Potomac who have obtained a bachelor's degree or higher.
| Field of Study | # Graduates | % Graduates |
| Computers & Mathematics | 1,677 | 12.3% |
| Bio, Nature & Agricultural | 1,402 | 10.3% |
| Physical & Health Sciences | 801 | 5.9% |
| Psychology | 552 | 4.0% |
| Social Sciences | 1,512 | 11.1% |
| Engineering | 1,902 | 13.9% |
| Multidisciplinary Studies | 15 | 0.1% |
| Science & Technology | 887 | 6.5% |
| Business | 2,002 | 14.7% |
| Education | 623 | 4.6% |
| Literature & Languages | 719 | 5.3% |
| Liberal Arts & History | 416 | 3.0% |
| Visual & Performing Arts | 256 | 1.9% |
| Communications | 364 | 2.7% |
| Arts & Humanities | 527 | 3.9% |
| Total | 13,655 | 100.0% |
Transportation & Commute in North Potomac
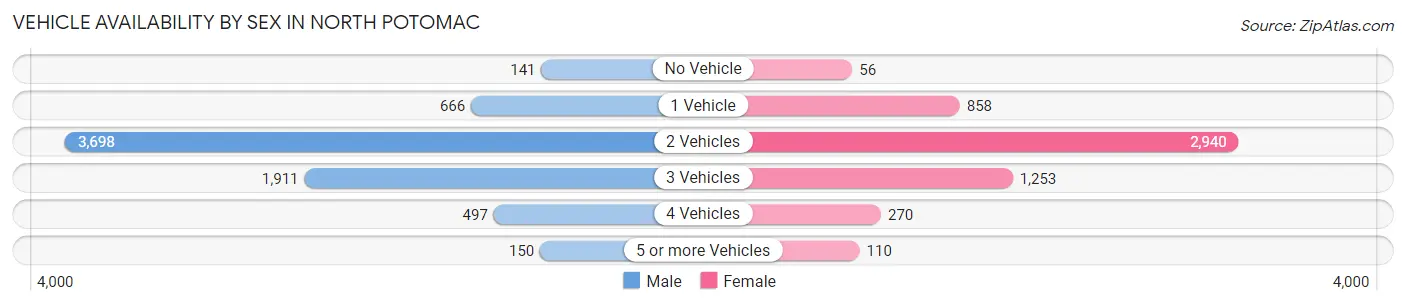
Vehicle Availability by Sex in North Potomac
The most prevalent vehicle ownership categories in North Potomac are males with 2 vehicles (3,698, accounting for 52.4%) and females with 2 vehicles (2,940, making up 67.4%).
| Vehicles Available | Male | Female |
| No Vehicle | 141 (2.0%) | 56 (1.0%) |
| 1 Vehicle | 666 (9.4%) | 858 (15.6%) |
| 2 Vehicles | 3,698 (52.4%) | 2,940 (53.6%) |
| 3 Vehicles | 1,911 (27.1%) | 1,253 (22.8%) |
| 4 Vehicles | 497 (7.0%) | 270 (4.9%) |
| 5 or more Vehicles | 150 (2.1%) | 110 (2.0%) |
| Total | 7,063 (100.0%) | 5,487 (100.0%) |
Commute Time in North Potomac
The most frequently occuring commute durations in North Potomac are 60 to 89 minutes (1,383 commuters, 16.3%), 30 to 34 minutes (1,324 commuters, 15.6%), and 15 to 19 minutes (1,304 commuters, 15.4%).
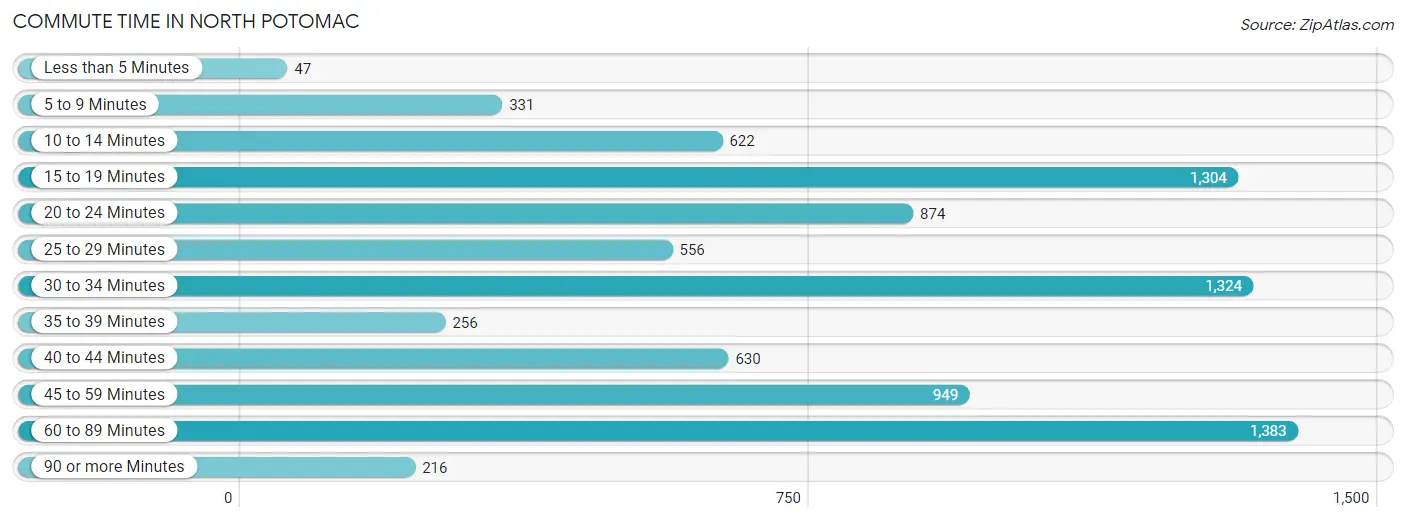
| Commute Time | # Commuters | % Commuters |
| Less than 5 Minutes | 47 | 0.5% |
| 5 to 9 Minutes | 331 | 3.9% |
| 10 to 14 Minutes | 622 | 7.3% |
| 15 to 19 Minutes | 1,304 | 15.4% |
| 20 to 24 Minutes | 874 | 10.3% |
| 25 to 29 Minutes | 556 | 6.6% |
| 30 to 34 Minutes | 1,324 | 15.6% |
| 35 to 39 Minutes | 256 | 3.0% |
| 40 to 44 Minutes | 630 | 7.4% |
| 45 to 59 Minutes | 949 | 11.2% |
| 60 to 89 Minutes | 1,383 | 16.3% |
| 90 or more Minutes | 216 | 2.5% |
Commute Time by Sex in North Potomac
The most common commute times in North Potomac are 60 to 89 minutes (896 commuters, 18.6%) for males and 15 to 19 minutes (593 commuters, 16.2%) for females.
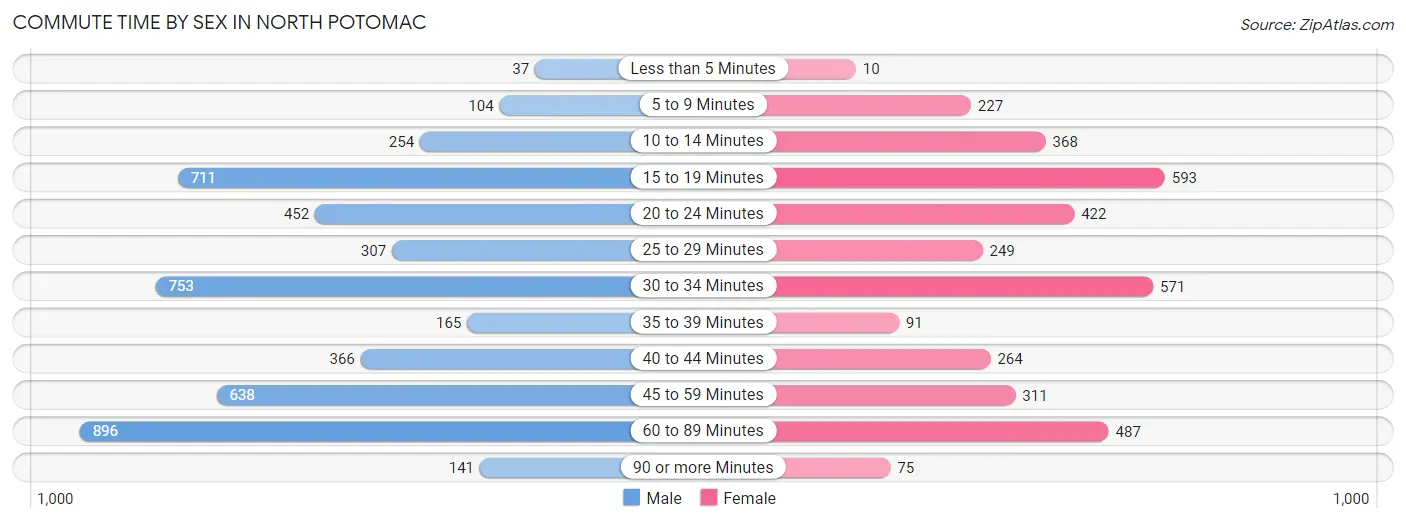
| Commute Time | Male | Female |
| Less than 5 Minutes | 37 (0.8%) | 10 (0.3%) |
| 5 to 9 Minutes | 104 (2.2%) | 227 (6.2%) |
| 10 to 14 Minutes | 254 (5.3%) | 368 (10.0%) |
| 15 to 19 Minutes | 711 (14.7%) | 593 (16.2%) |
| 20 to 24 Minutes | 452 (9.4%) | 422 (11.5%) |
| 25 to 29 Minutes | 307 (6.4%) | 249 (6.8%) |
| 30 to 34 Minutes | 753 (15.6%) | 571 (15.6%) |
| 35 to 39 Minutes | 165 (3.4%) | 91 (2.5%) |
| 40 to 44 Minutes | 366 (7.6%) | 264 (7.2%) |
| 45 to 59 Minutes | 638 (13.2%) | 311 (8.5%) |
| 60 to 89 Minutes | 896 (18.6%) | 487 (13.3%) |
| 90 or more Minutes | 141 (2.9%) | 75 (2.0%) |
Time of Departure to Work by Sex in North Potomac
The most frequent times of departure to work in North Potomac are 7:00 AM to 7:29 AM (815, 16.9%) for males and 8:00 AM to 8:29 AM (688, 18.8%) for females.
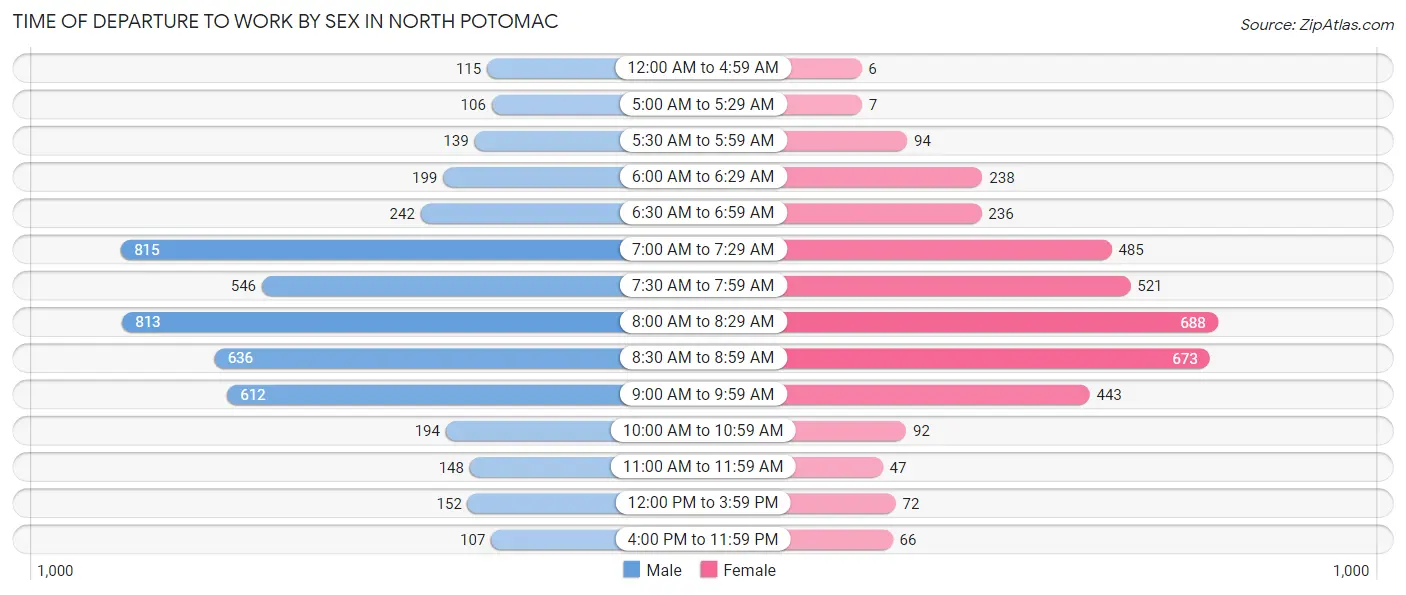
| Time of Departure | Male | Female |
| 12:00 AM to 4:59 AM | 115 (2.4%) | 6 (0.2%) |
| 5:00 AM to 5:29 AM | 106 (2.2%) | 7 (0.2%) |
| 5:30 AM to 5:59 AM | 139 (2.9%) | 94 (2.6%) |
| 6:00 AM to 6:29 AM | 199 (4.1%) | 238 (6.5%) |
| 6:30 AM to 6:59 AM | 242 (5.0%) | 236 (6.4%) |
| 7:00 AM to 7:29 AM | 815 (16.9%) | 485 (13.2%) |
| 7:30 AM to 7:59 AM | 546 (11.3%) | 521 (14.2%) |
| 8:00 AM to 8:29 AM | 813 (16.9%) | 688 (18.8%) |
| 8:30 AM to 8:59 AM | 636 (13.2%) | 673 (18.3%) |
| 9:00 AM to 9:59 AM | 612 (12.7%) | 443 (12.1%) |
| 10:00 AM to 10:59 AM | 194 (4.0%) | 92 (2.5%) |
| 11:00 AM to 11:59 AM | 148 (3.1%) | 47 (1.3%) |
| 12:00 PM to 3:59 PM | 152 (3.2%) | 72 (2.0%) |
| 4:00 PM to 11:59 PM | 107 (2.2%) | 66 (1.8%) |
| Total | 4,824 (100.0%) | 3,668 (100.0%) |
Housing Occupancy in North Potomac
Occupancy by Ownership in North Potomac
Of the total 8,272 dwellings in North Potomac, owner-occupied units account for 6,871 (83.1%), while renter-occupied units make up 1,401 (16.9%).
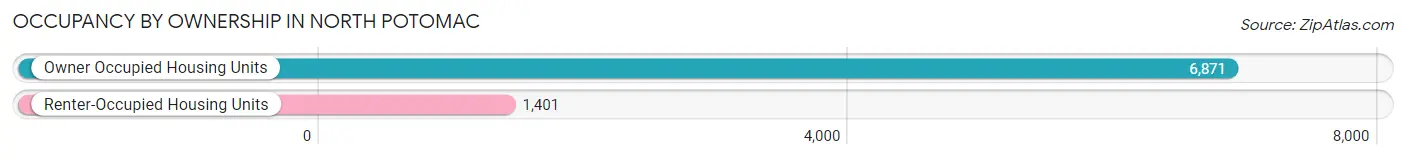
| Occupancy | # Housing Units | % Housing Units |
| Owner Occupied Housing Units | 6,871 | 83.1% |
| Renter-Occupied Housing Units | 1,401 | 16.9% |
| Total Occupied Housing Units | 8,272 | 100.0% |
Occupancy by Household Size in North Potomac
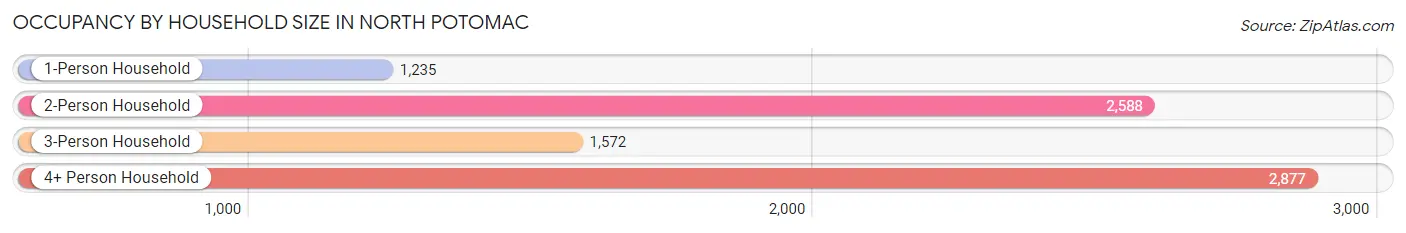
| Household Size | # Housing Units | % Housing Units |
| 1-Person Household | 1,235 | 14.9% |
| 2-Person Household | 2,588 | 31.3% |
| 3-Person Household | 1,572 | 19.0% |
| 4+ Person Household | 2,877 | 34.8% |
| Total Housing Units | 8,272 | 100.0% |
Occupancy by Ownership by Household Size in North Potomac
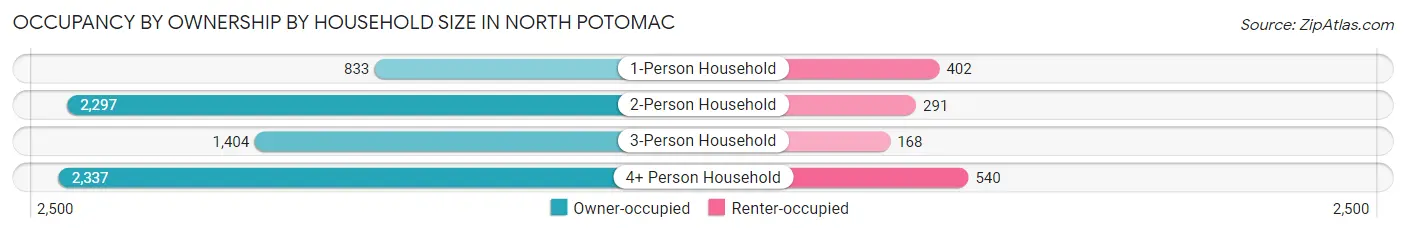
| Household Size | Owner-occupied | Renter-occupied |
| 1-Person Household | 833 (67.4%) | 402 (32.6%) |
| 2-Person Household | 2,297 (88.8%) | 291 (11.2%) |
| 3-Person Household | 1,404 (89.3%) | 168 (10.7%) |
| 4+ Person Household | 2,337 (81.2%) | 540 (18.8%) |
| Total Housing Units | 6,871 (83.1%) | 1,401 (16.9%) |
Occupancy by Educational Attainment in North Potomac
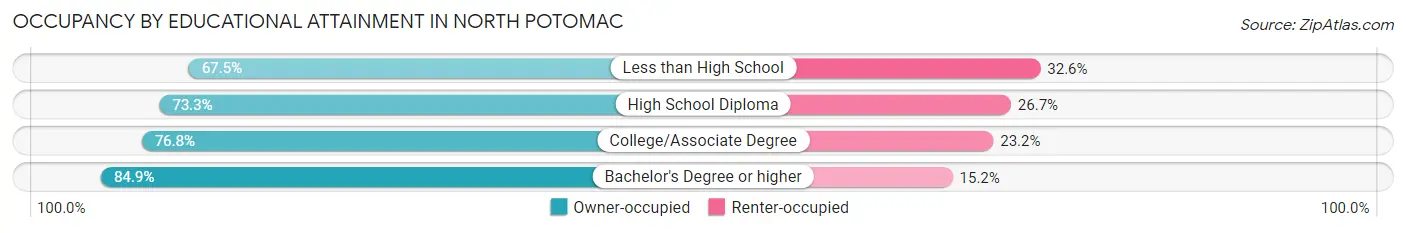
| Household Size | Owner-occupied | Renter-occupied |
| Less than High School | 143 (67.4%) | 69 (32.6%) |
| High School Diploma | 236 (73.3%) | 86 (26.7%) |
| College/Associate Degree | 701 (76.8%) | 212 (23.2%) |
| Bachelor's Degree or higher | 5,791 (84.9%) | 1,034 (15.1%) |
Occupancy by Age of Householder in North Potomac
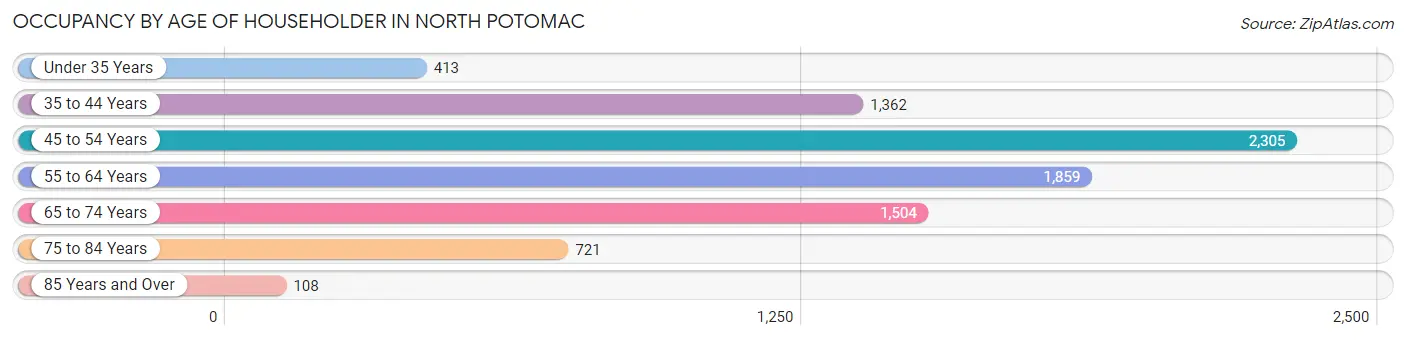
| Age Bracket | # Households | % Households |
| Under 35 Years | 413 | 5.0% |
| 35 to 44 Years | 1,362 | 16.5% |
| 45 to 54 Years | 2,305 | 27.9% |
| 55 to 64 Years | 1,859 | 22.5% |
| 65 to 74 Years | 1,504 | 18.2% |
| 75 to 84 Years | 721 | 8.7% |
| 85 Years and Over | 108 | 1.3% |
| Total | 8,272 | 100.0% |
Housing Finances in North Potomac
Median Income by Occupancy in North Potomac
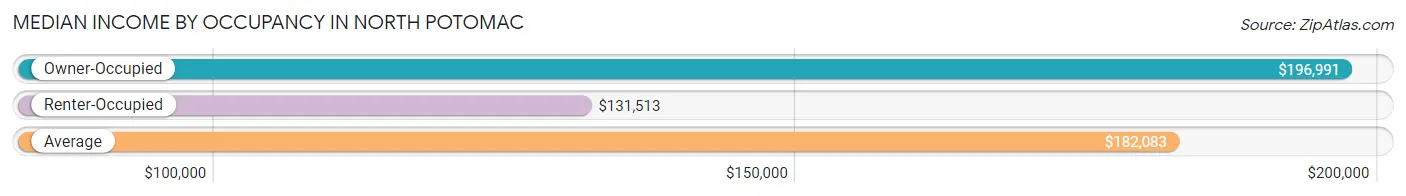
| Occupancy Type | # Households | Median Income |
| Owner-Occupied | 6,871 (83.1%) | $196,991 |
| Renter-Occupied | 1,401 (16.9%) | $131,513 |
| Average | 8,272 (100.0%) | $182,083 |
Occupancy by Householder Income Bracket in North Potomac
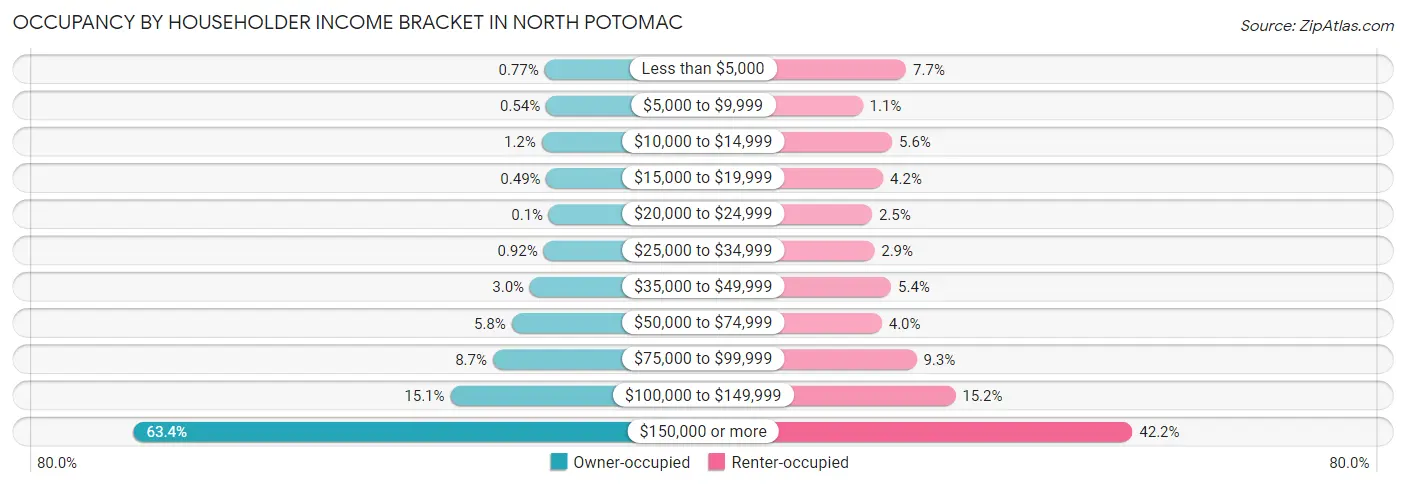
| Income Bracket | Owner-occupied | Renter-occupied |
| Less than $5,000 | 53 (0.8%) | 108 (7.7%) |
| $5,000 to $9,999 | 37 (0.5%) | 15 (1.1%) |
| $10,000 to $14,999 | 84 (1.2%) | 78 (5.6%) |
| $15,000 to $19,999 | 34 (0.5%) | 59 (4.2%) |
| $20,000 to $24,999 | 7 (0.1%) | 35 (2.5%) |
| $25,000 to $34,999 | 63 (0.9%) | 40 (2.9%) |
| $35,000 to $49,999 | 206 (3.0%) | 76 (5.4%) |
| $50,000 to $74,999 | 398 (5.8%) | 56 (4.0%) |
| $75,000 to $99,999 | 595 (8.7%) | 130 (9.3%) |
| $100,000 to $149,999 | 1,039 (15.1%) | 213 (15.2%) |
| $150,000 or more | 4,355 (63.4%) | 591 (42.2%) |
| Total | 6,871 (100.0%) | 1,401 (100.0%) |
Monthly Housing Cost Tiers in North Potomac
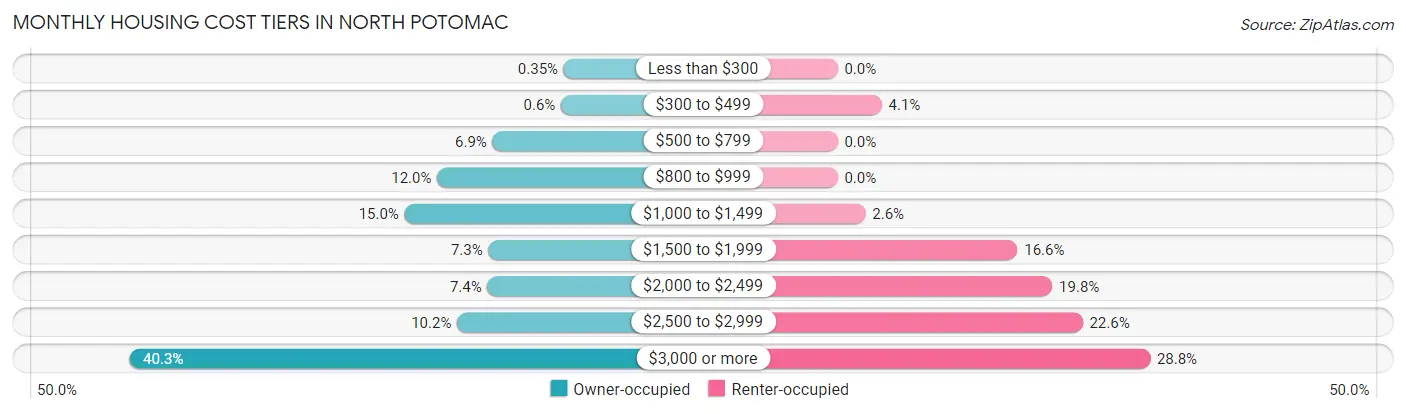
| Monthly Cost | Owner-occupied | Renter-occupied |
| Less than $300 | 24 (0.4%) | 0 (0.0%) |
| $300 to $499 | 41 (0.6%) | 57 (4.1%) |
| $500 to $799 | 475 (6.9%) | 0 (0.0%) |
| $800 to $999 | 825 (12.0%) | 0 (0.0%) |
| $1,000 to $1,499 | 1,031 (15.0%) | 36 (2.6%) |
| $1,500 to $1,999 | 501 (7.3%) | 232 (16.6%) |
| $2,000 to $2,499 | 507 (7.4%) | 277 (19.8%) |
| $2,500 to $2,999 | 699 (10.2%) | 316 (22.6%) |
| $3,000 or more | 2,768 (40.3%) | 403 (28.8%) |
| Total | 6,871 (100.0%) | 1,401 (100.0%) |
Physical Housing Characteristics in North Potomac
Housing Structures in North Potomac
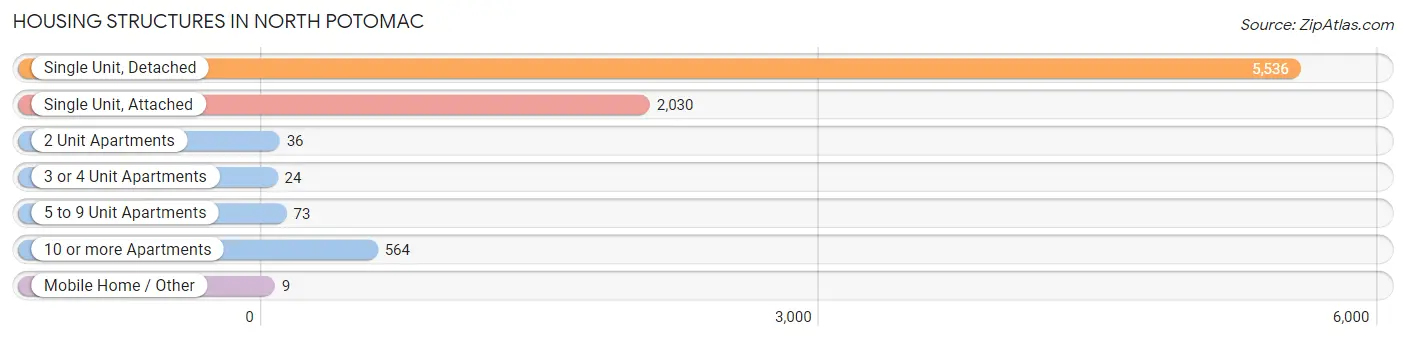
| Structure Type | # Housing Units | % Housing Units |
| Single Unit, Detached | 5,536 | 66.9% |
| Single Unit, Attached | 2,030 | 24.5% |
| 2 Unit Apartments | 36 | 0.4% |
| 3 or 4 Unit Apartments | 24 | 0.3% |
| 5 to 9 Unit Apartments | 73 | 0.9% |
| 10 or more Apartments | 564 | 6.8% |
| Mobile Home / Other | 9 | 0.1% |
| Total | 8,272 | 100.0% |
Housing Structures by Occupancy in North Potomac
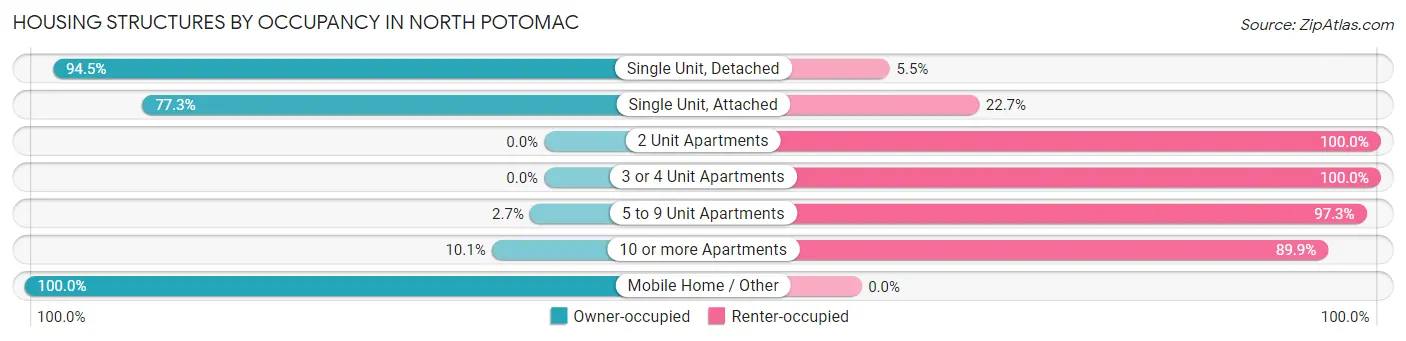
| Structure Type | Owner-occupied | Renter-occupied |
| Single Unit, Detached | 5,233 (94.5%) | 303 (5.5%) |
| Single Unit, Attached | 1,570 (77.3%) | 460 (22.7%) |
| 2 Unit Apartments | 0 (0.0%) | 36 (100.0%) |
| 3 or 4 Unit Apartments | 0 (0.0%) | 24 (100.0%) |
| 5 to 9 Unit Apartments | 2 (2.7%) | 71 (97.3%) |
| 10 or more Apartments | 57 (10.1%) | 507 (89.9%) |
| Mobile Home / Other | 9 (100.0%) | 0 (0.0%) |
| Total | 6,871 (83.1%) | 1,401 (16.9%) |
Housing Structures by Number of Rooms in North Potomac
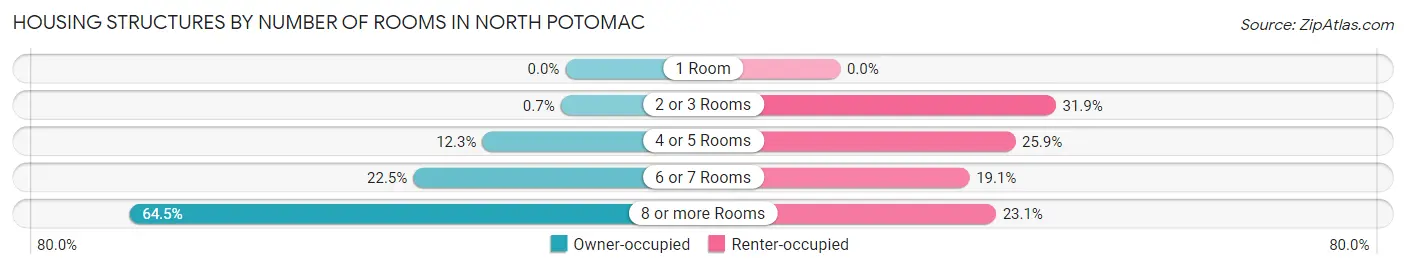
| Number of Rooms | Owner-occupied | Renter-occupied |
| 1 Room | 0 (0.0%) | 0 (0.0%) |
| 2 or 3 Rooms | 48 (0.7%) | 447 (31.9%) |
| 4 or 5 Rooms | 844 (12.3%) | 363 (25.9%) |
| 6 or 7 Rooms | 1,547 (22.5%) | 268 (19.1%) |
| 8 or more Rooms | 4,432 (64.5%) | 323 (23.1%) |
| Total | 6,871 (100.0%) | 1,401 (100.0%) |
Housing Structure by Heating Type in North Potomac
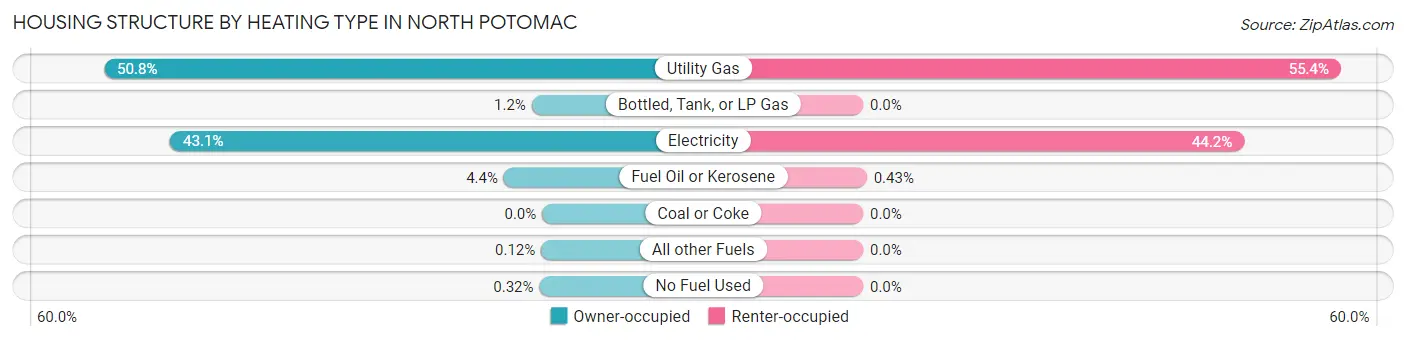
| Heating Type | Owner-occupied | Renter-occupied |
| Utility Gas | 3,490 (50.8%) | 776 (55.4%) |
| Bottled, Tank, or LP Gas | 83 (1.2%) | 0 (0.0%) |
| Electricity | 2,963 (43.1%) | 619 (44.2%) |
| Fuel Oil or Kerosene | 305 (4.4%) | 6 (0.4%) |
| Coal or Coke | 0 (0.0%) | 0 (0.0%) |
| All other Fuels | 8 (0.1%) | 0 (0.0%) |
| No Fuel Used | 22 (0.3%) | 0 (0.0%) |
| Total | 6,871 (100.0%) | 1,401 (100.0%) |
Household Vehicle Usage in North Potomac
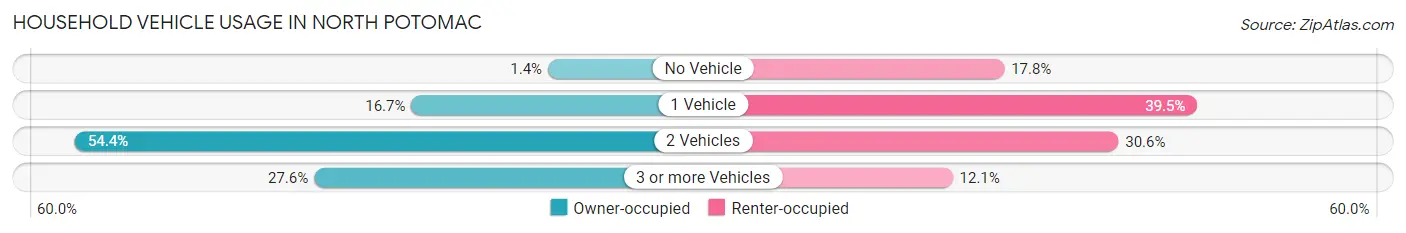
| Vehicles per Household | Owner-occupied | Renter-occupied |
| No Vehicle | 95 (1.4%) | 250 (17.8%) |
| 1 Vehicle | 1,146 (16.7%) | 553 (39.5%) |
| 2 Vehicles | 3,735 (54.4%) | 429 (30.6%) |
| 3 or more Vehicles | 1,895 (27.6%) | 169 (12.1%) |
| Total | 6,871 (100.0%) | 1,401 (100.0%) |
Real Estate & Mortgages in North Potomac
Real Estate and Mortgage Overview in North Potomac
| Characteristic | Without Mortgage | With Mortgage |
| Housing Units | 2,278 | 4,593 |
| Median Property Value | $727,700 | $791,300 |
| Median Household Income | $160,208 | $3,192 |
| Monthly Housing Costs | $963 | $2,768 |
| Real Estate Taxes | $6,712 | $53 |
Property Value by Mortgage Status in North Potomac
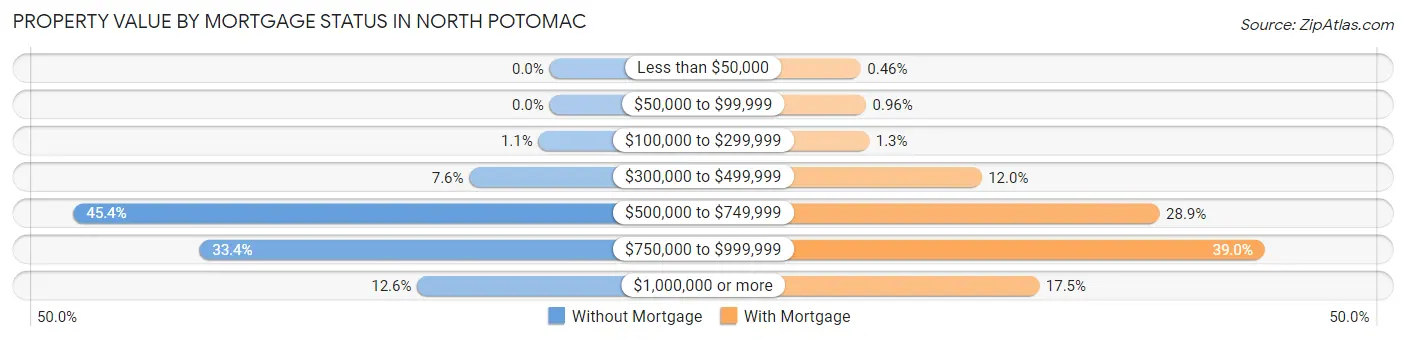
| Property Value | Without Mortgage | With Mortgage |
| Less than $50,000 | 0 (0.0%) | 21 (0.5%) |
| $50,000 to $99,999 | 0 (0.0%) | 44 (1.0%) |
| $100,000 to $299,999 | 24 (1.1%) | 58 (1.3%) |
| $300,000 to $499,999 | 174 (7.6%) | 550 (12.0%) |
| $500,000 to $749,999 | 1,033 (45.4%) | 1,328 (28.9%) |
| $750,000 to $999,999 | 760 (33.4%) | 1,790 (39.0%) |
| $1,000,000 or more | 287 (12.6%) | 802 (17.5%) |
| Total | 2,278 (100.0%) | 4,593 (100.0%) |
Household Income by Mortgage Status in North Potomac
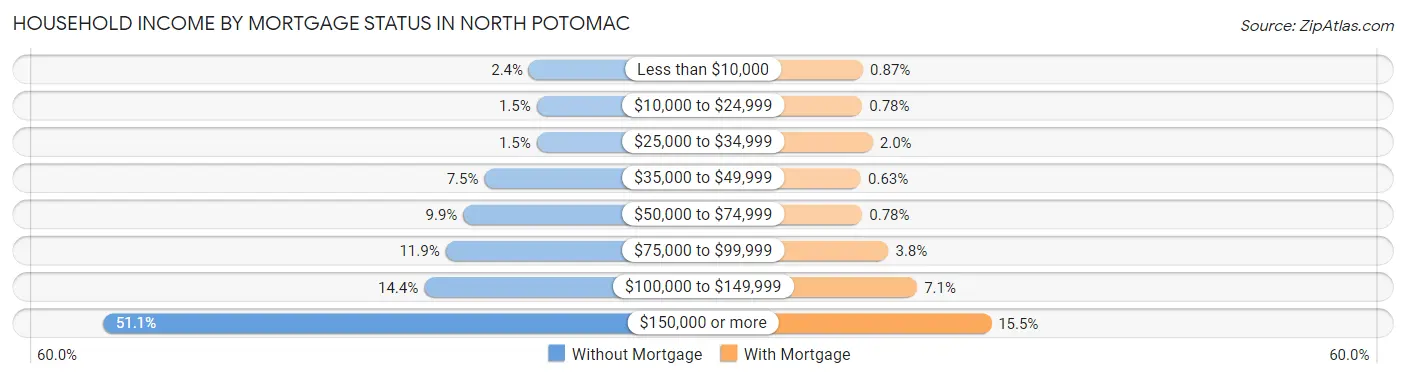
| Household Income | Without Mortgage | With Mortgage |
| Less than $10,000 | 54 (2.4%) | 40 (0.9%) |
| $10,000 to $24,999 | 34 (1.5%) | 36 (0.8%) |
| $25,000 to $34,999 | 34 (1.5%) | 91 (2.0%) |
| $35,000 to $49,999 | 170 (7.5%) | 29 (0.6%) |
| $50,000 to $74,999 | 225 (9.9%) | 36 (0.8%) |
| $75,000 to $99,999 | 271 (11.9%) | 173 (3.8%) |
| $100,000 to $149,999 | 327 (14.3%) | 324 (7.0%) |
| $150,000 or more | 1,163 (51.0%) | 712 (15.5%) |
| Total | 2,278 (100.0%) | 4,593 (100.0%) |
Property Value to Household Income Ratio in North Potomac
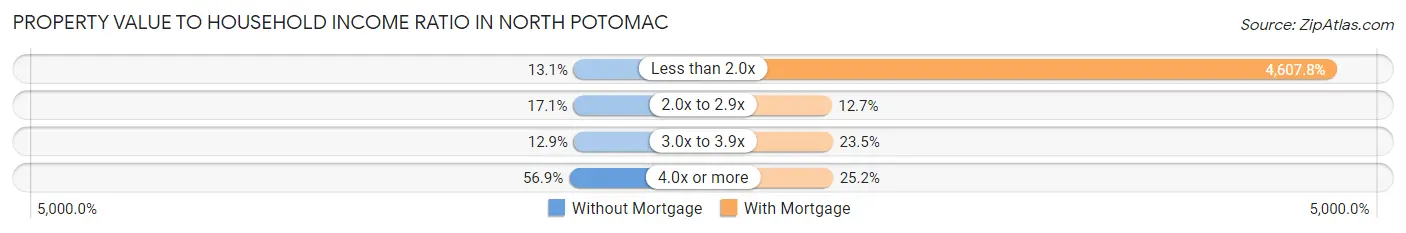
| Value-to-Income Ratio | Without Mortgage | With Mortgage |
| Less than 2.0x | 299 (13.1%) | 211,635 (4,607.8%) |
| 2.0x to 2.9x | 389 (17.1%) | 584 (12.7%) |
| 3.0x to 3.9x | 294 (12.9%) | 1,078 (23.5%) |
| 4.0x or more | 1,296 (56.9%) | 1,159 (25.2%) |
| Total | 2,278 (100.0%) | 4,593 (100.0%) |
Real Estate Taxes by Mortgage Status in North Potomac
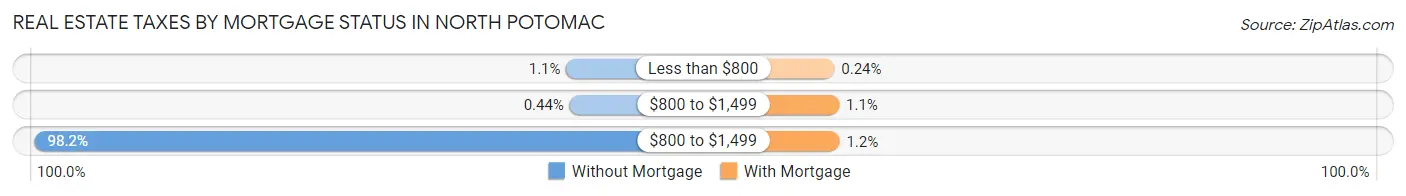
| Property Taxes | Without Mortgage | With Mortgage |
| Less than $800 | 24 (1.1%) | 11 (0.2%) |
| $800 to $1,499 | 10 (0.4%) | 51 (1.1%) |
| $800 to $1,499 | 2,236 (98.2%) | 54 (1.2%) |
| Total | 2,278 (100.0%) | 4,593 (100.0%) |
Health & Disability in North Potomac
Health Insurance Coverage by Age in North Potomac
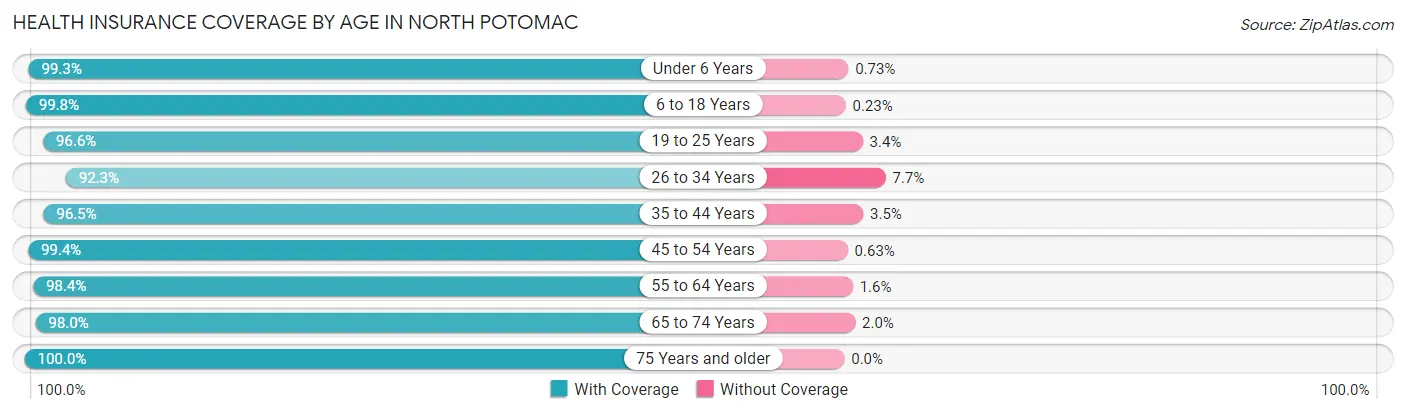
| Age Bracket | With Coverage | Without Coverage |
| Under 6 Years | 1,225 (99.3%) | 9 (0.7%) |
| 6 to 18 Years | 4,671 (99.8%) | 11 (0.2%) |
| 19 to 25 Years | 2,036 (96.6%) | 72 (3.4%) |
| 26 to 34 Years | 1,489 (92.3%) | 124 (7.7%) |
| 35 to 44 Years | 2,802 (96.5%) | 102 (3.5%) |
| 45 to 54 Years | 4,250 (99.4%) | 27 (0.6%) |
| 55 to 64 Years | 3,376 (98.4%) | 54 (1.6%) |
| 65 to 74 Years | 2,669 (98.0%) | 55 (2.0%) |
| 75 Years and older | 1,671 (100.0%) | 0 (0.0%) |
| Total | 24,189 (98.2%) | 454 (1.8%) |
Health Insurance Coverage by Citizenship Status in North Potomac
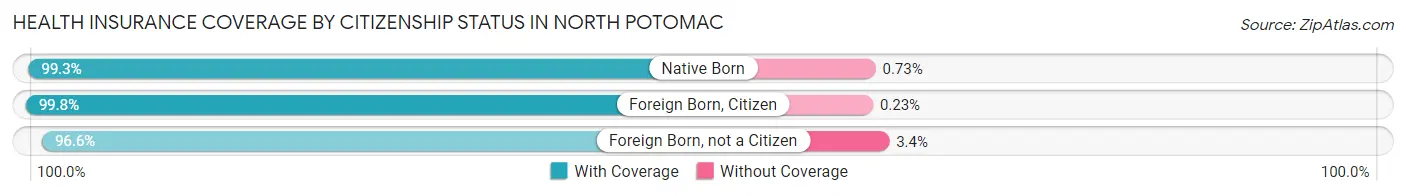
| Citizenship Status | With Coverage | Without Coverage |
| Native Born | 1,225 (99.3%) | 9 (0.7%) |
| Foreign Born, Citizen | 4,671 (99.8%) | 11 (0.2%) |
| Foreign Born, not a Citizen | 2,036 (96.6%) | 72 (3.4%) |
Health Insurance Coverage by Household Income in North Potomac
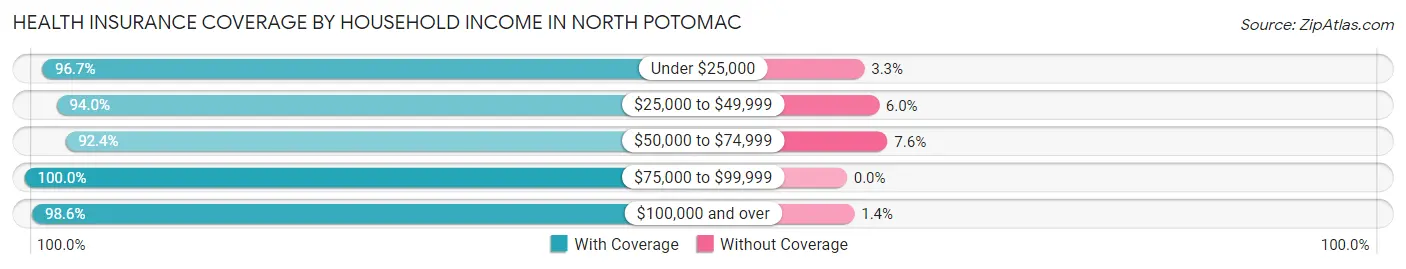
| Household Income | With Coverage | Without Coverage |
| Under $25,000 | 945 (96.7%) | 32 (3.3%) |
| $25,000 to $49,999 | 829 (94.0%) | 53 (6.0%) |
| $50,000 to $74,999 | 1,044 (92.4%) | 86 (7.6%) |
| $75,000 to $99,999 | 1,725 (100.0%) | 0 (0.0%) |
| $100,000 and over | 19,634 (98.6%) | 279 (1.4%) |
Public vs Private Health Insurance Coverage by Age in North Potomac
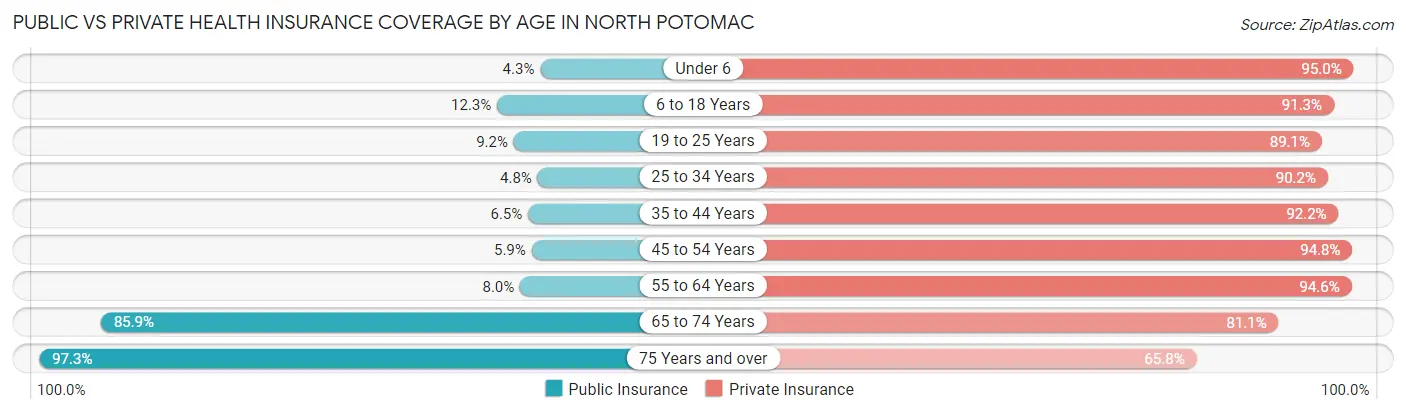
| Age Bracket | Public Insurance | Private Insurance |
| Under 6 | 53 (4.3%) | 1,172 (95.0%) |
| 6 to 18 Years | 576 (12.3%) | 4,276 (91.3%) |
| 19 to 25 Years | 194 (9.2%) | 1,878 (89.1%) |
| 25 to 34 Years | 77 (4.8%) | 1,455 (90.2%) |
| 35 to 44 Years | 190 (6.5%) | 2,677 (92.2%) |
| 45 to 54 Years | 252 (5.9%) | 4,053 (94.8%) |
| 55 to 64 Years | 275 (8.0%) | 3,245 (94.6%) |
| 65 to 74 Years | 2,339 (85.9%) | 2,208 (81.1%) |
| 75 Years and over | 1,626 (97.3%) | 1,100 (65.8%) |
| Total | 5,582 (22.7%) | 22,064 (89.5%) |
Disability Status by Sex by Age in North Potomac
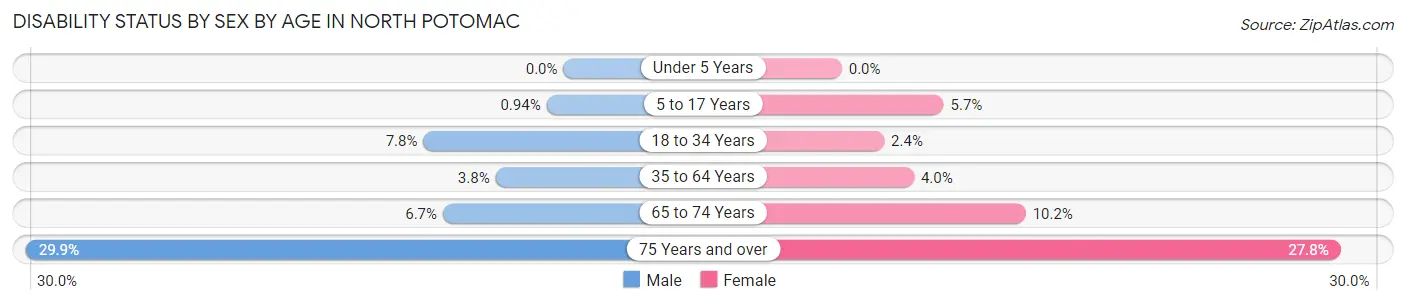
| Age Bracket | Male | Female |
| Under 5 Years | 0 (0.0%) | 0 (0.0%) |
| 5 to 17 Years | 22 (0.9%) | 120 (5.7%) |
| 18 to 34 Years | 176 (7.8%) | 47 (2.4%) |
| 35 to 64 Years | 192 (3.8%) | 222 (4.0%) |
| 65 to 74 Years | 93 (6.7%) | 137 (10.2%) |
| 75 Years and over | 179 (29.9%) | 298 (27.8%) |
Disability Class by Sex by Age in North Potomac
Disability Class: Hearing Difficulty
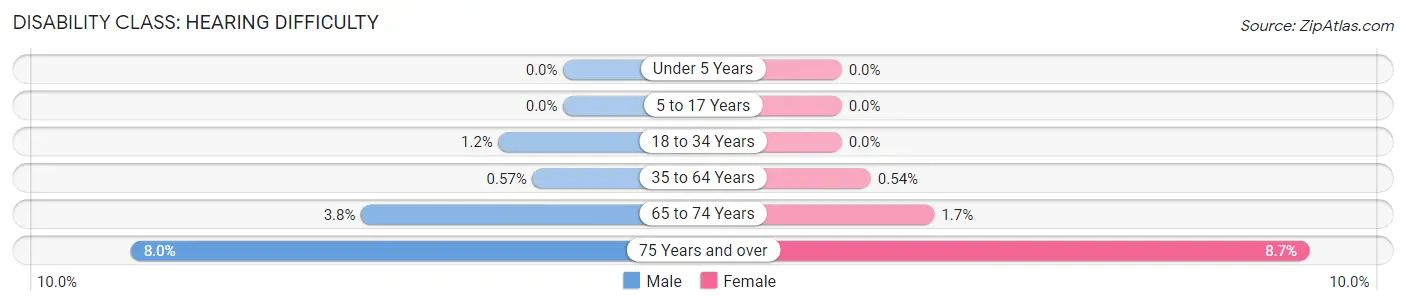
| Age Bracket | Male | Female |
| Under 5 Years | 0 (0.0%) | 0 (0.0%) |
| 5 to 17 Years | 0 (0.0%) | 0 (0.0%) |
| 18 to 34 Years | 27 (1.2%) | 0 (0.0%) |
| 35 to 64 Years | 29 (0.6%) | 30 (0.5%) |
| 65 to 74 Years | 52 (3.7%) | 23 (1.7%) |
| 75 Years and over | 48 (8.0%) | 93 (8.7%) |
Disability Class: Vision Difficulty
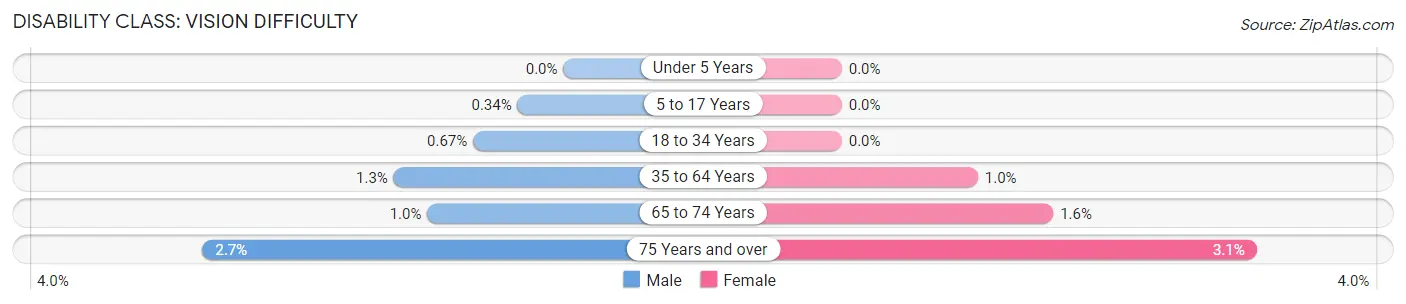
| Age Bracket | Male | Female |
| Under 5 Years | 0 (0.0%) | 0 (0.0%) |
| 5 to 17 Years | 8 (0.3%) | 0 (0.0%) |
| 18 to 34 Years | 15 (0.7%) | 0 (0.0%) |
| 35 to 64 Years | 64 (1.3%) | 56 (1.0%) |
| 65 to 74 Years | 14 (1.0%) | 21 (1.6%) |
| 75 Years and over | 16 (2.7%) | 33 (3.1%) |
Disability Class: Cognitive Difficulty
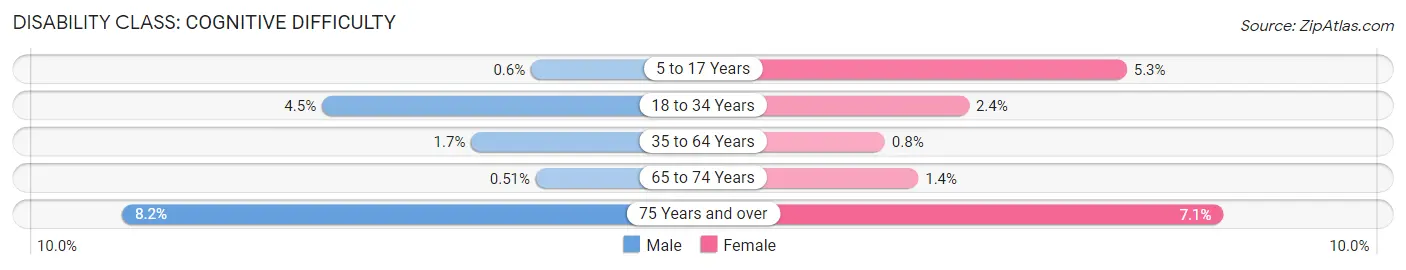
| Age Bracket | Male | Female |
| 5 to 17 Years | 14 (0.6%) | 112 (5.3%) |
| 18 to 34 Years | 101 (4.5%) | 47 (2.4%) |
| 35 to 64 Years | 87 (1.7%) | 44 (0.8%) |
| 65 to 74 Years | 7 (0.5%) | 19 (1.4%) |
| 75 Years and over | 49 (8.2%) | 76 (7.1%) |
Disability Class: Ambulatory Difficulty
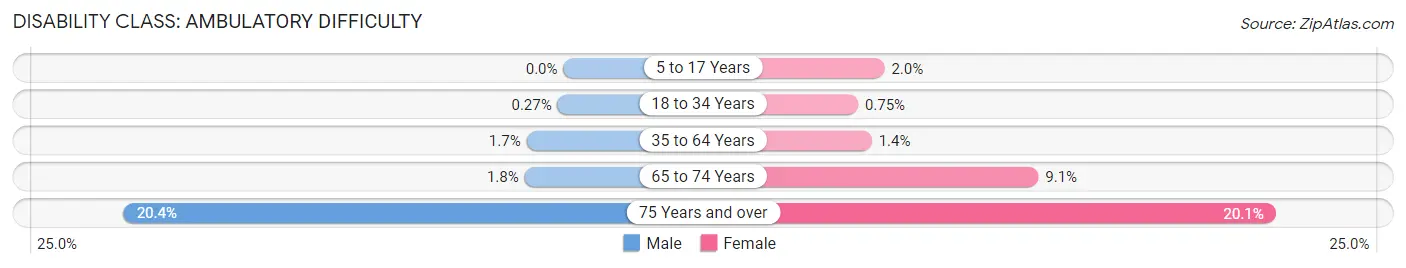
| Age Bracket | Male | Female |
| 5 to 17 Years | 0 (0.0%) | 42 (2.0%) |
| 18 to 34 Years | 6 (0.3%) | 15 (0.7%) |
| 35 to 64 Years | 87 (1.7%) | 77 (1.4%) |
| 65 to 74 Years | 25 (1.8%) | 122 (9.1%) |
| 75 Years and over | 122 (20.4%) | 216 (20.1%) |
Disability Class: Self-Care Difficulty
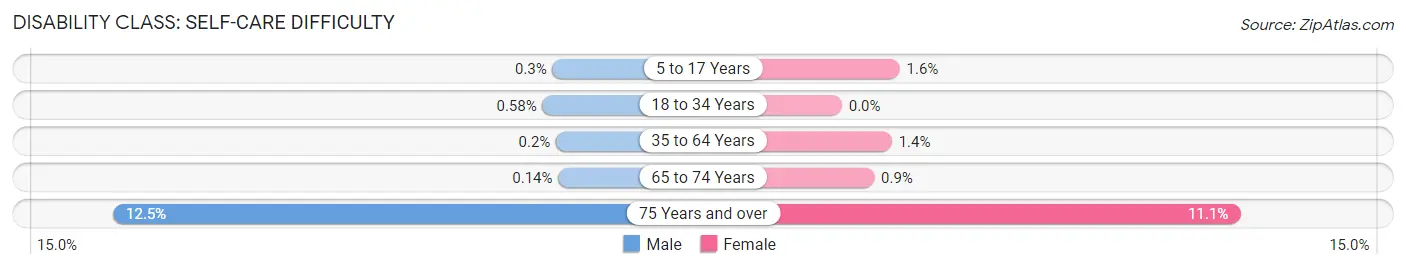
| Age Bracket | Male | Female |
| 5 to 17 Years | 7 (0.3%) | 34 (1.6%) |
| 18 to 34 Years | 13 (0.6%) | 0 (0.0%) |
| 35 to 64 Years | 10 (0.2%) | 77 (1.4%) |
| 65 to 74 Years | 2 (0.1%) | 12 (0.9%) |
| 75 Years and over | 75 (12.5%) | 119 (11.1%) |
Technology Access in North Potomac
Computing Device Access in North Potomac
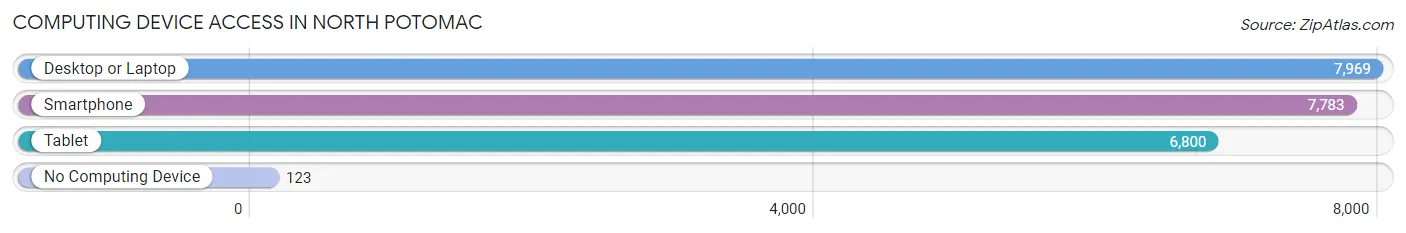
| Device Type | # Households | % Households |
| Desktop or Laptop | 7,969 | 96.3% |
| Smartphone | 7,783 | 94.1% |
| Tablet | 6,800 | 82.2% |
| No Computing Device | 123 | 1.5% |
| Total | 8,272 | 100.0% |
Internet Access in North Potomac
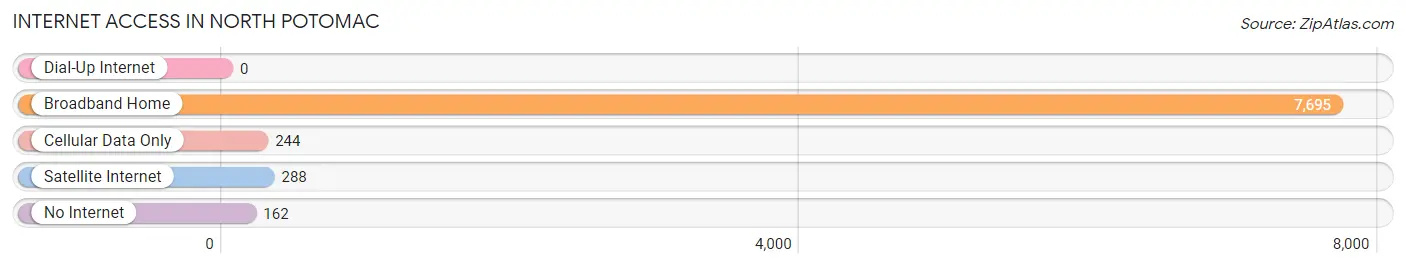
| Internet Type | # Households | % Households |
| Dial-Up Internet | 0 | 0.0% |
| Broadband Home | 7,695 | 93.0% |
| Cellular Data Only | 244 | 2.9% |
| Satellite Internet | 288 | 3.5% |
| No Internet | 162 | 2.0% |
| Total | 8,272 | 100.0% |
North Potomac Summary
History
North Potomac is a census-designated place (CDP) located in Montgomery County, Maryland. It is a suburban community located approximately 20 miles northwest of Washington, D.C. The area was first settled in the late 1700s by German and English immigrants. The area was originally known as Travilah, and was part of a larger tract of land owned by the Travilah family. The area was later renamed North Potomac in the late 1800s, when the Potomac River was used to power a mill.
The area remained largely rural until the 1950s, when the construction of the Washington Metro and the development of the Interstate Highway System made the area more accessible to commuters. This led to an influx of new residents, and the area quickly became a popular suburb of Washington, D.C.
Geography
North Potomac is located in Montgomery County, Maryland, approximately 20 miles northwest of Washington, D.C. The area is bordered by the Potomac River to the north, the Montgomery County line to the east, the city of Rockville to the south, and the city of Gaithersburg to the west. The area is mostly residential, with some commercial and industrial development along the Interstate 270 corridor.
The area is characterized by rolling hills and valleys, with the highest point in the area being the summit of Travilah Hill, which rises to an elevation of 545 feet. The area is also home to several parks and recreational areas, including the North Potomac Community Park, the North Potomac Golf Course, and the North Potomac Nature Center.
Economy
North Potomac is primarily a residential community, with most of its residents commuting to nearby cities for work. The area is home to several large employers, including the National Institutes of Health, the National Institute of Standards and Technology, and the National Naval Medical Center. The area is also home to several technology companies, including Lockheed Martin, Northrop Grumman, and Booz Allen Hamilton.
The area is also home to several shopping centers, including the Travilah Square Shopping Center, the North Potomac Shopping Center, and the Potomac Promenade Shopping Center. The area is also home to several restaurants, including the popular North Potomac Pizza and Subs.
Demographics
As of the 2010 census, the population of North Potomac was 24,811. The population is primarily white (77.3%), with a significant Asian population (14.2%). The median household income is $128,845, and the median home value is $541,000. The area is well-educated, with over 80% of the population having a bachelor's degree or higher.
North Potomac is a diverse community, with a variety of religious and cultural backgrounds. The area is home to several churches, including the North Potomac United Methodist Church, the North Potomac Presbyterian Church, and the North Potomac Jewish Community Center. The area is also home to several cultural organizations, including the North Potomac Cultural Arts Council and the North Potomac Historical Society.
Common Questions
What is Per Capita Income in North Potomac?
Per Capita income in North Potomac is $71,327.
What is the Median Family Income in North Potomac?
Median Family Income in North Potomac is $199,245.
What is the Median Household income in North Potomac?
Median Household Income in North Potomac is $182,083.
What is Income or Wage Gap in North Potomac?
Income or Wage Gap in North Potomac is 44.1%.
Women in North Potomac earn 55.9 cents for every dollar earned by a man.
What is Family Income Deficit in North Potomac?
Family Income Deficit in North Potomac is $11,413.
Families that are below poverty line in North Potomac earn $11,413 less on average than the poverty threshold level.
What is Inequality or Gini Index in North Potomac?
Inequality or Gini Index in North Potomac is 0.39.
What is the Total Population of North Potomac?
Total Population of North Potomac is 24,692.
What is the Total Male Population of North Potomac?
Total Male Population of North Potomac is 12,191.
What is the Total Female Population of North Potomac?
Total Female Population of North Potomac is 12,501.
What is the Ratio of Males per 100 Females in North Potomac?
There are 97.52 Males per 100 Females in North Potomac.
What is the Ratio of Females per 100 Males in North Potomac?
There are 102.54 Females per 100 Males in North Potomac.
What is the Median Population Age in North Potomac?
Median Population Age in North Potomac is 44.4 Years.
What is the Average Family Size in North Potomac
Average Family Size in North Potomac is 3.3 People.
What is the Average Household Size in North Potomac
Average Household Size in North Potomac is 3.0 People.
How Large is the Labor Force in North Potomac?
There are 13,283 People in the Labor Forcein in North Potomac.
What is the Percentage of People in the Labor Force in North Potomac?
66.4% of People are in the Labor Force in North Potomac.
What is the Unemployment Rate in North Potomac?
Unemployment Rate in North Potomac is 4.8%.