Rockville, MD Map & Demographics
Rockville Map
Rockville Overview
$61,412
PER CAPITA INCOME
$148,288
AVG FAMILY INCOME
$122,470
AVG HOUSEHOLD INCOME
33.2%
WAGE / INCOME GAP [ % ]
66.8¢/ $1
WAGE / INCOME GAP [ $ ]
$8,223
FAMILY INCOME DEFICIT
0.42
INEQUALITY / GINI INDEX
67,142
TOTAL POPULATION
32,410
MALE POPULATION
34,732
FEMALE POPULATION
93.31
MALES / 100 FEMALES
107.16
FEMALES / 100 MALES
38.8
MEDIAN AGE
3.1
AVG FAMILY SIZE
2.5
AVG HOUSEHOLD SIZE
37,728
LABOR FORCE [ PEOPLE ]
68.5%
PERCENT IN LABOR FORCE
3.6%
UNEMPLOYMENT RATE
Income in Rockville
Income Overview in Rockville
Per Capita Income in Rockville is $61,412, while median incomes of families and households are $148,288 and $122,470 respectively.
| Characteristic | Number | Measure |
| Per Capita Income | 67,142 | $61,412 |
| Median Family Income | 16,830 | $148,288 |
| Mean Family Income | 16,830 | $176,437 |
| Median Household Income | 26,543 | $122,470 |
| Mean Household Income | 26,543 | $151,301 |
| Income Deficit | 16,830 | $8,223 |
| Wage / Income Gap (%) | 67,142 | 33.25% |
| Wage / Income Gap ($) | 67,142 | 66.75¢ per $1 |
| Gini / Inequality Index | 67,142 | 0.42 |
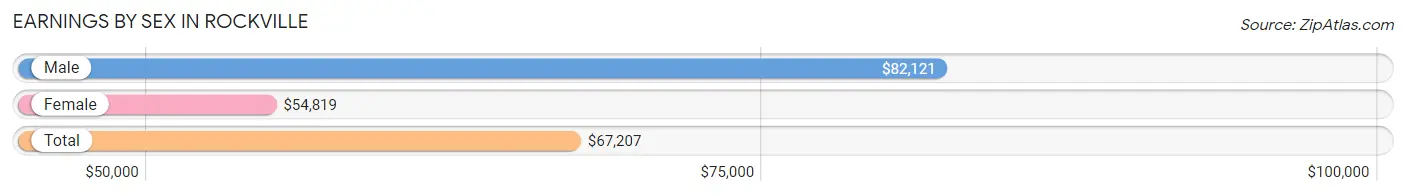
Earnings by Sex in Rockville
Average Earnings in Rockville are $67,207, $82,121 for men and $54,819 for women, a difference of 33.3%.
| Sex | Number | Average Earnings |
| Male | 19,661 (50.4%) | $82,121 |
| Female | 19,317 (49.6%) | $54,819 |
| Total | 38,978 (100.0%) | $67,207 |
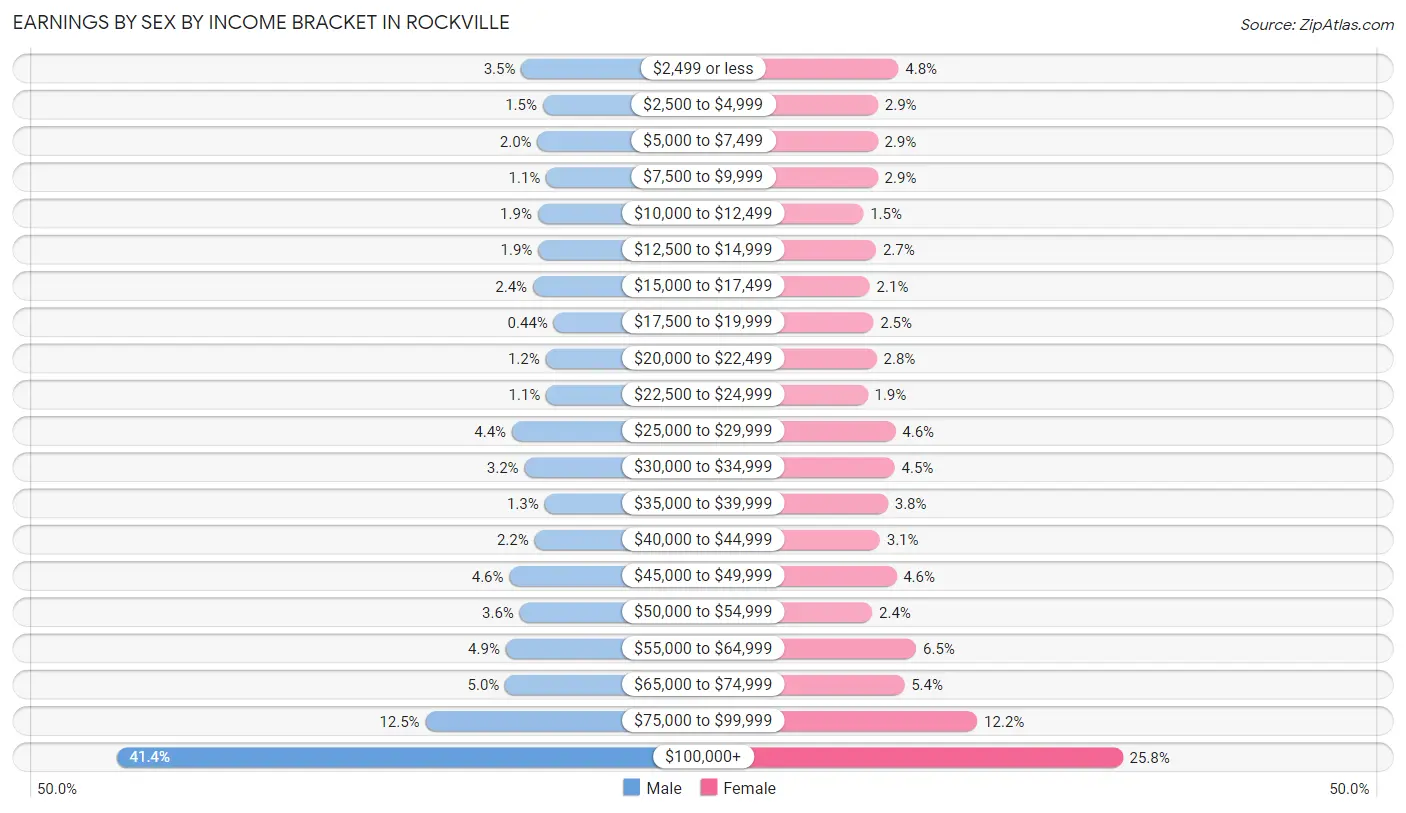
Earnings by Sex by Income Bracket in Rockville
The most common earnings brackets in Rockville are $100,000+ for men (8,135 | 41.4%) and $100,000+ for women (4,989 | 25.8%).
| Income | Male | Female |
| $2,499 or less | 683 (3.5%) | 933 (4.8%) |
| $2,500 to $4,999 | 287 (1.5%) | 562 (2.9%) |
| $5,000 to $7,499 | 386 (2.0%) | 557 (2.9%) |
| $7,500 to $9,999 | 225 (1.1%) | 558 (2.9%) |
| $10,000 to $12,499 | 379 (1.9%) | 298 (1.5%) |
| $12,500 to $14,999 | 372 (1.9%) | 527 (2.7%) |
| $15,000 to $17,499 | 468 (2.4%) | 413 (2.1%) |
| $17,500 to $19,999 | 86 (0.4%) | 480 (2.5%) |
| $20,000 to $22,499 | 235 (1.2%) | 539 (2.8%) |
| $22,500 to $24,999 | 224 (1.1%) | 375 (1.9%) |
| $25,000 to $29,999 | 855 (4.3%) | 879 (4.5%) |
| $30,000 to $34,999 | 625 (3.2%) | 865 (4.5%) |
| $35,000 to $39,999 | 253 (1.3%) | 741 (3.8%) |
| $40,000 to $44,999 | 438 (2.2%) | 596 (3.1%) |
| $45,000 to $49,999 | 902 (4.6%) | 895 (4.6%) |
| $50,000 to $54,999 | 711 (3.6%) | 458 (2.4%) |
| $55,000 to $64,999 | 970 (4.9%) | 1,254 (6.5%) |
| $65,000 to $74,999 | 979 (5.0%) | 1,039 (5.4%) |
| $75,000 to $99,999 | 2,448 (12.4%) | 2,359 (12.2%) |
| $100,000+ | 8,135 (41.4%) | 4,989 (25.8%) |
| Total | 19,661 (100.0%) | 19,317 (100.0%) |
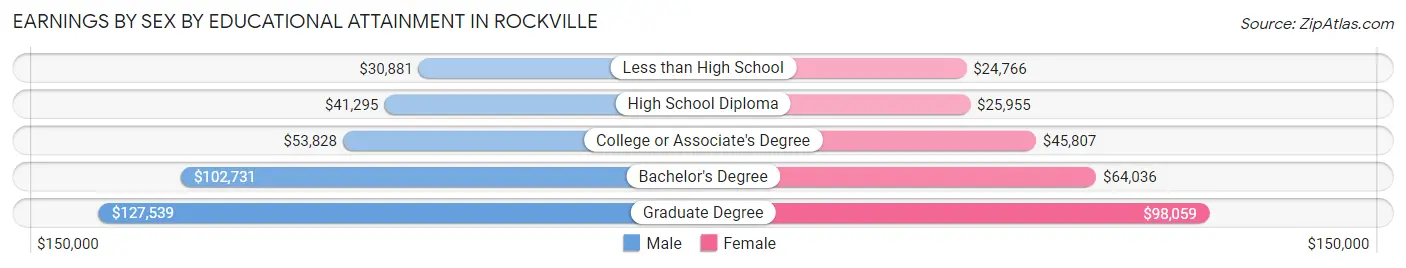
Earnings by Sex by Educational Attainment in Rockville
Average earnings in Rockville are $91,178 for men and $64,802 for women, a difference of 28.9%. Men with an educational attainment of graduate degree enjoy the highest average annual earnings of $127,539, while those with less than high school education earn the least with $30,881. Women with an educational attainment of graduate degree earn the most with the average annual earnings of $98,059, while those with less than high school education have the smallest earnings of $24,766.
| Educational Attainment | Male Income | Female Income |
| Less than High School | $30,881 | $24,766 |
| High School Diploma | $41,295 | $25,955 |
| College or Associate's Degree | $53,828 | $45,807 |
| Bachelor's Degree | $102,731 | $64,036 |
| Graduate Degree | $127,539 | $98,059 |
| Total | $91,178 | $64,802 |
Family Income in Rockville
Family Income Brackets in Rockville
According to the Rockville family income data, there are 5,571 families falling into the $200,000+ income range, which is the most common income bracket and makes up 33.1% of all families. Conversely, the $10,000 to $14,999 income bracket is the least frequent group with only 118 families (0.7%) belonging to this category.
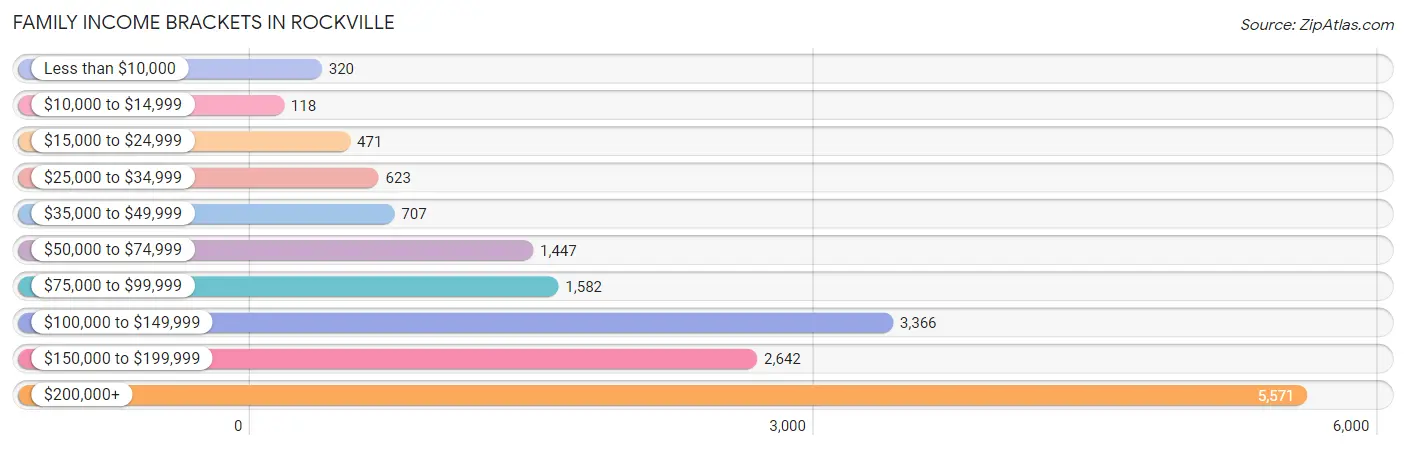
| Income Bracket | # Families | % Families |
| Less than $10,000 | 320 | 1.9% |
| $10,000 to $14,999 | 118 | 0.7% |
| $15,000 to $24,999 | 471 | 2.8% |
| $25,000 to $34,999 | 623 | 3.7% |
| $35,000 to $49,999 | 707 | 4.2% |
| $50,000 to $74,999 | 1,447 | 8.6% |
| $75,000 to $99,999 | 1,582 | 9.4% |
| $100,000 to $149,999 | 3,366 | 20.0% |
| $150,000 to $199,999 | 2,642 | 15.7% |
| $200,000+ | 5,571 | 33.1% |
Family Income by Famaliy Size in Rockville
4-person families (3,561 | 21.2%) account for the highest median family income in Rockville with $180,893 per family, while 2-person families (7,592 | 45.1%) have the highest median income of $66,154 per family member.
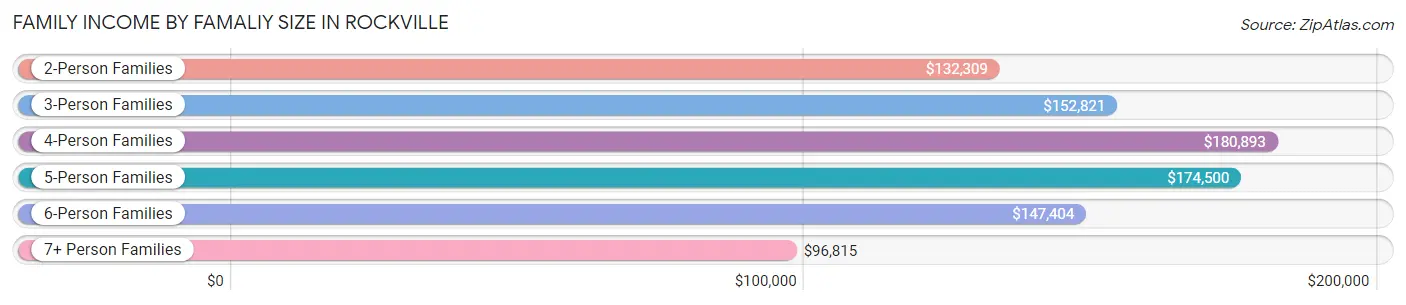
| Income Bracket | # Families | Median Income |
| 2-Person Families | 7,592 (45.1%) | $132,309 |
| 3-Person Families | 4,095 (24.3%) | $152,821 |
| 4-Person Families | 3,561 (21.2%) | $180,893 |
| 5-Person Families | 1,156 (6.9%) | $174,500 |
| 6-Person Families | 181 (1.1%) | $147,404 |
| 7+ Person Families | 245 (1.5%) | $96,815 |
| Total | 16,830 (100.0%) | $148,288 |
Family Income by Number of Earners in Rockville
The median family income in Rockville is $148,288, with families comprising 3+ earners (1,879) having the highest median family income of $179,938, while families with no earners (1,707) have the lowest median family income of $97,813, accounting for 11.2% and 10.1% of families, respectively.
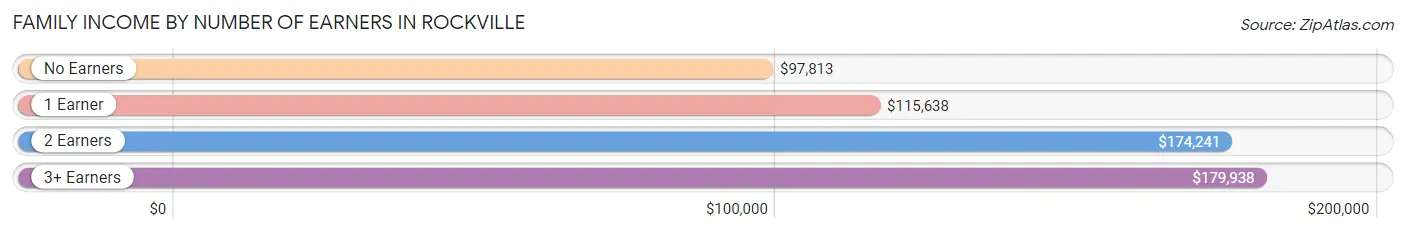
| Number of Earners | # Families | Median Income |
| No Earners | 1,707 (10.1%) | $97,813 |
| 1 Earner | 5,215 (31.0%) | $115,638 |
| 2 Earners | 8,029 (47.7%) | $174,241 |
| 3+ Earners | 1,879 (11.2%) | $179,938 |
| Total | 16,830 (100.0%) | $148,288 |
Household Income in Rockville
Household Income Brackets in Rockville
With 6,556 households falling in the category, the $200,000+ income range is the most frequent in Rockville, accounting for 24.7% of all households. In contrast, only 637 households (2.4%) fall into the $10,000 to $14,999 income bracket, making it the least populous group.
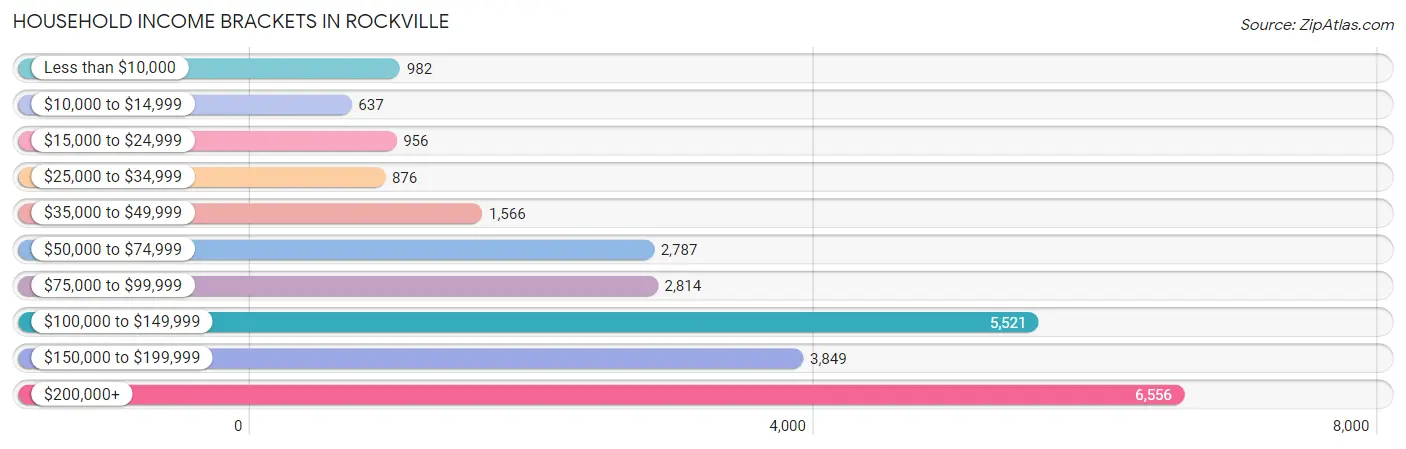
| Income Bracket | # Households | % Households |
| Less than $10,000 | 982 | 3.7% |
| $10,000 to $14,999 | 637 | 2.4% |
| $15,000 to $24,999 | 956 | 3.6% |
| $25,000 to $34,999 | 876 | 3.3% |
| $35,000 to $49,999 | 1,566 | 5.9% |
| $50,000 to $74,999 | 2,787 | 10.5% |
| $75,000 to $99,999 | 2,814 | 10.6% |
| $100,000 to $149,999 | 5,521 | 20.8% |
| $150,000 to $199,999 | 3,849 | 14.5% |
| $200,000+ | 6,556 | 24.7% |
Household Income by Householder Age in Rockville
The median household income in Rockville is $122,470, with the highest median household income of $166,977 found in the 45 to 64 years age bracket for the primary householder. A total of 9,192 households (34.6%) fall into this category. Meanwhile, the 15 to 24 years age bracket for the primary householder has the lowest median household income of $62,083, with 901 households (3.4%) in this group.
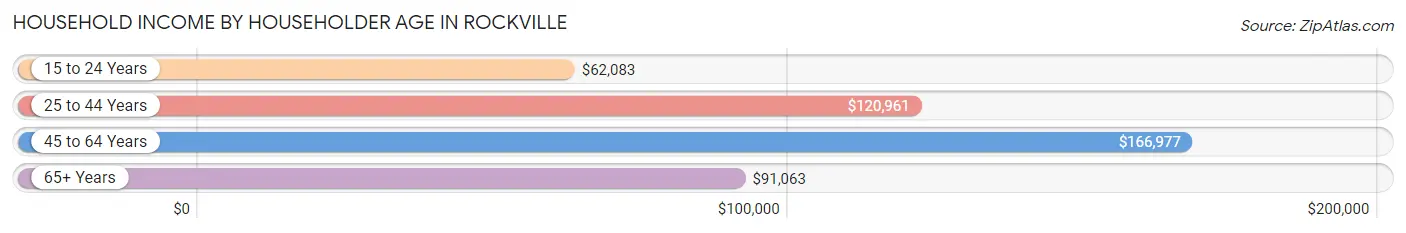
| Income Bracket | # Households | Median Income |
| 15 to 24 Years | 901 (3.4%) | $62,083 |
| 25 to 44 Years | 9,363 (35.3%) | $120,961 |
| 45 to 64 Years | 9,192 (34.6%) | $166,977 |
| 65+ Years | 7,087 (26.7%) | $91,063 |
| Total | 26,543 (100.0%) | $122,470 |
Poverty in Rockville
Income Below Poverty by Sex and Age in Rockville
With 8.4% poverty level for males and 8.2% for females among the residents of Rockville, 6 to 11 year old males and 75 year old and over females are the most vulnerable to poverty, with 469 males (19.4%) and 619 females (17.0%) in their respective age groups living below the poverty level.
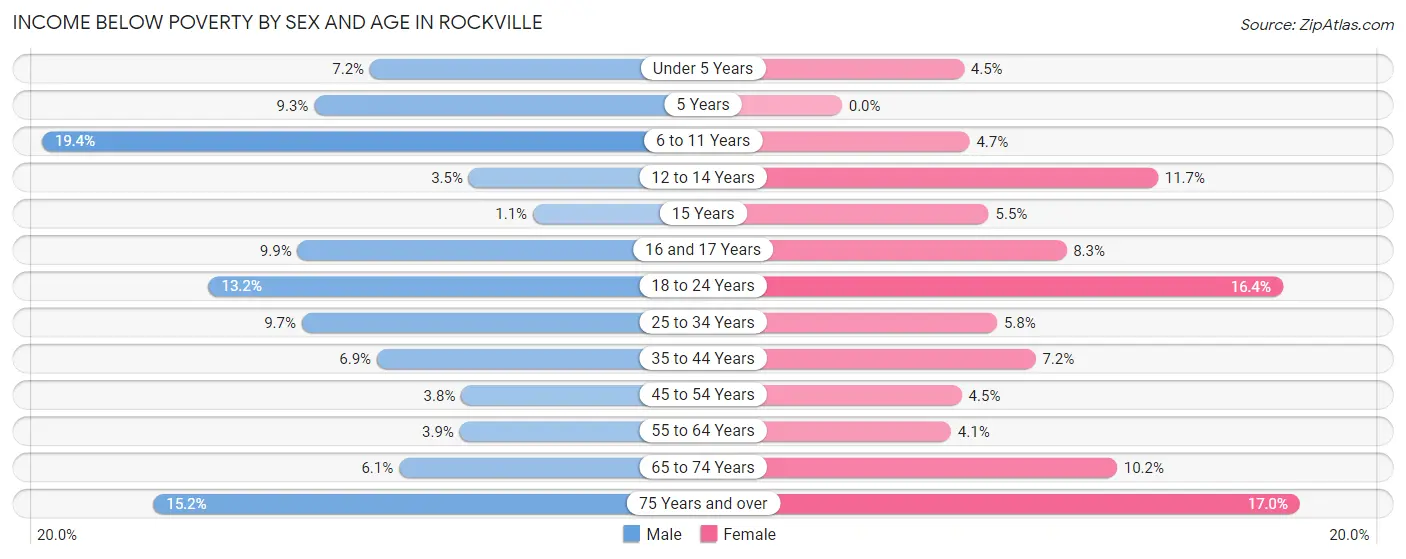
| Age Bracket | Male | Female |
| Under 5 Years | 109 (7.2%) | 87 (4.5%) |
| 5 Years | 38 (9.2%) | 0 (0.0%) |
| 6 to 11 Years | 469 (19.4%) | 92 (4.7%) |
| 12 to 14 Years | 57 (3.5%) | 137 (11.7%) |
| 15 Years | 4 (1.1%) | 15 (5.4%) |
| 16 and 17 Years | 88 (9.9%) | 67 (8.3%) |
| 18 to 24 Years | 332 (13.2%) | 484 (16.4%) |
| 25 to 34 Years | 487 (9.7%) | 290 (5.8%) |
| 35 to 44 Years | 324 (6.9%) | 349 (7.2%) |
| 45 to 54 Years | 165 (3.8%) | 190 (4.4%) |
| 55 to 64 Years | 139 (3.8%) | 162 (4.1%) |
| 65 to 74 Years | 155 (6.1%) | 312 (10.2%) |
| 75 Years and over | 334 (15.2%) | 619 (17.0%) |
| Total | 2,701 (8.4%) | 2,804 (8.2%) |
Income Above Poverty by Sex and Age in Rockville
According to the poverty statistics in Rockville, males aged 15 years and females aged 5 years are the age groups that are most secure financially, with 98.9% of males and 100.0% of females in these age groups living above the poverty line.
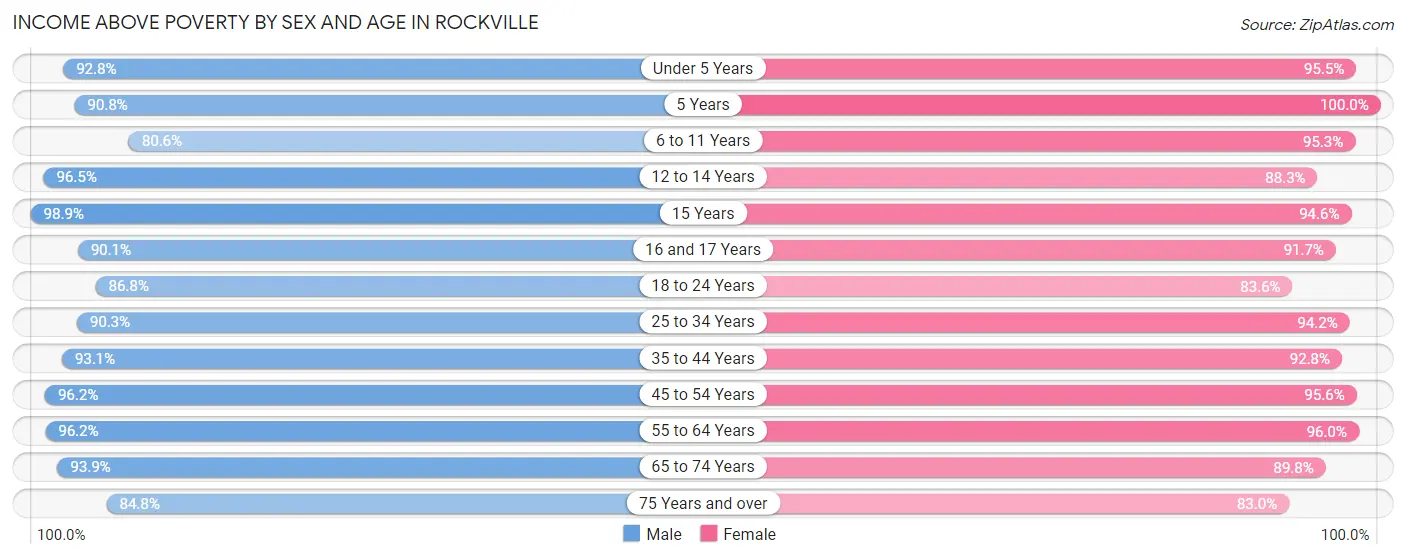
| Age Bracket | Male | Female |
| Under 5 Years | 1,410 (92.8%) | 1,833 (95.5%) |
| 5 Years | 373 (90.7%) | 312 (100.0%) |
| 6 to 11 Years | 1,953 (80.6%) | 1,847 (95.3%) |
| 12 to 14 Years | 1,566 (96.5%) | 1,031 (88.3%) |
| 15 Years | 350 (98.9%) | 260 (94.6%) |
| 16 and 17 Years | 804 (90.1%) | 737 (91.7%) |
| 18 to 24 Years | 2,189 (86.8%) | 2,473 (83.6%) |
| 25 to 34 Years | 4,531 (90.3%) | 4,743 (94.2%) |
| 35 to 44 Years | 4,355 (93.1%) | 4,506 (92.8%) |
| 45 to 54 Years | 4,193 (96.2%) | 4,080 (95.6%) |
| 55 to 64 Years | 3,467 (96.2%) | 3,842 (96.0%) |
| 65 to 74 Years | 2,385 (93.9%) | 2,743 (89.8%) |
| 75 Years and over | 1,860 (84.8%) | 3,022 (83.0%) |
| Total | 29,436 (91.6%) | 31,429 (91.8%) |
Income Below Poverty Among Married-Couple Families in Rockville
The poverty statistics for married-couple families in Rockville show that 3.5% or 440 of the total 12,715 families live below the poverty line. Families with 5 or more children have the highest poverty rate of 17.1%, comprising of 15 families. On the other hand, families with 1 or 2 children have the lowest poverty rate of 2.2%, which includes 106 families.
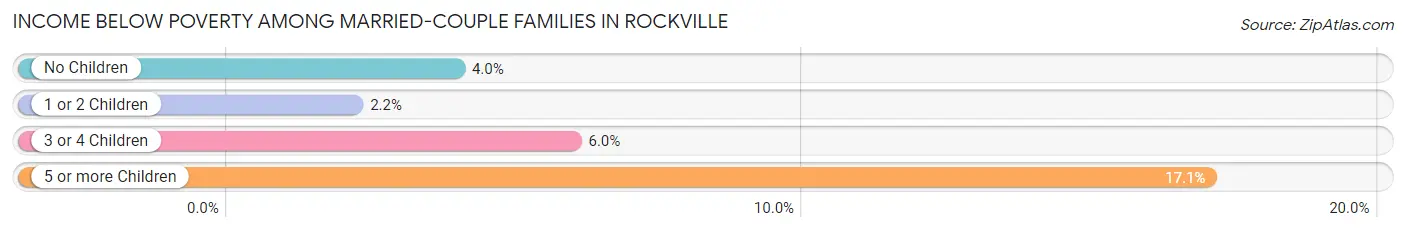
| Children | Above Poverty | Below Poverty |
| No Children | 6,881 (96.1%) | 283 (4.0%) |
| 1 or 2 Children | 4,755 (97.8%) | 106 (2.2%) |
| 3 or 4 Children | 566 (94.0%) | 36 (6.0%) |
| 5 or more Children | 73 (83.0%) | 15 (17.1%) |
| Total | 12,275 (96.5%) | 440 (3.5%) |
Income Below Poverty Among Single-Parent Households in Rockville
According to the poverty data in Rockville, 18.7% or 242 single-father households and 9.9% or 280 single-mother households are living below the poverty line. Among single-father households, those with 3 or 4 children have the highest poverty rate, with 109 households (36.0%) experiencing poverty. Likewise, among single-mother households, those with 3 or 4 children have the highest poverty rate, with 82 households (29.4%) falling below the poverty line.
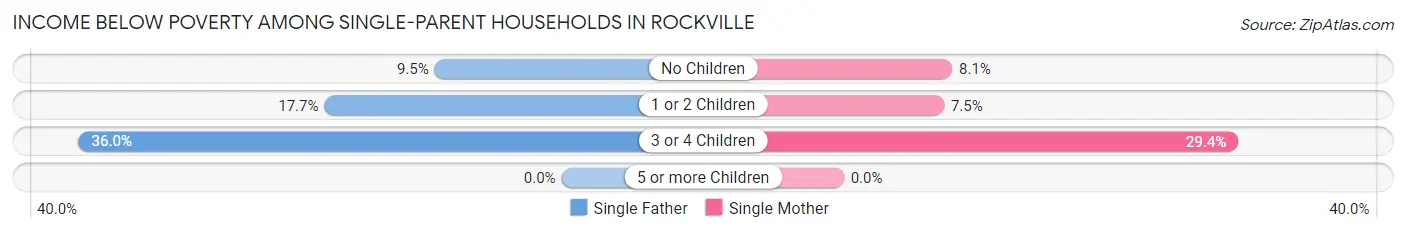
| Children | Single Father | Single Mother |
| No Children | 48 (9.5%) | 119 (8.1%) |
| 1 or 2 Children | 85 (17.7%) | 79 (7.5%) |
| 3 or 4 Children | 109 (36.0%) | 82 (29.4%) |
| 5 or more Children | 0 (0.0%) | 0 (0.0%) |
| Total | 242 (18.7%) | 280 (9.9%) |
Income Below Poverty Among Married-Couple vs Single-Parent Households in Rockville
The poverty data for Rockville shows that 440 of the married-couple family households (3.5%) and 522 of the single-parent households (12.7%) are living below the poverty level. Within the married-couple family households, those with 5 or more children have the highest poverty rate, with 15 households (17.1%) falling below the poverty line. Among the single-parent households, those with 3 or 4 children have the highest poverty rate, with 191 household (32.8%) living below poverty.
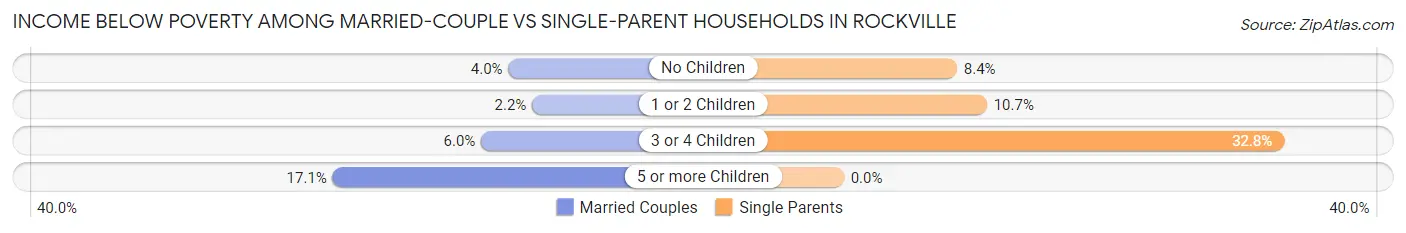
| Children | Married-Couple Families | Single-Parent Households |
| No Children | 283 (4.0%) | 167 (8.4%) |
| 1 or 2 Children | 106 (2.2%) | 164 (10.7%) |
| 3 or 4 Children | 36 (6.0%) | 191 (32.8%) |
| 5 or more Children | 15 (17.1%) | 0 (0.0%) |
| Total | 440 (3.5%) | 522 (12.7%) |
Race in Rockville
The most populous races in Rockville are White / Caucasian (33,216 | 49.5%), Asian (15,144 | 22.6%), and Hispanic or Latino (11,774 | 17.5%).
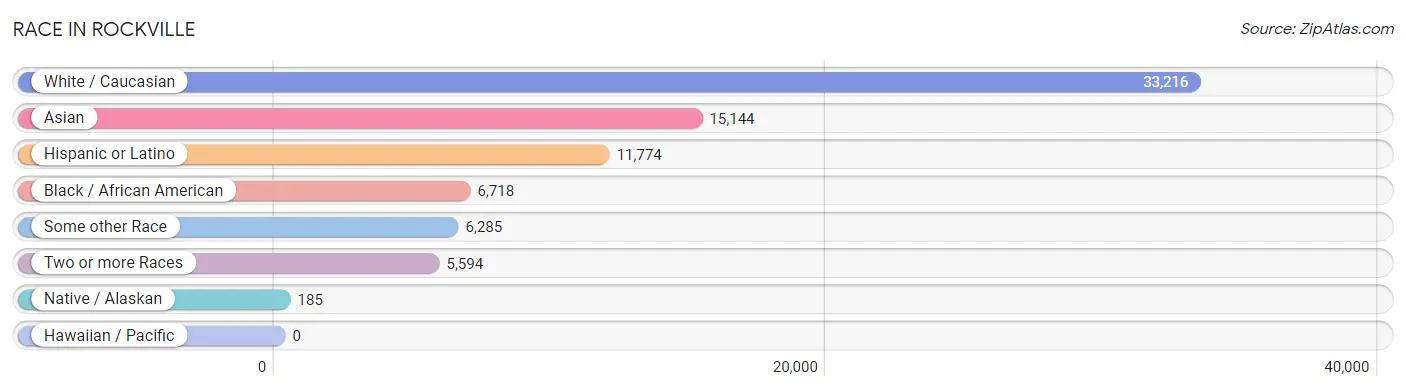
| Race | # Population | % Population |
| Asian | 15,144 | 22.6% |
| Black / African American | 6,718 | 10.0% |
| Hawaiian / Pacific | 0 | 0.0% |
| Hispanic or Latino | 11,774 | 17.5% |
| Native / Alaskan | 185 | 0.3% |
| White / Caucasian | 33,216 | 49.5% |
| Two or more Races | 5,594 | 8.3% |
| Some other Race | 6,285 | 9.4% |
| Total | 67,142 | 100.0% |
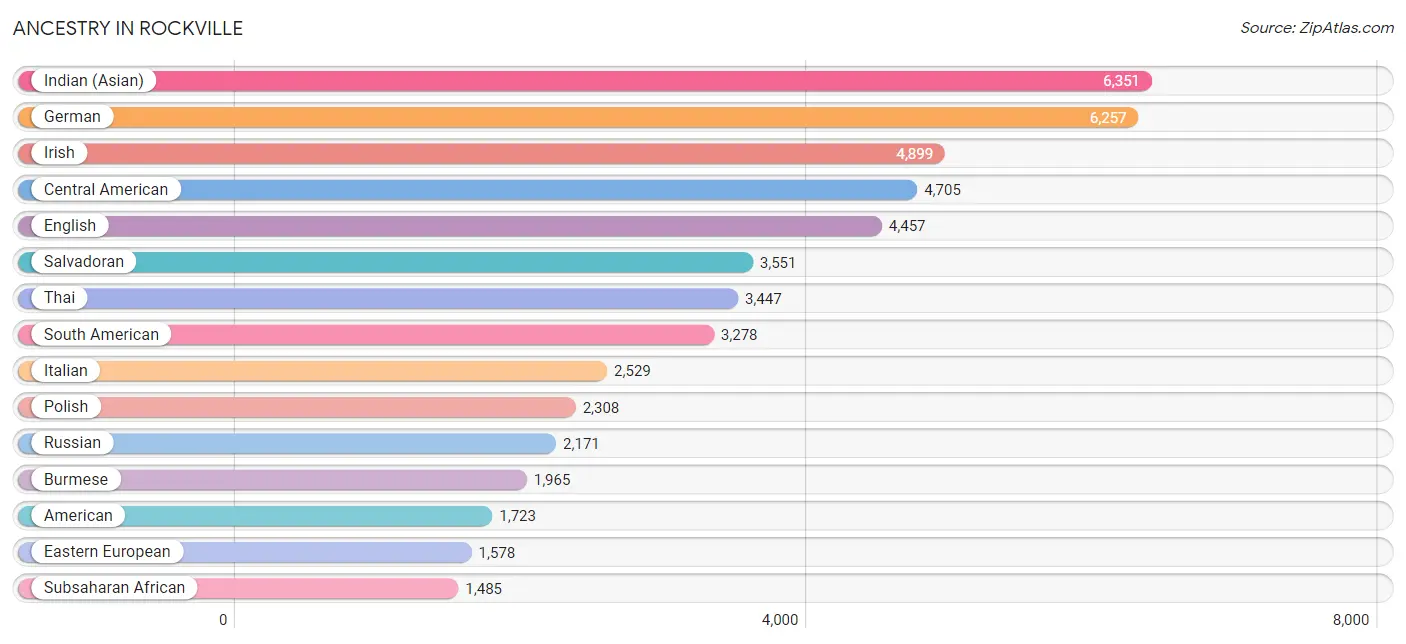
Ancestry in Rockville
The most populous ancestries reported in Rockville are Indian (Asian) (6,351 | 9.5%), German (6,257 | 9.3%), Irish (4,899 | 7.3%), Central American (4,705 | 7.0%), and English (4,457 | 6.6%), together accounting for 39.7% of all Rockville residents.
| Ancestry | # Population | % Population |
| Afghan | 22 | 0.0% |
| African | 287 | 0.4% |
| Albanian | 10 | 0.0% |
| American | 1,723 | 2.6% |
| Apache | 18 | 0.0% |
| Arab | 1,017 | 1.5% |
| Argentinean | 264 | 0.4% |
| Armenian | 192 | 0.3% |
| Assyrian / Chaldean / Syriac | 14 | 0.0% |
| Austrian | 270 | 0.4% |
| Barbadian | 4 | 0.0% |
| Belgian | 73 | 0.1% |
| Bermudan | 6 | 0.0% |
| Bhutanese | 465 | 0.7% |
| Blackfeet | 6 | 0.0% |
| Bolivian | 392 | 0.6% |
| Brazilian | 382 | 0.6% |
| British | 502 | 0.7% |
| British West Indian | 66 | 0.1% |
| Bulgarian | 55 | 0.1% |
| Burmese | 1,965 | 2.9% |
| Cajun | 16 | 0.0% |
| Canadian | 22 | 0.0% |
| Cape Verdean | 23 | 0.0% |
| Central American | 4,705 | 7.0% |
| Central American Indian | 83 | 0.1% |
| Cherokee | 91 | 0.1% |
| Chilean | 337 | 0.5% |
| Colombian | 389 | 0.6% |
| Costa Rican | 53 | 0.1% |
| Croatian | 36 | 0.1% |
| Cuban | 282 | 0.4% |
| Cypriot | 56 | 0.1% |
| Czech | 175 | 0.3% |
| Czechoslovakian | 53 | 0.1% |
| Danish | 106 | 0.2% |
| Dominican | 818 | 1.2% |
| Dutch | 335 | 0.5% |
| Eastern European | 1,578 | 2.4% |
| Ecuadorian | 163 | 0.2% |
| Egyptian | 221 | 0.3% |
| English | 4,457 | 6.6% |
| Ethiopian | 524 | 0.8% |
| European | 1,367 | 2.0% |
| Filipino | 412 | 0.6% |
| Finnish | 73 | 0.1% |
| French | 974 | 1.5% |
| French Canadian | 220 | 0.3% |
| German | 6,257 | 9.3% |
| Ghanaian | 60 | 0.1% |
| Greek | 426 | 0.6% |
| Guamanian / Chamorro | 22 | 0.0% |
| Guatemalan | 112 | 0.2% |
| Guyanese | 114 | 0.2% |
| Haitian | 168 | 0.3% |
| Honduran | 771 | 1.1% |
| Hungarian | 432 | 0.6% |
| Indian (Asian) | 6,351 | 9.5% |
| Indonesian | 141 | 0.2% |
| Iranian | 958 | 1.4% |
| Iraqi | 38 | 0.1% |
| Irish | 4,899 | 7.3% |
| Israeli | 370 | 0.5% |
| Italian | 2,529 | 3.8% |
| Jamaican | 315 | 0.5% |
| Japanese | 47 | 0.1% |
| Jordanian | 20 | 0.0% |
| Kenyan | 11 | 0.0% |
| Korean | 1,254 | 1.9% |
| Laotian | 491 | 0.7% |
| Latvian | 40 | 0.1% |
| Lebanese | 122 | 0.2% |
| Liberian | 54 | 0.1% |
| Lithuanian | 246 | 0.4% |
| Luxembourger | 7 | 0.0% |
| Malaysian | 32 | 0.1% |
| Mexican | 963 | 1.4% |
| Mexican American Indian | 56 | 0.1% |
| Mongolian | 16 | 0.0% |
| Moroccan | 94 | 0.1% |
| Navajo | 25 | 0.0% |
| New Zealander | 44 | 0.1% |
| Nicaraguan | 105 | 0.2% |
| Nigerian | 300 | 0.4% |
| Northern European | 410 | 0.6% |
| Norwegian | 205 | 0.3% |
| Pakistani | 249 | 0.4% |
| Palestinian | 24 | 0.0% |
| Panamanian | 87 | 0.1% |
| Paraguayan | 135 | 0.2% |
| Peruvian | 1,389 | 2.1% |
| Polish | 2,308 | 3.4% |
| Portuguese | 409 | 0.6% |
| Pueblo | 30 | 0.0% |
| Puerto Rican | 466 | 0.7% |
| Romanian | 195 | 0.3% |
| Russian | 2,171 | 3.2% |
| Salvadoran | 3,551 | 5.3% |
| Scandinavian | 93 | 0.1% |
| Scotch-Irish | 413 | 0.6% |
| Scottish | 1,251 | 1.9% |
| Serbian | 262 | 0.4% |
| Slavic | 56 | 0.1% |
| Slovak | 274 | 0.4% |
| Slovene | 15 | 0.0% |
| South American | 3,278 | 4.9% |
| South American Indian | 30 | 0.0% |
| Soviet Union | 23 | 0.0% |
| Spaniard | 259 | 0.4% |
| Spanish | 135 | 0.2% |
| Sri Lankan | 635 | 0.9% |
| Subsaharan African | 1,485 | 2.2% |
| Swedish | 357 | 0.5% |
| Swiss | 49 | 0.1% |
| Syrian | 321 | 0.5% |
| Taiwanese | 13 | 0.0% |
| Thai | 3,447 | 5.1% |
| Tongan | 164 | 0.2% |
| Trinidadian and Tobagonian | 220 | 0.3% |
| Turkish | 253 | 0.4% |
| Ugandan | 46 | 0.1% |
| Ukrainian | 461 | 0.7% |
| Venezuelan | 209 | 0.3% |
| Vietnamese | 124 | 0.2% |
| Welsh | 179 | 0.3% |
| West Indian | 219 | 0.3% |
| Yugoslavian | 32 | 0.1% | View All 127 Rows |
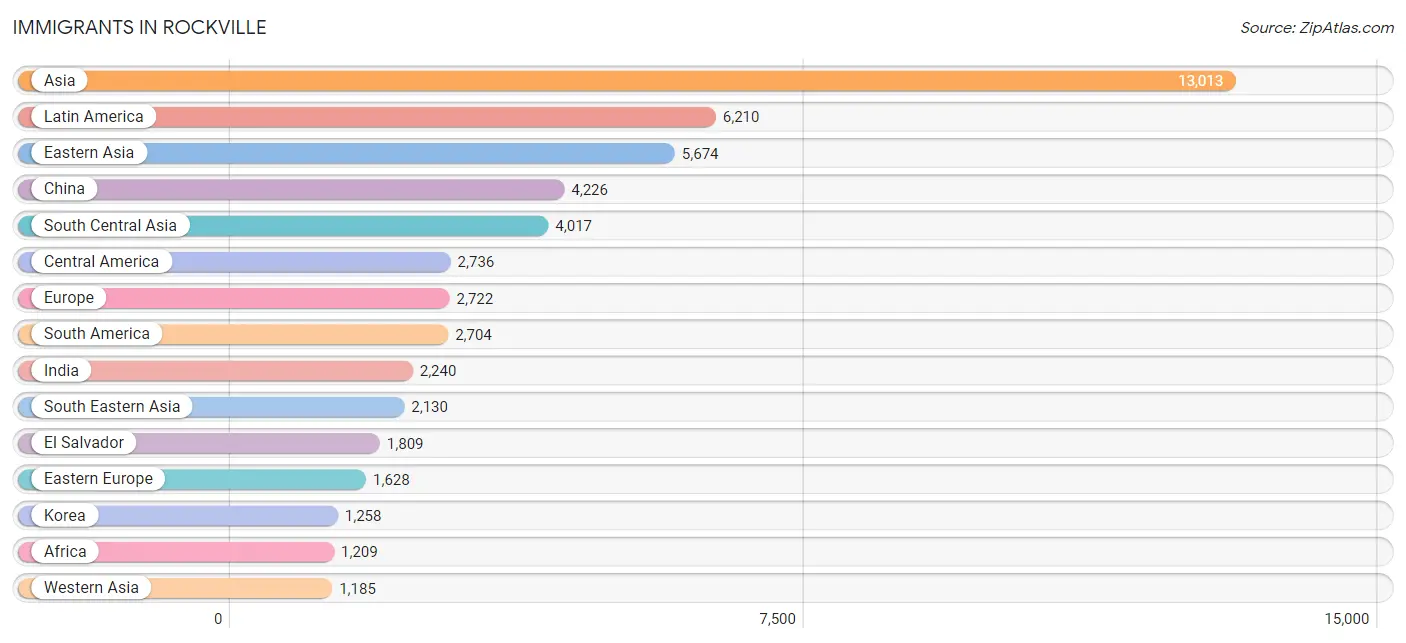
Immigrants in Rockville
The most numerous immigrant groups reported in Rockville came from Asia (13,013 | 19.4%), Latin America (6,210 | 9.2%), Eastern Asia (5,674 | 8.5%), China (4,226 | 6.3%), and South Central Asia (4,017 | 6.0%), together accounting for 49.4% of all Rockville residents.
| Immigration Origin | # Population | % Population |
| Afghanistan | 109 | 0.2% |
| Africa | 1,209 | 1.8% |
| Argentina | 207 | 0.3% |
| Asia | 13,013 | 19.4% |
| Bangladesh | 105 | 0.2% |
| Belarus | 56 | 0.1% |
| Belgium | 8 | 0.0% |
| Bolivia | 243 | 0.4% |
| Bosnia and Herzegovina | 57 | 0.1% |
| Brazil | 635 | 0.9% |
| Bulgaria | 46 | 0.1% |
| Cambodia | 17 | 0.0% |
| Cameroon | 64 | 0.1% |
| Canada | 134 | 0.2% |
| Caribbean | 770 | 1.1% |
| Central America | 2,736 | 4.1% |
| Chile | 190 | 0.3% |
| China | 4,226 | 6.3% |
| Colombia | 274 | 0.4% |
| Costa Rica | 50 | 0.1% |
| Croatia | 7 | 0.0% |
| Cuba | 69 | 0.1% |
| Czechoslovakia | 65 | 0.1% |
| Dominican Republic | 398 | 0.6% |
| Eastern Africa | 315 | 0.5% |
| Eastern Asia | 5,674 | 8.5% |
| Eastern Europe | 1,628 | 2.4% |
| Ecuador | 25 | 0.0% |
| Egypt | 198 | 0.3% |
| El Salvador | 1,809 | 2.7% |
| England | 54 | 0.1% |
| Eritrea | 32 | 0.1% |
| Ethiopia | 209 | 0.3% |
| Europe | 2,722 | 4.1% |
| France | 210 | 0.3% |
| Germany | 208 | 0.3% |
| Ghana | 120 | 0.2% |
| Greece | 187 | 0.3% |
| Guatemala | 132 | 0.2% |
| Guyana | 119 | 0.2% |
| Haiti | 31 | 0.1% |
| Honduras | 422 | 0.6% |
| Hong Kong | 215 | 0.3% |
| Hungary | 32 | 0.1% |
| India | 2,240 | 3.3% |
| Indonesia | 504 | 0.7% |
| Iran | 1,028 | 1.5% |
| Iraq | 10 | 0.0% |
| Ireland | 12 | 0.0% |
| Israel | 432 | 0.6% |
| Italy | 81 | 0.1% |
| Jamaica | 111 | 0.2% |
| Japan | 190 | 0.3% |
| Korea | 1,258 | 1.9% |
| Laos | 12 | 0.0% |
| Latin America | 6,210 | 9.2% |
| Latvia | 29 | 0.0% |
| Lebanon | 79 | 0.1% |
| Liberia | 35 | 0.1% |
| Lithuania | 30 | 0.0% |
| Malaysia | 76 | 0.1% |
| Mexico | 204 | 0.3% |
| Middle Africa | 78 | 0.1% |
| Moldova | 14 | 0.0% |
| Morocco | 48 | 0.1% |
| Nepal | 144 | 0.2% |
| Netherlands | 25 | 0.0% |
| Nicaragua | 65 | 0.1% |
| Nigeria | 42 | 0.1% |
| Northern Africa | 256 | 0.4% |
| Northern Europe | 220 | 0.3% |
| Oceania | 51 | 0.1% |
| Pakistan | 296 | 0.4% |
| Panama | 54 | 0.1% |
| Peru | 671 | 1.0% |
| Philippines | 679 | 1.0% |
| Poland | 54 | 0.1% |
| Portugal | 64 | 0.1% |
| Romania | 67 | 0.1% |
| Russia | 677 | 1.0% |
| Saudi Arabia | 37 | 0.1% |
| Serbia | 92 | 0.1% |
| Sierra Leone | 12 | 0.0% |
| Singapore | 90 | 0.1% |
| South Africa | 100 | 0.2% |
| South America | 2,704 | 4.0% |
| South Central Asia | 4,017 | 6.0% |
| South Eastern Asia | 2,130 | 3.2% |
| Southern Europe | 405 | 0.6% |
| Spain | 73 | 0.1% |
| Sri Lanka | 28 | 0.0% |
| Sudan | 8 | 0.0% |
| Sweden | 11 | 0.0% |
| Switzerland | 18 | 0.0% |
| Syria | 156 | 0.2% |
| Taiwan | 714 | 1.1% |
| Thailand | 140 | 0.2% |
| Trinidad and Tobago | 143 | 0.2% |
| Turkey | 146 | 0.2% |
| Uganda | 61 | 0.1% |
| Ukraine | 292 | 0.4% |
| Uzbekistan | 67 | 0.1% |
| Venezuela | 227 | 0.3% |
| Vietnam | 505 | 0.7% |
| Western Africa | 414 | 0.6% |
| Western Asia | 1,185 | 1.8% |
| Western Europe | 469 | 0.7% | View All 107 Rows |
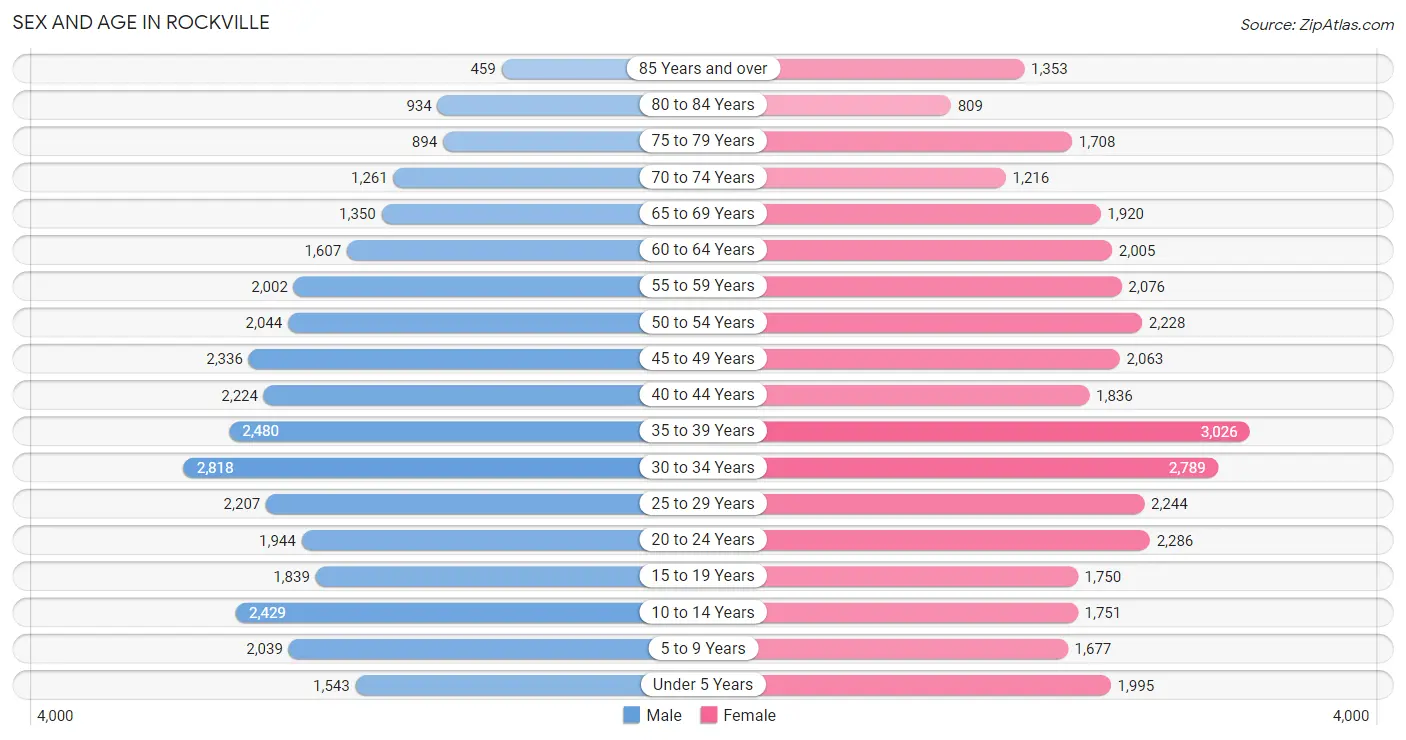
Sex and Age in Rockville
Sex and Age in Rockville
The most populous age groups in Rockville are 30 to 34 Years (2,818 | 8.7%) for men and 35 to 39 Years (3,026 | 8.7%) for women.
| Age Bracket | Male | Female |
| Under 5 Years | 1,543 (4.8%) | 1,995 (5.7%) |
| 5 to 9 Years | 2,039 (6.3%) | 1,677 (4.8%) |
| 10 to 14 Years | 2,429 (7.5%) | 1,751 (5.0%) |
| 15 to 19 Years | 1,839 (5.7%) | 1,750 (5.0%) |
| 20 to 24 Years | 1,944 (6.0%) | 2,286 (6.6%) |
| 25 to 29 Years | 2,207 (6.8%) | 2,244 (6.5%) |
| 30 to 34 Years | 2,818 (8.7%) | 2,789 (8.0%) |
| 35 to 39 Years | 2,480 (7.6%) | 3,026 (8.7%) |
| 40 to 44 Years | 2,224 (6.9%) | 1,836 (5.3%) |
| 45 to 49 Years | 2,336 (7.2%) | 2,063 (5.9%) |
| 50 to 54 Years | 2,044 (6.3%) | 2,228 (6.4%) |
| 55 to 59 Years | 2,002 (6.2%) | 2,076 (6.0%) |
| 60 to 64 Years | 1,607 (5.0%) | 2,005 (5.8%) |
| 65 to 69 Years | 1,350 (4.2%) | 1,920 (5.5%) |
| 70 to 74 Years | 1,261 (3.9%) | 1,216 (3.5%) |
| 75 to 79 Years | 894 (2.8%) | 1,708 (4.9%) |
| 80 to 84 Years | 934 (2.9%) | 809 (2.3%) |
| 85 Years and over | 459 (1.4%) | 1,353 (3.9%) |
| Total | 32,410 (100.0%) | 34,732 (100.0%) |
Families and Households in Rockville
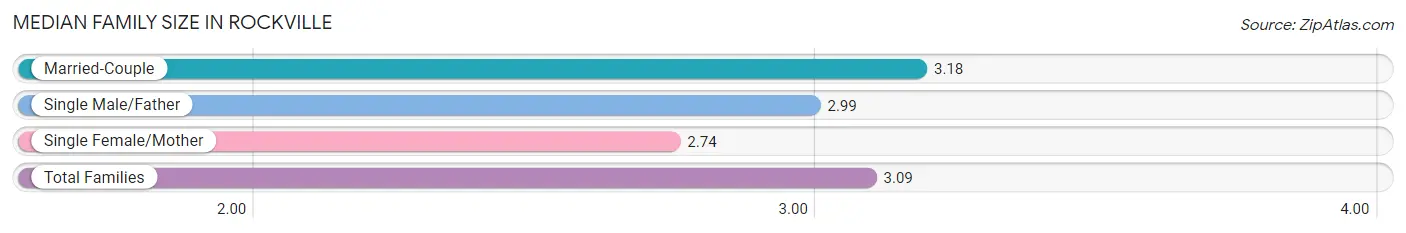
Median Family Size in Rockville
The median family size in Rockville is 3.09 persons per family, with married-couple families (12,715 | 75.5%) accounting for the largest median family size of 3.18 persons per family. On the other hand, single female/mother families (2,823 | 16.8%) represent the smallest median family size with 2.74 persons per family.
| Family Type | # Families | Family Size |
| Married-Couple | 12,715 (75.5%) | 3.18 |
| Single Male/Father | 1,292 (7.7%) | 2.99 |
| Single Female/Mother | 2,823 (16.8%) | 2.74 |
| Total Families | 16,830 (100.0%) | 3.09 |
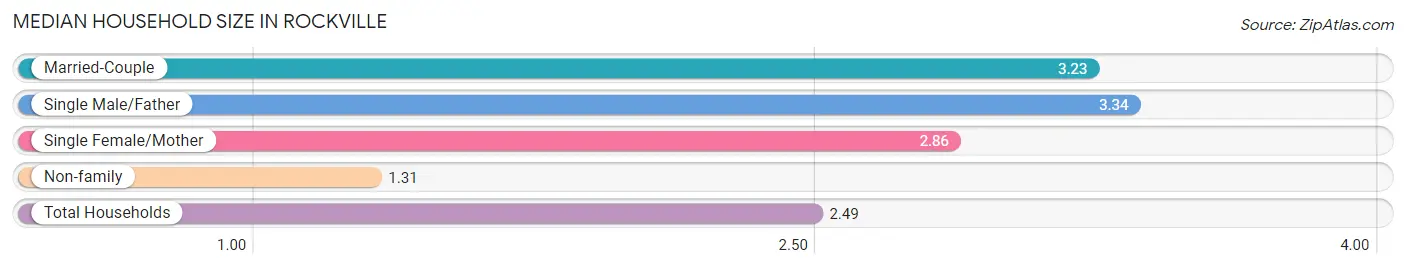
Median Household Size in Rockville
The median household size in Rockville is 2.49 persons per household, with single male/father households (1,292 | 4.9%) accounting for the largest median household size of 3.34 persons per household. non-family households (9,713 | 36.6%) represent the smallest median household size with 1.31 persons per household.
| Household Type | # Households | Household Size |
| Married-Couple | 12,715 (47.9%) | 3.23 |
| Single Male/Father | 1,292 (4.9%) | 3.34 |
| Single Female/Mother | 2,823 (10.6%) | 2.86 |
| Non-family | 9,713 (36.6%) | 1.31 |
| Total Households | 26,543 (100.0%) | 2.49 |
Household Size by Marriage Status in Rockville
Out of a total of 26,543 households in Rockville, 16,830 (63.4%) are family households, while 9,713 (36.6%) are nonfamily households. The most numerous type of family households are 2-person households, comprising 7,141, and the most common type of nonfamily households are 1-person households, comprising 7,586.
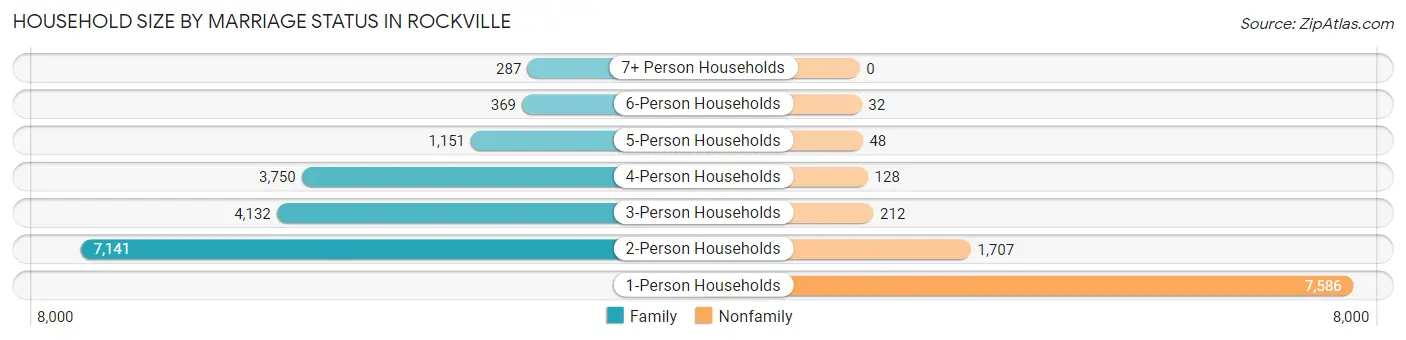
| Household Size | Family Households | Nonfamily Households |
| 1-Person Households | - | 7,586 (28.6%) |
| 2-Person Households | 7,141 (26.9%) | 1,707 (6.4%) |
| 3-Person Households | 4,132 (15.6%) | 212 (0.8%) |
| 4-Person Households | 3,750 (14.1%) | 128 (0.5%) |
| 5-Person Households | 1,151 (4.3%) | 48 (0.2%) |
| 6-Person Households | 369 (1.4%) | 32 (0.1%) |
| 7+ Person Households | 287 (1.1%) | 0 (0.0%) |
| Total | 16,830 (63.4%) | 9,713 (36.6%) |
Female Fertility in Rockville
Fertility by Age in Rockville
Average fertility rate in Rockville is 52.0 births per 1,000 women. Women in the age bracket of 20 to 34 years have the highest fertility rate with 87.0 births per 1,000 women. Women in the age bracket of 20 to 34 years acount for 73.6% of all women with births.
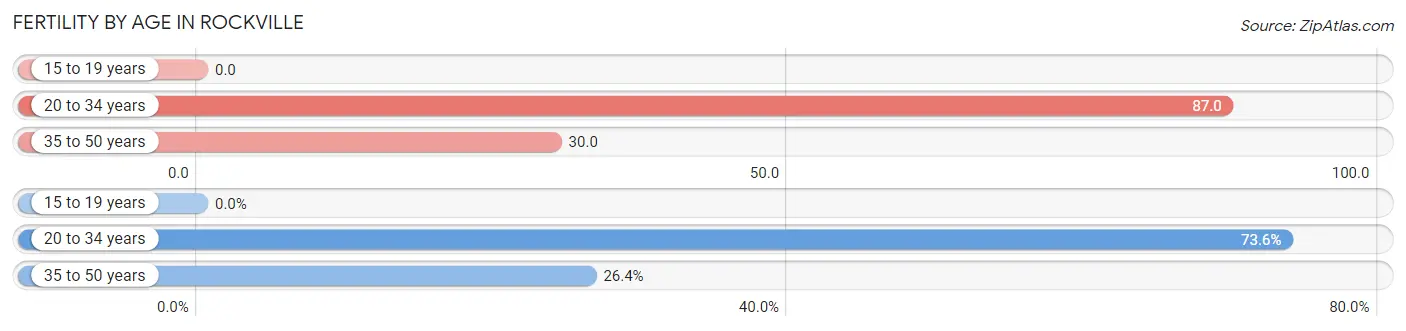
| Age Bracket | Women with Births | Births / 1,000 Women |
| 15 to 19 years | 0 (0.0%) | 0.0 |
| 20 to 34 years | 637 (73.6%) | 87.0 |
| 35 to 50 years | 228 (26.4%) | 30.0 |
| Total | 865 (100.0%) | 52.0 |
Fertility by Age by Marriage Status in Rockville
65.8% of women with births (865) in Rockville are married. The highest percentage of unmarried women with births falls into 20 to 34 years age bracket with 40.5% of them unmarried at the time of birth, while the lowest percentage of unmarried women with births belong to 35 to 50 years age bracket with 16.7% of them unmarried.
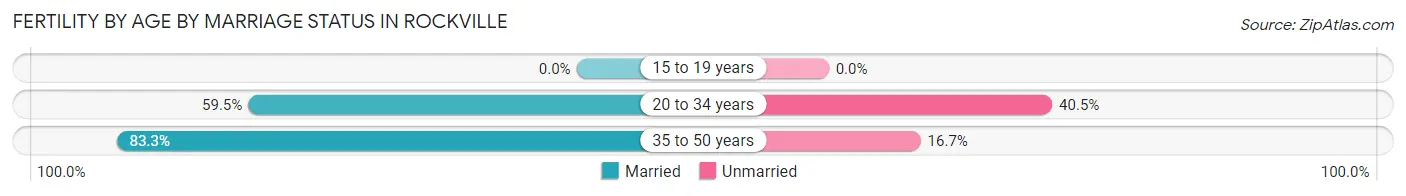
| Age Bracket | Married | Unmarried |
| 15 to 19 years | 0 (0.0%) | 0 (0.0%) |
| 20 to 34 years | 379 (59.5%) | 258 (40.5%) |
| 35 to 50 years | 190 (83.3%) | 38 (16.7%) |
| Total | 569 (65.8%) | 296 (34.2%) |
Fertility by Education in Rockville
Average fertility rate in Rockville is 52.0 births per 1,000 women. Women with the education attainment of high school diploma have the highest fertility rate of 66.0 births per 1,000 women, while women with the education attainment of less than high school have the lowest fertility at 31.0 births per 1,000 women. Women with the education attainment of graduate degree represent 40.1% of all women with births.
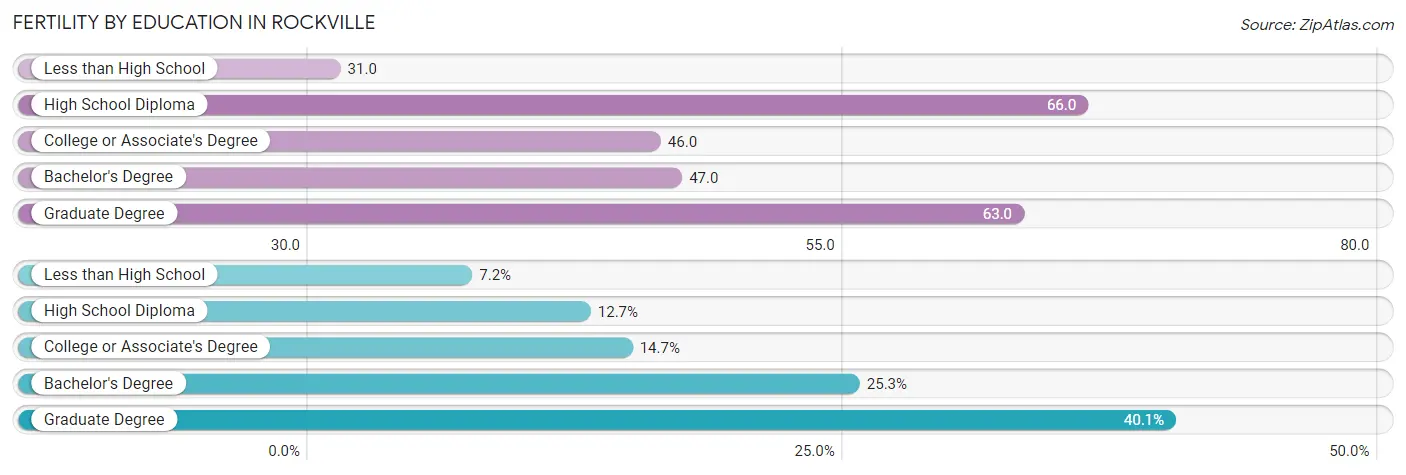
| Educational Attainment | Women with Births | Births / 1,000 Women |
| Less than High School | 62 (7.2%) | 31.0 |
| High School Diploma | 110 (12.7%) | 66.0 |
| College or Associate's Degree | 127 (14.7%) | 46.0 |
| Bachelor's Degree | 219 (25.3%) | 47.0 |
| Graduate Degree | 347 (40.1%) | 63.0 |
| Total | 865 (100.0%) | 52.0 |
Fertility by Education by Marriage Status in Rockville
34.2% of women with births in Rockville are unmarried. Women with the educational attainment of graduate degree are most likely to be married with 100.0% of them married at childbirth, while women with the educational attainment of less than high school are least likely to be married with 100.0% of them unmarried at childbirth.
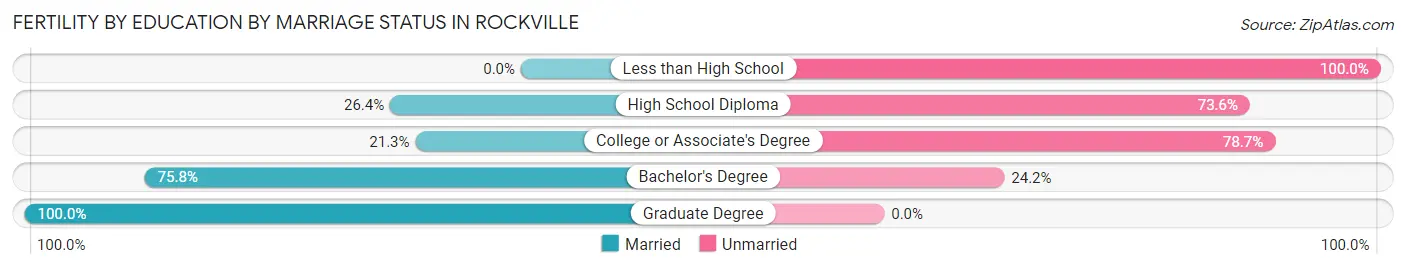
| Educational Attainment | Married | Unmarried |
| Less than High School | 0 (0.0%) | 62 (100.0%) |
| High School Diploma | 29 (26.4%) | 81 (73.6%) |
| College or Associate's Degree | 27 (21.3%) | 100 (78.7%) |
| Bachelor's Degree | 166 (75.8%) | 53 (24.2%) |
| Graduate Degree | 347 (100.0%) | 0 (0.0%) |
| Total | 569 (65.8%) | 296 (34.2%) |
Employment Characteristics in Rockville
Employment by Class of Employer in Rockville
Among the 35,855 employed individuals in Rockville, private company employees (18,819 | 52.5%), federal government employees (6,725 | 18.8%), and not-for-profit organizations (4,033 | 11.3%) make up the most common classes of employment.
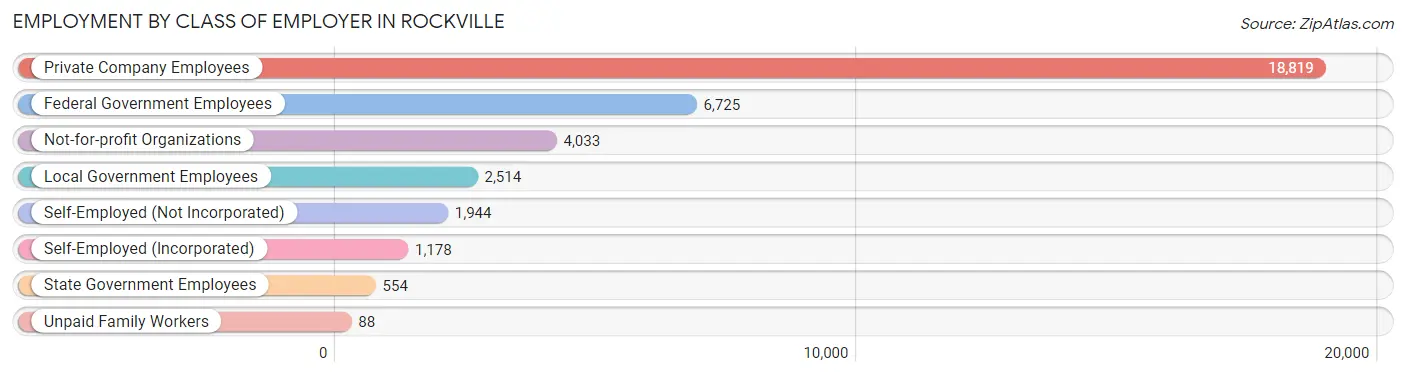
| Employer Class | # Employees | % Employees |
| Private Company Employees | 18,819 | 52.5% |
| Self-Employed (Incorporated) | 1,178 | 3.3% |
| Self-Employed (Not Incorporated) | 1,944 | 5.4% |
| Not-for-profit Organizations | 4,033 | 11.3% |
| Local Government Employees | 2,514 | 7.0% |
| State Government Employees | 554 | 1.5% |
| Federal Government Employees | 6,725 | 18.8% |
| Unpaid Family Workers | 88 | 0.3% |
| Total | 35,855 | 100.0% |
Employment Status by Age in Rockville
According to the labor force statistics for Rockville, out of the total population over 16 years of age (55,078), 68.5% or 37,728 individuals are in the labor force, with 3.6% or 1,358 of them unemployed. The age group with the highest labor force participation rate is 45 to 54 years, with 89.9% or 7,795 individuals in the labor force. Within the labor force, the 75 years and over age range has the highest percentage of unemployed individuals, with 10.5% or 61 of them being unemployed.
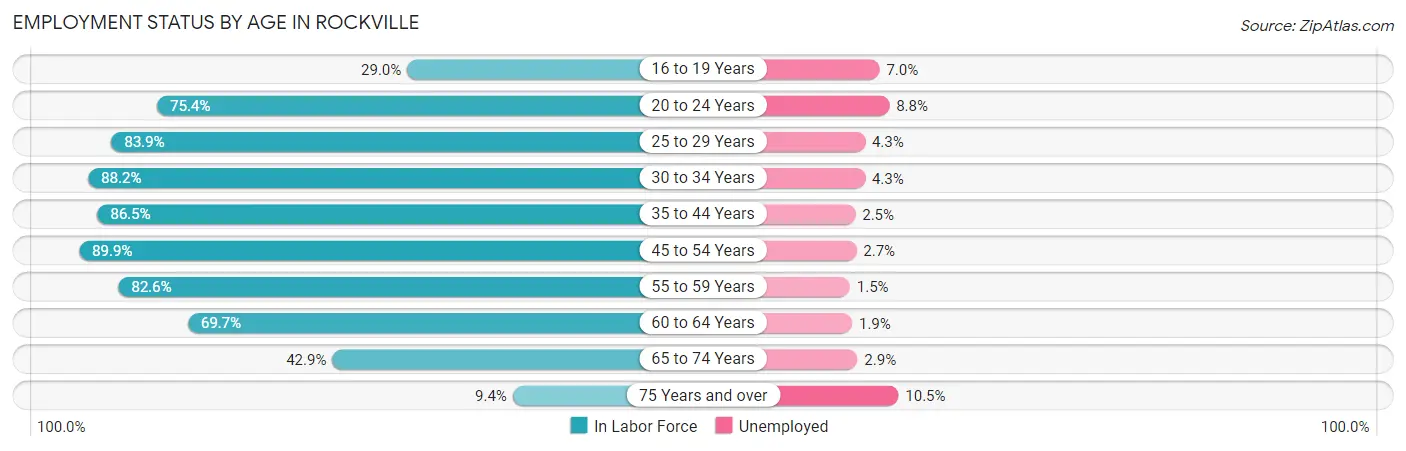
| Age Bracket | In Labor Force | Unemployed |
| 16 to 19 Years | 858 (29.0%) | 60 (7.0%) |
| 20 to 24 Years | 3,189 (75.4%) | 281 (8.8%) |
| 25 to 29 Years | 3,734 (83.9%) | 161 (4.3%) |
| 30 to 34 Years | 4,945 (88.2%) | 213 (4.3%) |
| 35 to 44 Years | 8,275 (86.5%) | 207 (2.5%) |
| 45 to 54 Years | 7,795 (89.9%) | 210 (2.7%) |
| 55 to 59 Years | 3,368 (82.6%) | 51 (1.5%) |
| 60 to 64 Years | 2,518 (69.7%) | 48 (1.9%) |
| 65 to 74 Years | 2,465 (42.9%) | 71 (2.9%) |
| 75 Years and over | 579 (9.4%) | 61 (10.5%) |
| Total | 37,728 (68.5%) | 1,358 (3.6%) |
Employment Status by Educational Attainment in Rockville
According to labor force statistics for Rockville, 85.1% of individuals (30,623) out of the total population between 25 and 64 years of age (35,985) are in the labor force, with 2.9% or 888 of them being unemployed. The group with the highest labor force participation rate are those with the educational attainment of bachelor's degree or higher, with 88.3% or 21,372 individuals in the labor force. Within the labor force, individuals with high school diploma education have the highest percentage of unemployment, with 3.8% or 93 of them being unemployed.
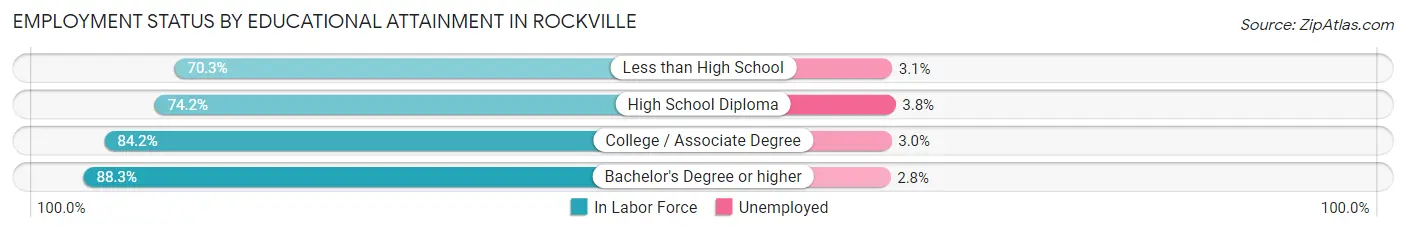
| Educational Attainment | In Labor Force | Unemployed |
| Less than High School | 1,636 (70.3%) | 72 (3.1%) |
| High School Diploma | 2,453 (74.2%) | 126 (3.8%) |
| College / Associate Degree | 5,177 (84.2%) | 184 (3.0%) |
| Bachelor's Degree or higher | 21,372 (88.3%) | 678 (2.8%) |
| Total | 30,623 (85.1%) | 1,044 (2.9%) |
Employment Occupations by Sex in Rockville
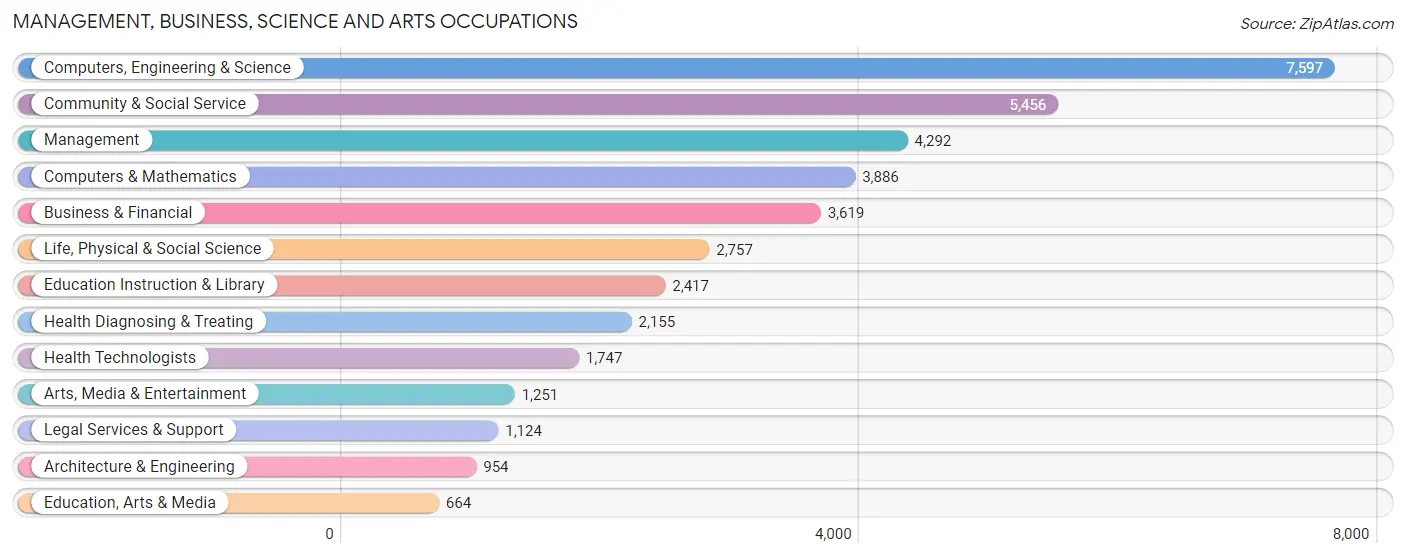
Management, Business, Science and Arts Occupations
The most common Management, Business, Science and Arts occupations in Rockville are Computers, Engineering & Science (7,597 | 21.1%), Community & Social Service (5,456 | 15.2%), Management (4,292 | 11.9%), Computers & Mathematics (3,886 | 10.8%), and Business & Financial (3,619 | 10.1%).
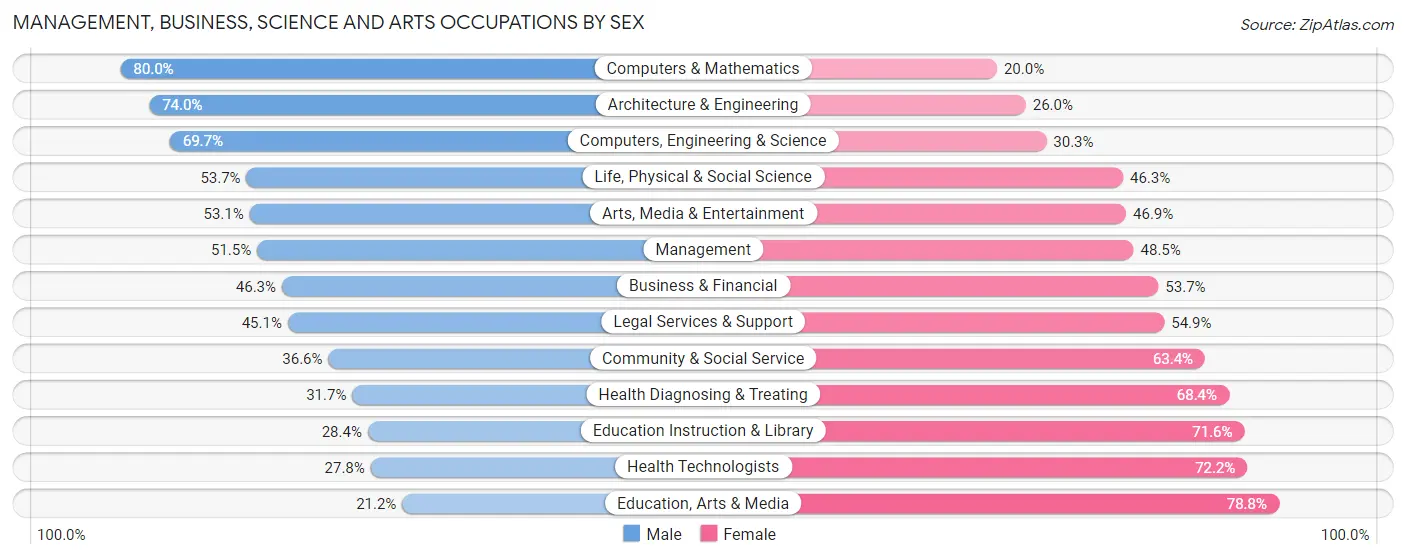
Management, Business, Science and Arts Occupations by Sex
Within the Management, Business, Science and Arts occupations in Rockville, the most male-oriented occupations are Computers & Mathematics (80.0%), Architecture & Engineering (74.0%), and Computers, Engineering & Science (69.7%), while the most female-oriented occupations are Education, Arts & Media (78.8%), Health Technologists (72.2%), and Education Instruction & Library (71.6%).
| Occupation | Male | Female |
| Management | 2,211 (51.5%) | 2,081 (48.5%) |
| Business & Financial | 1,677 (46.3%) | 1,942 (53.7%) |
| Computers, Engineering & Science | 5,296 (69.7%) | 2,301 (30.3%) |
| Computers & Mathematics | 3,109 (80.0%) | 777 (20.0%) |
| Architecture & Engineering | 706 (74.0%) | 248 (26.0%) |
| Life, Physical & Social Science | 1,481 (53.7%) | 1,276 (46.3%) |
| Community & Social Service | 1,999 (36.6%) | 3,457 (63.4%) |
| Education, Arts & Media | 141 (21.2%) | 523 (78.8%) |
| Legal Services & Support | 507 (45.1%) | 617 (54.9%) |
| Education Instruction & Library | 687 (28.4%) | 1,730 (71.6%) |
| Arts, Media & Entertainment | 664 (53.1%) | 587 (46.9%) |
| Health Diagnosing & Treating | 682 (31.7%) | 1,473 (68.3%) |
| Health Technologists | 486 (27.8%) | 1,261 (72.2%) |
| Total (Category) | 11,865 (51.3%) | 11,254 (48.7%) |
| Total (Overall) | 18,645 (51.8%) | 17,319 (48.2%) |
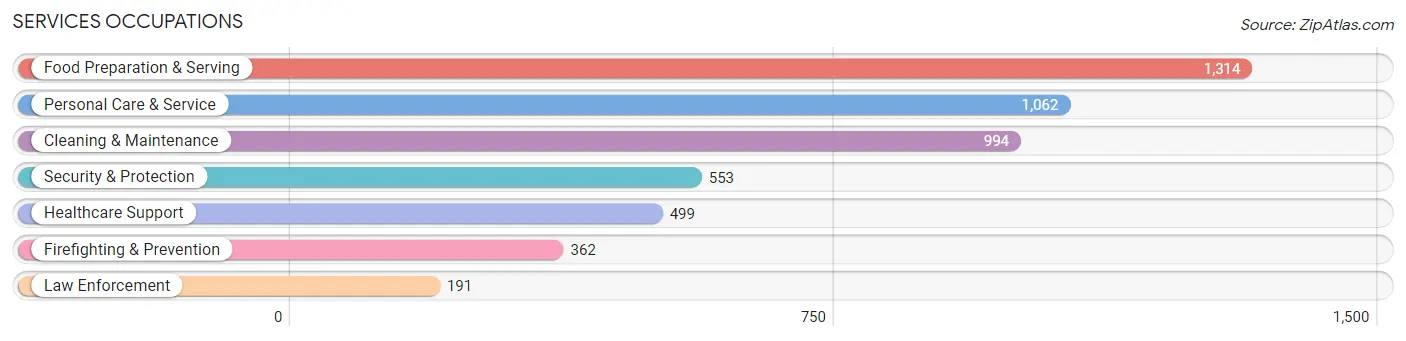
Services Occupations
The most common Services occupations in Rockville are Food Preparation & Serving (1,314 | 3.6%), Personal Care & Service (1,062 | 2.9%), Cleaning & Maintenance (994 | 2.8%), Security & Protection (553 | 1.5%), and Healthcare Support (499 | 1.4%).
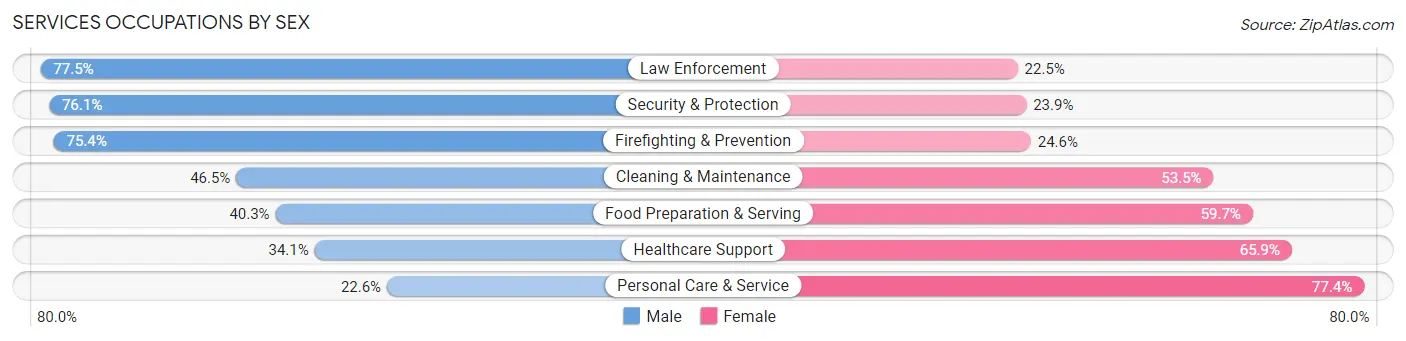
Services Occupations by Sex
Within the Services occupations in Rockville, the most male-oriented occupations are Law Enforcement (77.5%), Security & Protection (76.1%), and Firefighting & Prevention (75.4%), while the most female-oriented occupations are Personal Care & Service (77.4%), Healthcare Support (65.9%), and Food Preparation & Serving (59.7%).
| Occupation | Male | Female |
| Healthcare Support | 170 (34.1%) | 329 (65.9%) |
| Security & Protection | 421 (76.1%) | 132 (23.9%) |
| Firefighting & Prevention | 273 (75.4%) | 89 (24.6%) |
| Law Enforcement | 148 (77.5%) | 43 (22.5%) |
| Food Preparation & Serving | 529 (40.3%) | 785 (59.7%) |
| Cleaning & Maintenance | 462 (46.5%) | 532 (53.5%) |
| Personal Care & Service | 240 (22.6%) | 822 (77.4%) |
| Total (Category) | 1,822 (41.2%) | 2,600 (58.8%) |
| Total (Overall) | 18,645 (51.8%) | 17,319 (48.2%) |
Sales and Office Occupations
The most common Sales and Office occupations in Rockville are Sales & Related (2,597 | 7.2%), and Office & Administration (2,375 | 6.6%).

Sales and Office Occupations by Sex
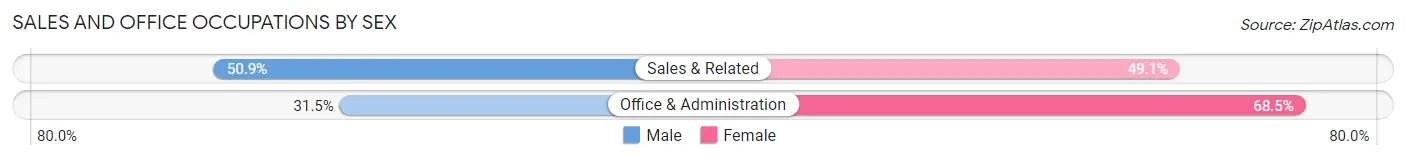
| Occupation | Male | Female |
| Sales & Related | 1,321 (50.9%) | 1,276 (49.1%) |
| Office & Administration | 749 (31.5%) | 1,626 (68.5%) |
| Total (Category) | 2,070 (41.6%) | 2,902 (58.4%) |
| Total (Overall) | 18,645 (51.8%) | 17,319 (48.2%) |
Natural Resources, Construction and Maintenance Occupations
The most common Natural Resources, Construction and Maintenance occupations in Rockville are Construction & Extraction (1,217 | 3.4%), Installation, Maintenance & Repair (683 | 1.9%), and Farming, Fishing & Forestry (47 | 0.1%).

Natural Resources, Construction and Maintenance Occupations by Sex
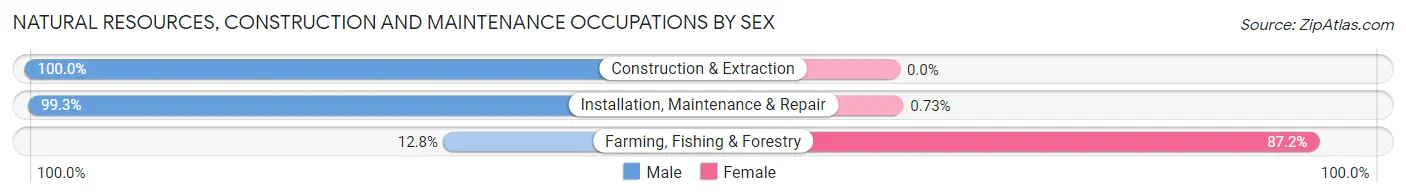
| Occupation | Male | Female |
| Farming, Fishing & Forestry | 6 (12.8%) | 41 (87.2%) |
| Construction & Extraction | 1,217 (100.0%) | 0 (0.0%) |
| Installation, Maintenance & Repair | 678 (99.3%) | 5 (0.7%) |
| Total (Category) | 1,901 (97.6%) | 46 (2.4%) |
| Total (Overall) | 18,645 (51.8%) | 17,319 (48.2%) |
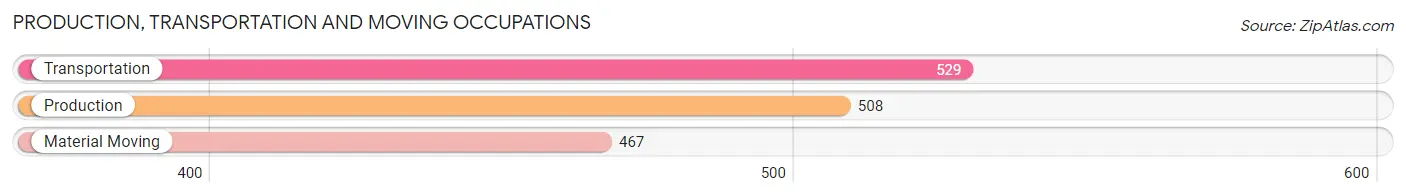
Production, Transportation and Moving Occupations
The most common Production, Transportation and Moving occupations in Rockville are Transportation (529 | 1.5%), Production (508 | 1.4%), and Material Moving (467 | 1.3%).
Production, Transportation and Moving Occupations by Sex
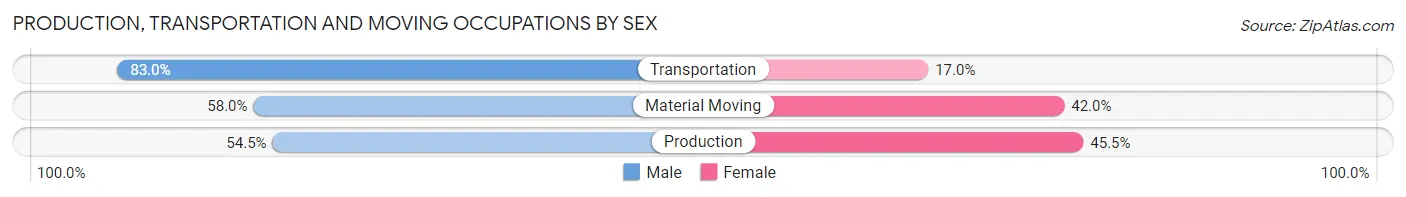
| Occupation | Male | Female |
| Production | 277 (54.5%) | 231 (45.5%) |
| Transportation | 439 (83.0%) | 90 (17.0%) |
| Material Moving | 271 (58.0%) | 196 (42.0%) |
| Total (Category) | 987 (65.6%) | 517 (34.4%) |
| Total (Overall) | 18,645 (51.8%) | 17,319 (48.2%) |
Employment Industries by Sex in Rockville
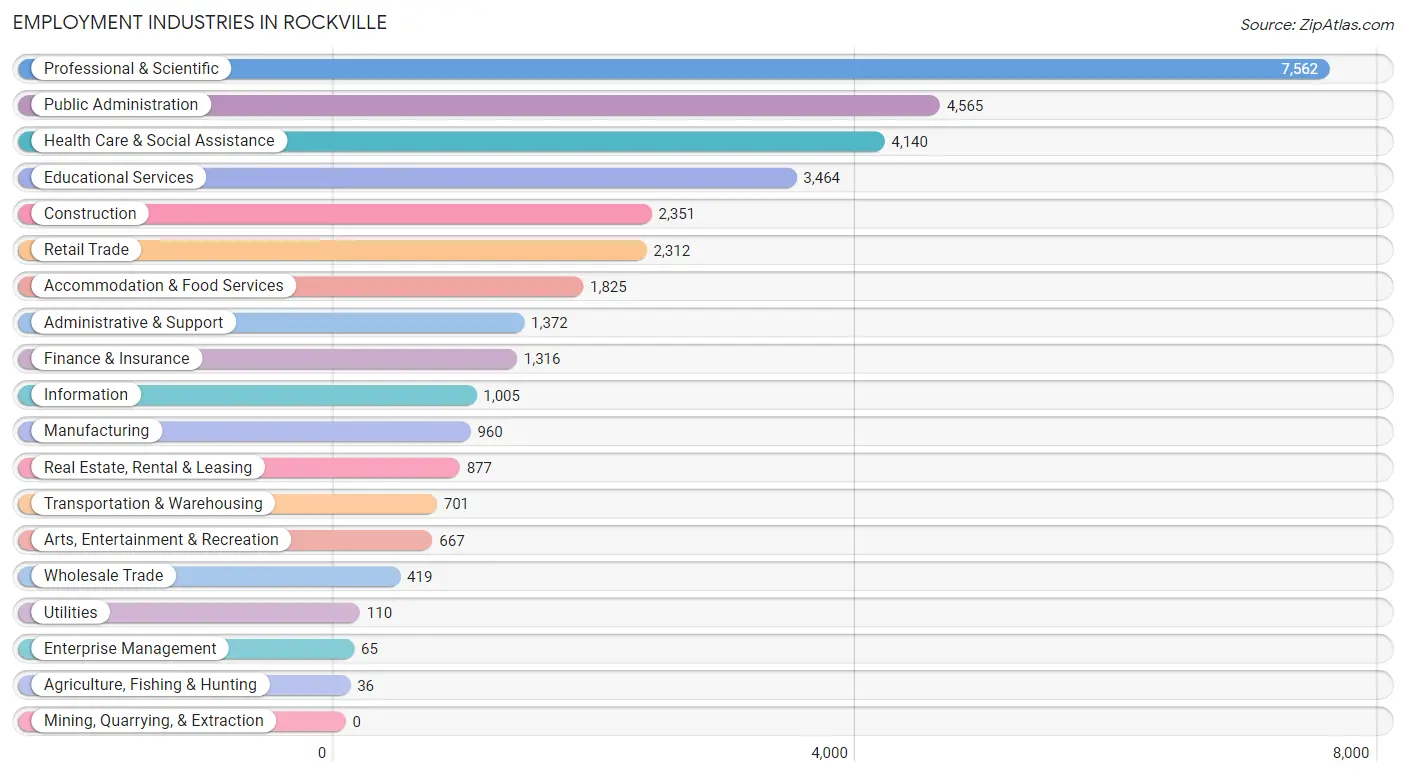
Employment Industries in Rockville
The major employment industries in Rockville include Professional & Scientific (7,562 | 21.0%), Public Administration (4,565 | 12.7%), Health Care & Social Assistance (4,140 | 11.5%), Educational Services (3,464 | 9.6%), and Construction (2,351 | 6.5%).
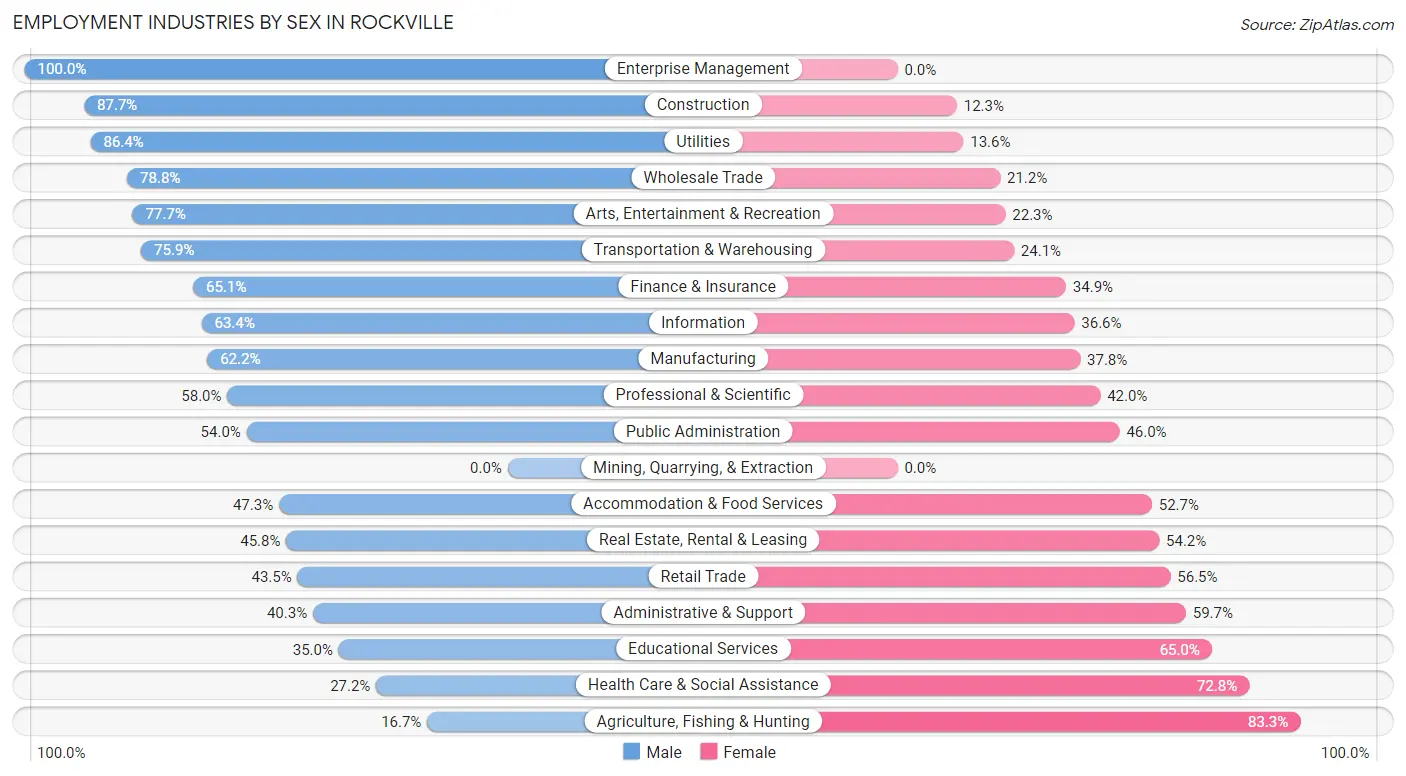
Employment Industries by Sex in Rockville
The Rockville industries that see more men than women are Enterprise Management (100.0%), Construction (87.7%), and Utilities (86.4%), whereas the industries that tend to have a higher number of women are Agriculture, Fishing & Hunting (83.3%), Health Care & Social Assistance (72.8%), and Educational Services (65.0%).
| Industry | Male | Female |
| Agriculture, Fishing & Hunting | 6 (16.7%) | 30 (83.3%) |
| Mining, Quarrying, & Extraction | 0 (0.0%) | 0 (0.0%) |
| Construction | 2,062 (87.7%) | 289 (12.3%) |
| Manufacturing | 597 (62.2%) | 363 (37.8%) |
| Wholesale Trade | 330 (78.8%) | 89 (21.2%) |
| Retail Trade | 1,006 (43.5%) | 1,306 (56.5%) |
| Transportation & Warehousing | 532 (75.9%) | 169 (24.1%) |
| Utilities | 95 (86.4%) | 15 (13.6%) |
| Information | 637 (63.4%) | 368 (36.6%) |
| Finance & Insurance | 857 (65.1%) | 459 (34.9%) |
| Real Estate, Rental & Leasing | 402 (45.8%) | 475 (54.2%) |
| Professional & Scientific | 4,388 (58.0%) | 3,174 (42.0%) |
| Enterprise Management | 65 (100.0%) | 0 (0.0%) |
| Administrative & Support | 553 (40.3%) | 819 (59.7%) |
| Educational Services | 1,211 (35.0%) | 2,253 (65.0%) |
| Health Care & Social Assistance | 1,127 (27.2%) | 3,013 (72.8%) |
| Arts, Entertainment & Recreation | 518 (77.7%) | 149 (22.3%) |
| Accommodation & Food Services | 864 (47.3%) | 961 (52.7%) |
| Public Administration | 2,467 (54.0%) | 2,098 (46.0%) |
| Total | 18,645 (51.8%) | 17,319 (48.2%) |
Education in Rockville
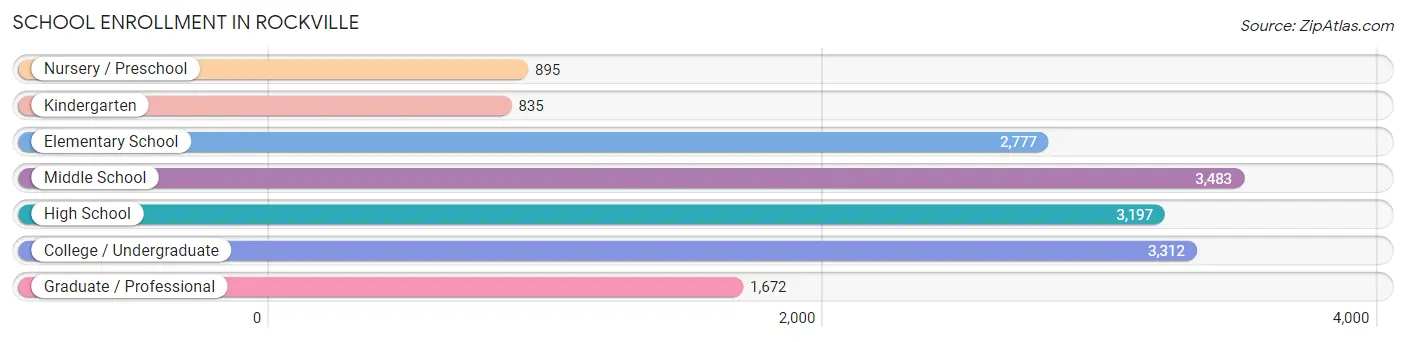
School Enrollment in Rockville
The most common levels of schooling among the 16,171 students in Rockville are middle school (3,483 | 21.5%), college / undergraduate (3,312 | 20.5%), and high school (3,197 | 19.8%).
| School Level | # Students | % Students |
| Nursery / Preschool | 895 | 5.5% |
| Kindergarten | 835 | 5.2% |
| Elementary School | 2,777 | 17.2% |
| Middle School | 3,483 | 21.5% |
| High School | 3,197 | 19.8% |
| College / Undergraduate | 3,312 | 20.5% |
| Graduate / Professional | 1,672 | 10.3% |
| Total | 16,171 | 100.0% |
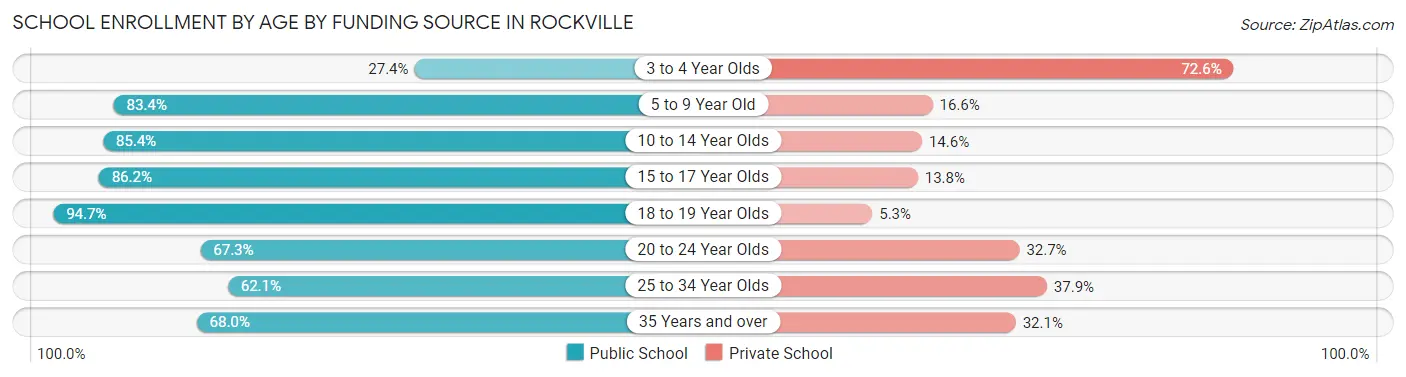
School Enrollment by Age by Funding Source in Rockville
Out of a total of 16,171 students who are enrolled in schools in Rockville, 3,606 (22.3%) attend a private institution, while the remaining 12,565 (77.7%) are enrolled in public schools. The age group of 3 to 4 year olds has the highest likelihood of being enrolled in private schools, with 514 (72.6% in the age bracket) enrolled. Conversely, the age group of 18 to 19 year olds has the lowest likelihood of being enrolled in a private school, with 1,101 (94.7% in the age bracket) attending a public institution.
| Age Bracket | Public School | Private School |
| 3 to 4 Year Olds | 194 (27.4%) | 514 (72.6%) |
| 5 to 9 Year Old | 2,830 (83.4%) | 562 (16.6%) |
| 10 to 14 Year Olds | 3,488 (85.4%) | 596 (14.6%) |
| 15 to 17 Year Olds | 2,003 (86.2%) | 321 (13.8%) |
| 18 to 19 Year Olds | 1,101 (94.7%) | 62 (5.3%) |
| 20 to 24 Year Olds | 1,138 (67.3%) | 554 (32.7%) |
| 25 to 34 Year Olds | 1,016 (62.1%) | 619 (37.9%) |
| 35 Years and over | 797 (67.9%) | 376 (32.1%) |
| Total | 12,565 (77.7%) | 3,606 (22.3%) |
Educational Attainment by Field of Study in Rockville
Business (4,416 | 13.2%), social sciences (3,662 | 10.9%), bio, nature & agricultural (3,568 | 10.7%), engineering (3,166 | 9.5%), and computers & mathematics (2,996 | 8.9%) are the most common fields of study among 33,480 individuals in Rockville who have obtained a bachelor's degree or higher.
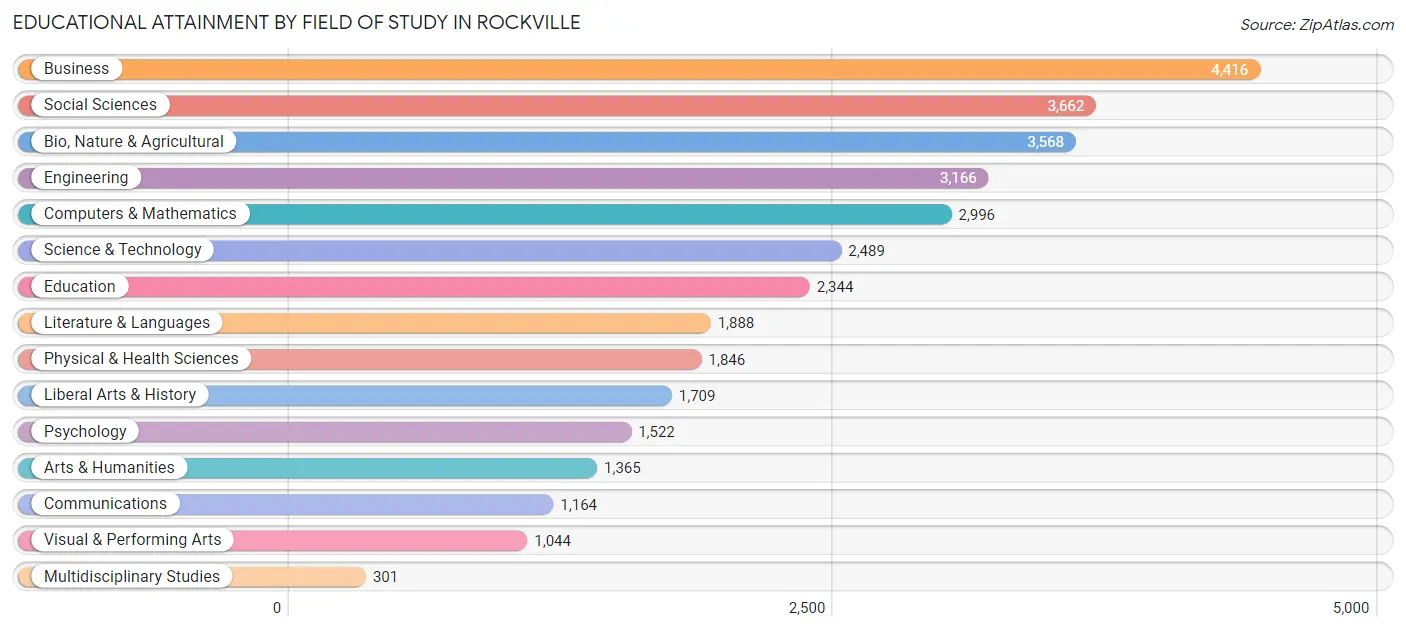
| Field of Study | # Graduates | % Graduates |
| Computers & Mathematics | 2,996 | 8.9% |
| Bio, Nature & Agricultural | 3,568 | 10.7% |
| Physical & Health Sciences | 1,846 | 5.5% |
| Psychology | 1,522 | 4.5% |
| Social Sciences | 3,662 | 10.9% |
| Engineering | 3,166 | 9.5% |
| Multidisciplinary Studies | 301 | 0.9% |
| Science & Technology | 2,489 | 7.4% |
| Business | 4,416 | 13.2% |
| Education | 2,344 | 7.0% |
| Literature & Languages | 1,888 | 5.6% |
| Liberal Arts & History | 1,709 | 5.1% |
| Visual & Performing Arts | 1,044 | 3.1% |
| Communications | 1,164 | 3.5% |
| Arts & Humanities | 1,365 | 4.1% |
| Total | 33,480 | 100.0% |
Transportation & Commute in Rockville
Vehicle Availability by Sex in Rockville
The most prevalent vehicle ownership categories in Rockville are males with 2 vehicles (7,843, accounting for 42.2%) and females with 2 vehicles (6,791, making up 45.6%).
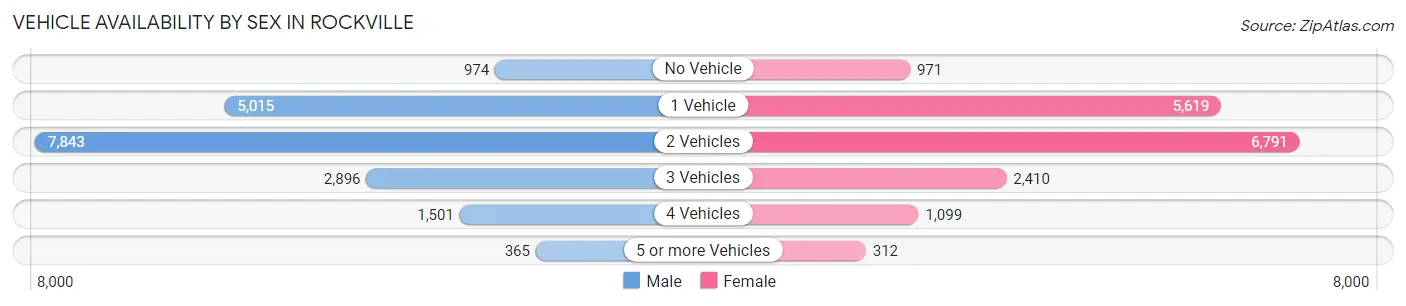
| Vehicles Available | Male | Female |
| No Vehicle | 974 (5.2%) | 971 (5.6%) |
| 1 Vehicle | 5,015 (27.0%) | 5,619 (32.7%) |
| 2 Vehicles | 7,843 (42.2%) | 6,791 (39.5%) |
| 3 Vehicles | 2,896 (15.6%) | 2,410 (14.0%) |
| 4 Vehicles | 1,501 (8.1%) | 1,099 (6.4%) |
| 5 or more Vehicles | 365 (2.0%) | 312 (1.8%) |
| Total | 18,594 (100.0%) | 17,202 (100.0%) |
Commute Time in Rockville
The most frequently occuring commute durations in Rockville are 30 to 34 minutes (3,813 commuters, 14.4%), 45 to 59 minutes (3,597 commuters, 13.6%), and 20 to 24 minutes (3,270 commuters, 12.4%).
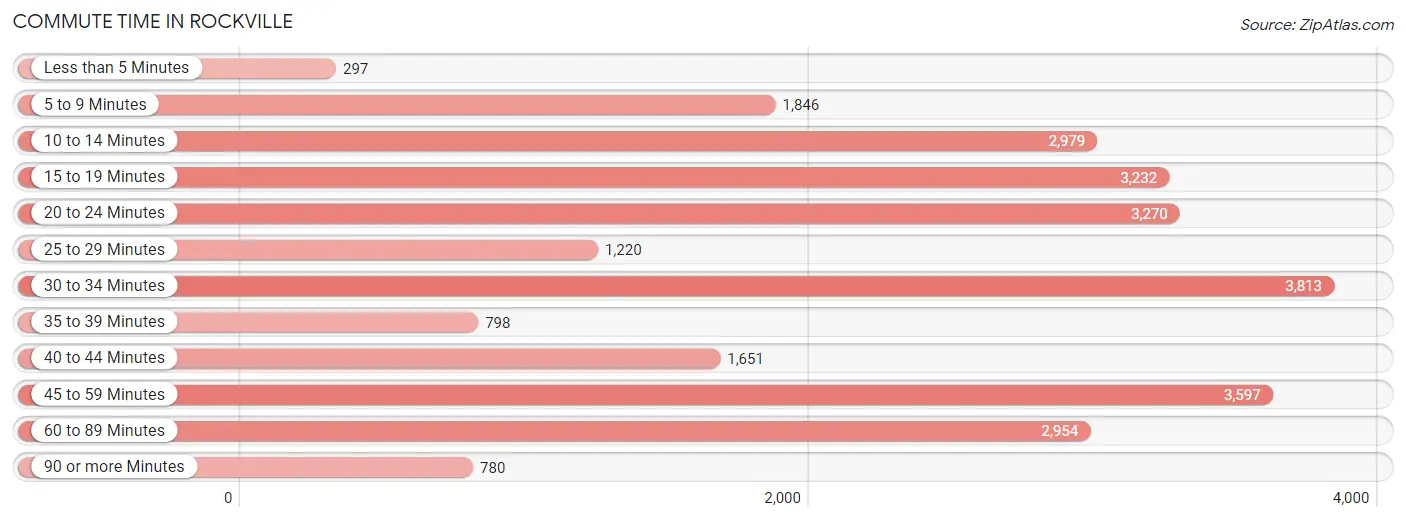
| Commute Time | # Commuters | % Commuters |
| Less than 5 Minutes | 297 | 1.1% |
| 5 to 9 Minutes | 1,846 | 7.0% |
| 10 to 14 Minutes | 2,979 | 11.3% |
| 15 to 19 Minutes | 3,232 | 12.2% |
| 20 to 24 Minutes | 3,270 | 12.4% |
| 25 to 29 Minutes | 1,220 | 4.6% |
| 30 to 34 Minutes | 3,813 | 14.4% |
| 35 to 39 Minutes | 798 | 3.0% |
| 40 to 44 Minutes | 1,651 | 6.2% |
| 45 to 59 Minutes | 3,597 | 13.6% |
| 60 to 89 Minutes | 2,954 | 11.2% |
| 90 or more Minutes | 780 | 2.9% |
Commute Time by Sex in Rockville
The most common commute times in Rockville are 45 to 59 minutes (2,237 commuters, 16.0%) for males and 15 to 19 minutes (1,820 commuters, 14.6%) for females.
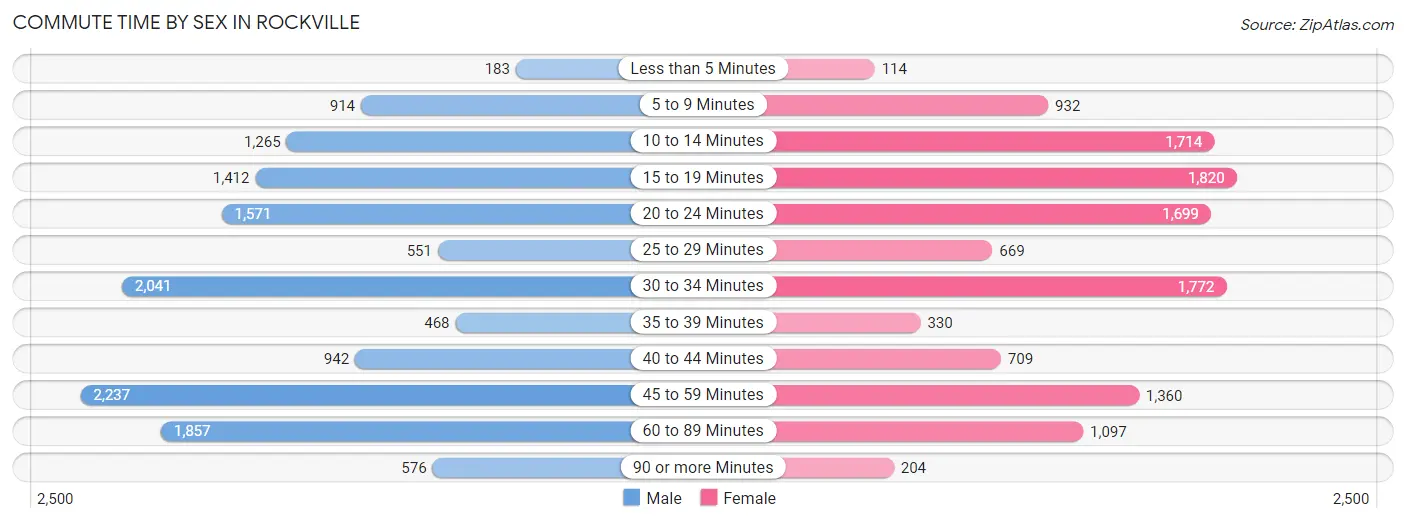
| Commute Time | Male | Female |
| Less than 5 Minutes | 183 (1.3%) | 114 (0.9%) |
| 5 to 9 Minutes | 914 (6.5%) | 932 (7.5%) |
| 10 to 14 Minutes | 1,265 (9.0%) | 1,714 (13.8%) |
| 15 to 19 Minutes | 1,412 (10.1%) | 1,820 (14.6%) |
| 20 to 24 Minutes | 1,571 (11.2%) | 1,699 (13.7%) |
| 25 to 29 Minutes | 551 (3.9%) | 669 (5.4%) |
| 30 to 34 Minutes | 2,041 (14.6%) | 1,772 (14.3%) |
| 35 to 39 Minutes | 468 (3.3%) | 330 (2.7%) |
| 40 to 44 Minutes | 942 (6.7%) | 709 (5.7%) |
| 45 to 59 Minutes | 2,237 (16.0%) | 1,360 (11.0%) |
| 60 to 89 Minutes | 1,857 (13.3%) | 1,097 (8.8%) |
| 90 or more Minutes | 576 (4.1%) | 204 (1.6%) |
Time of Departure to Work by Sex in Rockville
The most frequent times of departure to work in Rockville are 8:00 AM to 8:29 AM (2,267, 16.2%) for males and 8:00 AM to 8:29 AM (1,959, 15.8%) for females.
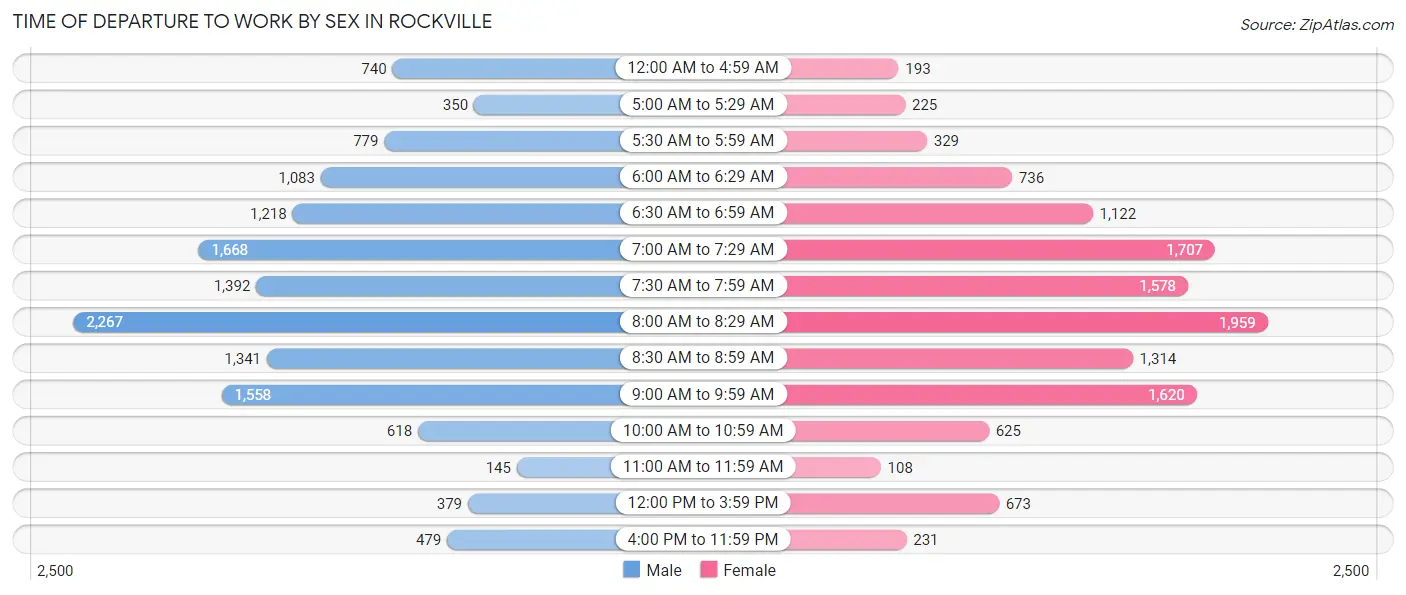
| Time of Departure | Male | Female |
| 12:00 AM to 4:59 AM | 740 (5.3%) | 193 (1.5%) |
| 5:00 AM to 5:29 AM | 350 (2.5%) | 225 (1.8%) |
| 5:30 AM to 5:59 AM | 779 (5.6%) | 329 (2.6%) |
| 6:00 AM to 6:29 AM | 1,083 (7.7%) | 736 (5.9%) |
| 6:30 AM to 6:59 AM | 1,218 (8.7%) | 1,122 (9.0%) |
| 7:00 AM to 7:29 AM | 1,668 (11.9%) | 1,707 (13.7%) |
| 7:30 AM to 7:59 AM | 1,392 (9.9%) | 1,578 (12.7%) |
| 8:00 AM to 8:29 AM | 2,267 (16.2%) | 1,959 (15.8%) |
| 8:30 AM to 8:59 AM | 1,341 (9.6%) | 1,314 (10.6%) |
| 9:00 AM to 9:59 AM | 1,558 (11.1%) | 1,620 (13.0%) |
| 10:00 AM to 10:59 AM | 618 (4.4%) | 625 (5.0%) |
| 11:00 AM to 11:59 AM | 145 (1.0%) | 108 (0.9%) |
| 12:00 PM to 3:59 PM | 379 (2.7%) | 673 (5.4%) |
| 4:00 PM to 11:59 PM | 479 (3.4%) | 231 (1.9%) |
| Total | 14,017 (100.0%) | 12,420 (100.0%) |
Housing Occupancy in Rockville
Occupancy by Ownership in Rockville
Of the total 26,543 dwellings in Rockville, owner-occupied units account for 14,487 (54.6%), while renter-occupied units make up 12,056 (45.4%).
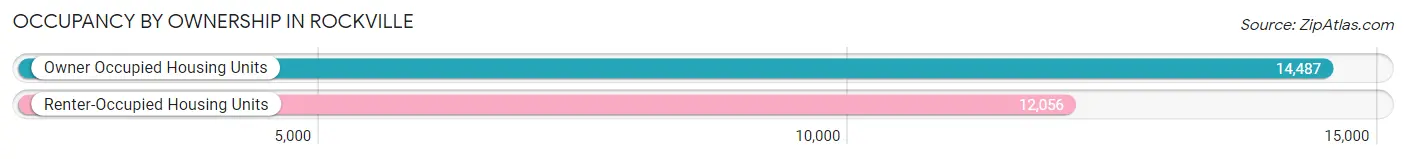
| Occupancy | # Housing Units | % Housing Units |
| Owner Occupied Housing Units | 14,487 | 54.6% |
| Renter-Occupied Housing Units | 12,056 | 45.4% |
| Total Occupied Housing Units | 26,543 | 100.0% |
Occupancy by Household Size in Rockville
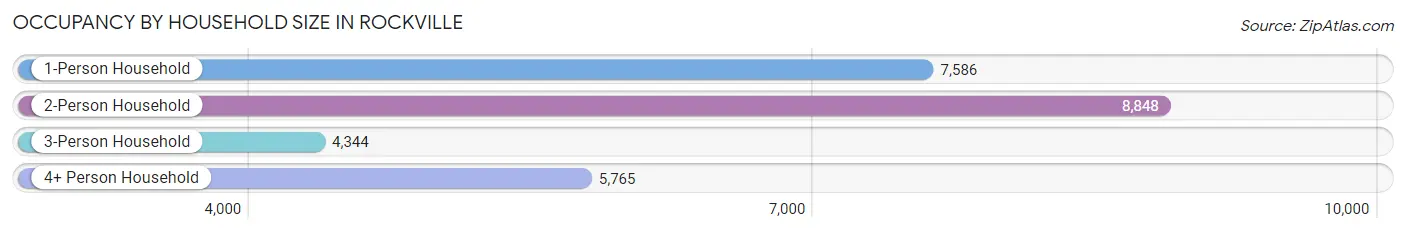
| Household Size | # Housing Units | % Housing Units |
| 1-Person Household | 7,586 | 28.6% |
| 2-Person Household | 8,848 | 33.3% |
| 3-Person Household | 4,344 | 16.4% |
| 4+ Person Household | 5,765 | 21.7% |
| Total Housing Units | 26,543 | 100.0% |
Occupancy by Ownership by Household Size in Rockville
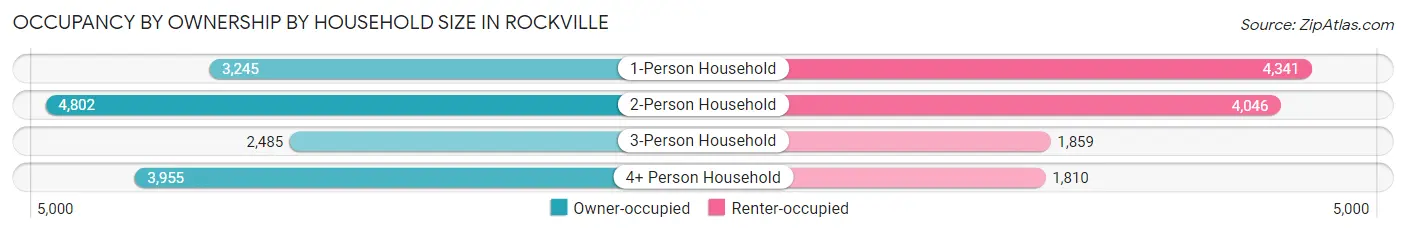
| Household Size | Owner-occupied | Renter-occupied |
| 1-Person Household | 3,245 (42.8%) | 4,341 (57.2%) |
| 2-Person Household | 4,802 (54.3%) | 4,046 (45.7%) |
| 3-Person Household | 2,485 (57.2%) | 1,859 (42.8%) |
| 4+ Person Household | 3,955 (68.6%) | 1,810 (31.4%) |
| Total Housing Units | 14,487 (54.6%) | 12,056 (45.4%) |
Occupancy by Educational Attainment in Rockville
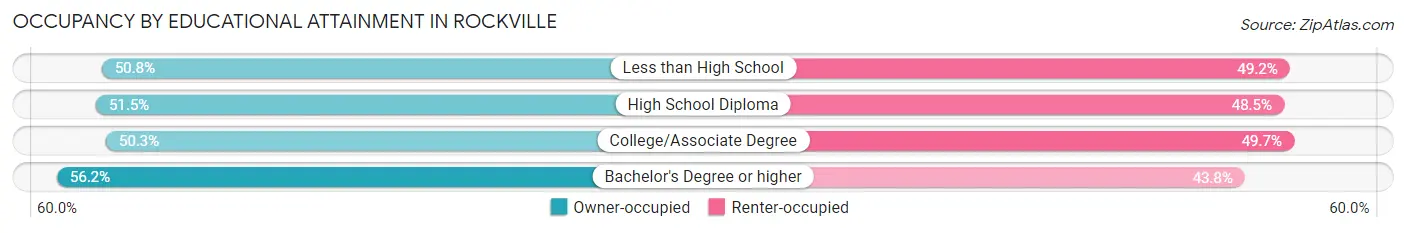
| Household Size | Owner-occupied | Renter-occupied |
| Less than High School | 684 (50.8%) | 662 (49.2%) |
| High School Diploma | 1,090 (51.5%) | 1,026 (48.5%) |
| College/Associate Degree | 2,154 (50.3%) | 2,126 (49.7%) |
| Bachelor's Degree or higher | 10,559 (56.2%) | 8,242 (43.8%) |
Occupancy by Age of Householder in Rockville
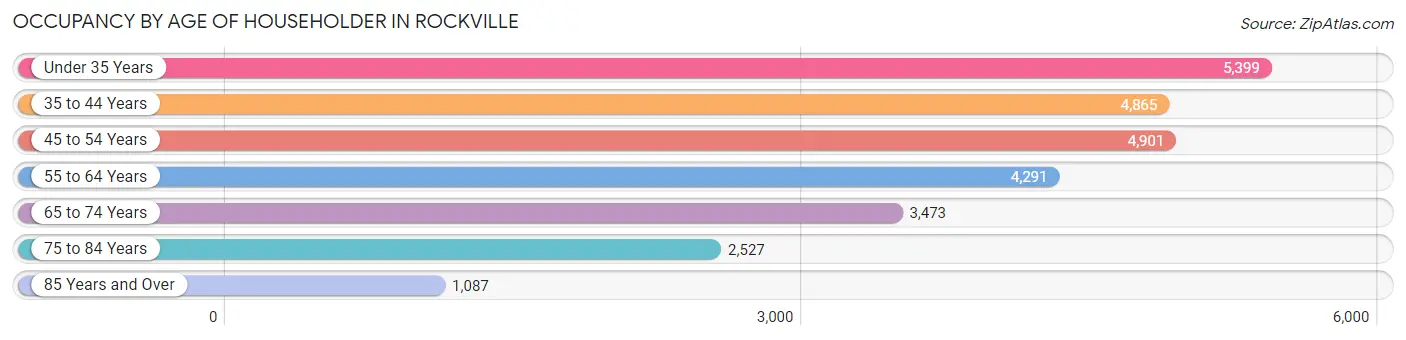
| Age Bracket | # Households | % Households |
| Under 35 Years | 5,399 | 20.3% |
| 35 to 44 Years | 4,865 | 18.3% |
| 45 to 54 Years | 4,901 | 18.5% |
| 55 to 64 Years | 4,291 | 16.2% |
| 65 to 74 Years | 3,473 | 13.1% |
| 75 to 84 Years | 2,527 | 9.5% |
| 85 Years and Over | 1,087 | 4.1% |
| Total | 26,543 | 100.0% |
Housing Finances in Rockville
Median Income by Occupancy in Rockville
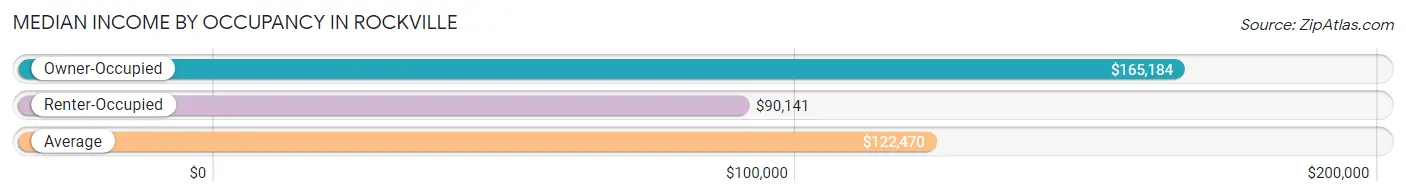
| Occupancy Type | # Households | Median Income |
| Owner-Occupied | 14,487 (54.6%) | $165,184 |
| Renter-Occupied | 12,056 (45.4%) | $90,141 |
| Average | 26,543 (100.0%) | $122,470 |
Occupancy by Householder Income Bracket in Rockville
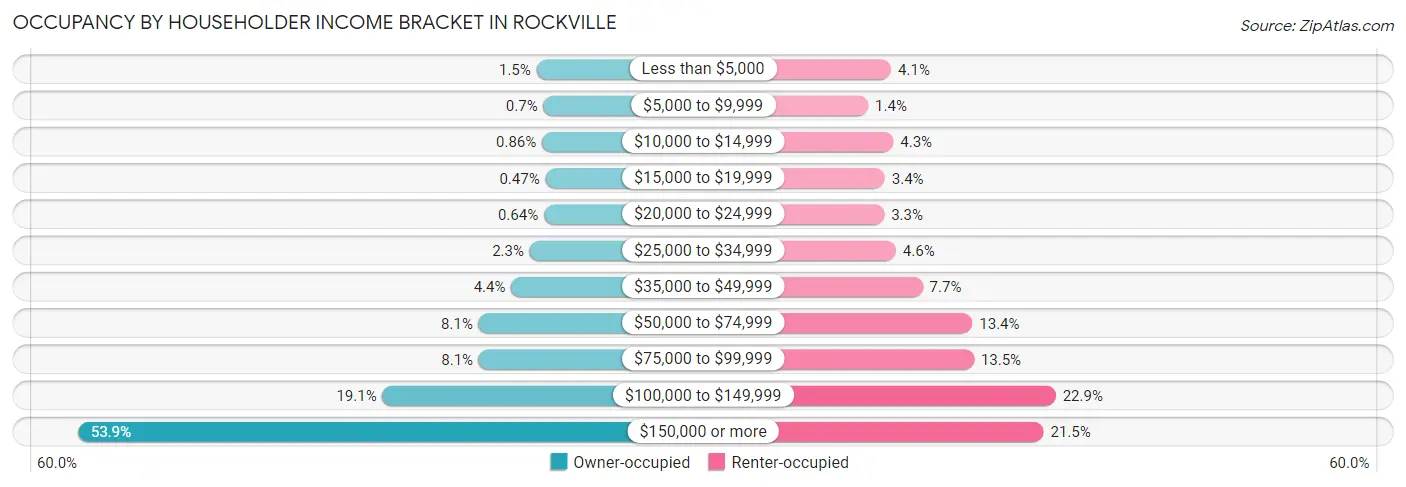
| Income Bracket | Owner-occupied | Renter-occupied |
| Less than $5,000 | 214 (1.5%) | 491 (4.1%) |
| $5,000 to $9,999 | 102 (0.7%) | 174 (1.4%) |
| $10,000 to $14,999 | 125 (0.9%) | 521 (4.3%) |
| $15,000 to $19,999 | 68 (0.5%) | 404 (3.4%) |
| $20,000 to $24,999 | 93 (0.6%) | 395 (3.3%) |
| $25,000 to $34,999 | 328 (2.3%) | 556 (4.6%) |
| $35,000 to $49,999 | 635 (4.4%) | 925 (7.7%) |
| $50,000 to $74,999 | 1,173 (8.1%) | 1,610 (13.4%) |
| $75,000 to $99,999 | 1,170 (8.1%) | 1,631 (13.5%) |
| $100,000 to $149,999 | 2,767 (19.1%) | 2,758 (22.9%) |
| $150,000 or more | 7,812 (53.9%) | 2,591 (21.5%) |
| Total | 14,487 (100.0%) | 12,056 (100.0%) |
Monthly Housing Cost Tiers in Rockville
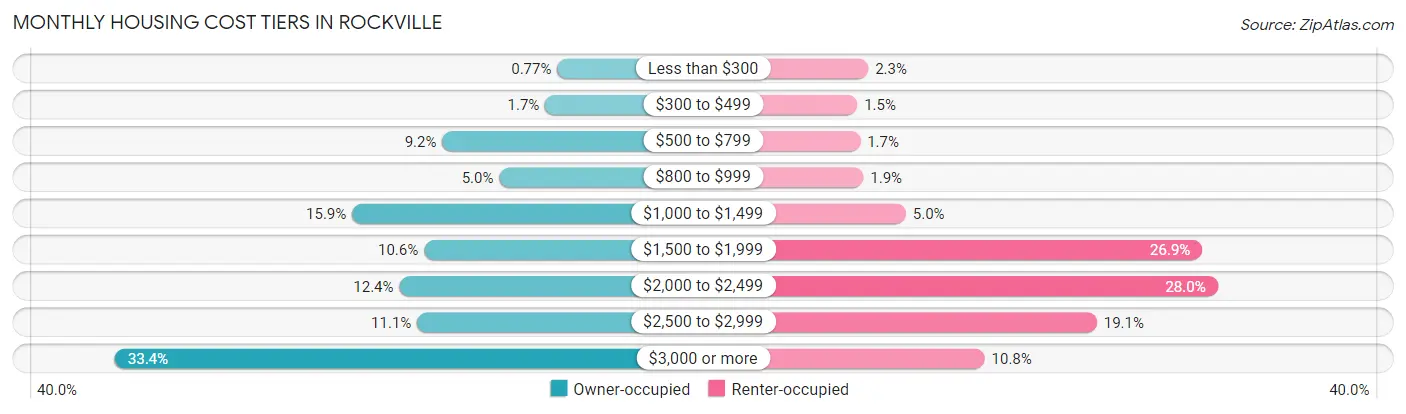
| Monthly Cost | Owner-occupied | Renter-occupied |
| Less than $300 | 111 (0.8%) | 274 (2.3%) |
| $300 to $499 | 240 (1.7%) | 176 (1.5%) |
| $500 to $799 | 1,338 (9.2%) | 202 (1.7%) |
| $800 to $999 | 730 (5.0%) | 230 (1.9%) |
| $1,000 to $1,499 | 2,301 (15.9%) | 608 (5.0%) |
| $1,500 to $1,999 | 1,533 (10.6%) | 3,238 (26.9%) |
| $2,000 to $2,499 | 1,796 (12.4%) | 3,374 (28.0%) |
| $2,500 to $2,999 | 1,607 (11.1%) | 2,303 (19.1%) |
| $3,000 or more | 4,831 (33.4%) | 1,307 (10.8%) |
| Total | 14,487 (100.0%) | 12,056 (100.0%) |
Physical Housing Characteristics in Rockville
Housing Structures in Rockville
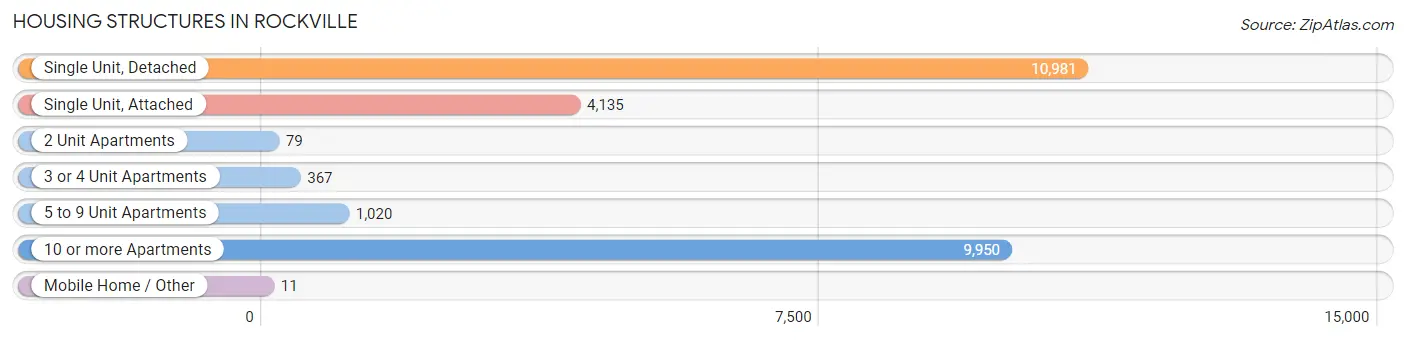
| Structure Type | # Housing Units | % Housing Units |
| Single Unit, Detached | 10,981 | 41.4% |
| Single Unit, Attached | 4,135 | 15.6% |
| 2 Unit Apartments | 79 | 0.3% |
| 3 or 4 Unit Apartments | 367 | 1.4% |
| 5 to 9 Unit Apartments | 1,020 | 3.8% |
| 10 or more Apartments | 9,950 | 37.5% |
| Mobile Home / Other | 11 | 0.0% |
| Total | 26,543 | 100.0% |
Housing Structures by Occupancy in Rockville
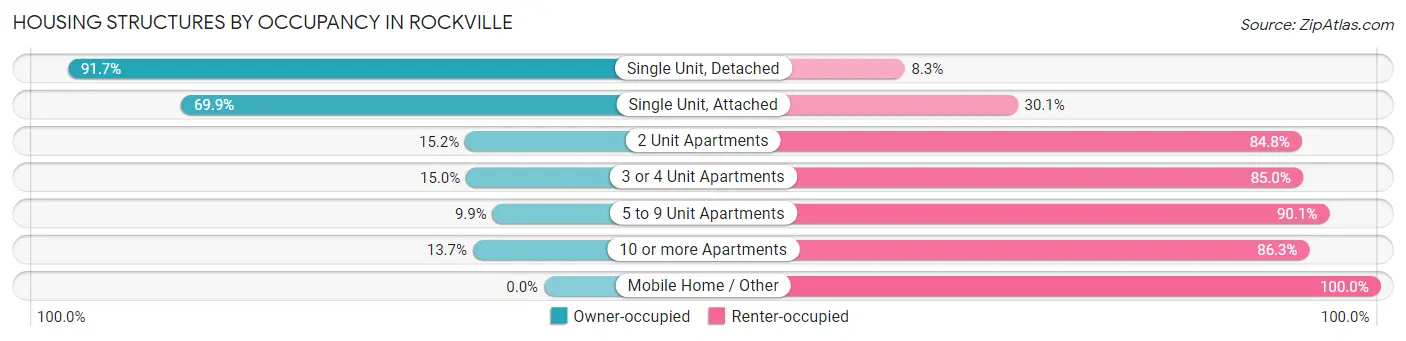
| Structure Type | Owner-occupied | Renter-occupied |
| Single Unit, Detached | 10,065 (91.7%) | 916 (8.3%) |
| Single Unit, Attached | 2,890 (69.9%) | 1,245 (30.1%) |
| 2 Unit Apartments | 12 (15.2%) | 67 (84.8%) |
| 3 or 4 Unit Apartments | 55 (15.0%) | 312 (85.0%) |
| 5 to 9 Unit Apartments | 101 (9.9%) | 919 (90.1%) |
| 10 or more Apartments | 1,364 (13.7%) | 8,586 (86.3%) |
| Mobile Home / Other | 0 (0.0%) | 11 (100.0%) |
| Total | 14,487 (54.6%) | 12,056 (45.4%) |
Housing Structures by Number of Rooms in Rockville
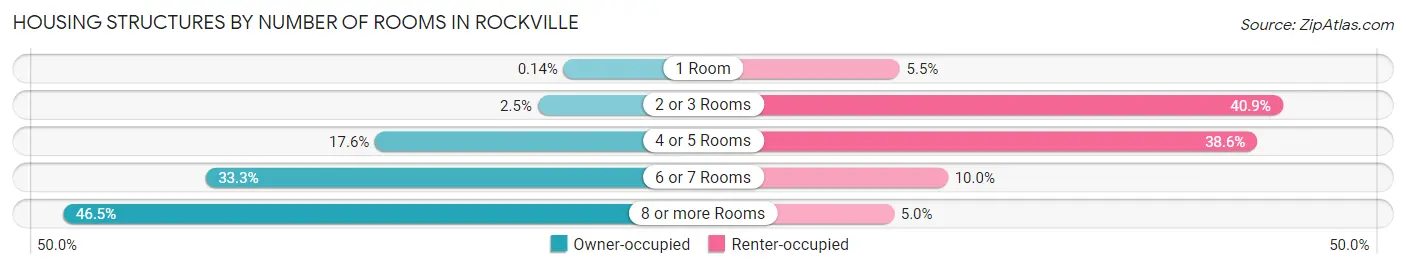
| Number of Rooms | Owner-occupied | Renter-occupied |
| 1 Room | 20 (0.1%) | 665 (5.5%) |
| 2 or 3 Rooms | 368 (2.5%) | 4,936 (40.9%) |
| 4 or 5 Rooms | 2,547 (17.6%) | 4,653 (38.6%) |
| 6 or 7 Rooms | 4,822 (33.3%) | 1,202 (10.0%) |
| 8 or more Rooms | 6,730 (46.5%) | 600 (5.0%) |
| Total | 14,487 (100.0%) | 12,056 (100.0%) |
Housing Structure by Heating Type in Rockville
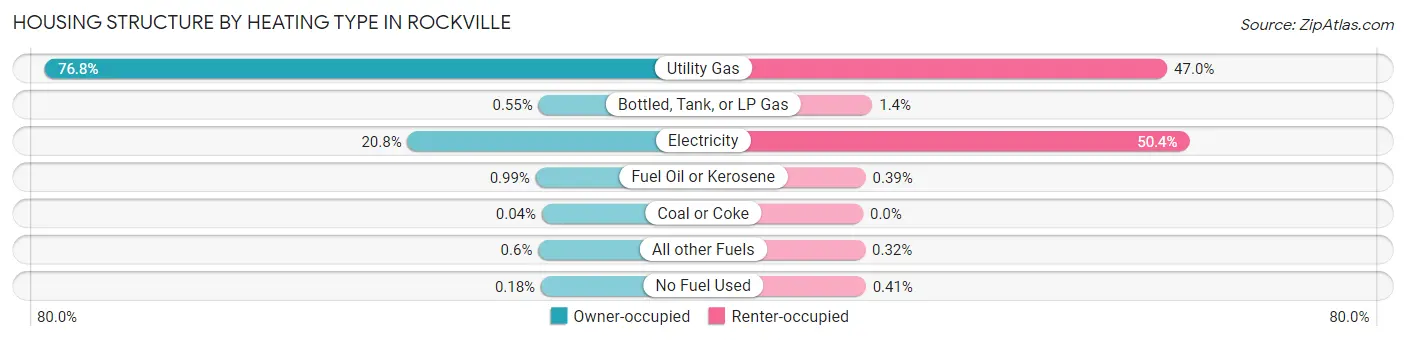
| Heating Type | Owner-occupied | Renter-occupied |
| Utility Gas | 11,130 (76.8%) | 5,667 (47.0%) |
| Bottled, Tank, or LP Gas | 79 (0.5%) | 173 (1.4%) |
| Electricity | 3,015 (20.8%) | 6,081 (50.4%) |
| Fuel Oil or Kerosene | 144 (1.0%) | 47 (0.4%) |
| Coal or Coke | 6 (0.0%) | 0 (0.0%) |
| All other Fuels | 87 (0.6%) | 39 (0.3%) |
| No Fuel Used | 26 (0.2%) | 49 (0.4%) |
| Total | 14,487 (100.0%) | 12,056 (100.0%) |
Household Vehicle Usage in Rockville
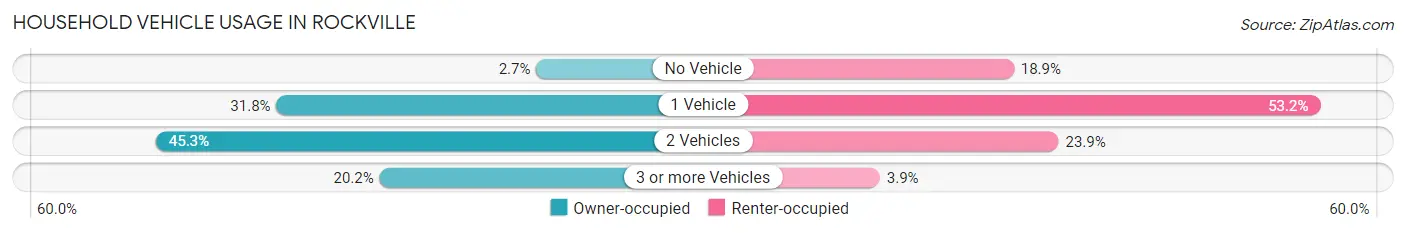
| Vehicles per Household | Owner-occupied | Renter-occupied |
| No Vehicle | 388 (2.7%) | 2,281 (18.9%) |
| 1 Vehicle | 4,606 (31.8%) | 6,419 (53.2%) |
| 2 Vehicles | 6,561 (45.3%) | 2,885 (23.9%) |
| 3 or more Vehicles | 2,932 (20.2%) | 471 (3.9%) |
| Total | 14,487 (100.0%) | 12,056 (100.0%) |
Real Estate & Mortgages in Rockville
Real Estate and Mortgage Overview in Rockville
| Characteristic | Without Mortgage | With Mortgage |
| Housing Units | 4,578 | 9,909 |
| Median Property Value | $597,900 | $637,200 |
| Median Household Income | $144,063 | $5,669 |
| Monthly Housing Costs | $1,008 | $4,831 |
| Real Estate Taxes | $6,234 | $141 |
Property Value by Mortgage Status in Rockville
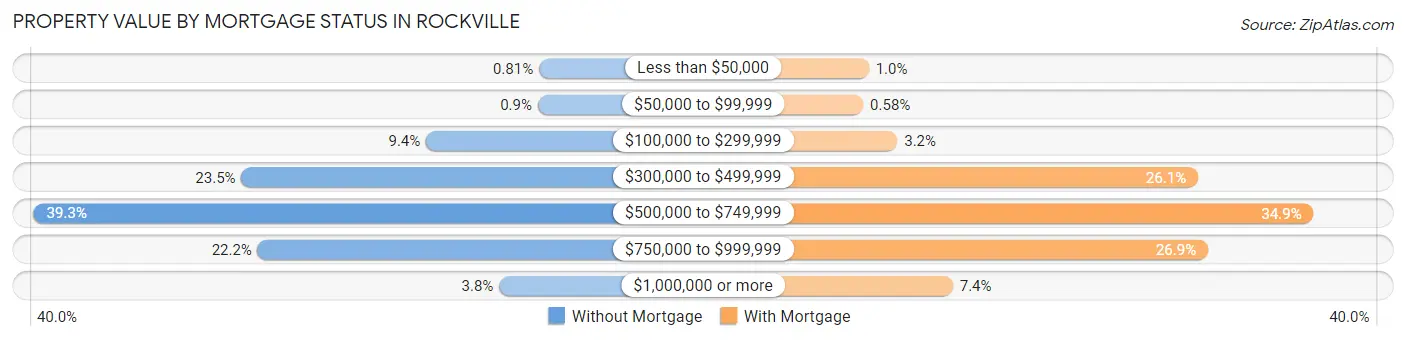
| Property Value | Without Mortgage | With Mortgage |
| Less than $50,000 | 37 (0.8%) | 99 (1.0%) |
| $50,000 to $99,999 | 41 (0.9%) | 57 (0.6%) |
| $100,000 to $299,999 | 431 (9.4%) | 315 (3.2%) |
| $300,000 to $499,999 | 1,075 (23.5%) | 2,586 (26.1%) |
| $500,000 to $749,999 | 1,800 (39.3%) | 3,457 (34.9%) |
| $750,000 to $999,999 | 1,018 (22.2%) | 2,661 (26.9%) |
| $1,000,000 or more | 176 (3.8%) | 734 (7.4%) |
| Total | 4,578 (100.0%) | 9,909 (100.0%) |
Household Income by Mortgage Status in Rockville
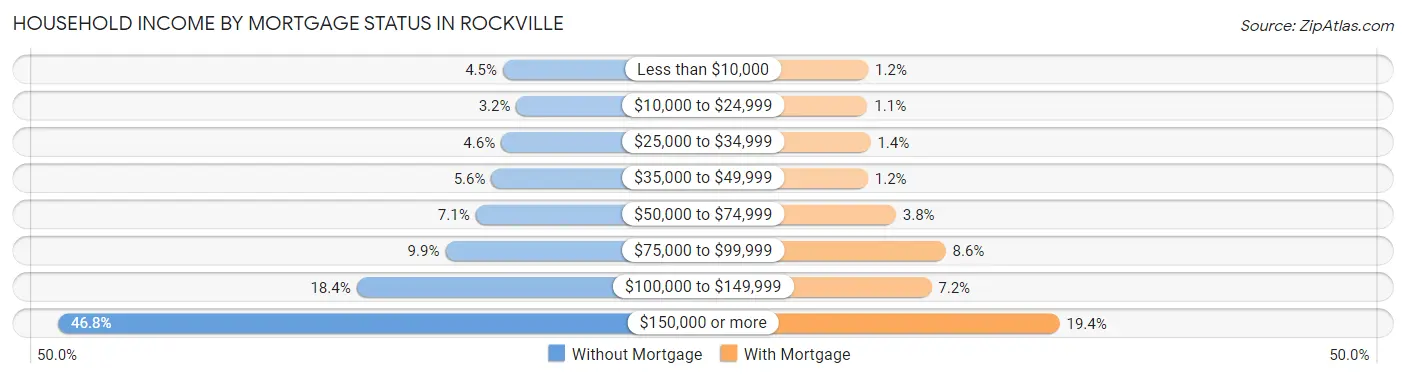
| Household Income | Without Mortgage | With Mortgage |
| Less than $10,000 | 204 (4.5%) | 119 (1.2%) |
| $10,000 to $24,999 | 145 (3.2%) | 112 (1.1%) |
| $25,000 to $34,999 | 212 (4.6%) | 141 (1.4%) |
| $35,000 to $49,999 | 254 (5.6%) | 116 (1.2%) |
| $50,000 to $74,999 | 323 (7.1%) | 381 (3.8%) |
| $75,000 to $99,999 | 455 (9.9%) | 850 (8.6%) |
| $100,000 to $149,999 | 842 (18.4%) | 715 (7.2%) |
| $150,000 or more | 2,143 (46.8%) | 1,925 (19.4%) |
| Total | 4,578 (100.0%) | 9,909 (100.0%) |
Property Value to Household Income Ratio in Rockville
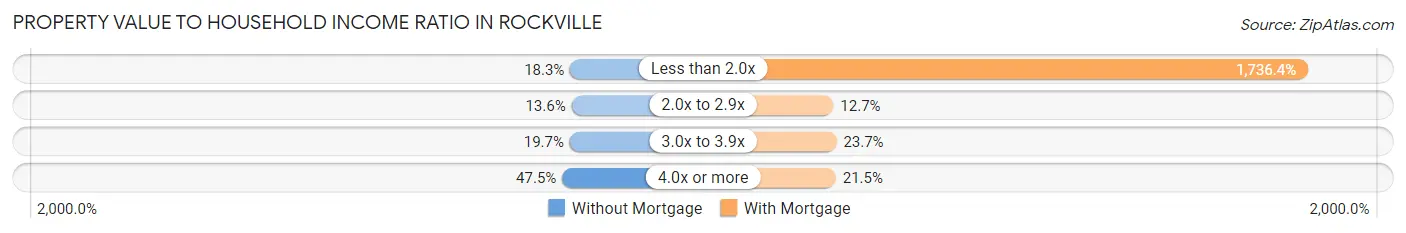
| Value-to-Income Ratio | Without Mortgage | With Mortgage |
| Less than 2.0x | 838 (18.3%) | 172,064 (1,736.4%) |
| 2.0x to 2.9x | 623 (13.6%) | 1,254 (12.7%) |
| 3.0x to 3.9x | 903 (19.7%) | 2,350 (23.7%) |
| 4.0x or more | 2,174 (47.5%) | 2,127 (21.5%) |
| Total | 4,578 (100.0%) | 9,909 (100.0%) |
Real Estate Taxes by Mortgage Status in Rockville

| Property Taxes | Without Mortgage | With Mortgage |
| Less than $800 | 188 (4.1%) | 40 (0.4%) |
| $800 to $1,499 | 92 (2.0%) | 42 (0.4%) |
| $800 to $1,499 | 4,145 (90.5%) | 211 (2.1%) |
| Total | 4,578 (100.0%) | 9,909 (100.0%) |
Health & Disability in Rockville
Health Insurance Coverage by Age in Rockville
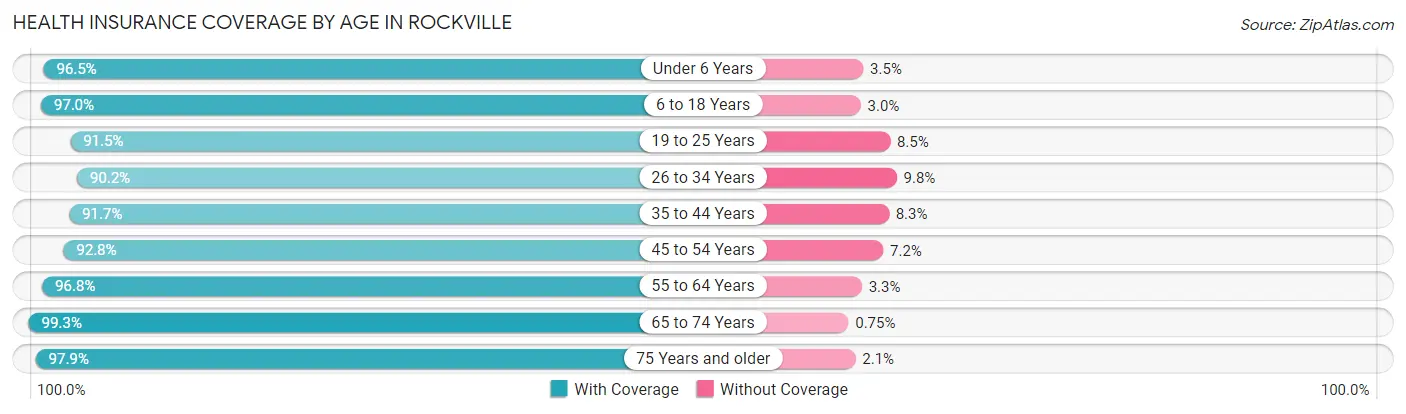
| Age Bracket | With Coverage | Without Coverage |
| Under 6 Years | 4,114 (96.5%) | 150 (3.5%) |
| 6 to 18 Years | 9,808 (97.0%) | 307 (3.0%) |
| 19 to 25 Years | 5,131 (91.5%) | 477 (8.5%) |
| 26 to 34 Years | 8,103 (90.2%) | 876 (9.8%) |
| 35 to 44 Years | 8,694 (91.7%) | 785 (8.3%) |
| 45 to 54 Years | 7,947 (92.8%) | 619 (7.2%) |
| 55 to 64 Years | 7,363 (96.8%) | 247 (3.3%) |
| 65 to 74 Years | 5,553 (99.3%) | 42 (0.7%) |
| 75 Years and older | 5,715 (97.9%) | 120 (2.1%) |
| Total | 62,428 (94.5%) | 3,623 (5.5%) |
Health Insurance Coverage by Citizenship Status in Rockville
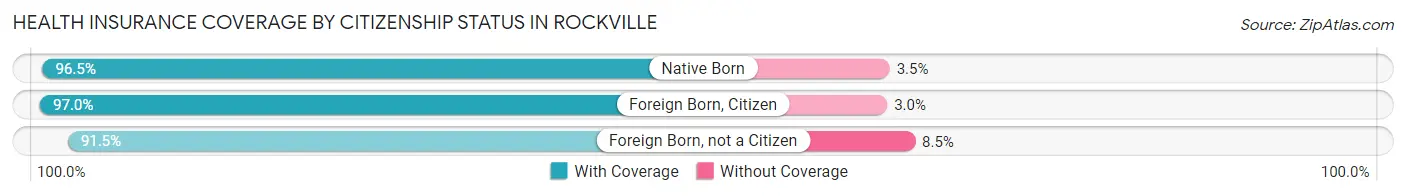
| Citizenship Status | With Coverage | Without Coverage |
| Native Born | 4,114 (96.5%) | 150 (3.5%) |
| Foreign Born, Citizen | 9,808 (97.0%) | 307 (3.0%) |
| Foreign Born, not a Citizen | 5,131 (91.5%) | 477 (8.5%) |
Health Insurance Coverage by Household Income in Rockville
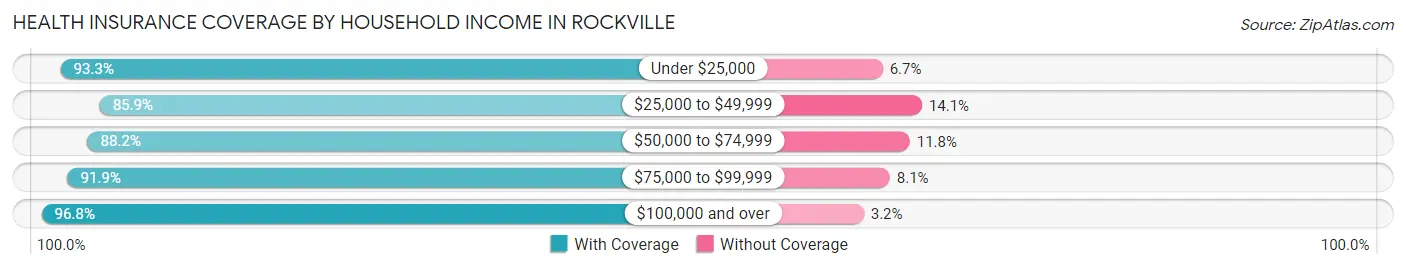
| Household Income | With Coverage | Without Coverage |
| Under $25,000 | 4,031 (93.3%) | 291 (6.7%) |
| $25,000 to $49,999 | 4,352 (85.9%) | 713 (14.1%) |
| $50,000 to $74,999 | 5,060 (88.2%) | 677 (11.8%) |
| $75,000 to $99,999 | 5,981 (91.9%) | 524 (8.1%) |
| $100,000 and over | 42,738 (96.8%) | 1,405 (3.2%) |
Public vs Private Health Insurance Coverage by Age in Rockville
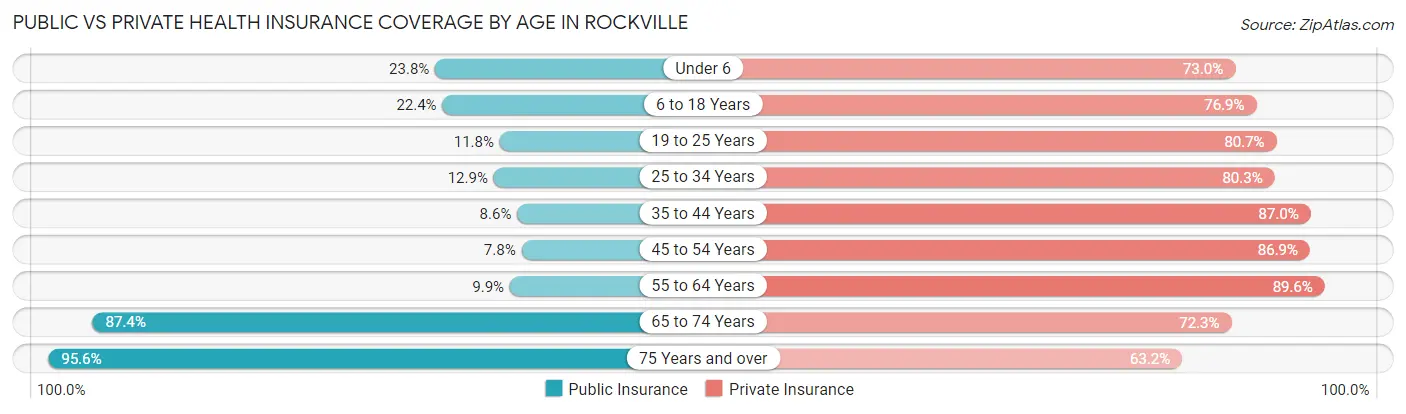
| Age Bracket | Public Insurance | Private Insurance |
| Under 6 | 1,015 (23.8%) | 3,112 (73.0%) |
| 6 to 18 Years | 2,270 (22.4%) | 7,782 (76.9%) |
| 19 to 25 Years | 661 (11.8%) | 4,524 (80.7%) |
| 25 to 34 Years | 1,160 (12.9%) | 7,211 (80.3%) |
| 35 to 44 Years | 811 (8.6%) | 8,249 (87.0%) |
| 45 to 54 Years | 666 (7.8%) | 7,441 (86.9%) |
| 55 to 64 Years | 754 (9.9%) | 6,821 (89.6%) |
| 65 to 74 Years | 4,889 (87.4%) | 4,045 (72.3%) |
| 75 Years and over | 5,578 (95.6%) | 3,685 (63.1%) |
| Total | 17,804 (27.0%) | 52,870 (80.0%) |
Disability Status by Sex by Age in Rockville
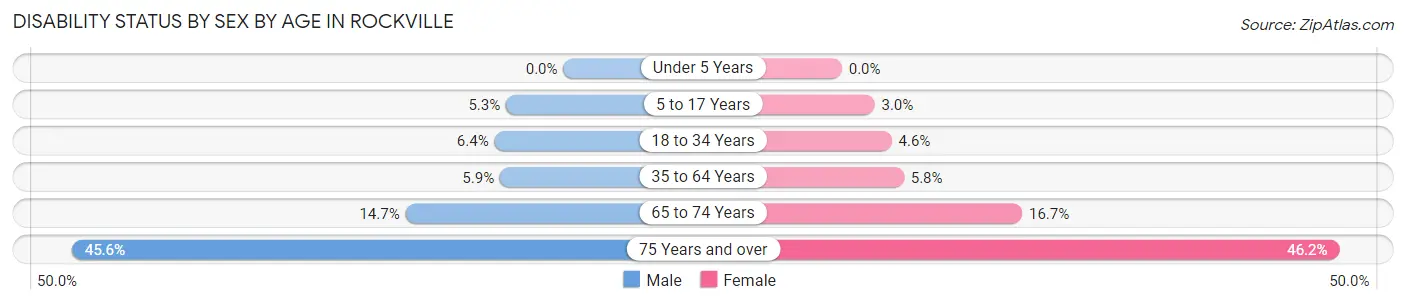
| Age Bracket | Male | Female |
| Under 5 Years | 0 (0.0%) | 0 (0.0%) |
| 5 to 17 Years | 304 (5.3%) | 137 (3.0%) |
| 18 to 34 Years | 474 (6.4%) | 360 (4.6%) |
| 35 to 64 Years | 738 (5.9%) | 754 (5.8%) |
| 65 to 74 Years | 372 (14.6%) | 511 (16.7%) |
| 75 Years and over | 1,001 (45.6%) | 1,681 (46.2%) |
Disability Class by Sex by Age in Rockville
Disability Class: Hearing Difficulty
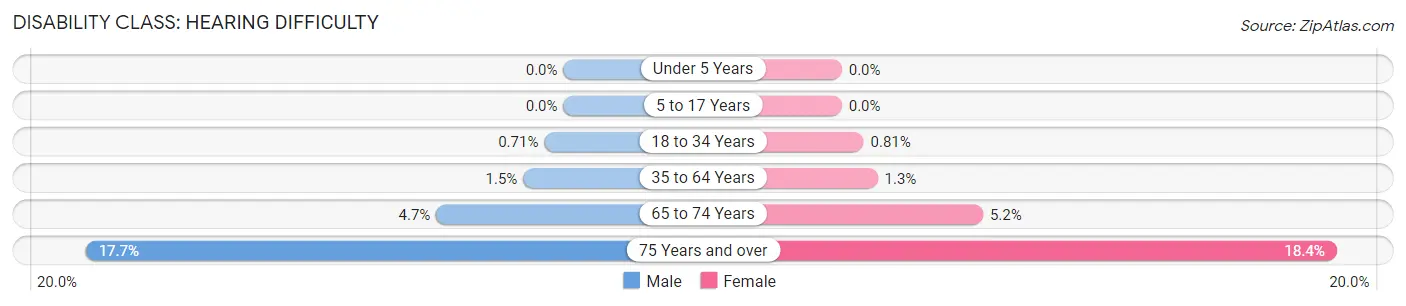
| Age Bracket | Male | Female |
| Under 5 Years | 0 (0.0%) | 0 (0.0%) |
| 5 to 17 Years | 0 (0.0%) | 0 (0.0%) |
| 18 to 34 Years | 53 (0.7%) | 63 (0.8%) |
| 35 to 64 Years | 187 (1.5%) | 174 (1.3%) |
| 65 to 74 Years | 120 (4.7%) | 160 (5.2%) |
| 75 Years and over | 389 (17.7%) | 669 (18.4%) |
Disability Class: Vision Difficulty
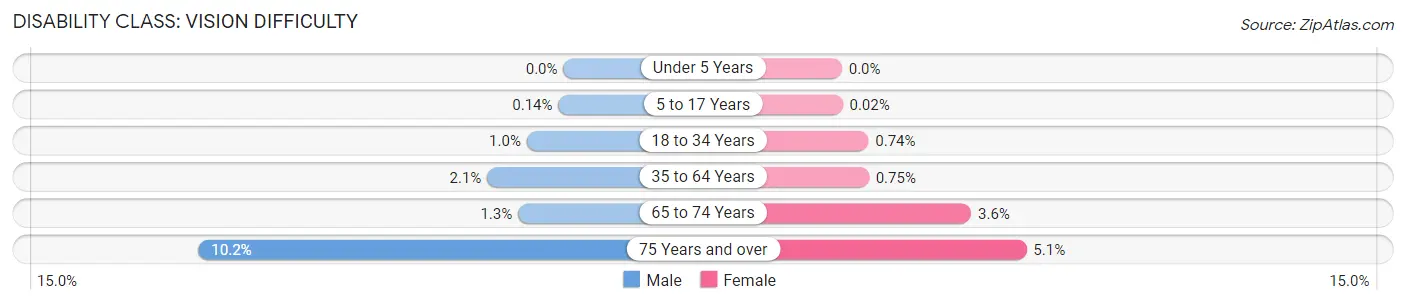
| Age Bracket | Male | Female |
| Under 5 Years | 0 (0.0%) | 0 (0.0%) |
| 5 to 17 Years | 8 (0.1%) | 1 (0.0%) |
| 18 to 34 Years | 76 (1.0%) | 58 (0.7%) |
| 35 to 64 Years | 266 (2.1%) | 98 (0.7%) |
| 65 to 74 Years | 32 (1.3%) | 110 (3.6%) |
| 75 Years and over | 223 (10.2%) | 187 (5.1%) |
Disability Class: Cognitive Difficulty
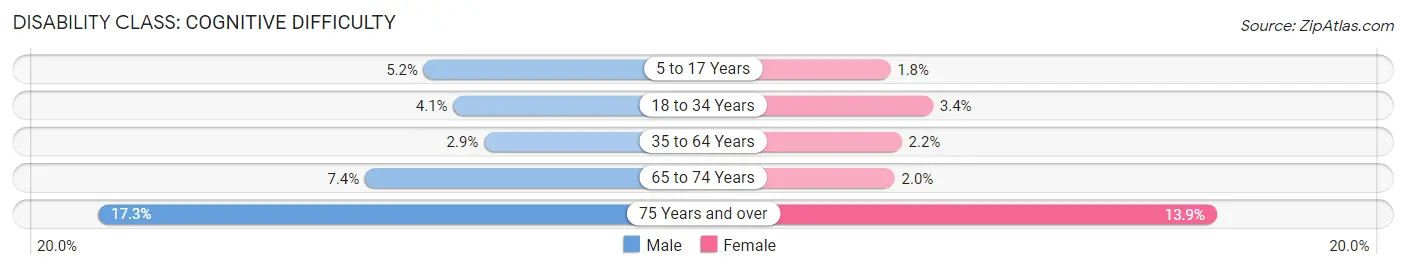
| Age Bracket | Male | Female |
| 5 to 17 Years | 296 (5.2%) | 81 (1.8%) |
| 18 to 34 Years | 303 (4.1%) | 263 (3.4%) |
| 35 to 64 Years | 369 (2.9%) | 291 (2.2%) |
| 65 to 74 Years | 187 (7.4%) | 60 (2.0%) |
| 75 Years and over | 379 (17.3%) | 507 (13.9%) |
Disability Class: Ambulatory Difficulty
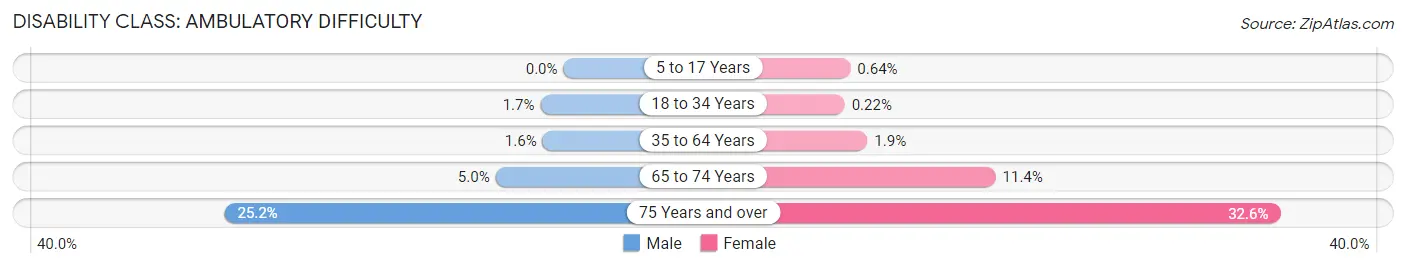
| Age Bracket | Male | Female |
| 5 to 17 Years | 0 (0.0%) | 29 (0.6%) |
| 18 to 34 Years | 127 (1.7%) | 17 (0.2%) |
| 35 to 64 Years | 195 (1.5%) | 249 (1.9%) |
| 65 to 74 Years | 128 (5.0%) | 349 (11.4%) |
| 75 Years and over | 552 (25.2%) | 1,185 (32.6%) |
Disability Class: Self-Care Difficulty
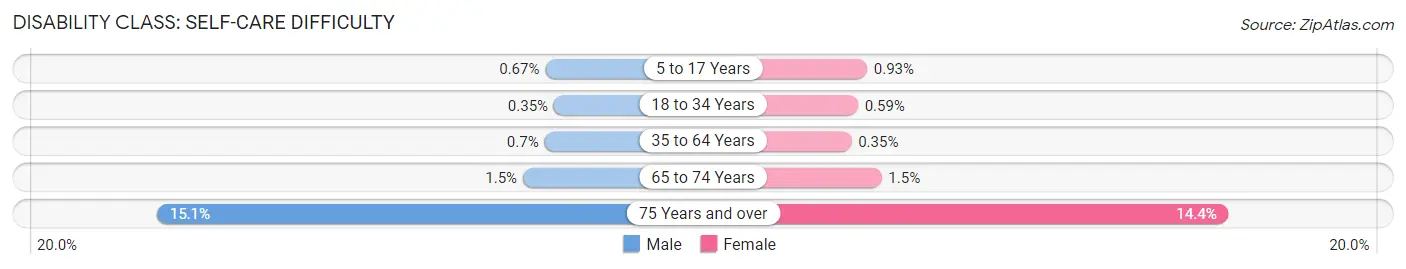
| Age Bracket | Male | Female |
| 5 to 17 Years | 38 (0.7%) | 42 (0.9%) |
| 18 to 34 Years | 26 (0.4%) | 46 (0.6%) |
| 35 to 64 Years | 88 (0.7%) | 46 (0.4%) |
| 65 to 74 Years | 38 (1.5%) | 45 (1.5%) |
| 75 Years and over | 331 (15.1%) | 523 (14.4%) |
Technology Access in Rockville
Computing Device Access in Rockville
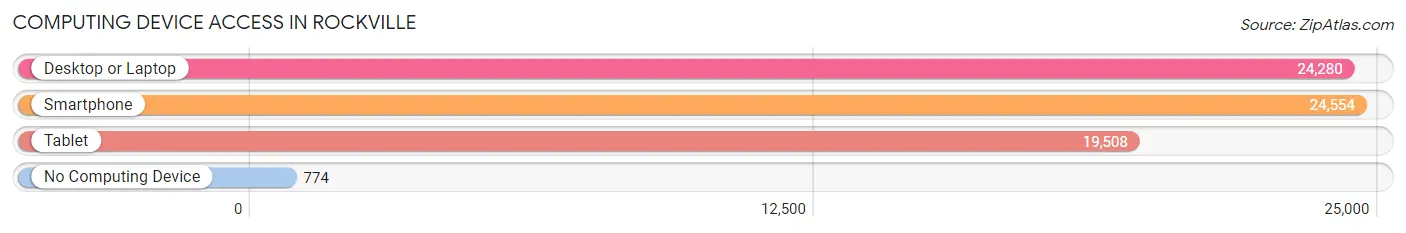
| Device Type | # Households | % Households |
| Desktop or Laptop | 24,280 | 91.5% |
| Smartphone | 24,554 | 92.5% |
| Tablet | 19,508 | 73.5% |
| No Computing Device | 774 | 2.9% |
| Total | 26,543 | 100.0% |
Internet Access in Rockville
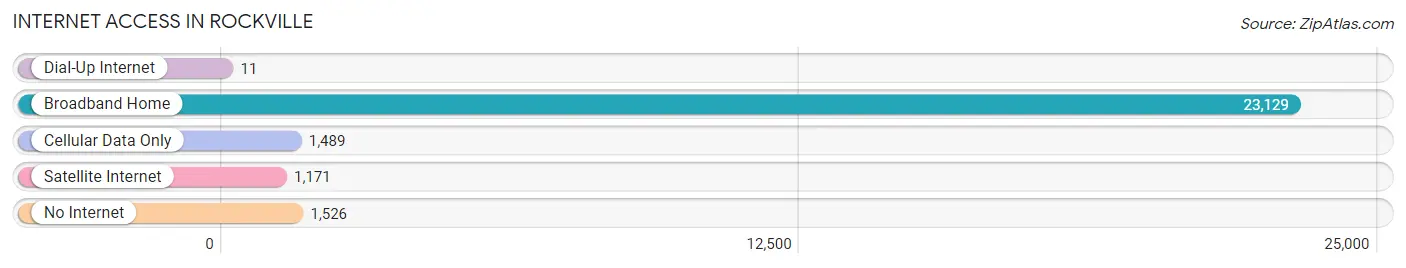
| Internet Type | # Households | % Households |
| Dial-Up Internet | 11 | 0.0% |
| Broadband Home | 23,129 | 87.1% |
| Cellular Data Only | 1,489 | 5.6% |
| Satellite Internet | 1,171 | 4.4% |
| No Internet | 1,526 | 5.8% |
| Total | 26,543 | 100.0% |
Rockville Summary
Rockville, Maryland is a city located in Montgomery County, Maryland, United States. It is the county seat of Montgomery County and is part of the Baltimore-Washington Metropolitan Area. The city has a population of about 66,000 people and is the third largest city in Maryland.
History
Rockville was first settled in the late 1700s by a group of German immigrants. The town was originally called Hungerford’s Tavern, named after the tavern that was built by the first settlers. The town was later renamed Rockville, after the rocky terrain of the area.
In 1801, Rockville was officially incorporated as a town. During the Civil War, Rockville served as a major supply center for the Union Army. After the war, the town experienced a period of growth and development. In the late 1800s, Rockville became a popular summer resort destination for wealthy Washingtonians.
In the early 1900s, Rockville began to experience a period of rapid growth and development. The city was connected to Washington, D.C. by the Washington, Baltimore and Annapolis Electric Railway in 1908. This allowed for easy access to the city and helped to spur further growth.
In the 1950s, Rockville experienced a period of suburbanization. The city was transformed from a small rural town to a bustling suburban city. This period of growth and development continued into the 1970s and 1980s.
Geography
Rockville is located in Montgomery County, Maryland, about 20 miles northwest of Washington, D.C. The city is situated in the Piedmont region of Maryland, which is characterized by rolling hills and valleys. The city is located at the intersection of two major highways, I-270 and I-370.
The city has a total area of 13.2 square miles, of which 12.9 square miles is land and 0.3 square miles is water. The city is located at an elevation of about 500 feet above sea level.
Economy
Rockville’s economy is largely based on the service industry. The city is home to a number of government agencies, including the National Institutes of Health, the Food and Drug Administration, and the Nuclear Regulatory Commission. The city is also home to a number of corporate headquarters, including Lockheed Martin, Marriott International, and Choice Hotels International.
The city is also home to a number of retail and entertainment venues, including the Rockville Town Center, the Rockville Metro Station, and the Rockville Pike.
Demographics
As of the 2010 census, Rockville had a population of 66,098 people. The racial makeup of the city was 57.2% White, 16.3% African American, 0.3% Native American, 16.7% Asian, 0.1% Pacific Islander, and 8.4% from other races. Hispanic or Latino of any race were 15.2% of the population.
The median income for a household in the city was $76,824, and the median income for a family was $90,945. The per capita income for the city was $37,845. About 5.2% of families and 7.3% of the population were below the poverty line, including 8.2% of those under age 18 and 5.2% of those age 65 or over.
Rockville is a diverse city with a rich history and a vibrant economy. The city is home to a number of government agencies, corporate headquarters, and retail and entertainment venues. The city has a population of about 66,000 people and is the third largest city in Maryland.
Common Questions
What is Per Capita Income in Rockville?
Per Capita income in Rockville is $61,412.
What is the Median Family Income in Rockville?
Median Family Income in Rockville is $148,288.
What is the Median Household income in Rockville?
Median Household Income in Rockville is $122,470.
What is Income or Wage Gap in Rockville?
Income or Wage Gap in Rockville is 33.2%.
Women in Rockville earn 66.8 cents for every dollar earned by a man.
What is Family Income Deficit in Rockville?
Family Income Deficit in Rockville is $8,223.
Families that are below poverty line in Rockville earn $8,223 less on average than the poverty threshold level.
What is Inequality or Gini Index in Rockville?
Inequality or Gini Index in Rockville is 0.42.
What is the Total Population of Rockville?
Total Population of Rockville is 67,142.
What is the Total Male Population of Rockville?
Total Male Population of Rockville is 32,410.
What is the Total Female Population of Rockville?
Total Female Population of Rockville is 34,732.
What is the Ratio of Males per 100 Females in Rockville?
There are 93.31 Males per 100 Females in Rockville.
What is the Ratio of Females per 100 Males in Rockville?
There are 107.16 Females per 100 Males in Rockville.
What is the Median Population Age in Rockville?
Median Population Age in Rockville is 38.8 Years.
What is the Average Family Size in Rockville
Average Family Size in Rockville is 3.1 People.
What is the Average Household Size in Rockville
Average Household Size in Rockville is 2.5 People.
How Large is the Labor Force in Rockville?
There are 37,728 People in the Labor Forcein in Rockville.
What is the Percentage of People in the Labor Force in Rockville?
68.5% of People are in the Labor Force in Rockville.
What is the Unemployment Rate in Rockville?
Unemployment Rate in Rockville is 3.6%.