Brookmont, MD Map & Demographics
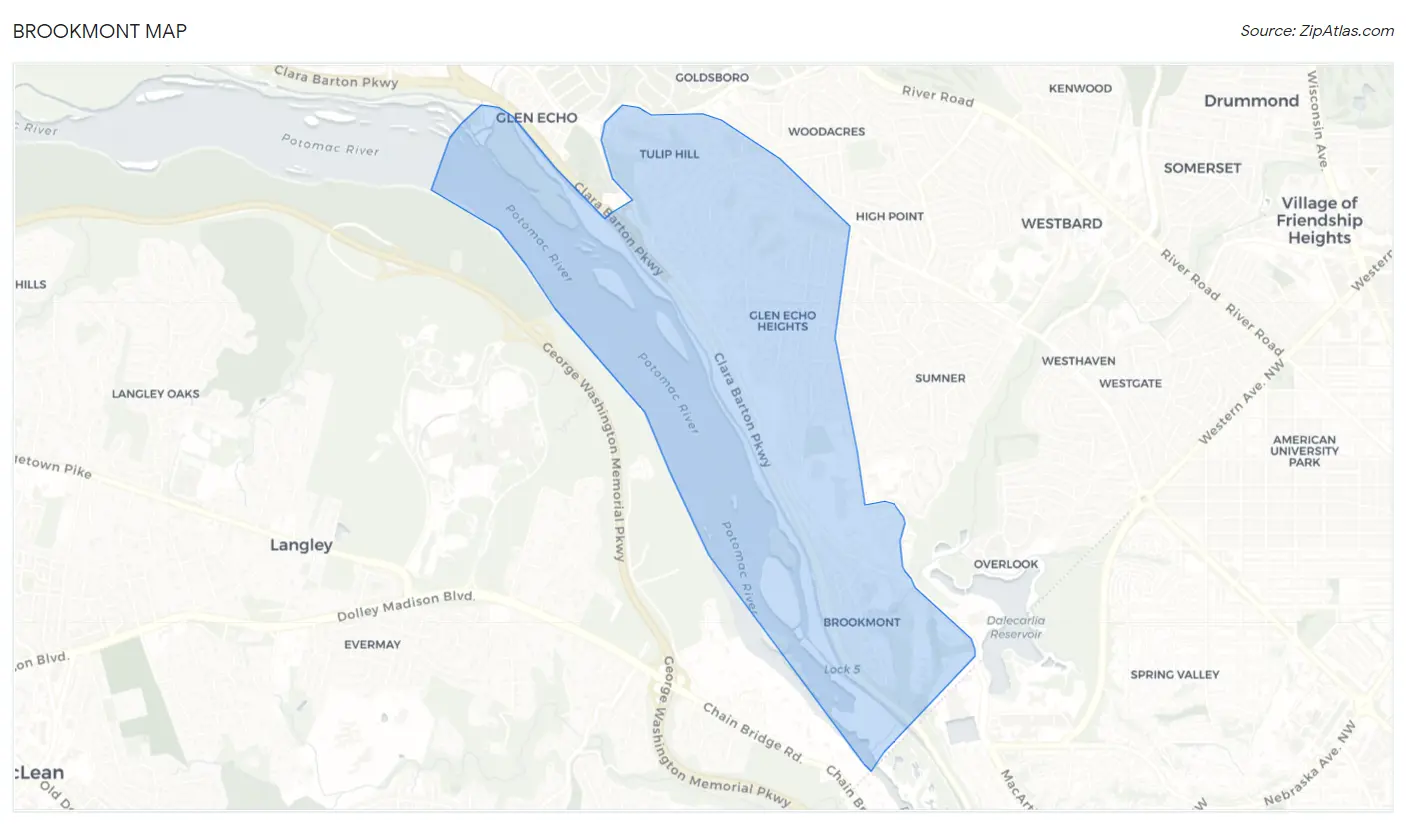
Brookmont Map
Brookmont Overview
$151,366
PER CAPITA INCOME
$250,001
AVG FAMILY INCOME
$250,001
AVG HOUSEHOLD INCOME
41.2%
WAGE / INCOME GAP [ % ]
58.8¢/ $1
WAGE / INCOME GAP [ $ ]
0.44
INEQUALITY / GINI INDEX
3,732
TOTAL POPULATION
1,954
MALE POPULATION
1,778
FEMALE POPULATION
109.90
MALES / 100 FEMALES
90.99
FEMALES / 100 MALES
45.9
MEDIAN AGE
3.1
AVG FAMILY SIZE
2.9
AVG HOUSEHOLD SIZE
2,139
LABOR FORCE [ PEOPLE ]
76.6%
PERCENT IN LABOR FORCE
6.2%
UNEMPLOYMENT RATE
Income in Brookmont
Income Overview in Brookmont
Per Capita Income in Brookmont is $151,366, while median incomes of families and households are $250,001 and $250,001 respectively.
| Characteristic | Number | Measure |
| Per Capita Income | 3,732 | $151,366 |
| Median Family Income | 1,095 | $250,001 |
| Mean Family Income | 1,095 | $478,391 |
| Median Household Income | 1,298 | $250,001 |
| Mean Household Income | 1,298 | $434,332 |
| Income Deficit | 1,095 | $0 |
| Wage / Income Gap (%) | 3,732 | 41.23% |
| Wage / Income Gap ($) | 3,732 | 58.77¢ per $1 |
| Gini / Inequality Index | 3,732 | 0.44 |
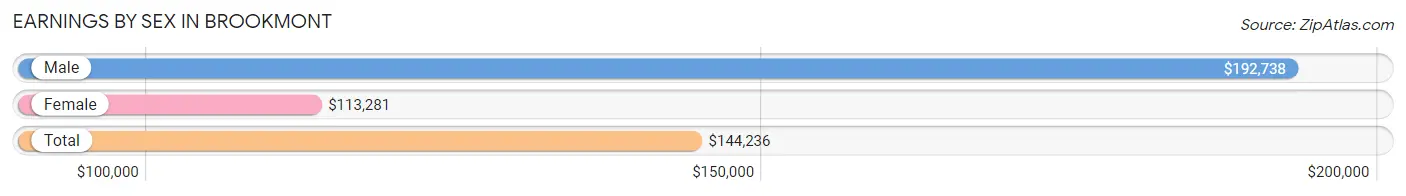
Earnings by Sex in Brookmont
Average Earnings in Brookmont are $144,236, $192,738 for men and $113,281 for women, a difference of 41.2%.
| Sex | Number | Average Earnings |
| Male | 1,120 (50.5%) | $192,738 |
| Female | 1,099 (49.5%) | $113,281 |
| Total | 2,219 (100.0%) | $144,236 |
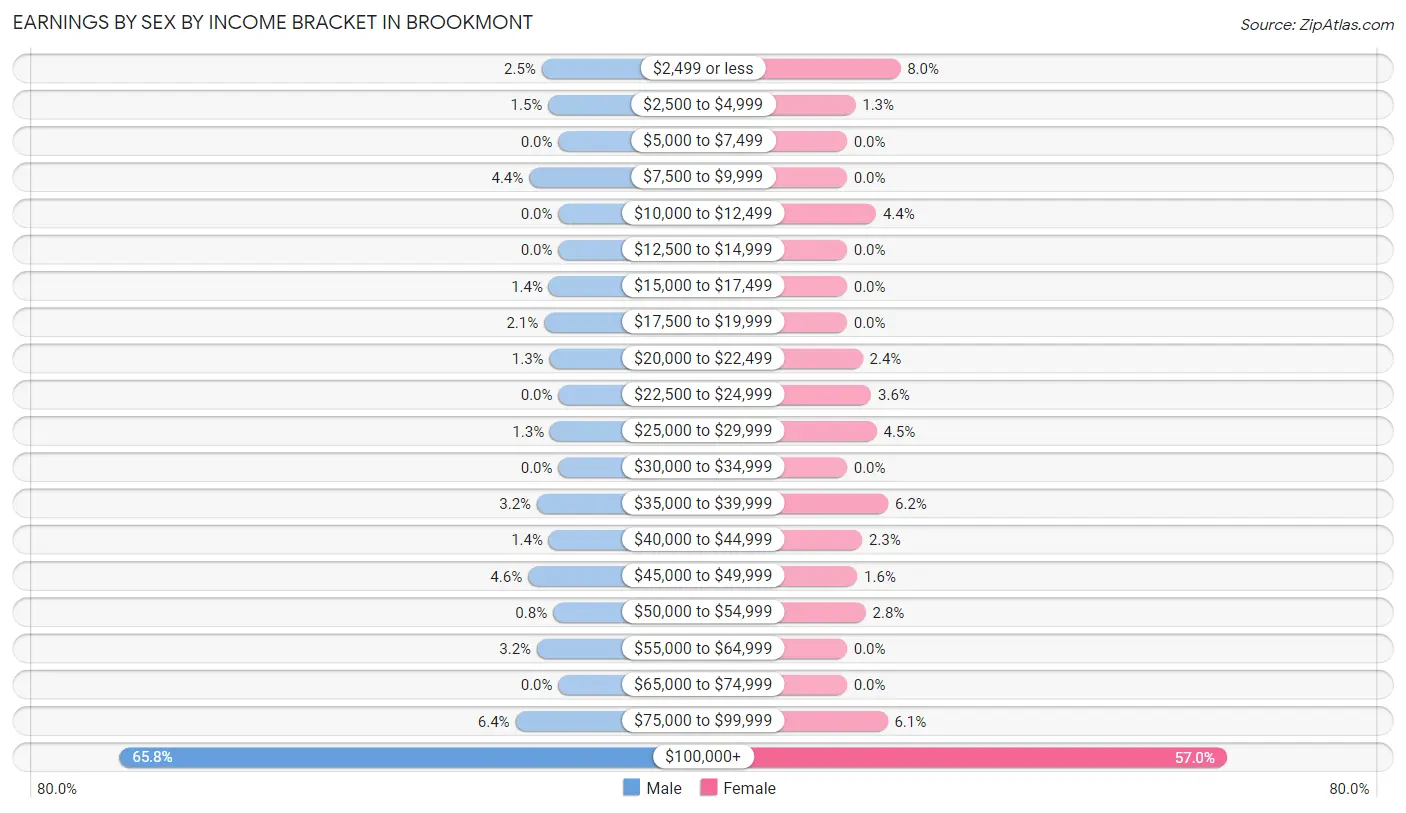
Earnings by Sex by Income Bracket in Brookmont
The most common earnings brackets in Brookmont are $100,000+ for men (737 | 65.8%) and $100,000+ for women (626 | 57.0%).
| Income | Male | Female |
| $2,499 or less | 28 (2.5%) | 88 (8.0%) |
| $2,500 to $4,999 | 17 (1.5%) | 14 (1.3%) |
| $5,000 to $7,499 | 0 (0.0%) | 0 (0.0%) |
| $7,500 to $9,999 | 49 (4.4%) | 0 (0.0%) |
| $10,000 to $12,499 | 0 (0.0%) | 48 (4.4%) |
| $12,500 to $14,999 | 0 (0.0%) | 0 (0.0%) |
| $15,000 to $17,499 | 16 (1.4%) | 0 (0.0%) |
| $17,500 to $19,999 | 24 (2.1%) | 0 (0.0%) |
| $20,000 to $22,499 | 15 (1.3%) | 26 (2.4%) |
| $22,500 to $24,999 | 0 (0.0%) | 40 (3.6%) |
| $25,000 to $29,999 | 14 (1.3%) | 49 (4.5%) |
| $30,000 to $34,999 | 0 (0.0%) | 0 (0.0%) |
| $35,000 to $39,999 | 36 (3.2%) | 68 (6.2%) |
| $40,000 to $44,999 | 16 (1.4%) | 25 (2.3%) |
| $45,000 to $49,999 | 51 (4.5%) | 17 (1.5%) |
| $50,000 to $54,999 | 9 (0.8%) | 31 (2.8%) |
| $55,000 to $64,999 | 36 (3.2%) | 0 (0.0%) |
| $65,000 to $74,999 | 0 (0.0%) | 0 (0.0%) |
| $75,000 to $99,999 | 72 (6.4%) | 67 (6.1%) |
| $100,000+ | 737 (65.8%) | 626 (57.0%) |
| Total | 1,120 (100.0%) | 1,099 (100.0%) |
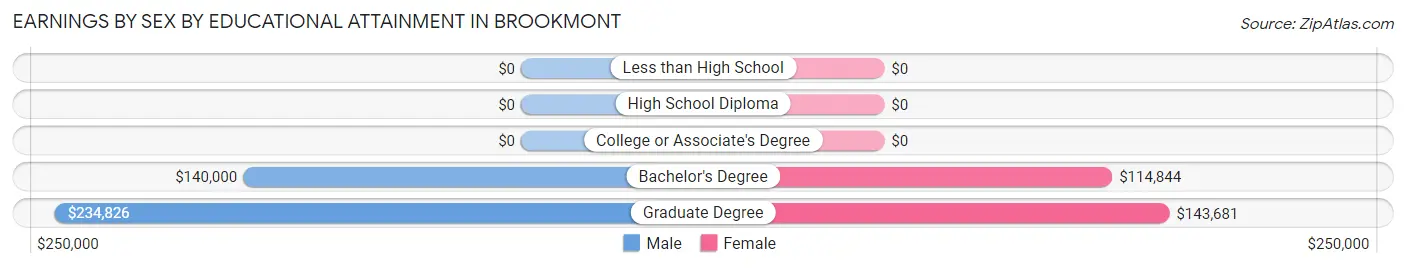
Earnings by Sex by Educational Attainment in Brookmont
Average earnings in Brookmont are $193,770 for men and $139,208 for women, a difference of 28.2%. Men with an educational attainment of graduate degree enjoy the highest average annual earnings of $234,826, while those with bachelor's degree education earn the least with $140,000. Women with an educational attainment of graduate degree earn the most with the average annual earnings of $143,681, while those with bachelor's degree education have the smallest earnings of $114,844.
| Educational Attainment | Male Income | Female Income |
| Less than High School | - | - |
| High School Diploma | - | - |
| College or Associate's Degree | - | - |
| Bachelor's Degree | $140,000 | $114,844 |
| Graduate Degree | $234,826 | $143,681 |
| Total | $193,770 | $139,208 |
Family Income in Brookmont
Family Income Brackets in Brookmont
According to the Brookmont family income data, there are 807 families falling into the $200,000+ income range, which is the most common income bracket and makes up 73.7% of all families.
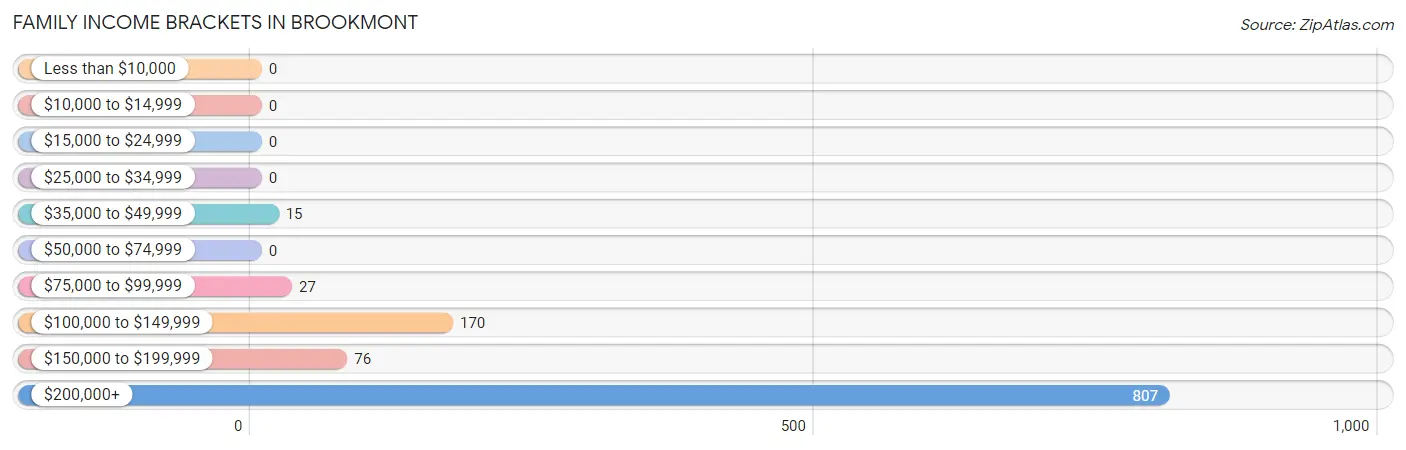
| Income Bracket | # Families | % Families |
| Less than $10,000 | 0 | 0.0% |
| $10,000 to $14,999 | 0 | 0.0% |
| $15,000 to $24,999 | 0 | 0.0% |
| $25,000 to $34,999 | 0 | 0.0% |
| $35,000 to $49,999 | 15 | 1.4% |
| $50,000 to $74,999 | 0 | 0.0% |
| $75,000 to $99,999 | 27 | 2.5% |
| $100,000 to $149,999 | 170 | 15.5% |
| $150,000 to $199,999 | 76 | 6.9% |
| $200,000+ | 807 | 73.7% |
Family Income by Famaliy Size in Brookmont
2-person families (519 | 47.4%) account for the highest median family income in Brookmont with $250,001 per family, while 2-person families (519 | 47.4%) have the highest median income of $125,000 per family member.
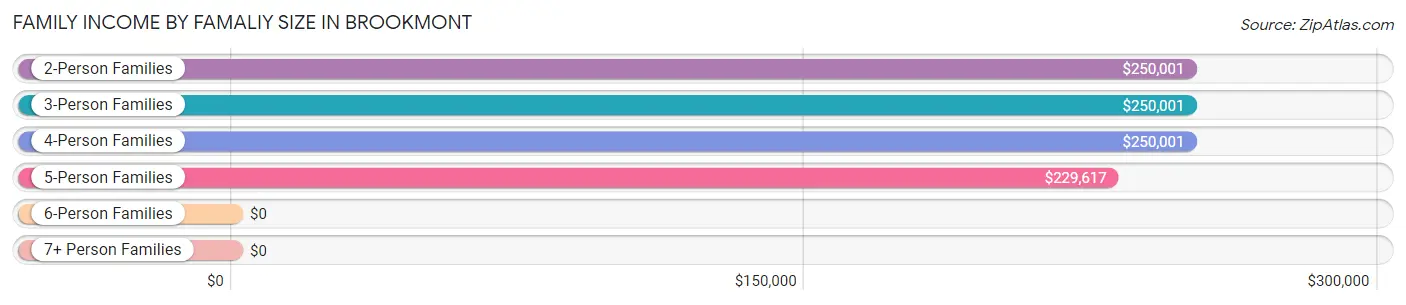
| Income Bracket | # Families | Median Income |
| 2-Person Families | 519 (47.4%) | $250,001 |
| 3-Person Families | 166 (15.2%) | $250,001 |
| 4-Person Families | 299 (27.3%) | $250,001 |
| 5-Person Families | 83 (7.6%) | $229,617 |
| 6-Person Families | 28 (2.6%) | $0 |
| 7+ Person Families | 0 (0.0%) | $0 |
| Total | 1,095 (100.0%) | $250,001 |
Family Income by Number of Earners in Brookmont
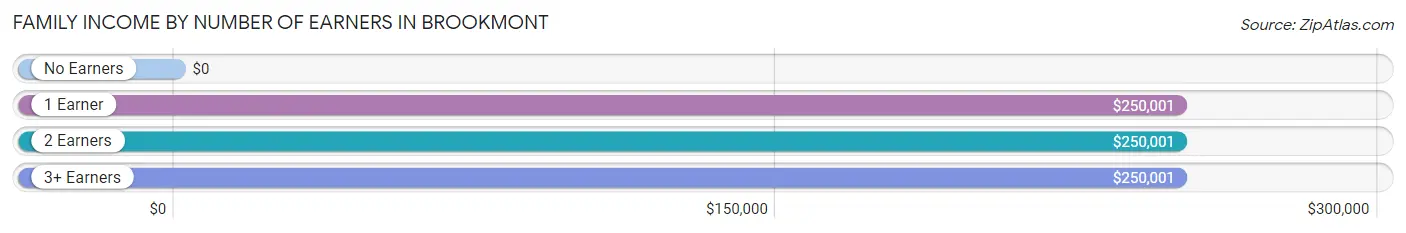
| Number of Earners | # Families | Median Income |
| No Earners | 20 (1.8%) | $0 |
| 1 Earner | 261 (23.8%) | $250,001 |
| 2 Earners | 730 (66.7%) | $250,001 |
| 3+ Earners | 84 (7.7%) | $250,001 |
| Total | 1,095 (100.0%) | $250,001 |
Household Income in Brookmont
Household Income Brackets in Brookmont
With 901 households falling in the category, the $200,000+ income range is the most frequent in Brookmont, accounting for 69.4% of all households.
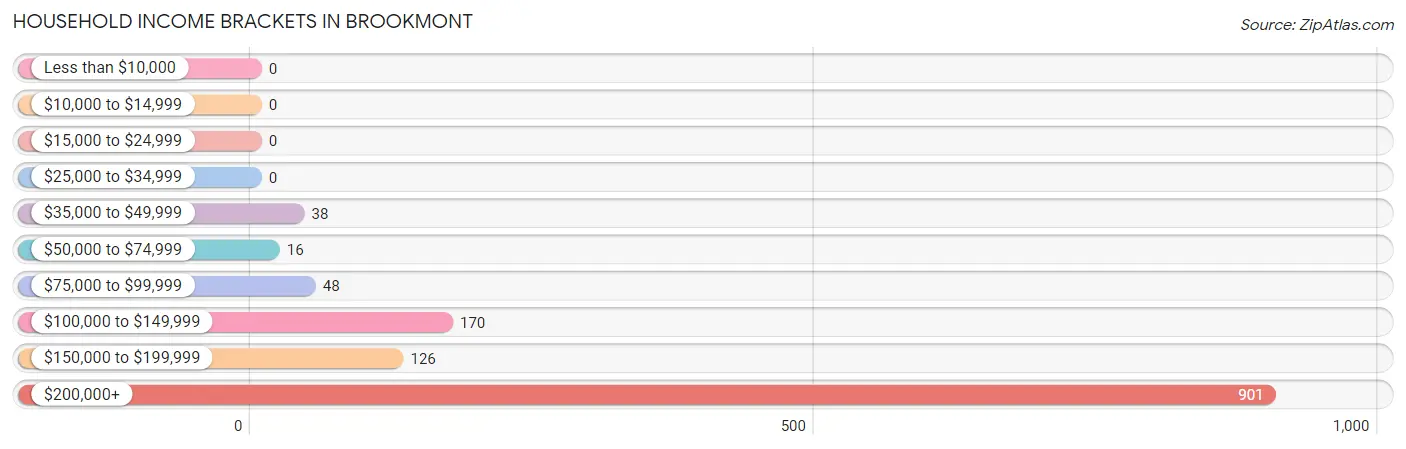
| Income Bracket | # Households | % Households |
| Less than $10,000 | 0 | 0.0% |
| $10,000 to $14,999 | 0 | 0.0% |
| $15,000 to $24,999 | 0 | 0.0% |
| $25,000 to $34,999 | 0 | 0.0% |
| $35,000 to $49,999 | 38 | 2.9% |
| $50,000 to $74,999 | 16 | 1.2% |
| $75,000 to $99,999 | 48 | 3.7% |
| $100,000 to $149,999 | 170 | 13.1% |
| $150,000 to $199,999 | 126 | 9.7% |
| $200,000+ | 901 | 69.4% |
Household Income by Householder Age in Brookmont
The median household income in Brookmont is $250,001, with the highest median household income of $250,001 found in the 25 to 44 years age bracket for the primary householder. A total of 212 households (16.3%) fall into this category.
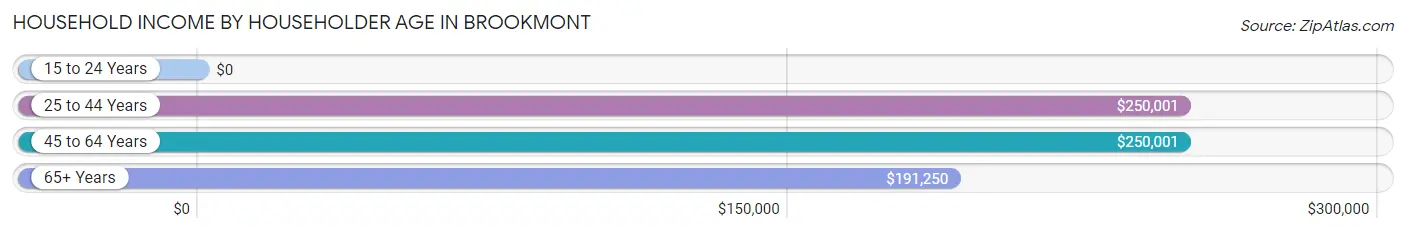
| Income Bracket | # Households | Median Income |
| 15 to 24 Years | 0 (0.0%) | $0 |
| 25 to 44 Years | 212 (16.3%) | $250,001 |
| 45 to 64 Years | 770 (59.3%) | $250,001 |
| 65+ Years | 316 (24.3%) | $191,250 |
| Total | 1,298 (100.0%) | $250,001 |
Poverty in Brookmont
Income Below Poverty by Sex and Age in Brookmont
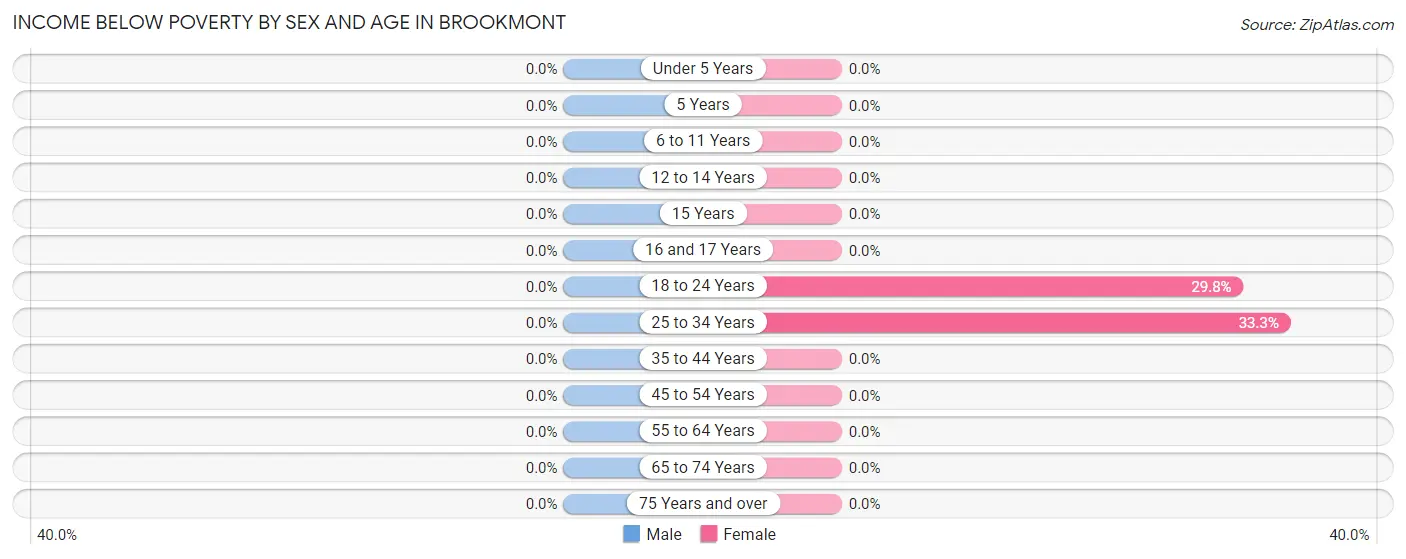
| Age Bracket | Male | Female |
| Under 5 Years | 0 (0.0%) | 0 (0.0%) |
| 5 Years | 0 (0.0%) | 0 (0.0%) |
| 6 to 11 Years | 0 (0.0%) | 0 (0.0%) |
| 12 to 14 Years | 0 (0.0%) | 0 (0.0%) |
| 15 Years | 0 (0.0%) | 0 (0.0%) |
| 16 and 17 Years | 0 (0.0%) | 0 (0.0%) |
| 18 to 24 Years | 0 (0.0%) | 17 (29.8%) |
| 25 to 34 Years | 0 (0.0%) | 24 (33.3%) |
| 35 to 44 Years | 0 (0.0%) | 0 (0.0%) |
| 45 to 54 Years | 0 (0.0%) | 0 (0.0%) |
| 55 to 64 Years | 0 (0.0%) | 0 (0.0%) |
| 65 to 74 Years | 0 (0.0%) | 0 (0.0%) |
| 75 Years and over | 0 (0.0%) | 0 (0.0%) |
| Total | 0 (0.0%) | 41 (2.3%) |
Income Above Poverty by Sex and Age in Brookmont
According to the poverty statistics in Brookmont, males aged under 5 years and females aged under 5 years are the age groups that are most secure financially, with 100.0% of males and 100.0% of females in these age groups living above the poverty line.
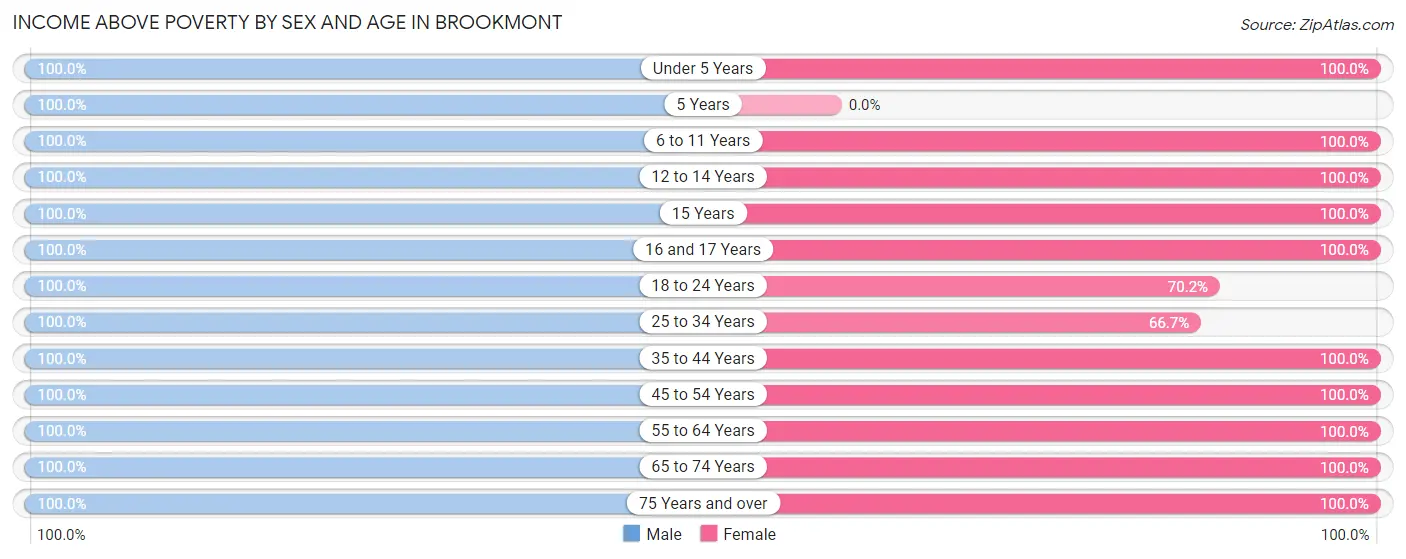
| Age Bracket | Male | Female |
| Under 5 Years | 52 (100.0%) | 14 (100.0%) |
| 5 Years | 15 (100.0%) | 0 (0.0%) |
| 6 to 11 Years | 271 (100.0%) | 210 (100.0%) |
| 12 to 14 Years | 122 (100.0%) | 121 (100.0%) |
| 15 Years | 109 (100.0%) | 14 (100.0%) |
| 16 and 17 Years | 55 (100.0%) | 119 (100.0%) |
| 18 to 24 Years | 142 (100.0%) | 40 (70.2%) |
| 25 to 34 Years | 49 (100.0%) | 48 (66.7%) |
| 35 to 44 Years | 154 (100.0%) | 197 (100.0%) |
| 45 to 54 Years | 346 (100.0%) | 388 (100.0%) |
| 55 to 64 Years | 353 (100.0%) | 344 (100.0%) |
| 65 to 74 Years | 107 (100.0%) | 116 (100.0%) |
| 75 Years and over | 179 (100.0%) | 115 (100.0%) |
| Total | 1,954 (100.0%) | 1,726 (97.7%) |
Income Below Poverty Among Married-Couple Families in Brookmont
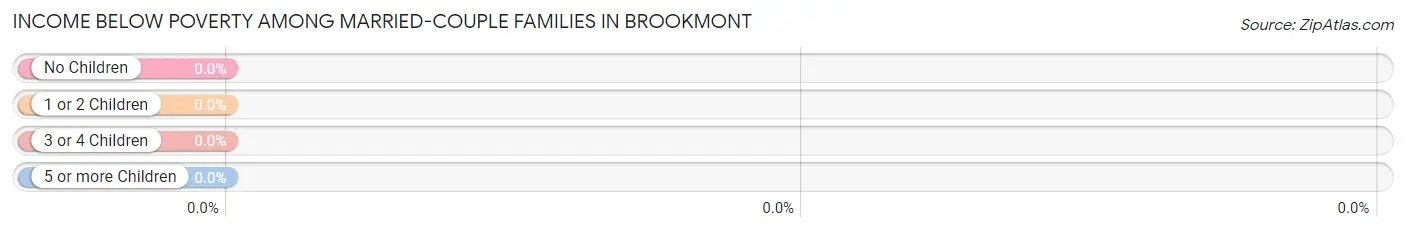
| Children | Above Poverty | Below Poverty |
| No Children | 502 (100.0%) | 0 (0.0%) |
| 1 or 2 Children | 343 (100.0%) | 0 (0.0%) |
| 3 or 4 Children | 94 (100.0%) | 0 (0.0%) |
| 5 or more Children | 0 (0.0%) | 0 (0.0%) |
| Total | 939 (100.0%) | 0 (0.0%) |
Income Below Poverty Among Single-Parent Households in Brookmont
| Children | Single Father | Single Mother |
| No Children | 0 (0.0%) | 0 (0.0%) |
| 1 or 2 Children | 0 (0.0%) | 0 (0.0%) |
| 3 or 4 Children | 0 (0.0%) | 0 (0.0%) |
| 5 or more Children | 0 (0.0%) | 0 (0.0%) |
| Total | 0 (0.0%) | 0 (0.0%) |
Income Below Poverty Among Married-Couple vs Single-Parent Households in Brookmont
| Children | Married-Couple Families | Single-Parent Households |
| No Children | 0 (0.0%) | 0 (0.0%) |
| 1 or 2 Children | 0 (0.0%) | 0 (0.0%) |
| 3 or 4 Children | 0 (0.0%) | 0 (0.0%) |
| 5 or more Children | 0 (0.0%) | 0 (0.0%) |
| Total | 0 (0.0%) | 0 (0.0%) |
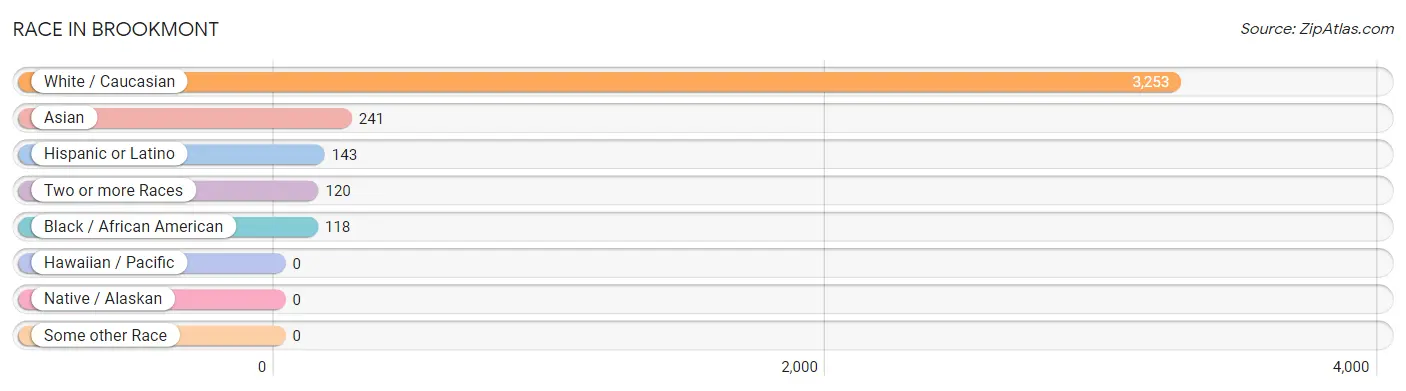
Race in Brookmont
The most populous races in Brookmont are White / Caucasian (3,253 | 87.2%), Asian (241 | 6.5%), and Hispanic or Latino (143 | 3.8%).
| Race | # Population | % Population |
| Asian | 241 | 6.5% |
| Black / African American | 118 | 3.2% |
| Hawaiian / Pacific | 0 | 0.0% |
| Hispanic or Latino | 143 | 3.8% |
| Native / Alaskan | 0 | 0.0% |
| White / Caucasian | 3,253 | 87.2% |
| Two or more Races | 120 | 3.2% |
| Some other Race | 0 | 0.0% |
| Total | 3,732 | 100.0% |
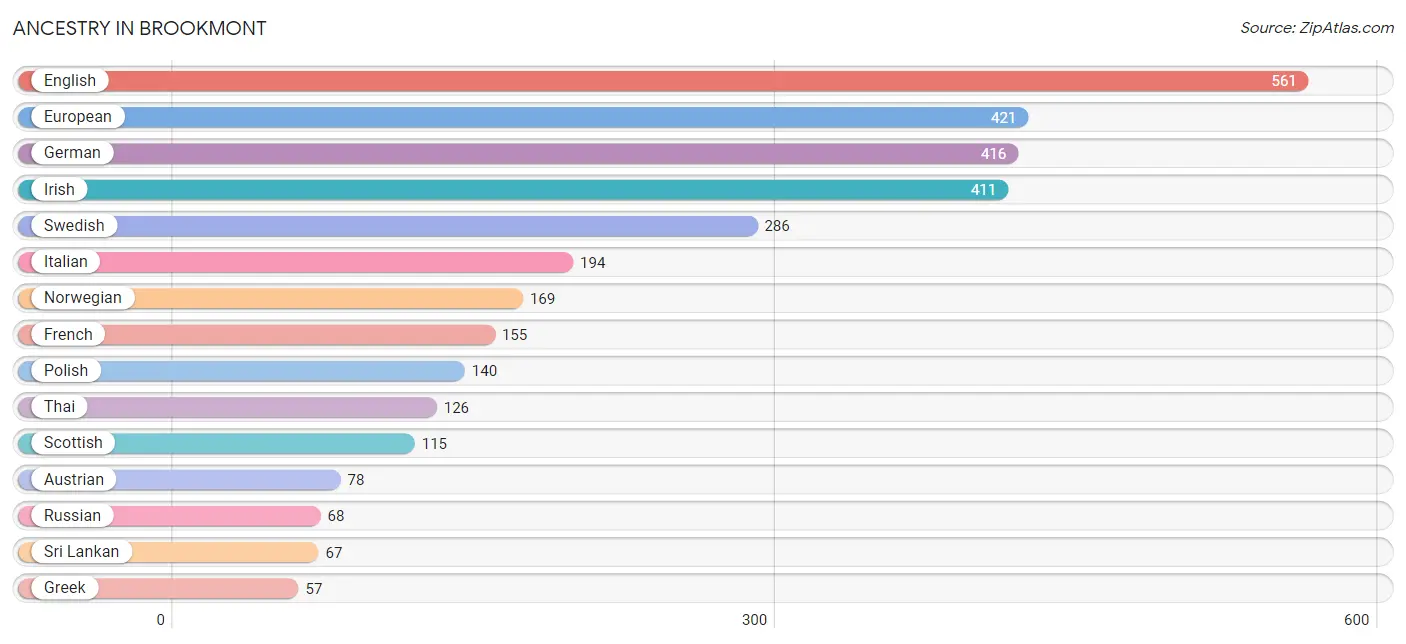
Ancestry in Brookmont
The most populous ancestries reported in Brookmont are English (561 | 15.0%), European (421 | 11.3%), German (416 | 11.2%), Irish (411 | 11.0%), and Swedish (286 | 7.7%), together accounting for 56.1% of all Brookmont residents.
| Ancestry | # Population | % Population |
| Alsatian | 23 | 0.6% |
| American | 45 | 1.2% |
| Austrian | 78 | 2.1% |
| Belgian | 42 | 1.1% |
| Brazilian | 12 | 0.3% |
| British | 26 | 0.7% |
| Dutch | 31 | 0.8% |
| Eastern European | 47 | 1.3% |
| Ecuadorian | 27 | 0.7% |
| English | 561 | 15.0% |
| European | 421 | 11.3% |
| Filipino | 45 | 1.2% |
| Finnish | 45 | 1.2% |
| French | 155 | 4.2% |
| German | 416 | 11.2% |
| Greek | 57 | 1.5% |
| Hungarian | 16 | 0.4% |
| Indian (Asian) | 45 | 1.2% |
| Irish | 411 | 11.0% |
| Italian | 194 | 5.2% |
| Jamaican | 14 | 0.4% |
| Mexican | 34 | 0.9% |
| Northern European | 17 | 0.5% |
| Norwegian | 169 | 4.5% |
| Peruvian | 25 | 0.7% |
| Polish | 140 | 3.7% |
| Puerto Rican | 21 | 0.6% |
| Romanian | 13 | 0.4% |
| Russian | 68 | 1.8% |
| Scandinavian | 49 | 1.3% |
| Scotch-Irish | 47 | 1.3% |
| Scottish | 115 | 3.1% |
| Serbian | 16 | 0.4% |
| South American | 52 | 1.4% |
| Sri Lankan | 67 | 1.8% |
| Swedish | 286 | 7.7% |
| Thai | 126 | 3.4% |
| Turkish | 45 | 1.2% |
| Ukrainian | 32 | 0.9% |
| Welsh | 15 | 0.4% | View All 40 Rows |
Immigrants in Brookmont
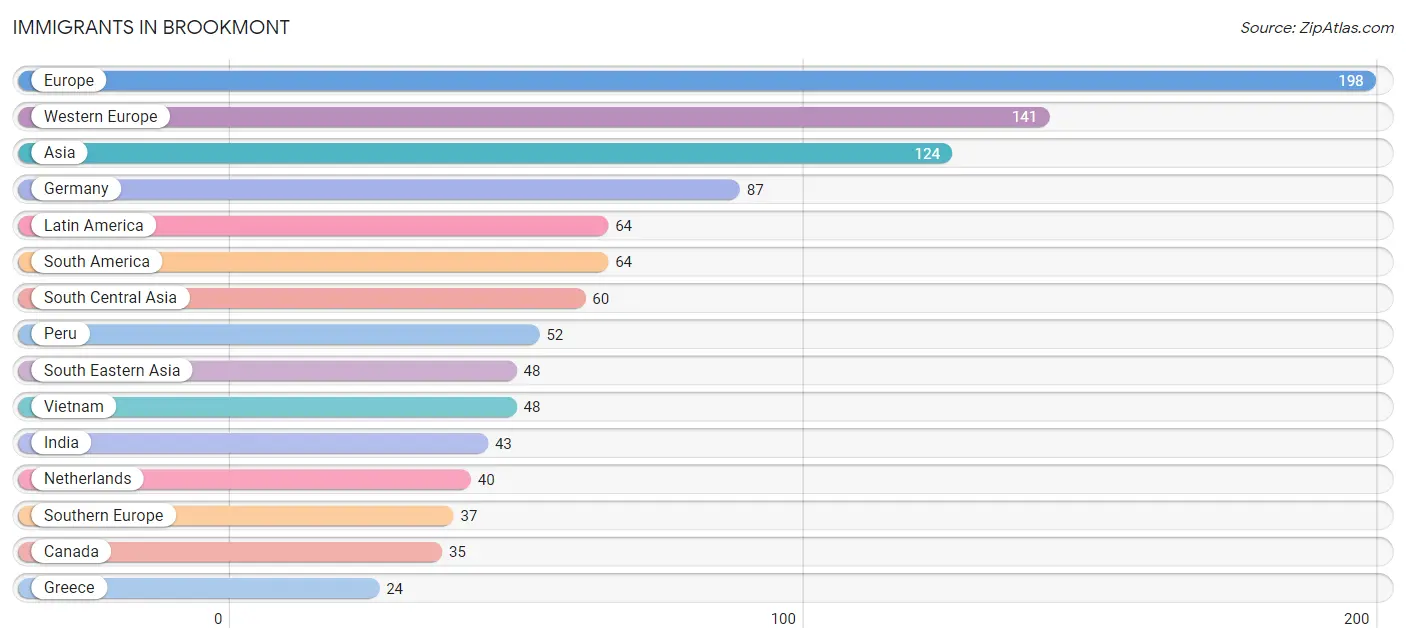
The most numerous immigrant groups reported in Brookmont came from Europe (198 | 5.3%), Western Europe (141 | 3.8%), Asia (124 | 3.3%), Germany (87 | 2.3%), and Latin America (64 | 1.7%), together accounting for 16.5% of all Brookmont residents.
| Immigration Origin | # Population | % Population |
| Asia | 124 | 3.3% |
| Bangladesh | 17 | 0.5% |
| Brazil | 12 | 0.3% |
| Canada | 35 | 0.9% |
| Europe | 198 | 5.3% |
| France | 14 | 0.4% |
| Germany | 87 | 2.3% |
| Greece | 24 | 0.6% |
| India | 43 | 1.1% |
| Italy | 13 | 0.4% |
| Latin America | 64 | 1.7% |
| Netherlands | 40 | 1.1% |
| Northern Europe | 20 | 0.5% |
| Peru | 52 | 1.4% |
| South America | 64 | 1.7% |
| South Central Asia | 60 | 1.6% |
| South Eastern Asia | 48 | 1.3% |
| Southern Europe | 37 | 1.0% |
| Turkey | 16 | 0.4% |
| Vietnam | 48 | 1.3% |
| Western Asia | 16 | 0.4% |
| Western Europe | 141 | 3.8% | View All 22 Rows |
Sex and Age in Brookmont
Sex and Age in Brookmont
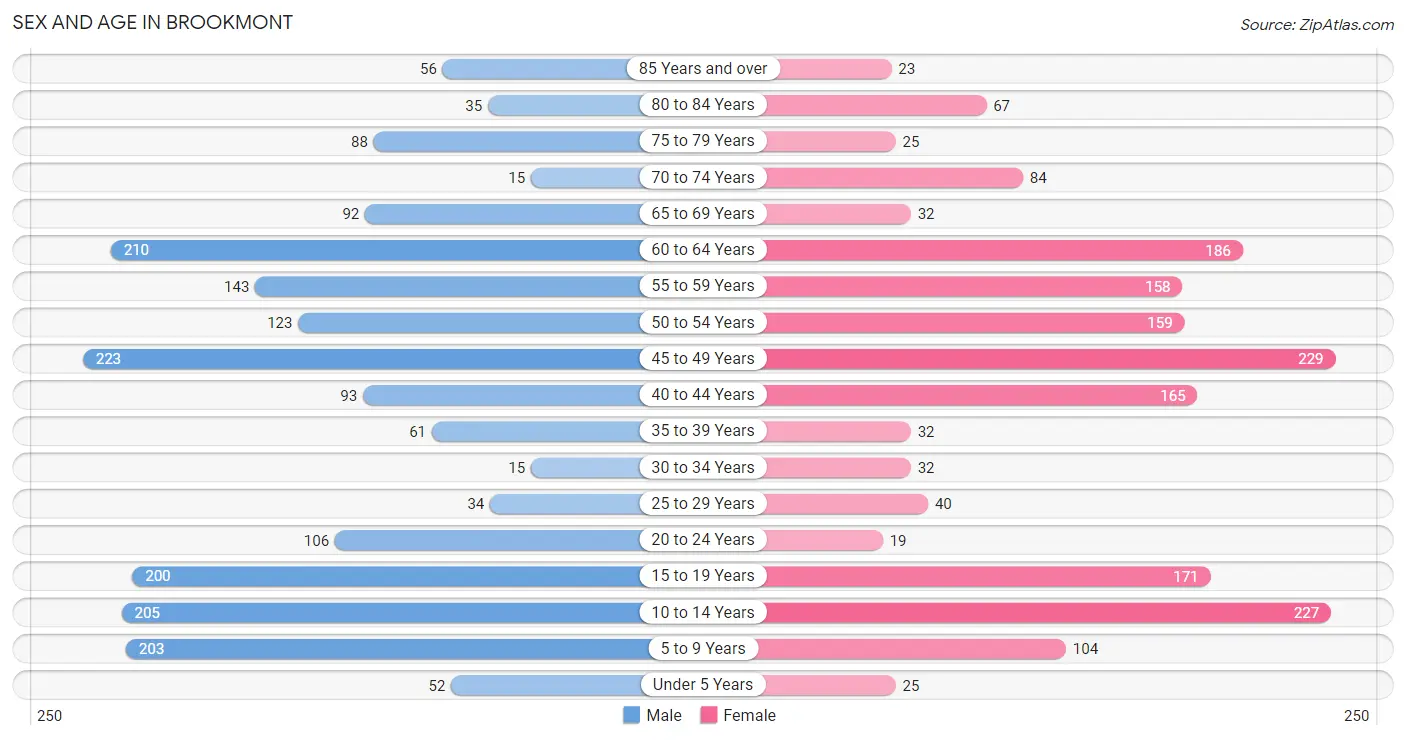
The most populous age groups in Brookmont are 45 to 49 Years (223 | 11.4%) for men and 45 to 49 Years (229 | 12.9%) for women.
| Age Bracket | Male | Female |
| Under 5 Years | 52 (2.7%) | 25 (1.4%) |
| 5 to 9 Years | 203 (10.4%) | 104 (5.9%) |
| 10 to 14 Years | 205 (10.5%) | 227 (12.8%) |
| 15 to 19 Years | 200 (10.2%) | 171 (9.6%) |
| 20 to 24 Years | 106 (5.4%) | 19 (1.1%) |
| 25 to 29 Years | 34 (1.7%) | 40 (2.2%) |
| 30 to 34 Years | 15 (0.8%) | 32 (1.8%) |
| 35 to 39 Years | 61 (3.1%) | 32 (1.8%) |
| 40 to 44 Years | 93 (4.8%) | 165 (9.3%) |
| 45 to 49 Years | 223 (11.4%) | 229 (12.9%) |
| 50 to 54 Years | 123 (6.3%) | 159 (8.9%) |
| 55 to 59 Years | 143 (7.3%) | 158 (8.9%) |
| 60 to 64 Years | 210 (10.7%) | 186 (10.5%) |
| 65 to 69 Years | 92 (4.7%) | 32 (1.8%) |
| 70 to 74 Years | 15 (0.8%) | 84 (4.7%) |
| 75 to 79 Years | 88 (4.5%) | 25 (1.4%) |
| 80 to 84 Years | 35 (1.8%) | 67 (3.8%) |
| 85 Years and over | 56 (2.9%) | 23 (1.3%) |
| Total | 1,954 (100.0%) | 1,778 (100.0%) |
Families and Households in Brookmont
Median Family Size in Brookmont
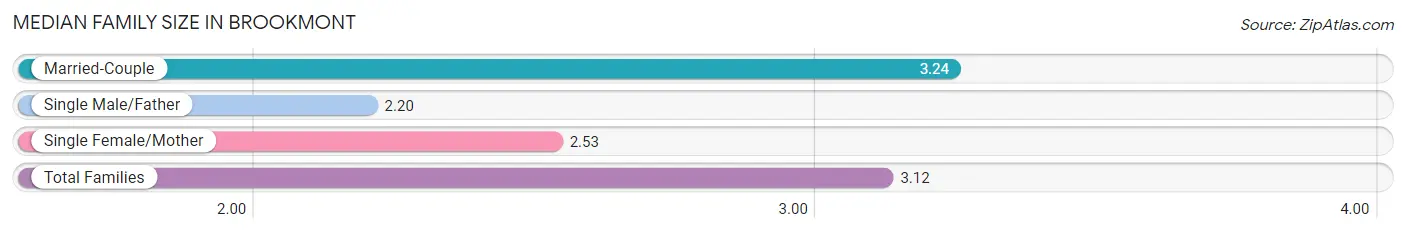
The median family size in Brookmont is 3.12 persons per family, with married-couple families (939 | 85.8%) accounting for the largest median family size of 3.24 persons per family. On the other hand, single male/father families (61 | 5.6%) represent the smallest median family size with 2.20 persons per family.
| Family Type | # Families | Family Size |
| Married-Couple | 939 (85.8%) | 3.24 |
| Single Male/Father | 61 (5.6%) | 2.20 |
| Single Female/Mother | 95 (8.7%) | 2.53 |
| Total Families | 1,095 (100.0%) | 3.12 |
Median Household Size in Brookmont
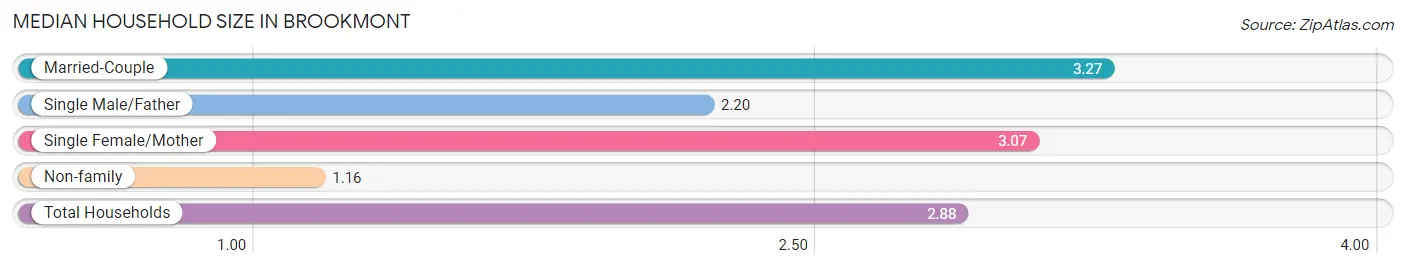
The median household size in Brookmont is 2.88 persons per household, with married-couple households (939 | 72.3%) accounting for the largest median household size of 3.27 persons per household. non-family households (203 | 15.6%) represent the smallest median household size with 1.16 persons per household.
| Household Type | # Households | Household Size |
| Married-Couple | 939 (72.3%) | 3.27 |
| Single Male/Father | 61 (4.7%) | 2.20 |
| Single Female/Mother | 95 (7.3%) | 3.07 |
| Non-family | 203 (15.6%) | 1.16 |
| Total Households | 1,298 (100.0%) | 2.88 |
Household Size by Marriage Status in Brookmont
Out of a total of 1,298 households in Brookmont, 1,095 (84.4%) are family households, while 203 (15.6%) are nonfamily households. The most numerous type of family households are 2-person households, comprising 496, and the most common type of nonfamily households are 1-person households, comprising 172.
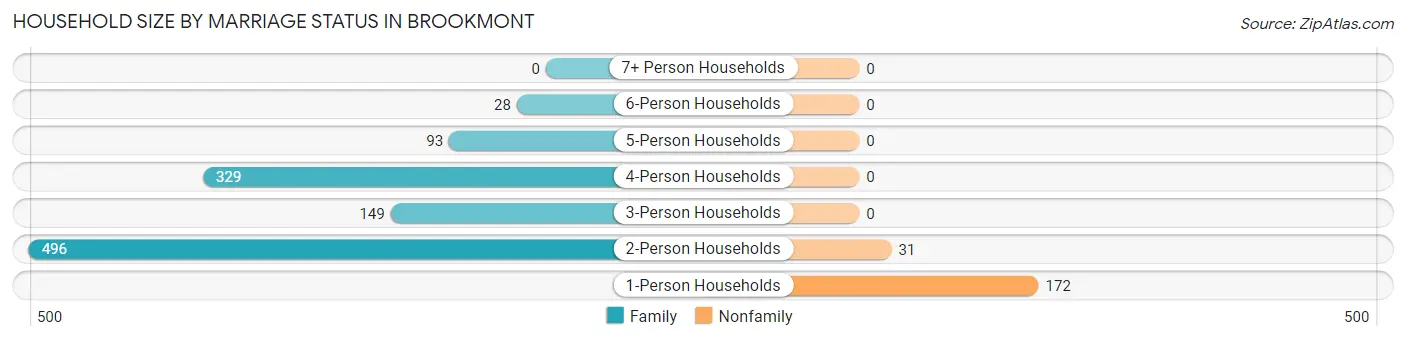
| Household Size | Family Households | Nonfamily Households |
| 1-Person Households | - | 172 (13.3%) |
| 2-Person Households | 496 (38.2%) | 31 (2.4%) |
| 3-Person Households | 149 (11.5%) | 0 (0.0%) |
| 4-Person Households | 329 (25.4%) | 0 (0.0%) |
| 5-Person Households | 93 (7.2%) | 0 (0.0%) |
| 6-Person Households | 28 (2.2%) | 0 (0.0%) |
| 7+ Person Households | 0 (0.0%) | 0 (0.0%) |
| Total | 1,095 (84.4%) | 203 (15.6%) |
Female Fertility in Brookmont
Fertility by Age in Brookmont
| Age Bracket | Women with Births | Births / 1,000 Women |
| 15 to 19 years | 0 (0.0%) | 0.0 |
| 20 to 34 years | 0 (0.0%) | 0.0 |
| 35 to 50 years | 0 (0.0%) | 0.0 |
| Total | 0 (0.0%) | 0.0 |
Fertility by Age by Marriage Status in Brookmont
| Age Bracket | Married | Unmarried |
| 15 to 19 years | 0 (0.0%) | 0 (0.0%) |
| 20 to 34 years | 0 (0.0%) | 0 (0.0%) |
| 35 to 50 years | 0 (0.0%) | 0 (0.0%) |
| Total | 0 (0.0%) | 0 (0.0%) |
Fertility by Education in Brookmont
| Educational Attainment | Women with Births | Births / 1,000 Women |
| Less than High School | 0 (0.0%) | 0.0 |
| High School Diploma | 0 (0.0%) | 0.0 |
| College or Associate's Degree | 0 (0.0%) | 0.0 |
| Bachelor's Degree | 0 (0.0%) | 0.0 |
| Graduate Degree | 0 (0.0%) | 0.0 |
| Total | 0 (0.0%) | 0.0 |
Fertility by Education by Marriage Status in Brookmont
| Educational Attainment | Married | Unmarried |
| Less than High School | 0 (0.0%) | 0 (0.0%) |
| High School Diploma | 0 (0.0%) | 0 (0.0%) |
| College or Associate's Degree | 0 (0.0%) | 0 (0.0%) |
| Bachelor's Degree | 0 (0.0%) | 0 (0.0%) |
| Graduate Degree | 0 (0.0%) | 0 (0.0%) |
| Total | 0 (0.0%) | 0 (0.0%) |
Employment Characteristics in Brookmont
Employment by Class of Employer in Brookmont
Among the 1,967 employed individuals in Brookmont, private company employees (855 | 43.5%), not-for-profit organizations (429 | 21.8%), and federal government employees (346 | 17.6%) make up the most common classes of employment.
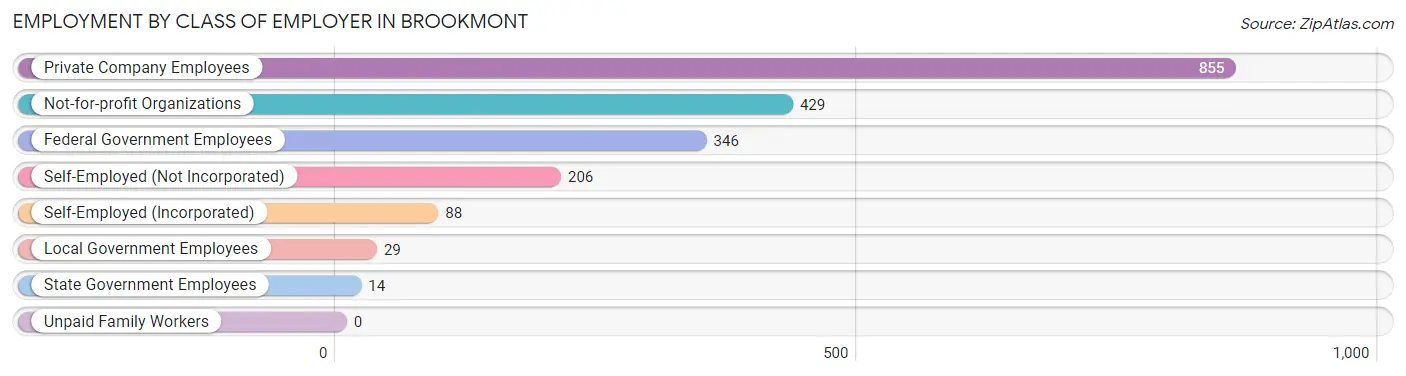
| Employer Class | # Employees | % Employees |
| Private Company Employees | 855 | 43.5% |
| Self-Employed (Incorporated) | 88 | 4.5% |
| Self-Employed (Not Incorporated) | 206 | 10.5% |
| Not-for-profit Organizations | 429 | 21.8% |
| Local Government Employees | 29 | 1.5% |
| State Government Employees | 14 | 0.7% |
| Federal Government Employees | 346 | 17.6% |
| Unpaid Family Workers | 0 | 0.0% |
| Total | 1,967 | 100.0% |
Employment Status by Age in Brookmont
According to the labor force statistics for Brookmont, out of the total population over 16 years of age (2,793), 76.6% or 2,139 individuals are in the labor force, with 6.2% or 133 of them unemployed. The age group with the highest labor force participation rate is 30 to 34 years, with 100.0% or 47 individuals in the labor force. Within the labor force, the 16 to 19 years age range has the highest percentage of unemployed individuals, with 100.0% or 17 of them being unemployed.
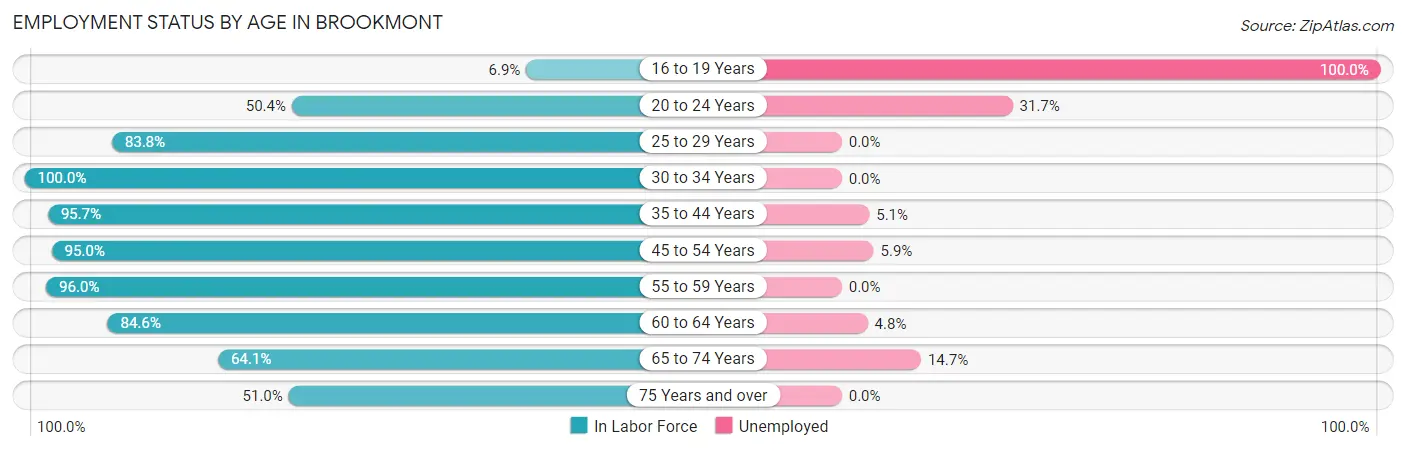
| Age Bracket | In Labor Force | Unemployed |
| 16 to 19 Years | 17 (6.9%) | 17 (100.0%) |
| 20 to 24 Years | 63 (50.4%) | 20 (31.7%) |
| 25 to 29 Years | 62 (83.8%) | 0 (0.0%) |
| 30 to 34 Years | 47 (100.0%) | 0 (0.0%) |
| 35 to 44 Years | 336 (95.7%) | 17 (5.1%) |
| 45 to 54 Years | 697 (95.0%) | 41 (5.9%) |
| 55 to 59 Years | 289 (96.0%) | 0 (0.0%) |
| 60 to 64 Years | 335 (84.6%) | 16 (4.8%) |
| 65 to 74 Years | 143 (64.1%) | 21 (14.7%) |
| 75 Years and over | 150 (51.0%) | 0 (0.0%) |
| Total | 2,139 (76.6%) | 133 (6.2%) |
Employment Status by Educational Attainment in Brookmont
According to labor force statistics for Brookmont, 92.8% of individuals (1,766) out of the total population between 25 and 64 years of age (1,903) are in the labor force, with 4.2% or 74 of them being unemployed. The group with the highest labor force participation rate are those with the educational attainment of high school diploma, with 100.0% or 16 individuals in the labor force. Within the labor force, individuals with bachelor's degree or higher education have the highest percentage of unemployment, with 4.4% or 74 of them being unemployed.
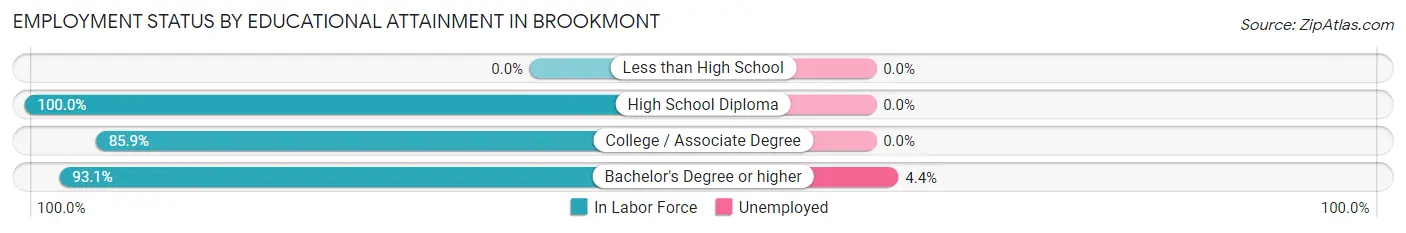
| Educational Attainment | In Labor Force | Unemployed |
| Less than High School | 0 (0.0%) | 0 (0.0%) |
| High School Diploma | 16 (100.0%) | 0 (0.0%) |
| College / Associate Degree | 73 (85.9%) | 0 (0.0%) |
| Bachelor's Degree or higher | 1,678 (93.1%) | 79 (4.4%) |
| Total | 1,766 (92.8%) | 80 (4.2%) |
Employment Occupations by Sex in Brookmont
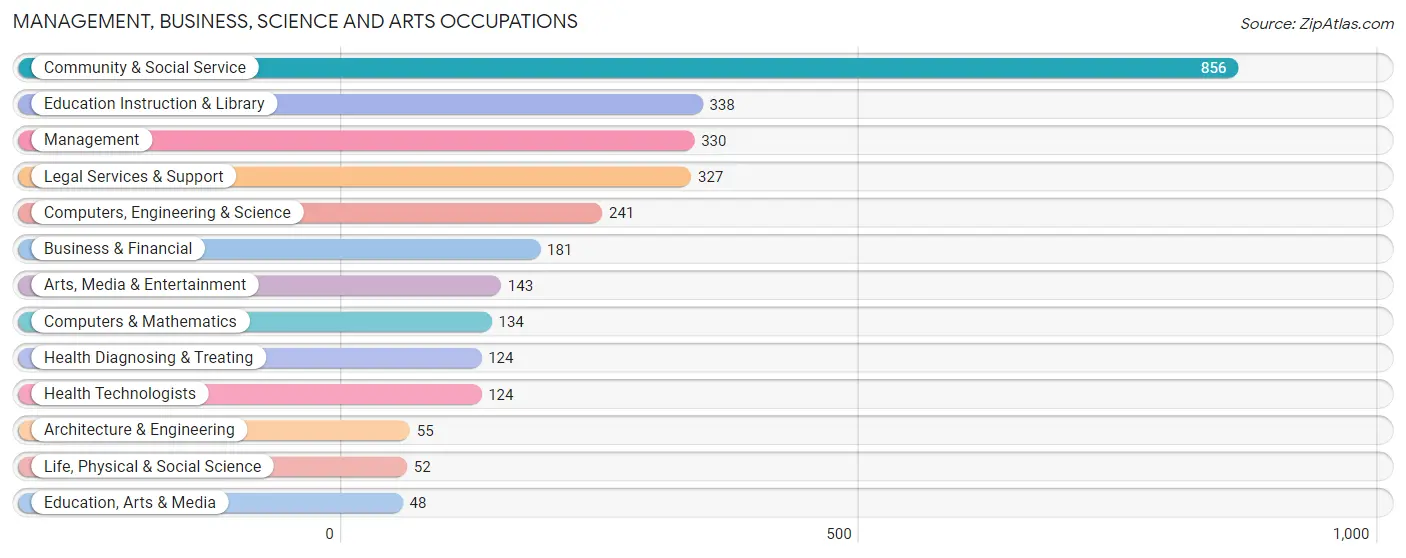
Management, Business, Science and Arts Occupations
The most common Management, Business, Science and Arts occupations in Brookmont are Community & Social Service (856 | 43.0%), Education Instruction & Library (338 | 17.0%), Management (330 | 16.6%), Legal Services & Support (327 | 16.4%), and Computers, Engineering & Science (241 | 12.1%).
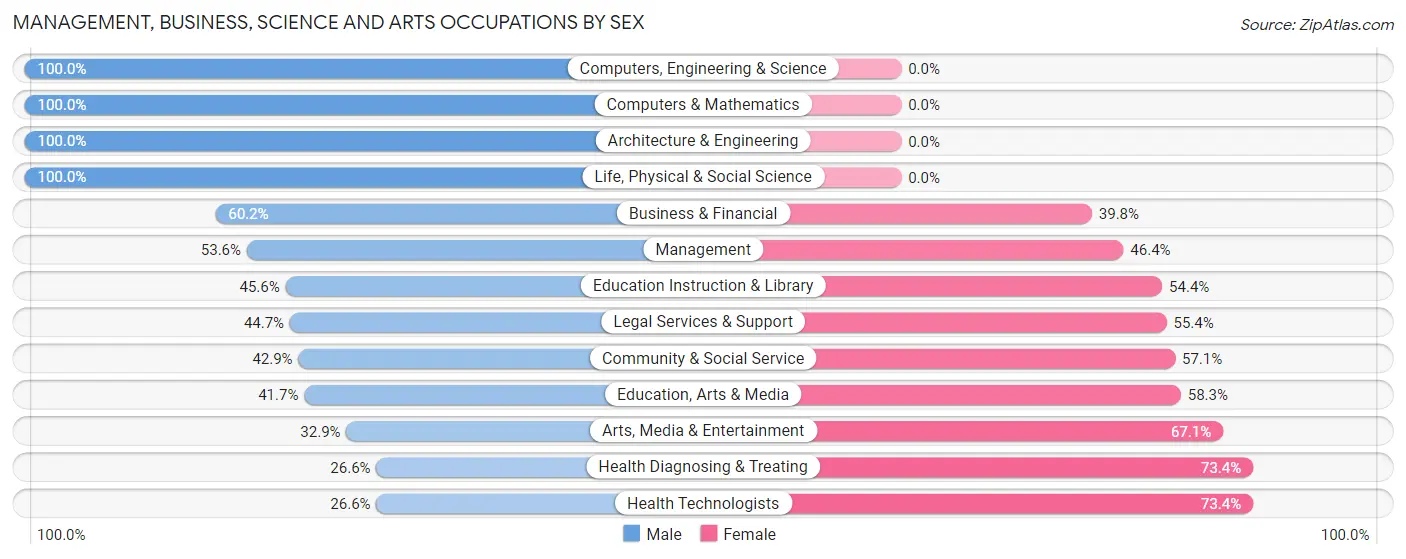
Management, Business, Science and Arts Occupations by Sex
Within the Management, Business, Science and Arts occupations in Brookmont, the most male-oriented occupations are Computers, Engineering & Science (100.0%), Computers & Mathematics (100.0%), and Architecture & Engineering (100.0%), while the most female-oriented occupations are Health Diagnosing & Treating (73.4%), Health Technologists (73.4%), and Arts, Media & Entertainment (67.1%).
| Occupation | Male | Female |
| Management | 177 (53.6%) | 153 (46.4%) |
| Business & Financial | 109 (60.2%) | 72 (39.8%) |
| Computers, Engineering & Science | 241 (100.0%) | 0 (0.0%) |
| Computers & Mathematics | 134 (100.0%) | 0 (0.0%) |
| Architecture & Engineering | 55 (100.0%) | 0 (0.0%) |
| Life, Physical & Social Science | 52 (100.0%) | 0 (0.0%) |
| Community & Social Service | 367 (42.9%) | 489 (57.1%) |
| Education, Arts & Media | 20 (41.7%) | 28 (58.3%) |
| Legal Services & Support | 146 (44.7%) | 181 (55.3%) |
| Education Instruction & Library | 154 (45.6%) | 184 (54.4%) |
| Arts, Media & Entertainment | 47 (32.9%) | 96 (67.1%) |
| Health Diagnosing & Treating | 33 (26.6%) | 91 (73.4%) |
| Health Technologists | 33 (26.6%) | 91 (73.4%) |
| Total (Category) | 927 (53.5%) | 805 (46.5%) |
| Total (Overall) | 1,058 (53.1%) | 933 (46.9%) |
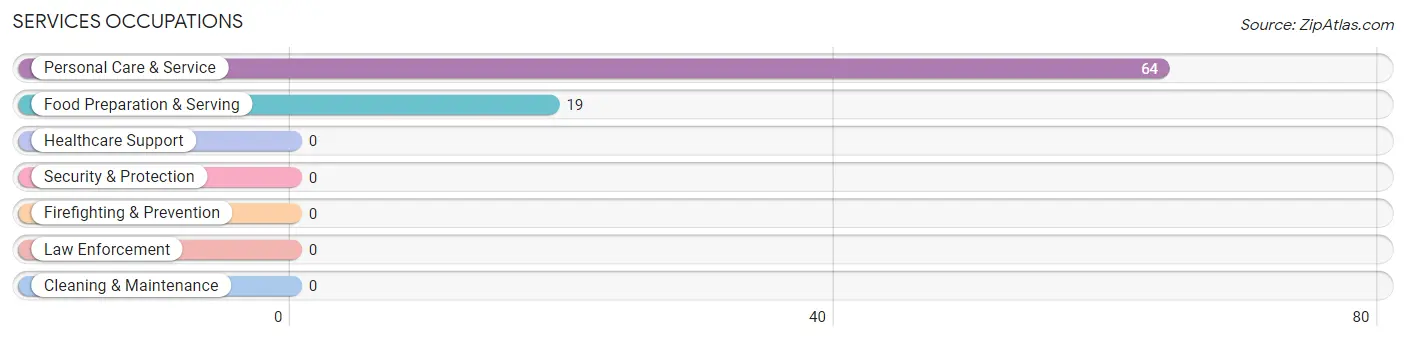
Services Occupations
The most common Services occupations in Brookmont are Personal Care & Service (64 | 3.2%), and Food Preparation & Serving (19 | 0.9%).
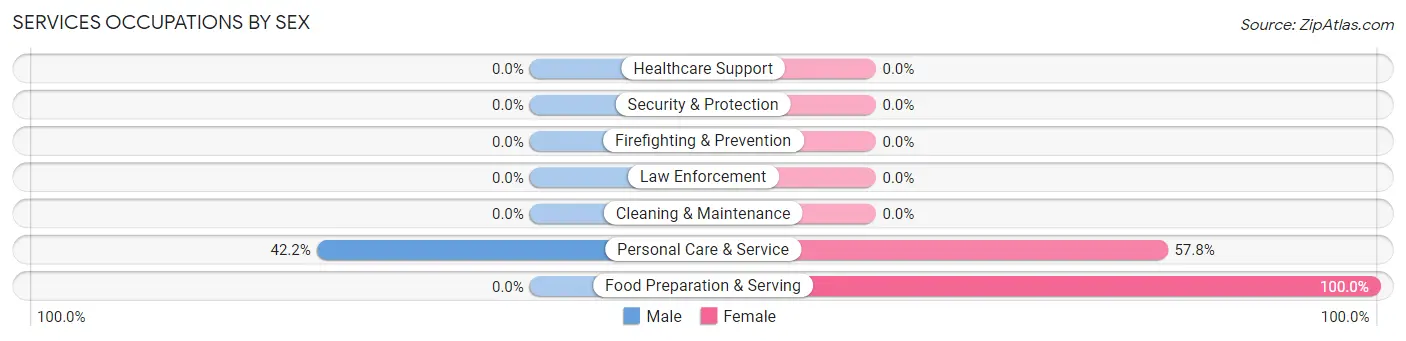
Services Occupations by Sex
| Occupation | Male | Female |
| Healthcare Support | 0 (0.0%) | 0 (0.0%) |
| Security & Protection | 0 (0.0%) | 0 (0.0%) |
| Firefighting & Prevention | 0 (0.0%) | 0 (0.0%) |
| Law Enforcement | 0 (0.0%) | 0 (0.0%) |
| Food Preparation & Serving | 0 (0.0%) | 19 (100.0%) |
| Cleaning & Maintenance | 0 (0.0%) | 0 (0.0%) |
| Personal Care & Service | 27 (42.2%) | 37 (57.8%) |
| Total (Category) | 27 (32.5%) | 56 (67.5%) |
| Total (Overall) | 1,058 (53.1%) | 933 (46.9%) |
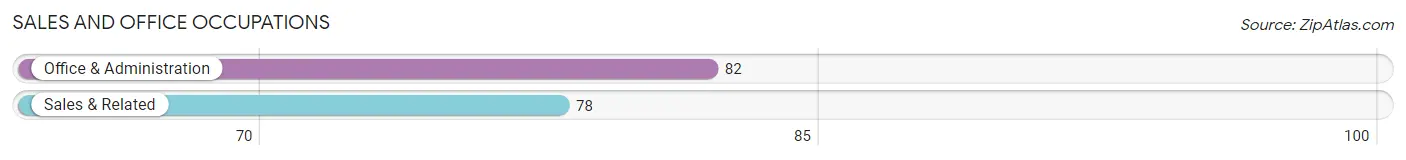
Sales and Office Occupations
The most common Sales and Office occupations in Brookmont are Office & Administration (82 | 4.1%), and Sales & Related (78 | 3.9%).
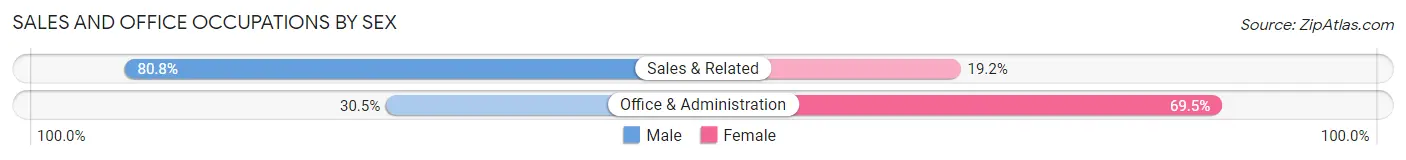
Sales and Office Occupations by Sex
| Occupation | Male | Female |
| Sales & Related | 63 (80.8%) | 15 (19.2%) |
| Office & Administration | 25 (30.5%) | 57 (69.5%) |
| Total (Category) | 88 (55.0%) | 72 (45.0%) |
| Total (Overall) | 1,058 (53.1%) | 933 (46.9%) |
Natural Resources, Construction and Maintenance Occupations
Natural Resources, Construction and Maintenance Occupations by Sex
| Occupation | Male | Female |
| Farming, Fishing & Forestry | 0 (0.0%) | 0 (0.0%) |
| Construction & Extraction | 0 (0.0%) | 0 (0.0%) |
| Installation, Maintenance & Repair | 0 (0.0%) | 0 (0.0%) |
| Total (Category) | 0 (0.0%) | 0 (0.0%) |
| Total (Overall) | 1,058 (53.1%) | 933 (46.9%) |
Production, Transportation and Moving Occupations
The most common Production, Transportation and Moving occupations in Brookmont are , and Production (16 | 0.8%).
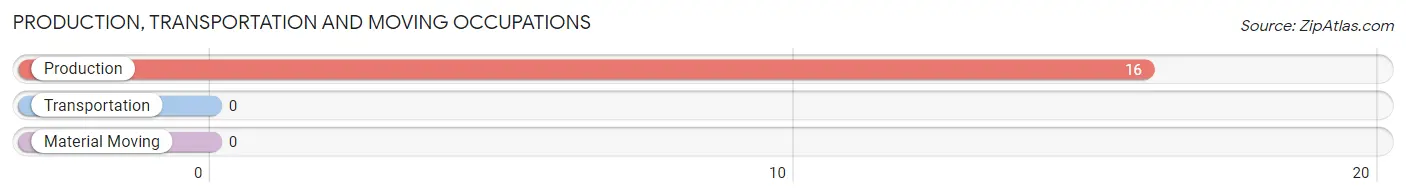
Production, Transportation and Moving Occupations by Sex
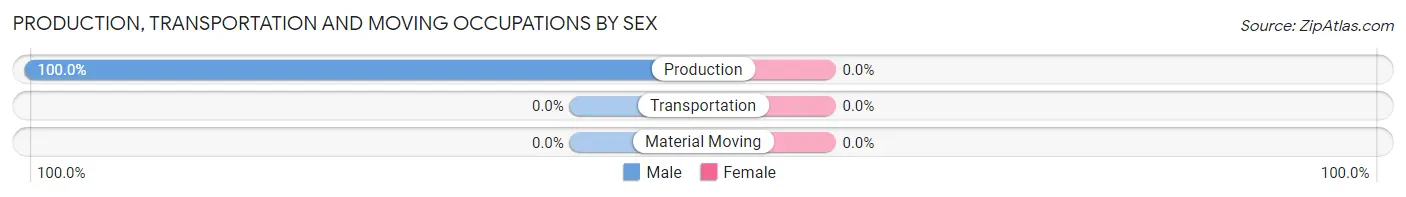
| Occupation | Male | Female |
| Production | 16 (100.0%) | 0 (0.0%) |
| Transportation | 0 (0.0%) | 0 (0.0%) |
| Material Moving | 0 (0.0%) | 0 (0.0%) |
| Total (Category) | 16 (100.0%) | 0 (0.0%) |
| Total (Overall) | 1,058 (53.1%) | 933 (46.9%) |
Employment Industries by Sex in Brookmont
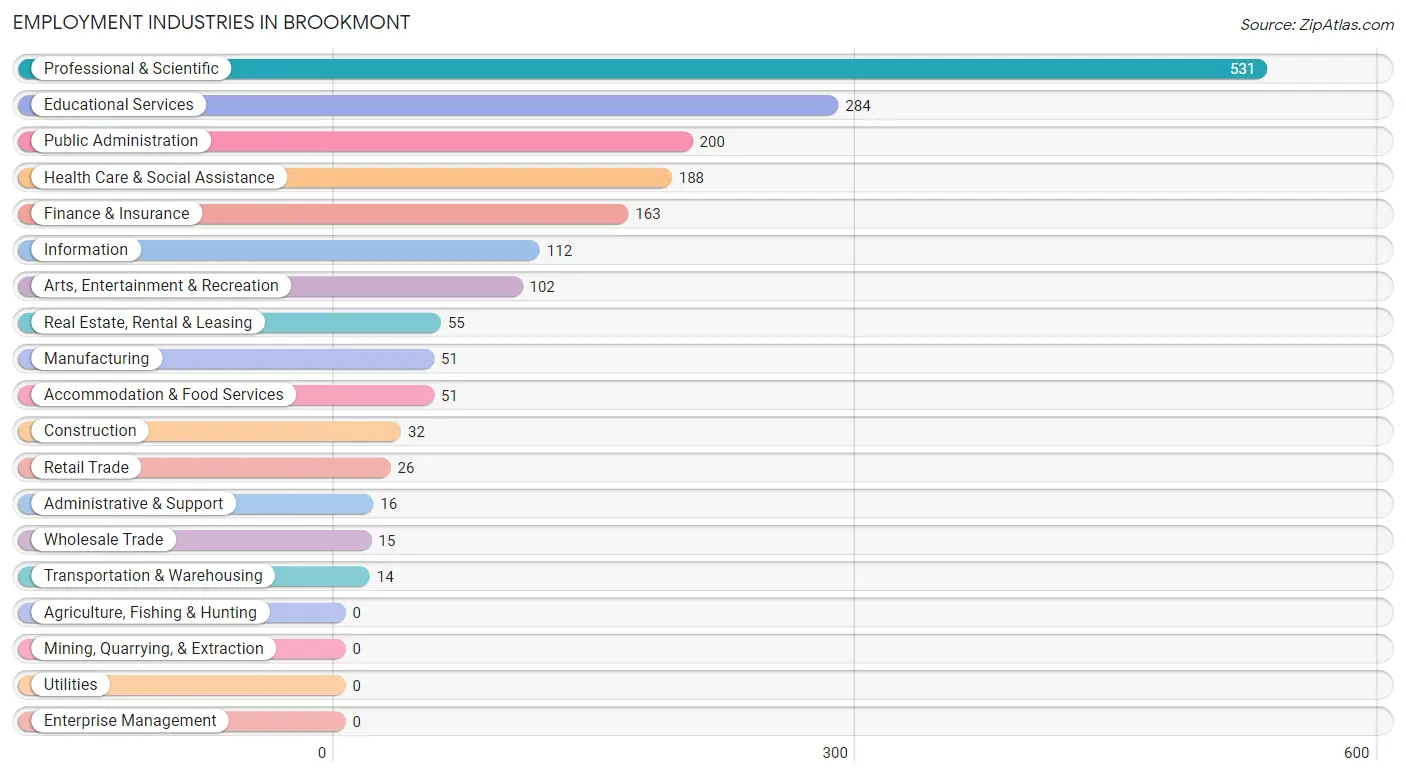
Employment Industries in Brookmont
The major employment industries in Brookmont include Professional & Scientific (531 | 26.7%), Educational Services (284 | 14.3%), Public Administration (200 | 10.1%), Health Care & Social Assistance (188 | 9.4%), and Finance & Insurance (163 | 8.2%).
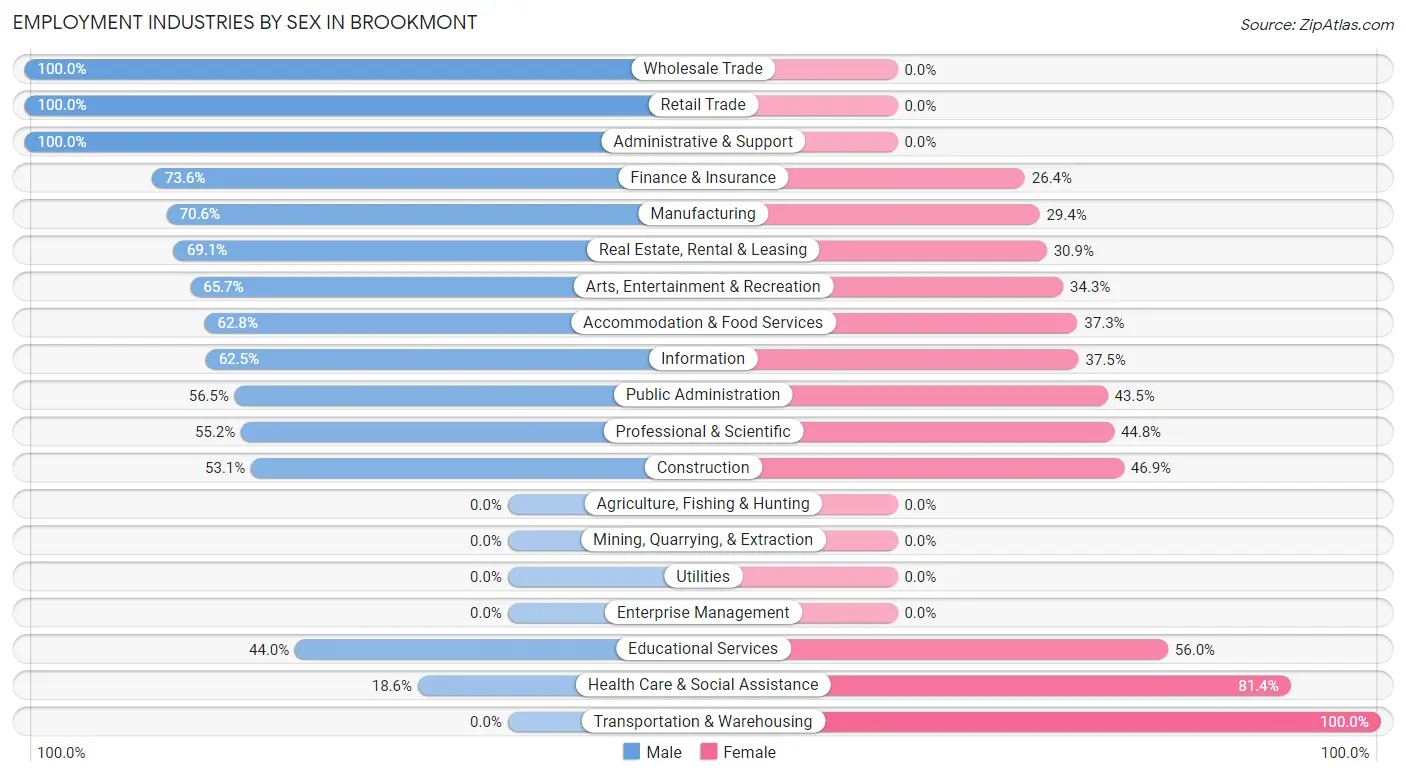
Employment Industries by Sex in Brookmont
The Brookmont industries that see more men than women are Wholesale Trade (100.0%), Retail Trade (100.0%), and Administrative & Support (100.0%), whereas the industries that tend to have a higher number of women are Transportation & Warehousing (100.0%), Health Care & Social Assistance (81.4%), and Educational Services (56.0%).
| Industry | Male | Female |
| Agriculture, Fishing & Hunting | 0 (0.0%) | 0 (0.0%) |
| Mining, Quarrying, & Extraction | 0 (0.0%) | 0 (0.0%) |
| Construction | 17 (53.1%) | 15 (46.9%) |
| Manufacturing | 36 (70.6%) | 15 (29.4%) |
| Wholesale Trade | 15 (100.0%) | 0 (0.0%) |
| Retail Trade | 26 (100.0%) | 0 (0.0%) |
| Transportation & Warehousing | 0 (0.0%) | 14 (100.0%) |
| Utilities | 0 (0.0%) | 0 (0.0%) |
| Information | 70 (62.5%) | 42 (37.5%) |
| Finance & Insurance | 120 (73.6%) | 43 (26.4%) |
| Real Estate, Rental & Leasing | 38 (69.1%) | 17 (30.9%) |
| Professional & Scientific | 293 (55.2%) | 238 (44.8%) |
| Enterprise Management | 0 (0.0%) | 0 (0.0%) |
| Administrative & Support | 16 (100.0%) | 0 (0.0%) |
| Educational Services | 125 (44.0%) | 159 (56.0%) |
| Health Care & Social Assistance | 35 (18.6%) | 153 (81.4%) |
| Arts, Entertainment & Recreation | 67 (65.7%) | 35 (34.3%) |
| Accommodation & Food Services | 32 (62.7%) | 19 (37.2%) |
| Public Administration | 113 (56.5%) | 87 (43.5%) |
| Total | 1,058 (53.1%) | 933 (46.9%) |
Education in Brookmont
School Enrollment in Brookmont
The most common levels of schooling among the 1,304 students in Brookmont are middle school (398 | 30.5%), high school (381 | 29.2%), and elementary school (217 | 16.6%).
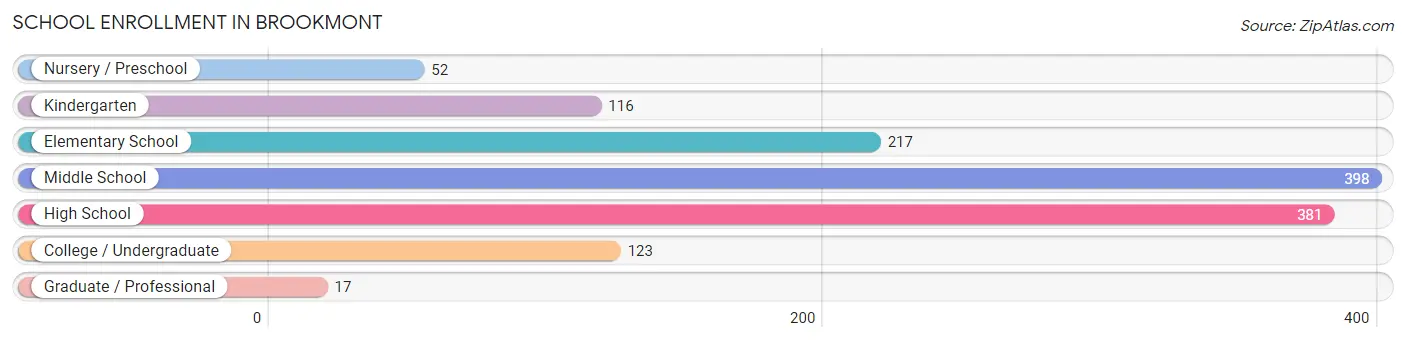
| School Level | # Students | % Students |
| Nursery / Preschool | 52 | 4.0% |
| Kindergarten | 116 | 8.9% |
| Elementary School | 217 | 16.6% |
| Middle School | 398 | 30.5% |
| High School | 381 | 29.2% |
| College / Undergraduate | 123 | 9.4% |
| Graduate / Professional | 17 | 1.3% |
| Total | 1,304 | 100.0% |
School Enrollment by Age by Funding Source in Brookmont
Out of a total of 1,304 students who are enrolled in schools in Brookmont, 672 (51.5%) attend a private institution, while the remaining 632 (48.5%) are enrolled in public schools. The age group of 3 to 4 year olds has the highest likelihood of being enrolled in private schools, with 66 (100.0% in the age bracket) enrolled. Conversely, the age group of 25 to 34 year olds has the lowest likelihood of being enrolled in a private school, with 29 (100.0% in the age bracket) attending a public institution.
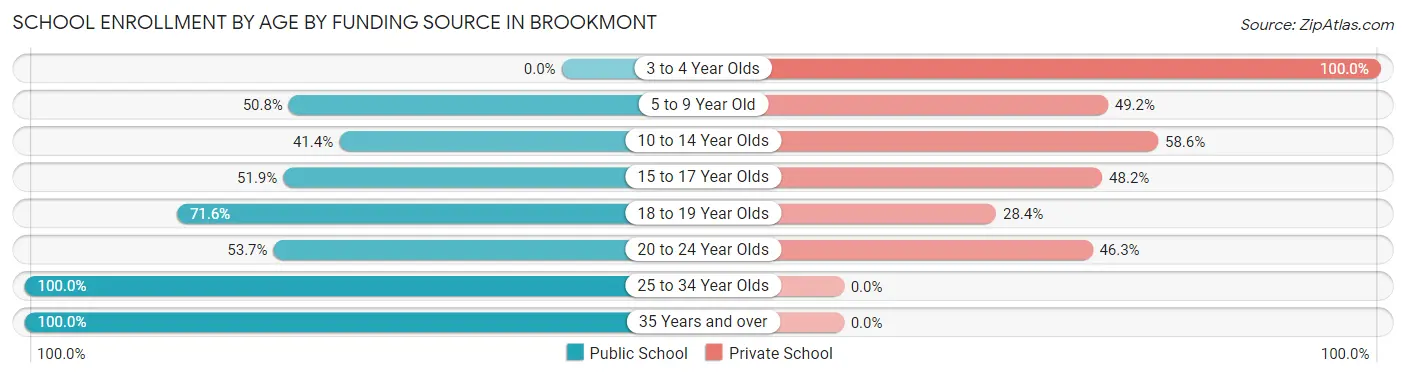
| Age Bracket | Public School | Private School |
| 3 to 4 Year Olds | 0 (0.0%) | 66 (100.0%) |
| 5 to 9 Year Old | 156 (50.8%) | 151 (49.2%) |
| 10 to 14 Year Olds | 179 (41.4%) | 253 (58.6%) |
| 15 to 17 Year Olds | 154 (51.8%) | 143 (48.1%) |
| 18 to 19 Year Olds | 53 (71.6%) | 21 (28.4%) |
| 20 to 24 Year Olds | 44 (53.7%) | 38 (46.3%) |
| 25 to 34 Year Olds | 29 (100.0%) | 0 (0.0%) |
| 35 Years and over | 17 (100.0%) | 0 (0.0%) |
| Total | 632 (48.5%) | 672 (51.5%) |
Educational Attainment by Field of Study in Brookmont
Social sciences (655 | 27.7%), literature & languages (307 | 13.0%), business (248 | 10.5%), bio, nature & agricultural (196 | 8.3%), and engineering (188 | 8.0%) are the most common fields of study among 2,362 individuals in Brookmont who have obtained a bachelor's degree or higher.
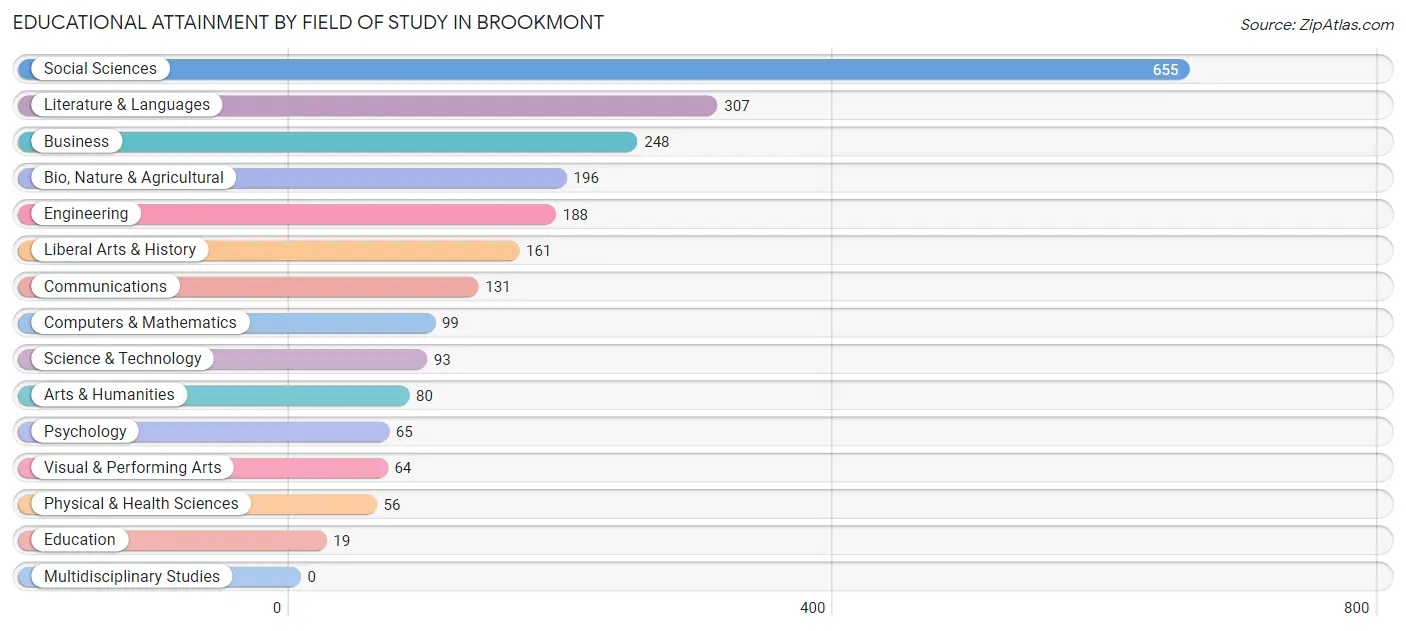
| Field of Study | # Graduates | % Graduates |
| Computers & Mathematics | 99 | 4.2% |
| Bio, Nature & Agricultural | 196 | 8.3% |
| Physical & Health Sciences | 56 | 2.4% |
| Psychology | 65 | 2.8% |
| Social Sciences | 655 | 27.7% |
| Engineering | 188 | 8.0% |
| Multidisciplinary Studies | 0 | 0.0% |
| Science & Technology | 93 | 3.9% |
| Business | 248 | 10.5% |
| Education | 19 | 0.8% |
| Literature & Languages | 307 | 13.0% |
| Liberal Arts & History | 161 | 6.8% |
| Visual & Performing Arts | 64 | 2.7% |
| Communications | 131 | 5.6% |
| Arts & Humanities | 80 | 3.4% |
| Total | 2,362 | 100.0% |
Transportation & Commute in Brookmont
Vehicle Availability by Sex in Brookmont
The most prevalent vehicle ownership categories in Brookmont are males with 2 vehicles (754, accounting for 71.1%) and females with 2 vehicles (621, making up 83.2%).
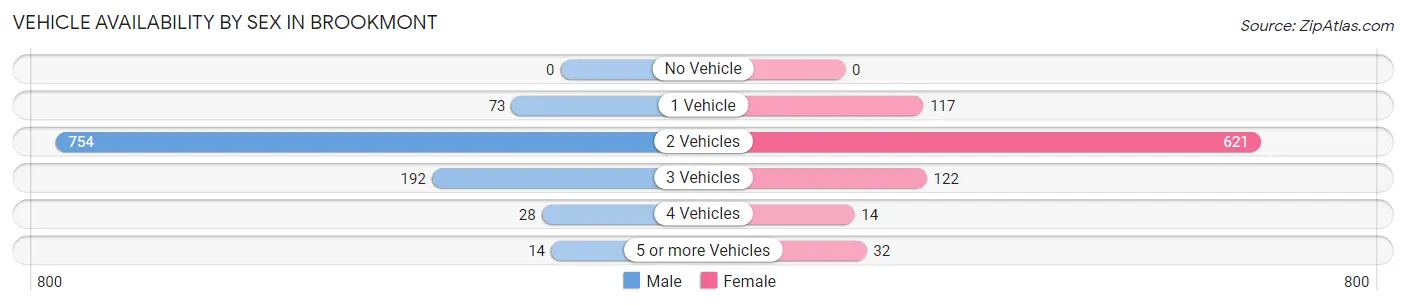
| Vehicles Available | Male | Female |
| No Vehicle | 0 (0.0%) | 0 (0.0%) |
| 1 Vehicle | 73 (6.9%) | 117 (12.9%) |
| 2 Vehicles | 754 (71.1%) | 621 (68.5%) |
| 3 Vehicles | 192 (18.1%) | 122 (13.5%) |
| 4 Vehicles | 28 (2.6%) | 14 (1.5%) |
| 5 or more Vehicles | 14 (1.3%) | 32 (3.5%) |
| Total | 1,061 (100.0%) | 906 (100.0%) |
Commute Time in Brookmont
The most frequently occuring commute durations in Brookmont are 30 to 34 minutes (381 commuters, 28.6%), 40 to 44 minutes (170 commuters, 12.8%), and 10 to 14 minutes (148 commuters, 11.1%).
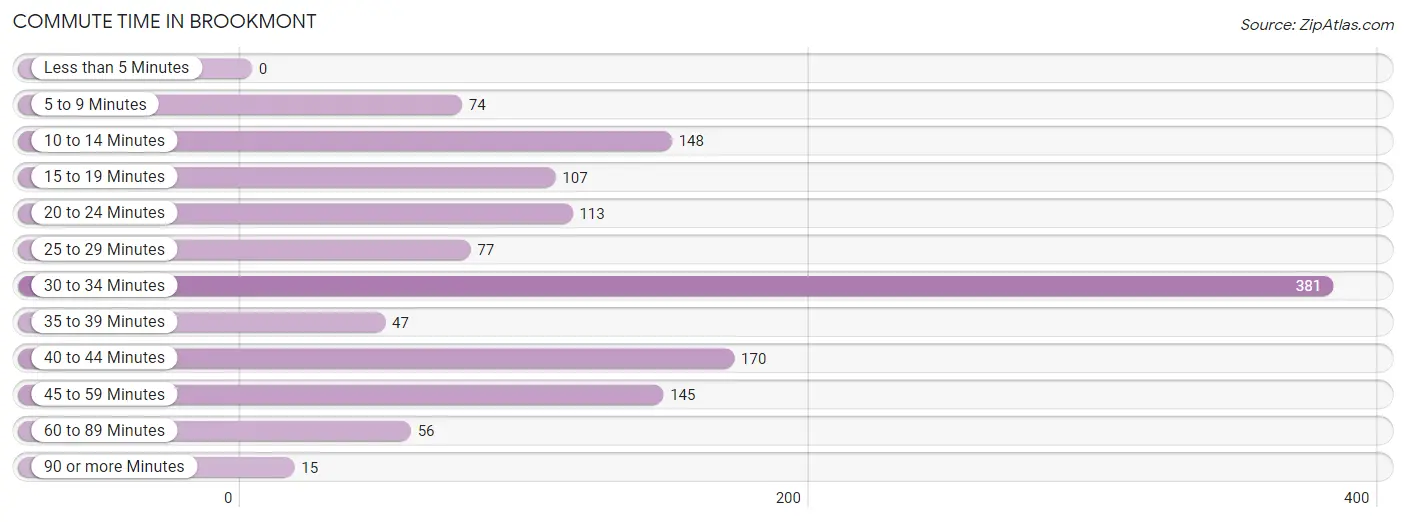
| Commute Time | # Commuters | % Commuters |
| Less than 5 Minutes | 0 | 0.0% |
| 5 to 9 Minutes | 74 | 5.6% |
| 10 to 14 Minutes | 148 | 11.1% |
| 15 to 19 Minutes | 107 | 8.0% |
| 20 to 24 Minutes | 113 | 8.5% |
| 25 to 29 Minutes | 77 | 5.8% |
| 30 to 34 Minutes | 381 | 28.6% |
| 35 to 39 Minutes | 47 | 3.5% |
| 40 to 44 Minutes | 170 | 12.8% |
| 45 to 59 Minutes | 145 | 10.9% |
| 60 to 89 Minutes | 56 | 4.2% |
| 90 or more Minutes | 15 | 1.1% |
Commute Time by Sex in Brookmont
The most common commute times in Brookmont are 30 to 34 minutes (234 commuters, 31.0%) for males and 30 to 34 minutes (147 commuters, 25.4%) for females.
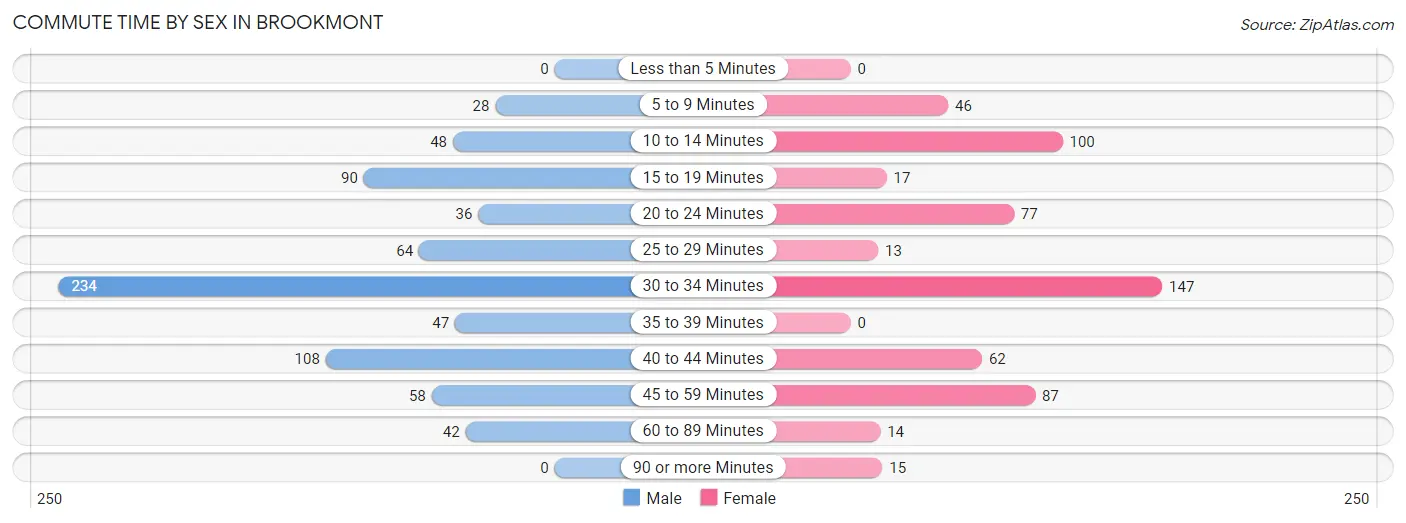
| Commute Time | Male | Female |
| Less than 5 Minutes | 0 (0.0%) | 0 (0.0%) |
| 5 to 9 Minutes | 28 (3.7%) | 46 (8.0%) |
| 10 to 14 Minutes | 48 (6.4%) | 100 (17.3%) |
| 15 to 19 Minutes | 90 (11.9%) | 17 (2.9%) |
| 20 to 24 Minutes | 36 (4.8%) | 77 (13.3%) |
| 25 to 29 Minutes | 64 (8.5%) | 13 (2.2%) |
| 30 to 34 Minutes | 234 (31.0%) | 147 (25.4%) |
| 35 to 39 Minutes | 47 (6.2%) | 0 (0.0%) |
| 40 to 44 Minutes | 108 (14.3%) | 62 (10.7%) |
| 45 to 59 Minutes | 58 (7.7%) | 87 (15.0%) |
| 60 to 89 Minutes | 42 (5.6%) | 14 (2.4%) |
| 90 or more Minutes | 0 (0.0%) | 15 (2.6%) |
Time of Departure to Work by Sex in Brookmont
The most frequent times of departure to work in Brookmont are 7:30 AM to 7:59 AM (193, 25.6%) for males and 8:00 AM to 8:29 AM (112, 19.4%) for females.
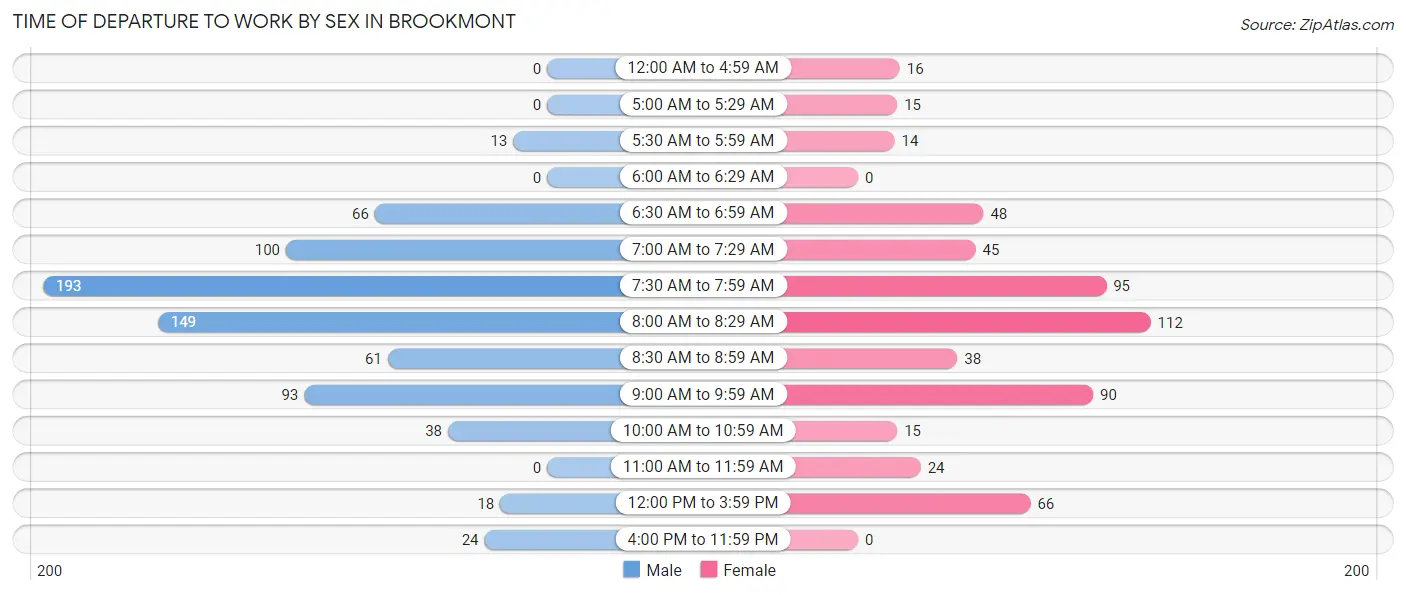
| Time of Departure | Male | Female |
| 12:00 AM to 4:59 AM | 0 (0.0%) | 16 (2.8%) |
| 5:00 AM to 5:29 AM | 0 (0.0%) | 15 (2.6%) |
| 5:30 AM to 5:59 AM | 13 (1.7%) | 14 (2.4%) |
| 6:00 AM to 6:29 AM | 0 (0.0%) | 0 (0.0%) |
| 6:30 AM to 6:59 AM | 66 (8.7%) | 48 (8.3%) |
| 7:00 AM to 7:29 AM | 100 (13.3%) | 45 (7.8%) |
| 7:30 AM to 7:59 AM | 193 (25.6%) | 95 (16.4%) |
| 8:00 AM to 8:29 AM | 149 (19.7%) | 112 (19.4%) |
| 8:30 AM to 8:59 AM | 61 (8.1%) | 38 (6.6%) |
| 9:00 AM to 9:59 AM | 93 (12.3%) | 90 (15.6%) |
| 10:00 AM to 10:59 AM | 38 (5.0%) | 15 (2.6%) |
| 11:00 AM to 11:59 AM | 0 (0.0%) | 24 (4.2%) |
| 12:00 PM to 3:59 PM | 18 (2.4%) | 66 (11.4%) |
| 4:00 PM to 11:59 PM | 24 (3.2%) | 0 (0.0%) |
| Total | 755 (100.0%) | 578 (100.0%) |
Housing Occupancy in Brookmont
Occupancy by Ownership in Brookmont
Of the total 1,298 dwellings in Brookmont, owner-occupied units account for 986 (76.0%), while renter-occupied units make up 312 (24.0%).
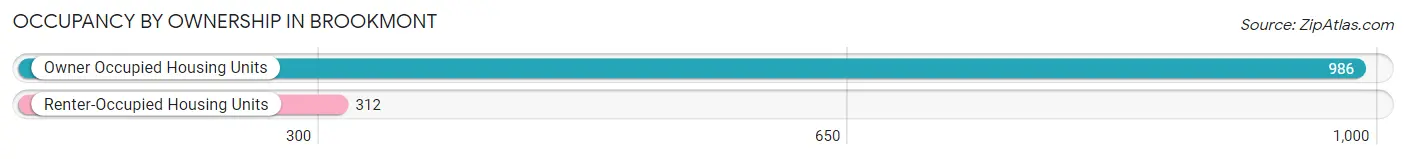
| Occupancy | # Housing Units | % Housing Units |
| Owner Occupied Housing Units | 986 | 76.0% |
| Renter-Occupied Housing Units | 312 | 24.0% |
| Total Occupied Housing Units | 1,298 | 100.0% |
Occupancy by Household Size in Brookmont
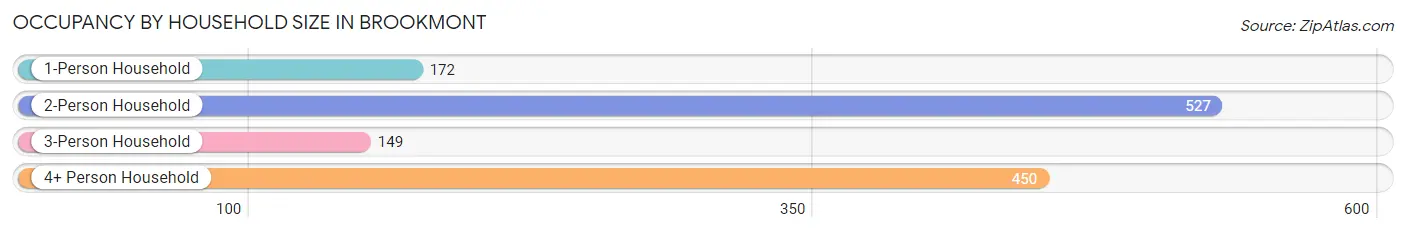
| Household Size | # Housing Units | % Housing Units |
| 1-Person Household | 172 | 13.3% |
| 2-Person Household | 527 | 40.6% |
| 3-Person Household | 149 | 11.5% |
| 4+ Person Household | 450 | 34.7% |
| Total Housing Units | 1,298 | 100.0% |
Occupancy by Ownership by Household Size in Brookmont
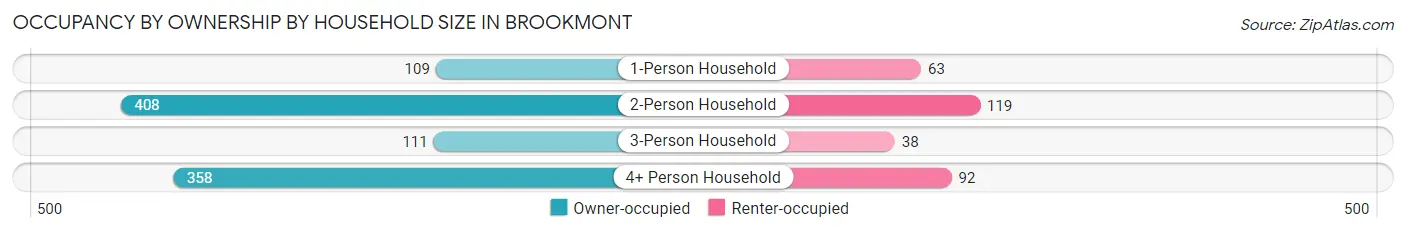
| Household Size | Owner-occupied | Renter-occupied |
| 1-Person Household | 109 (63.4%) | 63 (36.6%) |
| 2-Person Household | 408 (77.4%) | 119 (22.6%) |
| 3-Person Household | 111 (74.5%) | 38 (25.5%) |
| 4+ Person Household | 358 (79.6%) | 92 (20.4%) |
| Total Housing Units | 986 (76.0%) | 312 (24.0%) |
Occupancy by Educational Attainment in Brookmont
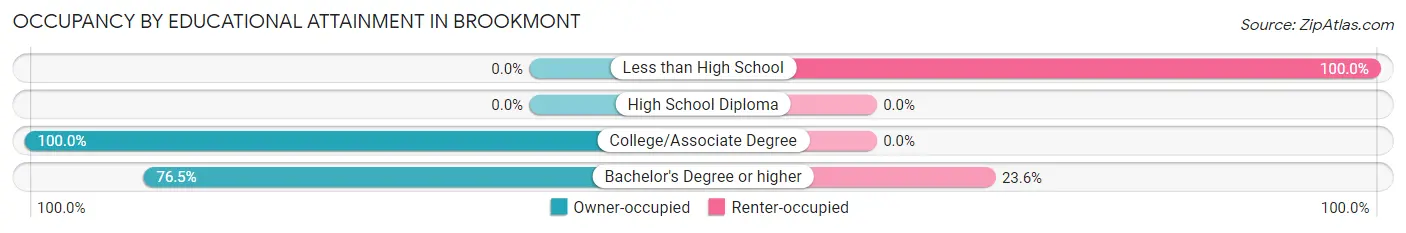
| Household Size | Owner-occupied | Renter-occupied |
| Less than High School | 0 (0.0%) | 27 (100.0%) |
| High School Diploma | 0 (0.0%) | 0 (0.0%) |
| College/Associate Degree | 61 (100.0%) | 0 (0.0%) |
| Bachelor's Degree or higher | 925 (76.4%) | 285 (23.5%) |
Occupancy by Age of Householder in Brookmont
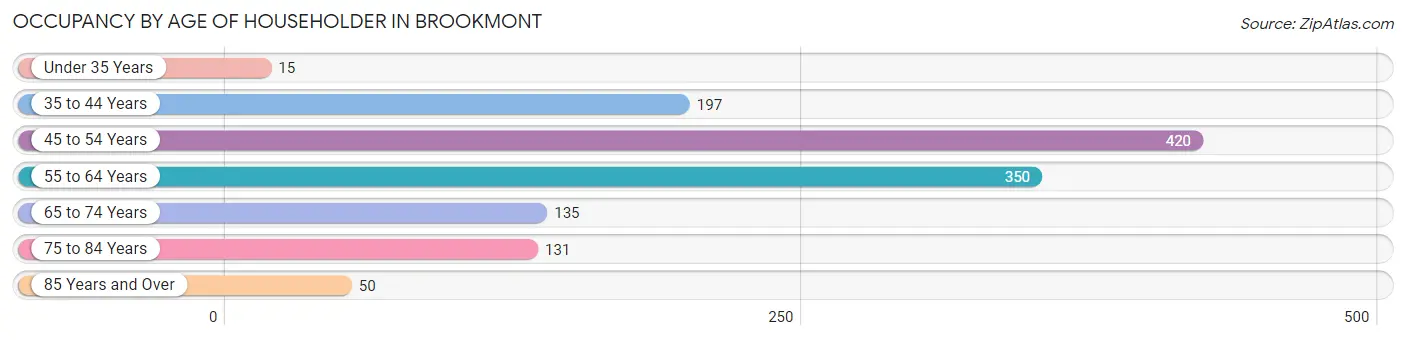
| Age Bracket | # Households | % Households |
| Under 35 Years | 15 | 1.2% |
| 35 to 44 Years | 197 | 15.2% |
| 45 to 54 Years | 420 | 32.4% |
| 55 to 64 Years | 350 | 27.0% |
| 65 to 74 Years | 135 | 10.4% |
| 75 to 84 Years | 131 | 10.1% |
| 85 Years and Over | 50 | 3.8% |
| Total | 1,298 | 100.0% |
Housing Finances in Brookmont
Median Income by Occupancy in Brookmont
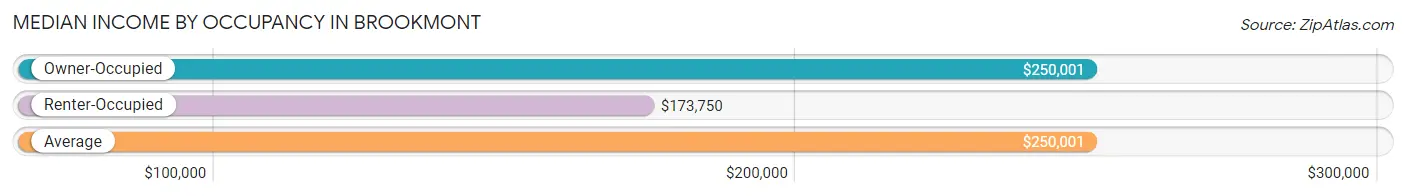
| Occupancy Type | # Households | Median Income |
| Owner-Occupied | 986 (76.0%) | $250,001 |
| Renter-Occupied | 312 (24.0%) | $173,750 |
| Average | 1,298 (100.0%) | $250,001 |
Occupancy by Householder Income Bracket in Brookmont
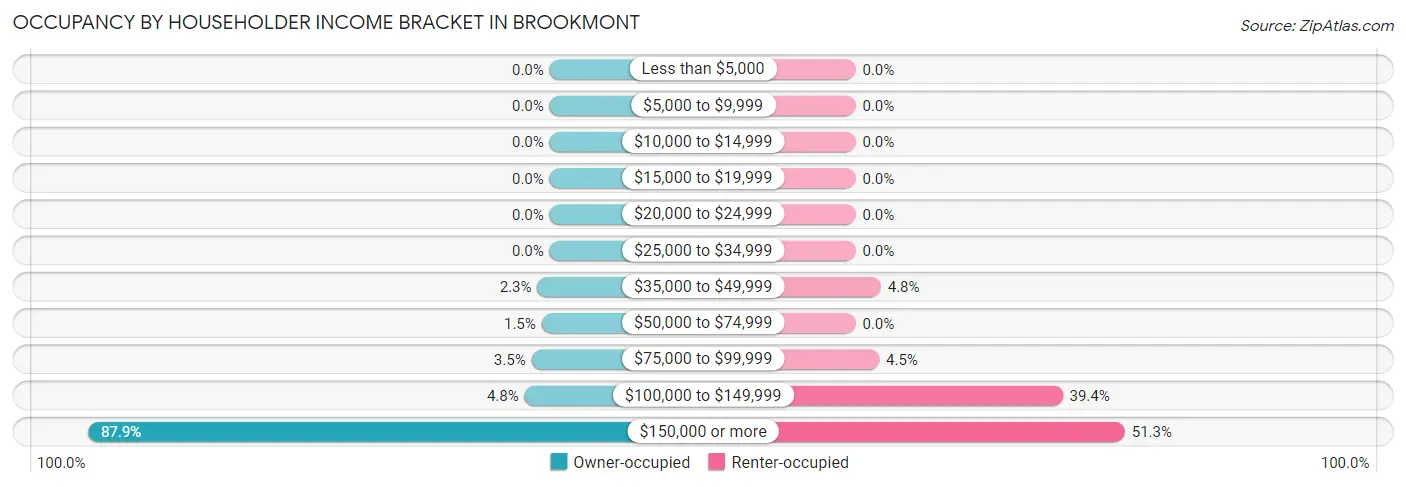
| Income Bracket | Owner-occupied | Renter-occupied |
| Less than $5,000 | 0 (0.0%) | 0 (0.0%) |
| $5,000 to $9,999 | 0 (0.0%) | 0 (0.0%) |
| $10,000 to $14,999 | 0 (0.0%) | 0 (0.0%) |
| $15,000 to $19,999 | 0 (0.0%) | 0 (0.0%) |
| $20,000 to $24,999 | 0 (0.0%) | 0 (0.0%) |
| $25,000 to $34,999 | 0 (0.0%) | 0 (0.0%) |
| $35,000 to $49,999 | 23 (2.3%) | 15 (4.8%) |
| $50,000 to $74,999 | 15 (1.5%) | 0 (0.0%) |
| $75,000 to $99,999 | 34 (3.5%) | 14 (4.5%) |
| $100,000 to $149,999 | 47 (4.8%) | 123 (39.4%) |
| $150,000 or more | 867 (87.9%) | 160 (51.3%) |
| Total | 986 (100.0%) | 312 (100.0%) |
Monthly Housing Cost Tiers in Brookmont
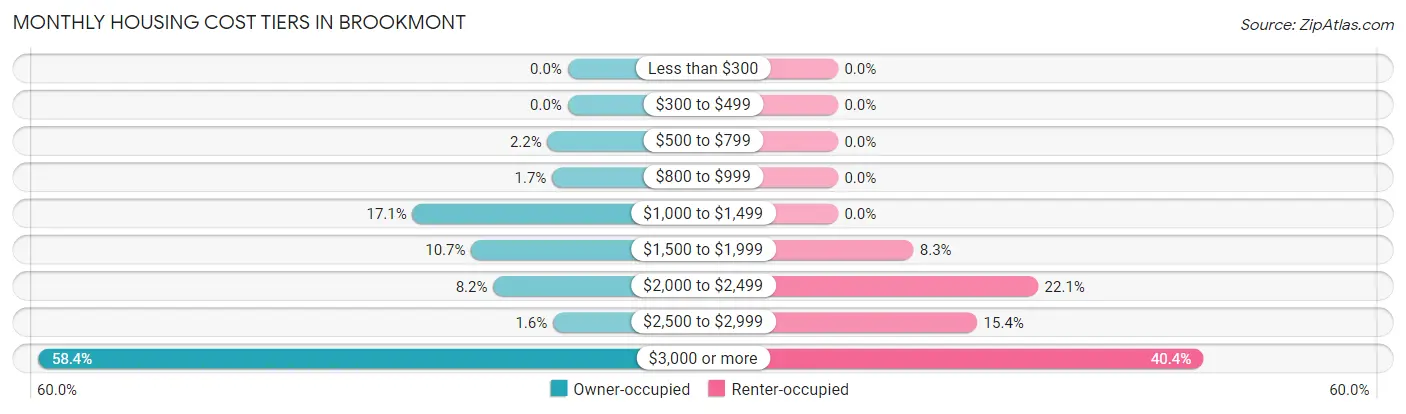
| Monthly Cost | Owner-occupied | Renter-occupied |
| Less than $300 | 0 (0.0%) | 0 (0.0%) |
| $300 to $499 | 0 (0.0%) | 0 (0.0%) |
| $500 to $799 | 22 (2.2%) | 0 (0.0%) |
| $800 to $999 | 17 (1.7%) | 0 (0.0%) |
| $1,000 to $1,499 | 169 (17.1%) | 0 (0.0%) |
| $1,500 to $1,999 | 105 (10.6%) | 26 (8.3%) |
| $2,000 to $2,499 | 81 (8.2%) | 69 (22.1%) |
| $2,500 to $2,999 | 16 (1.6%) | 48 (15.4%) |
| $3,000 or more | 576 (58.4%) | 126 (40.4%) |
| Total | 986 (100.0%) | 312 (100.0%) |
Physical Housing Characteristics in Brookmont
Housing Structures in Brookmont
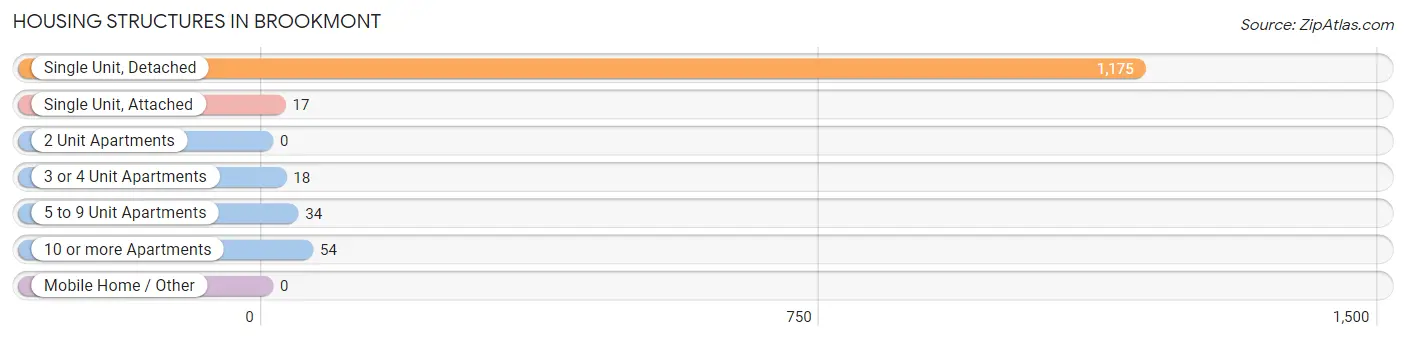
| Structure Type | # Housing Units | % Housing Units |
| Single Unit, Detached | 1,175 | 90.5% |
| Single Unit, Attached | 17 | 1.3% |
| 2 Unit Apartments | 0 | 0.0% |
| 3 or 4 Unit Apartments | 18 | 1.4% |
| 5 to 9 Unit Apartments | 34 | 2.6% |
| 10 or more Apartments | 54 | 4.2% |
| Mobile Home / Other | 0 | 0.0% |
| Total | 1,298 | 100.0% |
Housing Structures by Occupancy in Brookmont
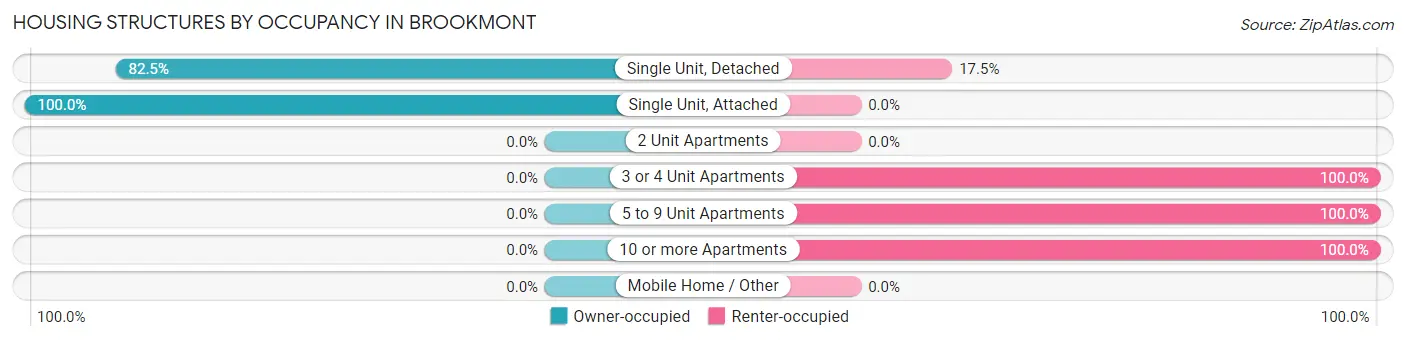
| Structure Type | Owner-occupied | Renter-occupied |
| Single Unit, Detached | 969 (82.5%) | 206 (17.5%) |
| Single Unit, Attached | 17 (100.0%) | 0 (0.0%) |
| 2 Unit Apartments | 0 (0.0%) | 0 (0.0%) |
| 3 or 4 Unit Apartments | 0 (0.0%) | 18 (100.0%) |
| 5 to 9 Unit Apartments | 0 (0.0%) | 34 (100.0%) |
| 10 or more Apartments | 0 (0.0%) | 54 (100.0%) |
| Mobile Home / Other | 0 (0.0%) | 0 (0.0%) |
| Total | 986 (76.0%) | 312 (24.0%) |
Housing Structures by Number of Rooms in Brookmont
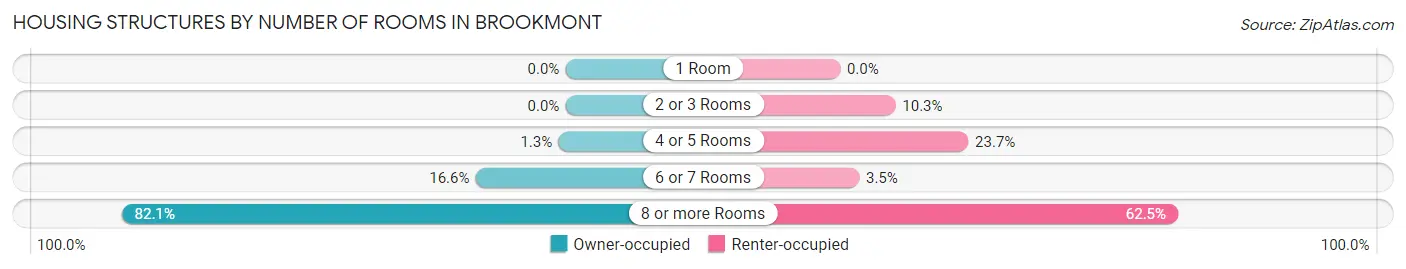
| Number of Rooms | Owner-occupied | Renter-occupied |
| 1 Room | 0 (0.0%) | 0 (0.0%) |
| 2 or 3 Rooms | 0 (0.0%) | 32 (10.3%) |
| 4 or 5 Rooms | 13 (1.3%) | 74 (23.7%) |
| 6 or 7 Rooms | 164 (16.6%) | 11 (3.5%) |
| 8 or more Rooms | 809 (82.1%) | 195 (62.5%) |
| Total | 986 (100.0%) | 312 (100.0%) |
Housing Structure by Heating Type in Brookmont
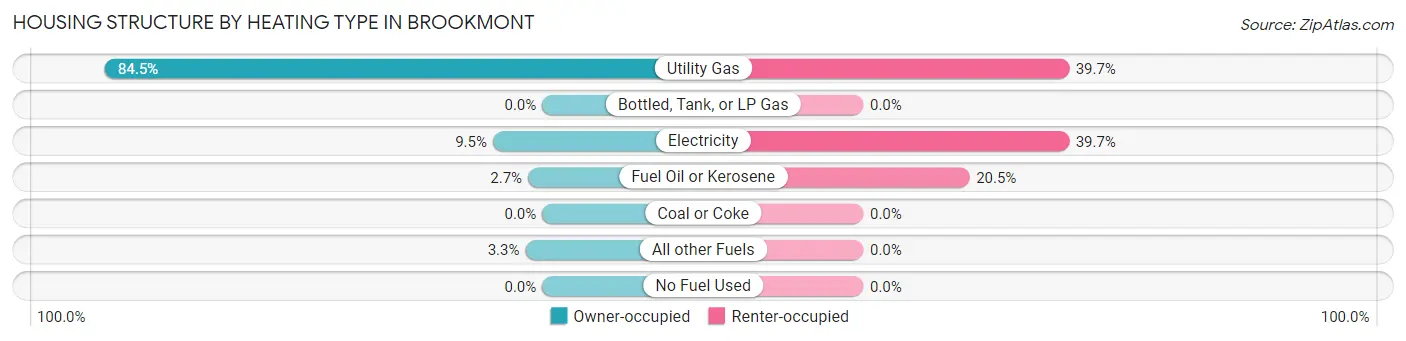
| Heating Type | Owner-occupied | Renter-occupied |
| Utility Gas | 833 (84.5%) | 124 (39.7%) |
| Bottled, Tank, or LP Gas | 0 (0.0%) | 0 (0.0%) |
| Electricity | 94 (9.5%) | 124 (39.7%) |
| Fuel Oil or Kerosene | 27 (2.7%) | 64 (20.5%) |
| Coal or Coke | 0 (0.0%) | 0 (0.0%) |
| All other Fuels | 32 (3.3%) | 0 (0.0%) |
| No Fuel Used | 0 (0.0%) | 0 (0.0%) |
| Total | 986 (100.0%) | 312 (100.0%) |
Household Vehicle Usage in Brookmont
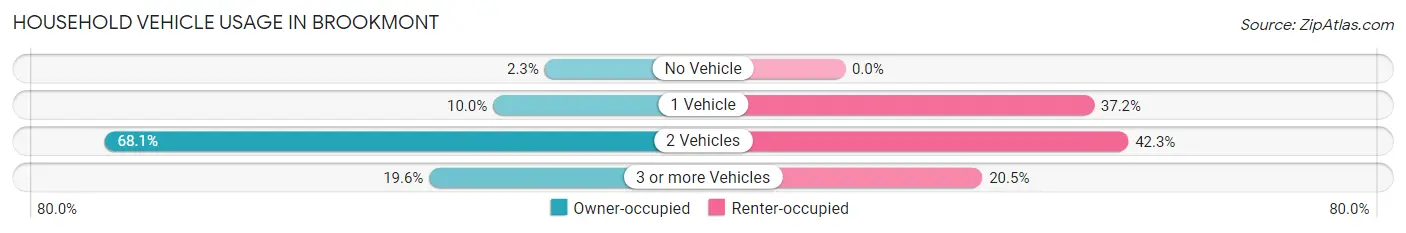
| Vehicles per Household | Owner-occupied | Renter-occupied |
| No Vehicle | 23 (2.3%) | 0 (0.0%) |
| 1 Vehicle | 99 (10.0%) | 116 (37.2%) |
| 2 Vehicles | 671 (68.0%) | 132 (42.3%) |
| 3 or more Vehicles | 193 (19.6%) | 64 (20.5%) |
| Total | 986 (100.0%) | 312 (100.0%) |
Real Estate & Mortgages in Brookmont
Real Estate and Mortgage Overview in Brookmont
| Characteristic | Without Mortgage | With Mortgage |
| Housing Units | 362 | 624 |
| Median Property Value | $1,432,100 | $1,284,700 |
| Median Household Income | $250,001 | $537 |
| Monthly Housing Costs | $1,501 | $576 |
| Real Estate Taxes | $10,001 | $23 |
Property Value by Mortgage Status in Brookmont
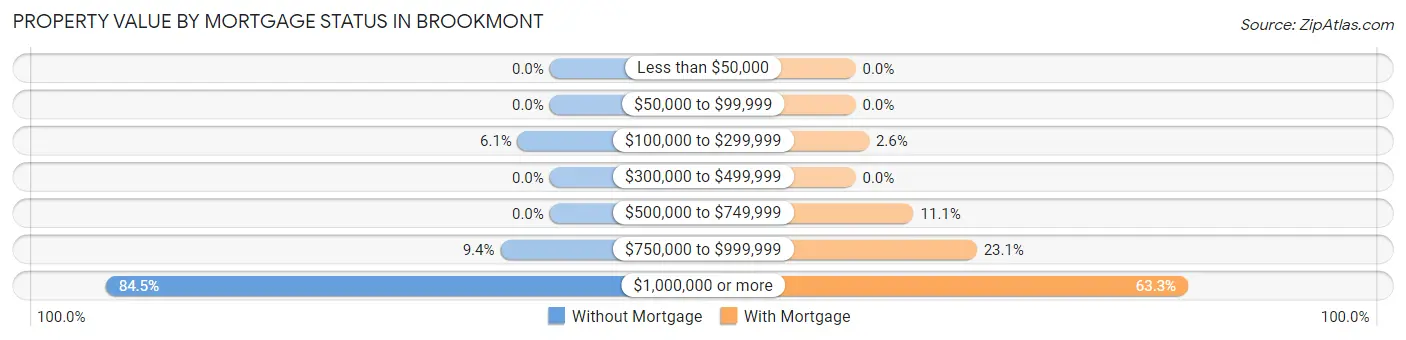
| Property Value | Without Mortgage | With Mortgage |
| Less than $50,000 | 0 (0.0%) | 0 (0.0%) |
| $50,000 to $99,999 | 0 (0.0%) | 0 (0.0%) |
| $100,000 to $299,999 | 22 (6.1%) | 16 (2.6%) |
| $300,000 to $499,999 | 0 (0.0%) | 0 (0.0%) |
| $500,000 to $749,999 | 0 (0.0%) | 69 (11.1%) |
| $750,000 to $999,999 | 34 (9.4%) | 144 (23.1%) |
| $1,000,000 or more | 306 (84.5%) | 395 (63.3%) |
| Total | 362 (100.0%) | 624 (100.0%) |
Household Income by Mortgage Status in Brookmont
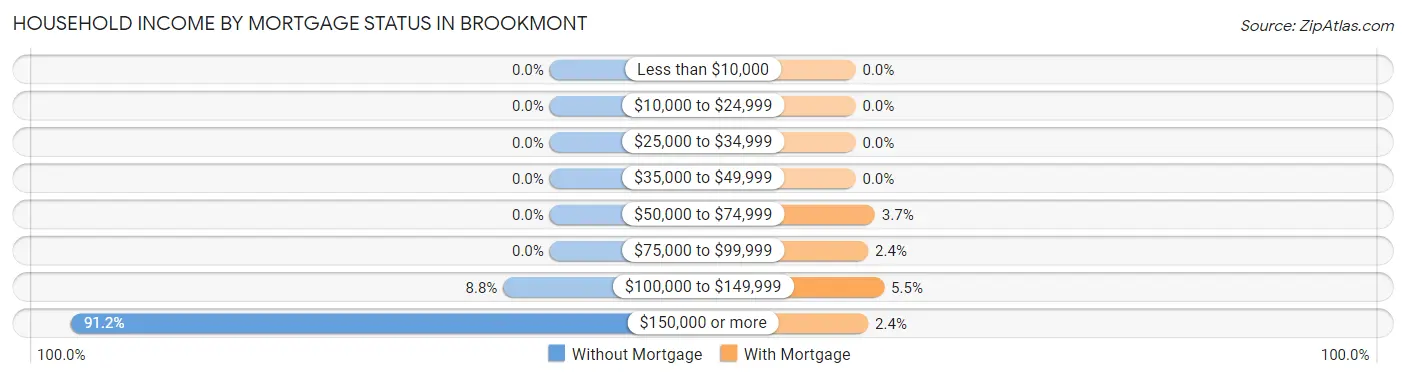
| Household Income | Without Mortgage | With Mortgage |
| Less than $10,000 | 0 (0.0%) | 0 (0.0%) |
| $10,000 to $24,999 | 0 (0.0%) | 0 (0.0%) |
| $25,000 to $34,999 | 0 (0.0%) | 0 (0.0%) |
| $35,000 to $49,999 | 0 (0.0%) | 0 (0.0%) |
| $50,000 to $74,999 | 0 (0.0%) | 23 (3.7%) |
| $75,000 to $99,999 | 0 (0.0%) | 15 (2.4%) |
| $100,000 to $149,999 | 32 (8.8%) | 34 (5.4%) |
| $150,000 or more | 330 (91.2%) | 15 (2.4%) |
| Total | 362 (100.0%) | 624 (100.0%) |
Property Value to Household Income Ratio in Brookmont
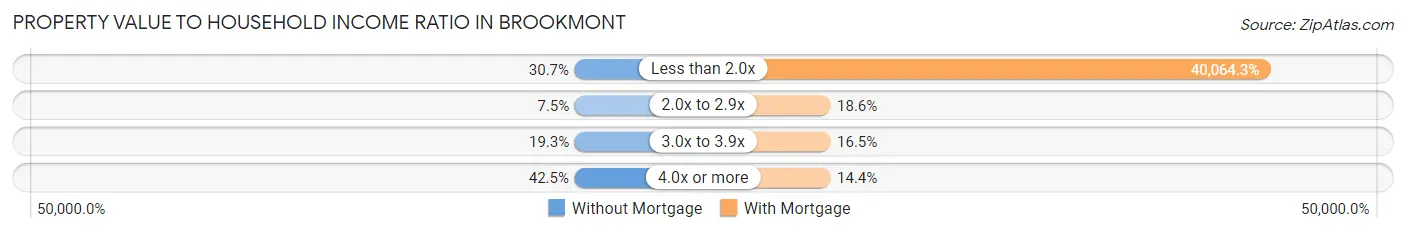
| Value-to-Income Ratio | Without Mortgage | With Mortgage |
| Less than 2.0x | 111 (30.7%) | 250,001 (40,064.3%) |
| 2.0x to 2.9x | 27 (7.5%) | 116 (18.6%) |
| 3.0x to 3.9x | 70 (19.3%) | 103 (16.5%) |
| 4.0x or more | 154 (42.5%) | 90 (14.4%) |
| Total | 362 (100.0%) | 624 (100.0%) |
Real Estate Taxes by Mortgage Status in Brookmont
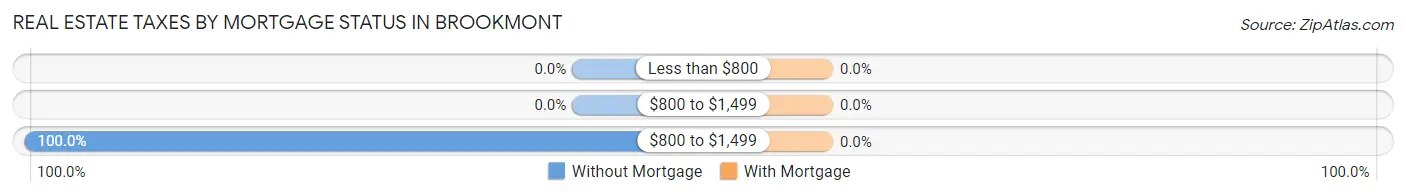
| Property Taxes | Without Mortgage | With Mortgage |
| Less than $800 | 0 (0.0%) | 0 (0.0%) |
| $800 to $1,499 | 0 (0.0%) | 0 (0.0%) |
| $800 to $1,499 | 362 (100.0%) | 0 (0.0%) |
| Total | 362 (100.0%) | 624 (100.0%) |
Health & Disability in Brookmont
Health Insurance Coverage by Age in Brookmont
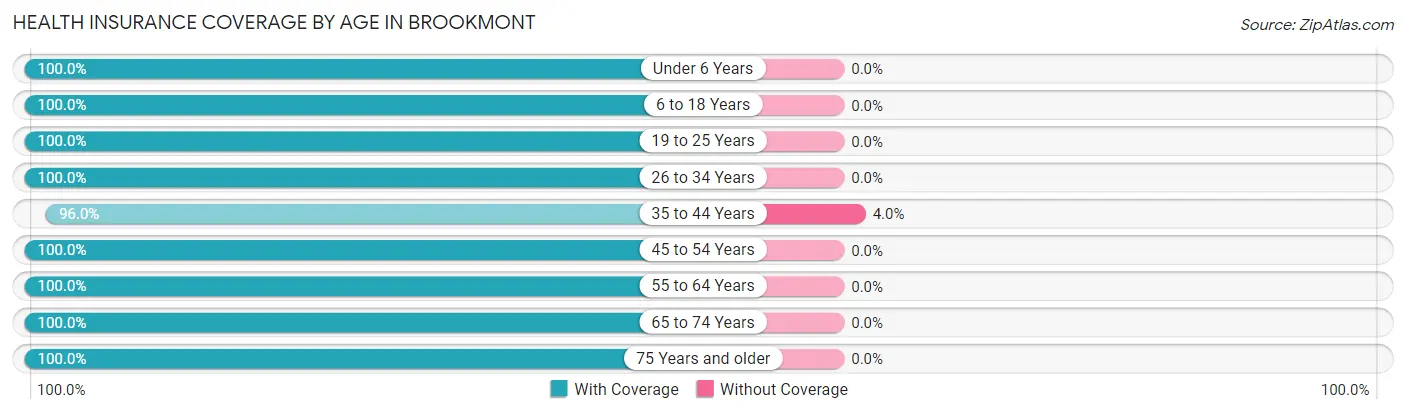
| Age Bracket | With Coverage | Without Coverage |
| Under 6 Years | 92 (100.0%) | 0 (0.0%) |
| 6 to 18 Years | 1,081 (100.0%) | 0 (0.0%) |
| 19 to 25 Years | 151 (100.0%) | 0 (0.0%) |
| 26 to 34 Years | 109 (100.0%) | 0 (0.0%) |
| 35 to 44 Years | 337 (96.0%) | 14 (4.0%) |
| 45 to 54 Years | 717 (100.0%) | 0 (0.0%) |
| 55 to 64 Years | 697 (100.0%) | 0 (0.0%) |
| 65 to 74 Years | 223 (100.0%) | 0 (0.0%) |
| 75 Years and older | 294 (100.0%) | 0 (0.0%) |
| Total | 3,701 (99.6%) | 14 (0.4%) |
Health Insurance Coverage by Citizenship Status in Brookmont
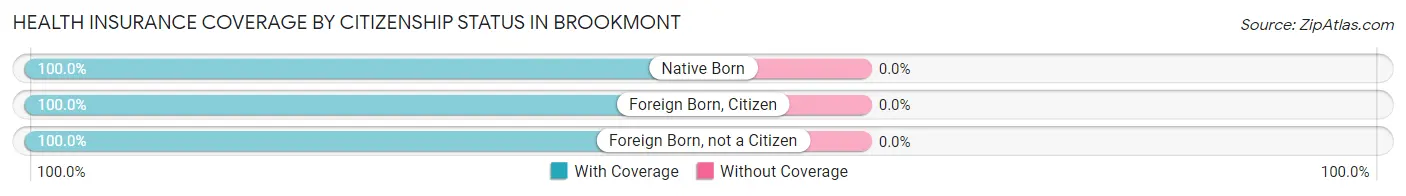
| Citizenship Status | With Coverage | Without Coverage |
| Native Born | 92 (100.0%) | 0 (0.0%) |
| Foreign Born, Citizen | 1,081 (100.0%) | 0 (0.0%) |
| Foreign Born, not a Citizen | 151 (100.0%) | 0 (0.0%) |
Health Insurance Coverage by Household Income in Brookmont
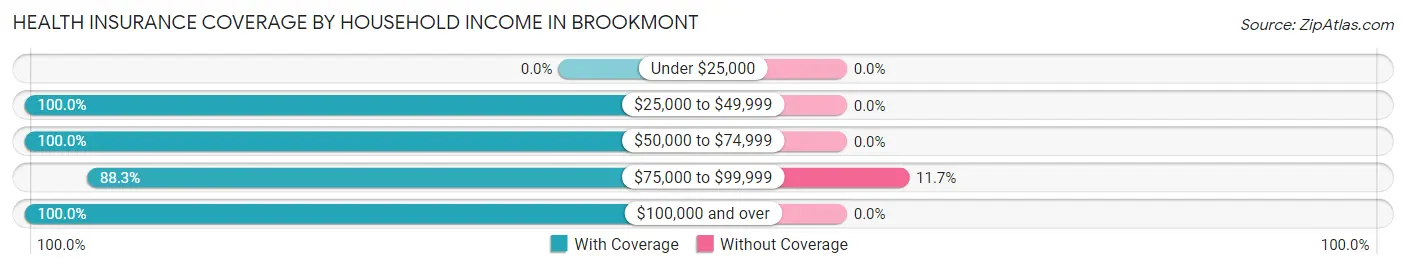
| Household Income | With Coverage | Without Coverage |
| Under $25,000 | 0 (0.0%) | 0 (0.0%) |
| $25,000 to $49,999 | 65 (100.0%) | 0 (0.0%) |
| $50,000 to $74,999 | 15 (100.0%) | 0 (0.0%) |
| $75,000 to $99,999 | 106 (88.3%) | 14 (11.7%) |
| $100,000 and over | 3,515 (100.0%) | 0 (0.0%) |
Public vs Private Health Insurance Coverage by Age in Brookmont
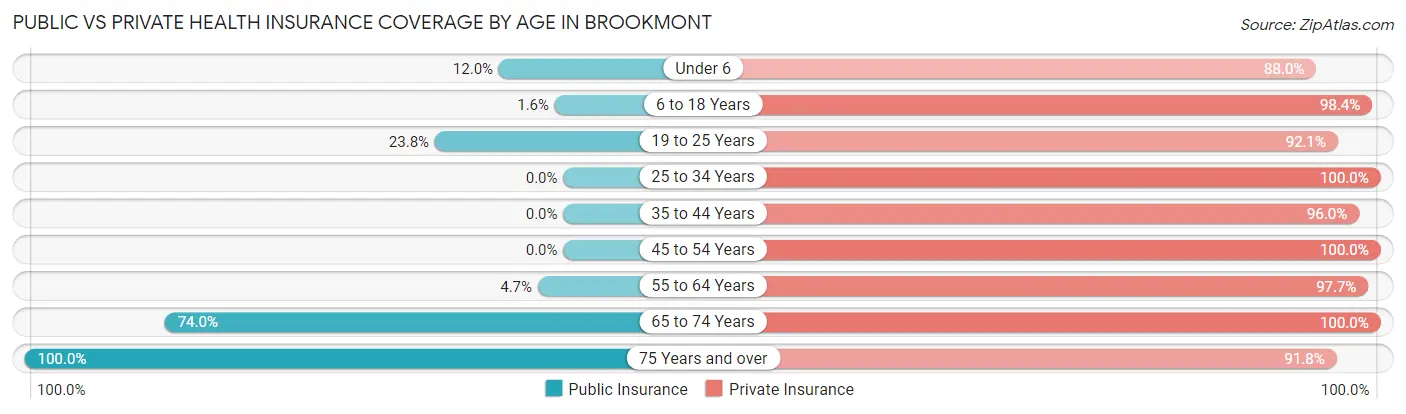
| Age Bracket | Public Insurance | Private Insurance |
| Under 6 | 11 (12.0%) | 81 (88.0%) |
| 6 to 18 Years | 17 (1.6%) | 1,064 (98.4%) |
| 19 to 25 Years | 36 (23.8%) | 139 (92.0%) |
| 25 to 34 Years | 0 (0.0%) | 109 (100.0%) |
| 35 to 44 Years | 0 (0.0%) | 337 (96.0%) |
| 45 to 54 Years | 0 (0.0%) | 717 (100.0%) |
| 55 to 64 Years | 33 (4.7%) | 681 (97.7%) |
| 65 to 74 Years | 165 (74.0%) | 223 (100.0%) |
| 75 Years and over | 294 (100.0%) | 270 (91.8%) |
| Total | 556 (15.0%) | 3,621 (97.5%) |
Disability Status by Sex by Age in Brookmont
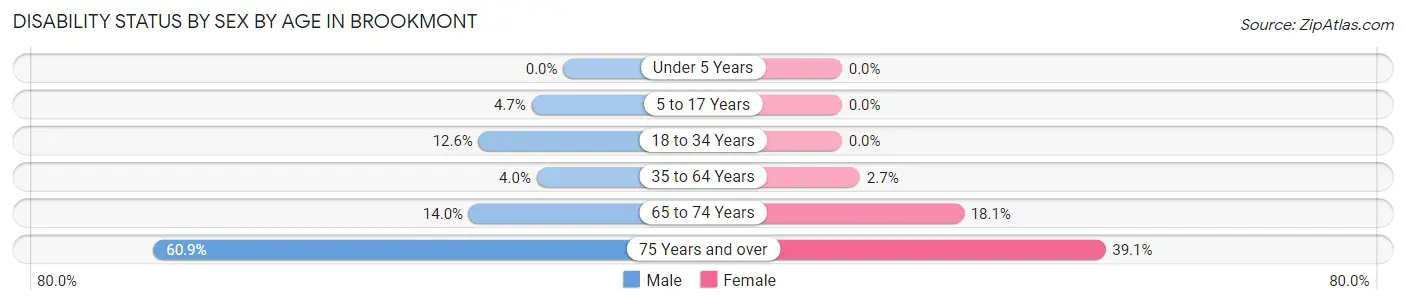
| Age Bracket | Male | Female |
| Under 5 Years | 0 (0.0%) | 0 (0.0%) |
| 5 to 17 Years | 27 (4.7%) | 0 (0.0%) |
| 18 to 34 Years | 24 (12.6%) | 0 (0.0%) |
| 35 to 64 Years | 33 (4.0%) | 25 (2.7%) |
| 65 to 74 Years | 15 (14.0%) | 21 (18.1%) |
| 75 Years and over | 109 (60.9%) | 45 (39.1%) |
Disability Class by Sex by Age in Brookmont
Disability Class: Hearing Difficulty
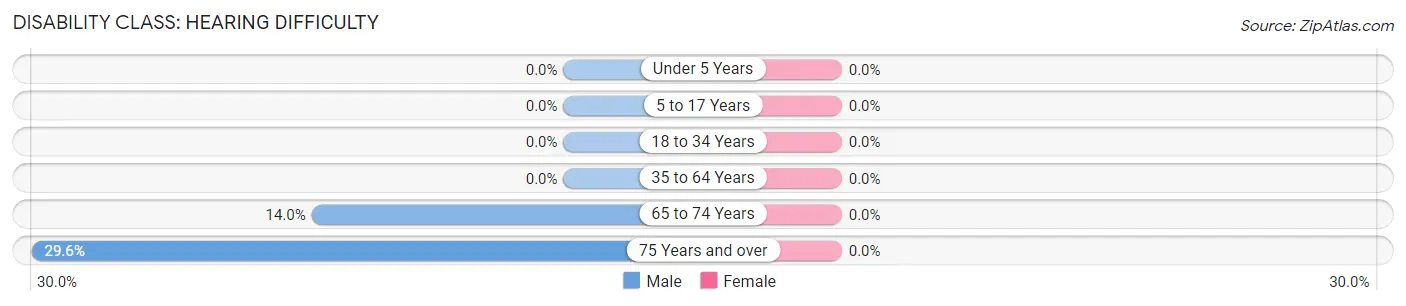
| Age Bracket | Male | Female |
| Under 5 Years | 0 (0.0%) | 0 (0.0%) |
| 5 to 17 Years | 0 (0.0%) | 0 (0.0%) |
| 18 to 34 Years | 0 (0.0%) | 0 (0.0%) |
| 35 to 64 Years | 0 (0.0%) | 0 (0.0%) |
| 65 to 74 Years | 15 (14.0%) | 0 (0.0%) |
| 75 Years and over | 53 (29.6%) | 0 (0.0%) |
Disability Class: Vision Difficulty
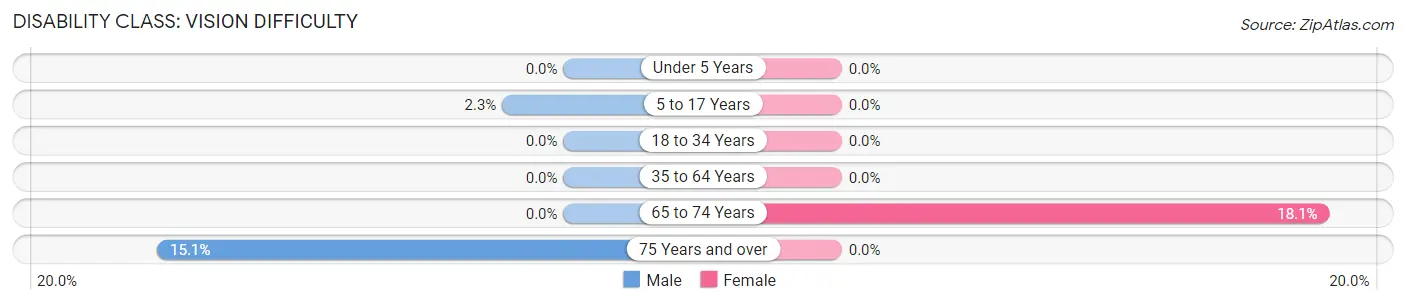
| Age Bracket | Male | Female |
| Under 5 Years | 0 (0.0%) | 0 (0.0%) |
| 5 to 17 Years | 13 (2.3%) | 0 (0.0%) |
| 18 to 34 Years | 0 (0.0%) | 0 (0.0%) |
| 35 to 64 Years | 0 (0.0%) | 0 (0.0%) |
| 65 to 74 Years | 0 (0.0%) | 21 (18.1%) |
| 75 Years and over | 27 (15.1%) | 0 (0.0%) |
Disability Class: Cognitive Difficulty
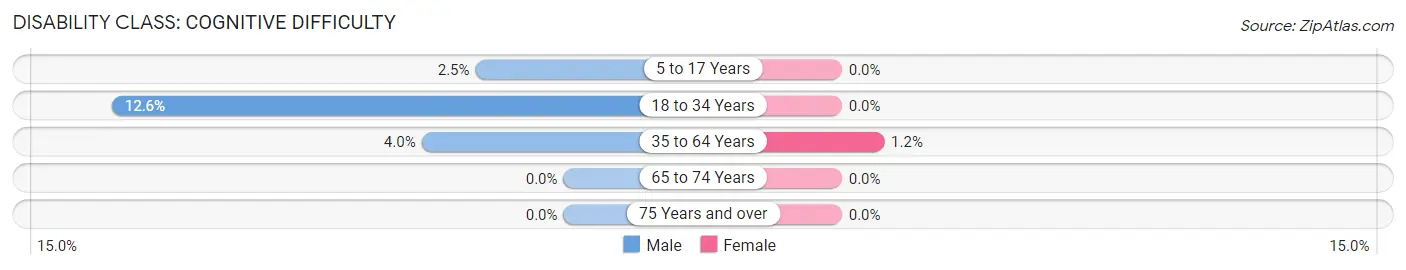
| Age Bracket | Male | Female |
| 5 to 17 Years | 14 (2.5%) | 0 (0.0%) |
| 18 to 34 Years | 24 (12.6%) | 0 (0.0%) |
| 35 to 64 Years | 33 (4.0%) | 11 (1.2%) |
| 65 to 74 Years | 0 (0.0%) | 0 (0.0%) |
| 75 Years and over | 0 (0.0%) | 0 (0.0%) |
Disability Class: Ambulatory Difficulty
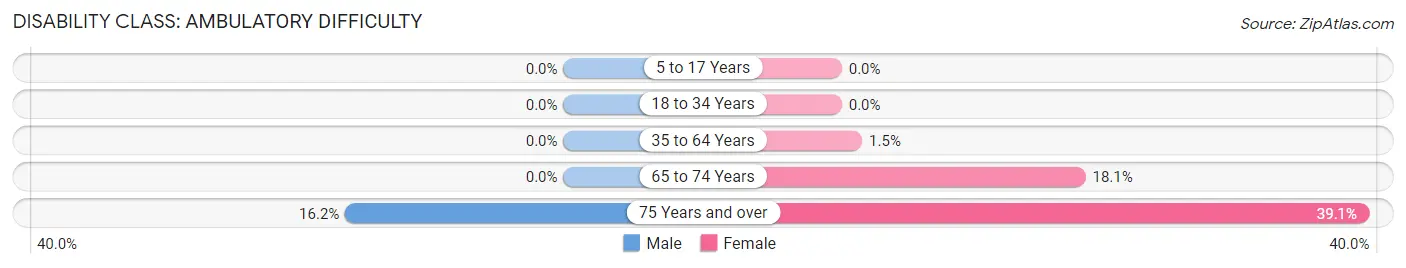
| Age Bracket | Male | Female |
| 5 to 17 Years | 0 (0.0%) | 0 (0.0%) |
| 18 to 34 Years | 0 (0.0%) | 0 (0.0%) |
| 35 to 64 Years | 0 (0.0%) | 14 (1.5%) |
| 65 to 74 Years | 0 (0.0%) | 21 (18.1%) |
| 75 Years and over | 29 (16.2%) | 45 (39.1%) |
Disability Class: Self-Care Difficulty
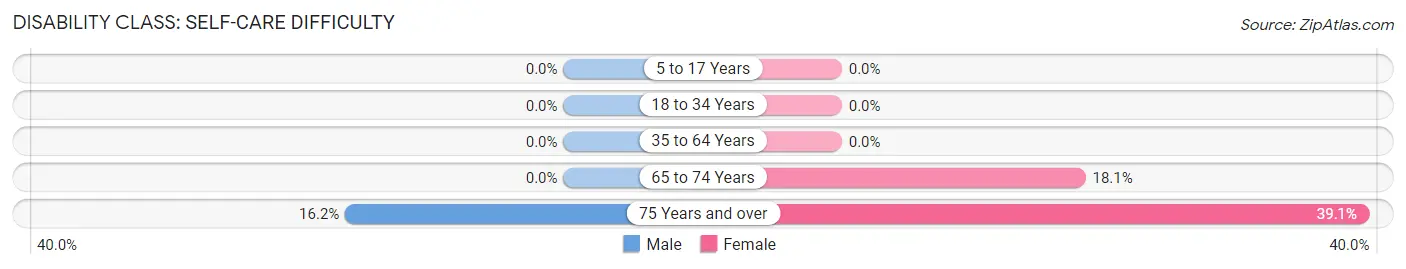
| Age Bracket | Male | Female |
| 5 to 17 Years | 0 (0.0%) | 0 (0.0%) |
| 18 to 34 Years | 0 (0.0%) | 0 (0.0%) |
| 35 to 64 Years | 0 (0.0%) | 0 (0.0%) |
| 65 to 74 Years | 0 (0.0%) | 21 (18.1%) |
| 75 Years and over | 29 (16.2%) | 45 (39.1%) |
Technology Access in Brookmont
Computing Device Access in Brookmont
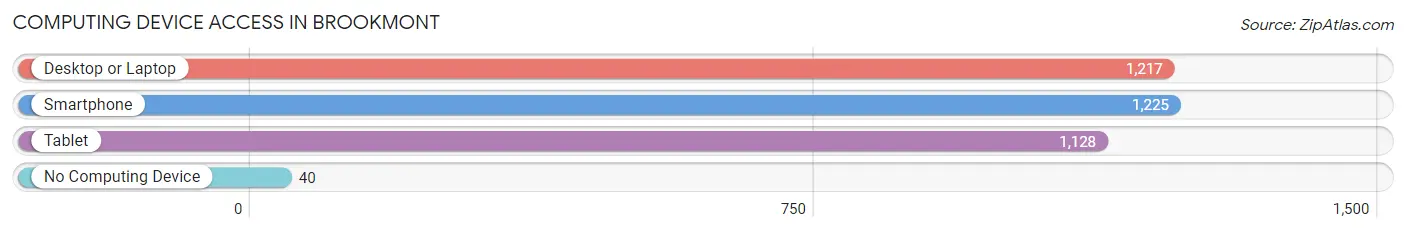
| Device Type | # Households | % Households |
| Desktop or Laptop | 1,217 | 93.8% |
| Smartphone | 1,225 | 94.4% |
| Tablet | 1,128 | 86.9% |
| No Computing Device | 40 | 3.1% |
| Total | 1,298 | 100.0% |
Internet Access in Brookmont
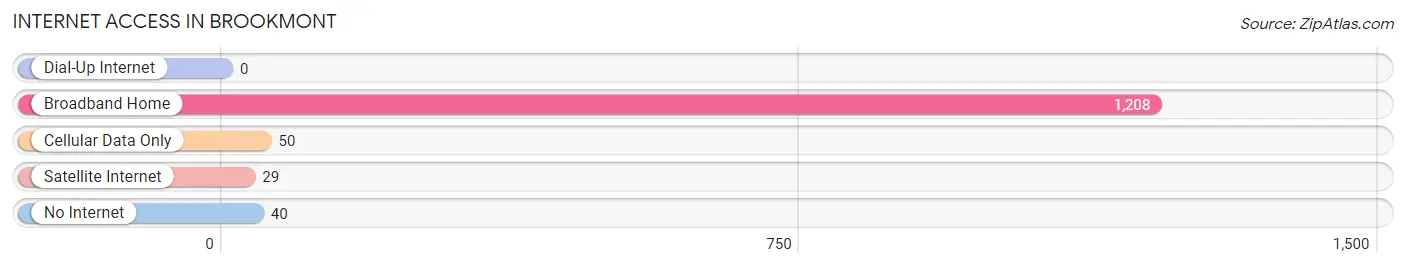
| Internet Type | # Households | % Households |
| Dial-Up Internet | 0 | 0.0% |
| Broadband Home | 1,208 | 93.1% |
| Cellular Data Only | 50 | 3.8% |
| Satellite Internet | 29 | 2.2% |
| No Internet | 40 | 3.1% |
| Total | 1,298 | 100.0% |
Brookmont Summary
History
The history of Brookmont, Maryland dates back to the early 19th century. The area was first settled by the Piscataway Indians, who were part of the Algonquian-speaking peoples. The Piscataway Indians were a peaceful tribe that lived in the area for centuries before the arrival of European settlers. The first European settlers arrived in the area in the late 1700s and early 1800s. The area was originally known as "Piscataway Village" and was part of Montgomery County.
In 1873, the area was renamed Brookmont after the nearby brook. The name was chosen by the local postmaster, who thought it sounded more pleasant than Piscataway Village. The area was officially incorporated as a town in 1894.
In the early 20th century, Brookmont was a small farming community. The town was home to several small businesses, including a general store, a blacksmith shop, and a grist mill. The town also had a school, a church, and a post office.
In the 1950s, the area began to experience rapid growth as Washington, D.C. expanded. The population of Brookmont increased from 1,000 in 1950 to over 5,000 in 1960. The town was annexed by the City of Bethesda in 1961.
Geography
Brookmont is located in Montgomery County, Maryland, just north of Washington, D.C. The town is situated on the banks of the Potomac River and is bordered by the communities of Cabin John, Bethesda, and Potomac.
The town covers an area of 1.2 square miles and has a population of approximately 5,000 people. The town is mostly residential, with some commercial and industrial areas.
The terrain of Brookmont is mostly flat, with some hills in the northern part of the town. The town is located in a temperate climate zone, with hot summers and cold winters.
Economy
The economy of Brookmont is largely based on the service industry. The town is home to several restaurants, retail stores, and professional services. The town also has a few small manufacturing companies.
The town is also home to several government agencies, including the National Institutes of Health and the National Institute of Standards and Technology. These agencies employ many of the town's residents.
Demographics
As of the 2010 census, the population of Brookmont was 5,000. The racial makeup of the town was 79.2% White, 11.2% African American, 4.2% Asian, and 5.4% other.
The median household income in Brookmont was $90,000, and the median family income was $100,000. The town had a poverty rate of 4.2%.
The town is served by the Montgomery County Public Schools system. The town has one elementary school, one middle school, and one high school. The town also has several private schools.
Common Questions
What is Per Capita Income in Brookmont?
Per Capita income in Brookmont is $151,366.
What is the Median Family Income in Brookmont?
Median Family Income in Brookmont is $250,001.
What is the Median Household income in Brookmont?
Median Household Income in Brookmont is $250,001.
What is Income or Wage Gap in Brookmont?
Income or Wage Gap in Brookmont is 41.2%.
Women in Brookmont earn 58.8 cents for every dollar earned by a man.
What is Inequality or Gini Index in Brookmont?
Inequality or Gini Index in Brookmont is 0.44.
What is the Total Population of Brookmont?
Total Population of Brookmont is 3,732.
What is the Total Male Population of Brookmont?
Total Male Population of Brookmont is 1,954.
What is the Total Female Population of Brookmont?
Total Female Population of Brookmont is 1,778.
What is the Ratio of Males per 100 Females in Brookmont?
There are 109.90 Males per 100 Females in Brookmont.
What is the Ratio of Females per 100 Males in Brookmont?
There are 90.99 Females per 100 Males in Brookmont.
What is the Median Population Age in Brookmont?
Median Population Age in Brookmont is 45.9 Years.
What is the Average Family Size in Brookmont
Average Family Size in Brookmont is 3.1 People.
What is the Average Household Size in Brookmont
Average Household Size in Brookmont is 2.9 People.
How Large is the Labor Force in Brookmont?
There are 2,139 People in the Labor Forcein in Brookmont.
What is the Percentage of People in the Labor Force in Brookmont?
76.6% of People are in the Labor Force in Brookmont.
What is the Unemployment Rate in Brookmont?
Unemployment Rate in Brookmont is 6.2%.