Ashton Sandy Spring, MD Map & Demographics
Ashton Sandy Spring Map
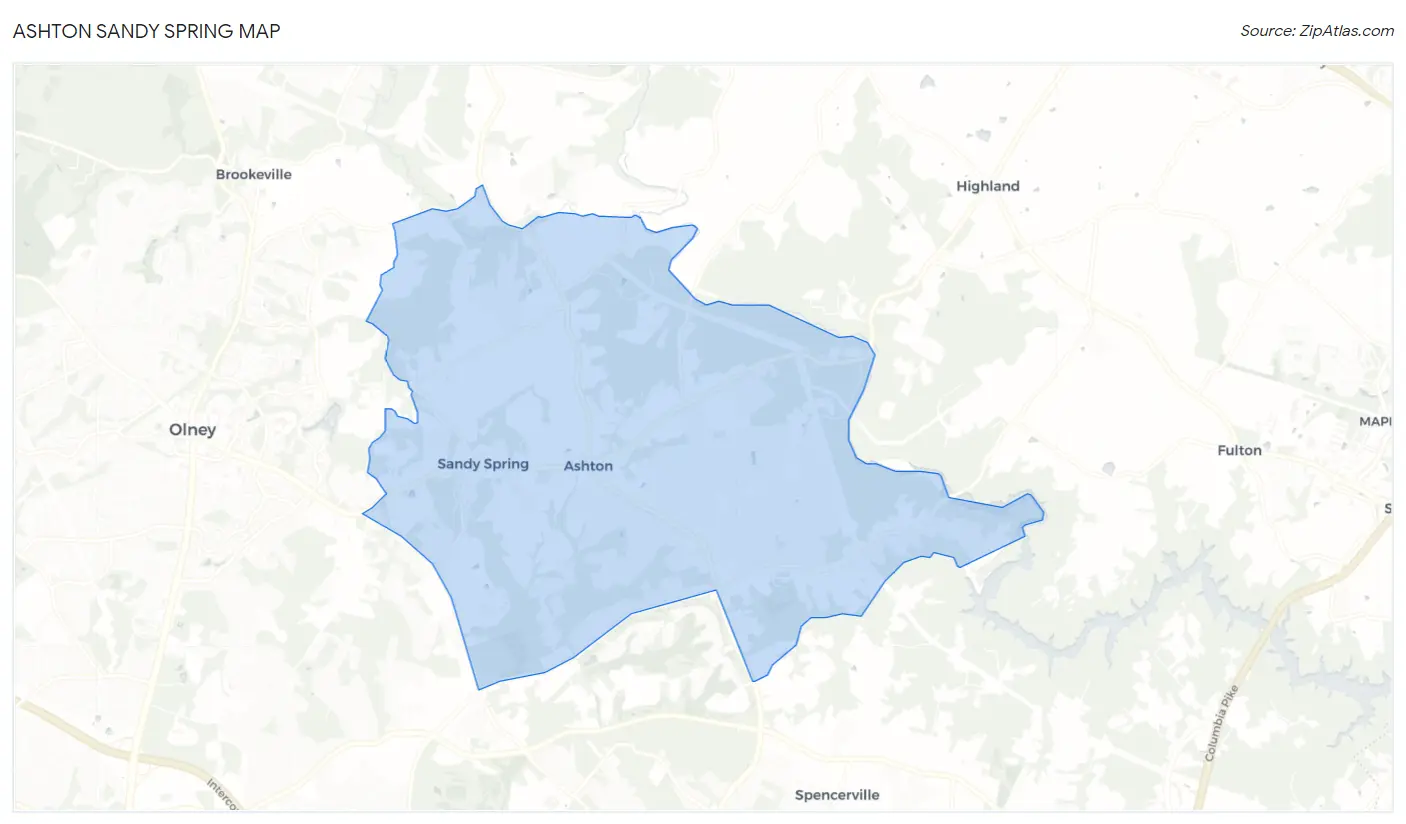
Ashton Sandy Spring Overview
$75,515
PER CAPITA INCOME
$177,500
AVG FAMILY INCOME
$167,577
AVG HOUSEHOLD INCOME
38.9%
WAGE / INCOME GAP [ % ]
61.1¢/ $1
WAGE / INCOME GAP [ $ ]
0.41
INEQUALITY / GINI INDEX
5,578
TOTAL POPULATION
2,662
MALE POPULATION
2,916
FEMALE POPULATION
91.29
MALES / 100 FEMALES
109.54
FEMALES / 100 MALES
48.3
MEDIAN AGE
3.0
AVG FAMILY SIZE
2.7
AVG HOUSEHOLD SIZE
2,956
LABOR FORCE [ PEOPLE ]
64.9%
PERCENT IN LABOR FORCE
3.2%
UNEMPLOYMENT RATE
Income in Ashton Sandy Spring
Income Overview in Ashton Sandy Spring
Per Capita Income in Ashton Sandy Spring is $75,515, while median incomes of families and households are $177,500 and $167,577 respectively.
| Characteristic | Number | Measure |
| Per Capita Income | 5,578 | $75,515 |
| Median Family Income | 1,558 | $177,500 |
| Mean Family Income | 1,558 | $249,250 |
| Median Household Income | 1,915 | $167,577 |
| Mean Household Income | 1,915 | $225,095 |
| Income Deficit | 1,558 | $0 |
| Wage / Income Gap (%) | 5,578 | 38.91% |
| Wage / Income Gap ($) | 5,578 | 61.09¢ per $1 |
| Gini / Inequality Index | 5,578 | 0.41 |
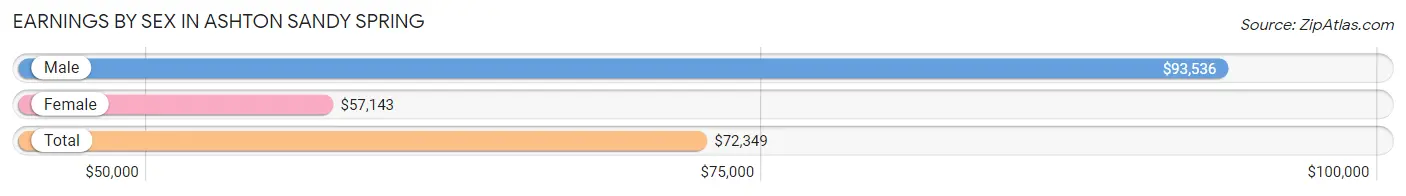
Earnings by Sex in Ashton Sandy Spring
Average Earnings in Ashton Sandy Spring are $72,349, $93,536 for men and $57,143 for women, a difference of 38.9%.
| Sex | Number | Average Earnings |
| Male | 1,501 (48.6%) | $93,536 |
| Female | 1,588 (51.4%) | $57,143 |
| Total | 3,089 (100.0%) | $72,349 |
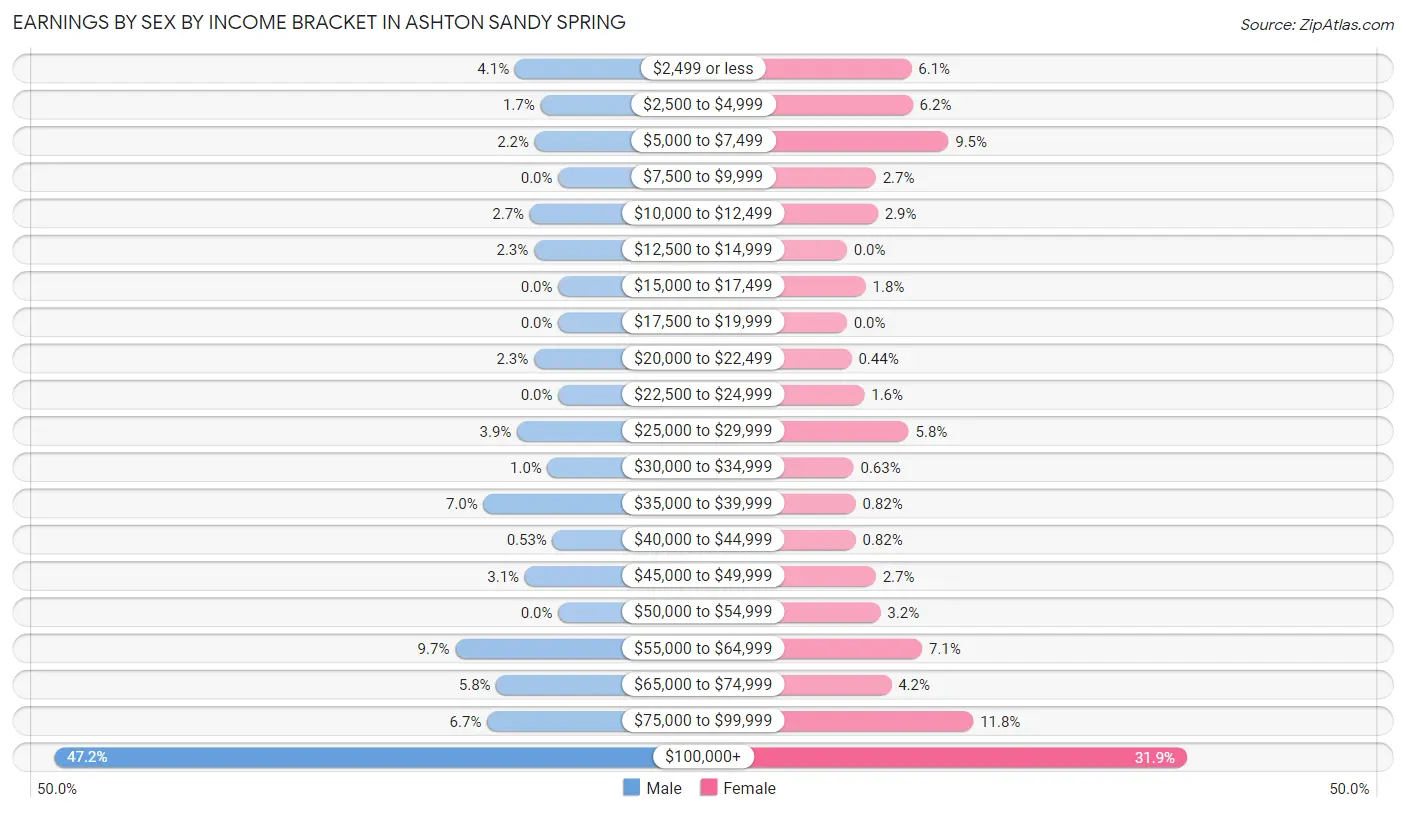
Earnings by Sex by Income Bracket in Ashton Sandy Spring
The most common earnings brackets in Ashton Sandy Spring are $100,000+ for men (709 | 47.2%) and $100,000+ for women (506 | 31.9%).
| Income | Male | Female |
| $2,499 or less | 61 (4.1%) | 96 (6.0%) |
| $2,500 to $4,999 | 25 (1.7%) | 98 (6.2%) |
| $5,000 to $7,499 | 33 (2.2%) | 151 (9.5%) |
| $7,500 to $9,999 | 0 (0.0%) | 43 (2.7%) |
| $10,000 to $12,499 | 40 (2.7%) | 46 (2.9%) |
| $12,500 to $14,999 | 34 (2.3%) | 0 (0.0%) |
| $15,000 to $17,499 | 0 (0.0%) | 28 (1.8%) |
| $17,500 to $19,999 | 0 (0.0%) | 0 (0.0%) |
| $20,000 to $22,499 | 34 (2.3%) | 7 (0.4%) |
| $22,500 to $24,999 | 0 (0.0%) | 26 (1.6%) |
| $25,000 to $29,999 | 58 (3.9%) | 92 (5.8%) |
| $30,000 to $34,999 | 15 (1.0%) | 10 (0.6%) |
| $35,000 to $39,999 | 105 (7.0%) | 13 (0.8%) |
| $40,000 to $44,999 | 8 (0.5%) | 13 (0.8%) |
| $45,000 to $49,999 | 47 (3.1%) | 43 (2.7%) |
| $50,000 to $54,999 | 0 (0.0%) | 50 (3.2%) |
| $55,000 to $64,999 | 145 (9.7%) | 112 (7.0%) |
| $65,000 to $74,999 | 87 (5.8%) | 66 (4.2%) |
| $75,000 to $99,999 | 100 (6.7%) | 188 (11.8%) |
| $100,000+ | 709 (47.2%) | 506 (31.9%) |
| Total | 1,501 (100.0%) | 1,588 (100.0%) |
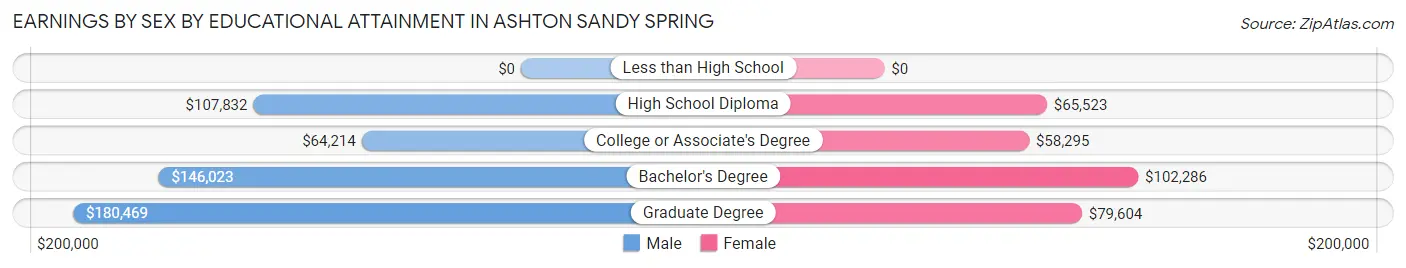
Earnings by Sex by Educational Attainment in Ashton Sandy Spring
Average earnings in Ashton Sandy Spring are $116,375 for men and $77,698 for women, a difference of 33.2%. Men with an educational attainment of graduate degree enjoy the highest average annual earnings of $180,469, while those with college or associate's degree education earn the least with $64,214. Women with an educational attainment of bachelor's degree earn the most with the average annual earnings of $102,286, while those with college or associate's degree education have the smallest earnings of $58,295.
| Educational Attainment | Male Income | Female Income |
| Less than High School | - | - |
| High School Diploma | $107,832 | $65,523 |
| College or Associate's Degree | $64,214 | $58,295 |
| Bachelor's Degree | $146,023 | $102,286 |
| Graduate Degree | $180,469 | $79,604 |
| Total | $116,375 | $77,698 |
Family Income in Ashton Sandy Spring
Family Income Brackets in Ashton Sandy Spring
According to the Ashton Sandy Spring family income data, there are 650 families falling into the $200,000+ income range, which is the most common income bracket and makes up 41.7% of all families.
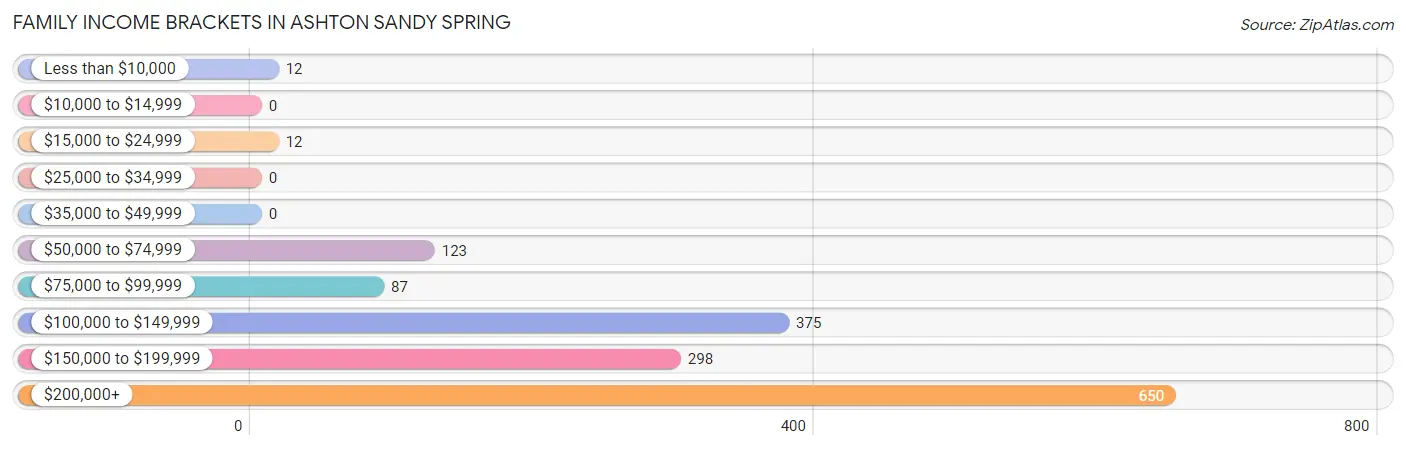
| Income Bracket | # Families | % Families |
| Less than $10,000 | 12 | 0.8% |
| $10,000 to $14,999 | 0 | 0.0% |
| $15,000 to $24,999 | 12 | 0.8% |
| $25,000 to $34,999 | 0 | 0.0% |
| $35,000 to $49,999 | 0 | 0.0% |
| $50,000 to $74,999 | 123 | 7.9% |
| $75,000 to $99,999 | 87 | 5.6% |
| $100,000 to $149,999 | 375 | 24.1% |
| $150,000 to $199,999 | 298 | 19.1% |
| $200,000+ | 650 | 41.7% |
Family Income by Famaliy Size in Ashton Sandy Spring
4-person families (220 | 14.1%) account for the highest median family income in Ashton Sandy Spring with $250,001 per family, while 2-person families (721 | 46.3%) have the highest median income of $88,458 per family member.
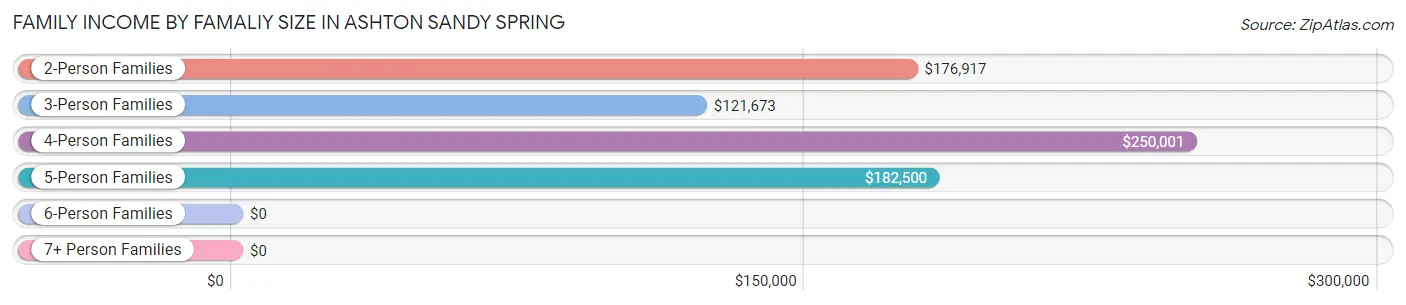
| Income Bracket | # Families | Median Income |
| 2-Person Families | 721 (46.3%) | $176,917 |
| 3-Person Families | 365 (23.4%) | $121,673 |
| 4-Person Families | 220 (14.1%) | $250,001 |
| 5-Person Families | 206 (13.2%) | $182,500 |
| 6-Person Families | 27 (1.7%) | $0 |
| 7+ Person Families | 19 (1.2%) | $0 |
| Total | 1,558 (100.0%) | $177,500 |
Family Income by Number of Earners in Ashton Sandy Spring
The median family income in Ashton Sandy Spring is $177,500, with families comprising 3+ earners (307) having the highest median family income of $250,001, while families with no earners (118) have the lowest median family income of $131,250, accounting for 19.7% and 7.6% of families, respectively.
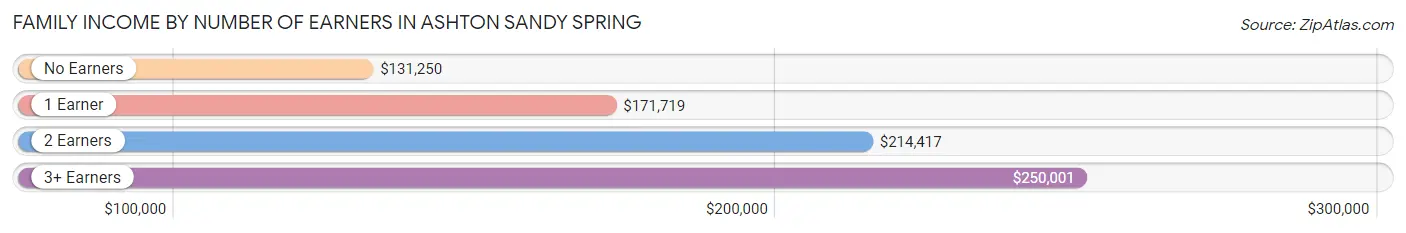
| Number of Earners | # Families | Median Income |
| No Earners | 118 (7.6%) | $131,250 |
| 1 Earner | 474 (30.4%) | $171,719 |
| 2 Earners | 659 (42.3%) | $214,417 |
| 3+ Earners | 307 (19.7%) | $250,001 |
| Total | 1,558 (100.0%) | $177,500 |
Household Income in Ashton Sandy Spring
Household Income Brackets in Ashton Sandy Spring
With 728 households falling in the category, the $200,000+ income range is the most frequent in Ashton Sandy Spring, accounting for 38.0% of all households.
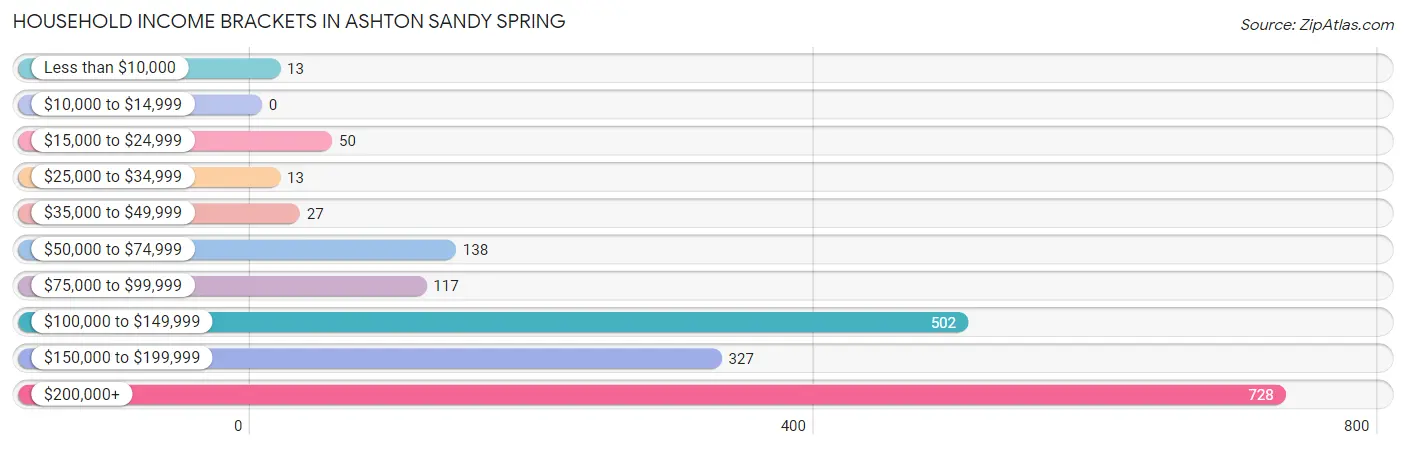
| Income Bracket | # Households | % Households |
| Less than $10,000 | 13 | 0.7% |
| $10,000 to $14,999 | 0 | 0.0% |
| $15,000 to $24,999 | 50 | 2.6% |
| $25,000 to $34,999 | 13 | 0.7% |
| $35,000 to $49,999 | 27 | 1.4% |
| $50,000 to $74,999 | 138 | 7.2% |
| $75,000 to $99,999 | 117 | 6.1% |
| $100,000 to $149,999 | 502 | 26.2% |
| $150,000 to $199,999 | 327 | 17.1% |
| $200,000+ | 728 | 38.0% |
Household Income by Householder Age in Ashton Sandy Spring
The median household income in Ashton Sandy Spring is $167,577, with the highest median household income of $236,477 found in the 25 to 44 years age bracket for the primary householder. A total of 335 households (17.5%) fall into this category.
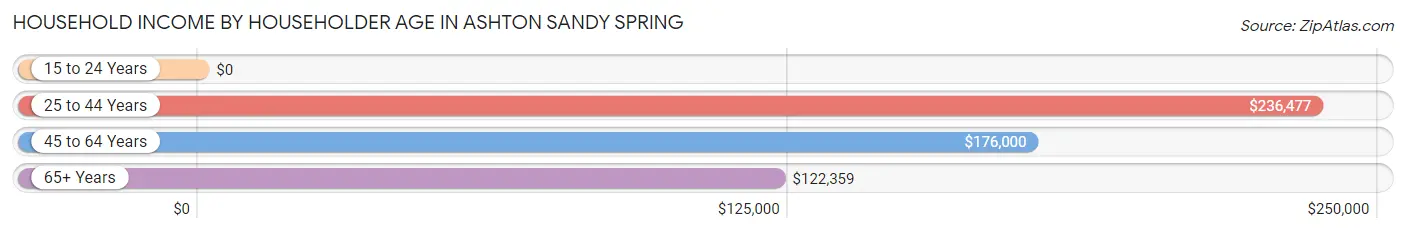
| Income Bracket | # Households | Median Income |
| 15 to 24 Years | 0 (0.0%) | $0 |
| 25 to 44 Years | 335 (17.5%) | $236,477 |
| 45 to 64 Years | 862 (45.0%) | $176,000 |
| 65+ Years | 718 (37.5%) | $122,359 |
| Total | 1,915 (100.0%) | $167,577 |
Poverty in Ashton Sandy Spring
Income Below Poverty by Sex and Age in Ashton Sandy Spring
With 2.8% poverty level for males and 3.0% for females among the residents of Ashton Sandy Spring, 15 year old males and 25 to 34 year old females are the most vulnerable to poverty, with 13 males (15.9%) and 23 females (9.0%) in their respective age groups living below the poverty level.
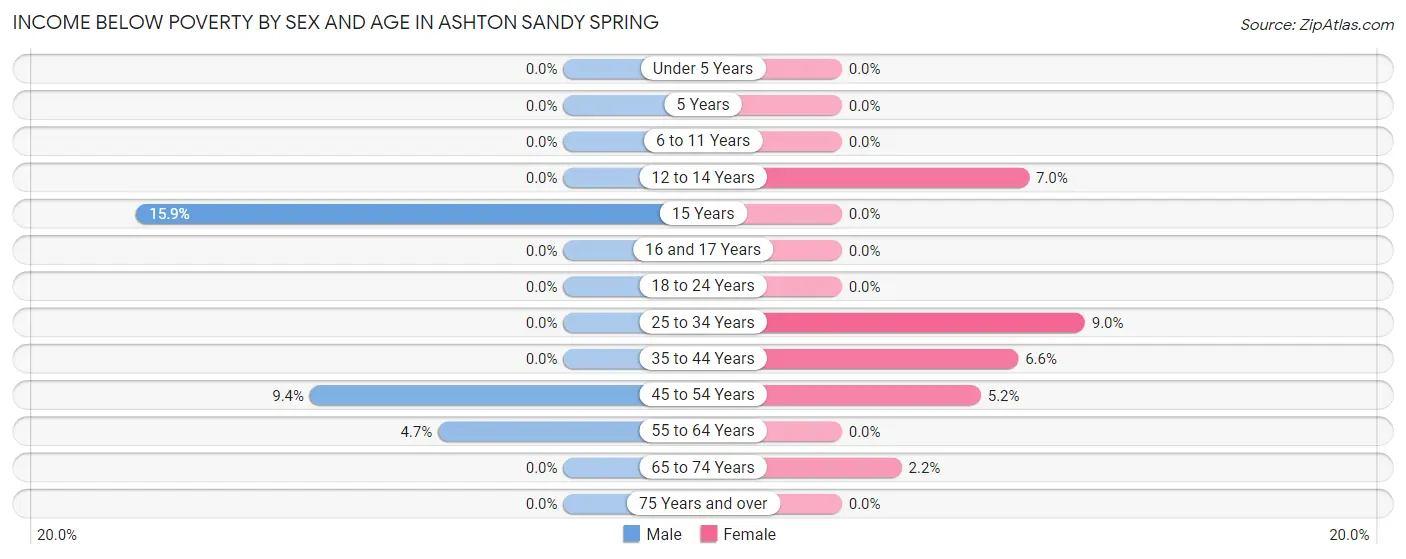
| Age Bracket | Male | Female |
| Under 5 Years | 0 (0.0%) | 0 (0.0%) |
| 5 Years | 0 (0.0%) | 0 (0.0%) |
| 6 to 11 Years | 0 (0.0%) | 0 (0.0%) |
| 12 to 14 Years | 0 (0.0%) | 13 (7.0%) |
| 15 Years | 13 (15.9%) | 0 (0.0%) |
| 16 and 17 Years | 0 (0.0%) | 0 (0.0%) |
| 18 to 24 Years | 0 (0.0%) | 0 (0.0%) |
| 25 to 34 Years | 0 (0.0%) | 23 (9.0%) |
| 35 to 44 Years | 0 (0.0%) | 22 (6.6%) |
| 45 to 54 Years | 40 (9.4%) | 13 (5.2%) |
| 55 to 64 Years | 19 (4.6%) | 0 (0.0%) |
| 65 to 74 Years | 0 (0.0%) | 13 (2.2%) |
| 75 Years and over | 0 (0.0%) | 0 (0.0%) |
| Total | 72 (2.8%) | 84 (3.0%) |
Income Above Poverty by Sex and Age in Ashton Sandy Spring
According to the poverty statistics in Ashton Sandy Spring, males aged under 5 years and females aged under 5 years are the age groups that are most secure financially, with 100.0% of males and 100.0% of females in these age groups living above the poverty line.
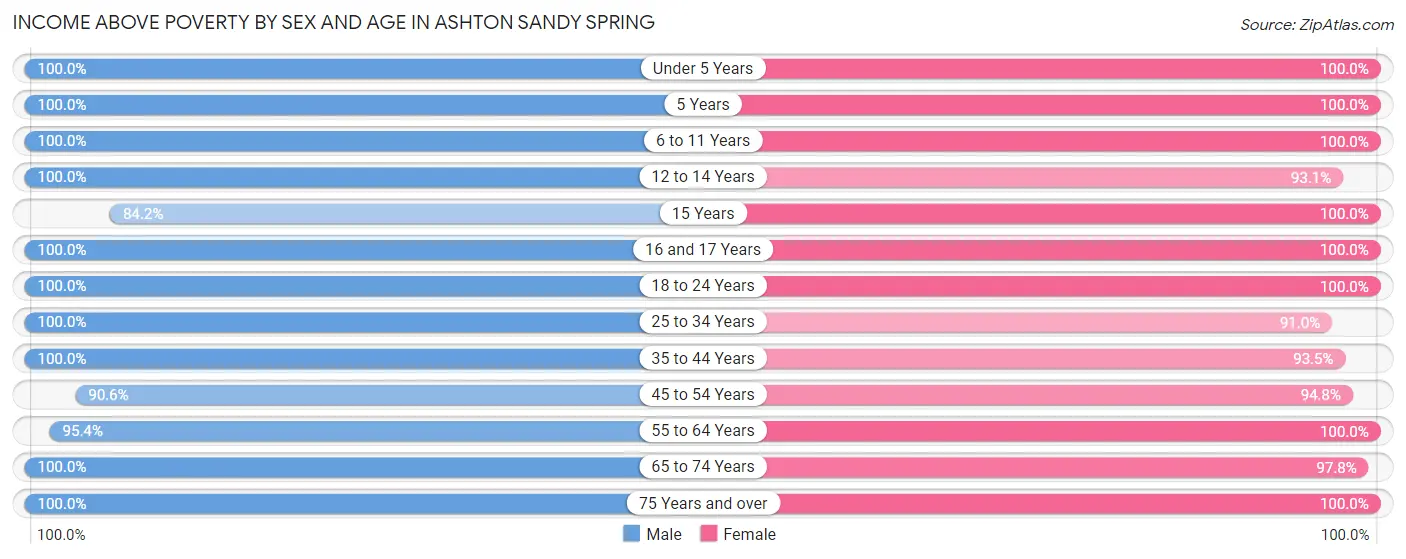
| Age Bracket | Male | Female |
| Under 5 Years | 119 (100.0%) | 99 (100.0%) |
| 5 Years | 39 (100.0%) | 63 (100.0%) |
| 6 to 11 Years | 160 (100.0%) | 92 (100.0%) |
| 12 to 14 Years | 78 (100.0%) | 174 (93.0%) |
| 15 Years | 69 (84.2%) | 104 (100.0%) |
| 16 and 17 Years | 159 (100.0%) | 28 (100.0%) |
| 18 to 24 Years | 152 (100.0%) | 212 (100.0%) |
| 25 to 34 Years | 189 (100.0%) | 232 (91.0%) |
| 35 to 44 Years | 267 (100.0%) | 314 (93.4%) |
| 45 to 54 Years | 385 (90.6%) | 239 (94.8%) |
| 55 to 64 Years | 390 (95.4%) | 427 (100.0%) |
| 65 to 74 Years | 286 (100.0%) | 572 (97.8%) |
| 75 Years and over | 231 (100.0%) | 175 (100.0%) |
| Total | 2,524 (97.2%) | 2,731 (97.0%) |
Income Below Poverty Among Married-Couple Families in Ashton Sandy Spring
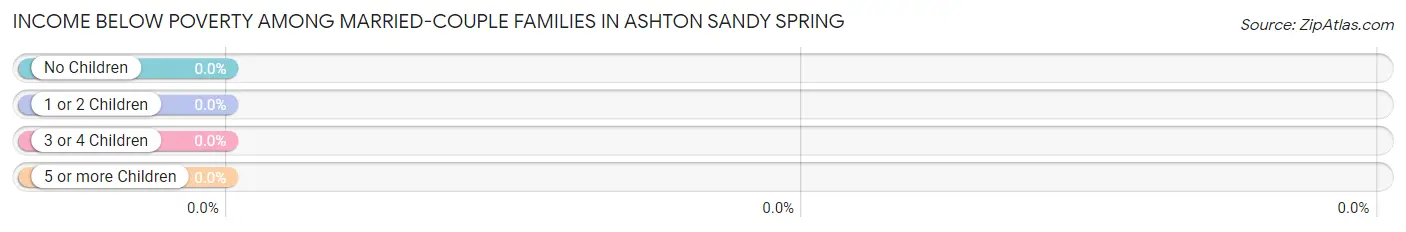
| Children | Above Poverty | Below Poverty |
| No Children | 670 (100.0%) | 0 (0.0%) |
| 1 or 2 Children | 412 (100.0%) | 0 (0.0%) |
| 3 or 4 Children | 91 (100.0%) | 0 (0.0%) |
| 5 or more Children | 8 (100.0%) | 0 (0.0%) |
| Total | 1,181 (100.0%) | 0 (0.0%) |
Income Below Poverty Among Single-Parent Households in Ashton Sandy Spring
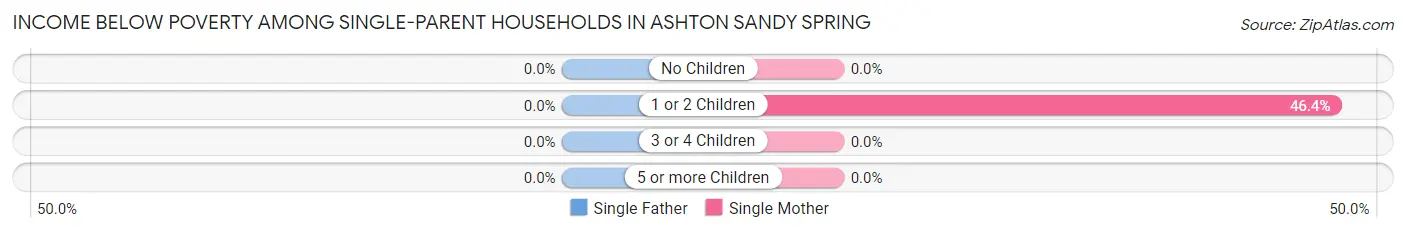
| Children | Single Father | Single Mother |
| No Children | 0 (0.0%) | 0 (0.0%) |
| 1 or 2 Children | 0 (0.0%) | 13 (46.4%) |
| 3 or 4 Children | 0 (0.0%) | 0 (0.0%) |
| 5 or more Children | 0 (0.0%) | 0 (0.0%) |
| Total | 0 (0.0%) | 13 (5.1%) |
Income Below Poverty Among Married-Couple vs Single-Parent Households in Ashton Sandy Spring
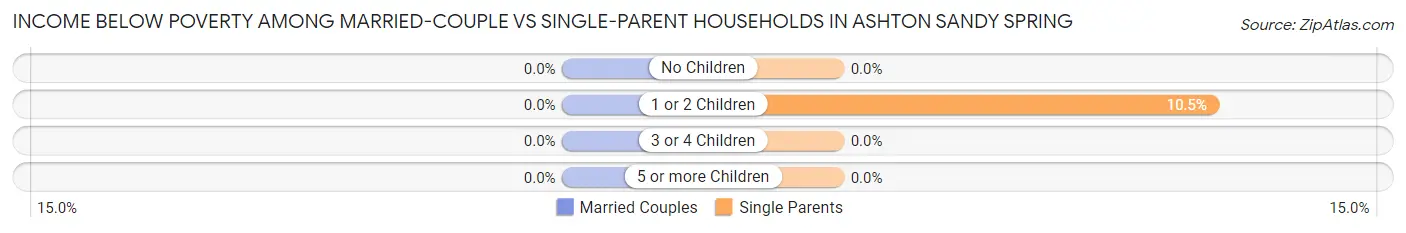
| Children | Married-Couple Families | Single-Parent Households |
| No Children | 0 (0.0%) | 0 (0.0%) |
| 1 or 2 Children | 0 (0.0%) | 13 (10.5%) |
| 3 or 4 Children | 0 (0.0%) | 0 (0.0%) |
| 5 or more Children | 0 (0.0%) | 0 (0.0%) |
| Total | 0 (0.0%) | 13 (3.5%) |
Race in Ashton Sandy Spring
The most populous races in Ashton Sandy Spring are White / Caucasian (3,749 | 67.2%), Black / African American (679 | 12.2%), and Hispanic or Latino (521 | 9.3%).
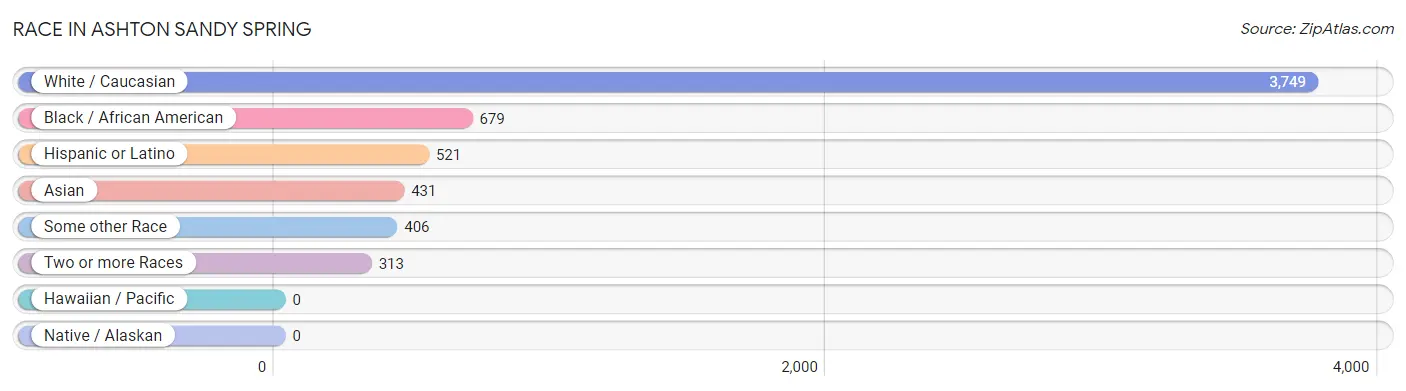
| Race | # Population | % Population |
| Asian | 431 | 7.7% |
| Black / African American | 679 | 12.2% |
| Hawaiian / Pacific | 0 | 0.0% |
| Hispanic or Latino | 521 | 9.3% |
| Native / Alaskan | 0 | 0.0% |
| White / Caucasian | 3,749 | 67.2% |
| Two or more Races | 313 | 5.6% |
| Some other Race | 406 | 7.3% |
| Total | 5,578 | 100.0% |
Ancestry in Ashton Sandy Spring
The most populous ancestries reported in Ashton Sandy Spring are German (708 | 12.7%), Irish (627 | 11.2%), English (417 | 7.5%), Italian (353 | 6.3%), and Central American (346 | 6.2%), together accounting for 43.9% of all Ashton Sandy Spring residents.
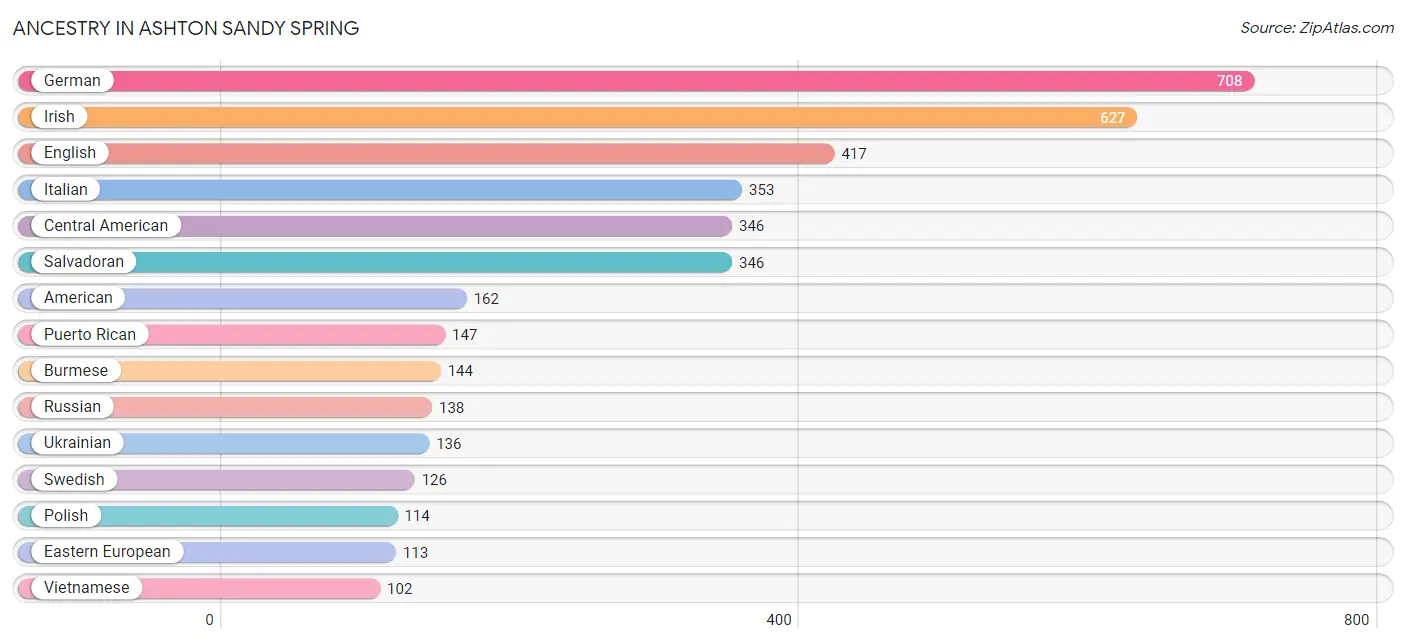
| Ancestry | # Population | % Population |
| American | 162 | 2.9% |
| Arab | 79 | 1.4% |
| Armenian | 42 | 0.7% |
| British | 2 | 0.0% |
| Bulgarian | 38 | 0.7% |
| Burmese | 144 | 2.6% |
| Central American | 346 | 6.2% |
| Cherokee | 18 | 0.3% |
| Czech | 25 | 0.4% |
| Danish | 16 | 0.3% |
| Dutch | 26 | 0.5% |
| Eastern European | 113 | 2.0% |
| English | 417 | 7.5% |
| Ethiopian | 1 | 0.0% |
| European | 95 | 1.7% |
| French | 93 | 1.7% |
| French Canadian | 14 | 0.3% |
| German | 708 | 12.7% |
| Ghanaian | 28 | 0.5% |
| Hungarian | 81 | 1.5% |
| Indian (Asian) | 10 | 0.2% |
| Iranian | 44 | 0.8% |
| Irish | 627 | 11.2% |
| Iroquois | 22 | 0.4% |
| Italian | 353 | 6.3% |
| Jamaican | 19 | 0.3% |
| Lithuanian | 38 | 0.7% |
| Mexican | 15 | 0.3% |
| Norwegian | 64 | 1.1% |
| Polish | 114 | 2.0% |
| Portuguese | 20 | 0.4% |
| Puerto Rican | 147 | 2.6% |
| Russian | 138 | 2.5% |
| Salvadoran | 346 | 6.2% |
| Scotch-Irish | 34 | 0.6% |
| Scottish | 71 | 1.3% |
| South American | 13 | 0.2% |
| Sri Lankan | 79 | 1.4% |
| Subsaharan African | 29 | 0.5% |
| Swedish | 126 | 2.3% |
| Thai | 89 | 1.6% |
| Ukrainian | 136 | 2.4% |
| Venezuelan | 13 | 0.2% |
| Vietnamese | 102 | 1.8% |
| Welsh | 19 | 0.3% | View All 45 Rows |
Immigrants in Ashton Sandy Spring
The most numerous immigrant groups reported in Ashton Sandy Spring came from Asia (307 | 5.5%), Latin America (288 | 5.2%), Central America (255 | 4.6%), El Salvador (240 | 4.3%), and South Central Asia (197 | 3.5%), together accounting for 23.1% of all Ashton Sandy Spring residents.
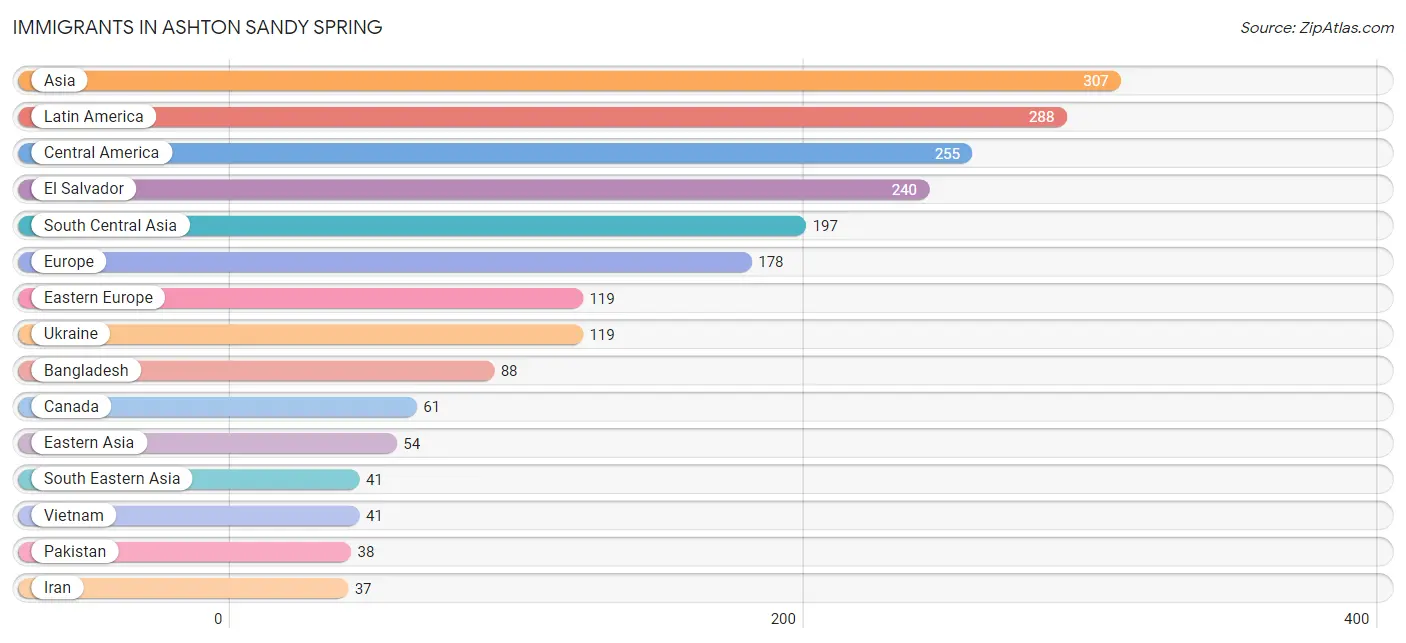
| Immigration Origin | # Population | % Population |
| Africa | 22 | 0.4% |
| Asia | 307 | 5.5% |
| Bangladesh | 88 | 1.6% |
| Canada | 61 | 1.1% |
| Caribbean | 33 | 0.6% |
| Central America | 255 | 4.6% |
| China | 23 | 0.4% |
| Eastern Africa | 1 | 0.0% |
| Eastern Asia | 54 | 1.0% |
| Eastern Europe | 119 | 2.1% |
| El Salvador | 240 | 4.3% |
| England | 21 | 0.4% |
| Ethiopia | 1 | 0.0% |
| Europe | 178 | 3.2% |
| Germany | 16 | 0.3% |
| Ghana | 21 | 0.4% |
| India | 34 | 0.6% |
| Iran | 37 | 0.7% |
| Jamaica | 33 | 0.6% |
| Korea | 31 | 0.6% |
| Kuwait | 15 | 0.3% |
| Latin America | 288 | 5.2% |
| Mexico | 15 | 0.3% |
| Northern Europe | 23 | 0.4% |
| Pakistan | 38 | 0.7% |
| Portugal | 20 | 0.4% |
| Scotland | 2 | 0.0% |
| South Central Asia | 197 | 3.5% |
| South Eastern Asia | 41 | 0.7% |
| Southern Europe | 20 | 0.4% |
| Ukraine | 119 | 2.1% |
| Vietnam | 41 | 0.7% |
| Western Africa | 21 | 0.4% |
| Western Asia | 15 | 0.3% |
| Western Europe | 16 | 0.3% | View All 35 Rows |
Sex and Age in Ashton Sandy Spring
Sex and Age in Ashton Sandy Spring
The most populous age groups in Ashton Sandy Spring are 15 to 19 Years (266 | 10.0%) for men and 65 to 69 Years (498 | 17.1%) for women.
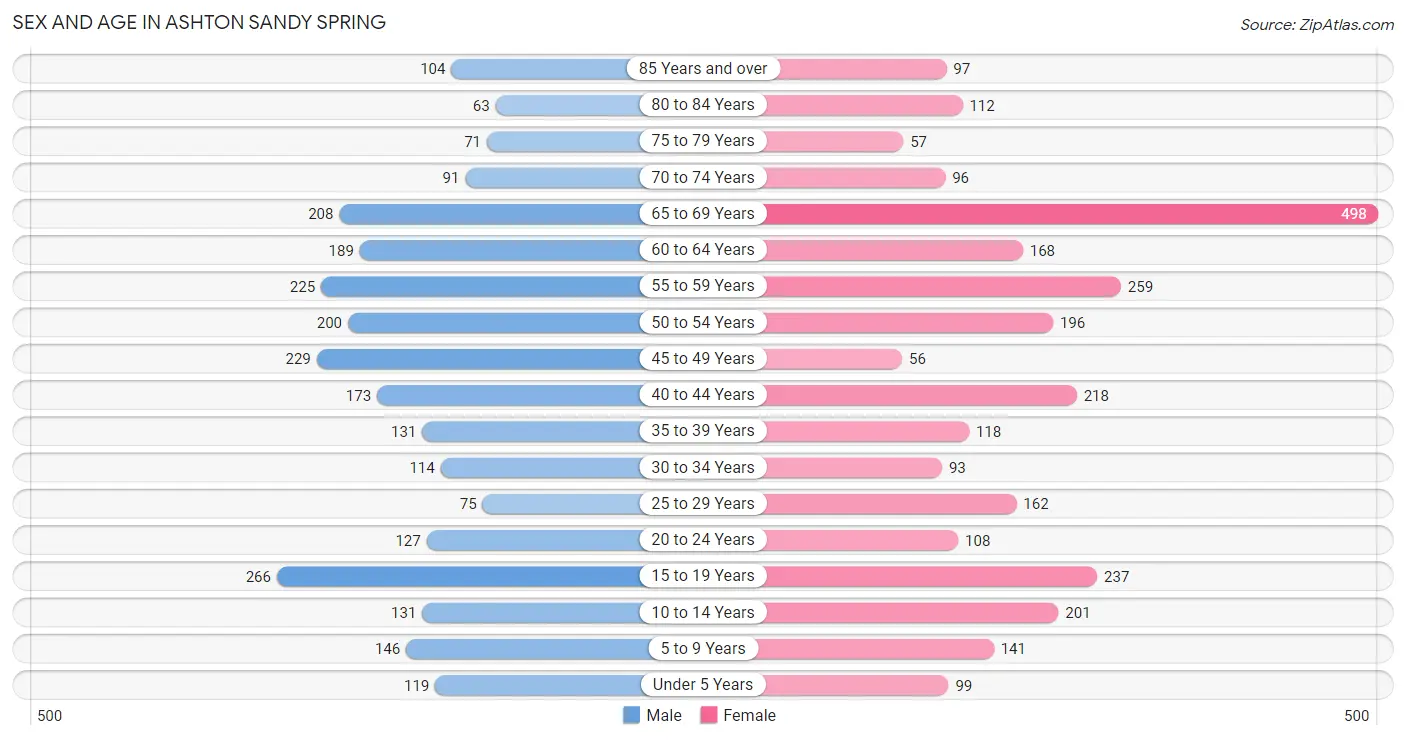
| Age Bracket | Male | Female |
| Under 5 Years | 119 (4.5%) | 99 (3.4%) |
| 5 to 9 Years | 146 (5.5%) | 141 (4.8%) |
| 10 to 14 Years | 131 (4.9%) | 201 (6.9%) |
| 15 to 19 Years | 266 (10.0%) | 237 (8.1%) |
| 20 to 24 Years | 127 (4.8%) | 108 (3.7%) |
| 25 to 29 Years | 75 (2.8%) | 162 (5.6%) |
| 30 to 34 Years | 114 (4.3%) | 93 (3.2%) |
| 35 to 39 Years | 131 (4.9%) | 118 (4.1%) |
| 40 to 44 Years | 173 (6.5%) | 218 (7.5%) |
| 45 to 49 Years | 229 (8.6%) | 56 (1.9%) |
| 50 to 54 Years | 200 (7.5%) | 196 (6.7%) |
| 55 to 59 Years | 225 (8.5%) | 259 (8.9%) |
| 60 to 64 Years | 189 (7.1%) | 168 (5.8%) |
| 65 to 69 Years | 208 (7.8%) | 498 (17.1%) |
| 70 to 74 Years | 91 (3.4%) | 96 (3.3%) |
| 75 to 79 Years | 71 (2.7%) | 57 (1.9%) |
| 80 to 84 Years | 63 (2.4%) | 112 (3.8%) |
| 85 Years and over | 104 (3.9%) | 97 (3.3%) |
| Total | 2,662 (100.0%) | 2,916 (100.0%) |
Families and Households in Ashton Sandy Spring
Median Family Size in Ashton Sandy Spring
The median family size in Ashton Sandy Spring is 3.02 persons per family, with married-couple families (1,181 | 75.8%) accounting for the largest median family size of 3.36 persons per family. On the other hand, single female/mother families (253 | 16.2%) represent the smallest median family size with 1.76 persons per family.
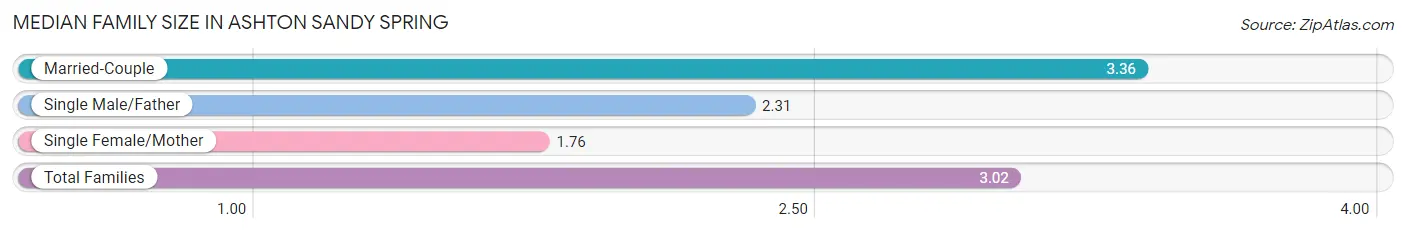
| Family Type | # Families | Family Size |
| Married-Couple | 1,181 (75.8%) | 3.36 |
| Single Male/Father | 124 (8.0%) | 2.31 |
| Single Female/Mother | 253 (16.2%) | 1.76 |
| Total Families | 1,558 (100.0%) | 3.02 |
Median Household Size in Ashton Sandy Spring
The median household size in Ashton Sandy Spring is 2.74 persons per household, with married-couple households (1,181 | 61.7%) accounting for the largest median household size of 3.38 persons per household. non-family households (357 | 18.6%) represent the smallest median household size with 1.32 persons per household.
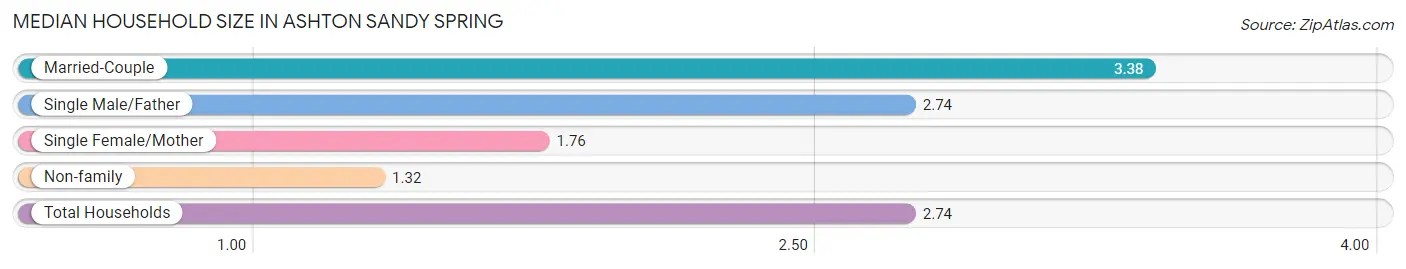
| Household Type | # Households | Household Size |
| Married-Couple | 1,181 (61.7%) | 3.38 |
| Single Male/Father | 124 (6.5%) | 2.74 |
| Single Female/Mother | 253 (13.2%) | 1.76 |
| Non-family | 357 (18.6%) | 1.32 |
| Total Households | 1,915 (100.0%) | 2.74 |
Household Size by Marriage Status in Ashton Sandy Spring
Out of a total of 1,915 households in Ashton Sandy Spring, 1,558 (81.4%) are family households, while 357 (18.6%) are nonfamily households. The most numerous type of family households are 2-person households, comprising 687, and the most common type of nonfamily households are 1-person households, comprising 226.
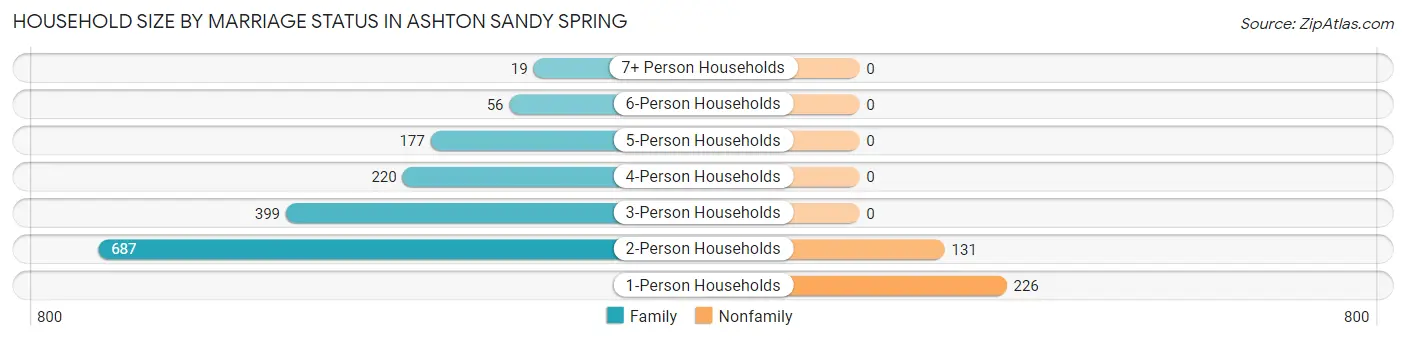
| Household Size | Family Households | Nonfamily Households |
| 1-Person Households | - | 226 (11.8%) |
| 2-Person Households | 687 (35.9%) | 131 (6.8%) |
| 3-Person Households | 399 (20.8%) | 0 (0.0%) |
| 4-Person Households | 220 (11.5%) | 0 (0.0%) |
| 5-Person Households | 177 (9.2%) | 0 (0.0%) |
| 6-Person Households | 56 (2.9%) | 0 (0.0%) |
| 7+ Person Households | 19 (1.0%) | 0 (0.0%) |
| Total | 1,558 (81.4%) | 357 (18.6%) |
Female Fertility in Ashton Sandy Spring
Fertility by Age in Ashton Sandy Spring
Average fertility rate in Ashton Sandy Spring is 37.0 births per 1,000 women. Women in the age bracket of 20 to 34 years have the highest fertility rate with 110.0 births per 1,000 women. Women in the age bracket of 20 to 34 years acount for 100.0% of all women with births.
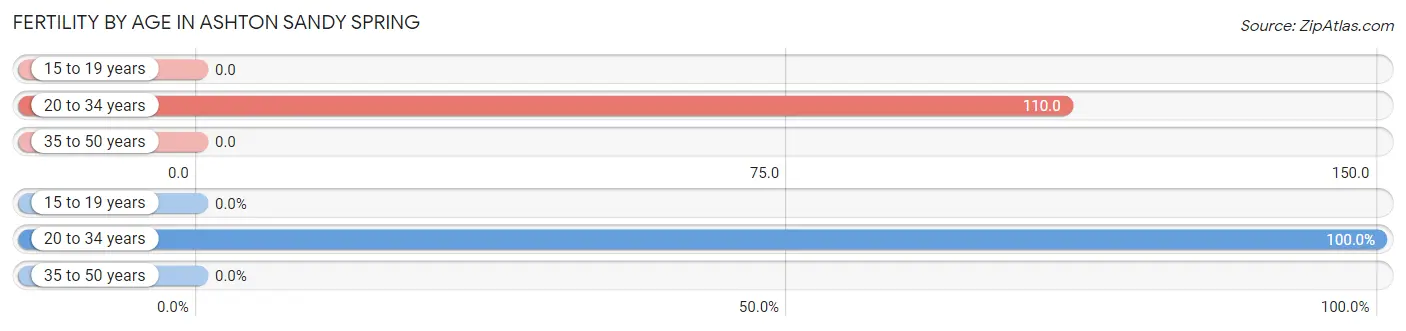
| Age Bracket | Women with Births | Births / 1,000 Women |
| 15 to 19 years | 0 (0.0%) | 0.0 |
| 20 to 34 years | 40 (100.0%) | 110.0 |
| 35 to 50 years | 0 (0.0%) | 0.0 |
| Total | 40 (100.0%) | 37.0 |
Fertility by Age by Marriage Status in Ashton Sandy Spring
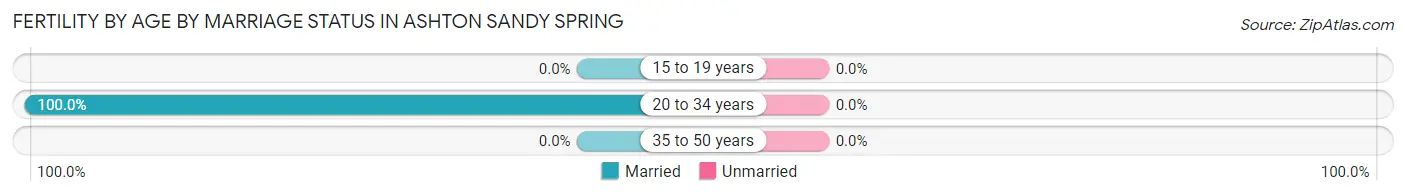
| Age Bracket | Married | Unmarried |
| 15 to 19 years | 0 (0.0%) | 0 (0.0%) |
| 20 to 34 years | 40 (100.0%) | 0 (0.0%) |
| 35 to 50 years | 0 (0.0%) | 0 (0.0%) |
| Total | 40 (100.0%) | 0 (0.0%) |
Fertility by Education in Ashton Sandy Spring
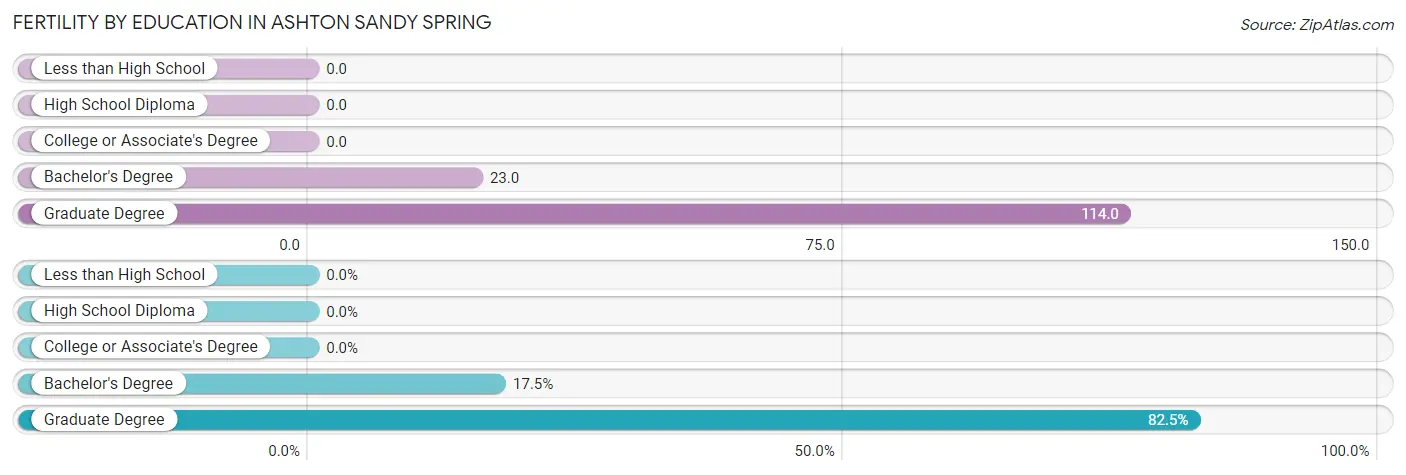
| Educational Attainment | Women with Births | Births / 1,000 Women |
| Less than High School | 0 (0.0%) | 0.0 |
| High School Diploma | 0 (0.0%) | 0.0 |
| College or Associate's Degree | 0 (0.0%) | 0.0 |
| Bachelor's Degree | 7 (17.5%) | 23.0 |
| Graduate Degree | 33 (82.5%) | 114.0 |
| Total | 40 (100.0%) | 37.0 |
Fertility by Education by Marriage Status in Ashton Sandy Spring
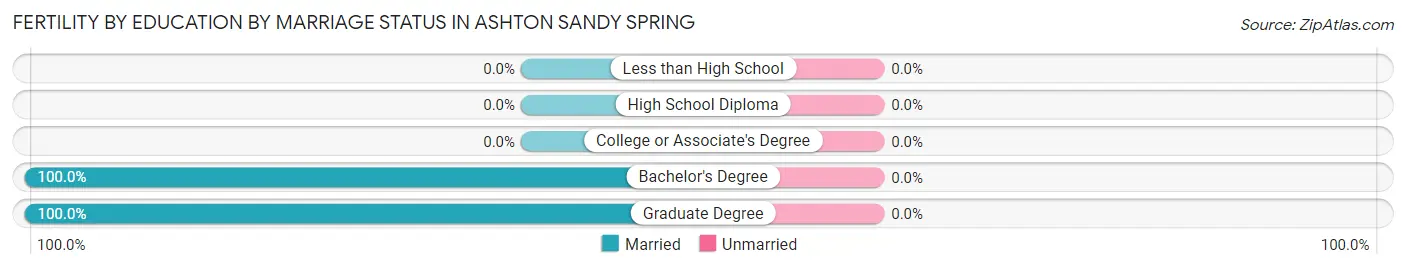
| Educational Attainment | Married | Unmarried |
| Less than High School | 0 (0.0%) | 0 (0.0%) |
| High School Diploma | 0 (0.0%) | 0 (0.0%) |
| College or Associate's Degree | 0 (0.0%) | 0 (0.0%) |
| Bachelor's Degree | 7 (100.0%) | 0 (0.0%) |
| Graduate Degree | 33 (100.0%) | 0 (0.0%) |
| Total | 40 (100.0%) | 0 (0.0%) |
Employment Characteristics in Ashton Sandy Spring
Employment by Class of Employer in Ashton Sandy Spring
Among the 2,862 employed individuals in Ashton Sandy Spring, private company employees (1,687 | 58.9%), self-employed (incorporated) (309 | 10.8%), and local government employees (233 | 8.1%) make up the most common classes of employment.
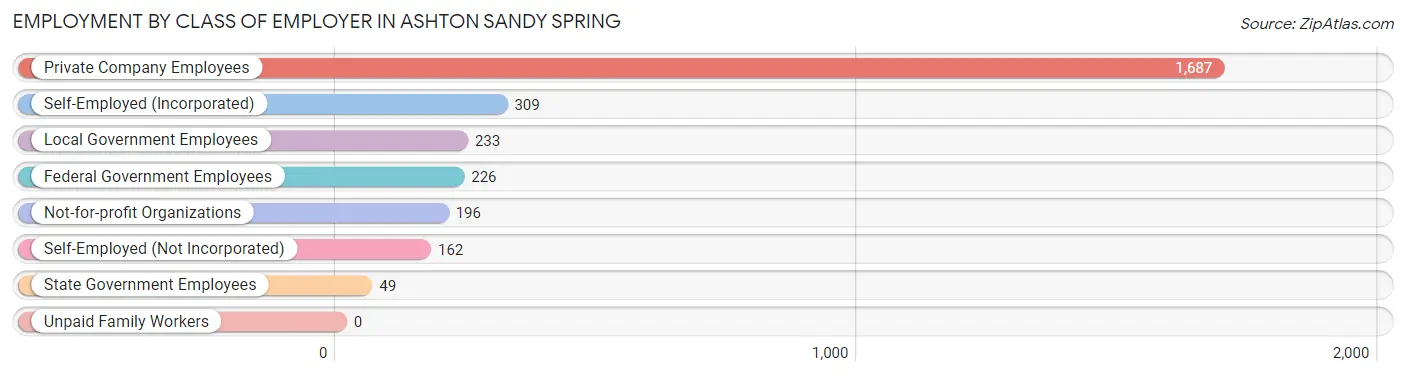
| Employer Class | # Employees | % Employees |
| Private Company Employees | 1,687 | 58.9% |
| Self-Employed (Incorporated) | 309 | 10.8% |
| Self-Employed (Not Incorporated) | 162 | 5.7% |
| Not-for-profit Organizations | 196 | 6.9% |
| Local Government Employees | 233 | 8.1% |
| State Government Employees | 49 | 1.7% |
| Federal Government Employees | 226 | 7.9% |
| Unpaid Family Workers | 0 | 0.0% |
| Total | 2,862 | 100.0% |
Employment Status by Age in Ashton Sandy Spring
According to the labor force statistics for Ashton Sandy Spring, out of the total population over 16 years of age (4,555), 64.9% or 2,956 individuals are in the labor force, with 3.2% or 95 of them unemployed. The age group with the highest labor force participation rate is 30 to 34 years, with 100.0% or 207 individuals in the labor force. Within the labor force, the 20 to 24 years age range has the highest percentage of unemployed individuals, with 18.8% or 42 of them being unemployed.
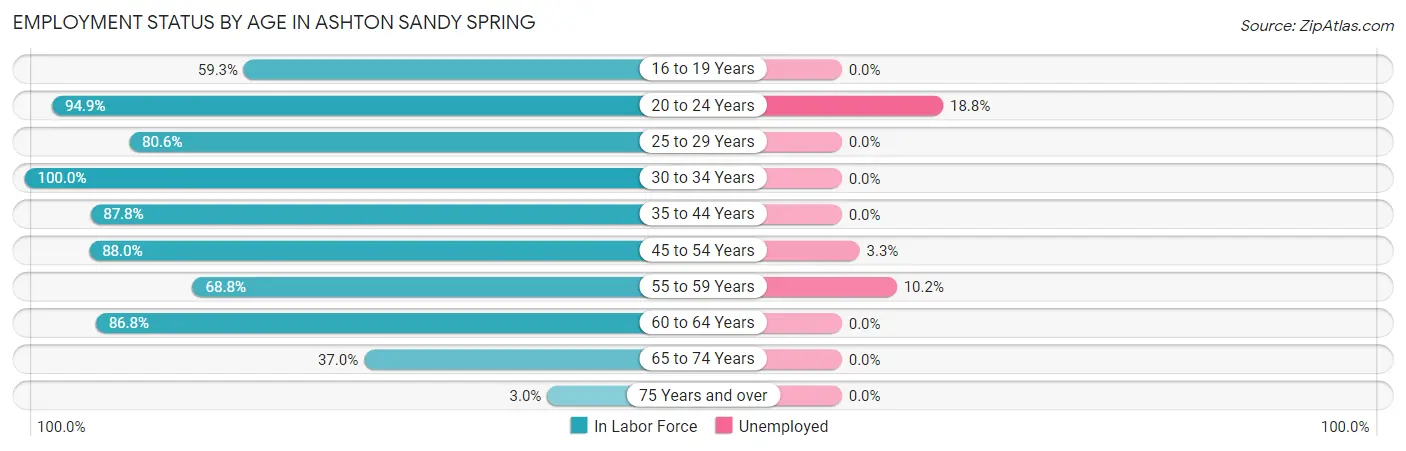
| Age Bracket | In Labor Force | Unemployed |
| 16 to 19 Years | 188 (59.3%) | 0 (0.0%) |
| 20 to 24 Years | 223 (94.9%) | 42 (18.8%) |
| 25 to 29 Years | 191 (80.6%) | 0 (0.0%) |
| 30 to 34 Years | 207 (100.0%) | 0 (0.0%) |
| 35 to 44 Years | 562 (87.8%) | 0 (0.0%) |
| 45 to 54 Years | 599 (88.0%) | 20 (3.3%) |
| 55 to 59 Years | 333 (68.8%) | 34 (10.2%) |
| 60 to 64 Years | 310 (86.8%) | 0 (0.0%) |
| 65 to 74 Years | 330 (37.0%) | 0 (0.0%) |
| 75 Years and over | 15 (3.0%) | 0 (0.0%) |
| Total | 2,956 (64.9%) | 95 (3.2%) |
Employment Status by Educational Attainment in Ashton Sandy Spring
According to labor force statistics for Ashton Sandy Spring, 84.5% of individuals (2,202) out of the total population between 25 and 64 years of age (2,606) are in the labor force, with 2.5% or 55 of them being unemployed. The group with the highest labor force participation rate are those with the educational attainment of bachelor's degree or higher, with 90.4% or 1,420 individuals in the labor force. Within the labor force, individuals with less than high school education have the highest percentage of unemployment, with 40.2% or 41 of them being unemployed.
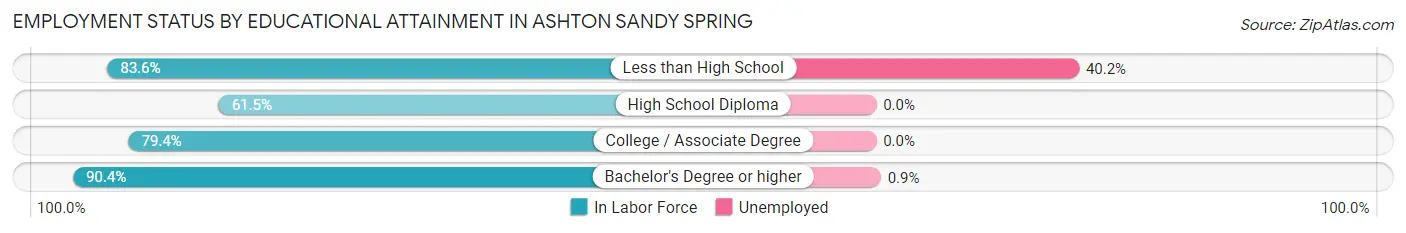
| Educational Attainment | In Labor Force | Unemployed |
| Less than High School | 102 (83.6%) | 49 (40.2%) |
| High School Diploma | 155 (61.5%) | 0 (0.0%) |
| College / Associate Degree | 525 (79.4%) | 0 (0.0%) |
| Bachelor's Degree or higher | 1,420 (90.4%) | 14 (0.9%) |
| Total | 2,202 (84.5%) | 65 (2.5%) |
Employment Occupations by Sex in Ashton Sandy Spring
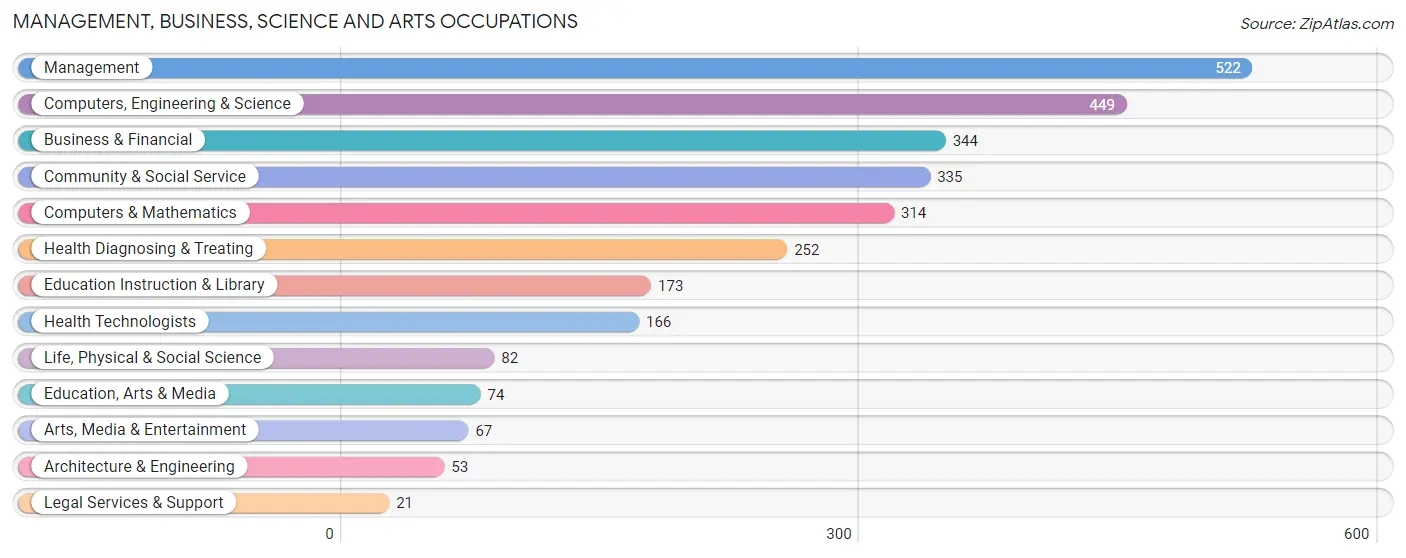
Management, Business, Science and Arts Occupations
The most common Management, Business, Science and Arts occupations in Ashton Sandy Spring are Management (522 | 18.2%), Computers, Engineering & Science (449 | 15.7%), Business & Financial (344 | 12.0%), Community & Social Service (335 | 11.7%), and Computers & Mathematics (314 | 11.0%).
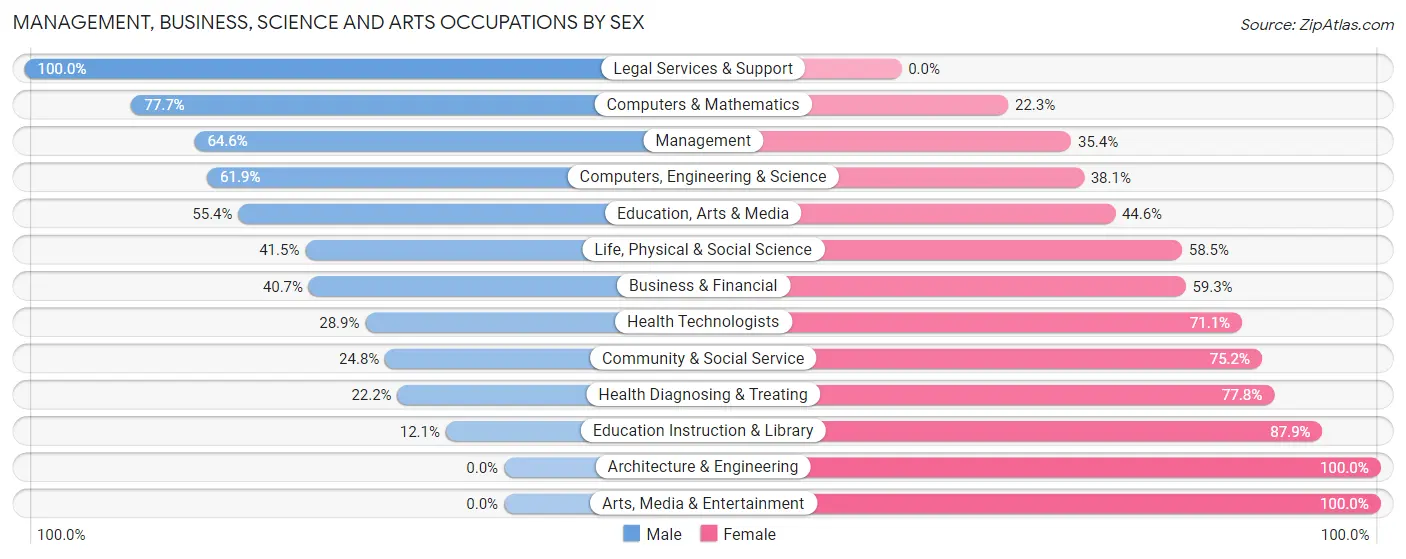
Management, Business, Science and Arts Occupations by Sex
Within the Management, Business, Science and Arts occupations in Ashton Sandy Spring, the most male-oriented occupations are Legal Services & Support (100.0%), Computers & Mathematics (77.7%), and Management (64.6%), while the most female-oriented occupations are Architecture & Engineering (100.0%), Arts, Media & Entertainment (100.0%), and Education Instruction & Library (87.9%).
| Occupation | Male | Female |
| Management | 337 (64.6%) | 185 (35.4%) |
| Business & Financial | 140 (40.7%) | 204 (59.3%) |
| Computers, Engineering & Science | 278 (61.9%) | 171 (38.1%) |
| Computers & Mathematics | 244 (77.7%) | 70 (22.3%) |
| Architecture & Engineering | 0 (0.0%) | 53 (100.0%) |
| Life, Physical & Social Science | 34 (41.5%) | 48 (58.5%) |
| Community & Social Service | 83 (24.8%) | 252 (75.2%) |
| Education, Arts & Media | 41 (55.4%) | 33 (44.6%) |
| Legal Services & Support | 21 (100.0%) | 0 (0.0%) |
| Education Instruction & Library | 21 (12.1%) | 152 (87.9%) |
| Arts, Media & Entertainment | 0 (0.0%) | 67 (100.0%) |
| Health Diagnosing & Treating | 56 (22.2%) | 196 (77.8%) |
| Health Technologists | 48 (28.9%) | 118 (71.1%) |
| Total (Category) | 894 (47.0%) | 1,008 (53.0%) |
| Total (Overall) | 1,428 (49.9%) | 1,434 (50.1%) |
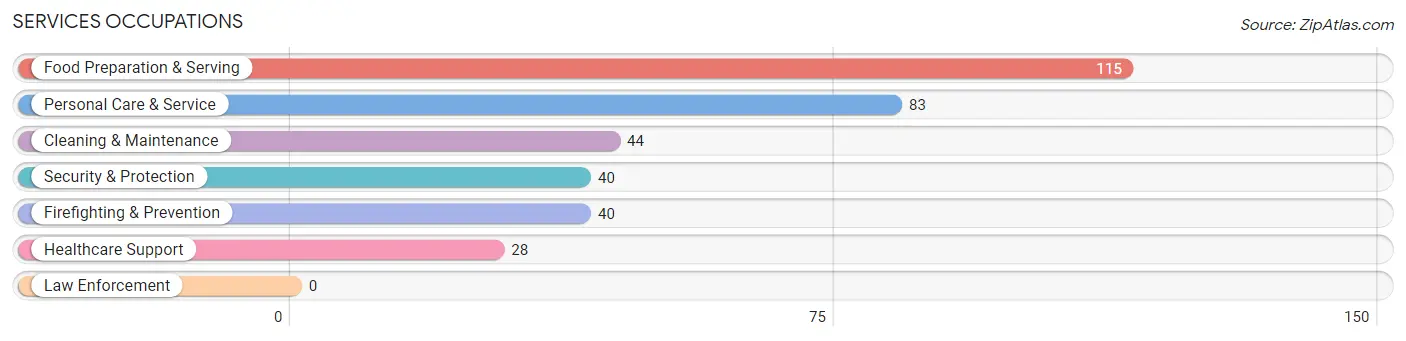
Services Occupations
The most common Services occupations in Ashton Sandy Spring are Food Preparation & Serving (115 | 4.0%), Personal Care & Service (83 | 2.9%), Cleaning & Maintenance (44 | 1.5%), Security & Protection (40 | 1.4%), and Firefighting & Prevention (40 | 1.4%).
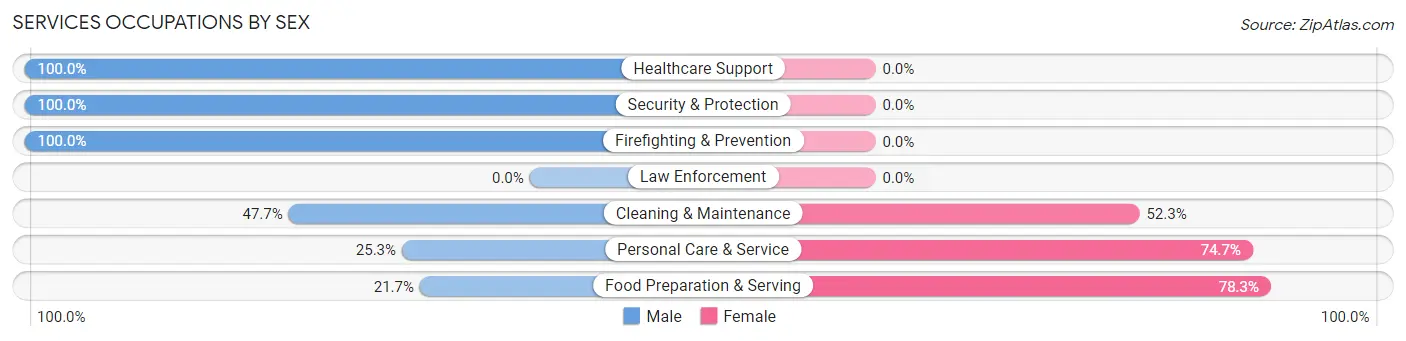
Services Occupations by Sex
Within the Services occupations in Ashton Sandy Spring, the most male-oriented occupations are Healthcare Support (100.0%), Security & Protection (100.0%), and Firefighting & Prevention (100.0%), while the most female-oriented occupations are Food Preparation & Serving (78.3%), Personal Care & Service (74.7%), and Cleaning & Maintenance (52.3%).
| Occupation | Male | Female |
| Healthcare Support | 28 (100.0%) | 0 (0.0%) |
| Security & Protection | 40 (100.0%) | 0 (0.0%) |
| Firefighting & Prevention | 40 (100.0%) | 0 (0.0%) |
| Law Enforcement | 0 (0.0%) | 0 (0.0%) |
| Food Preparation & Serving | 25 (21.7%) | 90 (78.3%) |
| Cleaning & Maintenance | 21 (47.7%) | 23 (52.3%) |
| Personal Care & Service | 21 (25.3%) | 62 (74.7%) |
| Total (Category) | 135 (43.5%) | 175 (56.5%) |
| Total (Overall) | 1,428 (49.9%) | 1,434 (50.1%) |
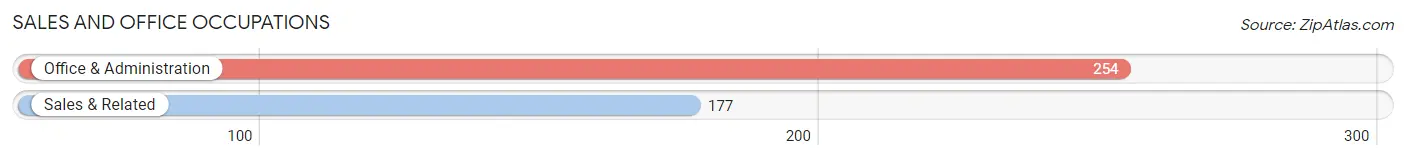
Sales and Office Occupations
The most common Sales and Office occupations in Ashton Sandy Spring are Office & Administration (254 | 8.9%), and Sales & Related (177 | 6.2%).
Sales and Office Occupations by Sex
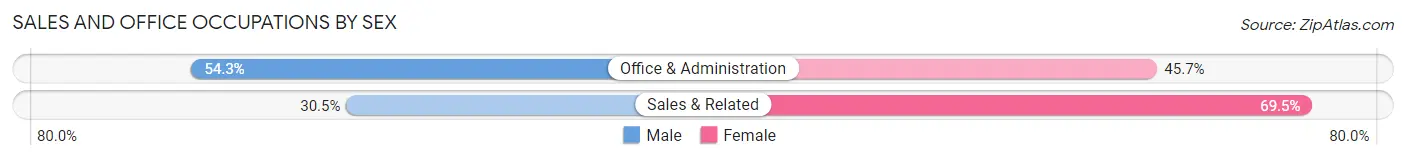
| Occupation | Male | Female |
| Sales & Related | 54 (30.5%) | 123 (69.5%) |
| Office & Administration | 138 (54.3%) | 116 (45.7%) |
| Total (Category) | 192 (44.6%) | 239 (55.4%) |
| Total (Overall) | 1,428 (49.9%) | 1,434 (50.1%) |
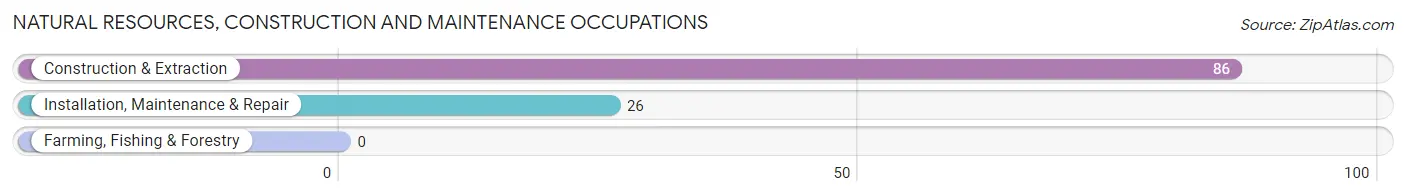
Natural Resources, Construction and Maintenance Occupations
The most common Natural Resources, Construction and Maintenance occupations in Ashton Sandy Spring are Construction & Extraction (86 | 3.0%), and Installation, Maintenance & Repair (26 | 0.9%).
Natural Resources, Construction and Maintenance Occupations by Sex
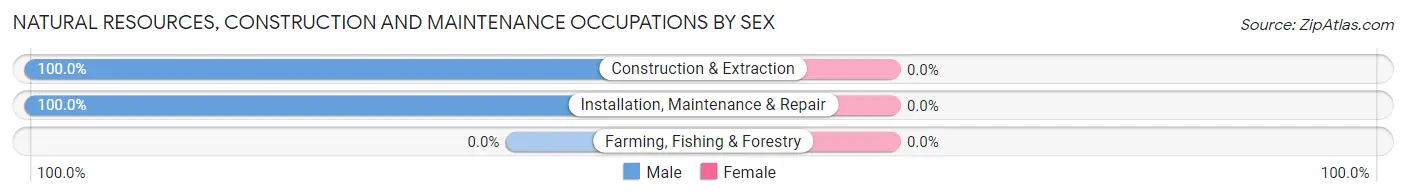
| Occupation | Male | Female |
| Farming, Fishing & Forestry | 0 (0.0%) | 0 (0.0%) |
| Construction & Extraction | 86 (100.0%) | 0 (0.0%) |
| Installation, Maintenance & Repair | 26 (100.0%) | 0 (0.0%) |
| Total (Category) | 112 (100.0%) | 0 (0.0%) |
| Total (Overall) | 1,428 (49.9%) | 1,434 (50.1%) |
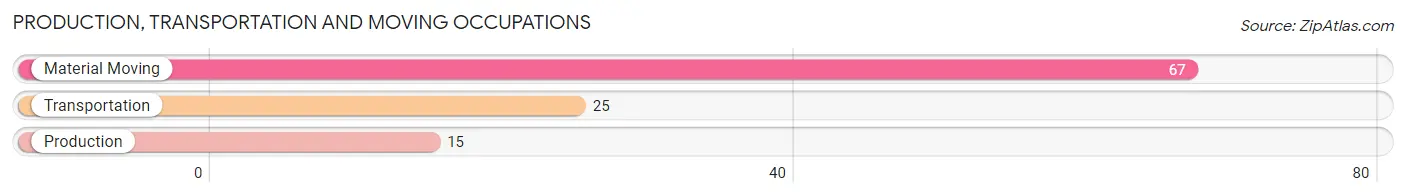
Production, Transportation and Moving Occupations
The most common Production, Transportation and Moving occupations in Ashton Sandy Spring are Material Moving (67 | 2.3%), Transportation (25 | 0.9%), and Production (15 | 0.5%).
Production, Transportation and Moving Occupations by Sex
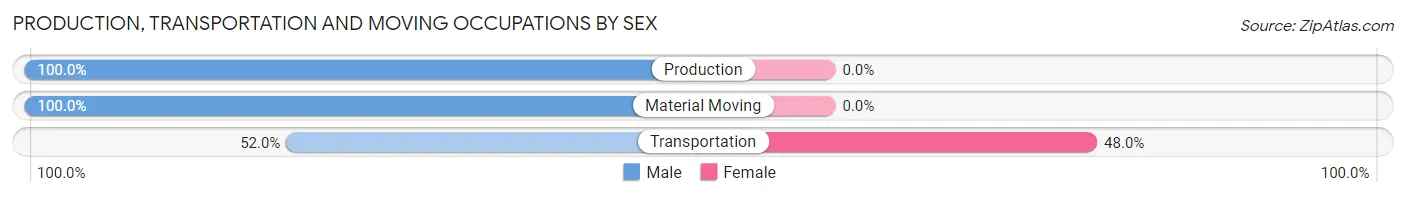
| Occupation | Male | Female |
| Production | 15 (100.0%) | 0 (0.0%) |
| Transportation | 13 (52.0%) | 12 (48.0%) |
| Material Moving | 67 (100.0%) | 0 (0.0%) |
| Total (Category) | 95 (88.8%) | 12 (11.2%) |
| Total (Overall) | 1,428 (49.9%) | 1,434 (50.1%) |
Employment Industries by Sex in Ashton Sandy Spring
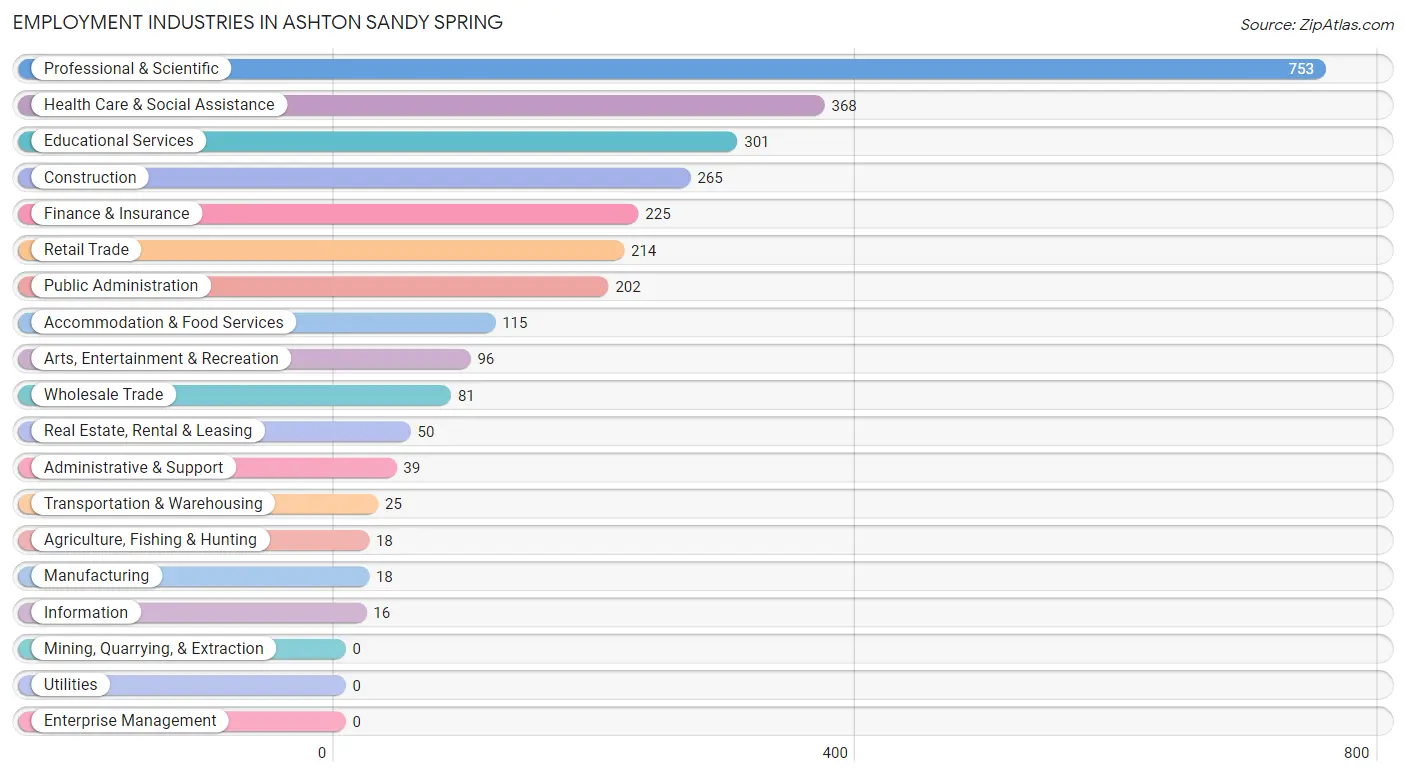
Employment Industries in Ashton Sandy Spring
The major employment industries in Ashton Sandy Spring include Professional & Scientific (753 | 26.3%), Health Care & Social Assistance (368 | 12.9%), Educational Services (301 | 10.5%), Construction (265 | 9.3%), and Finance & Insurance (225 | 7.9%).
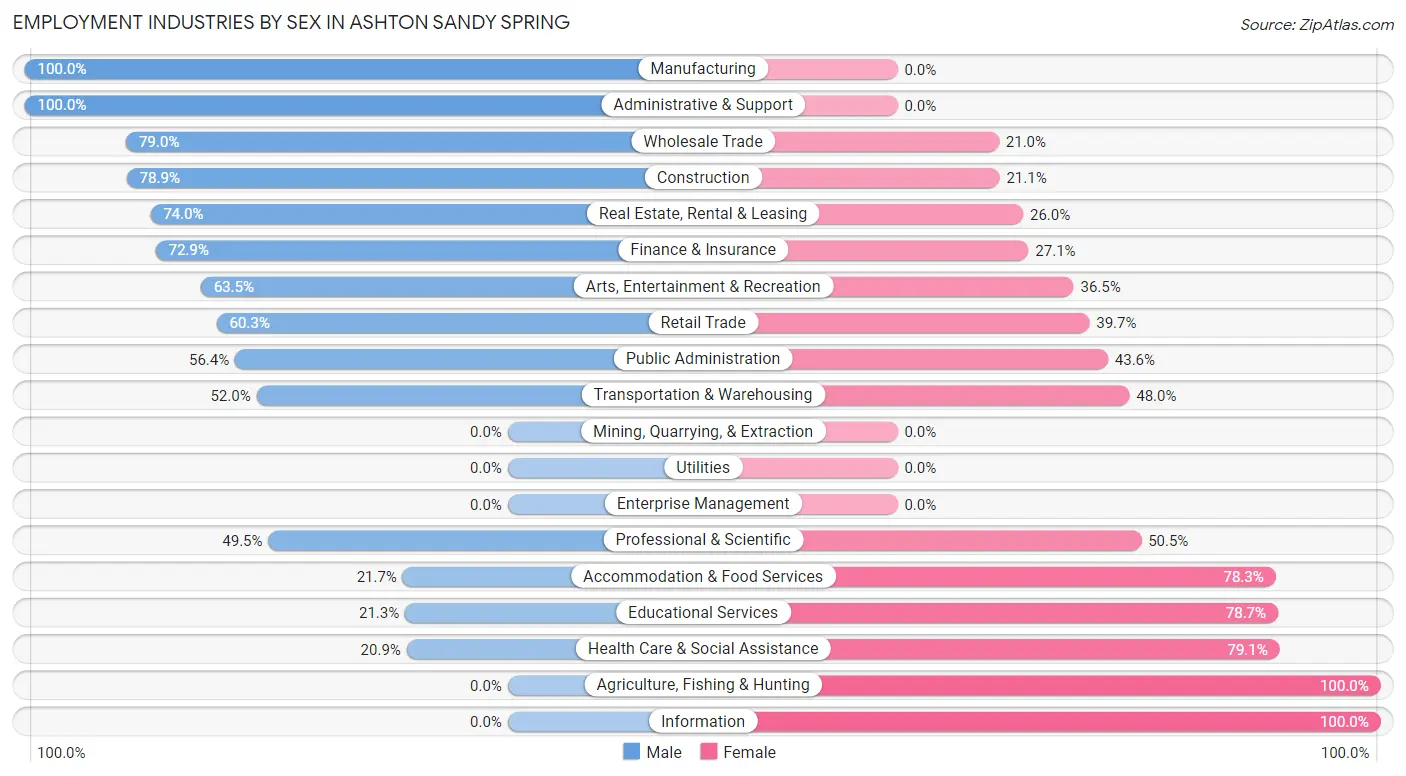
Employment Industries by Sex in Ashton Sandy Spring
The Ashton Sandy Spring industries that see more men than women are Manufacturing (100.0%), Administrative & Support (100.0%), and Wholesale Trade (79.0%), whereas the industries that tend to have a higher number of women are Agriculture, Fishing & Hunting (100.0%), Information (100.0%), and Health Care & Social Assistance (79.1%).
| Industry | Male | Female |
| Agriculture, Fishing & Hunting | 0 (0.0%) | 18 (100.0%) |
| Mining, Quarrying, & Extraction | 0 (0.0%) | 0 (0.0%) |
| Construction | 209 (78.9%) | 56 (21.1%) |
| Manufacturing | 18 (100.0%) | 0 (0.0%) |
| Wholesale Trade | 64 (79.0%) | 17 (21.0%) |
| Retail Trade | 129 (60.3%) | 85 (39.7%) |
| Transportation & Warehousing | 13 (52.0%) | 12 (48.0%) |
| Utilities | 0 (0.0%) | 0 (0.0%) |
| Information | 0 (0.0%) | 16 (100.0%) |
| Finance & Insurance | 164 (72.9%) | 61 (27.1%) |
| Real Estate, Rental & Leasing | 37 (74.0%) | 13 (26.0%) |
| Professional & Scientific | 373 (49.5%) | 380 (50.5%) |
| Enterprise Management | 0 (0.0%) | 0 (0.0%) |
| Administrative & Support | 39 (100.0%) | 0 (0.0%) |
| Educational Services | 64 (21.3%) | 237 (78.7%) |
| Health Care & Social Assistance | 77 (20.9%) | 291 (79.1%) |
| Arts, Entertainment & Recreation | 61 (63.5%) | 35 (36.5%) |
| Accommodation & Food Services | 25 (21.7%) | 90 (78.3%) |
| Public Administration | 114 (56.4%) | 88 (43.6%) |
| Total | 1,428 (49.9%) | 1,434 (50.1%) |
Education in Ashton Sandy Spring
School Enrollment in Ashton Sandy Spring
The most common levels of schooling among the 1,477 students in Ashton Sandy Spring are high school (488 | 33.0%), college / undergraduate (280 | 19.0%), and middle school (262 | 17.7%).
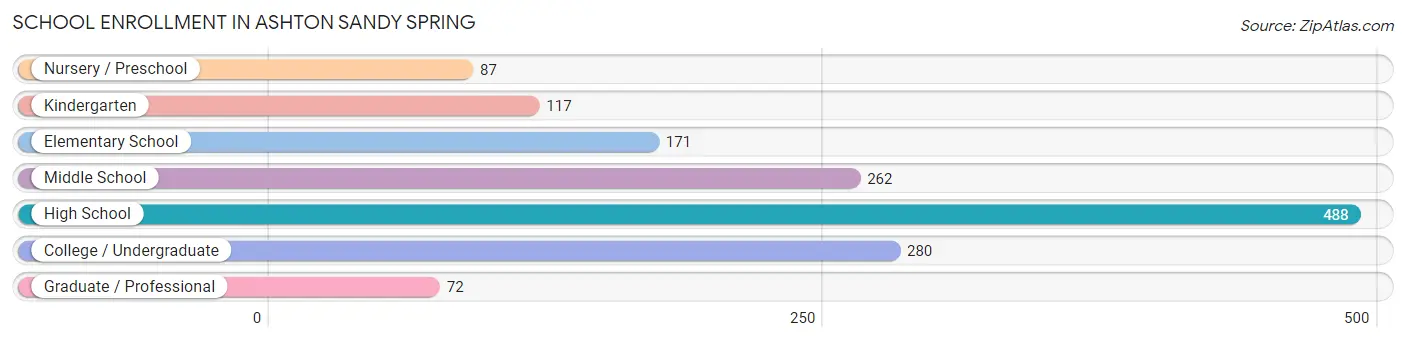
| School Level | # Students | % Students |
| Nursery / Preschool | 87 | 5.9% |
| Kindergarten | 117 | 7.9% |
| Elementary School | 171 | 11.6% |
| Middle School | 262 | 17.7% |
| High School | 488 | 33.0% |
| College / Undergraduate | 280 | 19.0% |
| Graduate / Professional | 72 | 4.9% |
| Total | 1,477 | 100.0% |
School Enrollment by Age by Funding Source in Ashton Sandy Spring
Out of a total of 1,477 students who are enrolled in schools in Ashton Sandy Spring, 375 (25.4%) attend a private institution, while the remaining 1,102 (74.6%) are enrolled in public schools. The age group of 3 to 4 year olds has the highest likelihood of being enrolled in private schools, with 59 (72.8% in the age bracket) enrolled. Conversely, the age group of 18 to 19 year olds has the lowest likelihood of being enrolled in a private school, with 129 (100.0% in the age bracket) attending a public institution.
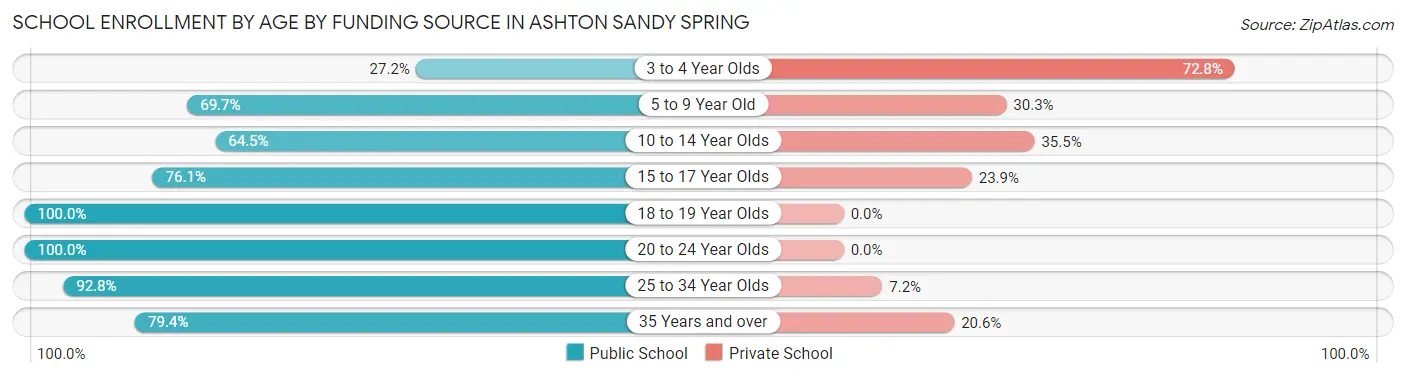
| Age Bracket | Public School | Private School |
| 3 to 4 Year Olds | 22 (27.2%) | 59 (72.8%) |
| 5 to 9 Year Old | 200 (69.7%) | 87 (30.3%) |
| 10 to 14 Year Olds | 214 (64.5%) | 118 (35.5%) |
| 15 to 17 Year Olds | 284 (76.1%) | 89 (23.9%) |
| 18 to 19 Year Olds | 129 (100.0%) | 0 (0.0%) |
| 20 to 24 Year Olds | 33 (100.0%) | 0 (0.0%) |
| 25 to 34 Year Olds | 193 (92.8%) | 15 (7.2%) |
| 35 Years and over | 27 (79.4%) | 7 (20.6%) |
| Total | 1,102 (74.6%) | 375 (25.4%) |
Educational Attainment by Field of Study in Ashton Sandy Spring
Social sciences (368 | 14.9%), education (364 | 14.7%), business (349 | 14.1%), computers & mathematics (265 | 10.7%), and bio, nature & agricultural (166 | 6.7%) are the most common fields of study among 2,473 individuals in Ashton Sandy Spring who have obtained a bachelor's degree or higher.
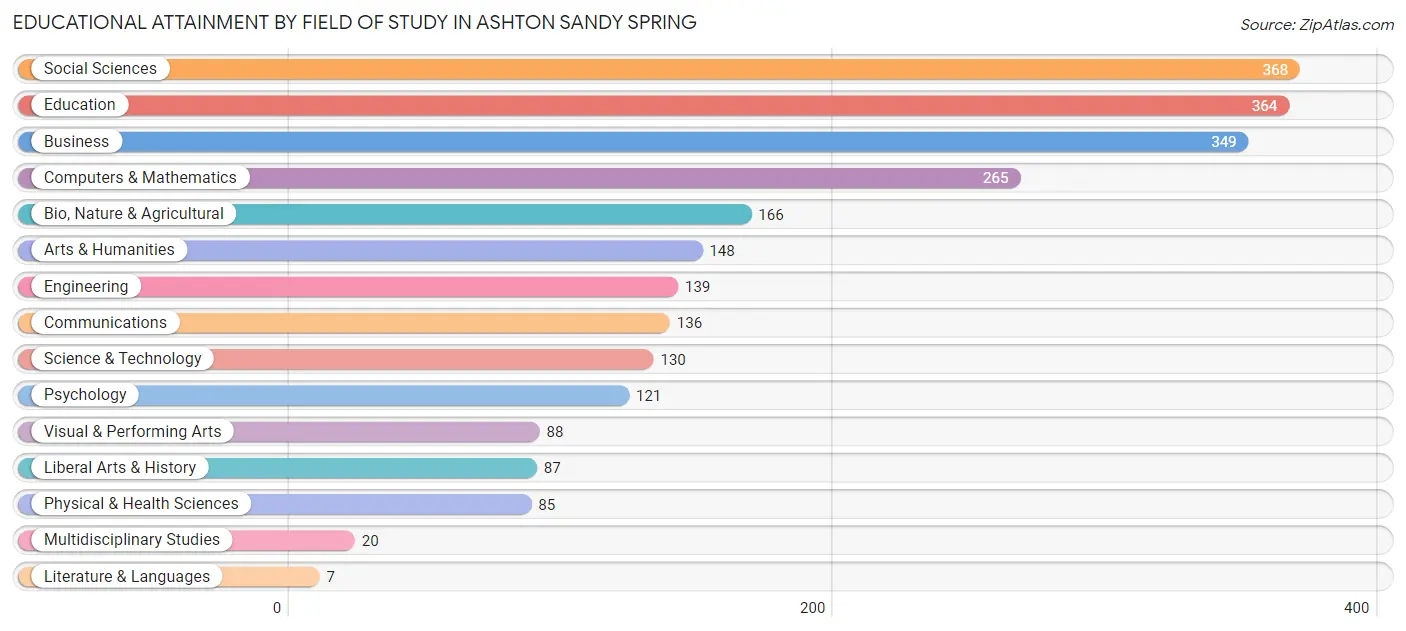
| Field of Study | # Graduates | % Graduates |
| Computers & Mathematics | 265 | 10.7% |
| Bio, Nature & Agricultural | 166 | 6.7% |
| Physical & Health Sciences | 85 | 3.4% |
| Psychology | 121 | 4.9% |
| Social Sciences | 368 | 14.9% |
| Engineering | 139 | 5.6% |
| Multidisciplinary Studies | 20 | 0.8% |
| Science & Technology | 130 | 5.3% |
| Business | 349 | 14.1% |
| Education | 364 | 14.7% |
| Literature & Languages | 7 | 0.3% |
| Liberal Arts & History | 87 | 3.5% |
| Visual & Performing Arts | 88 | 3.6% |
| Communications | 136 | 5.5% |
| Arts & Humanities | 148 | 6.0% |
| Total | 2,473 | 100.0% |
Transportation & Commute in Ashton Sandy Spring
Vehicle Availability by Sex in Ashton Sandy Spring
The most prevalent vehicle ownership categories in Ashton Sandy Spring are males with 2 vehicles (505, accounting for 35.9%) and females with 2 vehicles (481, making up 35.2%).
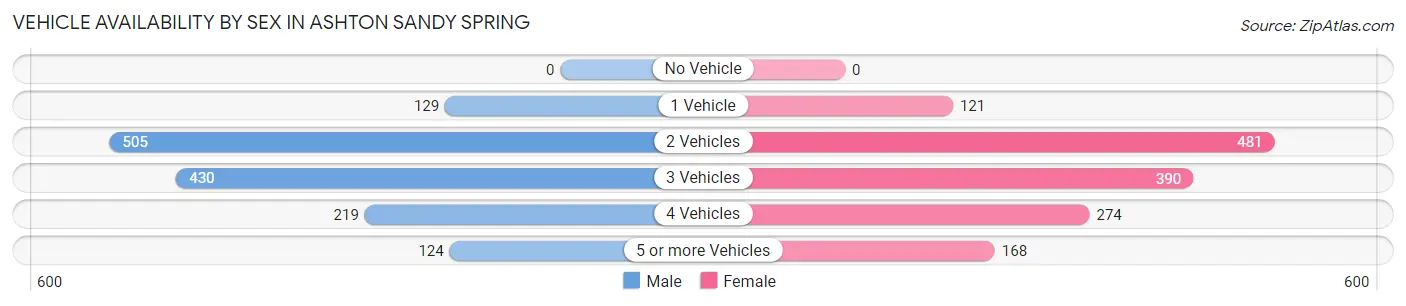
| Vehicles Available | Male | Female |
| No Vehicle | 0 (0.0%) | 0 (0.0%) |
| 1 Vehicle | 129 (9.2%) | 121 (8.4%) |
| 2 Vehicles | 505 (35.9%) | 481 (33.5%) |
| 3 Vehicles | 430 (30.6%) | 390 (27.2%) |
| 4 Vehicles | 219 (15.6%) | 274 (19.1%) |
| 5 or more Vehicles | 124 (8.8%) | 168 (11.7%) |
| Total | 1,407 (100.0%) | 1,434 (100.0%) |
Commute Time in Ashton Sandy Spring
The most frequently occuring commute durations in Ashton Sandy Spring are 45 to 59 minutes (373 commuters, 18.6%), 30 to 34 minutes (288 commuters, 14.4%), and 40 to 44 minutes (213 commuters, 10.6%).
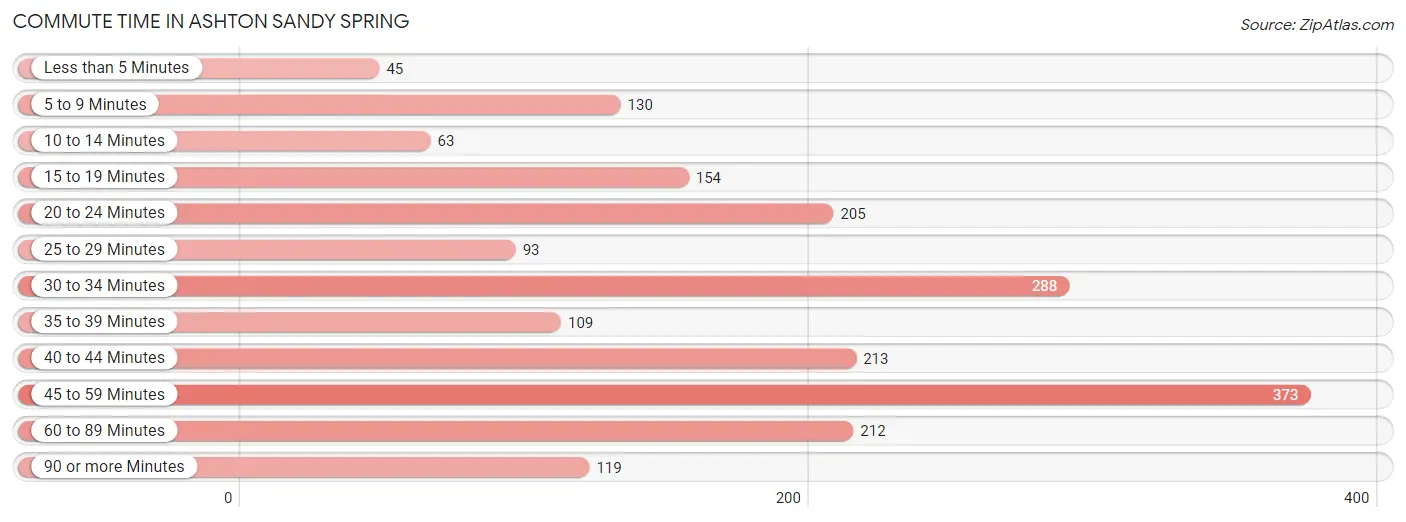
| Commute Time | # Commuters | % Commuters |
| Less than 5 Minutes | 45 | 2.2% |
| 5 to 9 Minutes | 130 | 6.5% |
| 10 to 14 Minutes | 63 | 3.1% |
| 15 to 19 Minutes | 154 | 7.7% |
| 20 to 24 Minutes | 205 | 10.2% |
| 25 to 29 Minutes | 93 | 4.6% |
| 30 to 34 Minutes | 288 | 14.4% |
| 35 to 39 Minutes | 109 | 5.4% |
| 40 to 44 Minutes | 213 | 10.6% |
| 45 to 59 Minutes | 373 | 18.6% |
| 60 to 89 Minutes | 212 | 10.6% |
| 90 or more Minutes | 119 | 5.9% |
Commute Time by Sex in Ashton Sandy Spring
The most common commute times in Ashton Sandy Spring are 45 to 59 minutes (297 commuters, 30.0%) for males and 30 to 34 minutes (150 commuters, 14.8%) for females.
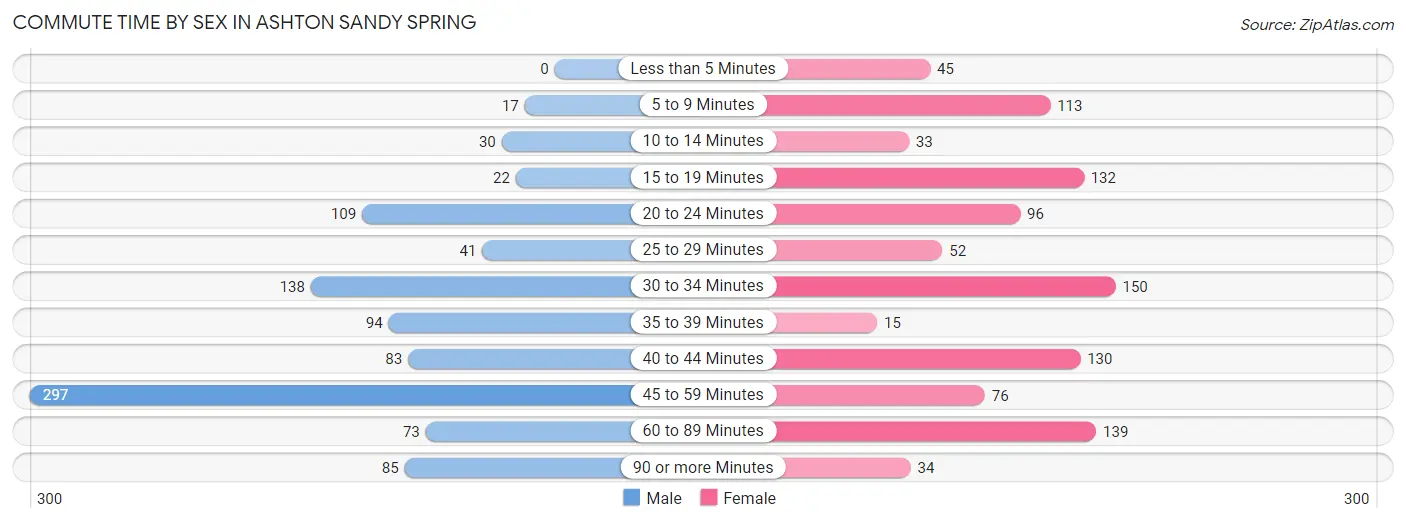
| Commute Time | Male | Female |
| Less than 5 Minutes | 0 (0.0%) | 45 (4.4%) |
| 5 to 9 Minutes | 17 (1.7%) | 113 (11.1%) |
| 10 to 14 Minutes | 30 (3.0%) | 33 (3.3%) |
| 15 to 19 Minutes | 22 (2.2%) | 132 (13.0%) |
| 20 to 24 Minutes | 109 (11.0%) | 96 (9.5%) |
| 25 to 29 Minutes | 41 (4.2%) | 52 (5.1%) |
| 30 to 34 Minutes | 138 (14.0%) | 150 (14.8%) |
| 35 to 39 Minutes | 94 (9.5%) | 15 (1.5%) |
| 40 to 44 Minutes | 83 (8.4%) | 130 (12.8%) |
| 45 to 59 Minutes | 297 (30.0%) | 76 (7.5%) |
| 60 to 89 Minutes | 73 (7.4%) | 139 (13.7%) |
| 90 or more Minutes | 85 (8.6%) | 34 (3.4%) |
Time of Departure to Work by Sex in Ashton Sandy Spring
The most frequent times of departure to work in Ashton Sandy Spring are 8:00 AM to 8:29 AM (209, 21.1%) for males and 7:00 AM to 7:29 AM (172, 17.0%) for females.
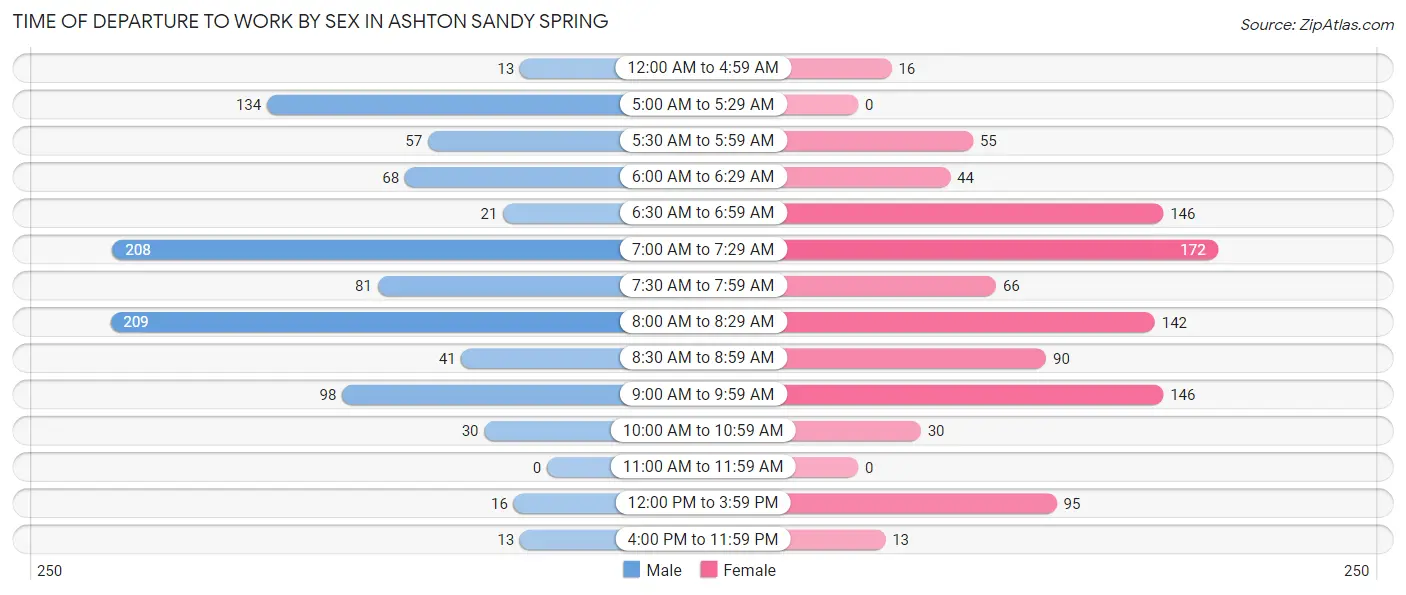
| Time of Departure | Male | Female |
| 12:00 AM to 4:59 AM | 13 (1.3%) | 16 (1.6%) |
| 5:00 AM to 5:29 AM | 134 (13.6%) | 0 (0.0%) |
| 5:30 AM to 5:59 AM | 57 (5.8%) | 55 (5.4%) |
| 6:00 AM to 6:29 AM | 68 (6.9%) | 44 (4.3%) |
| 6:30 AM to 6:59 AM | 21 (2.1%) | 146 (14.4%) |
| 7:00 AM to 7:29 AM | 208 (21.0%) | 172 (17.0%) |
| 7:30 AM to 7:59 AM | 81 (8.2%) | 66 (6.5%) |
| 8:00 AM to 8:29 AM | 209 (21.1%) | 142 (14.0%) |
| 8:30 AM to 8:59 AM | 41 (4.2%) | 90 (8.9%) |
| 9:00 AM to 9:59 AM | 98 (9.9%) | 146 (14.4%) |
| 10:00 AM to 10:59 AM | 30 (3.0%) | 30 (3.0%) |
| 11:00 AM to 11:59 AM | 0 (0.0%) | 0 (0.0%) |
| 12:00 PM to 3:59 PM | 16 (1.6%) | 95 (9.4%) |
| 4:00 PM to 11:59 PM | 13 (1.3%) | 13 (1.3%) |
| Total | 989 (100.0%) | 1,015 (100.0%) |
Housing Occupancy in Ashton Sandy Spring
Occupancy by Ownership in Ashton Sandy Spring
Of the total 1,915 dwellings in Ashton Sandy Spring, owner-occupied units account for 1,761 (92.0%), while renter-occupied units make up 154 (8.0%).
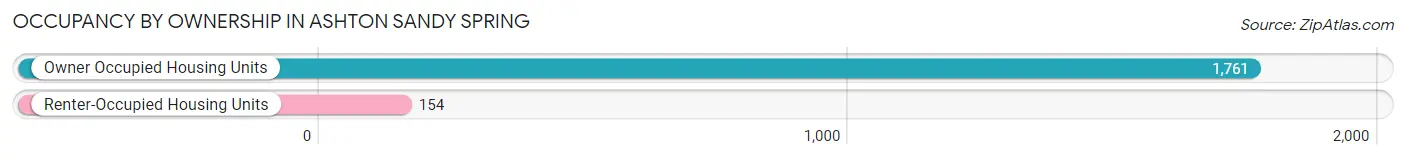
| Occupancy | # Housing Units | % Housing Units |
| Owner Occupied Housing Units | 1,761 | 92.0% |
| Renter-Occupied Housing Units | 154 | 8.0% |
| Total Occupied Housing Units | 1,915 | 100.0% |
Occupancy by Household Size in Ashton Sandy Spring
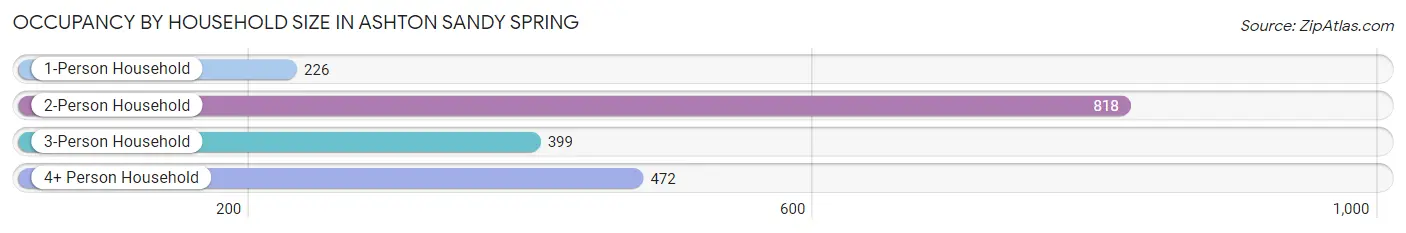
| Household Size | # Housing Units | % Housing Units |
| 1-Person Household | 226 | 11.8% |
| 2-Person Household | 818 | 42.7% |
| 3-Person Household | 399 | 20.8% |
| 4+ Person Household | 472 | 24.6% |
| Total Housing Units | 1,915 | 100.0% |
Occupancy by Ownership by Household Size in Ashton Sandy Spring
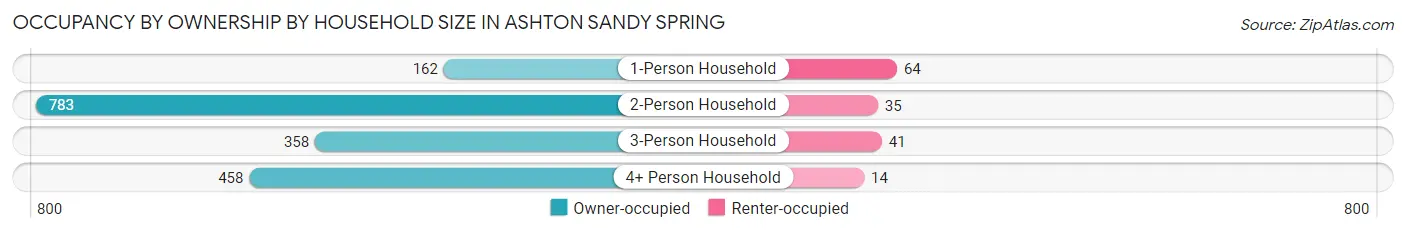
| Household Size | Owner-occupied | Renter-occupied |
| 1-Person Household | 162 (71.7%) | 64 (28.3%) |
| 2-Person Household | 783 (95.7%) | 35 (4.3%) |
| 3-Person Household | 358 (89.7%) | 41 (10.3%) |
| 4+ Person Household | 458 (97.0%) | 14 (3.0%) |
| Total Housing Units | 1,761 (92.0%) | 154 (8.0%) |
Occupancy by Educational Attainment in Ashton Sandy Spring
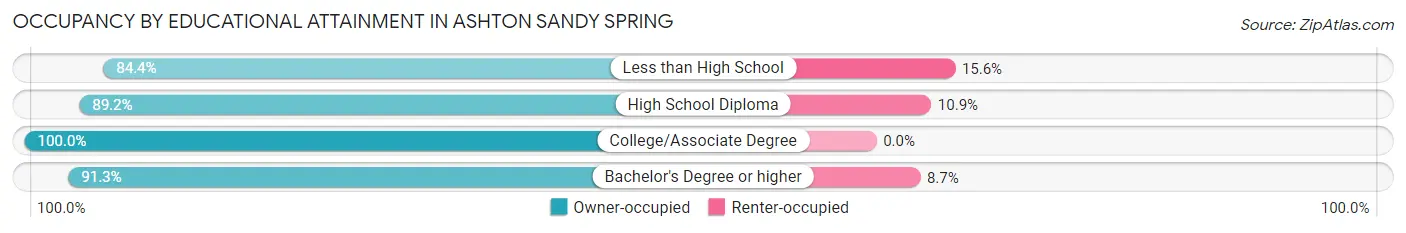
| Household Size | Owner-occupied | Renter-occupied |
| Less than High School | 189 (84.4%) | 35 (15.6%) |
| High School Diploma | 115 (89.1%) | 14 (10.8%) |
| College/Associate Degree | 353 (100.0%) | 0 (0.0%) |
| Bachelor's Degree or higher | 1,104 (91.3%) | 105 (8.7%) |
Occupancy by Age of Householder in Ashton Sandy Spring
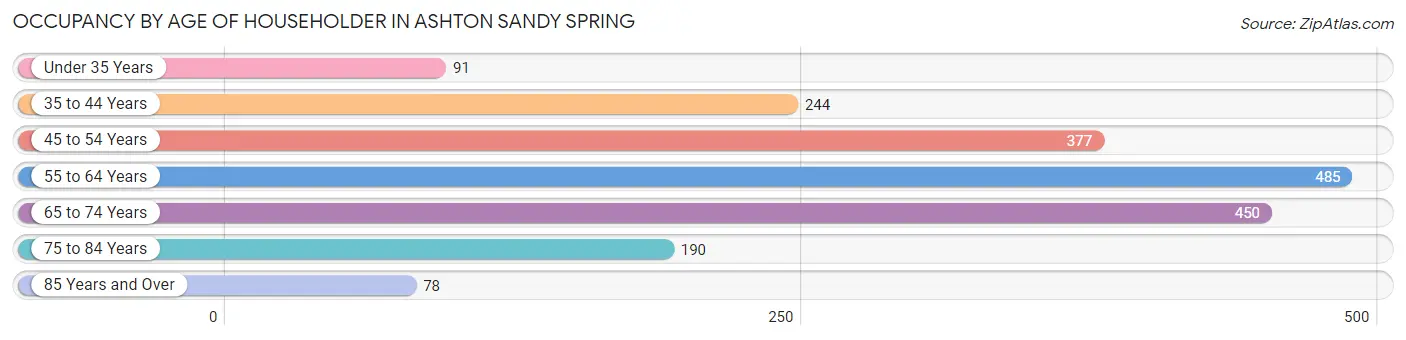
| Age Bracket | # Households | % Households |
| Under 35 Years | 91 | 4.8% |
| 35 to 44 Years | 244 | 12.7% |
| 45 to 54 Years | 377 | 19.7% |
| 55 to 64 Years | 485 | 25.3% |
| 65 to 74 Years | 450 | 23.5% |
| 75 to 84 Years | 190 | 9.9% |
| 85 Years and Over | 78 | 4.1% |
| Total | 1,915 | 100.0% |
Housing Finances in Ashton Sandy Spring
Median Income by Occupancy in Ashton Sandy Spring
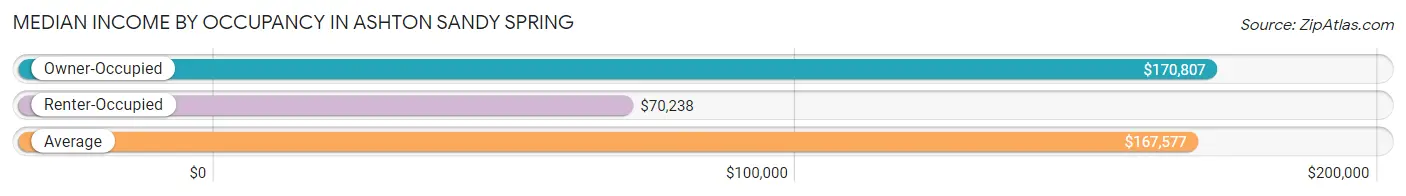
| Occupancy Type | # Households | Median Income |
| Owner-Occupied | 1,761 (92.0%) | $170,807 |
| Renter-Occupied | 154 (8.0%) | $70,238 |
| Average | 1,915 (100.0%) | $167,577 |
Occupancy by Householder Income Bracket in Ashton Sandy Spring
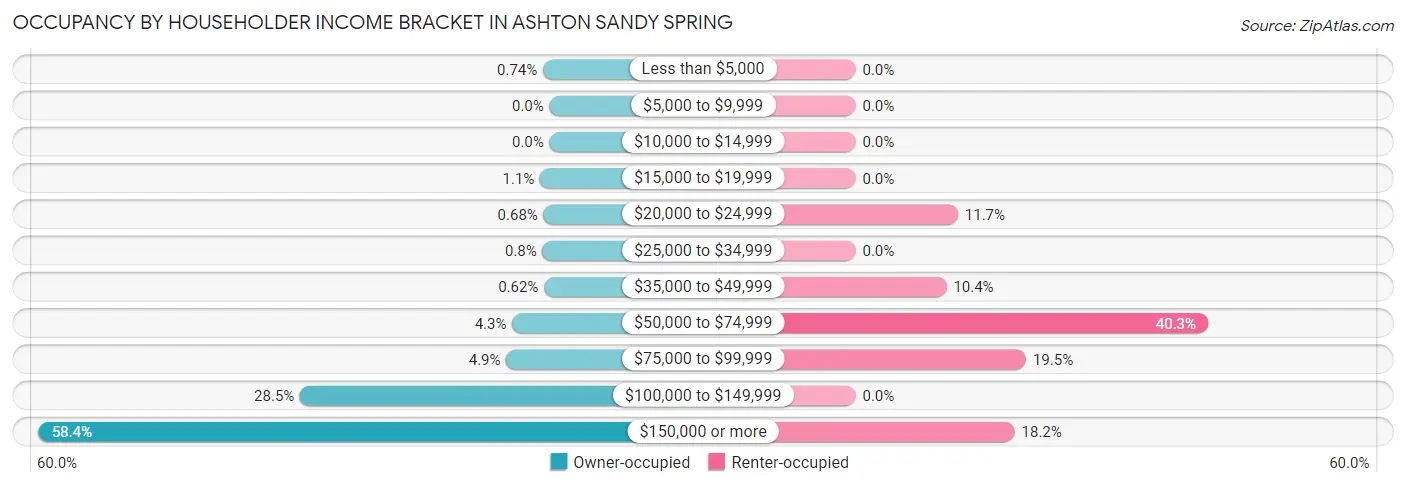
| Income Bracket | Owner-occupied | Renter-occupied |
| Less than $5,000 | 13 (0.7%) | 0 (0.0%) |
| $5,000 to $9,999 | 0 (0.0%) | 0 (0.0%) |
| $10,000 to $14,999 | 0 (0.0%) | 0 (0.0%) |
| $15,000 to $19,999 | 19 (1.1%) | 0 (0.0%) |
| $20,000 to $24,999 | 12 (0.7%) | 18 (11.7%) |
| $25,000 to $34,999 | 14 (0.8%) | 0 (0.0%) |
| $35,000 to $49,999 | 11 (0.6%) | 16 (10.4%) |
| $50,000 to $74,999 | 75 (4.3%) | 62 (40.3%) |
| $75,000 to $99,999 | 87 (4.9%) | 30 (19.5%) |
| $100,000 to $149,999 | 502 (28.5%) | 0 (0.0%) |
| $150,000 or more | 1,028 (58.4%) | 28 (18.2%) |
| Total | 1,761 (100.0%) | 154 (100.0%) |
Monthly Housing Cost Tiers in Ashton Sandy Spring
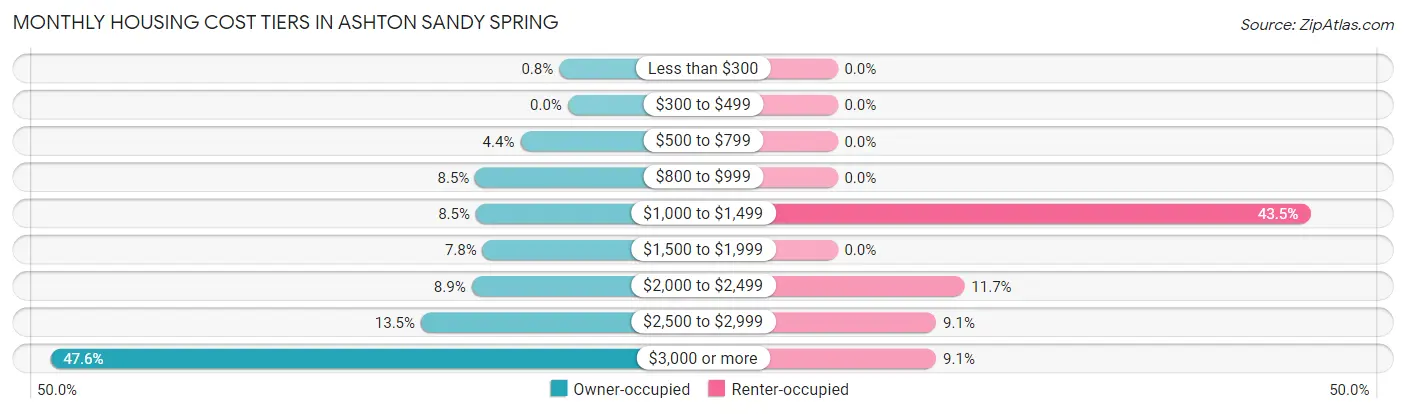
| Monthly Cost | Owner-occupied | Renter-occupied |
| Less than $300 | 14 (0.8%) | 0 (0.0%) |
| $300 to $499 | 0 (0.0%) | 0 (0.0%) |
| $500 to $799 | 77 (4.4%) | 0 (0.0%) |
| $800 to $999 | 150 (8.5%) | 0 (0.0%) |
| $1,000 to $1,499 | 149 (8.5%) | 67 (43.5%) |
| $1,500 to $1,999 | 138 (7.8%) | 0 (0.0%) |
| $2,000 to $2,499 | 156 (8.9%) | 18 (11.7%) |
| $2,500 to $2,999 | 238 (13.5%) | 14 (9.1%) |
| $3,000 or more | 839 (47.6%) | 14 (9.1%) |
| Total | 1,761 (100.0%) | 154 (100.0%) |
Physical Housing Characteristics in Ashton Sandy Spring
Housing Structures in Ashton Sandy Spring
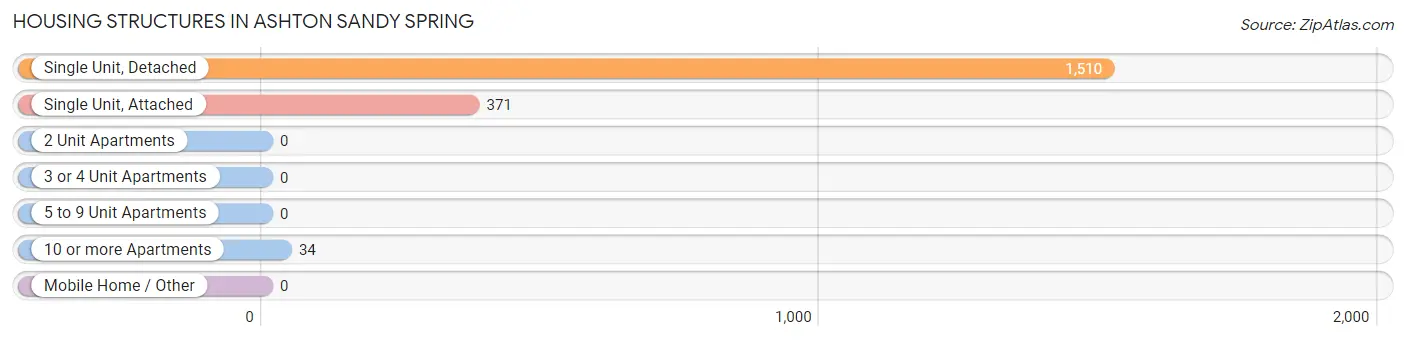
| Structure Type | # Housing Units | % Housing Units |
| Single Unit, Detached | 1,510 | 78.8% |
| Single Unit, Attached | 371 | 19.4% |
| 2 Unit Apartments | 0 | 0.0% |
| 3 or 4 Unit Apartments | 0 | 0.0% |
| 5 to 9 Unit Apartments | 0 | 0.0% |
| 10 or more Apartments | 34 | 1.8% |
| Mobile Home / Other | 0 | 0.0% |
| Total | 1,915 | 100.0% |
Housing Structures by Occupancy in Ashton Sandy Spring
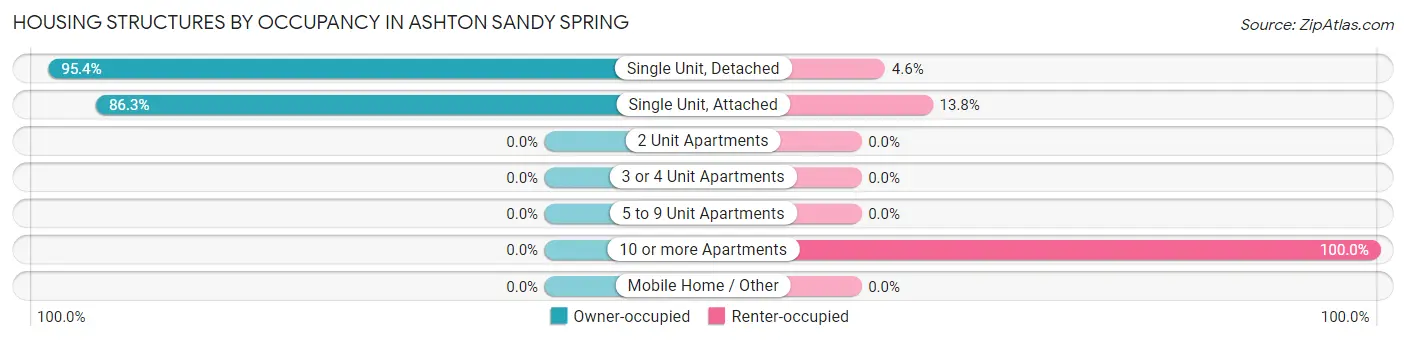
| Structure Type | Owner-occupied | Renter-occupied |
| Single Unit, Detached | 1,441 (95.4%) | 69 (4.6%) |
| Single Unit, Attached | 320 (86.3%) | 51 (13.8%) |
| 2 Unit Apartments | 0 (0.0%) | 0 (0.0%) |
| 3 or 4 Unit Apartments | 0 (0.0%) | 0 (0.0%) |
| 5 to 9 Unit Apartments | 0 (0.0%) | 0 (0.0%) |
| 10 or more Apartments | 0 (0.0%) | 34 (100.0%) |
| Mobile Home / Other | 0 (0.0%) | 0 (0.0%) |
| Total | 1,761 (92.0%) | 154 (8.0%) |
Housing Structures by Number of Rooms in Ashton Sandy Spring
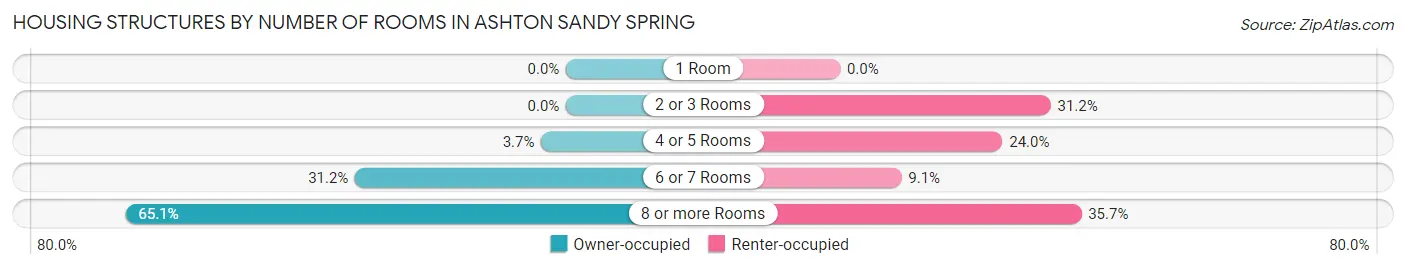
| Number of Rooms | Owner-occupied | Renter-occupied |
| 1 Room | 0 (0.0%) | 0 (0.0%) |
| 2 or 3 Rooms | 0 (0.0%) | 48 (31.2%) |
| 4 or 5 Rooms | 65 (3.7%) | 37 (24.0%) |
| 6 or 7 Rooms | 550 (31.2%) | 14 (9.1%) |
| 8 or more Rooms | 1,146 (65.1%) | 55 (35.7%) |
| Total | 1,761 (100.0%) | 154 (100.0%) |
Housing Structure by Heating Type in Ashton Sandy Spring
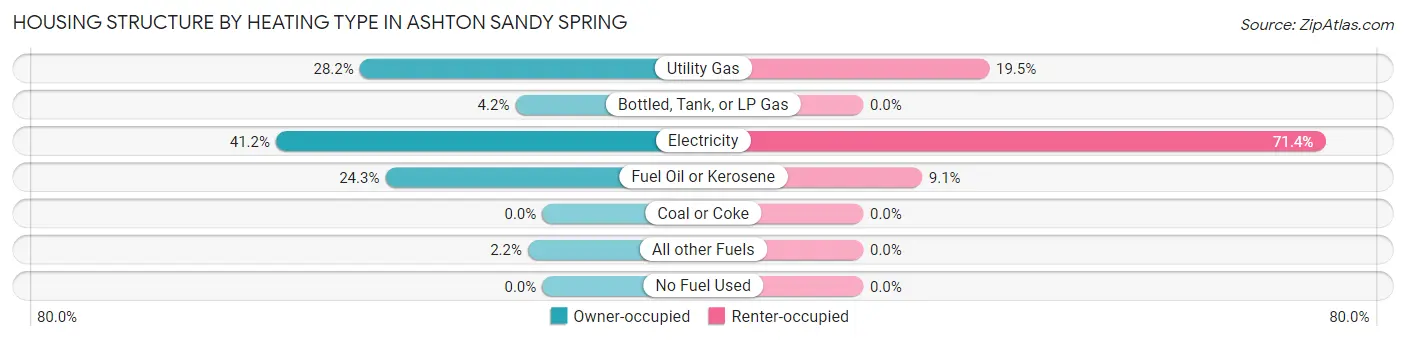
| Heating Type | Owner-occupied | Renter-occupied |
| Utility Gas | 497 (28.2%) | 30 (19.5%) |
| Bottled, Tank, or LP Gas | 73 (4.2%) | 0 (0.0%) |
| Electricity | 725 (41.2%) | 110 (71.4%) |
| Fuel Oil or Kerosene | 427 (24.2%) | 14 (9.1%) |
| Coal or Coke | 0 (0.0%) | 0 (0.0%) |
| All other Fuels | 39 (2.2%) | 0 (0.0%) |
| No Fuel Used | 0 (0.0%) | 0 (0.0%) |
| Total | 1,761 (100.0%) | 154 (100.0%) |
Household Vehicle Usage in Ashton Sandy Spring
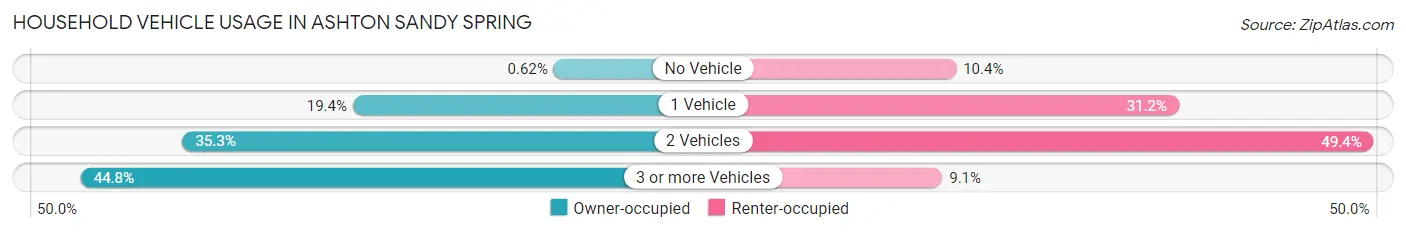
| Vehicles per Household | Owner-occupied | Renter-occupied |
| No Vehicle | 11 (0.6%) | 16 (10.4%) |
| 1 Vehicle | 341 (19.4%) | 48 (31.2%) |
| 2 Vehicles | 621 (35.3%) | 76 (49.3%) |
| 3 or more Vehicles | 788 (44.8%) | 14 (9.1%) |
| Total | 1,761 (100.0%) | 154 (100.0%) |
Real Estate & Mortgages in Ashton Sandy Spring
Real Estate and Mortgage Overview in Ashton Sandy Spring
| Characteristic | Without Mortgage | With Mortgage |
| Housing Units | 512 | 1,249 |
| Median Property Value | $819,900 | $766,000 |
| Median Household Income | $168,878 | $735 |
| Monthly Housing Costs | $1,063 | $801 |
| Real Estate Taxes | $7,083 | $0 |
Property Value by Mortgage Status in Ashton Sandy Spring
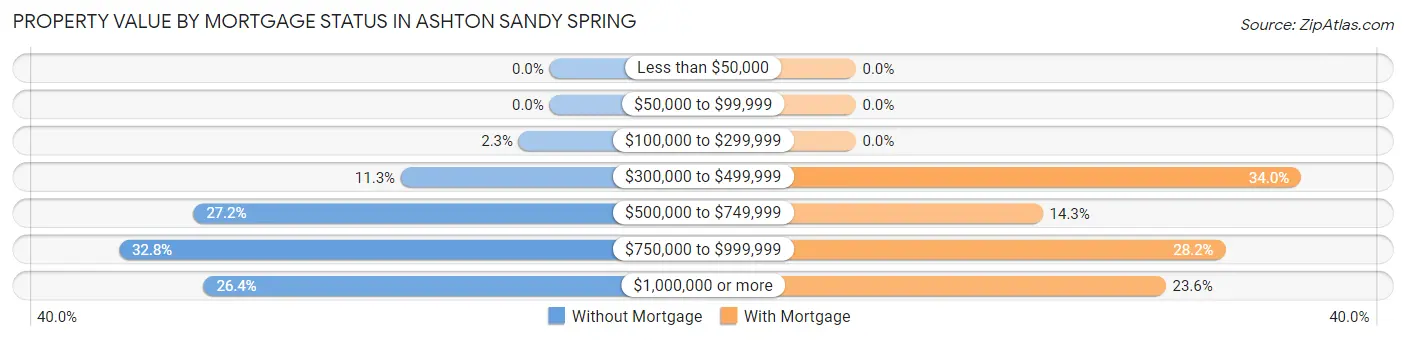
| Property Value | Without Mortgage | With Mortgage |
| Less than $50,000 | 0 (0.0%) | 0 (0.0%) |
| $50,000 to $99,999 | 0 (0.0%) | 0 (0.0%) |
| $100,000 to $299,999 | 12 (2.3%) | 0 (0.0%) |
| $300,000 to $499,999 | 58 (11.3%) | 424 (34.0%) |
| $500,000 to $749,999 | 139 (27.2%) | 178 (14.2%) |
| $750,000 to $999,999 | 168 (32.8%) | 352 (28.2%) |
| $1,000,000 or more | 135 (26.4%) | 295 (23.6%) |
| Total | 512 (100.0%) | 1,249 (100.0%) |
Household Income by Mortgage Status in Ashton Sandy Spring
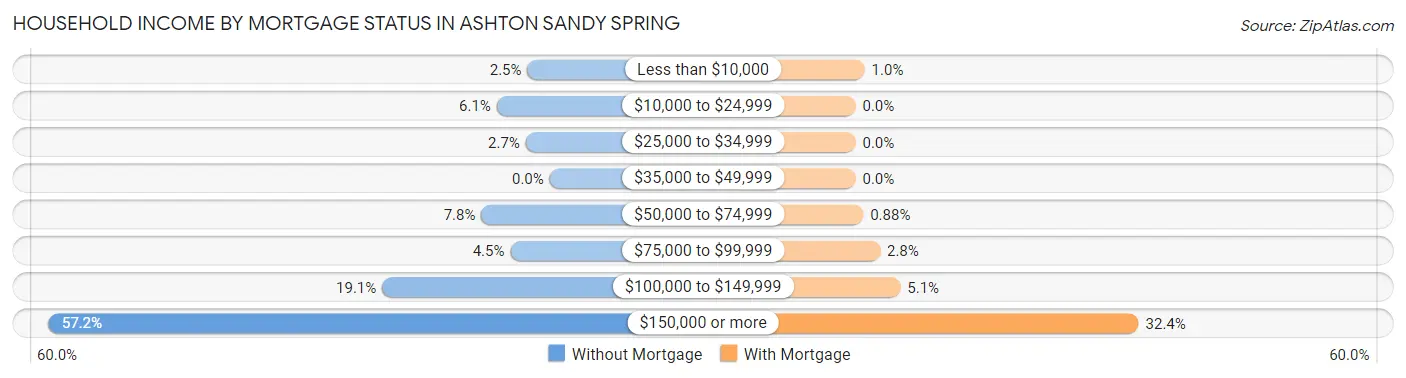
| Household Income | Without Mortgage | With Mortgage |
| Less than $10,000 | 13 (2.5%) | 13 (1.0%) |
| $10,000 to $24,999 | 31 (6.0%) | 0 (0.0%) |
| $25,000 to $34,999 | 14 (2.7%) | 0 (0.0%) |
| $35,000 to $49,999 | 0 (0.0%) | 0 (0.0%) |
| $50,000 to $74,999 | 40 (7.8%) | 11 (0.9%) |
| $75,000 to $99,999 | 23 (4.5%) | 35 (2.8%) |
| $100,000 to $149,999 | 98 (19.1%) | 64 (5.1%) |
| $150,000 or more | 293 (57.2%) | 404 (32.4%) |
| Total | 512 (100.0%) | 1,249 (100.0%) |
Property Value to Household Income Ratio in Ashton Sandy Spring
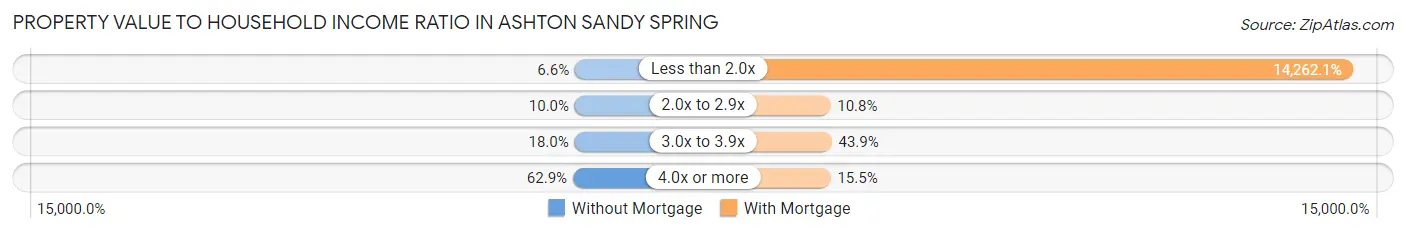
| Value-to-Income Ratio | Without Mortgage | With Mortgage |
| Less than 2.0x | 34 (6.6%) | 178,133 (14,262.0%) |
| 2.0x to 2.9x | 51 (10.0%) | 135 (10.8%) |
| 3.0x to 3.9x | 92 (18.0%) | 548 (43.9%) |
| 4.0x or more | 322 (62.9%) | 193 (15.4%) |
| Total | 512 (100.0%) | 1,249 (100.0%) |
Real Estate Taxes by Mortgage Status in Ashton Sandy Spring
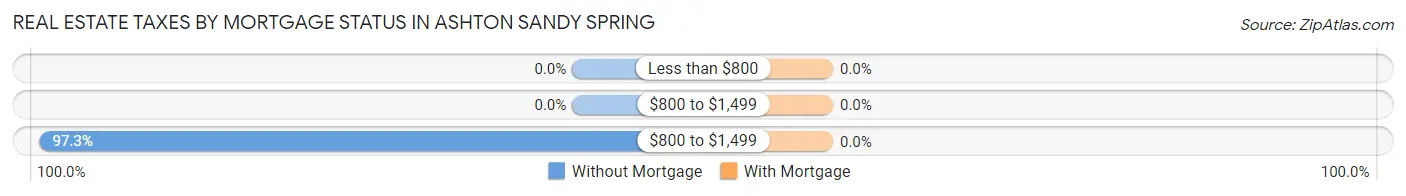
| Property Taxes | Without Mortgage | With Mortgage |
| Less than $800 | 0 (0.0%) | 0 (0.0%) |
| $800 to $1,499 | 0 (0.0%) | 0 (0.0%) |
| $800 to $1,499 | 498 (97.3%) | 0 (0.0%) |
| Total | 512 (100.0%) | 1,249 (100.0%) |
Health & Disability in Ashton Sandy Spring
Health Insurance Coverage by Age in Ashton Sandy Spring
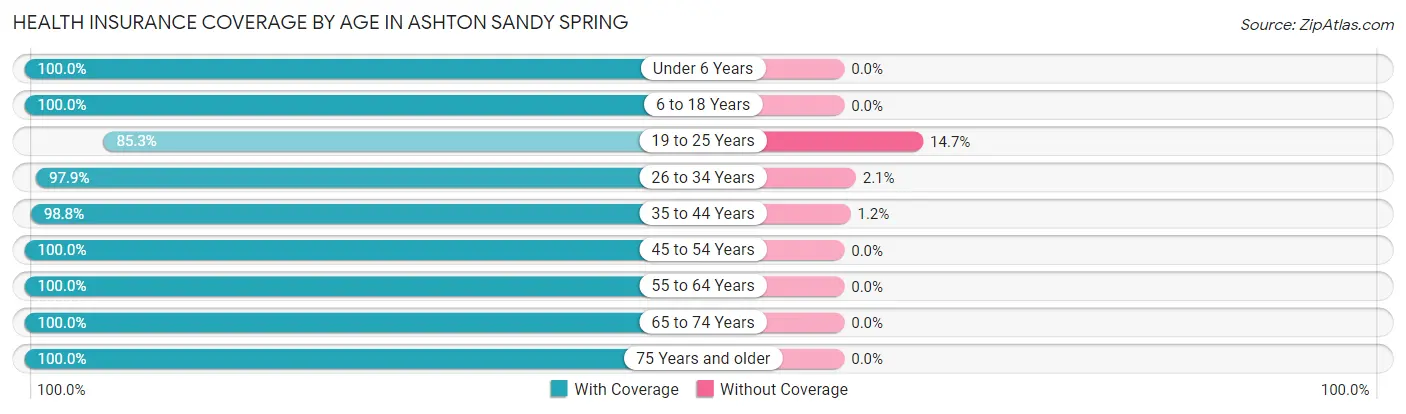
| Age Bracket | With Coverage | Without Coverage |
| Under 6 Years | 320 (100.0%) | 0 (0.0%) |
| 6 to 18 Years | 1,019 (100.0%) | 0 (0.0%) |
| 19 to 25 Years | 261 (85.3%) | 45 (14.7%) |
| 26 to 34 Years | 365 (97.9%) | 8 (2.1%) |
| 35 to 44 Years | 596 (98.8%) | 7 (1.2%) |
| 45 to 54 Years | 677 (100.0%) | 0 (0.0%) |
| 55 to 64 Years | 836 (100.0%) | 0 (0.0%) |
| 65 to 74 Years | 871 (100.0%) | 0 (0.0%) |
| 75 Years and older | 406 (100.0%) | 0 (0.0%) |
| Total | 5,351 (98.9%) | 60 (1.1%) |
Health Insurance Coverage by Citizenship Status in Ashton Sandy Spring
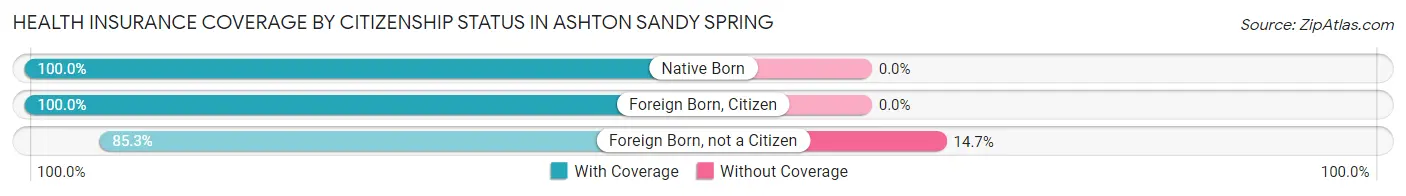
| Citizenship Status | With Coverage | Without Coverage |
| Native Born | 320 (100.0%) | 0 (0.0%) |
| Foreign Born, Citizen | 1,019 (100.0%) | 0 (0.0%) |
| Foreign Born, not a Citizen | 261 (85.3%) | 45 (14.7%) |
Health Insurance Coverage by Household Income in Ashton Sandy Spring
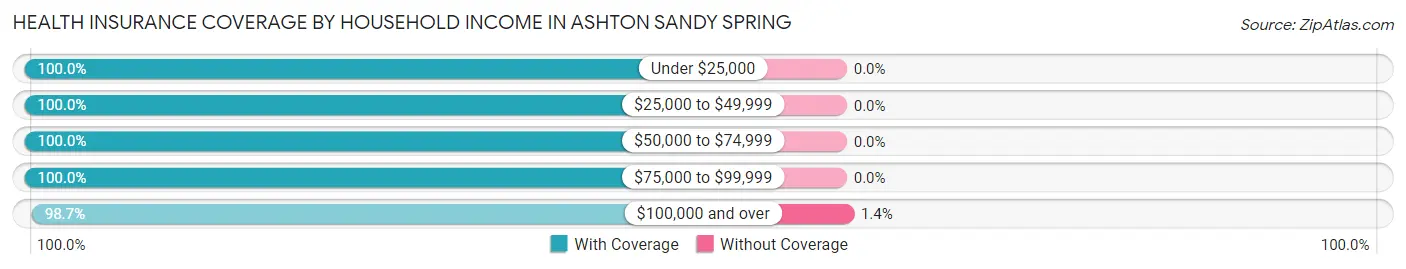
| Household Income | With Coverage | Without Coverage |
| Under $25,000 | 100 (100.0%) | 0 (0.0%) |
| $25,000 to $49,999 | 54 (100.0%) | 0 (0.0%) |
| $50,000 to $74,999 | 403 (100.0%) | 0 (0.0%) |
| $75,000 to $99,999 | 252 (100.0%) | 0 (0.0%) |
| $100,000 and over | 4,377 (98.7%) | 60 (1.3%) |
Public vs Private Health Insurance Coverage by Age in Ashton Sandy Spring
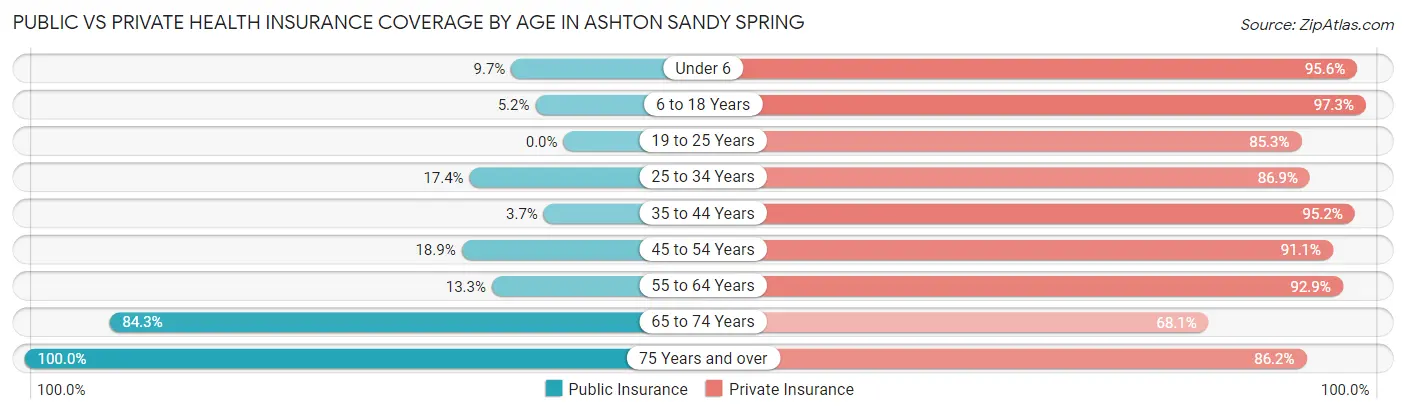
| Age Bracket | Public Insurance | Private Insurance |
| Under 6 | 31 (9.7%) | 306 (95.6%) |
| 6 to 18 Years | 53 (5.2%) | 991 (97.3%) |
| 19 to 25 Years | 0 (0.0%) | 261 (85.3%) |
| 25 to 34 Years | 65 (17.4%) | 324 (86.9%) |
| 35 to 44 Years | 22 (3.6%) | 574 (95.2%) |
| 45 to 54 Years | 128 (18.9%) | 617 (91.1%) |
| 55 to 64 Years | 111 (13.3%) | 777 (92.9%) |
| 65 to 74 Years | 734 (84.3%) | 593 (68.1%) |
| 75 Years and over | 406 (100.0%) | 350 (86.2%) |
| Total | 1,550 (28.6%) | 4,793 (88.6%) |
Disability Status by Sex by Age in Ashton Sandy Spring
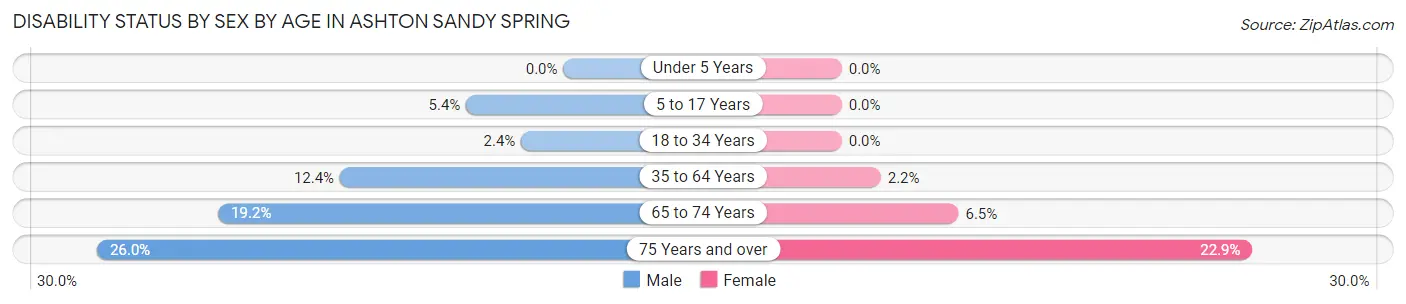
| Age Bracket | Male | Female |
| Under 5 Years | 0 (0.0%) | 0 (0.0%) |
| 5 to 17 Years | 28 (5.4%) | 0 (0.0%) |
| 18 to 34 Years | 8 (2.4%) | 0 (0.0%) |
| 35 to 64 Years | 137 (12.4%) | 22 (2.2%) |
| 65 to 74 Years | 55 (19.2%) | 38 (6.5%) |
| 75 Years and over | 60 (26.0%) | 40 (22.9%) |
Disability Class by Sex by Age in Ashton Sandy Spring
Disability Class: Hearing Difficulty
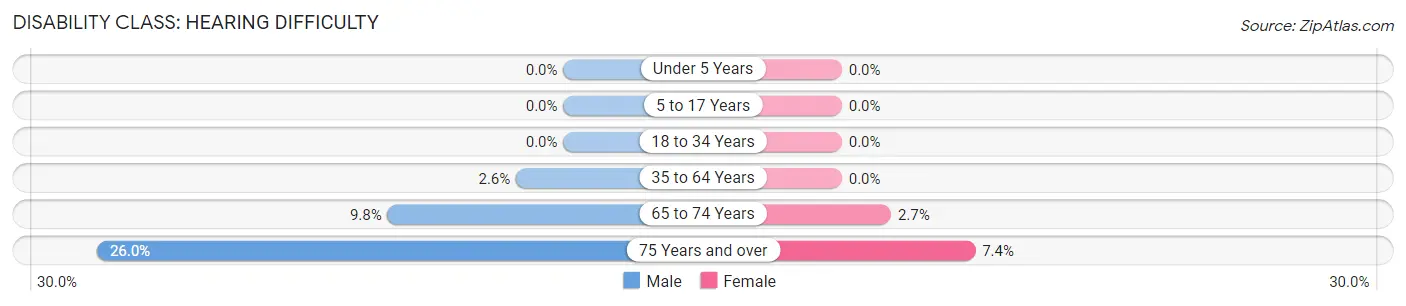
| Age Bracket | Male | Female |
| Under 5 Years | 0 (0.0%) | 0 (0.0%) |
| 5 to 17 Years | 0 (0.0%) | 0 (0.0%) |
| 18 to 34 Years | 0 (0.0%) | 0 (0.0%) |
| 35 to 64 Years | 29 (2.6%) | 0 (0.0%) |
| 65 to 74 Years | 28 (9.8%) | 16 (2.7%) |
| 75 Years and over | 60 (26.0%) | 13 (7.4%) |
Disability Class: Vision Difficulty
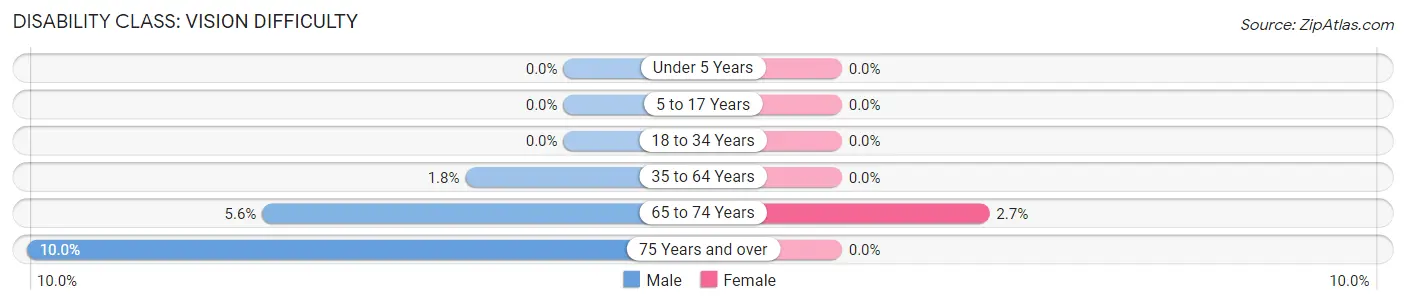
| Age Bracket | Male | Female |
| Under 5 Years | 0 (0.0%) | 0 (0.0%) |
| 5 to 17 Years | 0 (0.0%) | 0 (0.0%) |
| 18 to 34 Years | 0 (0.0%) | 0 (0.0%) |
| 35 to 64 Years | 20 (1.8%) | 0 (0.0%) |
| 65 to 74 Years | 16 (5.6%) | 16 (2.7%) |
| 75 Years and over | 23 (10.0%) | 0 (0.0%) |
Disability Class: Cognitive Difficulty
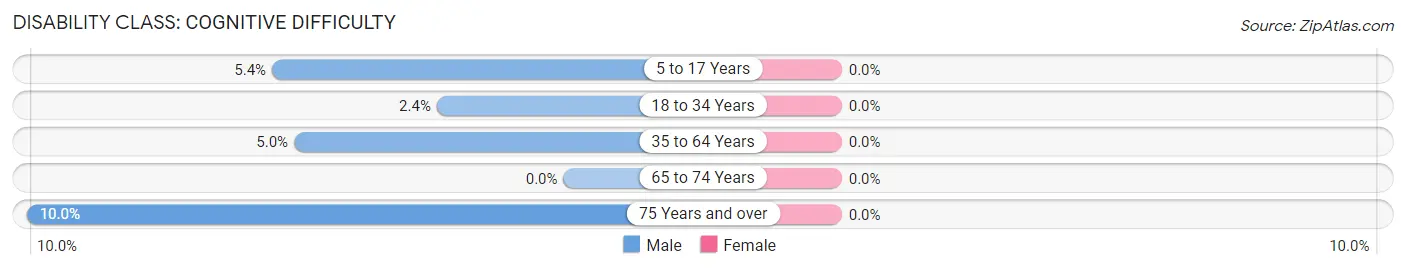
| Age Bracket | Male | Female |
| 5 to 17 Years | 28 (5.4%) | 0 (0.0%) |
| 18 to 34 Years | 8 (2.4%) | 0 (0.0%) |
| 35 to 64 Years | 55 (5.0%) | 0 (0.0%) |
| 65 to 74 Years | 0 (0.0%) | 0 (0.0%) |
| 75 Years and over | 23 (10.0%) | 0 (0.0%) |
Disability Class: Ambulatory Difficulty
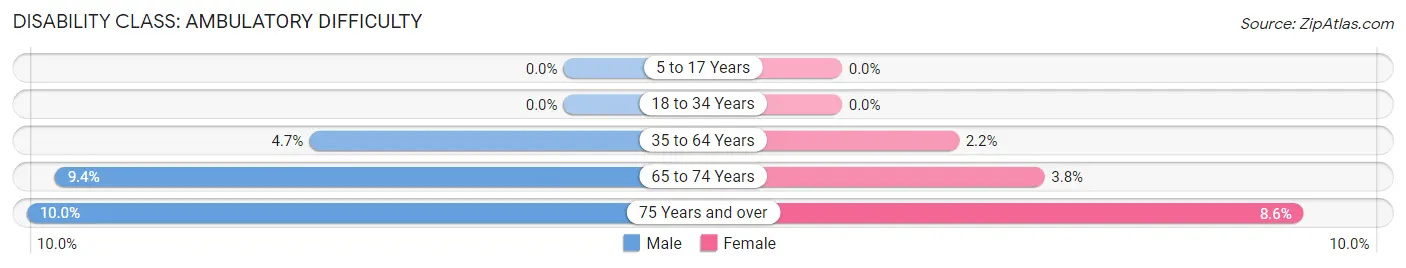
| Age Bracket | Male | Female |
| 5 to 17 Years | 0 (0.0%) | 0 (0.0%) |
| 18 to 34 Years | 0 (0.0%) | 0 (0.0%) |
| 35 to 64 Years | 52 (4.7%) | 22 (2.2%) |
| 65 to 74 Years | 27 (9.4%) | 22 (3.8%) |
| 75 Years and over | 23 (10.0%) | 15 (8.6%) |
Disability Class: Self-Care Difficulty
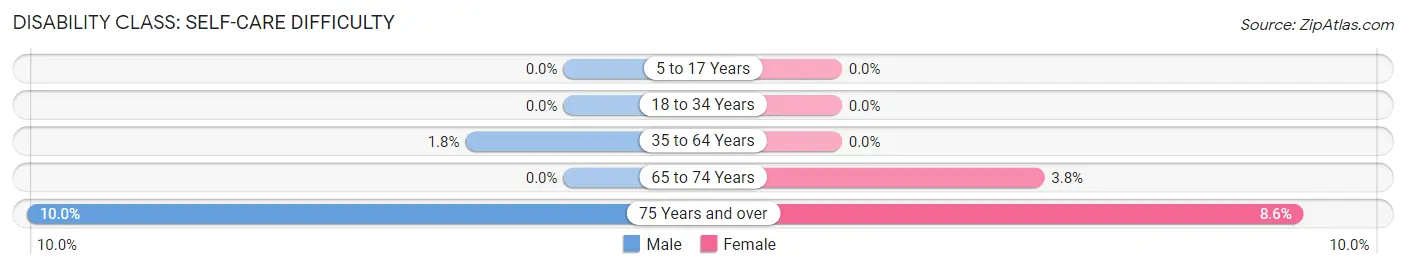
| Age Bracket | Male | Female |
| 5 to 17 Years | 0 (0.0%) | 0 (0.0%) |
| 18 to 34 Years | 0 (0.0%) | 0 (0.0%) |
| 35 to 64 Years | 20 (1.8%) | 0 (0.0%) |
| 65 to 74 Years | 0 (0.0%) | 22 (3.8%) |
| 75 Years and over | 23 (10.0%) | 15 (8.6%) |
Technology Access in Ashton Sandy Spring
Computing Device Access in Ashton Sandy Spring
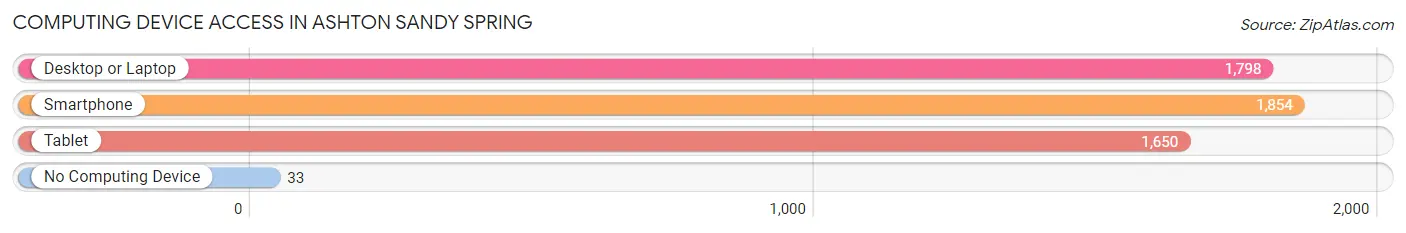
| Device Type | # Households | % Households |
| Desktop or Laptop | 1,798 | 93.9% |
| Smartphone | 1,854 | 96.8% |
| Tablet | 1,650 | 86.2% |
| No Computing Device | 33 | 1.7% |
| Total | 1,915 | 100.0% |
Internet Access in Ashton Sandy Spring
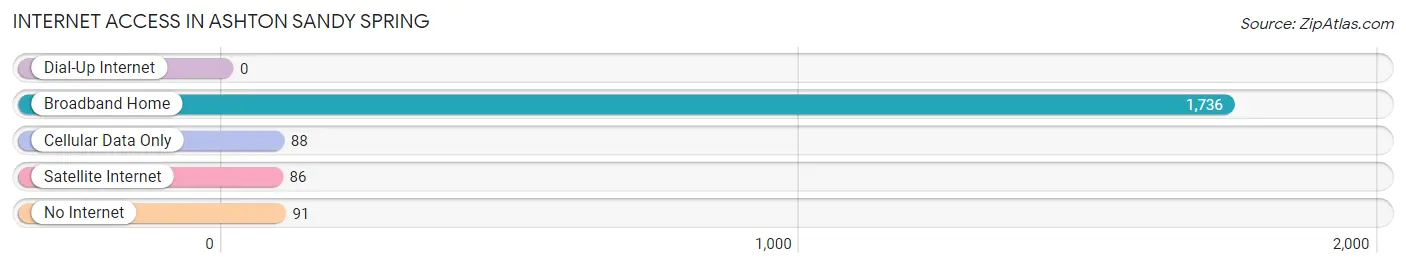
| Internet Type | # Households | % Households |
| Dial-Up Internet | 0 | 0.0% |
| Broadband Home | 1,736 | 90.6% |
| Cellular Data Only | 88 | 4.6% |
| Satellite Internet | 86 | 4.5% |
| No Internet | 91 | 4.8% |
| Total | 1,915 | 100.0% |
Ashton Sandy Spring Summary
Ashton Sandy Spring, MD is a small, unincorporated community located in Montgomery County, Maryland. It is situated approximately 20 miles north of Washington, D.C. and is part of the Washington Metropolitan Area. The community is bordered by Olney to the north, Brookeville to the east, and Laytonsville to the south.
History
The area that is now Ashton Sandy Spring was first settled in the late 1700s by Quakers from Pennsylvania. The community was originally known as Sandy Spring, and was named after a nearby spring that was used by the Quakers for baptisms. In 1845, the community was renamed Ashton Sandy Spring after the Ashton family, who had purchased a large tract of land in the area.
The community remained largely rural until the 1950s, when suburban development began to spread from Washington, D.C. into Montgomery County. This development brought an influx of new residents to the area, and Ashton Sandy Spring began to grow. In the 1970s, the community was incorporated as a census-designated place (CDP).
Geography
Ashton Sandy Spring is located in central Montgomery County, approximately 20 miles north of Washington, D.C. The community is situated in the Piedmont region of Maryland, and is characterized by rolling hills and wooded areas. The area is drained by the Little Seneca Creek, which flows through the community and empties into the Potomac River.
The climate in Ashton Sandy Spring is typical of the Mid-Atlantic region, with hot, humid summers and cold, wet winters. The average annual temperature is around 55 degrees Fahrenheit, and the average annual precipitation is around 40 inches.
Economy
The economy of Ashton Sandy Spring is largely based on the service industry. The community is home to a variety of restaurants, retail stores, and other businesses that serve the local population. In addition, the community is home to a number of professional offices, including medical and legal services.
The community is also home to a number of small businesses, including a local farm, a winery, and a brewery. These businesses provide employment opportunities for local residents and attract visitors to the area.
Demographics
As of the 2010 census, the population of Ashton Sandy Spring was 8,845. The population is largely white (83.3%), with smaller percentages of African Americans (7.7%), Asians (4.2%), and Hispanics (2.7%). The median household income is $117,945, and the median home value is $541,000.
The community is served by the Montgomery County Public Schools system. The local schools include Sandy Spring Friends School, a private Quaker school, and Ashton Elementary School, a public school.
Conclusion
Ashton Sandy Spring is a small, unincorporated community located in Montgomery County, Maryland. It is situated approximately 20 miles north of Washington, D.C. and is part of the Washington Metropolitan Area. The community is bordered by Olney to the north, Brookeville to the east, and Laytonsville to the south. The economy of Ashton Sandy Spring is largely based on the service industry, and the population is largely white. The community is served by the Montgomery County Public Schools system, and is home to a variety of businesses and professional offices.
Common Questions
What is Per Capita Income in Ashton Sandy Spring?
Per Capita income in Ashton Sandy Spring is $75,515.
What is the Median Family Income in Ashton Sandy Spring?
Median Family Income in Ashton Sandy Spring is $177,500.
What is the Median Household income in Ashton Sandy Spring?
Median Household Income in Ashton Sandy Spring is $167,577.
What is Income or Wage Gap in Ashton Sandy Spring?
Income or Wage Gap in Ashton Sandy Spring is 38.9%.
Women in Ashton Sandy Spring earn 61.1 cents for every dollar earned by a man.
What is Inequality or Gini Index in Ashton Sandy Spring?
Inequality or Gini Index in Ashton Sandy Spring is 0.41.
What is the Total Population of Ashton Sandy Spring?
Total Population of Ashton Sandy Spring is 5,578.
What is the Total Male Population of Ashton Sandy Spring?
Total Male Population of Ashton Sandy Spring is 2,662.
What is the Total Female Population of Ashton Sandy Spring?
Total Female Population of Ashton Sandy Spring is 2,916.
What is the Ratio of Males per 100 Females in Ashton Sandy Spring?
There are 91.29 Males per 100 Females in Ashton Sandy Spring.
What is the Ratio of Females per 100 Males in Ashton Sandy Spring?
There are 109.54 Females per 100 Males in Ashton Sandy Spring.
What is the Median Population Age in Ashton Sandy Spring?
Median Population Age in Ashton Sandy Spring is 48.3 Years.
What is the Average Family Size in Ashton Sandy Spring
Average Family Size in Ashton Sandy Spring is 3.0 People.
What is the Average Household Size in Ashton Sandy Spring
Average Household Size in Ashton Sandy Spring is 2.7 People.
How Large is the Labor Force in Ashton Sandy Spring?
There are 2,956 People in the Labor Forcein in Ashton Sandy Spring.
What is the Percentage of People in the Labor Force in Ashton Sandy Spring?
64.9% of People are in the Labor Force in Ashton Sandy Spring.
What is the Unemployment Rate in Ashton Sandy Spring?
Unemployment Rate in Ashton Sandy Spring is 3.2%.