Middletown, MD Map & Demographics
Middletown Map
Middletown Overview
$63,154
PER CAPITA INCOME
$192,454
AVG FAMILY INCOME
$168,007
AVG HOUSEHOLD INCOME
36.8%
WAGE / INCOME GAP [ % ]
63.2¢/ $1
WAGE / INCOME GAP [ $ ]
0.36
INEQUALITY / GINI INDEX
4,978
TOTAL POPULATION
2,405
MALE POPULATION
2,573
FEMALE POPULATION
93.47
MALES / 100 FEMALES
106.99
FEMALES / 100 MALES
41.3
MEDIAN AGE
3.3
AVG FAMILY SIZE
2.9
AVG HOUSEHOLD SIZE
2,692
LABOR FORCE [ PEOPLE ]
70.1%
PERCENT IN LABOR FORCE
2.2%
UNEMPLOYMENT RATE
Middletown Zip Codes
Income in Middletown
Income Overview in Middletown
Per Capita Income in Middletown is $63,154, while median incomes of families and households are $192,454 and $168,007 respectively.
| Characteristic | Number | Measure |
| Per Capita Income | 4,978 | $63,154 |
| Median Family Income | 1,325 | $192,454 |
| Mean Family Income | 1,325 | $199,616 |
| Median Household Income | 1,691 | $168,007 |
| Mean Household Income | 1,691 | $185,754 |
| Income Deficit | 1,325 | $0 |
| Wage / Income Gap (%) | 4,978 | 36.79% |
| Wage / Income Gap ($) | 4,978 | 63.21¢ per $1 |
| Gini / Inequality Index | 4,978 | 0.36 |
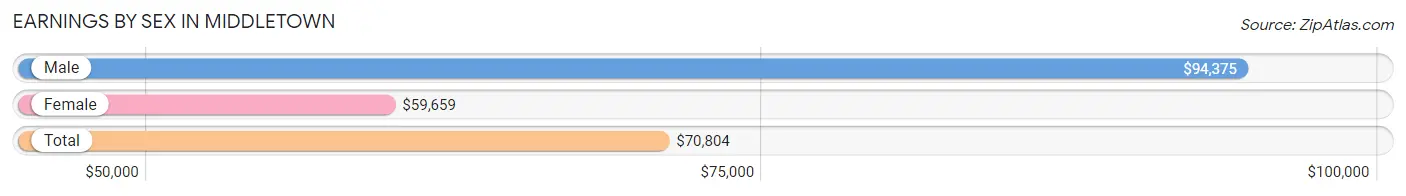
Earnings by Sex in Middletown
Average Earnings in Middletown are $70,804, $94,375 for men and $59,659 for women, a difference of 36.8%.
| Sex | Number | Average Earnings |
| Male | 1,469 (53.2%) | $94,375 |
| Female | 1,293 (46.8%) | $59,659 |
| Total | 2,762 (100.0%) | $70,804 |
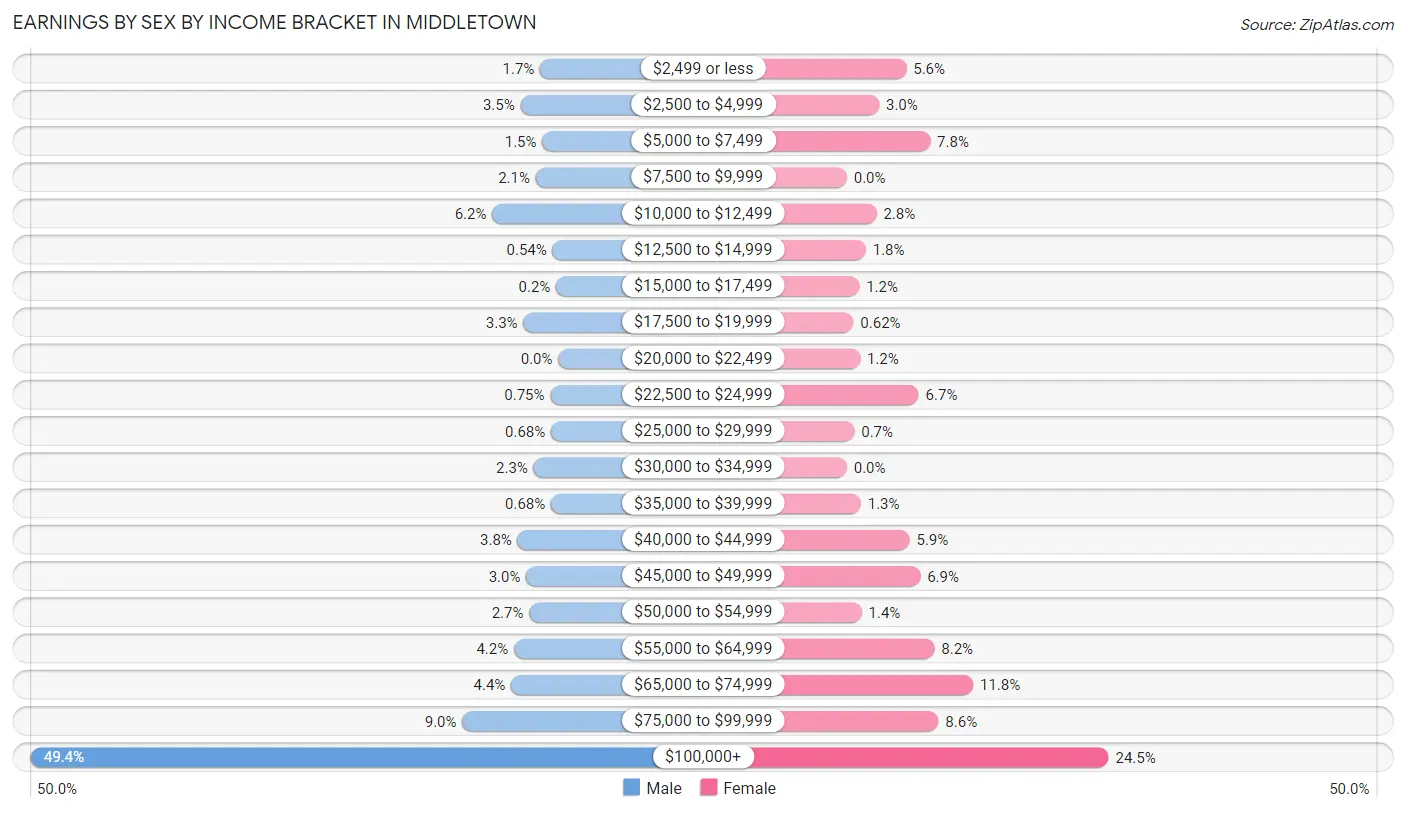
Earnings by Sex by Income Bracket in Middletown
The most common earnings brackets in Middletown are $100,000+ for men (726 | 49.4%) and $100,000+ for women (317 | 24.5%).
| Income | Male | Female |
| $2,499 or less | 25 (1.7%) | 72 (5.6%) |
| $2,500 to $4,999 | 52 (3.5%) | 39 (3.0%) |
| $5,000 to $7,499 | 22 (1.5%) | 101 (7.8%) |
| $7,500 to $9,999 | 31 (2.1%) | 0 (0.0%) |
| $10,000 to $12,499 | 91 (6.2%) | 36 (2.8%) |
| $12,500 to $14,999 | 8 (0.5%) | 23 (1.8%) |
| $15,000 to $17,499 | 3 (0.2%) | 15 (1.2%) |
| $17,500 to $19,999 | 48 (3.3%) | 8 (0.6%) |
| $20,000 to $22,499 | 0 (0.0%) | 16 (1.2%) |
| $22,500 to $24,999 | 11 (0.7%) | 87 (6.7%) |
| $25,000 to $29,999 | 10 (0.7%) | 9 (0.7%) |
| $30,000 to $34,999 | 34 (2.3%) | 0 (0.0%) |
| $35,000 to $39,999 | 10 (0.7%) | 17 (1.3%) |
| $40,000 to $44,999 | 56 (3.8%) | 76 (5.9%) |
| $45,000 to $49,999 | 44 (3.0%) | 89 (6.9%) |
| $50,000 to $54,999 | 40 (2.7%) | 18 (1.4%) |
| $55,000 to $64,999 | 61 (4.2%) | 106 (8.2%) |
| $65,000 to $74,999 | 65 (4.4%) | 153 (11.8%) |
| $75,000 to $99,999 | 132 (9.0%) | 111 (8.6%) |
| $100,000+ | 726 (49.4%) | 317 (24.5%) |
| Total | 1,469 (100.0%) | 1,293 (100.0%) |
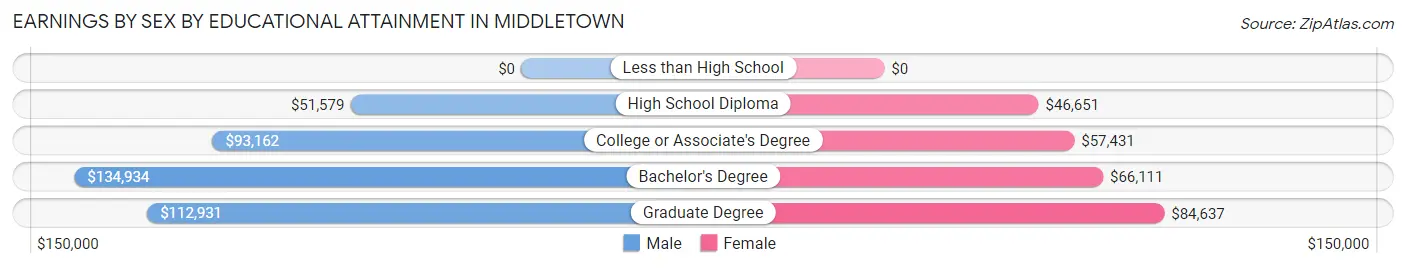
Earnings by Sex by Educational Attainment in Middletown
Average earnings in Middletown are $108,320 for men and $66,174 for women, a difference of 38.9%. Men with an educational attainment of bachelor's degree enjoy the highest average annual earnings of $134,934, while those with high school diploma education earn the least with $51,579. Women with an educational attainment of graduate degree earn the most with the average annual earnings of $84,637, while those with high school diploma education have the smallest earnings of $46,651.
| Educational Attainment | Male Income | Female Income |
| Less than High School | - | - |
| High School Diploma | $51,579 | $46,651 |
| College or Associate's Degree | $93,162 | $57,431 |
| Bachelor's Degree | $134,934 | $66,111 |
| Graduate Degree | $112,931 | $84,637 |
| Total | $108,320 | $66,174 |
Family Income in Middletown
Family Income Brackets in Middletown
According to the Middletown family income data, there are 539 families falling into the $200,000+ income range, which is the most common income bracket and makes up 40.7% of all families.
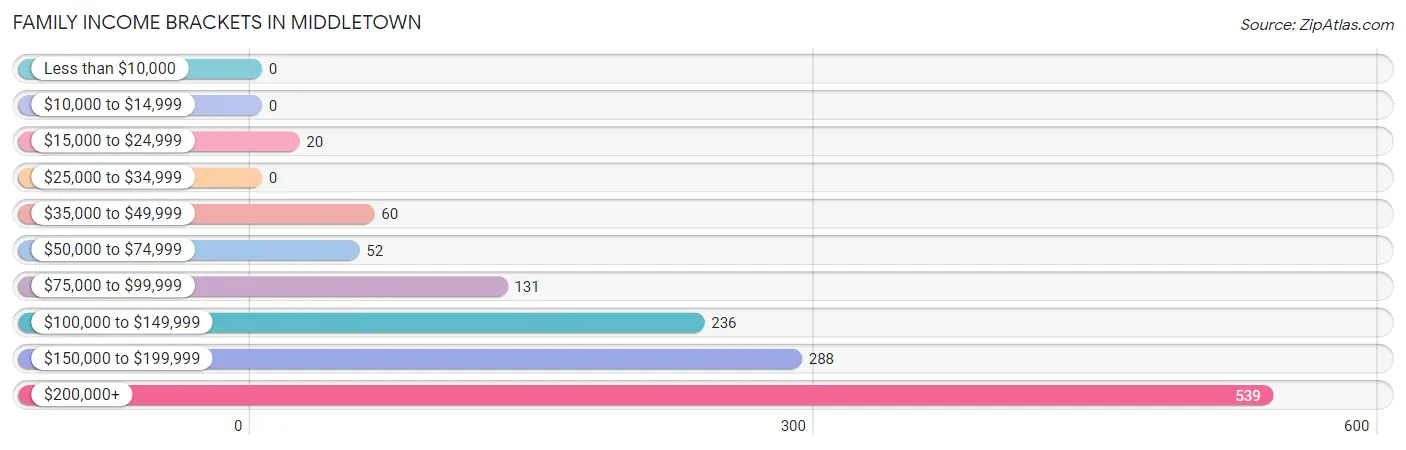
| Income Bracket | # Families | % Families |
| Less than $10,000 | 0 | 0.0% |
| $10,000 to $14,999 | 0 | 0.0% |
| $15,000 to $24,999 | 20 | 1.5% |
| $25,000 to $34,999 | 0 | 0.0% |
| $35,000 to $49,999 | 60 | 4.5% |
| $50,000 to $74,999 | 52 | 3.9% |
| $75,000 to $99,999 | 131 | 9.9% |
| $100,000 to $149,999 | 236 | 17.8% |
| $150,000 to $199,999 | 288 | 21.7% |
| $200,000+ | 539 | 40.7% |
Family Income by Famaliy Size in Middletown
6-person families (55 | 4.2%) account for the highest median family income in Middletown with $250,001 per family, while 2-person families (486 | 36.7%) have the highest median income of $71,776 per family member.
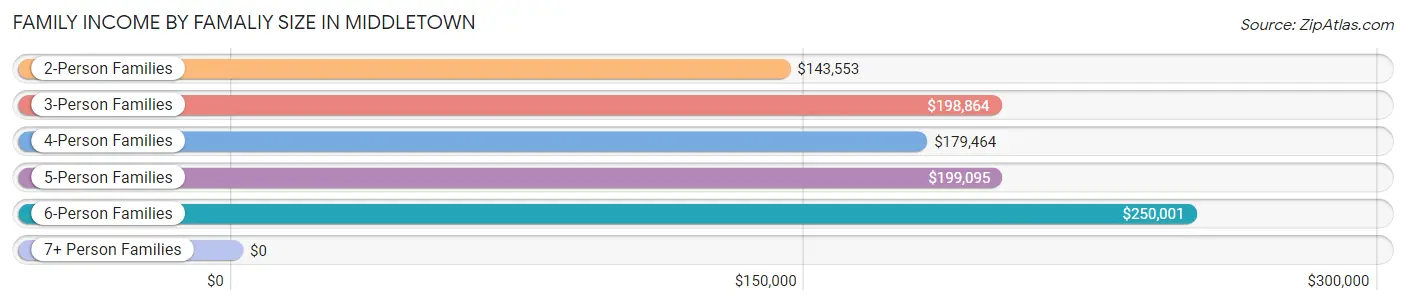
| Income Bracket | # Families | Median Income |
| 2-Person Families | 486 (36.7%) | $143,553 |
| 3-Person Families | 304 (22.9%) | $198,864 |
| 4-Person Families | 303 (22.9%) | $179,464 |
| 5-Person Families | 164 (12.4%) | $199,095 |
| 6-Person Families | 55 (4.2%) | $250,001 |
| 7+ Person Families | 13 (1.0%) | $0 |
| Total | 1,325 (100.0%) | $192,454 |
Family Income by Number of Earners in Middletown
The median family income in Middletown is $192,454, with families comprising 3+ earners (212) having the highest median family income of $229,444, while families with no earners (110) have the lowest median family income of $119,375, accounting for 16.0% and 8.3% of families, respectively.
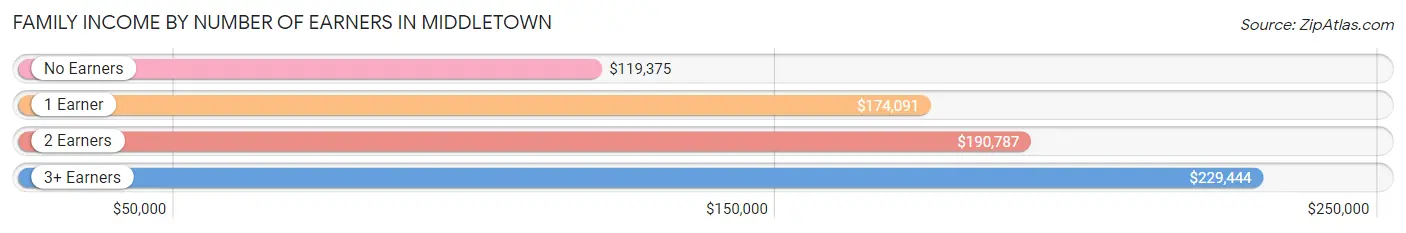
| Number of Earners | # Families | Median Income |
| No Earners | 110 (8.3%) | $119,375 |
| 1 Earner | 356 (26.9%) | $174,091 |
| 2 Earners | 647 (48.8%) | $190,787 |
| 3+ Earners | 212 (16.0%) | $229,444 |
| Total | 1,325 (100.0%) | $192,454 |
Household Income in Middletown
Household Income Brackets in Middletown
With 582 households falling in the category, the $200,000+ income range is the most frequent in Middletown, accounting for 34.4% of all households. In contrast, only 2 households (0.1%) fall into the $25,000 to $34,999 income bracket, making it the least populous group.
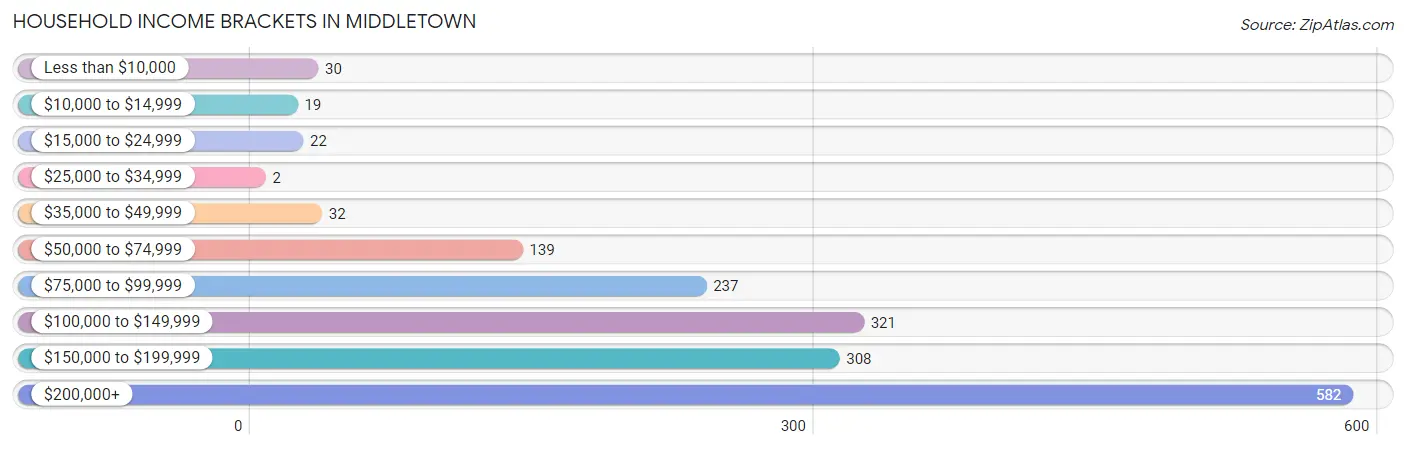
| Income Bracket | # Households | % Households |
| Less than $10,000 | 30 | 1.8% |
| $10,000 to $14,999 | 19 | 1.1% |
| $15,000 to $24,999 | 22 | 1.3% |
| $25,000 to $34,999 | 2 | 0.1% |
| $35,000 to $49,999 | 32 | 1.9% |
| $50,000 to $74,999 | 139 | 8.2% |
| $75,000 to $99,999 | 237 | 14.0% |
| $100,000 to $149,999 | 321 | 19.0% |
| $150,000 to $199,999 | 308 | 18.2% |
| $200,000+ | 582 | 34.4% |
Household Income by Householder Age in Middletown
The median household income in Middletown is $168,007, with the highest median household income of $198,364 found in the 45 to 64 years age bracket for the primary householder. A total of 811 households (48.0%) fall into this category.
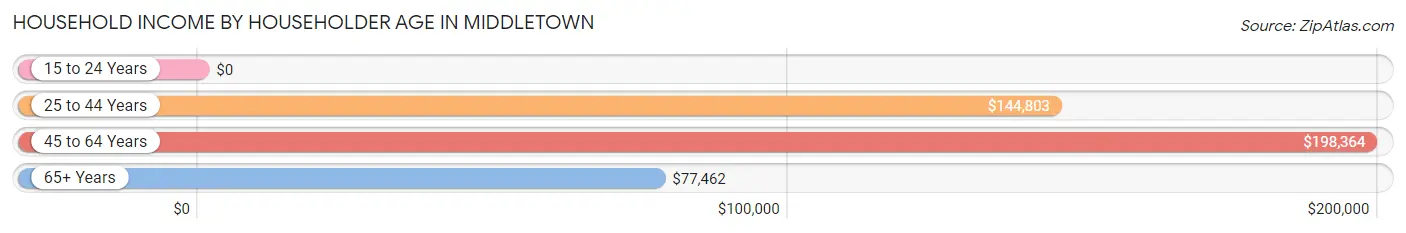
| Income Bracket | # Households | Median Income |
| 15 to 24 Years | 0 (0.0%) | $0 |
| 25 to 44 Years | 471 (27.9%) | $144,803 |
| 45 to 64 Years | 811 (48.0%) | $198,364 |
| 65+ Years | 409 (24.2%) | $77,462 |
| Total | 1,691 (100.0%) | $168,007 |
Poverty in Middletown
Income Below Poverty by Sex and Age in Middletown
With 0.3% poverty level for males and 3.7% for females among the residents of Middletown, 45 to 54 year old males and 75 year old and over females are the most vulnerable to poverty, with 8 males (1.8%) and 30 females (18.4%) in their respective age groups living below the poverty level.
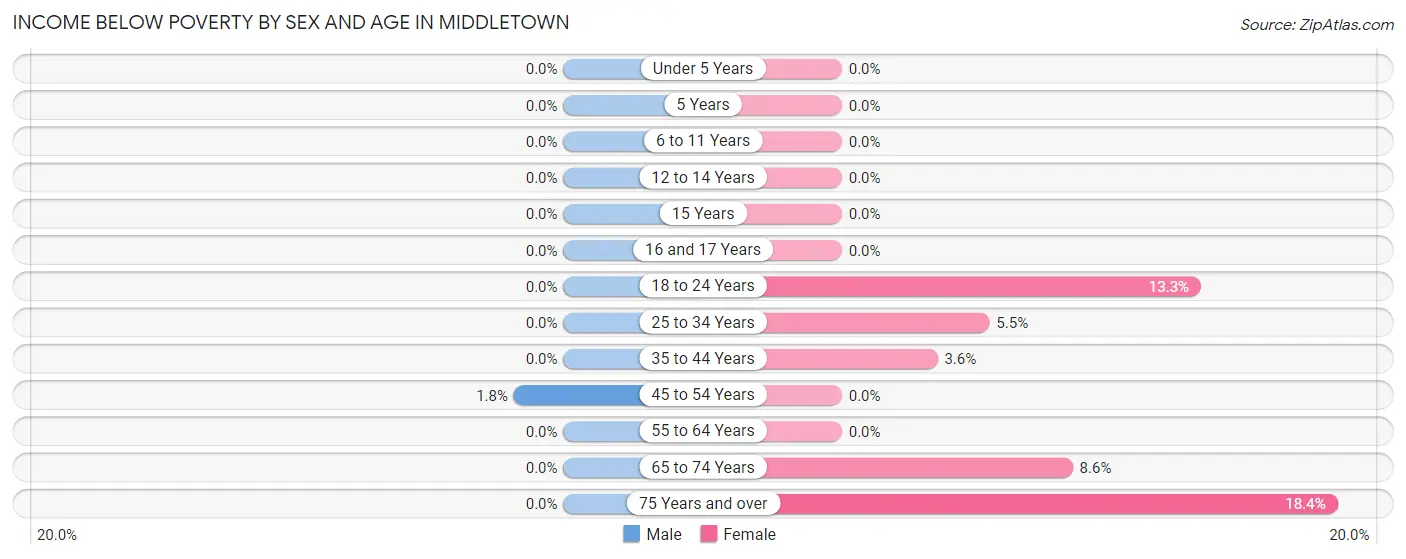
| Age Bracket | Male | Female |
| Under 5 Years | 0 (0.0%) | 0 (0.0%) |
| 5 Years | 0 (0.0%) | 0 (0.0%) |
| 6 to 11 Years | 0 (0.0%) | 0 (0.0%) |
| 12 to 14 Years | 0 (0.0%) | 0 (0.0%) |
| 15 Years | 0 (0.0%) | 0 (0.0%) |
| 16 and 17 Years | 0 (0.0%) | 0 (0.0%) |
| 18 to 24 Years | 0 (0.0%) | 22 (13.3%) |
| 25 to 34 Years | 0 (0.0%) | 12 (5.5%) |
| 35 to 44 Years | 0 (0.0%) | 12 (3.5%) |
| 45 to 54 Years | 8 (1.8%) | 0 (0.0%) |
| 55 to 64 Years | 0 (0.0%) | 0 (0.0%) |
| 65 to 74 Years | 0 (0.0%) | 18 (8.6%) |
| 75 Years and over | 0 (0.0%) | 30 (18.4%) |
| Total | 8 (0.3%) | 94 (3.7%) |
Income Above Poverty by Sex and Age in Middletown
According to the poverty statistics in Middletown, males aged under 5 years and females aged under 5 years are the age groups that are most secure financially, with 100.0% of males and 100.0% of females in these age groups living above the poverty line.
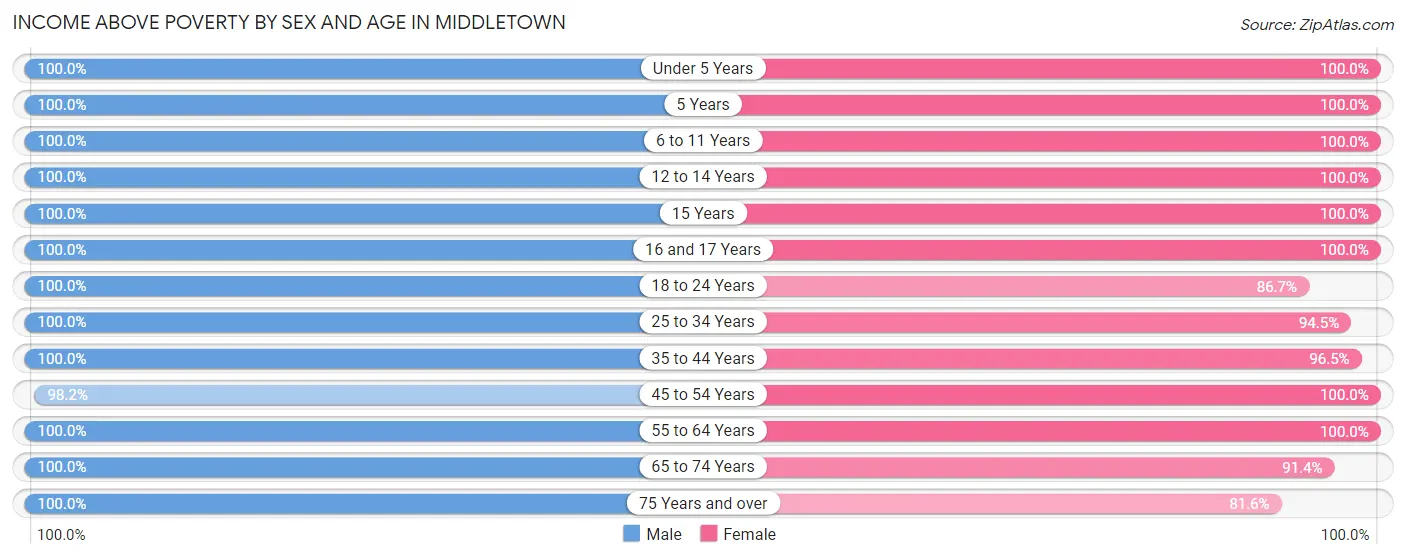
| Age Bracket | Male | Female |
| Under 5 Years | 141 (100.0%) | 141 (100.0%) |
| 5 Years | 19 (100.0%) | 53 (100.0%) |
| 6 to 11 Years | 185 (100.0%) | 287 (100.0%) |
| 12 to 14 Years | 133 (100.0%) | 94 (100.0%) |
| 15 Years | 23 (100.0%) | 55 (100.0%) |
| 16 and 17 Years | 59 (100.0%) | 68 (100.0%) |
| 18 to 24 Years | 279 (100.0%) | 143 (86.7%) |
| 25 to 34 Years | 158 (100.0%) | 207 (94.5%) |
| 35 to 44 Years | 269 (100.0%) | 326 (96.5%) |
| 45 to 54 Years | 426 (98.2%) | 364 (100.0%) |
| 55 to 64 Years | 287 (100.0%) | 409 (100.0%) |
| 65 to 74 Years | 250 (100.0%) | 192 (91.4%) |
| 75 Years and over | 168 (100.0%) | 133 (81.6%) |
| Total | 2,397 (99.7%) | 2,472 (96.3%) |
Income Below Poverty Among Married-Couple Families in Middletown
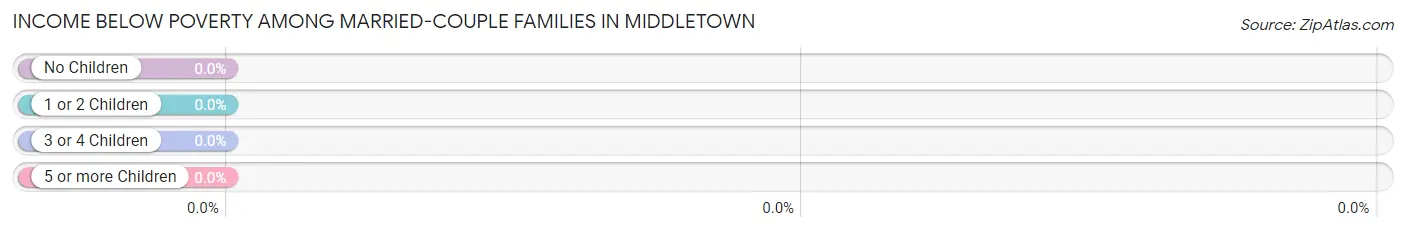
| Children | Above Poverty | Below Poverty |
| No Children | 568 (100.0%) | 0 (0.0%) |
| 1 or 2 Children | 510 (100.0%) | 0 (0.0%) |
| 3 or 4 Children | 70 (100.0%) | 0 (0.0%) |
| 5 or more Children | 13 (100.0%) | 0 (0.0%) |
| Total | 1,161 (100.0%) | 0 (0.0%) |
Income Below Poverty Among Single-Parent Households in Middletown
| Children | Single Father | Single Mother |
| No Children | 0 (0.0%) | 0 (0.0%) |
| 1 or 2 Children | 0 (0.0%) | 0 (0.0%) |
| 3 or 4 Children | 0 (0.0%) | 0 (0.0%) |
| 5 or more Children | 0 (0.0%) | 0 (0.0%) |
| Total | 0 (0.0%) | 0 (0.0%) |
Income Below Poverty Among Married-Couple vs Single-Parent Households in Middletown
| Children | Married-Couple Families | Single-Parent Households |
| No Children | 0 (0.0%) | 0 (0.0%) |
| 1 or 2 Children | 0 (0.0%) | 0 (0.0%) |
| 3 or 4 Children | 0 (0.0%) | 0 (0.0%) |
| 5 or more Children | 0 (0.0%) | 0 (0.0%) |
| Total | 0 (0.0%) | 0 (0.0%) |
Race in Middletown
The most populous races in Middletown are White / Caucasian (4,099 | 82.3%), Asian (480 | 9.6%), and Two or more Races (274 | 5.5%).

| Race | # Population | % Population |
| Asian | 480 | 9.6% |
| Black / African American | 83 | 1.7% |
| Hawaiian / Pacific | 0 | 0.0% |
| Hispanic or Latino | 103 | 2.1% |
| Native / Alaskan | 0 | 0.0% |
| White / Caucasian | 4,099 | 82.3% |
| Two or more Races | 274 | 5.5% |
| Some other Race | 42 | 0.8% |
| Total | 4,978 | 100.0% |
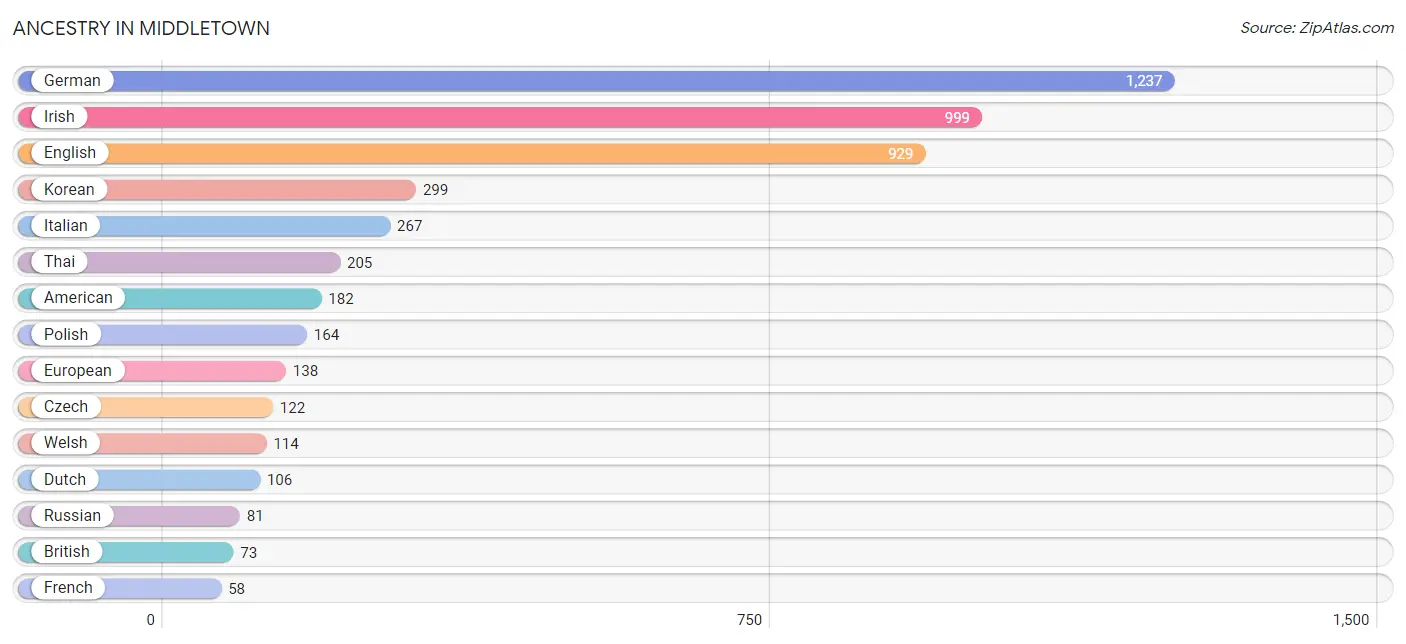
Ancestry in Middletown
The most populous ancestries reported in Middletown are German (1,237 | 24.8%), Irish (999 | 20.1%), English (929 | 18.7%), Korean (299 | 6.0%), and Italian (267 | 5.4%), together accounting for 74.9% of all Middletown residents.
| Ancestry | # Population | % Population |
| American | 182 | 3.7% |
| Apache | 12 | 0.2% |
| Arab | 12 | 0.2% |
| Armenian | 21 | 0.4% |
| British | 73 | 1.5% |
| Burmese | 31 | 0.6% |
| Canadian | 14 | 0.3% |
| Cuban | 54 | 1.1% |
| Czech | 122 | 2.5% |
| Czechoslovakian | 7 | 0.1% |
| Dutch | 106 | 2.1% |
| Eastern European | 21 | 0.4% |
| English | 929 | 18.7% |
| European | 138 | 2.8% |
| Finnish | 10 | 0.2% |
| French | 58 | 1.2% |
| German | 1,237 | 24.8% |
| Hungarian | 19 | 0.4% |
| Indian (Asian) | 52 | 1.0% |
| Irish | 999 | 20.1% |
| Italian | 267 | 5.4% |
| Korean | 299 | 6.0% |
| Lebanese | 12 | 0.2% |
| Mexican | 30 | 0.6% |
| Norwegian | 53 | 1.1% |
| Polish | 164 | 3.3% |
| Puerto Rican | 19 | 0.4% |
| Russian | 81 | 1.6% |
| Scotch-Irish | 33 | 0.7% |
| Scottish | 56 | 1.1% |
| Subsaharan African | 18 | 0.4% |
| Swedish | 28 | 0.6% |
| Swiss | 27 | 0.5% |
| Thai | 205 | 4.1% |
| Turkish | 9 | 0.2% |
| Welsh | 114 | 2.3% | View All 36 Rows |
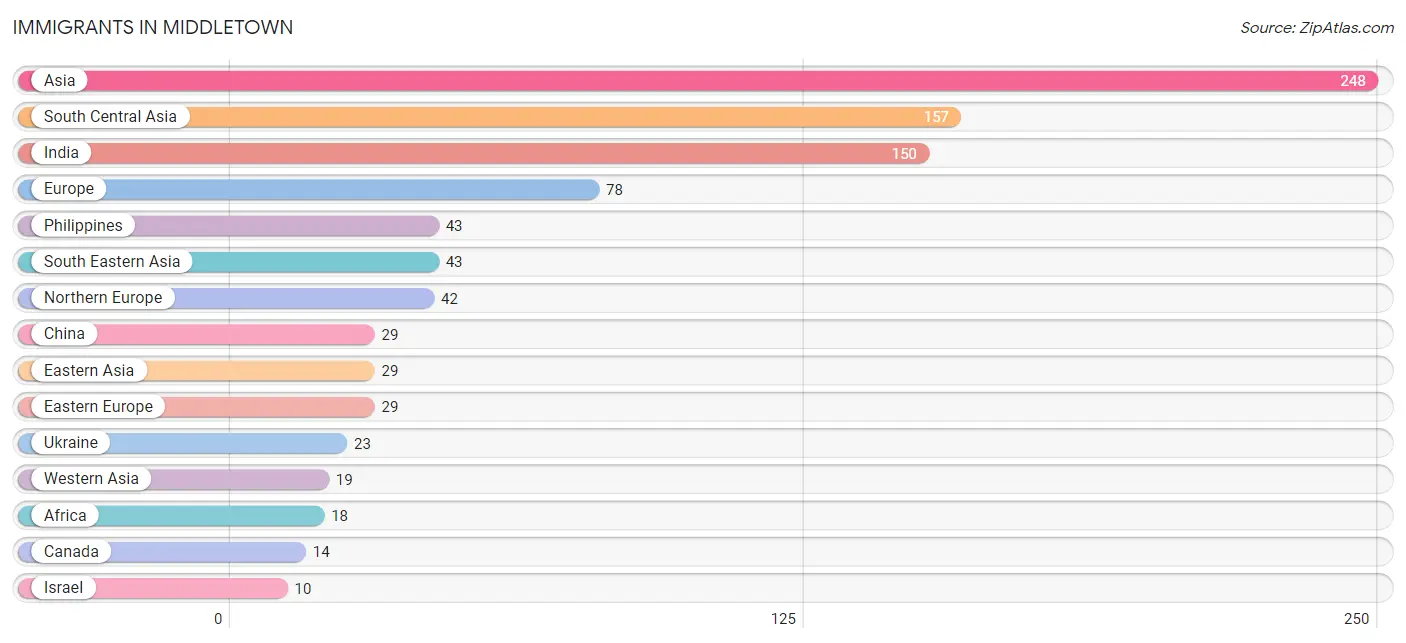
Immigrants in Middletown
The most numerous immigrant groups reported in Middletown came from Asia (248 | 5.0%), South Central Asia (157 | 3.2%), India (150 | 3.0%), Europe (78 | 1.6%), and Philippines (43 | 0.9%), together accounting for 13.6% of all Middletown residents.
| Immigration Origin | # Population | % Population |
| Africa | 18 | 0.4% |
| Asia | 248 | 5.0% |
| Canada | 14 | 0.3% |
| China | 29 | 0.6% |
| Eastern Asia | 29 | 0.6% |
| Eastern Europe | 29 | 0.6% |
| Europe | 78 | 1.6% |
| Germany | 7 | 0.1% |
| Hong Kong | 8 | 0.2% |
| India | 150 | 3.0% |
| Israel | 10 | 0.2% |
| Northern Europe | 42 | 0.8% |
| Pakistan | 7 | 0.1% |
| Philippines | 43 | 0.9% |
| Poland | 3 | 0.1% |
| South Central Asia | 157 | 3.2% |
| South Eastern Asia | 43 | 0.9% |
| Taiwan | 10 | 0.2% |
| Turkey | 9 | 0.2% |
| Ukraine | 23 | 0.5% |
| Western Asia | 19 | 0.4% |
| Western Europe | 7 | 0.1% | View All 22 Rows |
Sex and Age in Middletown
Sex and Age in Middletown
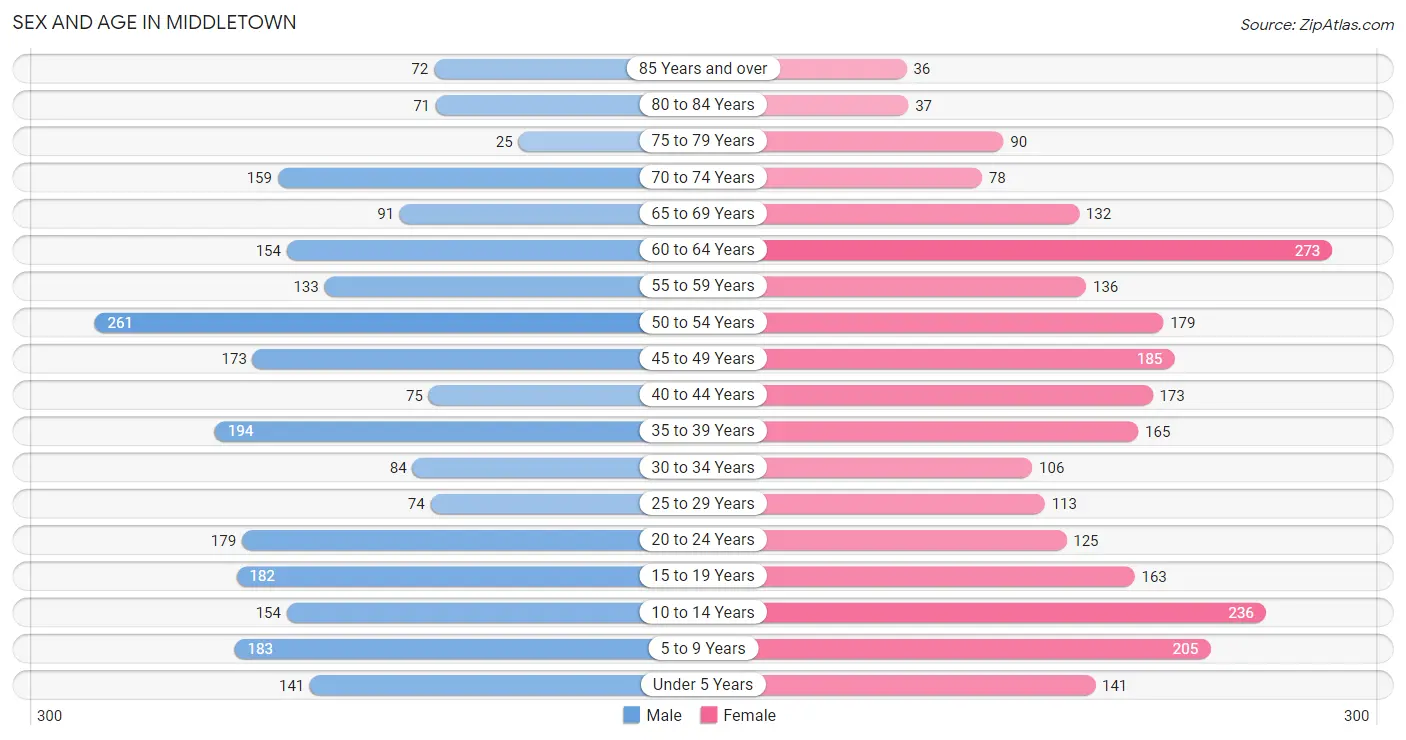
The most populous age groups in Middletown are 50 to 54 Years (261 | 10.8%) for men and 60 to 64 Years (273 | 10.6%) for women.
| Age Bracket | Male | Female |
| Under 5 Years | 141 (5.9%) | 141 (5.5%) |
| 5 to 9 Years | 183 (7.6%) | 205 (8.0%) |
| 10 to 14 Years | 154 (6.4%) | 236 (9.2%) |
| 15 to 19 Years | 182 (7.6%) | 163 (6.3%) |
| 20 to 24 Years | 179 (7.4%) | 125 (4.9%) |
| 25 to 29 Years | 74 (3.1%) | 113 (4.4%) |
| 30 to 34 Years | 84 (3.5%) | 106 (4.1%) |
| 35 to 39 Years | 194 (8.1%) | 165 (6.4%) |
| 40 to 44 Years | 75 (3.1%) | 173 (6.7%) |
| 45 to 49 Years | 173 (7.2%) | 185 (7.2%) |
| 50 to 54 Years | 261 (10.8%) | 179 (7.0%) |
| 55 to 59 Years | 133 (5.5%) | 136 (5.3%) |
| 60 to 64 Years | 154 (6.4%) | 273 (10.6%) |
| 65 to 69 Years | 91 (3.8%) | 132 (5.1%) |
| 70 to 74 Years | 159 (6.6%) | 78 (3.0%) |
| 75 to 79 Years | 25 (1.0%) | 90 (3.5%) |
| 80 to 84 Years | 71 (2.9%) | 37 (1.4%) |
| 85 Years and over | 72 (3.0%) | 36 (1.4%) |
| Total | 2,405 (100.0%) | 2,573 (100.0%) |
Families and Households in Middletown
Median Family Size in Middletown
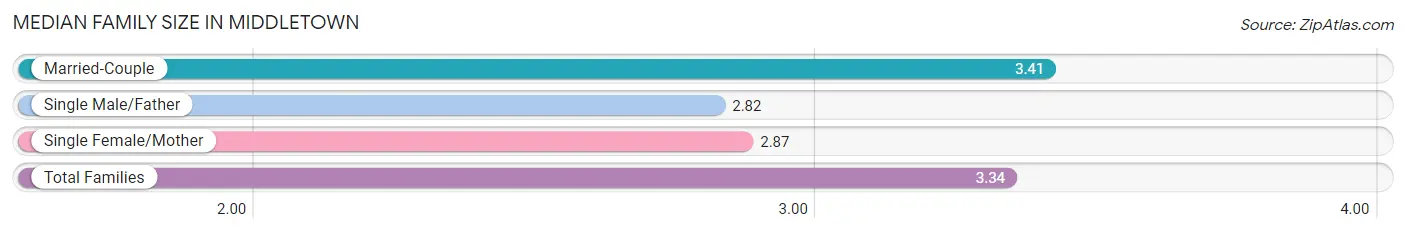
The median family size in Middletown is 3.34 persons per family, with married-couple families (1,161 | 87.6%) accounting for the largest median family size of 3.41 persons per family. On the other hand, single male/father families (34 | 2.6%) represent the smallest median family size with 2.82 persons per family.
| Family Type | # Families | Family Size |
| Married-Couple | 1,161 (87.6%) | 3.41 |
| Single Male/Father | 34 (2.6%) | 2.82 |
| Single Female/Mother | 130 (9.8%) | 2.87 |
| Total Families | 1,325 (100.0%) | 3.34 |
Median Household Size in Middletown
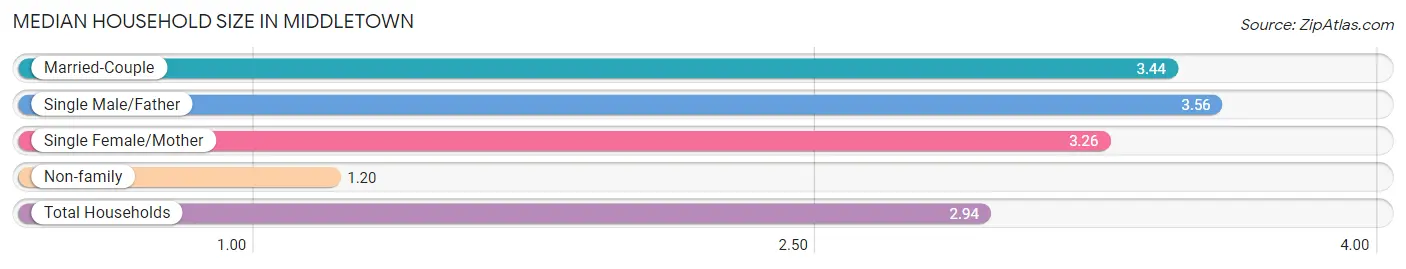
The median household size in Middletown is 2.94 persons per household, with single male/father households (34 | 2.0%) accounting for the largest median household size of 3.56 persons per household. non-family households (366 | 21.6%) represent the smallest median household size with 1.20 persons per household.
| Household Type | # Households | Household Size |
| Married-Couple | 1,161 (68.7%) | 3.44 |
| Single Male/Father | 34 (2.0%) | 3.56 |
| Single Female/Mother | 130 (7.7%) | 3.26 |
| Non-family | 366 (21.6%) | 1.20 |
| Total Households | 1,691 (100.0%) | 2.94 |
Household Size by Marriage Status in Middletown
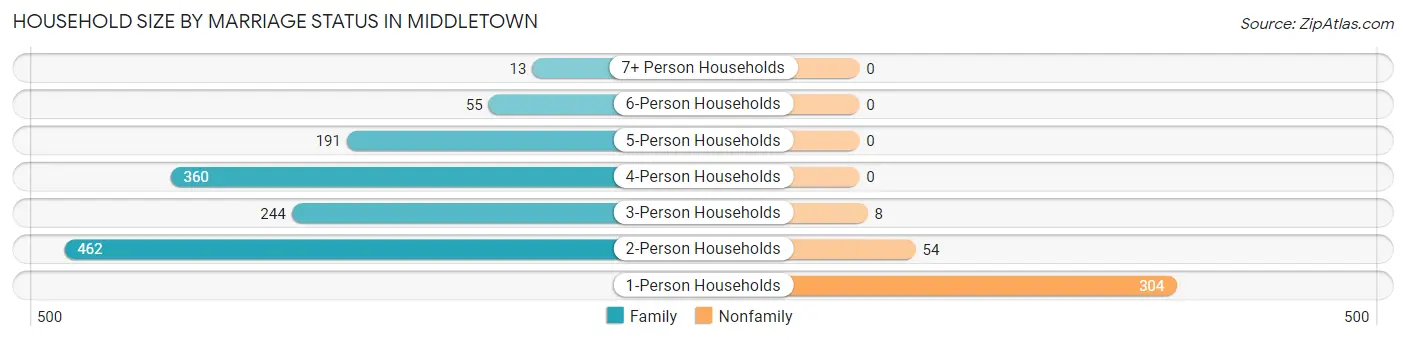
Out of a total of 1,691 households in Middletown, 1,325 (78.4%) are family households, while 366 (21.6%) are nonfamily households. The most numerous type of family households are 2-person households, comprising 462, and the most common type of nonfamily households are 1-person households, comprising 304.
| Household Size | Family Households | Nonfamily Households |
| 1-Person Households | - | 304 (18.0%) |
| 2-Person Households | 462 (27.3%) | 54 (3.2%) |
| 3-Person Households | 244 (14.4%) | 8 (0.5%) |
| 4-Person Households | 360 (21.3%) | 0 (0.0%) |
| 5-Person Households | 191 (11.3%) | 0 (0.0%) |
| 6-Person Households | 55 (3.3%) | 0 (0.0%) |
| 7+ Person Households | 13 (0.8%) | 0 (0.0%) |
| Total | 1,325 (78.4%) | 366 (21.6%) |
Female Fertility in Middletown
Fertility by Age in Middletown
Average fertility rate in Middletown is 23.0 births per 1,000 women. Women in the age bracket of 20 to 34 years have the highest fertility rate with 52.0 births per 1,000 women. Women in the age bracket of 20 to 34 years acount for 75.0% of all women with births.
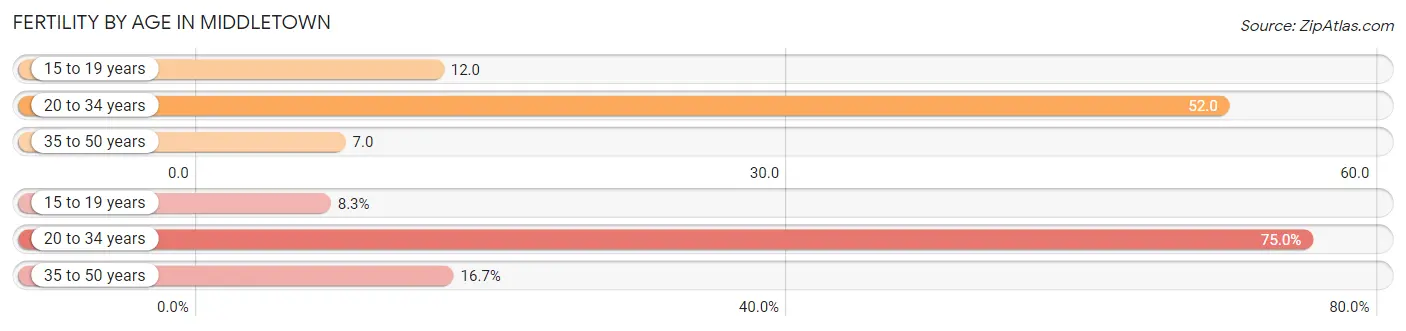
| Age Bracket | Women with Births | Births / 1,000 Women |
| 15 to 19 years | 2 (8.3%) | 12.0 |
| 20 to 34 years | 18 (75.0%) | 52.0 |
| 35 to 50 years | 4 (16.7%) | 7.0 |
| Total | 24 (100.0%) | 23.0 |
Fertility by Age by Marriage Status in Middletown
91.7% of women with births (24) in Middletown are married. The highest percentage of unmarried women with births falls into 15 to 19 years age bracket with 100.0% of them unmarried at the time of birth, while the lowest percentage of unmarried women with births belong to 20 to 34 years age bracket with 0.0% of them unmarried.
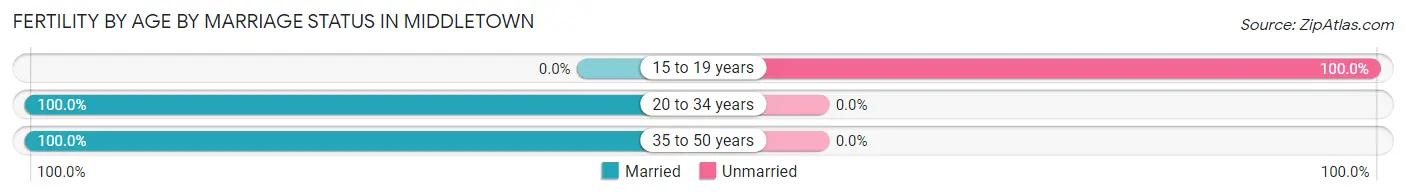
| Age Bracket | Married | Unmarried |
| 15 to 19 years | 0 (0.0%) | 2 (100.0%) |
| 20 to 34 years | 18 (100.0%) | 0 (0.0%) |
| 35 to 50 years | 4 (100.0%) | 0 (0.0%) |
| Total | 22 (91.7%) | 2 (8.3%) |
Fertility by Education in Middletown
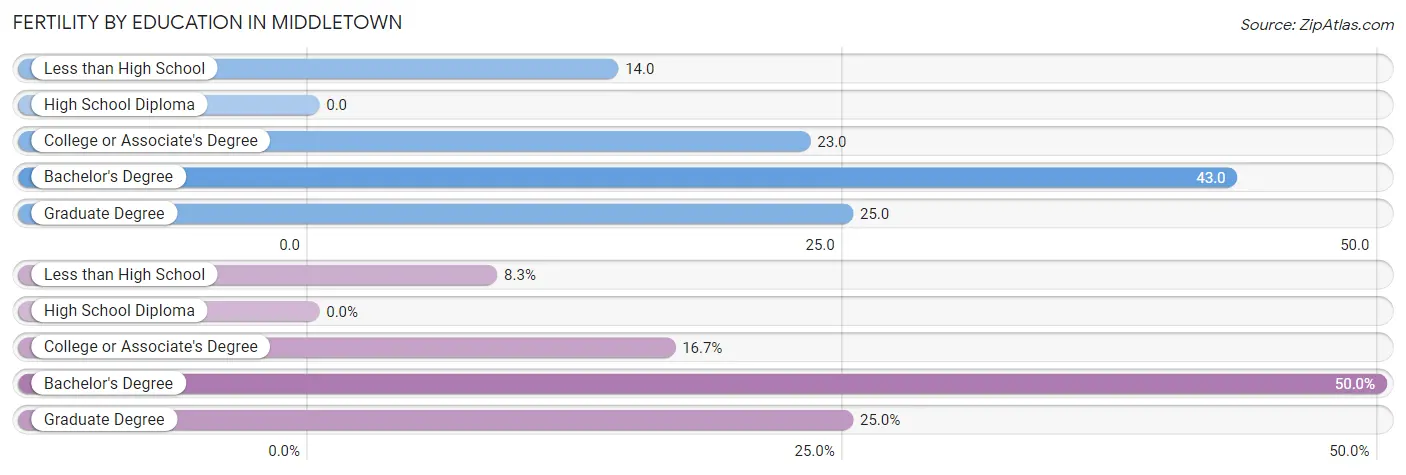
| Educational Attainment | Women with Births | Births / 1,000 Women |
| Less than High School | 2 (8.3%) | 14.0 |
| High School Diploma | 0 (0.0%) | 0.0 |
| College or Associate's Degree | 4 (16.7%) | 23.0 |
| Bachelor's Degree | 12 (50.0%) | 43.0 |
| Graduate Degree | 6 (25.0%) | 25.0 |
| Total | 24 (100.0%) | 23.0 |
Fertility by Education by Marriage Status in Middletown
8.3% of women with births in Middletown are unmarried. Women with the educational attainment of college or associate's degree are most likely to be married with 100.0% of them married at childbirth, while women with the educational attainment of less than high school are least likely to be married with 100.0% of them unmarried at childbirth.
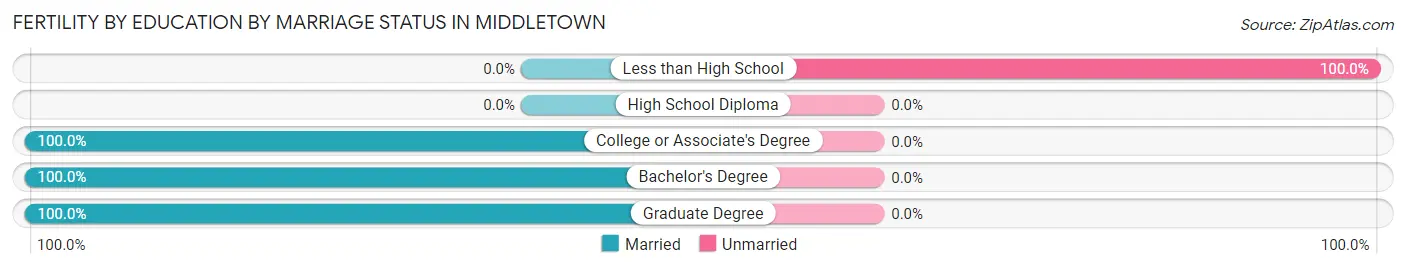
| Educational Attainment | Married | Unmarried |
| Less than High School | 0 (0.0%) | 2 (100.0%) |
| High School Diploma | 0 (0.0%) | 0 (0.0%) |
| College or Associate's Degree | 4 (100.0%) | 0 (0.0%) |
| Bachelor's Degree | 12 (100.0%) | 0 (0.0%) |
| Graduate Degree | 6 (100.0%) | 0 (0.0%) |
| Total | 22 (91.7%) | 2 (8.3%) |
Employment Characteristics in Middletown
Employment by Class of Employer in Middletown
Among the 2,547 employed individuals in Middletown, private company employees (1,491 | 58.5%), local government employees (380 | 14.9%), and federal government employees (290 | 11.4%) make up the most common classes of employment.
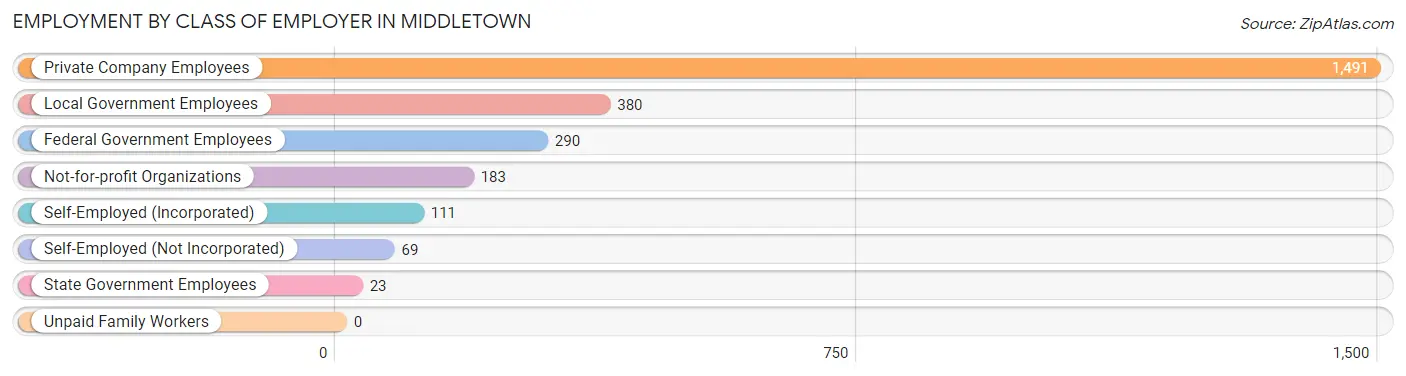
| Employer Class | # Employees | % Employees |
| Private Company Employees | 1,491 | 58.5% |
| Self-Employed (Incorporated) | 111 | 4.4% |
| Self-Employed (Not Incorporated) | 69 | 2.7% |
| Not-for-profit Organizations | 183 | 7.2% |
| Local Government Employees | 380 | 14.9% |
| State Government Employees | 23 | 0.9% |
| Federal Government Employees | 290 | 11.4% |
| Unpaid Family Workers | 0 | 0.0% |
| Total | 2,547 | 100.0% |
Employment Status by Age in Middletown
According to the labor force statistics for Middletown, out of the total population over 16 years of age (3,840), 70.1% or 2,692 individuals are in the labor force, with 2.2% or 59 of them unemployed. The age group with the highest labor force participation rate is 25 to 29 years, with 94.7% or 177 individuals in the labor force. Within the labor force, the 20 to 24 years age range has the highest percentage of unemployed individuals, with 14.6% or 36 of them being unemployed.
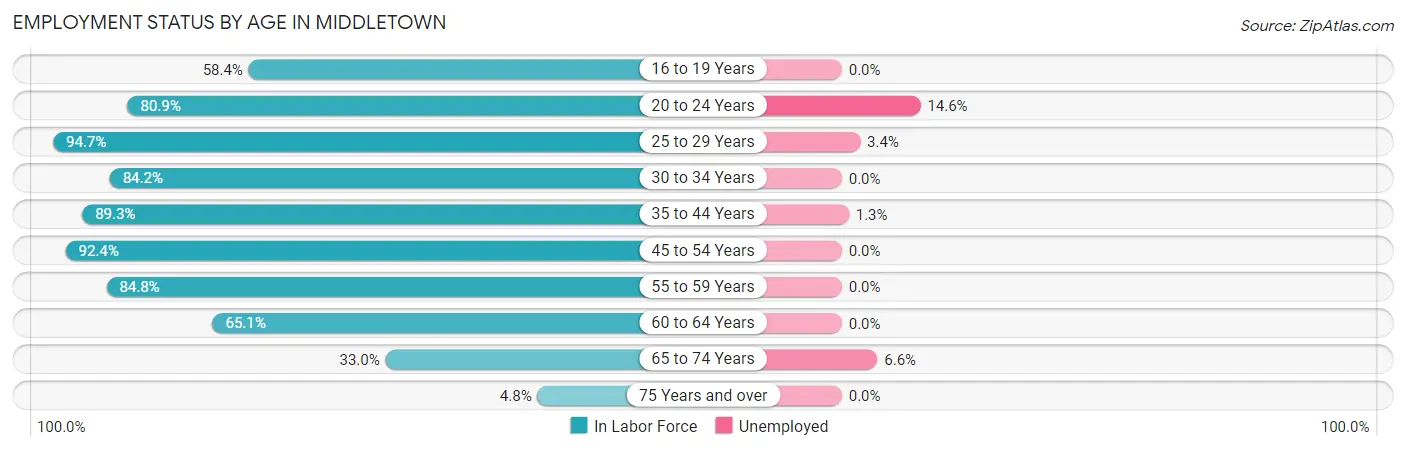
| Age Bracket | In Labor Force | Unemployed |
| 16 to 19 Years | 156 (58.4%) | 0 (0.0%) |
| 20 to 24 Years | 246 (80.9%) | 36 (14.6%) |
| 25 to 29 Years | 177 (94.7%) | 6 (3.4%) |
| 30 to 34 Years | 160 (84.2%) | 0 (0.0%) |
| 35 to 44 Years | 542 (89.3%) | 7 (1.3%) |
| 45 to 54 Years | 737 (92.4%) | 0 (0.0%) |
| 55 to 59 Years | 228 (84.8%) | 0 (0.0%) |
| 60 to 64 Years | 278 (65.1%) | 0 (0.0%) |
| 65 to 74 Years | 152 (33.0%) | 10 (6.6%) |
| 75 Years and over | 16 (4.8%) | 0 (0.0%) |
| Total | 2,692 (70.1%) | 59 (2.2%) |
Employment Status by Educational Attainment in Middletown
According to labor force statistics for Middletown, 85.6% of individuals (2,121) out of the total population between 25 and 64 years of age (2,478) are in the labor force, with 0.6% or 13 of them being unemployed. The group with the highest labor force participation rate are those with the educational attainment of bachelor's degree or higher, with 90.6% or 1,393 individuals in the labor force. Within the labor force, individuals with college / associate degree education have the highest percentage of unemployment, with 1.5% or 7 of them being unemployed.
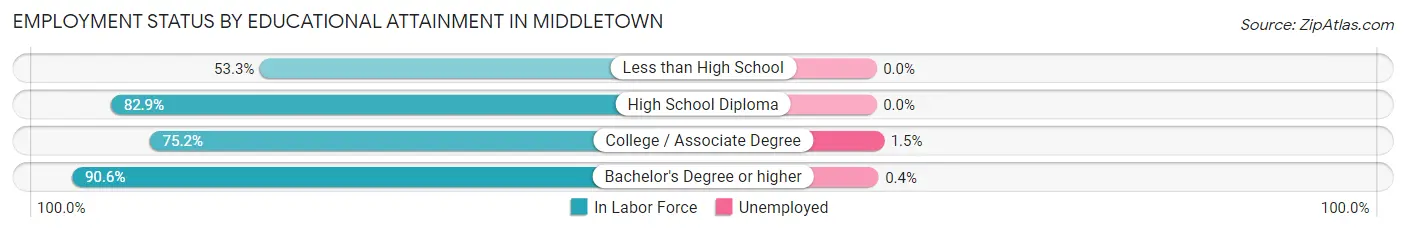
| Educational Attainment | In Labor Force | Unemployed |
| Less than High School | 8 (53.3%) | 0 (0.0%) |
| High School Diploma | 262 (82.9%) | 0 (0.0%) |
| College / Associate Degree | 458 (75.2%) | 9 (1.5%) |
| Bachelor's Degree or higher | 1,393 (90.6%) | 6 (0.4%) |
| Total | 2,121 (85.6%) | 15 (0.6%) |
Employment Occupations by Sex in Middletown
Management, Business, Science and Arts Occupations
The most common Management, Business, Science and Arts occupations in Middletown are Community & Social Service (375 | 14.3%), Management (374 | 14.3%), Business & Financial (368 | 14.1%), Computers, Engineering & Science (325 | 12.4%), and Education Instruction & Library (215 | 8.2%).
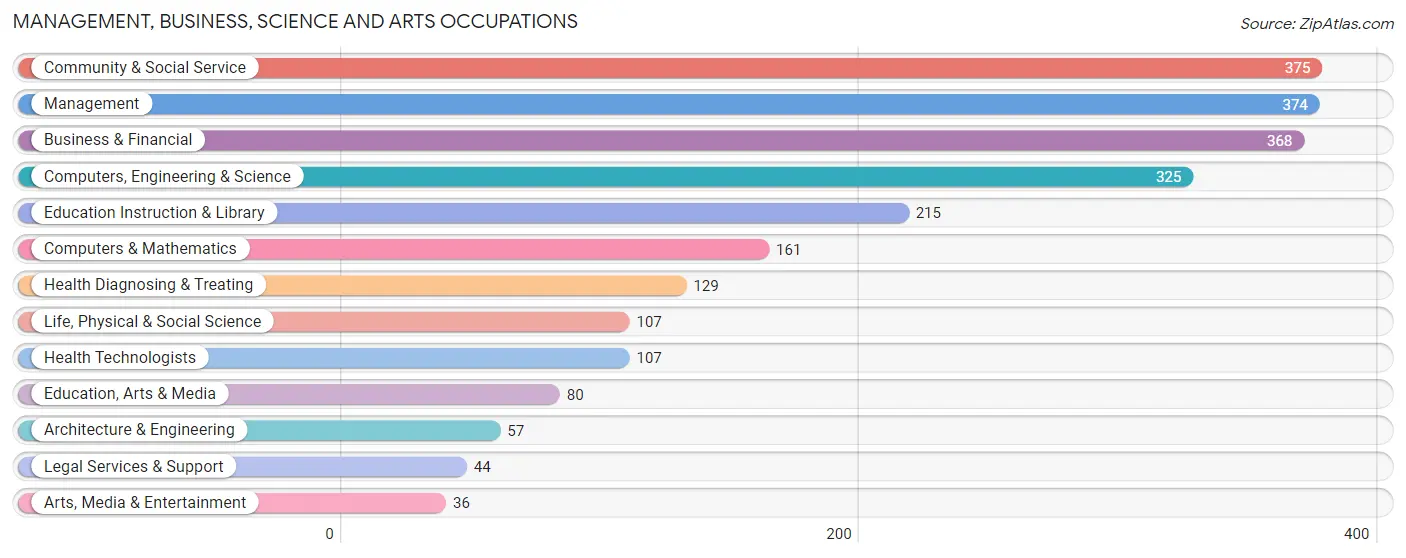
Management, Business, Science and Arts Occupations by Sex
Within the Management, Business, Science and Arts occupations in Middletown, the most male-oriented occupations are Architecture & Engineering (100.0%), Arts, Media & Entertainment (100.0%), and Life, Physical & Social Science (86.9%), while the most female-oriented occupations are Education, Arts & Media (93.8%), Education Instruction & Library (79.1%), and Health Technologists (77.6%).
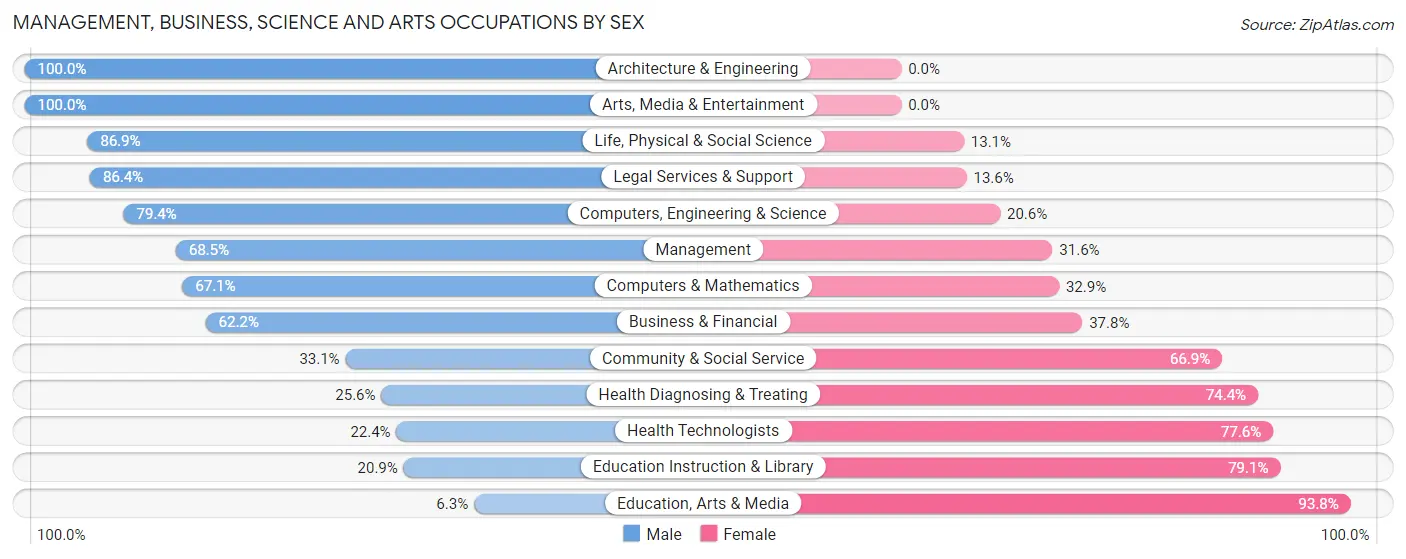
| Occupation | Male | Female |
| Management | 256 (68.4%) | 118 (31.6%) |
| Business & Financial | 229 (62.2%) | 139 (37.8%) |
| Computers, Engineering & Science | 258 (79.4%) | 67 (20.6%) |
| Computers & Mathematics | 108 (67.1%) | 53 (32.9%) |
| Architecture & Engineering | 57 (100.0%) | 0 (0.0%) |
| Life, Physical & Social Science | 93 (86.9%) | 14 (13.1%) |
| Community & Social Service | 124 (33.1%) | 251 (66.9%) |
| Education, Arts & Media | 5 (6.2%) | 75 (93.8%) |
| Legal Services & Support | 38 (86.4%) | 6 (13.6%) |
| Education Instruction & Library | 45 (20.9%) | 170 (79.1%) |
| Arts, Media & Entertainment | 36 (100.0%) | 0 (0.0%) |
| Health Diagnosing & Treating | 33 (25.6%) | 96 (74.4%) |
| Health Technologists | 24 (22.4%) | 83 (77.6%) |
| Total (Category) | 900 (57.3%) | 671 (42.7%) |
| Total (Overall) | 1,360 (51.9%) | 1,258 (48.0%) |
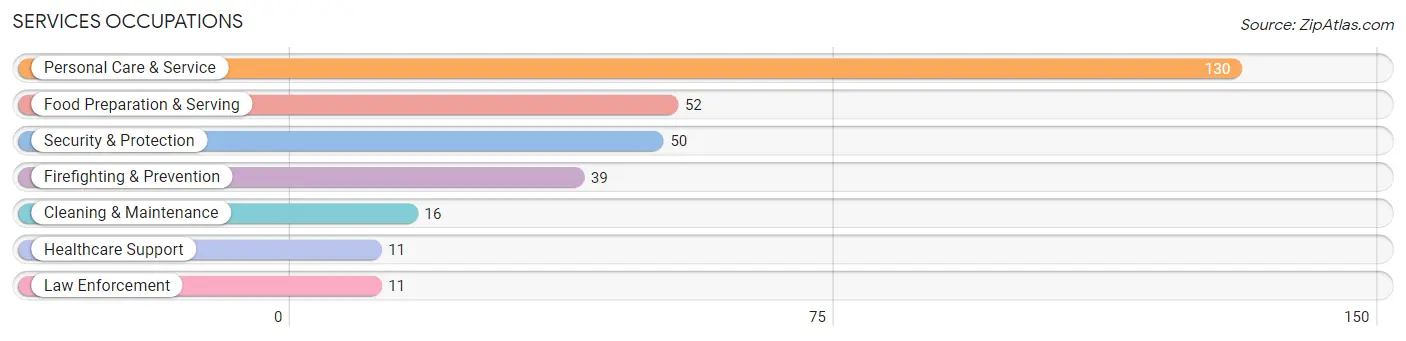
Services Occupations
The most common Services occupations in Middletown are Personal Care & Service (130 | 5.0%), Food Preparation & Serving (52 | 2.0%), Security & Protection (50 | 1.9%), Firefighting & Prevention (39 | 1.5%), and Cleaning & Maintenance (16 | 0.6%).
Services Occupations by Sex
Within the Services occupations in Middletown, the most male-oriented occupations are Security & Protection (100.0%), Firefighting & Prevention (100.0%), and Law Enforcement (100.0%), while the most female-oriented occupations are Healthcare Support (100.0%), Personal Care & Service (86.2%), and Food Preparation & Serving (76.9%).
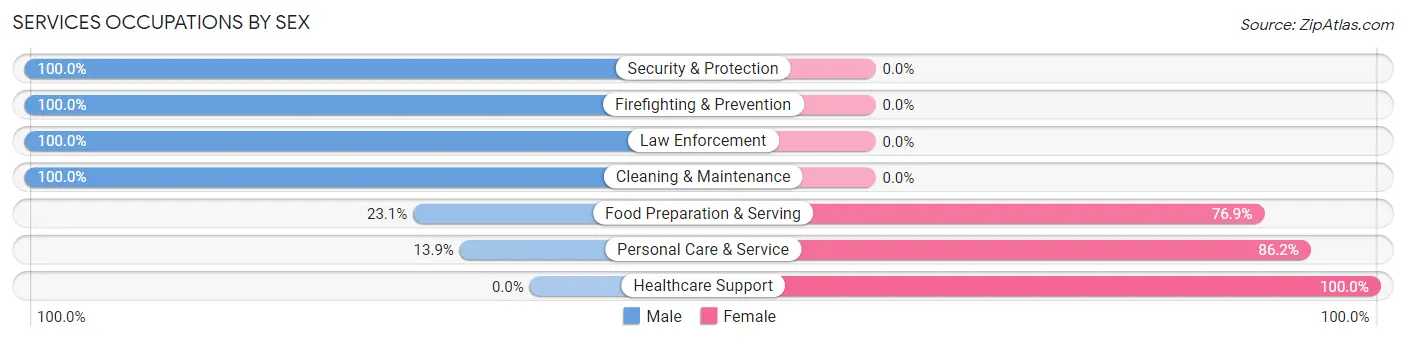
| Occupation | Male | Female |
| Healthcare Support | 0 (0.0%) | 11 (100.0%) |
| Security & Protection | 50 (100.0%) | 0 (0.0%) |
| Firefighting & Prevention | 39 (100.0%) | 0 (0.0%) |
| Law Enforcement | 11 (100.0%) | 0 (0.0%) |
| Food Preparation & Serving | 12 (23.1%) | 40 (76.9%) |
| Cleaning & Maintenance | 16 (100.0%) | 0 (0.0%) |
| Personal Care & Service | 18 (13.9%) | 112 (86.2%) |
| Total (Category) | 96 (37.1%) | 163 (62.9%) |
| Total (Overall) | 1,360 (51.9%) | 1,258 (48.0%) |
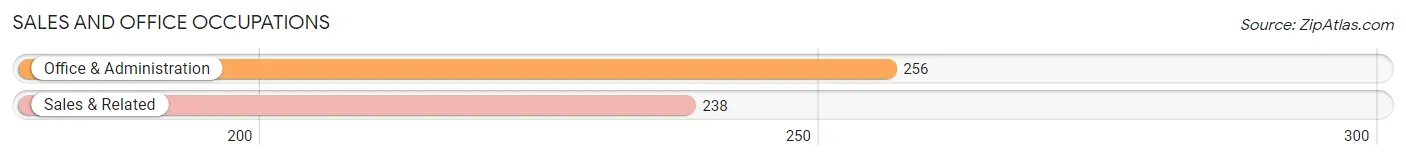
Sales and Office Occupations
The most common Sales and Office occupations in Middletown are Office & Administration (256 | 9.8%), and Sales & Related (238 | 9.1%).
Sales and Office Occupations by Sex
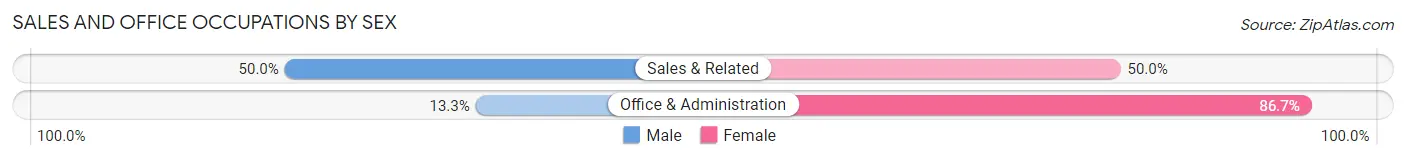
| Occupation | Male | Female |
| Sales & Related | 119 (50.0%) | 119 (50.0%) |
| Office & Administration | 34 (13.3%) | 222 (86.7%) |
| Total (Category) | 153 (31.0%) | 341 (69.0%) |
| Total (Overall) | 1,360 (51.9%) | 1,258 (48.0%) |
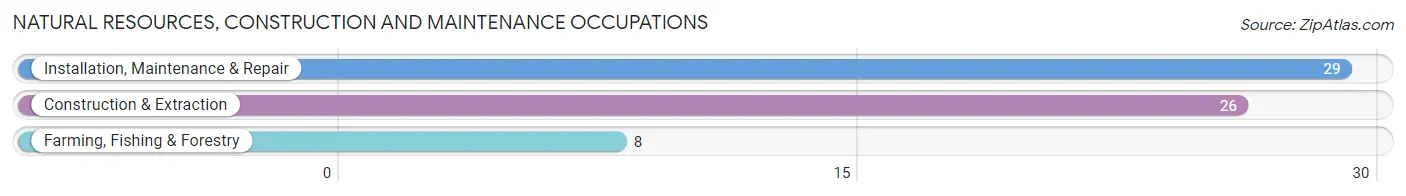
Natural Resources, Construction and Maintenance Occupations
The most common Natural Resources, Construction and Maintenance occupations in Middletown are Installation, Maintenance & Repair (29 | 1.1%), Construction & Extraction (26 | 1.0%), and Farming, Fishing & Forestry (8 | 0.3%).
Natural Resources, Construction and Maintenance Occupations by Sex
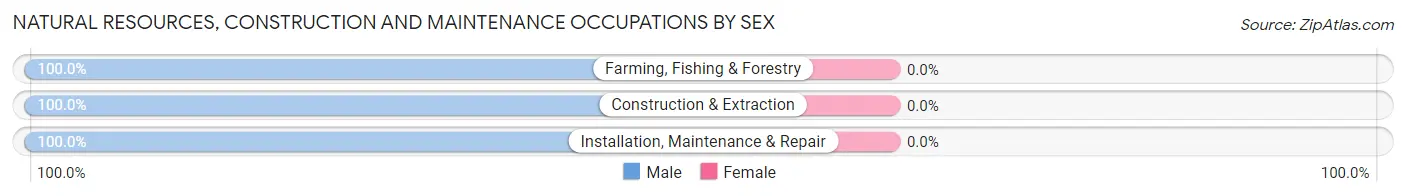
| Occupation | Male | Female |
| Farming, Fishing & Forestry | 8 (100.0%) | 0 (0.0%) |
| Construction & Extraction | 26 (100.0%) | 0 (0.0%) |
| Installation, Maintenance & Repair | 29 (100.0%) | 0 (0.0%) |
| Total (Category) | 63 (100.0%) | 0 (0.0%) |
| Total (Overall) | 1,360 (51.9%) | 1,258 (48.0%) |
Production, Transportation and Moving Occupations
The most common Production, Transportation and Moving occupations in Middletown are Production (115 | 4.4%), Transportation (61 | 2.3%), and Material Moving (55 | 2.1%).
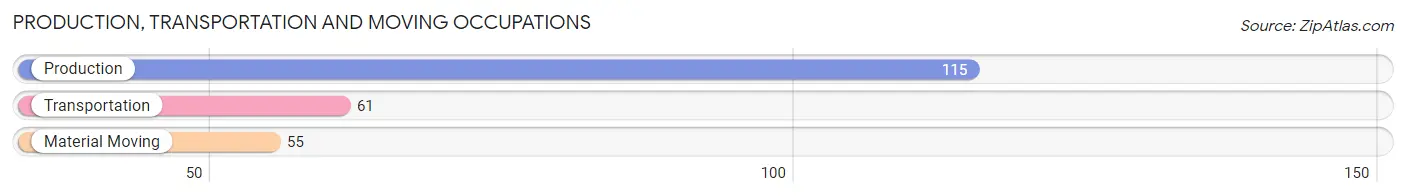
Production, Transportation and Moving Occupations by Sex
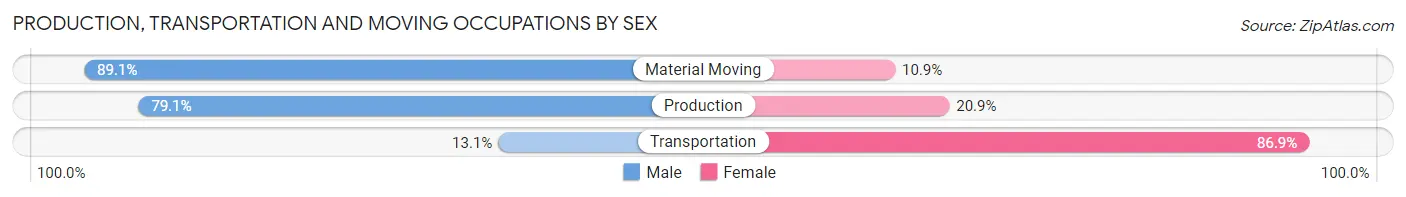
| Occupation | Male | Female |
| Production | 91 (79.1%) | 24 (20.9%) |
| Transportation | 8 (13.1%) | 53 (86.9%) |
| Material Moving | 49 (89.1%) | 6 (10.9%) |
| Total (Category) | 148 (64.1%) | 83 (35.9%) |
| Total (Overall) | 1,360 (51.9%) | 1,258 (48.0%) |
Employment Industries by Sex in Middletown
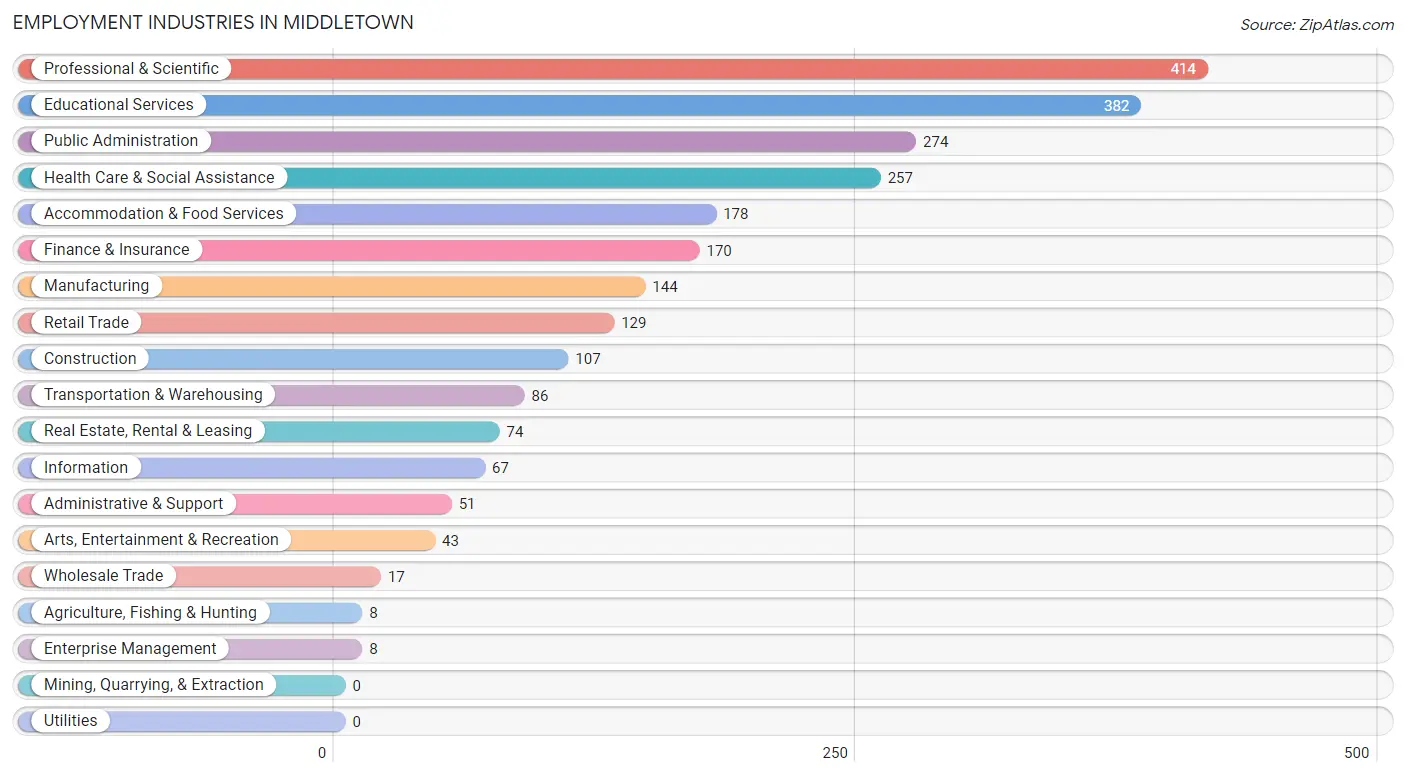
Employment Industries in Middletown
The major employment industries in Middletown include Professional & Scientific (414 | 15.8%), Educational Services (382 | 14.6%), Public Administration (274 | 10.5%), Health Care & Social Assistance (257 | 9.8%), and Accommodation & Food Services (178 | 6.8%).
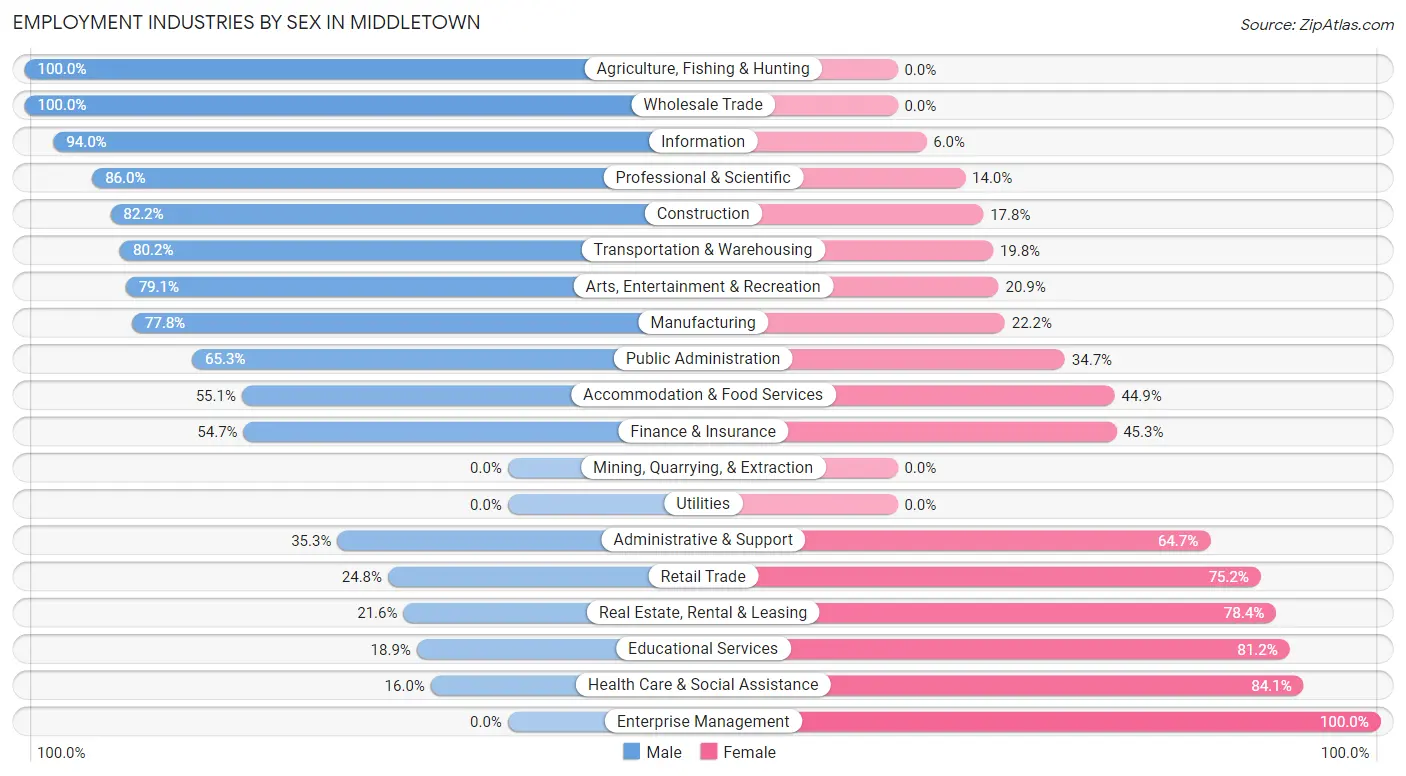
Employment Industries by Sex in Middletown
The Middletown industries that see more men than women are Agriculture, Fishing & Hunting (100.0%), Wholesale Trade (100.0%), and Information (94.0%), whereas the industries that tend to have a higher number of women are Enterprise Management (100.0%), Health Care & Social Assistance (84.1%), and Educational Services (81.1%).
| Industry | Male | Female |
| Agriculture, Fishing & Hunting | 8 (100.0%) | 0 (0.0%) |
| Mining, Quarrying, & Extraction | 0 (0.0%) | 0 (0.0%) |
| Construction | 88 (82.2%) | 19 (17.8%) |
| Manufacturing | 112 (77.8%) | 32 (22.2%) |
| Wholesale Trade | 17 (100.0%) | 0 (0.0%) |
| Retail Trade | 32 (24.8%) | 97 (75.2%) |
| Transportation & Warehousing | 69 (80.2%) | 17 (19.8%) |
| Utilities | 0 (0.0%) | 0 (0.0%) |
| Information | 63 (94.0%) | 4 (6.0%) |
| Finance & Insurance | 93 (54.7%) | 77 (45.3%) |
| Real Estate, Rental & Leasing | 16 (21.6%) | 58 (78.4%) |
| Professional & Scientific | 356 (86.0%) | 58 (14.0%) |
| Enterprise Management | 0 (0.0%) | 8 (100.0%) |
| Administrative & Support | 18 (35.3%) | 33 (64.7%) |
| Educational Services | 72 (18.9%) | 310 (81.1%) |
| Health Care & Social Assistance | 41 (16.0%) | 216 (84.1%) |
| Arts, Entertainment & Recreation | 34 (79.1%) | 9 (20.9%) |
| Accommodation & Food Services | 98 (55.1%) | 80 (44.9%) |
| Public Administration | 179 (65.3%) | 95 (34.7%) |
| Total | 1,360 (51.9%) | 1,258 (48.0%) |
Education in Middletown
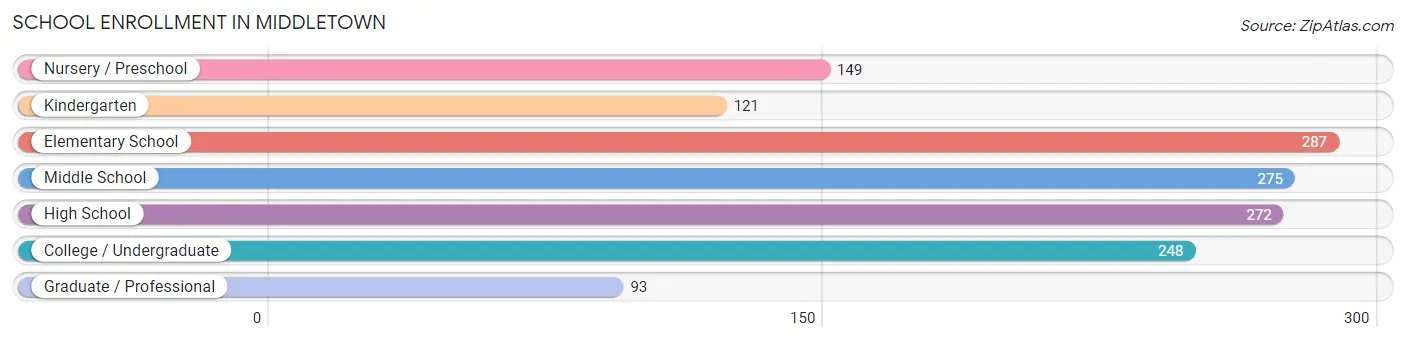
School Enrollment in Middletown
The most common levels of schooling among the 1,445 students in Middletown are elementary school (287 | 19.9%), middle school (275 | 19.0%), and high school (272 | 18.8%).
| School Level | # Students | % Students |
| Nursery / Preschool | 149 | 10.3% |
| Kindergarten | 121 | 8.4% |
| Elementary School | 287 | 19.9% |
| Middle School | 275 | 19.0% |
| High School | 272 | 18.8% |
| College / Undergraduate | 248 | 17.2% |
| Graduate / Professional | 93 | 6.4% |
| Total | 1,445 | 100.0% |
School Enrollment by Age by Funding Source in Middletown
Out of a total of 1,445 students who are enrolled in schools in Middletown, 188 (13.0%) attend a private institution, while the remaining 1,257 (87.0%) are enrolled in public schools. The age group of 25 to 34 year olds has the highest likelihood of being enrolled in private schools, with 38 (79.2% in the age bracket) enrolled. Conversely, the age group of 15 to 17 year olds has the lowest likelihood of being enrolled in a private school, with 205 (100.0% in the age bracket) attending a public institution.
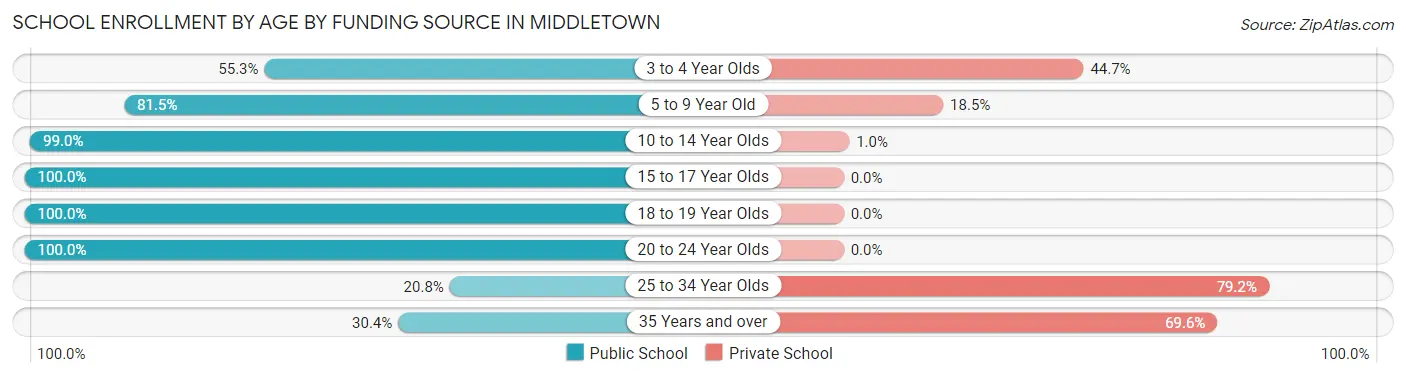
| Age Bracket | Public School | Private School |
| 3 to 4 Year Olds | 57 (55.3%) | 46 (44.7%) |
| 5 to 9 Year Old | 299 (81.5%) | 68 (18.5%) |
| 10 to 14 Year Olds | 386 (99.0%) | 4 (1.0%) |
| 15 to 17 Year Olds | 205 (100.0%) | 0 (0.0%) |
| 18 to 19 Year Olds | 140 (100.0%) | 0 (0.0%) |
| 20 to 24 Year Olds | 146 (100.0%) | 0 (0.0%) |
| 25 to 34 Year Olds | 10 (20.8%) | 38 (79.2%) |
| 35 Years and over | 14 (30.4%) | 32 (69.6%) |
| Total | 1,257 (87.0%) | 188 (13.0%) |
Educational Attainment by Field of Study in Middletown
Business (350 | 15.8%), social sciences (332 | 14.9%), science & technology (252 | 11.4%), education (250 | 11.3%), and computers & mathematics (242 | 10.9%) are the most common fields of study among 2,220 individuals in Middletown who have obtained a bachelor's degree or higher.
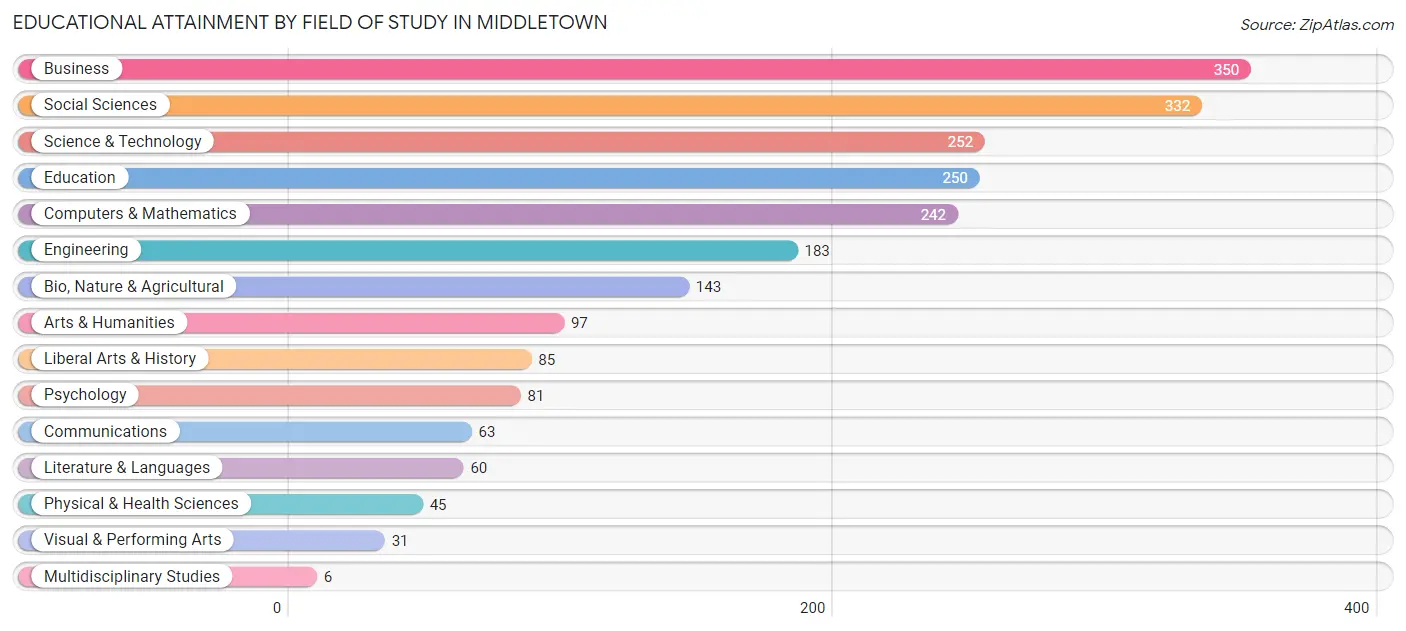
| Field of Study | # Graduates | % Graduates |
| Computers & Mathematics | 242 | 10.9% |
| Bio, Nature & Agricultural | 143 | 6.4% |
| Physical & Health Sciences | 45 | 2.0% |
| Psychology | 81 | 3.6% |
| Social Sciences | 332 | 14.9% |
| Engineering | 183 | 8.2% |
| Multidisciplinary Studies | 6 | 0.3% |
| Science & Technology | 252 | 11.4% |
| Business | 350 | 15.8% |
| Education | 250 | 11.3% |
| Literature & Languages | 60 | 2.7% |
| Liberal Arts & History | 85 | 3.8% |
| Visual & Performing Arts | 31 | 1.4% |
| Communications | 63 | 2.8% |
| Arts & Humanities | 97 | 4.4% |
| Total | 2,220 | 100.0% |
Transportation & Commute in Middletown
Vehicle Availability by Sex in Middletown
The most prevalent vehicle ownership categories in Middletown are males with 2 vehicles (588, accounting for 43.3%) and females with 2 vehicles (459, making up 49.4%).
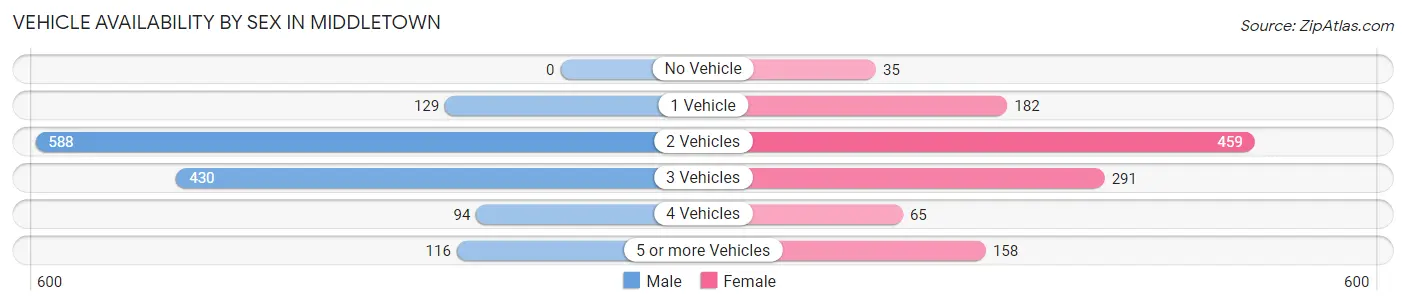
| Vehicles Available | Male | Female |
| No Vehicle | 0 (0.0%) | 35 (2.9%) |
| 1 Vehicle | 129 (9.5%) | 182 (15.3%) |
| 2 Vehicles | 588 (43.3%) | 459 (38.6%) |
| 3 Vehicles | 430 (31.7%) | 291 (24.4%) |
| 4 Vehicles | 94 (6.9%) | 65 (5.5%) |
| 5 or more Vehicles | 116 (8.6%) | 158 (13.3%) |
| Total | 1,357 (100.0%) | 1,190 (100.0%) |
Commute Time in Middletown
The most frequently occuring commute durations in Middletown are 20 to 24 minutes (465 commuters, 24.0%), 60 to 89 minutes (348 commuters, 17.9%), and 15 to 19 minutes (272 commuters, 14.0%).
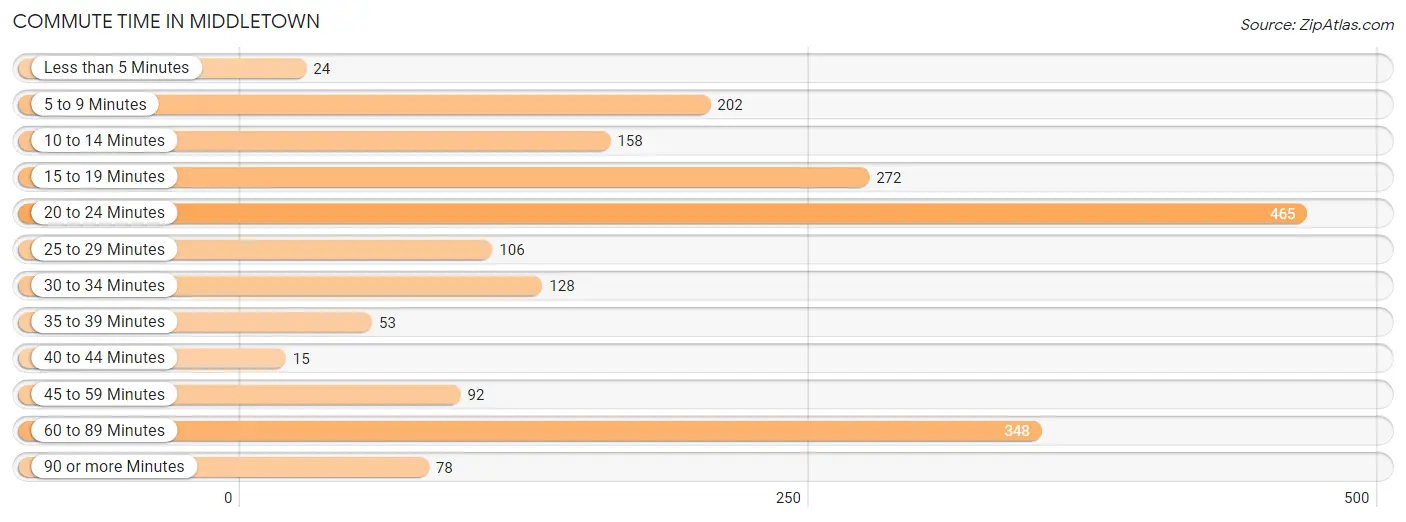
| Commute Time | # Commuters | % Commuters |
| Less than 5 Minutes | 24 | 1.2% |
| 5 to 9 Minutes | 202 | 10.4% |
| 10 to 14 Minutes | 158 | 8.1% |
| 15 to 19 Minutes | 272 | 14.0% |
| 20 to 24 Minutes | 465 | 24.0% |
| 25 to 29 Minutes | 106 | 5.5% |
| 30 to 34 Minutes | 128 | 6.6% |
| 35 to 39 Minutes | 53 | 2.7% |
| 40 to 44 Minutes | 15 | 0.8% |
| 45 to 59 Minutes | 92 | 4.7% |
| 60 to 89 Minutes | 348 | 17.9% |
| 90 or more Minutes | 78 | 4.0% |
Commute Time by Sex in Middletown
The most common commute times in Middletown are 20 to 24 minutes (228 commuters, 23.4%) for males and 20 to 24 minutes (237 commuters, 24.5%) for females.
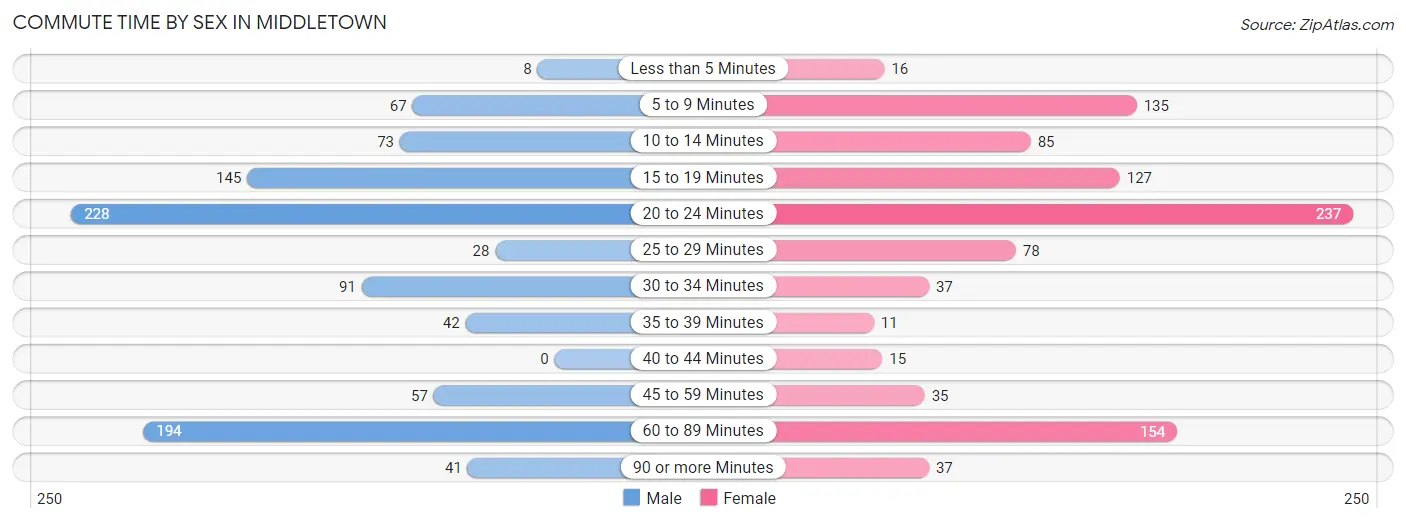
| Commute Time | Male | Female |
| Less than 5 Minutes | 8 (0.8%) | 16 (1.7%) |
| 5 to 9 Minutes | 67 (6.9%) | 135 (14.0%) |
| 10 to 14 Minutes | 73 (7.5%) | 85 (8.8%) |
| 15 to 19 Minutes | 145 (14.9%) | 127 (13.1%) |
| 20 to 24 Minutes | 228 (23.4%) | 237 (24.5%) |
| 25 to 29 Minutes | 28 (2.9%) | 78 (8.1%) |
| 30 to 34 Minutes | 91 (9.3%) | 37 (3.8%) |
| 35 to 39 Minutes | 42 (4.3%) | 11 (1.1%) |
| 40 to 44 Minutes | 0 (0.0%) | 15 (1.5%) |
| 45 to 59 Minutes | 57 (5.9%) | 35 (3.6%) |
| 60 to 89 Minutes | 194 (19.9%) | 154 (15.9%) |
| 90 or more Minutes | 41 (4.2%) | 37 (3.8%) |
Time of Departure to Work by Sex in Middletown
The most frequent times of departure to work in Middletown are 5:30 AM to 5:59 AM (147, 15.1%) for males and 8:00 AM to 8:29 AM (184, 19.0%) for females.
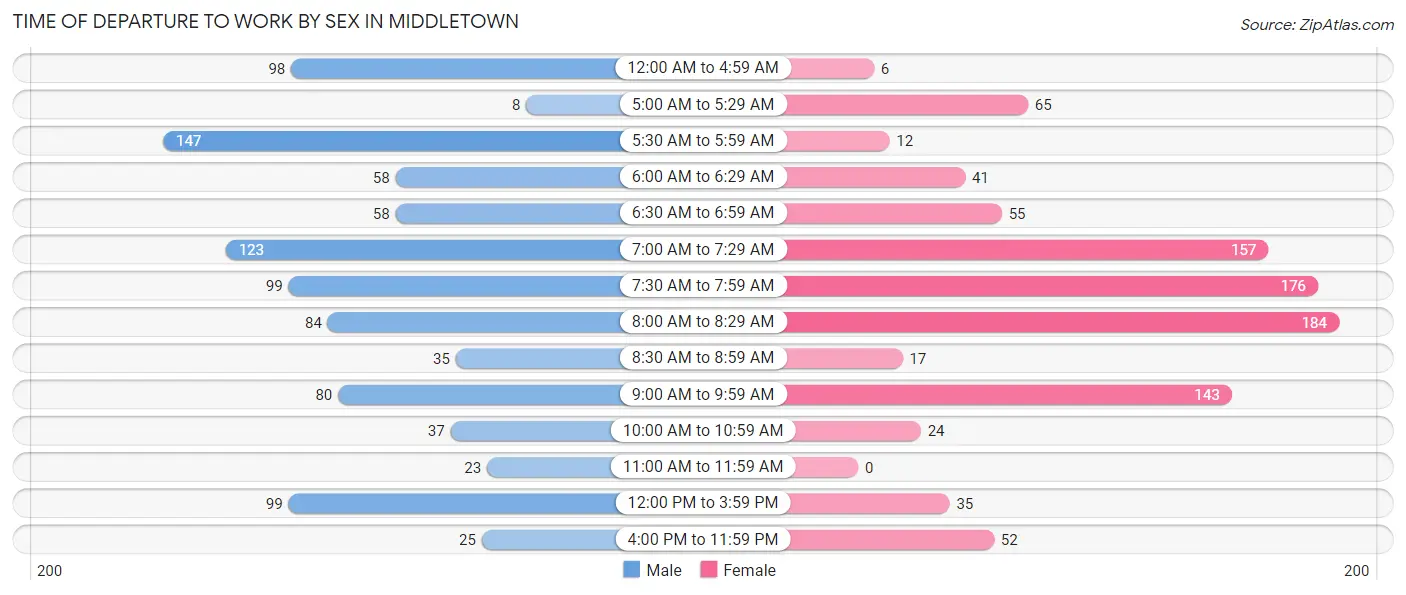
| Time of Departure | Male | Female |
| 12:00 AM to 4:59 AM | 98 (10.1%) | 6 (0.6%) |
| 5:00 AM to 5:29 AM | 8 (0.8%) | 65 (6.7%) |
| 5:30 AM to 5:59 AM | 147 (15.1%) | 12 (1.2%) |
| 6:00 AM to 6:29 AM | 58 (5.9%) | 41 (4.2%) |
| 6:30 AM to 6:59 AM | 58 (5.9%) | 55 (5.7%) |
| 7:00 AM to 7:29 AM | 123 (12.6%) | 157 (16.2%) |
| 7:30 AM to 7:59 AM | 99 (10.2%) | 176 (18.2%) |
| 8:00 AM to 8:29 AM | 84 (8.6%) | 184 (19.0%) |
| 8:30 AM to 8:59 AM | 35 (3.6%) | 17 (1.8%) |
| 9:00 AM to 9:59 AM | 80 (8.2%) | 143 (14.8%) |
| 10:00 AM to 10:59 AM | 37 (3.8%) | 24 (2.5%) |
| 11:00 AM to 11:59 AM | 23 (2.4%) | 0 (0.0%) |
| 12:00 PM to 3:59 PM | 99 (10.2%) | 35 (3.6%) |
| 4:00 PM to 11:59 PM | 25 (2.6%) | 52 (5.4%) |
| Total | 974 (100.0%) | 967 (100.0%) |
Housing Occupancy in Middletown
Occupancy by Ownership in Middletown
Of the total 1,691 dwellings in Middletown, owner-occupied units account for 1,398 (82.7%), while renter-occupied units make up 293 (17.3%).
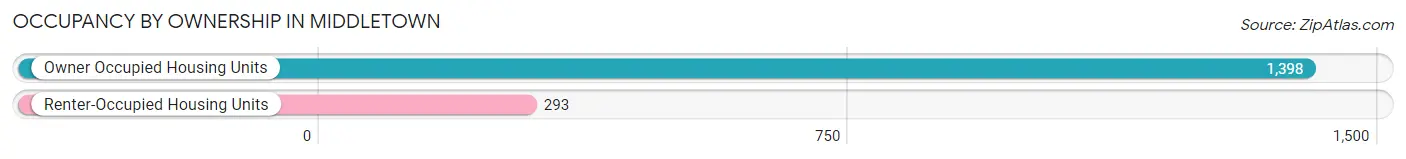
| Occupancy | # Housing Units | % Housing Units |
| Owner Occupied Housing Units | 1,398 | 82.7% |
| Renter-Occupied Housing Units | 293 | 17.3% |
| Total Occupied Housing Units | 1,691 | 100.0% |
Occupancy by Household Size in Middletown
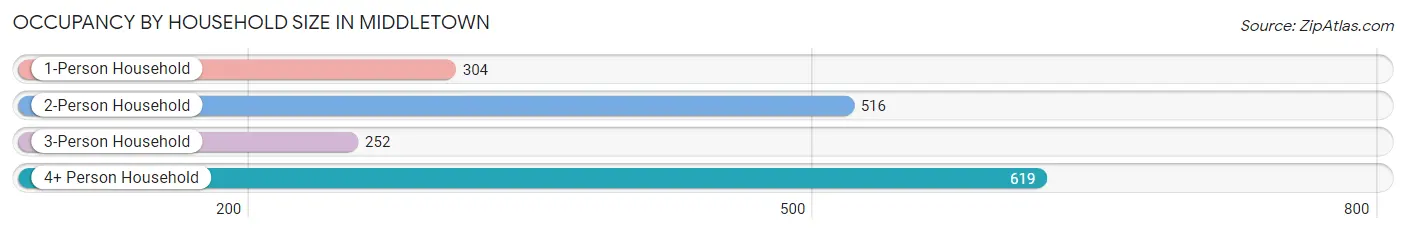
| Household Size | # Housing Units | % Housing Units |
| 1-Person Household | 304 | 18.0% |
| 2-Person Household | 516 | 30.5% |
| 3-Person Household | 252 | 14.9% |
| 4+ Person Household | 619 | 36.6% |
| Total Housing Units | 1,691 | 100.0% |
Occupancy by Ownership by Household Size in Middletown
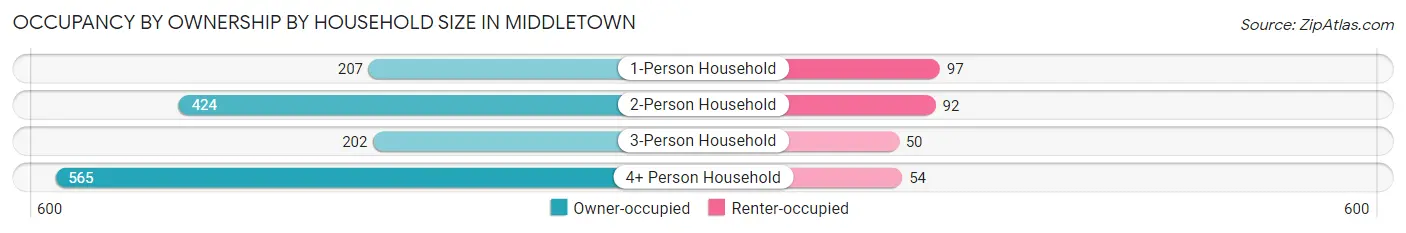
| Household Size | Owner-occupied | Renter-occupied |
| 1-Person Household | 207 (68.1%) | 97 (31.9%) |
| 2-Person Household | 424 (82.2%) | 92 (17.8%) |
| 3-Person Household | 202 (80.2%) | 50 (19.8%) |
| 4+ Person Household | 565 (91.3%) | 54 (8.7%) |
| Total Housing Units | 1,398 (82.7%) | 293 (17.3%) |
Occupancy by Educational Attainment in Middletown
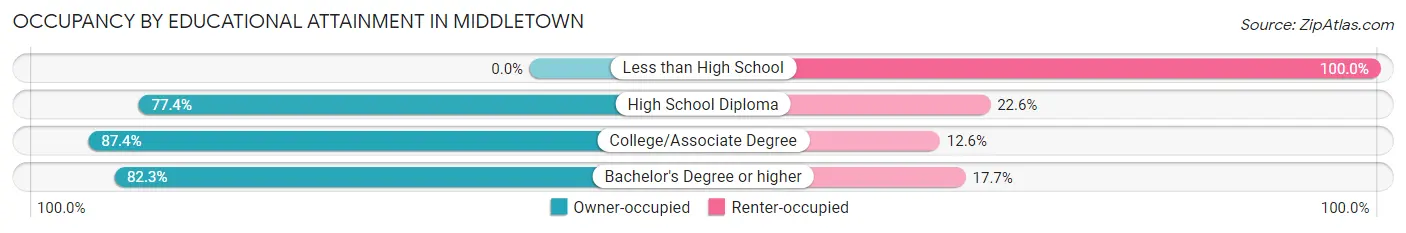
| Household Size | Owner-occupied | Renter-occupied |
| Less than High School | 0 (0.0%) | 3 (100.0%) |
| High School Diploma | 154 (77.4%) | 45 (22.6%) |
| College/Associate Degree | 325 (87.4%) | 47 (12.6%) |
| Bachelor's Degree or higher | 919 (82.3%) | 198 (17.7%) |
Occupancy by Age of Householder in Middletown
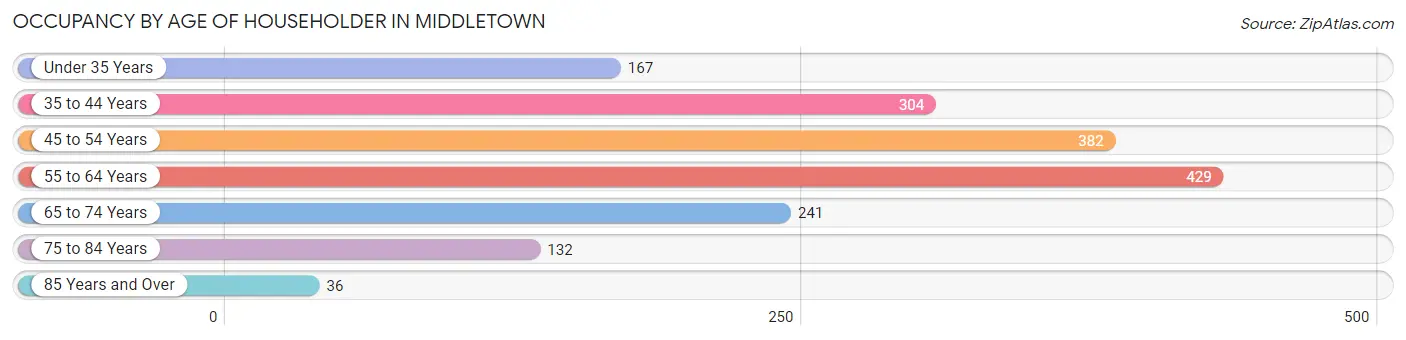
| Age Bracket | # Households | % Households |
| Under 35 Years | 167 | 9.9% |
| 35 to 44 Years | 304 | 18.0% |
| 45 to 54 Years | 382 | 22.6% |
| 55 to 64 Years | 429 | 25.4% |
| 65 to 74 Years | 241 | 14.2% |
| 75 to 84 Years | 132 | 7.8% |
| 85 Years and Over | 36 | 2.1% |
| Total | 1,691 | 100.0% |
Housing Finances in Middletown
Median Income by Occupancy in Middletown
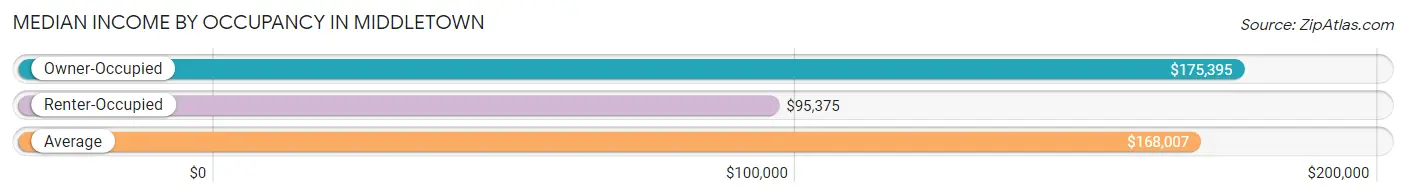
| Occupancy Type | # Households | Median Income |
| Owner-Occupied | 1,398 (82.7%) | $175,395 |
| Renter-Occupied | 293 (17.3%) | $95,375 |
| Average | 1,691 (100.0%) | $168,007 |
Occupancy by Householder Income Bracket in Middletown
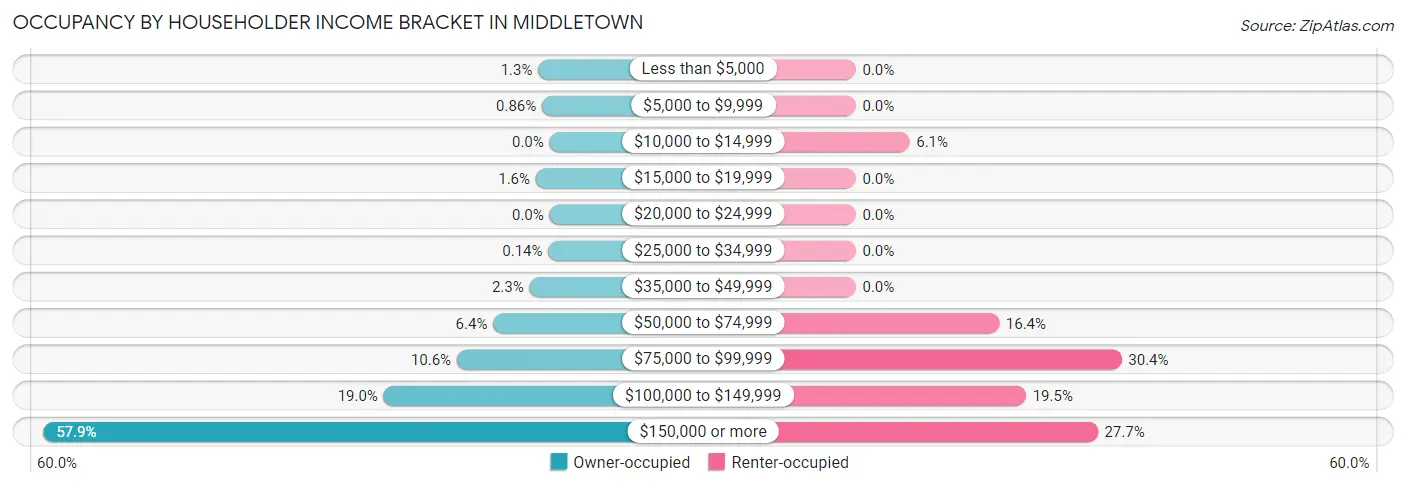
| Income Bracket | Owner-occupied | Renter-occupied |
| Less than $5,000 | 18 (1.3%) | 0 (0.0%) |
| $5,000 to $9,999 | 12 (0.9%) | 0 (0.0%) |
| $10,000 to $14,999 | 0 (0.0%) | 18 (6.1%) |
| $15,000 to $19,999 | 22 (1.6%) | 0 (0.0%) |
| $20,000 to $24,999 | 0 (0.0%) | 0 (0.0%) |
| $25,000 to $34,999 | 2 (0.1%) | 0 (0.0%) |
| $35,000 to $49,999 | 32 (2.3%) | 0 (0.0%) |
| $50,000 to $74,999 | 90 (6.4%) | 48 (16.4%) |
| $75,000 to $99,999 | 148 (10.6%) | 89 (30.4%) |
| $100,000 to $149,999 | 265 (19.0%) | 57 (19.5%) |
| $150,000 or more | 809 (57.9%) | 81 (27.7%) |
| Total | 1,398 (100.0%) | 293 (100.0%) |
Monthly Housing Cost Tiers in Middletown
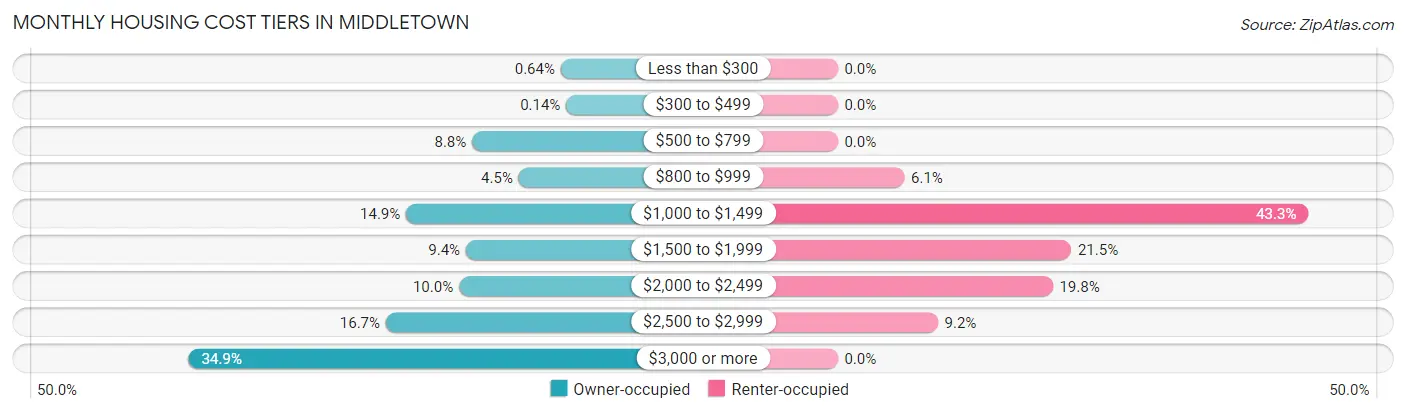
| Monthly Cost | Owner-occupied | Renter-occupied |
| Less than $300 | 9 (0.6%) | 0 (0.0%) |
| $300 to $499 | 2 (0.1%) | 0 (0.0%) |
| $500 to $799 | 123 (8.8%) | 0 (0.0%) |
| $800 to $999 | 63 (4.5%) | 18 (6.1%) |
| $1,000 to $1,499 | 208 (14.9%) | 127 (43.3%) |
| $1,500 to $1,999 | 131 (9.4%) | 63 (21.5%) |
| $2,000 to $2,499 | 140 (10.0%) | 58 (19.8%) |
| $2,500 to $2,999 | 234 (16.7%) | 27 (9.2%) |
| $3,000 or more | 488 (34.9%) | 0 (0.0%) |
| Total | 1,398 (100.0%) | 293 (100.0%) |
Physical Housing Characteristics in Middletown
Housing Structures in Middletown
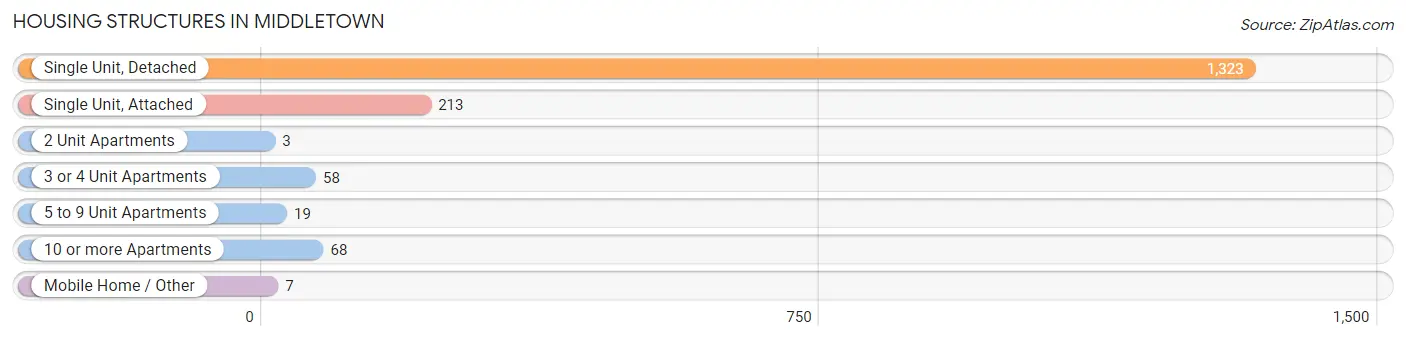
| Structure Type | # Housing Units | % Housing Units |
| Single Unit, Detached | 1,323 | 78.2% |
| Single Unit, Attached | 213 | 12.6% |
| 2 Unit Apartments | 3 | 0.2% |
| 3 or 4 Unit Apartments | 58 | 3.4% |
| 5 to 9 Unit Apartments | 19 | 1.1% |
| 10 or more Apartments | 68 | 4.0% |
| Mobile Home / Other | 7 | 0.4% |
| Total | 1,691 | 100.0% |
Housing Structures by Occupancy in Middletown
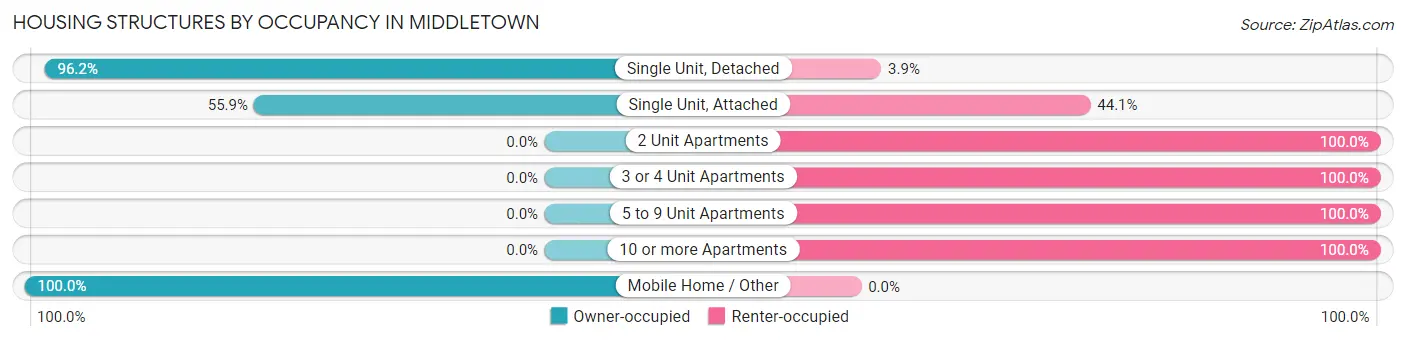
| Structure Type | Owner-occupied | Renter-occupied |
| Single Unit, Detached | 1,272 (96.2%) | 51 (3.8%) |
| Single Unit, Attached | 119 (55.9%) | 94 (44.1%) |
| 2 Unit Apartments | 0 (0.0%) | 3 (100.0%) |
| 3 or 4 Unit Apartments | 0 (0.0%) | 58 (100.0%) |
| 5 to 9 Unit Apartments | 0 (0.0%) | 19 (100.0%) |
| 10 or more Apartments | 0 (0.0%) | 68 (100.0%) |
| Mobile Home / Other | 7 (100.0%) | 0 (0.0%) |
| Total | 1,398 (82.7%) | 293 (17.3%) |
Housing Structures by Number of Rooms in Middletown
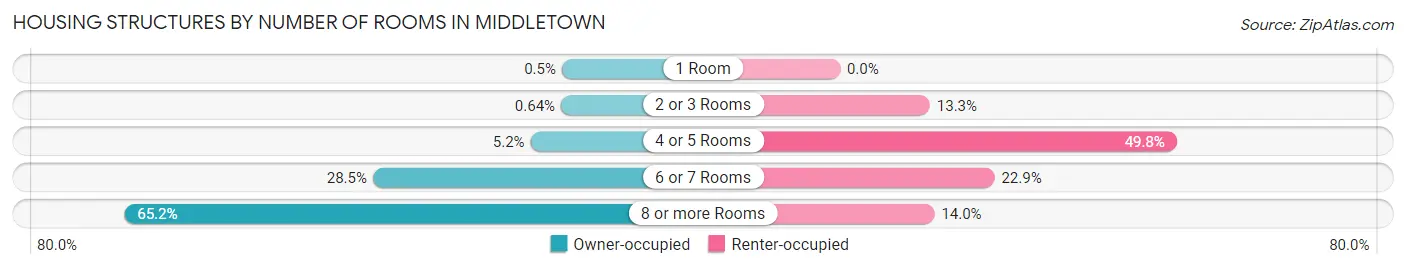
| Number of Rooms | Owner-occupied | Renter-occupied |
| 1 Room | 7 (0.5%) | 0 (0.0%) |
| 2 or 3 Rooms | 9 (0.6%) | 39 (13.3%) |
| 4 or 5 Rooms | 72 (5.1%) | 146 (49.8%) |
| 6 or 7 Rooms | 398 (28.5%) | 67 (22.9%) |
| 8 or more Rooms | 912 (65.2%) | 41 (14.0%) |
| Total | 1,398 (100.0%) | 293 (100.0%) |
Housing Structure by Heating Type in Middletown
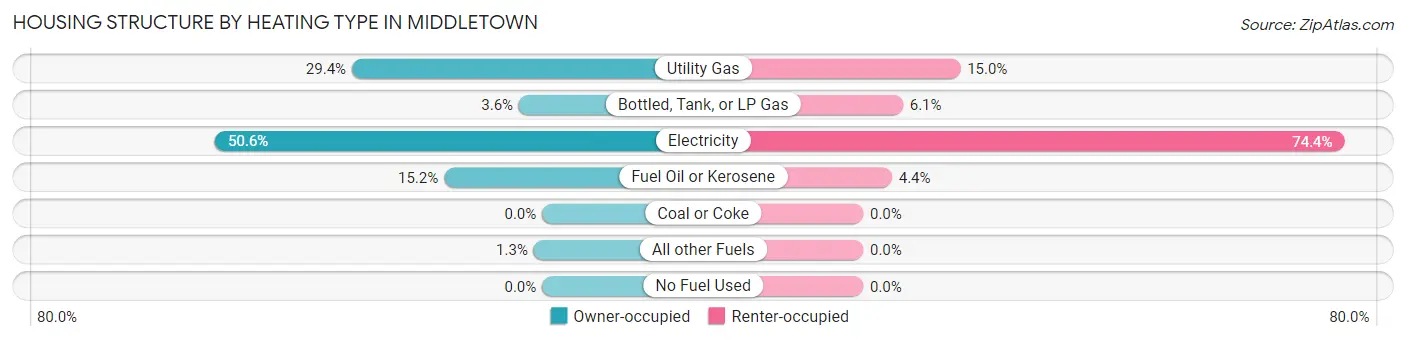
| Heating Type | Owner-occupied | Renter-occupied |
| Utility Gas | 411 (29.4%) | 44 (15.0%) |
| Bottled, Tank, or LP Gas | 50 (3.6%) | 18 (6.1%) |
| Electricity | 707 (50.6%) | 218 (74.4%) |
| Fuel Oil or Kerosene | 212 (15.2%) | 13 (4.4%) |
| Coal or Coke | 0 (0.0%) | 0 (0.0%) |
| All other Fuels | 18 (1.3%) | 0 (0.0%) |
| No Fuel Used | 0 (0.0%) | 0 (0.0%) |
| Total | 1,398 (100.0%) | 293 (100.0%) |
Household Vehicle Usage in Middletown
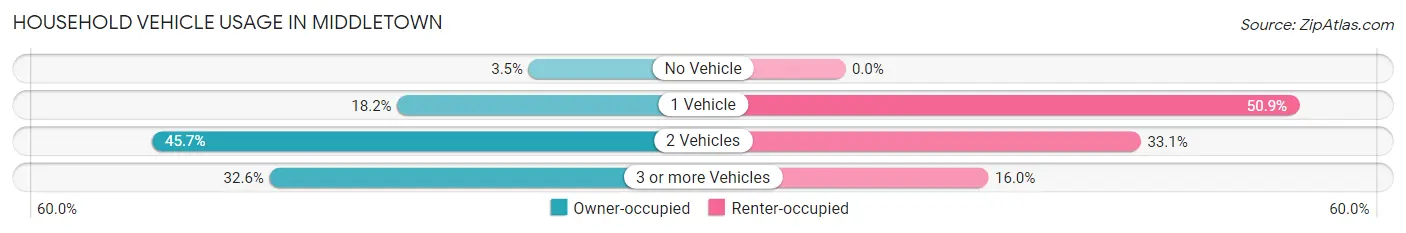
| Vehicles per Household | Owner-occupied | Renter-occupied |
| No Vehicle | 49 (3.5%) | 0 (0.0%) |
| 1 Vehicle | 255 (18.2%) | 149 (50.8%) |
| 2 Vehicles | 639 (45.7%) | 97 (33.1%) |
| 3 or more Vehicles | 455 (32.6%) | 47 (16.0%) |
| Total | 1,398 (100.0%) | 293 (100.0%) |
Real Estate & Mortgages in Middletown
Real Estate and Mortgage Overview in Middletown
| Characteristic | Without Mortgage | With Mortgage |
| Housing Units | 272 | 1,126 |
| Median Property Value | $456,100 | $537,200 |
| Median Household Income | $94,375 | $716 |
| Monthly Housing Costs | $856 | $488 |
| Real Estate Taxes | $5,210 | $0 |
Property Value by Mortgage Status in Middletown
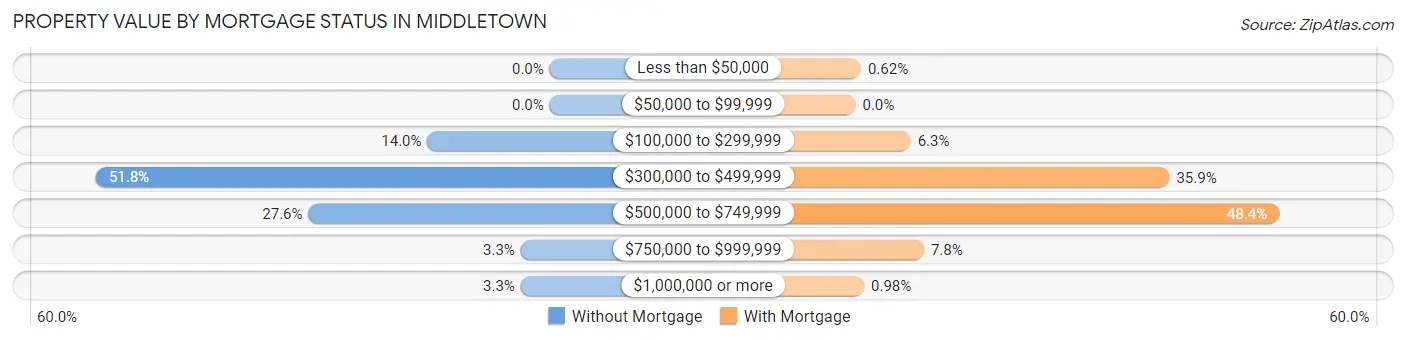
| Property Value | Without Mortgage | With Mortgage |
| Less than $50,000 | 0 (0.0%) | 7 (0.6%) |
| $50,000 to $99,999 | 0 (0.0%) | 0 (0.0%) |
| $100,000 to $299,999 | 38 (14.0%) | 71 (6.3%) |
| $300,000 to $499,999 | 141 (51.8%) | 404 (35.9%) |
| $500,000 to $749,999 | 75 (27.6%) | 545 (48.4%) |
| $750,000 to $999,999 | 9 (3.3%) | 88 (7.8%) |
| $1,000,000 or more | 9 (3.3%) | 11 (1.0%) |
| Total | 272 (100.0%) | 1,126 (100.0%) |
Household Income by Mortgage Status in Middletown
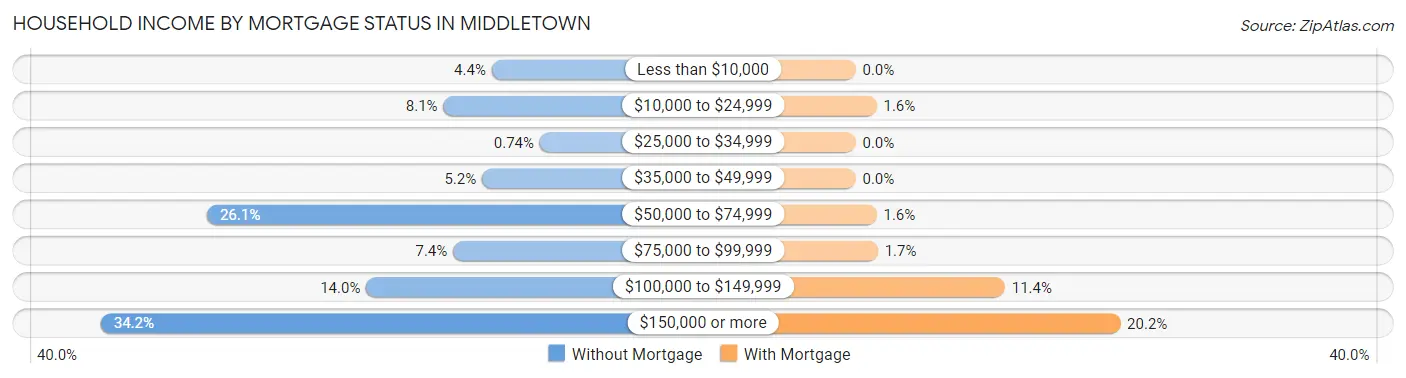
| Household Income | Without Mortgage | With Mortgage |
| Less than $10,000 | 12 (4.4%) | 0 (0.0%) |
| $10,000 to $24,999 | 22 (8.1%) | 18 (1.6%) |
| $25,000 to $34,999 | 2 (0.7%) | 0 (0.0%) |
| $35,000 to $49,999 | 14 (5.1%) | 0 (0.0%) |
| $50,000 to $74,999 | 71 (26.1%) | 18 (1.6%) |
| $75,000 to $99,999 | 20 (7.3%) | 19 (1.7%) |
| $100,000 to $149,999 | 38 (14.0%) | 128 (11.4%) |
| $150,000 or more | 93 (34.2%) | 227 (20.2%) |
| Total | 272 (100.0%) | 1,126 (100.0%) |
Property Value to Household Income Ratio in Middletown
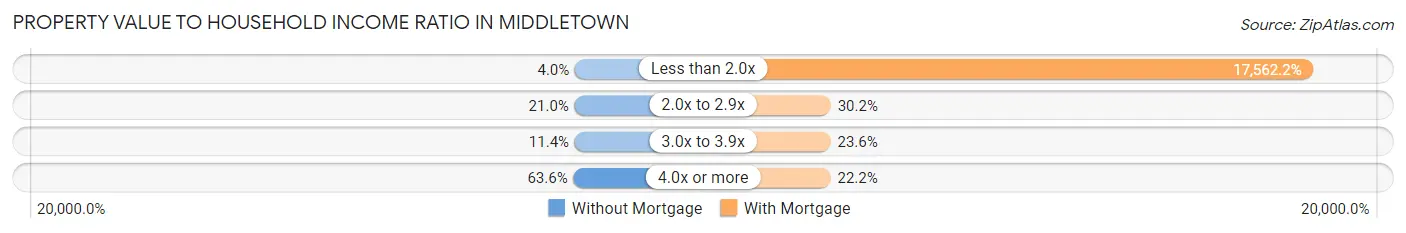
| Value-to-Income Ratio | Without Mortgage | With Mortgage |
| Less than 2.0x | 11 (4.0%) | 197,750 (17,562.2%) |
| 2.0x to 2.9x | 57 (21.0%) | 340 (30.2%) |
| 3.0x to 3.9x | 31 (11.4%) | 266 (23.6%) |
| 4.0x or more | 173 (63.6%) | 250 (22.2%) |
| Total | 272 (100.0%) | 1,126 (100.0%) |
Real Estate Taxes by Mortgage Status in Middletown
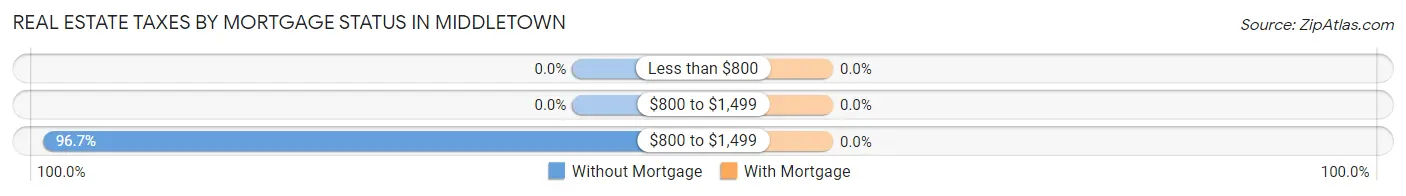
| Property Taxes | Without Mortgage | With Mortgage |
| Less than $800 | 0 (0.0%) | 0 (0.0%) |
| $800 to $1,499 | 0 (0.0%) | 0 (0.0%) |
| $800 to $1,499 | 263 (96.7%) | 0 (0.0%) |
| Total | 272 (100.0%) | 1,126 (100.0%) |
Health & Disability in Middletown
Health Insurance Coverage by Age in Middletown
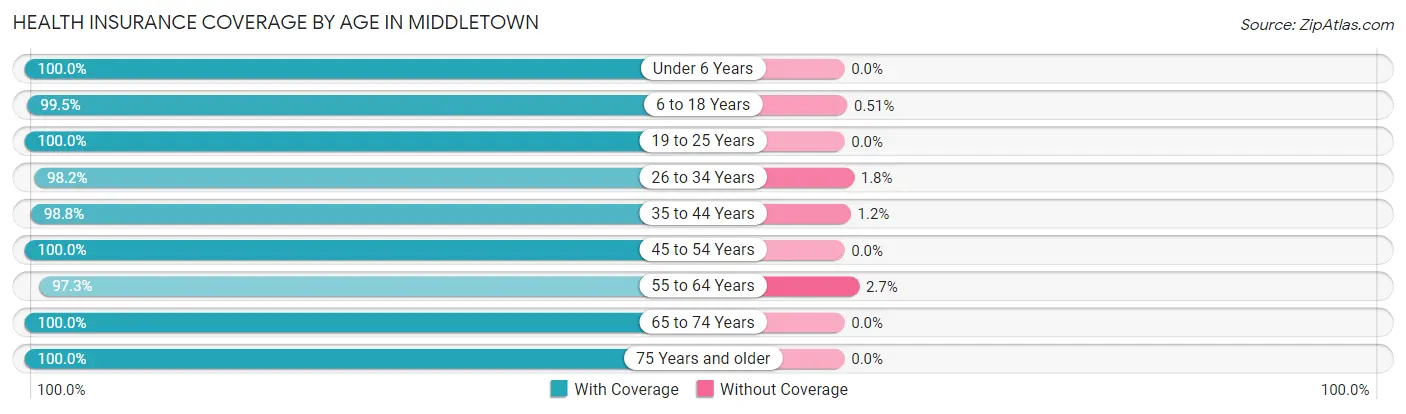
| Age Bracket | With Coverage | Without Coverage |
| Under 6 Years | 354 (100.0%) | 0 (0.0%) |
| 6 to 18 Years | 974 (99.5%) | 5 (0.5%) |
| 19 to 25 Years | 414 (100.0%) | 0 (0.0%) |
| 26 to 34 Years | 333 (98.2%) | 6 (1.8%) |
| 35 to 44 Years | 592 (98.8%) | 7 (1.2%) |
| 45 to 54 Years | 791 (100.0%) | 0 (0.0%) |
| 55 to 64 Years | 677 (97.3%) | 19 (2.7%) |
| 65 to 74 Years | 460 (100.0%) | 0 (0.0%) |
| 75 Years and older | 331 (100.0%) | 0 (0.0%) |
| Total | 4,926 (99.3%) | 37 (0.7%) |
Health Insurance Coverage by Citizenship Status in Middletown
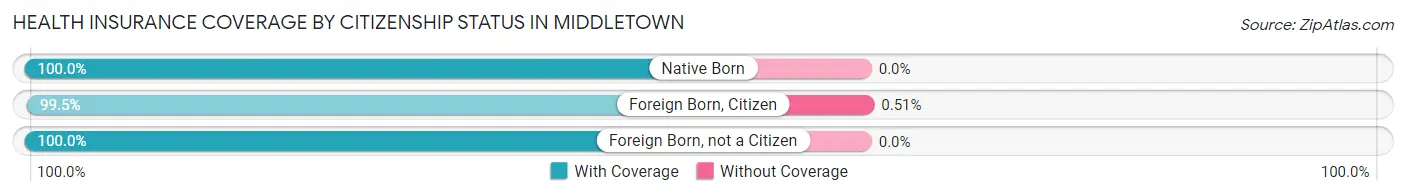
| Citizenship Status | With Coverage | Without Coverage |
| Native Born | 354 (100.0%) | 0 (0.0%) |
| Foreign Born, Citizen | 974 (99.5%) | 5 (0.5%) |
| Foreign Born, not a Citizen | 414 (100.0%) | 0 (0.0%) |
Health Insurance Coverage by Household Income in Middletown
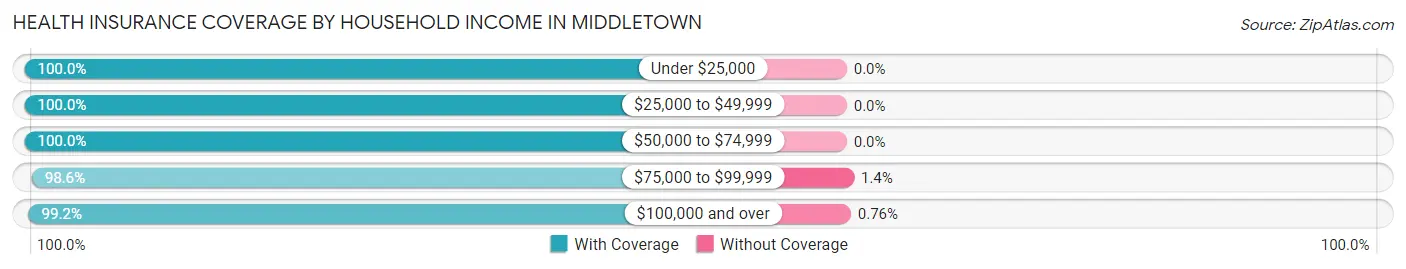
| Household Income | With Coverage | Without Coverage |
| Under $25,000 | 70 (100.0%) | 0 (0.0%) |
| $25,000 to $49,999 | 88 (100.0%) | 0 (0.0%) |
| $50,000 to $74,999 | 322 (100.0%) | 0 (0.0%) |
| $75,000 to $99,999 | 508 (98.6%) | 7 (1.4%) |
| $100,000 and over | 3,938 (99.2%) | 30 (0.8%) |
Public vs Private Health Insurance Coverage by Age in Middletown
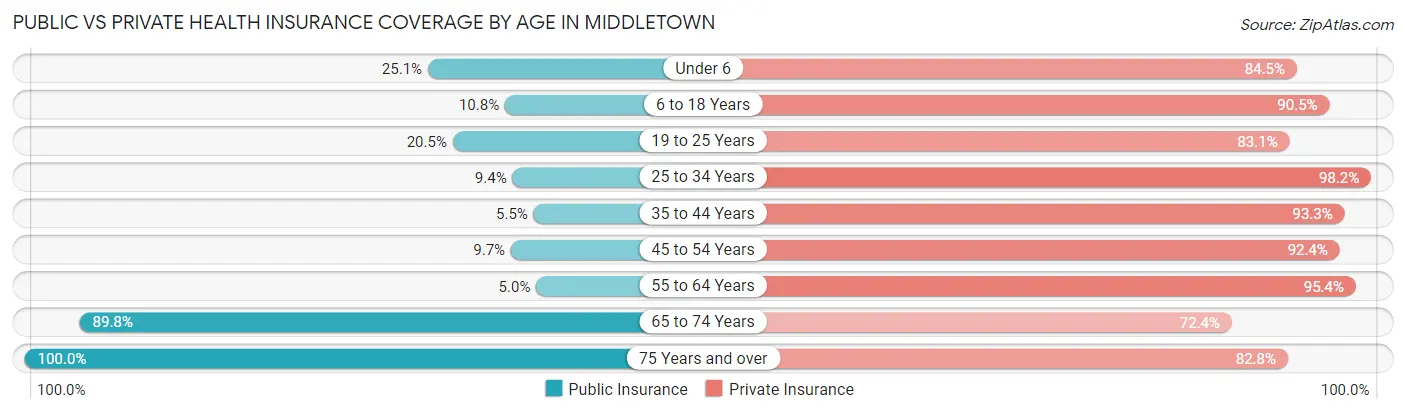
| Age Bracket | Public Insurance | Private Insurance |
| Under 6 | 89 (25.1%) | 299 (84.5%) |
| 6 to 18 Years | 106 (10.8%) | 886 (90.5%) |
| 19 to 25 Years | 85 (20.5%) | 344 (83.1%) |
| 25 to 34 Years | 32 (9.4%) | 333 (98.2%) |
| 35 to 44 Years | 33 (5.5%) | 559 (93.3%) |
| 45 to 54 Years | 77 (9.7%) | 731 (92.4%) |
| 55 to 64 Years | 35 (5.0%) | 664 (95.4%) |
| 65 to 74 Years | 413 (89.8%) | 333 (72.4%) |
| 75 Years and over | 331 (100.0%) | 274 (82.8%) |
| Total | 1,201 (24.2%) | 4,423 (89.1%) |
Disability Status by Sex by Age in Middletown
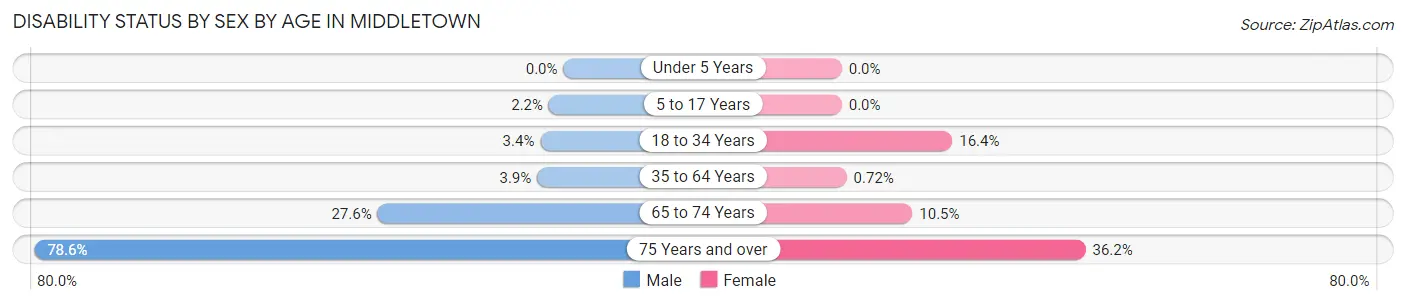
| Age Bracket | Male | Female |
| Under 5 Years | 0 (0.0%) | 0 (0.0%) |
| 5 to 17 Years | 9 (2.1%) | 0 (0.0%) |
| 18 to 34 Years | 15 (3.4%) | 63 (16.4%) |
| 35 to 64 Years | 38 (3.9%) | 8 (0.7%) |
| 65 to 74 Years | 69 (27.6%) | 22 (10.5%) |
| 75 Years and over | 132 (78.6%) | 59 (36.2%) |
Disability Class by Sex by Age in Middletown
Disability Class: Hearing Difficulty
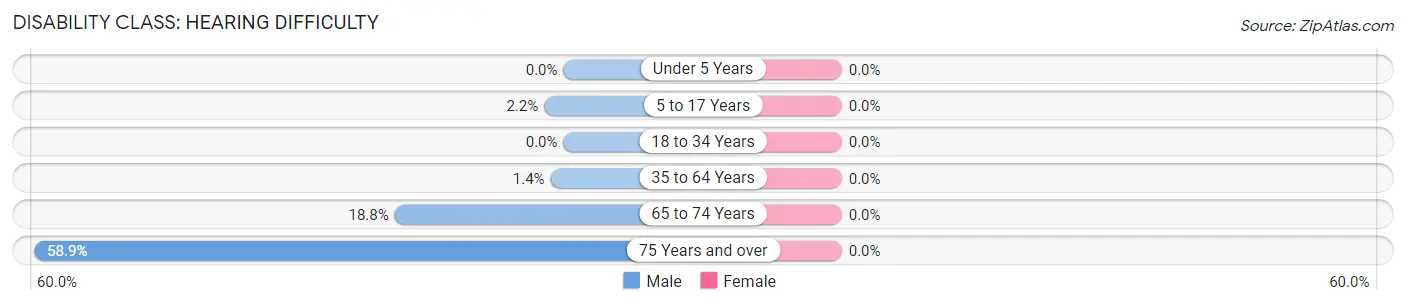
| Age Bracket | Male | Female |
| Under 5 Years | 0 (0.0%) | 0 (0.0%) |
| 5 to 17 Years | 9 (2.1%) | 0 (0.0%) |
| 18 to 34 Years | 0 (0.0%) | 0 (0.0%) |
| 35 to 64 Years | 14 (1.4%) | 0 (0.0%) |
| 65 to 74 Years | 47 (18.8%) | 0 (0.0%) |
| 75 Years and over | 99 (58.9%) | 0 (0.0%) |
Disability Class: Vision Difficulty
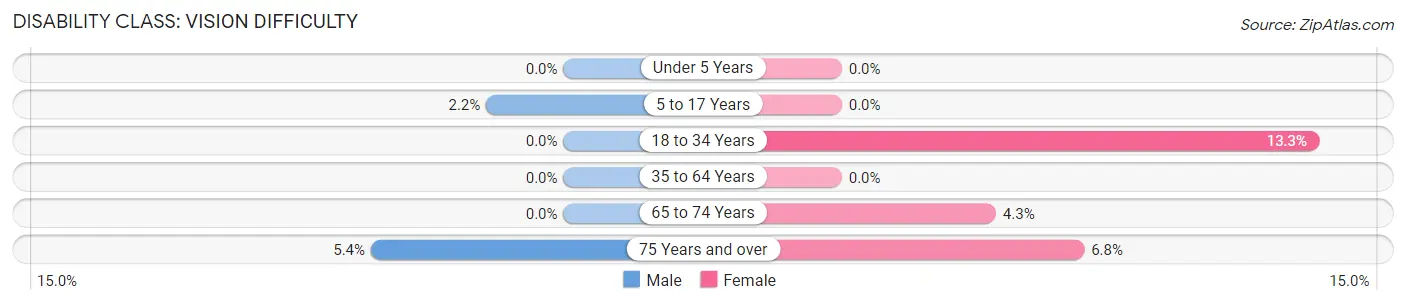
| Age Bracket | Male | Female |
| Under 5 Years | 0 (0.0%) | 0 (0.0%) |
| 5 to 17 Years | 9 (2.1%) | 0 (0.0%) |
| 18 to 34 Years | 0 (0.0%) | 51 (13.3%) |
| 35 to 64 Years | 0 (0.0%) | 0 (0.0%) |
| 65 to 74 Years | 0 (0.0%) | 9 (4.3%) |
| 75 Years and over | 9 (5.4%) | 11 (6.8%) |
Disability Class: Cognitive Difficulty
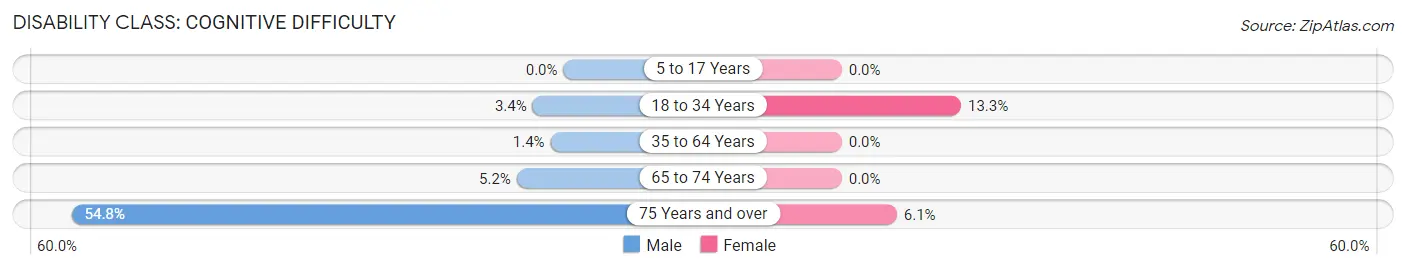
| Age Bracket | Male | Female |
| 5 to 17 Years | 0 (0.0%) | 0 (0.0%) |
| 18 to 34 Years | 15 (3.4%) | 51 (13.3%) |
| 35 to 64 Years | 14 (1.4%) | 0 (0.0%) |
| 65 to 74 Years | 13 (5.2%) | 0 (0.0%) |
| 75 Years and over | 92 (54.8%) | 10 (6.1%) |
Disability Class: Ambulatory Difficulty
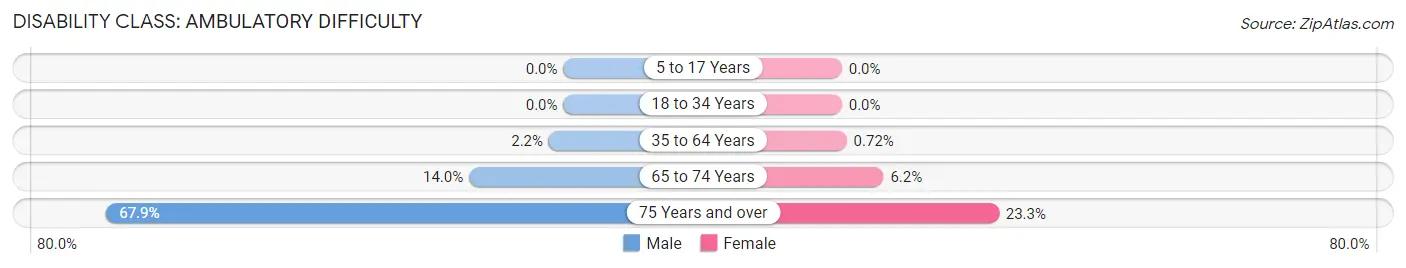
| Age Bracket | Male | Female |
| 5 to 17 Years | 0 (0.0%) | 0 (0.0%) |
| 18 to 34 Years | 0 (0.0%) | 0 (0.0%) |
| 35 to 64 Years | 21 (2.1%) | 8 (0.7%) |
| 65 to 74 Years | 35 (14.0%) | 13 (6.2%) |
| 75 Years and over | 114 (67.9%) | 38 (23.3%) |
Disability Class: Self-Care Difficulty
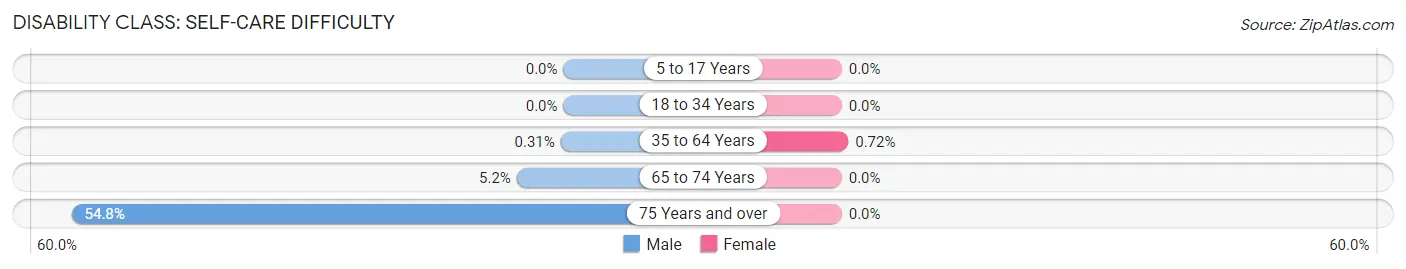
| Age Bracket | Male | Female |
| 5 to 17 Years | 0 (0.0%) | 0 (0.0%) |
| 18 to 34 Years | 0 (0.0%) | 0 (0.0%) |
| 35 to 64 Years | 3 (0.3%) | 8 (0.7%) |
| 65 to 74 Years | 13 (5.2%) | 0 (0.0%) |
| 75 Years and over | 92 (54.8%) | 0 (0.0%) |
Technology Access in Middletown
Computing Device Access in Middletown
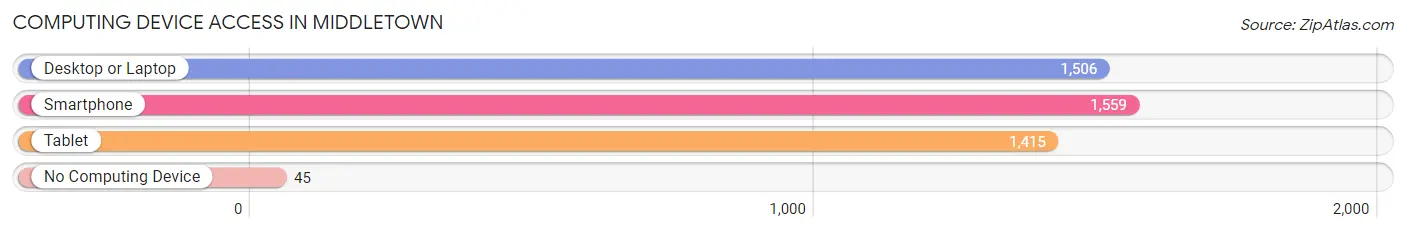
| Device Type | # Households | % Households |
| Desktop or Laptop | 1,506 | 89.1% |
| Smartphone | 1,559 | 92.2% |
| Tablet | 1,415 | 83.7% |
| No Computing Device | 45 | 2.7% |
| Total | 1,691 | 100.0% |
Internet Access in Middletown
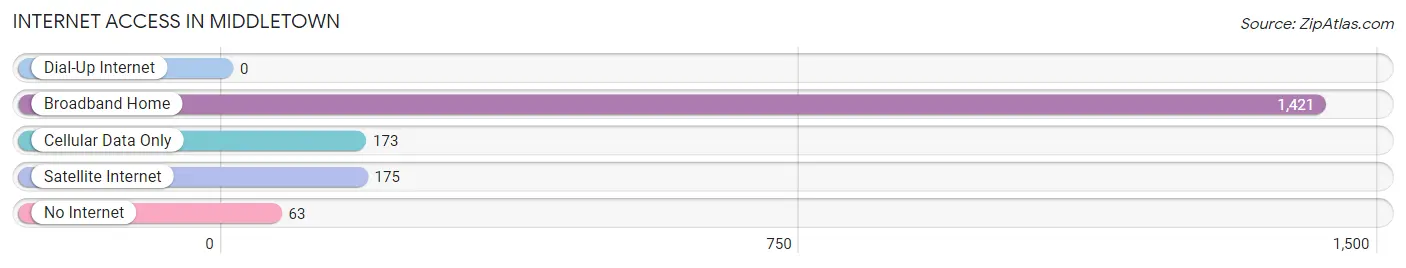
| Internet Type | # Households | % Households |
| Dial-Up Internet | 0 | 0.0% |
| Broadband Home | 1,421 | 84.0% |
| Cellular Data Only | 173 | 10.2% |
| Satellite Internet | 175 | 10.3% |
| No Internet | 63 | 3.7% |
| Total | 1,691 | 100.0% |
Middletown Summary
Middletown, Maryland is a small town located in Frederick County, Maryland. It is situated in the northern part of the state, about 30 miles northwest of Washington, D.C. The town has a population of about 4,000 people and is part of the Washington-Arlington-Alexandria metropolitan area.
History
Middletown was founded in 1797 by a group of German immigrants who had settled in the area. The town was named after the middle of three fords on the nearby Monocacy River. The town was incorporated in 1831 and was the first incorporated town in Frederick County.
In the 19th century, Middletown was a thriving agricultural community. The town was known for its production of wheat, corn, and other grains. The town also had a thriving brick-making industry.
In the 20th century, Middletown began to experience a decline in its agricultural industry. The town began to focus more on its tourism industry, as well as its retail and service industries.
Geography
Middletown is located in the northern part of Frederick County, Maryland. The town is situated in the Catoctin Valley, which is part of the Appalachian Mountains. The town is located about 30 miles northwest of Washington, D.C.
The town is bordered by the Monocacy River to the east and the Catoctin Mountains to the west. The town is also located near the Appalachian Trail, which runs through the Catoctin Valley.
Economy
Middletown’s economy is largely based on tourism and retail. The town is home to several wineries, as well as a number of antique shops and other retail stores. The town also has a number of restaurants and cafes.
The town is also home to a number of small businesses, including a number of manufacturing companies. The town is also home to a number of government offices, including the Frederick County Sheriff’s Office and the Middletown Police Department.
Demographics
As of the 2010 census, the population of Middletown was 4,019. The town has a median household income of $60,945 and a median family income of $71,945. The town has a population that is predominantly white (90.2%), with a small percentage of African Americans (4.2%) and Hispanics (2.7%).
Middletown is a small town with a rich history and a vibrant economy. The town is home to a number of wineries, antique shops, and other retail stores. The town is also home to a number of government offices and small businesses. The town has a population that is predominantly white, with a small percentage of African Americans and Hispanics.
Common Questions
What is Per Capita Income in Middletown?
Per Capita income in Middletown is $63,154.
What is the Median Family Income in Middletown?
Median Family Income in Middletown is $192,454.
What is the Median Household income in Middletown?
Median Household Income in Middletown is $168,007.
What is Income or Wage Gap in Middletown?
Income or Wage Gap in Middletown is 36.8%.
Women in Middletown earn 63.2 cents for every dollar earned by a man.
What is Inequality or Gini Index in Middletown?
Inequality or Gini Index in Middletown is 0.36.
What is the Total Population of Middletown?
Total Population of Middletown is 4,978.
What is the Total Male Population of Middletown?
Total Male Population of Middletown is 2,405.
What is the Total Female Population of Middletown?
Total Female Population of Middletown is 2,573.
What is the Ratio of Males per 100 Females in Middletown?
There are 93.47 Males per 100 Females in Middletown.
What is the Ratio of Females per 100 Males in Middletown?
There are 106.99 Females per 100 Males in Middletown.
What is the Median Population Age in Middletown?
Median Population Age in Middletown is 41.3 Years.
What is the Average Family Size in Middletown
Average Family Size in Middletown is 3.3 People.
What is the Average Household Size in Middletown
Average Household Size in Middletown is 2.9 People.
How Large is the Labor Force in Middletown?
There are 2,692 People in the Labor Forcein in Middletown.
What is the Percentage of People in the Labor Force in Middletown?
70.1% of People are in the Labor Force in Middletown.
What is the Unemployment Rate in Middletown?
Unemployment Rate in Middletown is 2.2%.