Ballenger Creek, MD Map & Demographics
Ballenger Creek Map
Ballenger Creek Overview
$46,058
PER CAPITA INCOME
$119,706
AVG FAMILY INCOME
$105,981
AVG HOUSEHOLD INCOME
26.1%
WAGE / INCOME GAP [ % ]
73.9¢/ $1
WAGE / INCOME GAP [ $ ]
0.39
INEQUALITY / GINI INDEX
24,325
TOTAL POPULATION
11,687
MALE POPULATION
12,638
FEMALE POPULATION
92.48
MALES / 100 FEMALES
108.14
FEMALES / 100 MALES
35.4
MEDIAN AGE
3.1
AVG FAMILY SIZE
2.6
AVG HOUSEHOLD SIZE
13,476
LABOR FORCE [ PEOPLE ]
71.4%
PERCENT IN LABOR FORCE
3.5%
UNEMPLOYMENT RATE
Income in Ballenger Creek
Income Overview in Ballenger Creek
Per Capita Income in Ballenger Creek is $46,058, while median incomes of families and households are $119,706 and $105,981 respectively.
| Characteristic | Number | Measure |
| Per Capita Income | 24,325 | $46,058 |
| Median Family Income | 6,148 | $119,706 |
| Mean Family Income | 6,148 | $131,060 |
| Median Household Income | 9,279 | $105,981 |
| Mean Household Income | 9,279 | $121,916 |
| Income Deficit | 6,148 | $0 |
| Wage / Income Gap (%) | 24,325 | 26.08% |
| Wage / Income Gap ($) | 24,325 | 73.92¢ per $1 |
| Gini / Inequality Index | 24,325 | 0.39 |
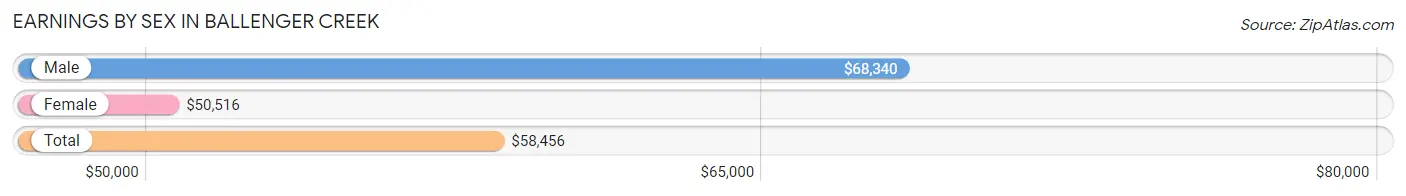
Earnings by Sex in Ballenger Creek
Average Earnings in Ballenger Creek are $58,456, $68,340 for men and $50,516 for women, a difference of 26.1%.
| Sex | Number | Average Earnings |
| Male | 7,288 (51.4%) | $68,340 |
| Female | 6,883 (48.6%) | $50,516 |
| Total | 14,171 (100.0%) | $58,456 |
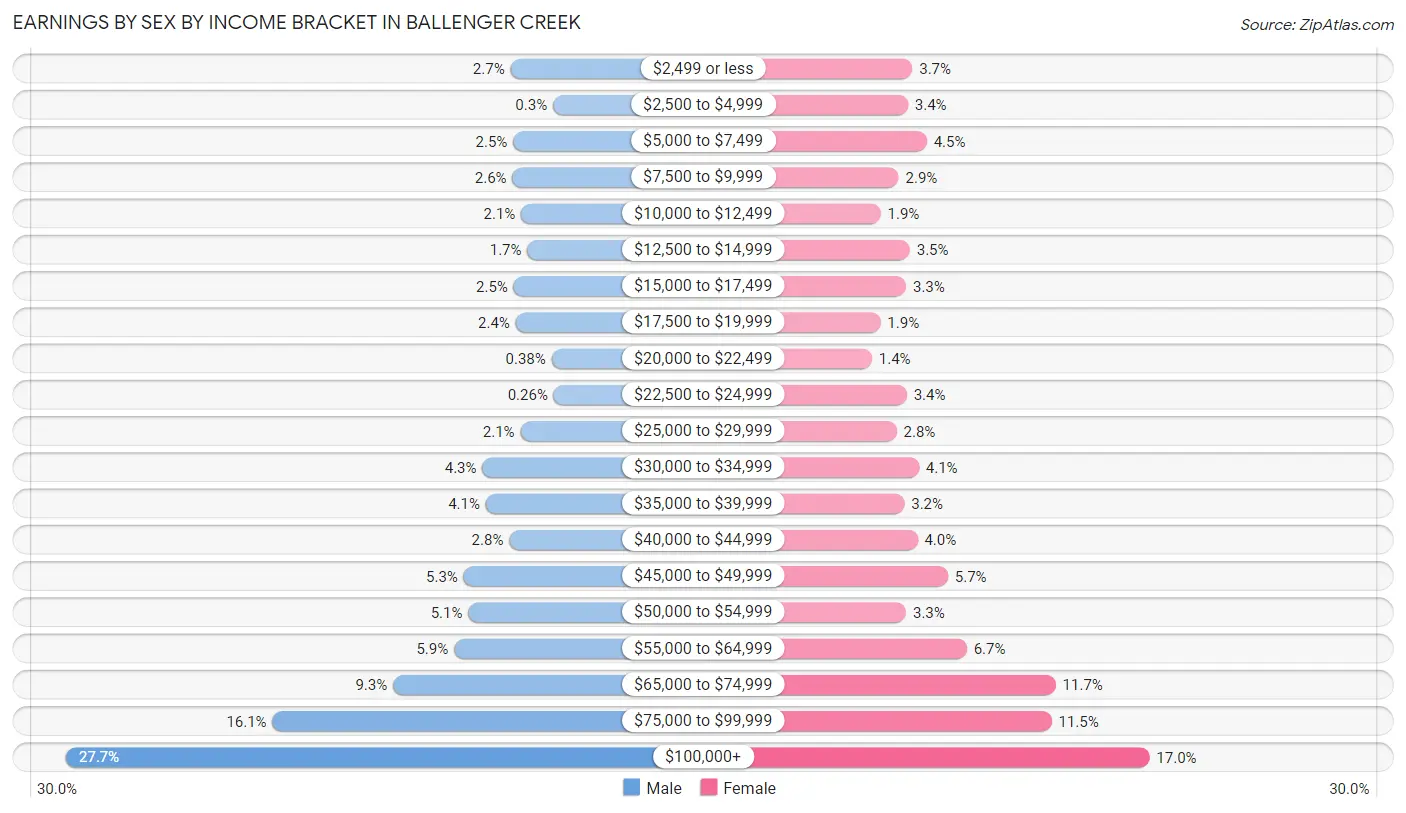
Earnings by Sex by Income Bracket in Ballenger Creek
The most common earnings brackets in Ballenger Creek are $100,000+ for men (2,017 | 27.7%) and $100,000+ for women (1,171 | 17.0%).
| Income | Male | Female |
| $2,499 or less | 196 (2.7%) | 253 (3.7%) |
| $2,500 to $4,999 | 22 (0.3%) | 236 (3.4%) |
| $5,000 to $7,499 | 185 (2.5%) | 309 (4.5%) |
| $7,500 to $9,999 | 188 (2.6%) | 200 (2.9%) |
| $10,000 to $12,499 | 152 (2.1%) | 131 (1.9%) |
| $12,500 to $14,999 | 127 (1.7%) | 244 (3.5%) |
| $15,000 to $17,499 | 183 (2.5%) | 229 (3.3%) |
| $17,500 to $19,999 | 175 (2.4%) | 130 (1.9%) |
| $20,000 to $22,499 | 28 (0.4%) | 97 (1.4%) |
| $22,500 to $24,999 | 19 (0.3%) | 232 (3.4%) |
| $25,000 to $29,999 | 155 (2.1%) | 193 (2.8%) |
| $30,000 to $34,999 | 311 (4.3%) | 279 (4.1%) |
| $35,000 to $39,999 | 297 (4.1%) | 222 (3.2%) |
| $40,000 to $44,999 | 201 (2.8%) | 273 (4.0%) |
| $45,000 to $49,999 | 388 (5.3%) | 391 (5.7%) |
| $50,000 to $54,999 | 369 (5.1%) | 229 (3.3%) |
| $55,000 to $64,999 | 427 (5.9%) | 464 (6.7%) |
| $65,000 to $74,999 | 677 (9.3%) | 808 (11.7%) |
| $75,000 to $99,999 | 1,171 (16.1%) | 792 (11.5%) |
| $100,000+ | 2,017 (27.7%) | 1,171 (17.0%) |
| Total | 7,288 (100.0%) | 6,883 (100.0%) |
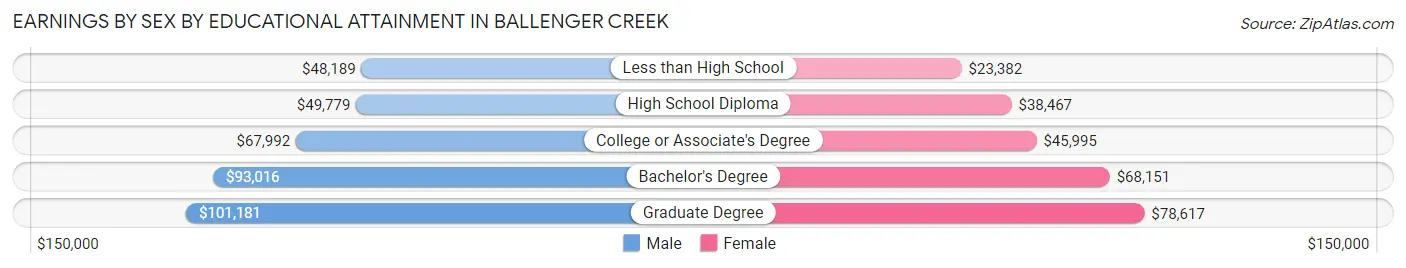
Earnings by Sex by Educational Attainment in Ballenger Creek
Average earnings in Ballenger Creek are $73,581 for men and $58,820 for women, a difference of 20.1%. Men with an educational attainment of graduate degree enjoy the highest average annual earnings of $101,181, while those with less than high school education earn the least with $48,189. Women with an educational attainment of graduate degree earn the most with the average annual earnings of $78,617, while those with less than high school education have the smallest earnings of $23,382.
| Educational Attainment | Male Income | Female Income |
| Less than High School | $48,189 | $23,382 |
| High School Diploma | $49,779 | $38,467 |
| College or Associate's Degree | $67,992 | $45,995 |
| Bachelor's Degree | $93,016 | $68,151 |
| Graduate Degree | $101,181 | $78,617 |
| Total | $73,581 | $58,820 |
Family Income in Ballenger Creek
Family Income Brackets in Ballenger Creek
According to the Ballenger Creek family income data, there are 1,525 families falling into the $100,000 to $149,999 income range, which is the most common income bracket and makes up 24.8% of all families. Conversely, the $35,000 to $49,999 income bracket is the least frequent group with only 166 families (2.7%) belonging to this category.
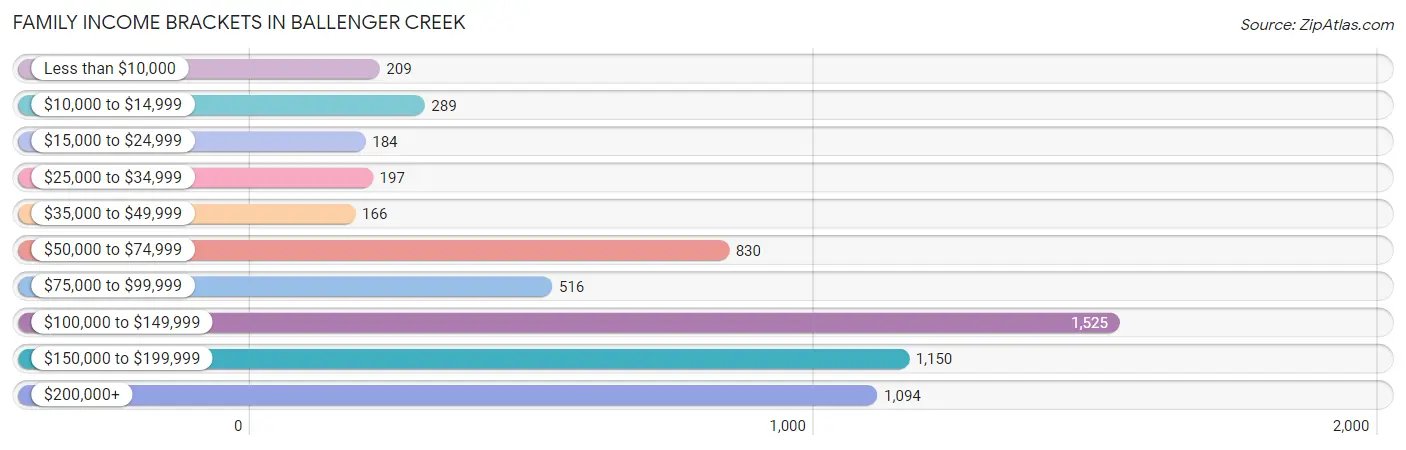
| Income Bracket | # Families | % Families |
| Less than $10,000 | 209 | 3.4% |
| $10,000 to $14,999 | 289 | 4.7% |
| $15,000 to $24,999 | 184 | 3.0% |
| $25,000 to $34,999 | 197 | 3.2% |
| $35,000 to $49,999 | 166 | 2.7% |
| $50,000 to $74,999 | 830 | 13.5% |
| $75,000 to $99,999 | 516 | 8.4% |
| $100,000 to $149,999 | 1,525 | 24.8% |
| $150,000 to $199,999 | 1,150 | 18.7% |
| $200,000+ | 1,094 | 17.8% |
Family Income by Famaliy Size in Ballenger Creek
6-person families (194 | 3.2%) account for the highest median family income in Ballenger Creek with $184,853 per family, while 2-person families (2,546 | 41.4%) have the highest median income of $45,972 per family member.
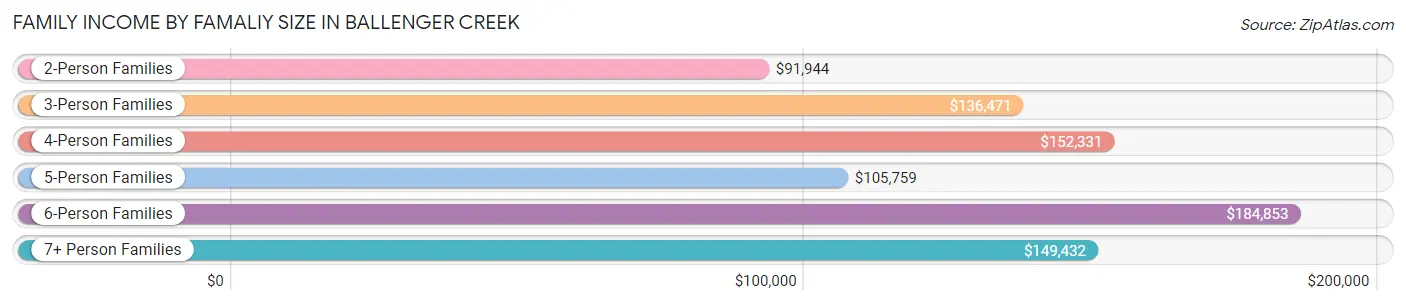
| Income Bracket | # Families | Median Income |
| 2-Person Families | 2,546 (41.4%) | $91,944 |
| 3-Person Families | 1,126 (18.3%) | $136,471 |
| 4-Person Families | 1,698 (27.6%) | $152,331 |
| 5-Person Families | 537 (8.7%) | $105,759 |
| 6-Person Families | 194 (3.2%) | $184,853 |
| 7+ Person Families | 47 (0.8%) | $149,432 |
| Total | 6,148 (100.0%) | $119,706 |
Family Income by Number of Earners in Ballenger Creek
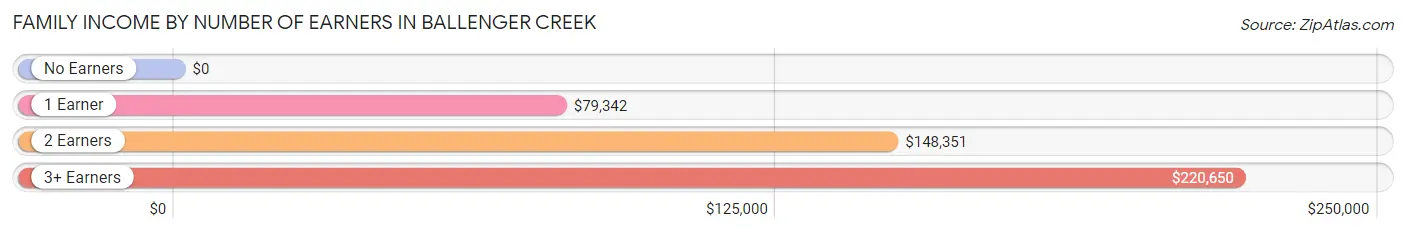
| Number of Earners | # Families | Median Income |
| No Earners | 748 (12.2%) | $0 |
| 1 Earner | 1,772 (28.8%) | $79,342 |
| 2 Earners | 2,679 (43.6%) | $148,351 |
| 3+ Earners | 949 (15.4%) | $220,650 |
| Total | 6,148 (100.0%) | $119,706 |
Household Income in Ballenger Creek
Household Income Brackets in Ballenger Creek
With 2,496 households falling in the category, the $100,000 to $149,999 income range is the most frequent in Ballenger Creek, accounting for 26.9% of all households. In contrast, only 186 households (2.0%) fall into the less than $10,000 income bracket, making it the least populous group.
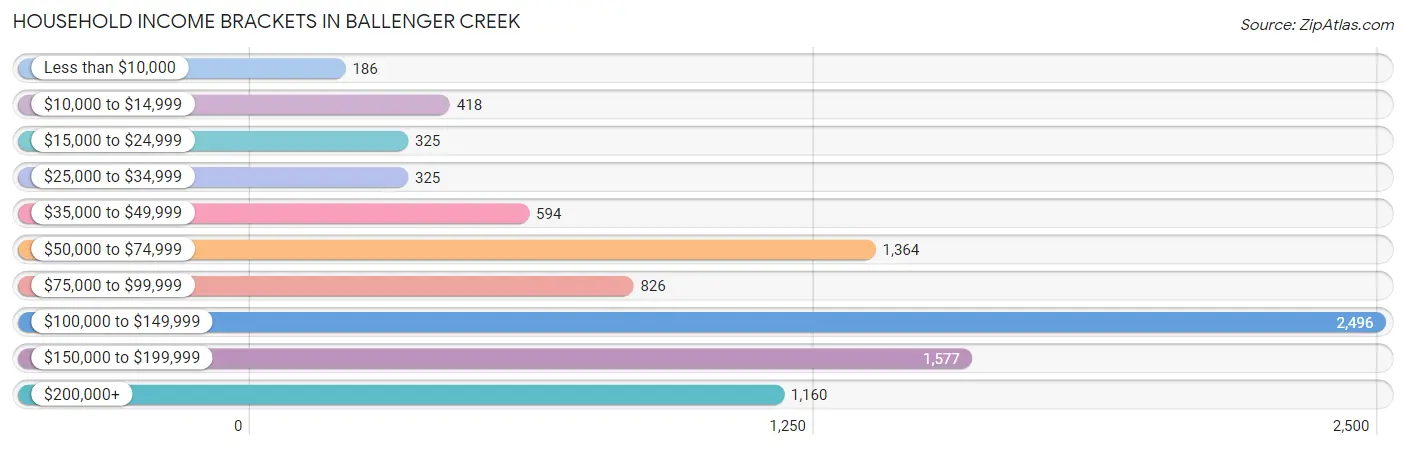
| Income Bracket | # Households | % Households |
| Less than $10,000 | 186 | 2.0% |
| $10,000 to $14,999 | 418 | 4.5% |
| $15,000 to $24,999 | 325 | 3.5% |
| $25,000 to $34,999 | 325 | 3.5% |
| $35,000 to $49,999 | 594 | 6.4% |
| $50,000 to $74,999 | 1,364 | 14.7% |
| $75,000 to $99,999 | 826 | 8.9% |
| $100,000 to $149,999 | 2,496 | 26.9% |
| $150,000 to $199,999 | 1,577 | 17.0% |
| $200,000+ | 1,160 | 12.5% |
Household Income by Householder Age in Ballenger Creek
The median household income in Ballenger Creek is $105,981, with the highest median household income of $132,913 found in the 45 to 64 years age bracket for the primary householder. A total of 3,333 households (35.9%) fall into this category. Meanwhile, the 65+ years age bracket for the primary householder has the lowest median household income of $54,103, with 1,737 households (18.7%) in this group.
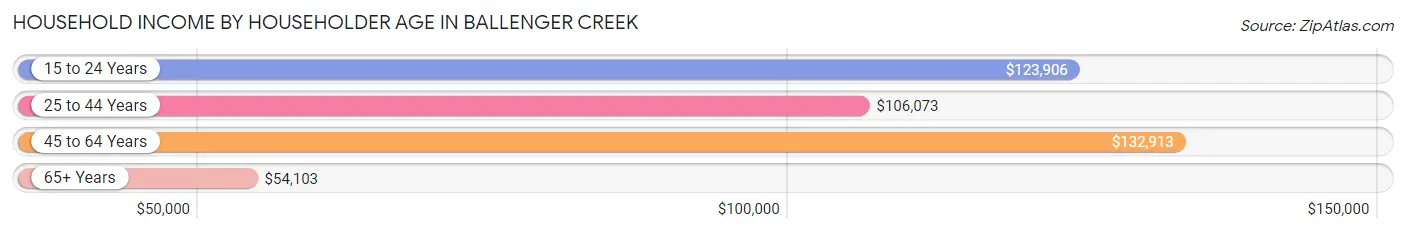
| Income Bracket | # Households | Median Income |
| 15 to 24 Years | 103 (1.1%) | $123,906 |
| 25 to 44 Years | 4,106 (44.3%) | $106,073 |
| 45 to 64 Years | 3,333 (35.9%) | $132,913 |
| 65+ Years | 1,737 (18.7%) | $54,103 |
| Total | 9,279 (100.0%) | $105,981 |
Poverty in Ballenger Creek
Income Below Poverty by Sex and Age in Ballenger Creek
With 8.0% poverty level for males and 10.6% for females among the residents of Ballenger Creek, 5 year old males and 35 to 44 year old females are the most vulnerable to poverty, with 103 males (46.0%) and 377 females (18.4%) in their respective age groups living below the poverty level.
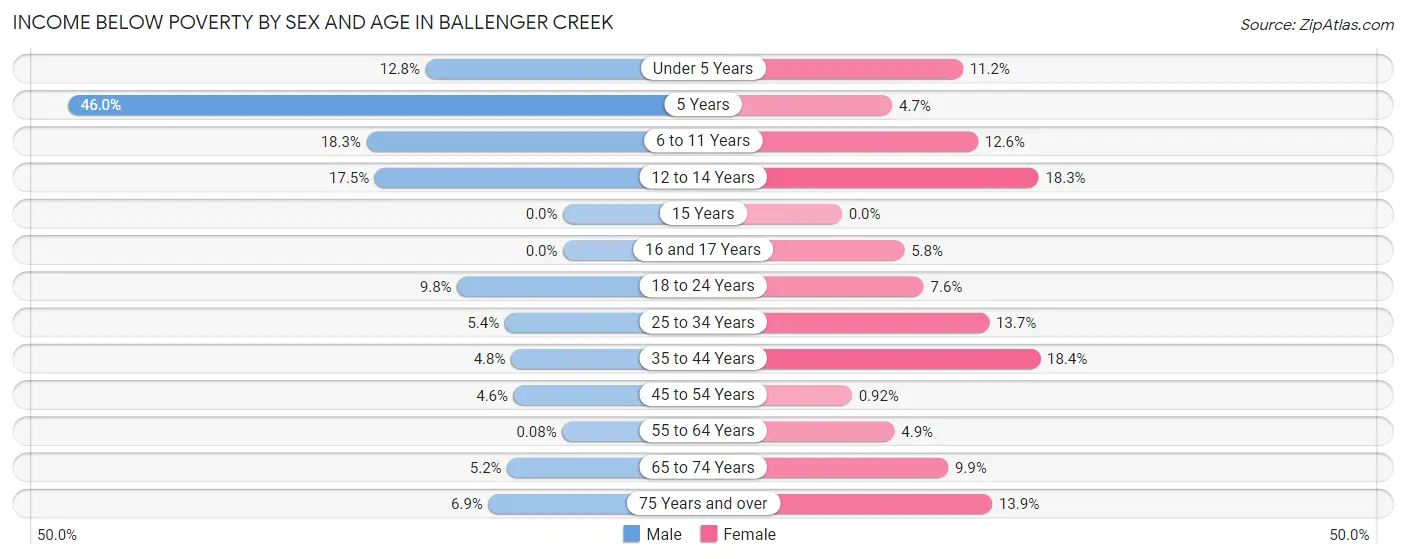
| Age Bracket | Male | Female |
| Under 5 Years | 110 (12.8%) | 124 (11.2%) |
| 5 Years | 103 (46.0%) | 5 (4.7%) |
| 6 to 11 Years | 194 (18.2%) | 111 (12.6%) |
| 12 to 14 Years | 80 (17.5%) | 73 (18.2%) |
| 15 Years | 0 (0.0%) | 0 (0.0%) |
| 16 and 17 Years | 0 (0.0%) | 18 (5.8%) |
| 18 to 24 Years | 103 (9.8%) | 66 (7.6%) |
| 25 to 34 Years | 108 (5.4%) | 280 (13.7%) |
| 35 to 44 Years | 96 (4.8%) | 377 (18.4%) |
| 45 to 54 Years | 64 (4.6%) | 14 (0.9%) |
| 55 to 64 Years | 1 (0.1%) | 76 (4.9%) |
| 65 to 74 Years | 33 (5.2%) | 71 (9.9%) |
| 75 Years and over | 19 (6.9%) | 120 (13.9%) |
| Total | 911 (8.0%) | 1,335 (10.6%) |
Income Above Poverty by Sex and Age in Ballenger Creek
According to the poverty statistics in Ballenger Creek, males aged 15 years and females aged 15 years are the age groups that are most secure financially, with 100.0% of males and 100.0% of females in these age groups living above the poverty line.
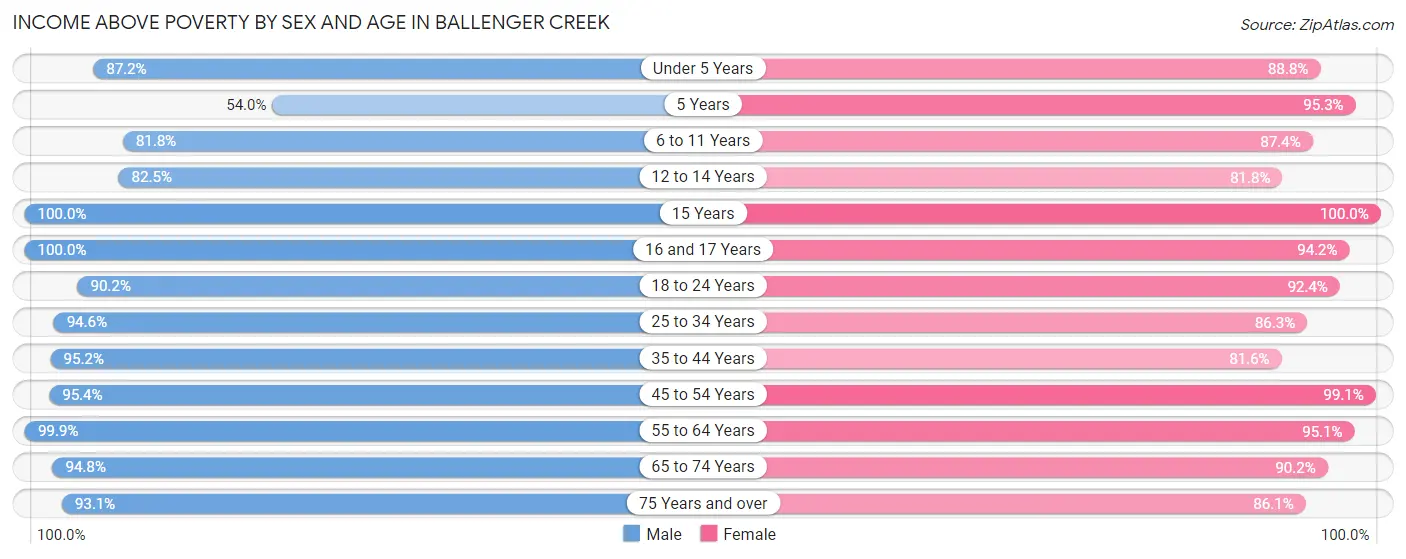
| Age Bracket | Male | Female |
| Under 5 Years | 752 (87.2%) | 981 (88.8%) |
| 5 Years | 121 (54.0%) | 102 (95.3%) |
| 6 to 11 Years | 869 (81.8%) | 768 (87.4%) |
| 12 to 14 Years | 378 (82.5%) | 327 (81.8%) |
| 15 Years | 96 (100.0%) | 136 (100.0%) |
| 16 and 17 Years | 102 (100.0%) | 293 (94.2%) |
| 18 to 24 Years | 945 (90.2%) | 803 (92.4%) |
| 25 to 34 Years | 1,887 (94.6%) | 1,770 (86.3%) |
| 35 to 44 Years | 1,891 (95.2%) | 1,672 (81.6%) |
| 45 to 54 Years | 1,329 (95.4%) | 1,503 (99.1%) |
| 55 to 64 Years | 1,237 (99.9%) | 1,480 (95.1%) |
| 65 to 74 Years | 603 (94.8%) | 650 (90.1%) |
| 75 Years and over | 255 (93.1%) | 741 (86.1%) |
| Total | 10,465 (92.0%) | 11,226 (89.4%) |
Income Below Poverty Among Married-Couple Families in Ballenger Creek
The poverty statistics for married-couple families in Ballenger Creek show that 1.2% or 46 of the total 3,907 families live below the poverty line. Families with 1 or 2 children have the highest poverty rate of 2.9%, comprising of 46 families. On the other hand, families with no children have the lowest poverty rate of 0.0%, which includes 0 families.
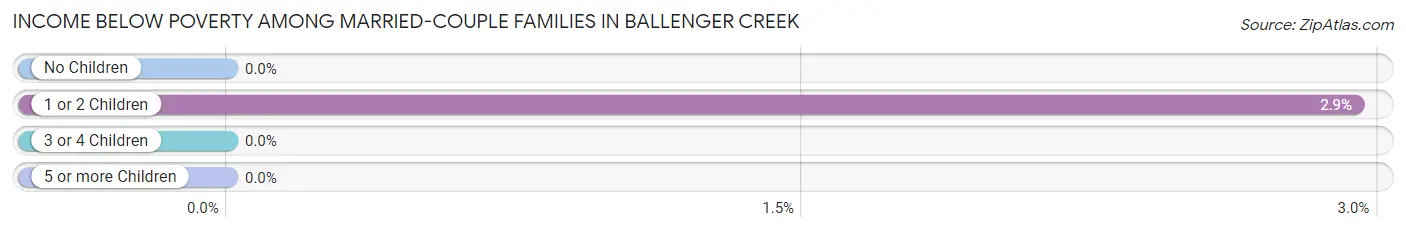
| Children | Above Poverty | Below Poverty |
| No Children | 2,058 (100.0%) | 0 (0.0%) |
| 1 or 2 Children | 1,516 (97.1%) | 46 (2.9%) |
| 3 or 4 Children | 276 (100.0%) | 0 (0.0%) |
| 5 or more Children | 11 (100.0%) | 0 (0.0%) |
| Total | 3,861 (98.8%) | 46 (1.2%) |
Income Below Poverty Among Single-Parent Households in Ballenger Creek
According to the poverty data in Ballenger Creek, 9.9% or 70 single-father households and 32.8% or 502 single-mother households are living below the poverty line. Among single-father households, those with 3 or 4 children have the highest poverty rate, with 33 households (28.4%) experiencing poverty. Likewise, among single-mother households, those with 3 or 4 children have the highest poverty rate, with 127 households (55.5%) falling below the poverty line.
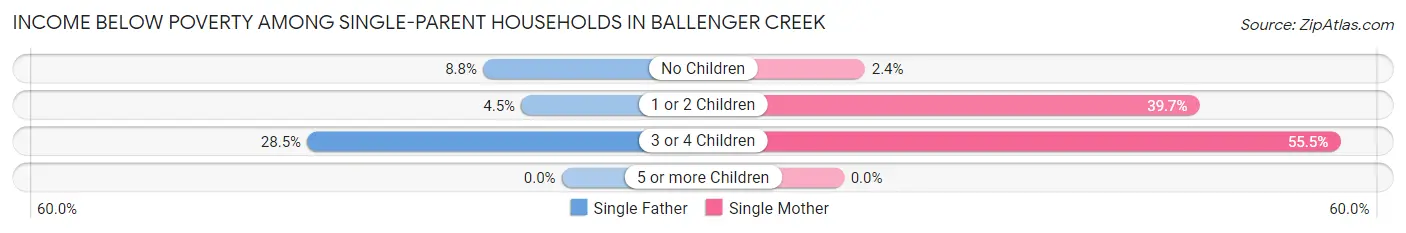
| Children | Single Father | Single Mother |
| No Children | 21 (8.8%) | 9 (2.4%) |
| 1 or 2 Children | 16 (4.5%) | 366 (39.7%) |
| 3 or 4 Children | 33 (28.4%) | 127 (55.5%) |
| 5 or more Children | 0 (0.0%) | 0 (0.0%) |
| Total | 70 (9.9%) | 502 (32.8%) |
Income Below Poverty Among Married-Couple vs Single-Parent Households in Ballenger Creek
The poverty data for Ballenger Creek shows that 46 of the married-couple family households (1.2%) and 572 of the single-parent households (25.5%) are living below the poverty level. Within the married-couple family households, those with 1 or 2 children have the highest poverty rate, with 46 households (2.9%) falling below the poverty line. Among the single-parent households, those with 3 or 4 children have the highest poverty rate, with 160 household (46.4%) living below poverty.
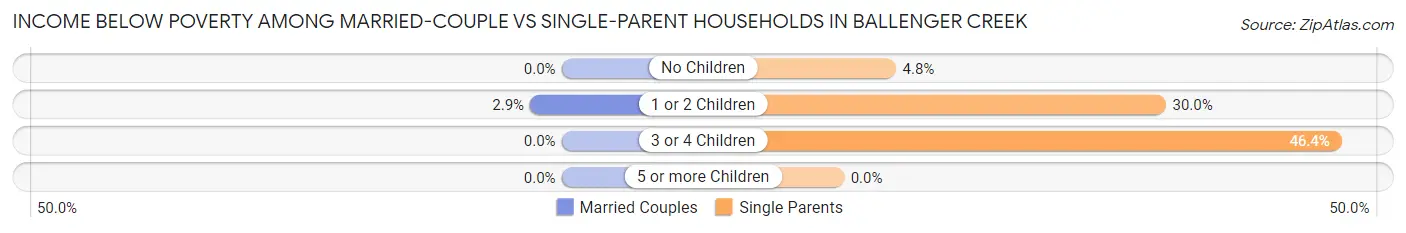
| Children | Married-Couple Families | Single-Parent Households |
| No Children | 0 (0.0%) | 30 (4.8%) |
| 1 or 2 Children | 46 (2.9%) | 382 (30.0%) |
| 3 or 4 Children | 0 (0.0%) | 160 (46.4%) |
| 5 or more Children | 0 (0.0%) | 0 (0.0%) |
| Total | 46 (1.2%) | 572 (25.5%) |
Race in Ballenger Creek
The most populous races in Ballenger Creek are White / Caucasian (14,098 | 58.0%), Black / African American (4,263 | 17.5%), and Hispanic or Latino (4,165 | 17.1%).
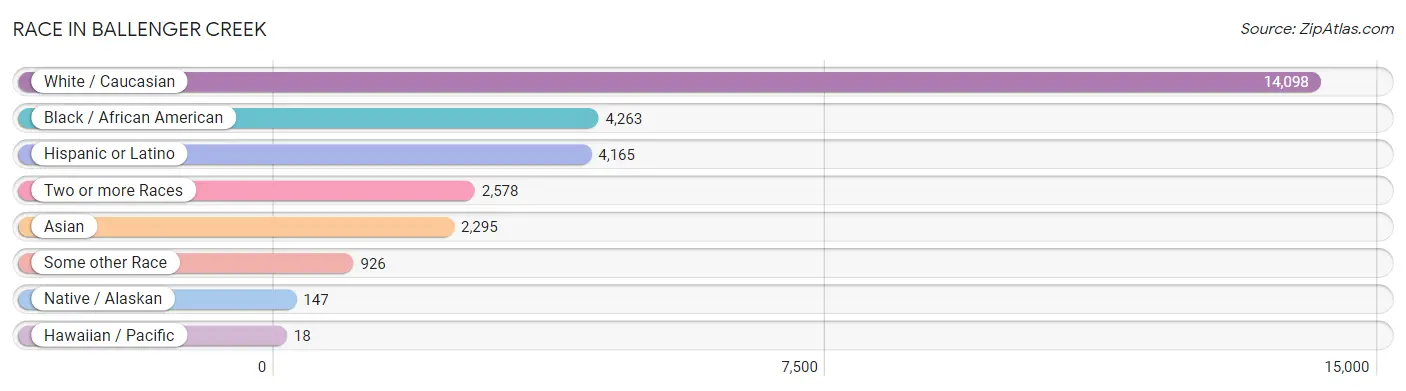
| Race | # Population | % Population |
| Asian | 2,295 | 9.4% |
| Black / African American | 4,263 | 17.5% |
| Hawaiian / Pacific | 18 | 0.1% |
| Hispanic or Latino | 4,165 | 17.1% |
| Native / Alaskan | 147 | 0.6% |
| White / Caucasian | 14,098 | 58.0% |
| Two or more Races | 2,578 | 10.6% |
| Some other Race | 926 | 3.8% |
| Total | 24,325 | 100.0% |
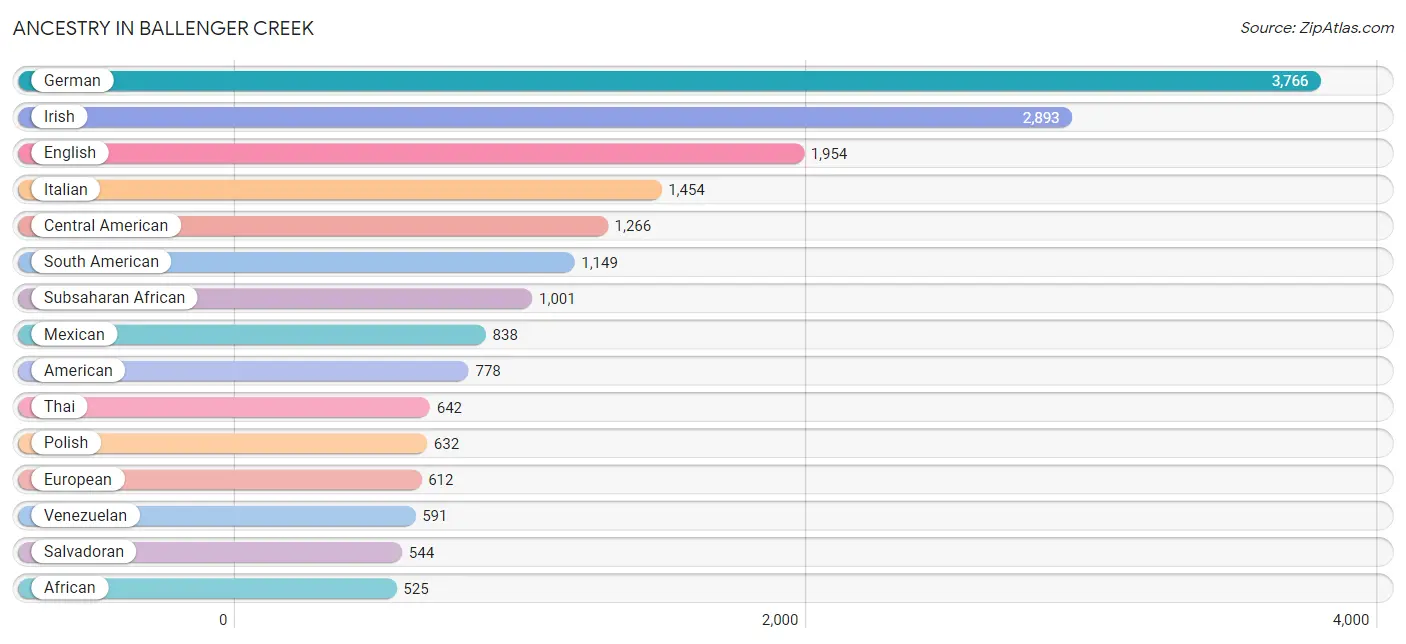
Ancestry in Ballenger Creek
The most populous ancestries reported in Ballenger Creek are German (3,766 | 15.5%), Irish (2,893 | 11.9%), English (1,954 | 8.0%), Italian (1,454 | 6.0%), and Central American (1,266 | 5.2%), together accounting for 46.6% of all Ballenger Creek residents.
| Ancestry | # Population | % Population |
| African | 525 | 2.2% |
| American | 778 | 3.2% |
| Arab | 168 | 0.7% |
| Armenian | 6 | 0.0% |
| Austrian | 30 | 0.1% |
| Bhutanese | 11 | 0.1% |
| Bolivian | 39 | 0.2% |
| Brazilian | 12 | 0.1% |
| British | 61 | 0.3% |
| Bulgarian | 33 | 0.1% |
| Burmese | 347 | 1.4% |
| Central American | 1,266 | 5.2% |
| Chilean | 121 | 0.5% |
| Chippewa | 17 | 0.1% |
| Colombian | 87 | 0.4% |
| Costa Rican | 181 | 0.7% |
| Cuban | 12 | 0.1% |
| Czech | 123 | 0.5% |
| Danish | 18 | 0.1% |
| Delaware | 16 | 0.1% |
| Dominican | 366 | 1.5% |
| Dutch | 132 | 0.5% |
| Eastern European | 117 | 0.5% |
| Ecuadorian | 59 | 0.2% |
| Egyptian | 30 | 0.1% |
| English | 1,954 | 8.0% |
| Ethiopian | 85 | 0.4% |
| European | 612 | 2.5% |
| Filipino | 6 | 0.0% |
| Finnish | 51 | 0.2% |
| French | 370 | 1.5% |
| French American Indian | 9 | 0.0% |
| French Canadian | 42 | 0.2% |
| German | 3,766 | 15.5% |
| Ghanaian | 52 | 0.2% |
| Greek | 32 | 0.1% |
| Guamanian / Chamorro | 10 | 0.0% |
| Guatemalan | 224 | 0.9% |
| Haitian | 62 | 0.3% |
| Honduran | 243 | 1.0% |
| Hungarian | 377 | 1.5% |
| Indian (Asian) | 106 | 0.4% |
| Indonesian | 46 | 0.2% |
| Iranian | 258 | 1.1% |
| Irish | 2,893 | 11.9% |
| Italian | 1,454 | 6.0% |
| Jamaican | 46 | 0.2% |
| Japanese | 240 | 1.0% |
| Korean | 337 | 1.4% |
| Laotian | 34 | 0.1% |
| Lebanese | 49 | 0.2% |
| Liberian | 129 | 0.5% |
| Lithuanian | 32 | 0.1% |
| Lumbee | 9 | 0.0% |
| Mexican | 838 | 3.5% |
| Mexican American Indian | 129 | 0.5% |
| Native Hawaiian | 7 | 0.0% |
| Nicaraguan | 31 | 0.1% |
| Nigerian | 183 | 0.7% |
| Northern European | 39 | 0.2% |
| Norwegian | 63 | 0.3% |
| Pakistani | 15 | 0.1% |
| Palestinian | 59 | 0.2% |
| Panamanian | 43 | 0.2% |
| Peruvian | 181 | 0.7% |
| Polish | 632 | 2.6% |
| Portuguese | 33 | 0.1% |
| Puerto Rican | 385 | 1.6% |
| Romanian | 41 | 0.2% |
| Russian | 308 | 1.3% |
| Salvadoran | 544 | 2.2% |
| Scandinavian | 30 | 0.1% |
| Scotch-Irish | 186 | 0.8% |
| Scottish | 383 | 1.6% |
| Senegalese | 49 | 0.2% |
| Slovak | 83 | 0.3% |
| South American | 1,149 | 4.7% |
| South American Indian | 19 | 0.1% |
| Spaniard | 32 | 0.1% |
| Spanish | 18 | 0.1% |
| Spanish American Indian | 22 | 0.1% |
| Sri Lankan | 381 | 1.6% |
| Subsaharan African | 1,001 | 4.1% |
| Swedish | 174 | 0.7% |
| Swiss | 40 | 0.2% |
| Thai | 642 | 2.6% |
| Trinidadian and Tobagonian | 8 | 0.0% |
| Turkish | 160 | 0.7% |
| Ukrainian | 90 | 0.4% |
| Uruguayan | 71 | 0.3% |
| Venezuelan | 591 | 2.4% |
| Welsh | 103 | 0.4% |
| West Indian | 11 | 0.1% | View All 93 Rows |
Immigrants in Ballenger Creek
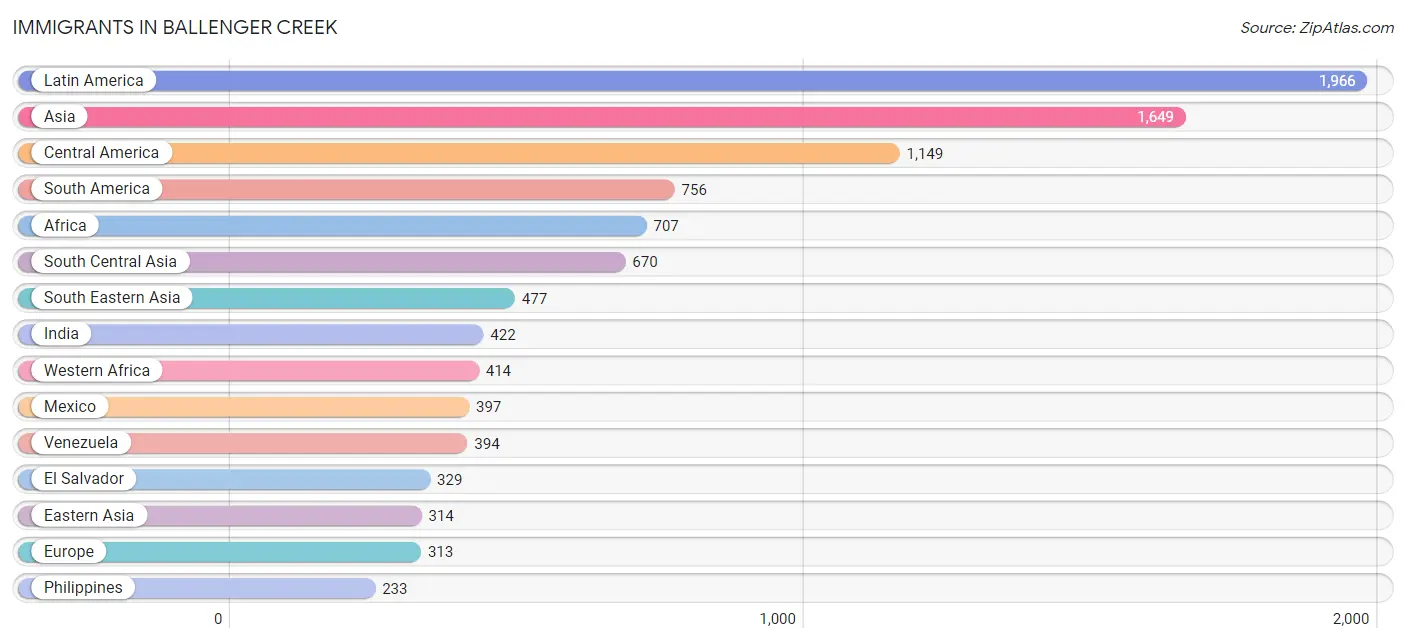
The most numerous immigrant groups reported in Ballenger Creek came from Latin America (1,966 | 8.1%), Asia (1,649 | 6.8%), Central America (1,149 | 4.7%), South America (756 | 3.1%), and Africa (707 | 2.9%), together accounting for 25.6% of all Ballenger Creek residents.
| Immigration Origin | # Population | % Population |
| Africa | 707 | 2.9% |
| Asia | 1,649 | 6.8% |
| Bangladesh | 43 | 0.2% |
| Bolivia | 60 | 0.3% |
| Brazil | 12 | 0.1% |
| Cambodia | 34 | 0.1% |
| Cameroon | 205 | 0.8% |
| Canada | 30 | 0.1% |
| Caribbean | 61 | 0.3% |
| Central America | 1,149 | 4.7% |
| Chile | 25 | 0.1% |
| China | 99 | 0.4% |
| Colombia | 77 | 0.3% |
| Costa Rica | 113 | 0.5% |
| Czechoslovakia | 4 | 0.0% |
| Dominican Republic | 5 | 0.0% |
| Eastern Africa | 53 | 0.2% |
| Eastern Asia | 314 | 1.3% |
| Eastern Europe | 125 | 0.5% |
| Ecuador | 12 | 0.1% |
| Egypt | 30 | 0.1% |
| El Salvador | 329 | 1.3% |
| England | 19 | 0.1% |
| Ethiopia | 53 | 0.2% |
| Europe | 313 | 1.3% |
| Germany | 140 | 0.6% |
| Ghana | 91 | 0.4% |
| Guatemala | 127 | 0.5% |
| Guyana | 14 | 0.1% |
| Haiti | 12 | 0.1% |
| Honduras | 131 | 0.5% |
| Hong Kong | 5 | 0.0% |
| India | 422 | 1.7% |
| Iran | 43 | 0.2% |
| Israel | 28 | 0.1% |
| Jamaica | 36 | 0.2% |
| Korea | 215 | 0.9% |
| Latin America | 1,966 | 8.1% |
| Liberia | 37 | 0.2% |
| Mexico | 397 | 1.6% |
| Micronesia | 6 | 0.0% |
| Middle Africa | 205 | 0.8% |
| Nicaragua | 31 | 0.1% |
| Nigeria | 90 | 0.4% |
| Northern Africa | 30 | 0.1% |
| Northern Europe | 48 | 0.2% |
| Oceania | 6 | 0.0% |
| Pakistan | 162 | 0.7% |
| Panama | 21 | 0.1% |
| Peru | 162 | 0.7% |
| Philippines | 233 | 1.0% |
| Poland | 26 | 0.1% |
| Romania | 41 | 0.2% |
| Russia | 36 | 0.2% |
| Senegal | 146 | 0.6% |
| South Africa | 5 | 0.0% |
| South America | 756 | 3.1% |
| South Central Asia | 670 | 2.8% |
| South Eastern Asia | 477 | 2.0% |
| Taiwan | 52 | 0.2% |
| Trinidad and Tobago | 8 | 0.0% |
| Turkey | 160 | 0.7% |
| Ukraine | 18 | 0.1% |
| Venezuela | 394 | 1.6% |
| Vietnam | 210 | 0.9% |
| Western Africa | 414 | 1.7% |
| Western Asia | 188 | 0.8% |
| Western Europe | 140 | 0.6% | View All 68 Rows |
Sex and Age in Ballenger Creek
Sex and Age in Ballenger Creek
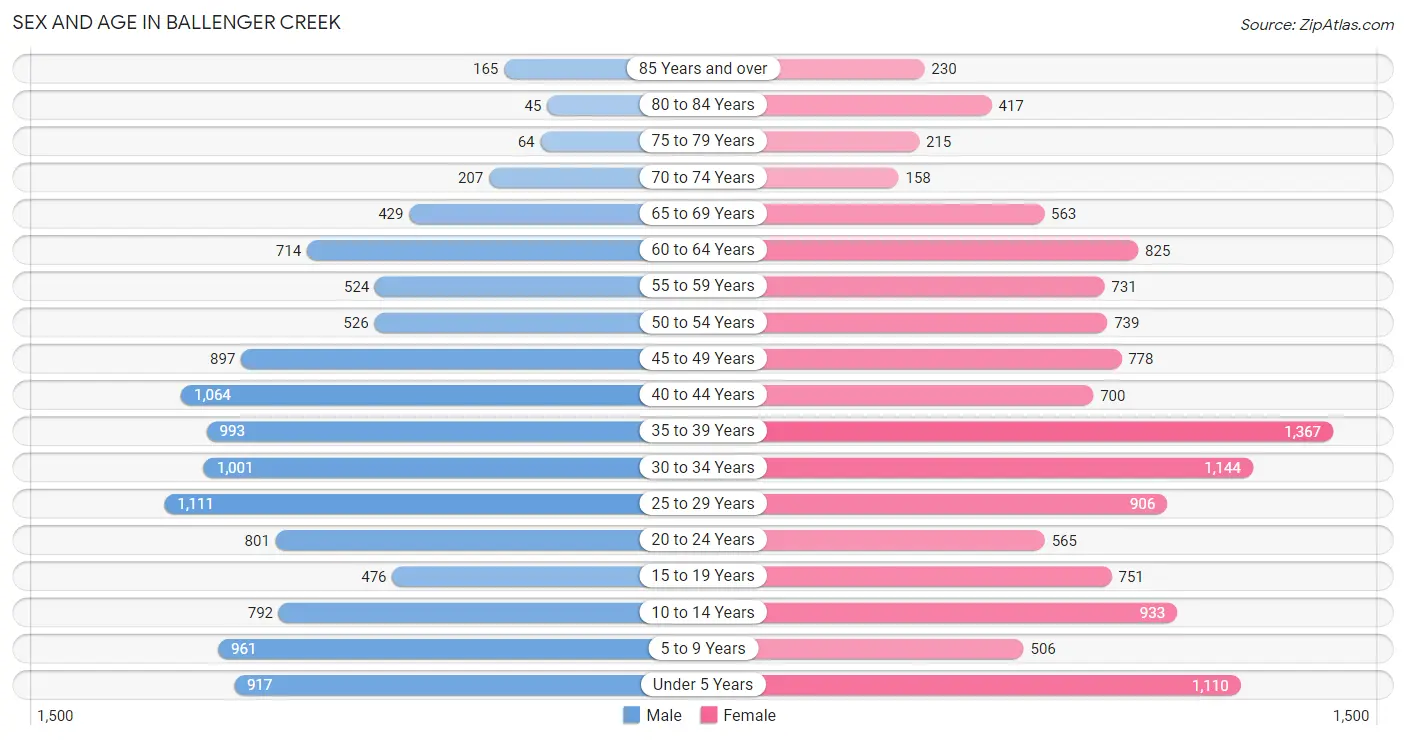
The most populous age groups in Ballenger Creek are 25 to 29 Years (1,111 | 9.5%) for men and 35 to 39 Years (1,367 | 10.8%) for women.
| Age Bracket | Male | Female |
| Under 5 Years | 917 (7.9%) | 1,110 (8.8%) |
| 5 to 9 Years | 961 (8.2%) | 506 (4.0%) |
| 10 to 14 Years | 792 (6.8%) | 933 (7.4%) |
| 15 to 19 Years | 476 (4.1%) | 751 (5.9%) |
| 20 to 24 Years | 801 (6.9%) | 565 (4.5%) |
| 25 to 29 Years | 1,111 (9.5%) | 906 (7.2%) |
| 30 to 34 Years | 1,001 (8.6%) | 1,144 (9.0%) |
| 35 to 39 Years | 993 (8.5%) | 1,367 (10.8%) |
| 40 to 44 Years | 1,064 (9.1%) | 700 (5.5%) |
| 45 to 49 Years | 897 (7.7%) | 778 (6.2%) |
| 50 to 54 Years | 526 (4.5%) | 739 (5.9%) |
| 55 to 59 Years | 524 (4.5%) | 731 (5.8%) |
| 60 to 64 Years | 714 (6.1%) | 825 (6.5%) |
| 65 to 69 Years | 429 (3.7%) | 563 (4.4%) |
| 70 to 74 Years | 207 (1.8%) | 158 (1.3%) |
| 75 to 79 Years | 64 (0.5%) | 215 (1.7%) |
| 80 to 84 Years | 45 (0.4%) | 417 (3.3%) |
| 85 Years and over | 165 (1.4%) | 230 (1.8%) |
| Total | 11,687 (100.0%) | 12,638 (100.0%) |
Families and Households in Ballenger Creek
Median Family Size in Ballenger Creek
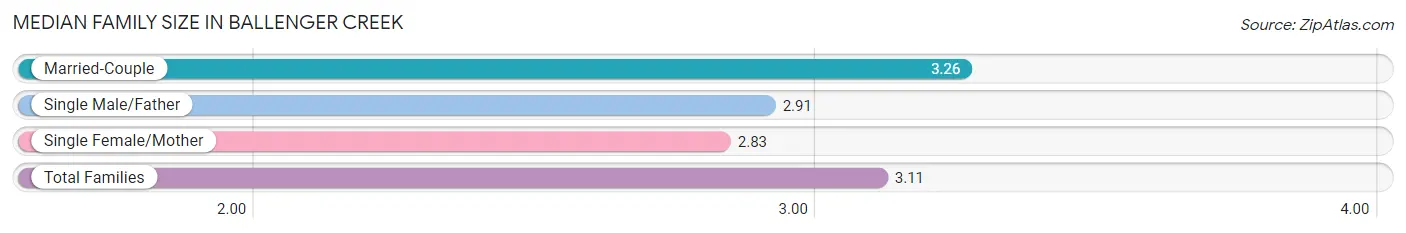
The median family size in Ballenger Creek is 3.11 persons per family, with married-couple families (3,907 | 63.5%) accounting for the largest median family size of 3.26 persons per family. On the other hand, single female/mother families (1,533 | 24.9%) represent the smallest median family size with 2.83 persons per family.
| Family Type | # Families | Family Size |
| Married-Couple | 3,907 (63.5%) | 3.26 |
| Single Male/Father | 708 (11.5%) | 2.91 |
| Single Female/Mother | 1,533 (24.9%) | 2.83 |
| Total Families | 6,148 (100.0%) | 3.11 |
Median Household Size in Ballenger Creek
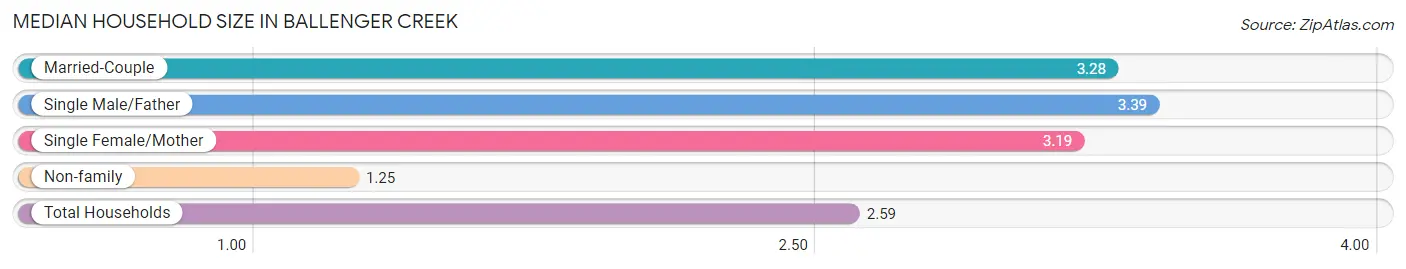
The median household size in Ballenger Creek is 2.59 persons per household, with single male/father households (708 | 7.6%) accounting for the largest median household size of 3.39 persons per household. non-family households (3,131 | 33.7%) represent the smallest median household size with 1.25 persons per household.
| Household Type | # Households | Household Size |
| Married-Couple | 3,907 (42.1%) | 3.28 |
| Single Male/Father | 708 (7.6%) | 3.39 |
| Single Female/Mother | 1,533 (16.5%) | 3.19 |
| Non-family | 3,131 (33.7%) | 1.25 |
| Total Households | 9,279 (100.0%) | 2.59 |
Household Size by Marriage Status in Ballenger Creek
Out of a total of 9,279 households in Ballenger Creek, 6,148 (66.3%) are family households, while 3,131 (33.7%) are nonfamily households. The most numerous type of family households are 2-person households, comprising 2,168, and the most common type of nonfamily households are 1-person households, comprising 2,574.
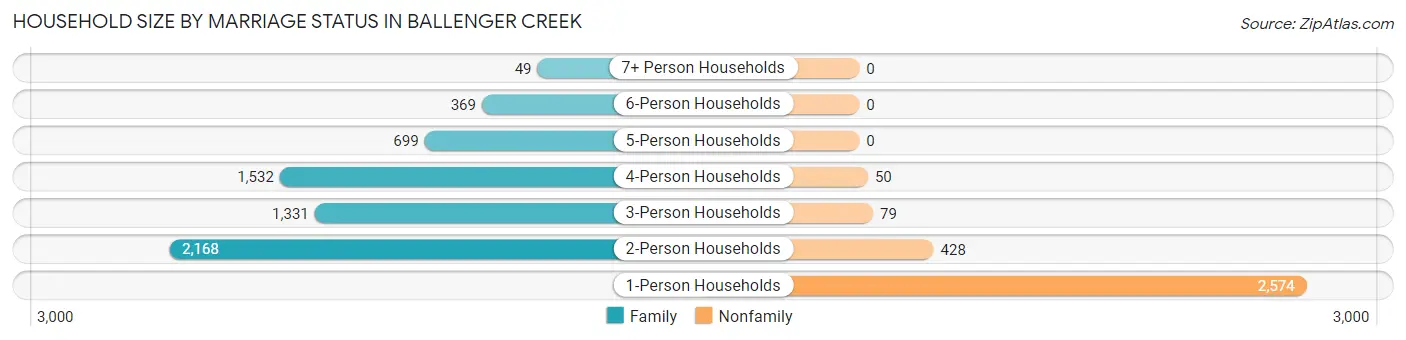
| Household Size | Family Households | Nonfamily Households |
| 1-Person Households | - | 2,574 (27.7%) |
| 2-Person Households | 2,168 (23.4%) | 428 (4.6%) |
| 3-Person Households | 1,331 (14.3%) | 79 (0.9%) |
| 4-Person Households | 1,532 (16.5%) | 50 (0.5%) |
| 5-Person Households | 699 (7.5%) | 0 (0.0%) |
| 6-Person Households | 369 (4.0%) | 0 (0.0%) |
| 7+ Person Households | 49 (0.5%) | 0 (0.0%) |
| Total | 6,148 (66.3%) | 3,131 (33.7%) |
Female Fertility in Ballenger Creek
Fertility by Age in Ballenger Creek
Average fertility rate in Ballenger Creek is 49.0 births per 1,000 women. Women in the age bracket of 20 to 34 years have the highest fertility rate with 92.0 births per 1,000 women. Women in the age bracket of 20 to 34 years acount for 77.9% of all women with births.
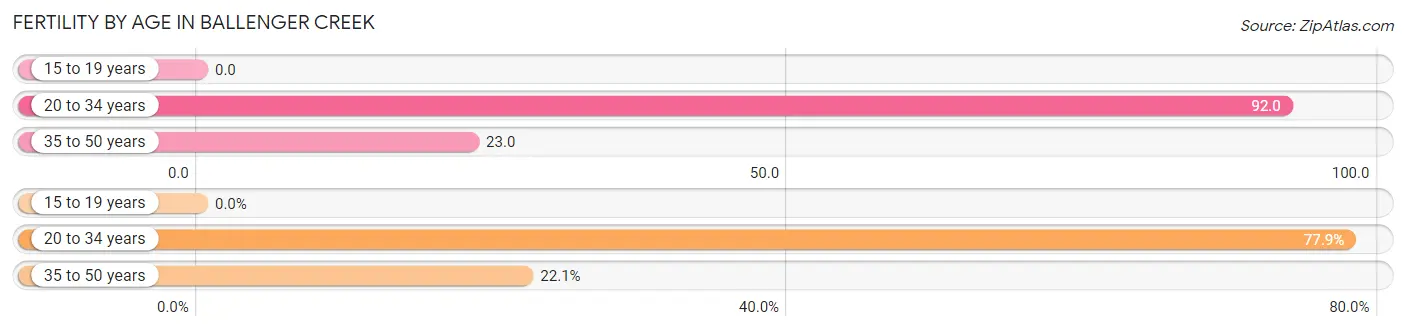
| Age Bracket | Women with Births | Births / 1,000 Women |
| 15 to 19 years | 0 (0.0%) | 0.0 |
| 20 to 34 years | 240 (77.9%) | 92.0 |
| 35 to 50 years | 68 (22.1%) | 23.0 |
| Total | 308 (100.0%) | 49.0 |
Fertility by Age by Marriage Status in Ballenger Creek
72.1% of women with births (308) in Ballenger Creek are married. The highest percentage of unmarried women with births falls into 35 to 50 years age bracket with 47.1% of them unmarried at the time of birth, while the lowest percentage of unmarried women with births belong to 20 to 34 years age bracket with 22.5% of them unmarried.
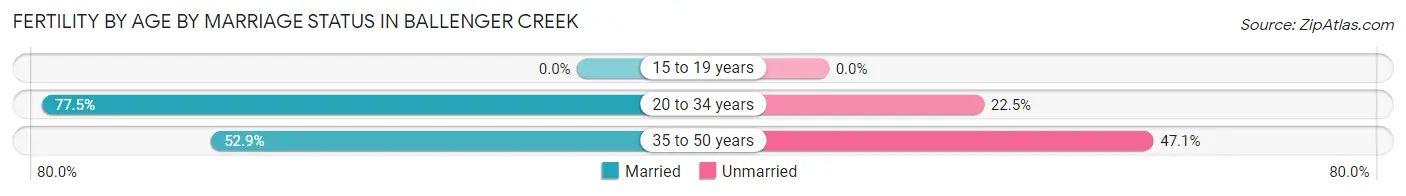
| Age Bracket | Married | Unmarried |
| 15 to 19 years | 0 (0.0%) | 0 (0.0%) |
| 20 to 34 years | 186 (77.5%) | 54 (22.5%) |
| 35 to 50 years | 36 (52.9%) | 32 (47.1%) |
| Total | 222 (72.1%) | 86 (27.9%) |
Fertility by Education in Ballenger Creek
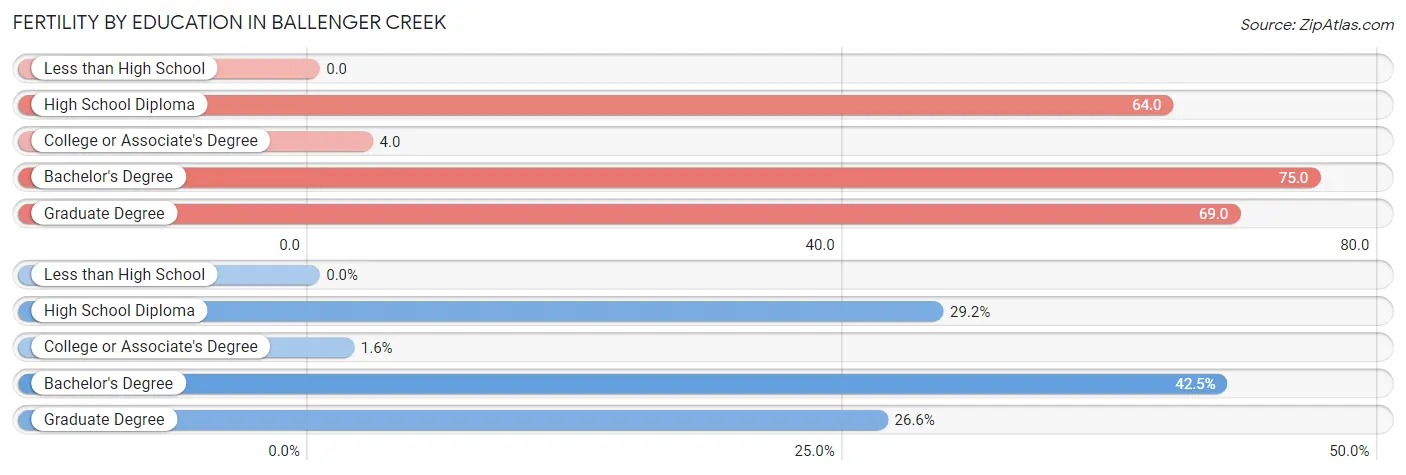
| Educational Attainment | Women with Births | Births / 1,000 Women |
| Less than High School | 0 (0.0%) | 0.0 |
| High School Diploma | 90 (29.2%) | 64.0 |
| College or Associate's Degree | 5 (1.6%) | 4.0 |
| Bachelor's Degree | 131 (42.5%) | 75.0 |
| Graduate Degree | 82 (26.6%) | 69.0 |
| Total | 308 (100.0%) | 49.0 |
Fertility by Education by Marriage Status in Ballenger Creek
27.9% of women with births in Ballenger Creek are unmarried. Women with the educational attainment of college or associate's degree are most likely to be married with 100.0% of them married at childbirth, while women with the educational attainment of high school diploma are least likely to be married with 38.9% of them unmarried at childbirth.
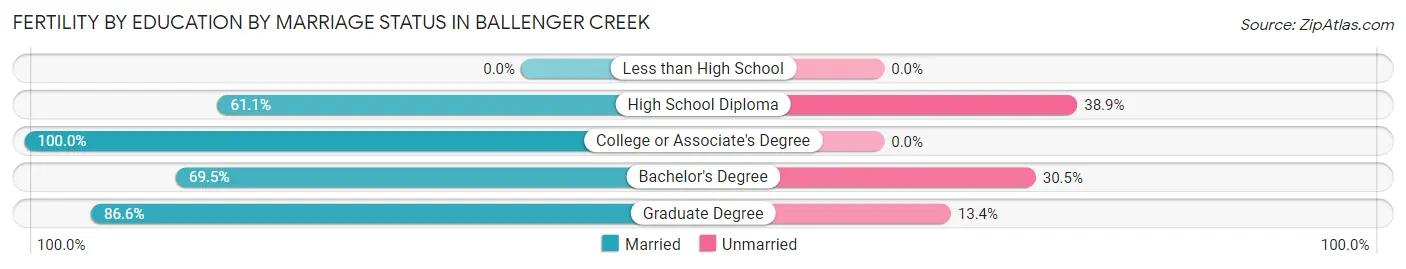
| Educational Attainment | Married | Unmarried |
| Less than High School | 0 (0.0%) | 0 (0.0%) |
| High School Diploma | 55 (61.1%) | 35 (38.9%) |
| College or Associate's Degree | 5 (100.0%) | 0 (0.0%) |
| Bachelor's Degree | 91 (69.5%) | 40 (30.5%) |
| Graduate Degree | 71 (86.6%) | 11 (13.4%) |
| Total | 222 (72.1%) | 86 (27.9%) |
Employment Characteristics in Ballenger Creek
Employment by Class of Employer in Ballenger Creek
Among the 12,823 employed individuals in Ballenger Creek, private company employees (8,511 | 66.4%), federal government employees (1,400 | 10.9%), and local government employees (1,099 | 8.6%) make up the most common classes of employment.
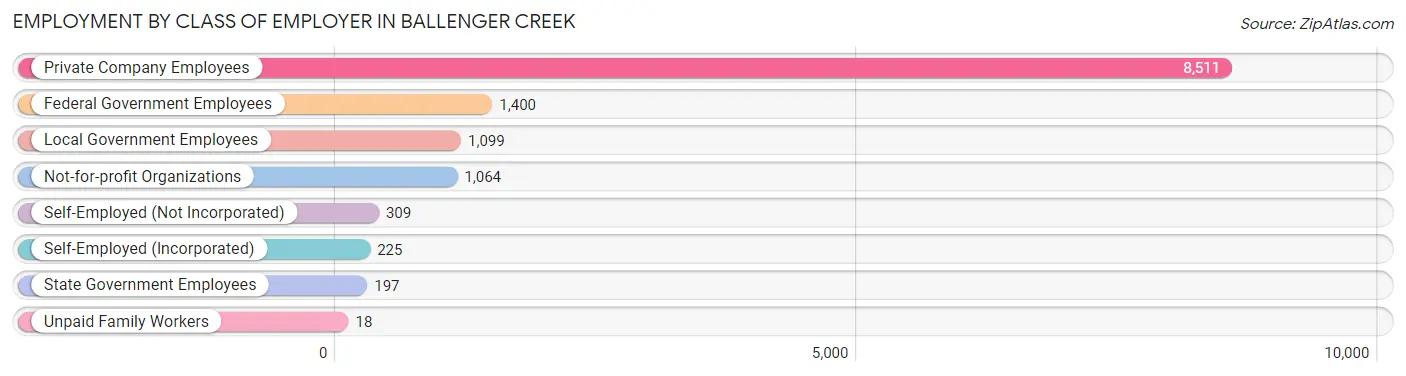
| Employer Class | # Employees | % Employees |
| Private Company Employees | 8,511 | 66.4% |
| Self-Employed (Incorporated) | 225 | 1.8% |
| Self-Employed (Not Incorporated) | 309 | 2.4% |
| Not-for-profit Organizations | 1,064 | 8.3% |
| Local Government Employees | 1,099 | 8.6% |
| State Government Employees | 197 | 1.5% |
| Federal Government Employees | 1,400 | 10.9% |
| Unpaid Family Workers | 18 | 0.1% |
| Total | 12,823 | 100.0% |
Employment Status by Age in Ballenger Creek
According to the labor force statistics for Ballenger Creek, out of the total population over 16 years of age (18,874), 71.4% or 13,476 individuals are in the labor force, with 3.5% or 472 of them unemployed. The age group with the highest labor force participation rate is 25 to 29 years, with 85.6% or 1,727 individuals in the labor force. Within the labor force, the 16 to 19 years age range has the highest percentage of unemployed individuals, with 12.0% or 60 of them being unemployed.
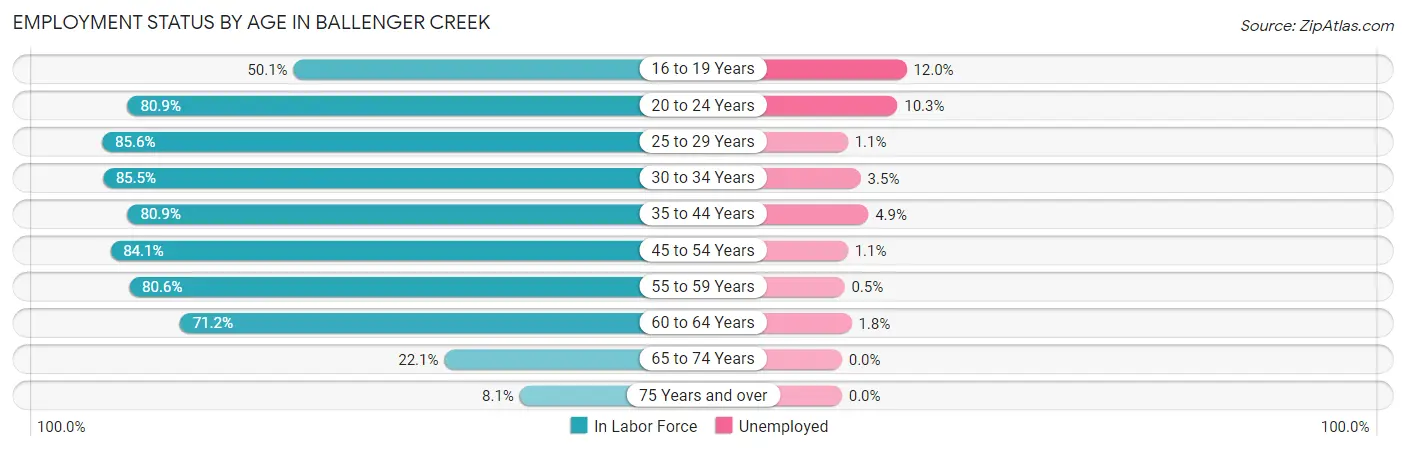
| Age Bracket | In Labor Force | Unemployed |
| 16 to 19 Years | 498 (50.1%) | 60 (12.0%) |
| 20 to 24 Years | 1,105 (80.9%) | 114 (10.3%) |
| 25 to 29 Years | 1,727 (85.6%) | 19 (1.1%) |
| 30 to 34 Years | 1,834 (85.5%) | 64 (3.5%) |
| 35 to 44 Years | 3,336 (80.9%) | 163 (4.9%) |
| 45 to 54 Years | 2,473 (84.1%) | 27 (1.1%) |
| 55 to 59 Years | 1,012 (80.6%) | 5 (0.5%) |
| 60 to 64 Years | 1,096 (71.2%) | 20 (1.8%) |
| 65 to 74 Years | 300 (22.1%) | 0 (0.0%) |
| 75 Years and over | 92 (8.1%) | 0 (0.0%) |
| Total | 13,476 (71.4%) | 472 (3.5%) |
Employment Status by Educational Attainment in Ballenger Creek
According to labor force statistics for Ballenger Creek, 81.9% of individuals (11,482) out of the total population between 25 and 64 years of age (14,020) are in the labor force, with 2.6% or 299 of them being unemployed. The group with the highest labor force participation rate are those with the educational attainment of college / associate degree, with 87.3% or 3,076 individuals in the labor force. Within the labor force, individuals with less than high school education have the highest percentage of unemployment, with 4.4% or 18 of them being unemployed.
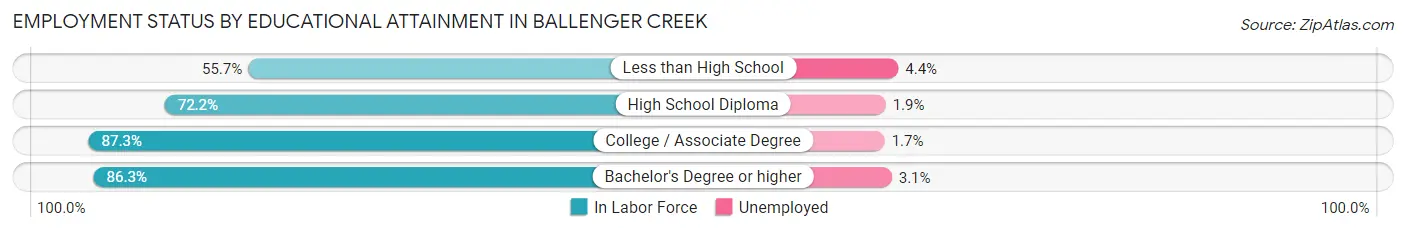
| Educational Attainment | In Labor Force | Unemployed |
| Less than High School | 406 (55.7%) | 32 (4.4%) |
| High School Diploma | 2,244 (72.2%) | 59 (1.9%) |
| College / Associate Degree | 3,076 (87.3%) | 60 (1.7%) |
| Bachelor's Degree or higher | 5,747 (86.3%) | 206 (3.1%) |
| Total | 11,482 (81.9%) | 365 (2.6%) |
Employment Occupations by Sex in Ballenger Creek
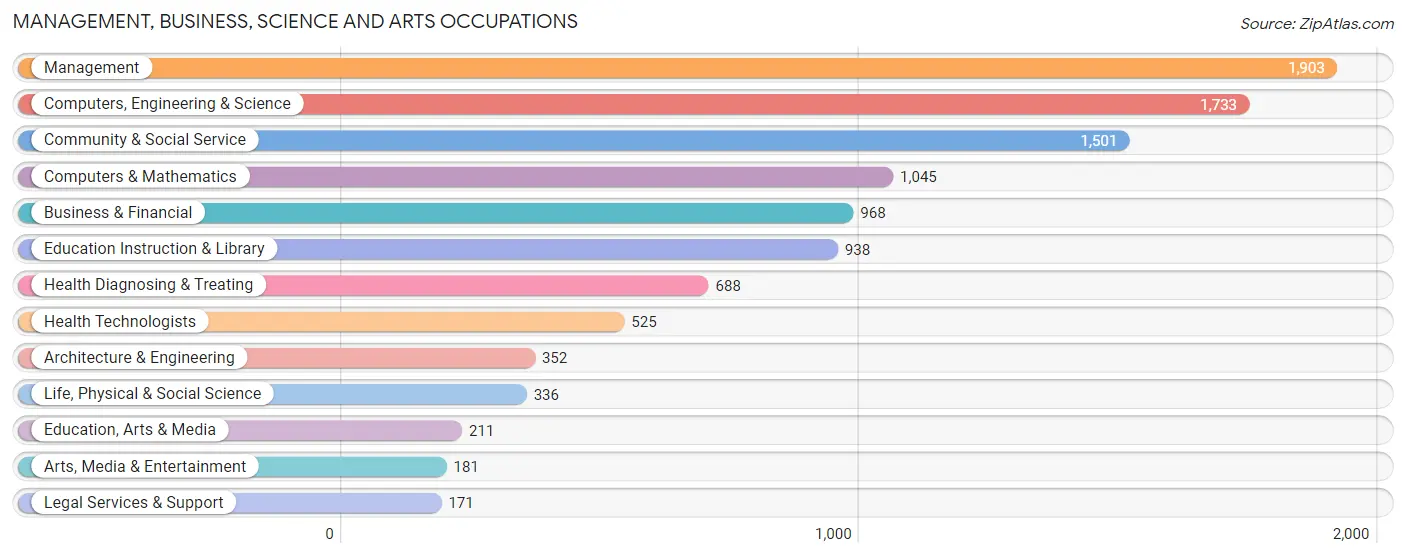
Management, Business, Science and Arts Occupations
The most common Management, Business, Science and Arts occupations in Ballenger Creek are Management (1,903 | 14.7%), Computers, Engineering & Science (1,733 | 13.4%), Community & Social Service (1,501 | 11.6%), Computers & Mathematics (1,045 | 8.1%), and Business & Financial (968 | 7.5%).
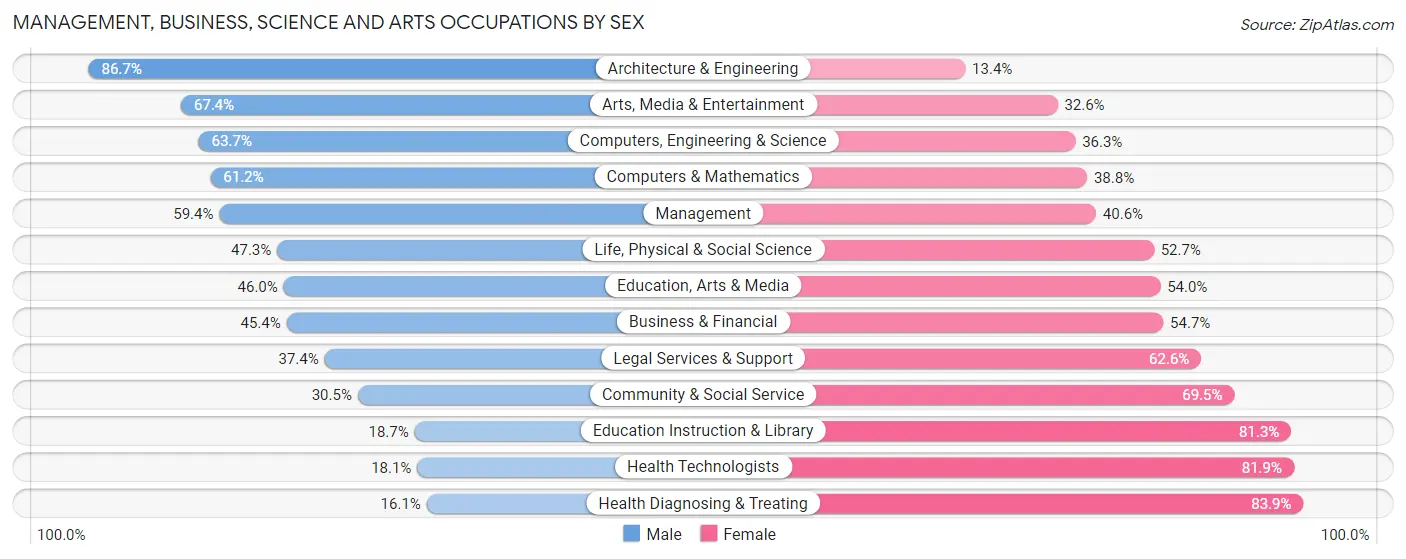
Management, Business, Science and Arts Occupations by Sex
Within the Management, Business, Science and Arts occupations in Ballenger Creek, the most male-oriented occupations are Architecture & Engineering (86.7%), Arts, Media & Entertainment (67.4%), and Computers, Engineering & Science (63.7%), while the most female-oriented occupations are Health Diagnosing & Treating (83.9%), Health Technologists (81.9%), and Education Instruction & Library (81.3%).
| Occupation | Male | Female |
| Management | 1,130 (59.4%) | 773 (40.6%) |
| Business & Financial | 439 (45.4%) | 529 (54.6%) |
| Computers, Engineering & Science | 1,104 (63.7%) | 629 (36.3%) |
| Computers & Mathematics | 640 (61.2%) | 405 (38.8%) |
| Architecture & Engineering | 305 (86.7%) | 47 (13.4%) |
| Life, Physical & Social Science | 159 (47.3%) | 177 (52.7%) |
| Community & Social Service | 458 (30.5%) | 1,043 (69.5%) |
| Education, Arts & Media | 97 (46.0%) | 114 (54.0%) |
| Legal Services & Support | 64 (37.4%) | 107 (62.6%) |
| Education Instruction & Library | 175 (18.7%) | 763 (81.3%) |
| Arts, Media & Entertainment | 122 (67.4%) | 59 (32.6%) |
| Health Diagnosing & Treating | 111 (16.1%) | 577 (83.9%) |
| Health Technologists | 95 (18.1%) | 430 (81.9%) |
| Total (Category) | 3,242 (47.7%) | 3,551 (52.3%) |
| Total (Overall) | 6,684 (51.7%) | 6,235 (48.3%) |
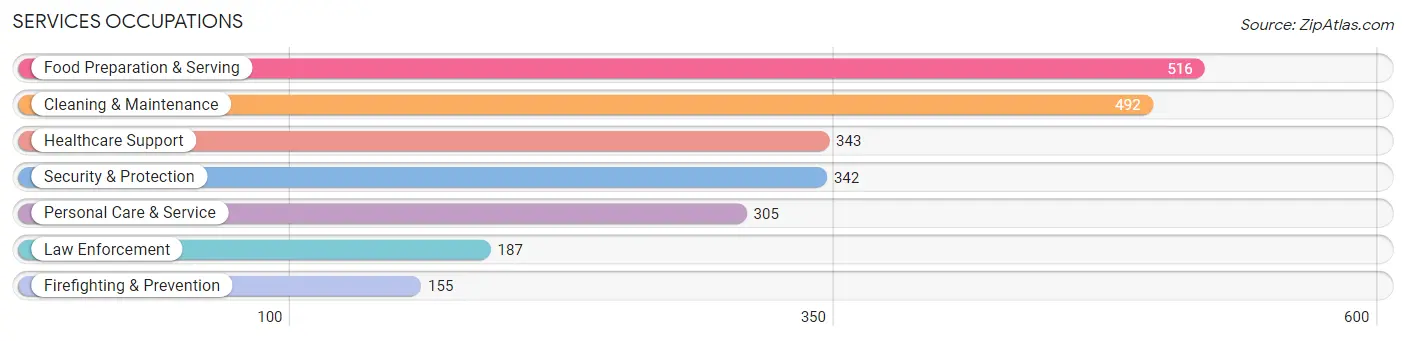
Services Occupations
The most common Services occupations in Ballenger Creek are Food Preparation & Serving (516 | 4.0%), Cleaning & Maintenance (492 | 3.8%), Healthcare Support (343 | 2.7%), Security & Protection (342 | 2.6%), and Personal Care & Service (305 | 2.4%).
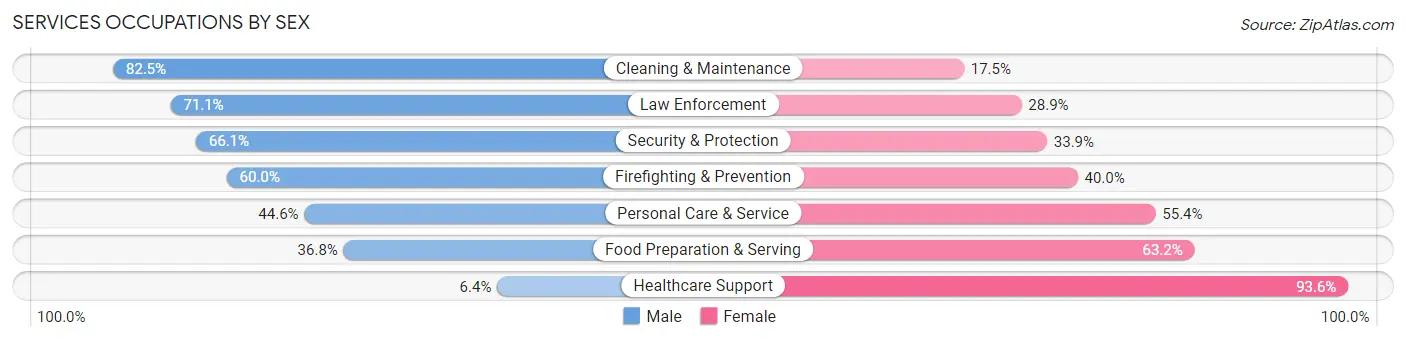
Services Occupations by Sex
Within the Services occupations in Ballenger Creek, the most male-oriented occupations are Cleaning & Maintenance (82.5%), Law Enforcement (71.1%), and Security & Protection (66.1%), while the most female-oriented occupations are Healthcare Support (93.6%), Food Preparation & Serving (63.2%), and Personal Care & Service (55.4%).
| Occupation | Male | Female |
| Healthcare Support | 22 (6.4%) | 321 (93.6%) |
| Security & Protection | 226 (66.1%) | 116 (33.9%) |
| Firefighting & Prevention | 93 (60.0%) | 62 (40.0%) |
| Law Enforcement | 133 (71.1%) | 54 (28.9%) |
| Food Preparation & Serving | 190 (36.8%) | 326 (63.2%) |
| Cleaning & Maintenance | 406 (82.5%) | 86 (17.5%) |
| Personal Care & Service | 136 (44.6%) | 169 (55.4%) |
| Total (Category) | 980 (49.0%) | 1,018 (50.9%) |
| Total (Overall) | 6,684 (51.7%) | 6,235 (48.3%) |
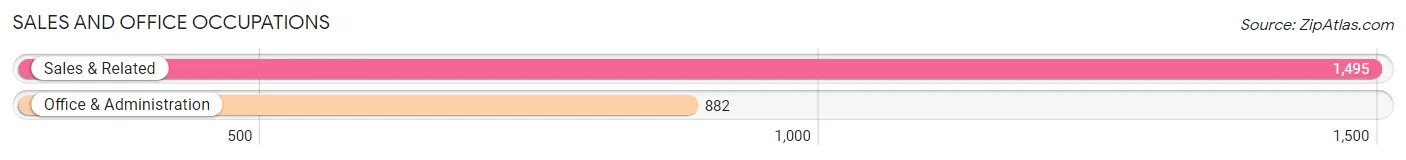
Sales and Office Occupations
The most common Sales and Office occupations in Ballenger Creek are Sales & Related (1,495 | 11.6%), and Office & Administration (882 | 6.8%).
Sales and Office Occupations by Sex
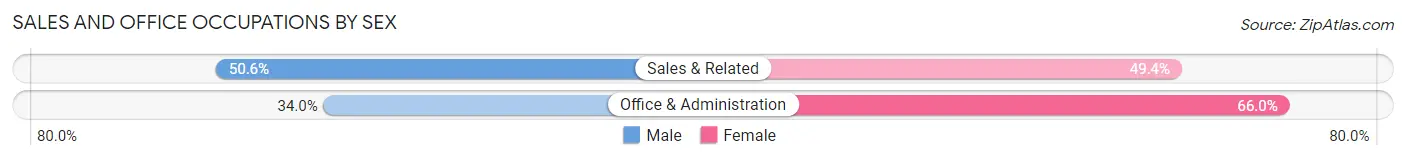
| Occupation | Male | Female |
| Sales & Related | 756 (50.6%) | 739 (49.4%) |
| Office & Administration | 300 (34.0%) | 582 (66.0%) |
| Total (Category) | 1,056 (44.4%) | 1,321 (55.6%) |
| Total (Overall) | 6,684 (51.7%) | 6,235 (48.3%) |
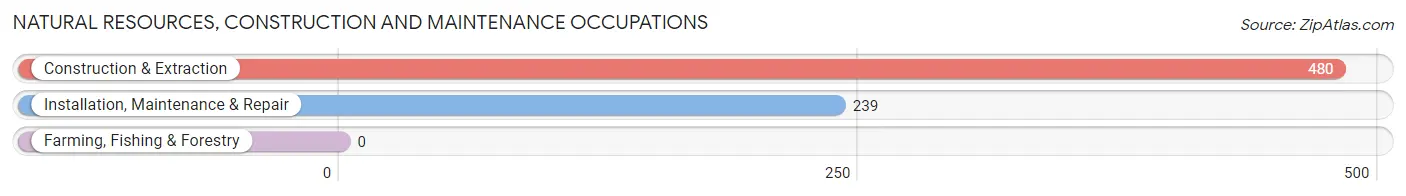
Natural Resources, Construction and Maintenance Occupations
The most common Natural Resources, Construction and Maintenance occupations in Ballenger Creek are Construction & Extraction (480 | 3.7%), and Installation, Maintenance & Repair (239 | 1.8%).
Natural Resources, Construction and Maintenance Occupations by Sex
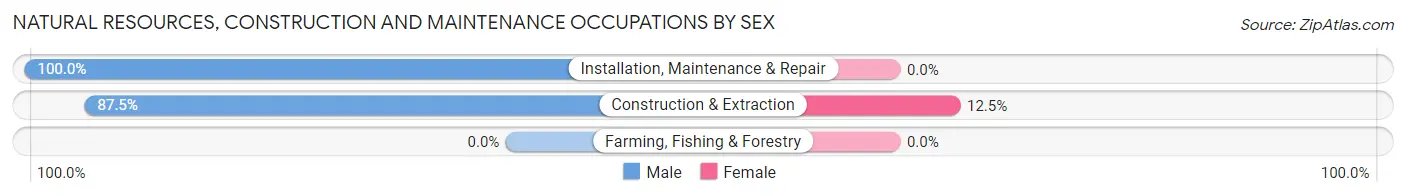
| Occupation | Male | Female |
| Farming, Fishing & Forestry | 0 (0.0%) | 0 (0.0%) |
| Construction & Extraction | 420 (87.5%) | 60 (12.5%) |
| Installation, Maintenance & Repair | 239 (100.0%) | 0 (0.0%) |
| Total (Category) | 659 (91.7%) | 60 (8.3%) |
| Total (Overall) | 6,684 (51.7%) | 6,235 (48.3%) |
Production, Transportation and Moving Occupations
The most common Production, Transportation and Moving occupations in Ballenger Creek are Transportation (365 | 2.8%), Material Moving (365 | 2.8%), and Production (302 | 2.3%).
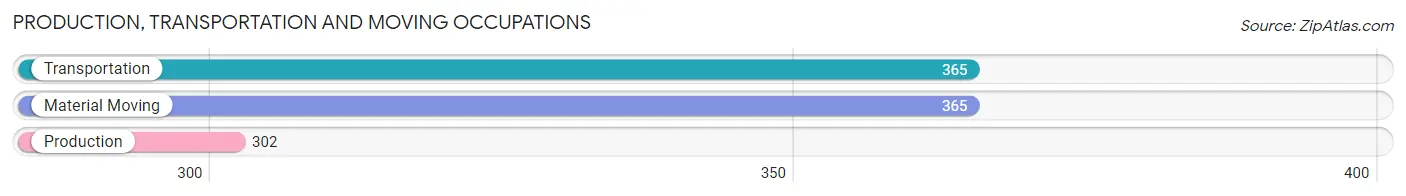
Production, Transportation and Moving Occupations by Sex
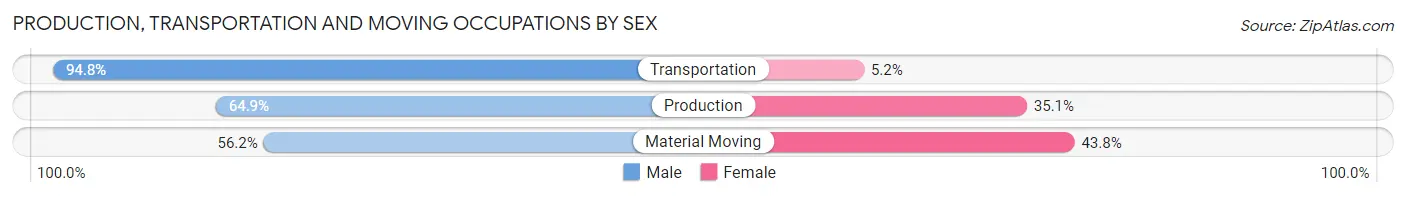
| Occupation | Male | Female |
| Production | 196 (64.9%) | 106 (35.1%) |
| Transportation | 346 (94.8%) | 19 (5.2%) |
| Material Moving | 205 (56.2%) | 160 (43.8%) |
| Total (Category) | 747 (72.4%) | 285 (27.6%) |
| Total (Overall) | 6,684 (51.7%) | 6,235 (48.3%) |
Employment Industries by Sex in Ballenger Creek
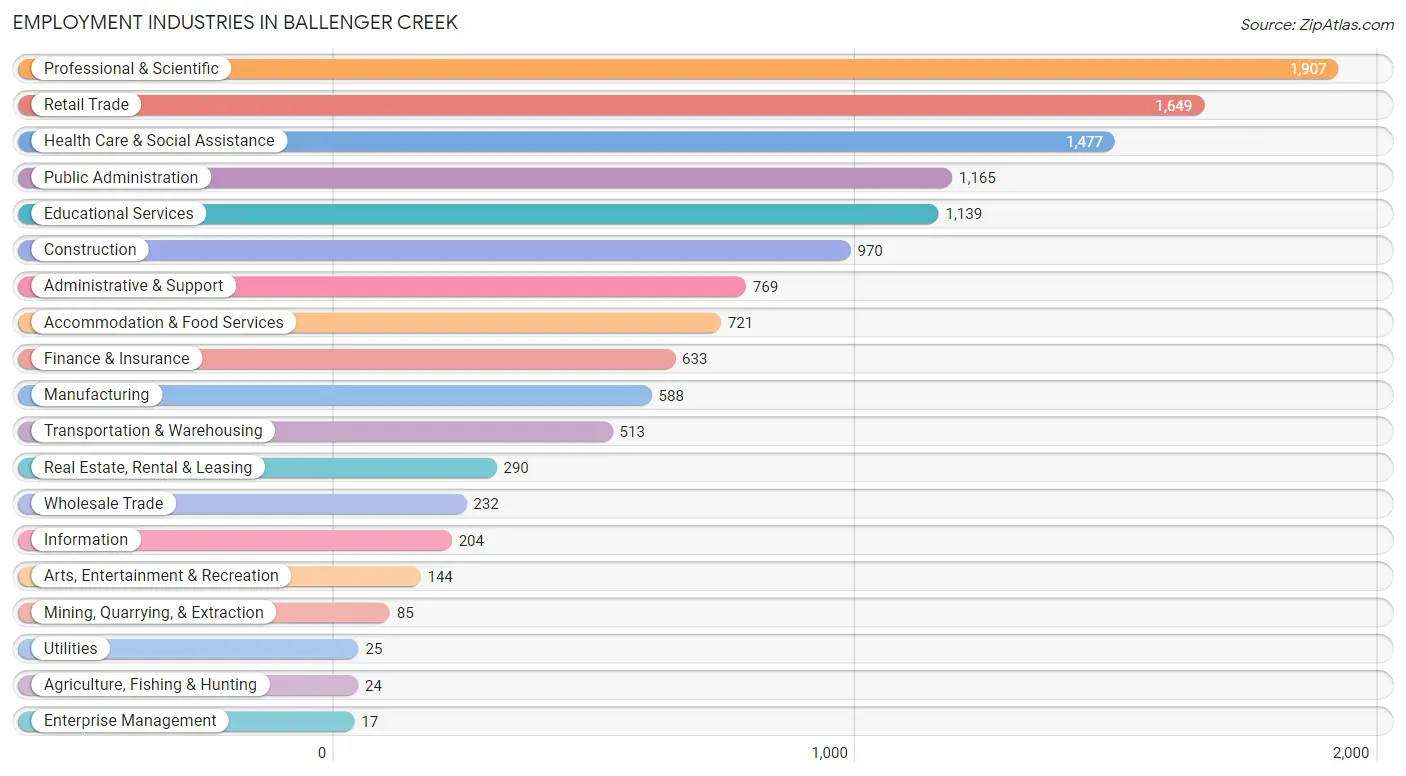
Employment Industries in Ballenger Creek
The major employment industries in Ballenger Creek include Professional & Scientific (1,907 | 14.8%), Retail Trade (1,649 | 12.8%), Health Care & Social Assistance (1,477 | 11.4%), Public Administration (1,165 | 9.0%), and Educational Services (1,139 | 8.8%).
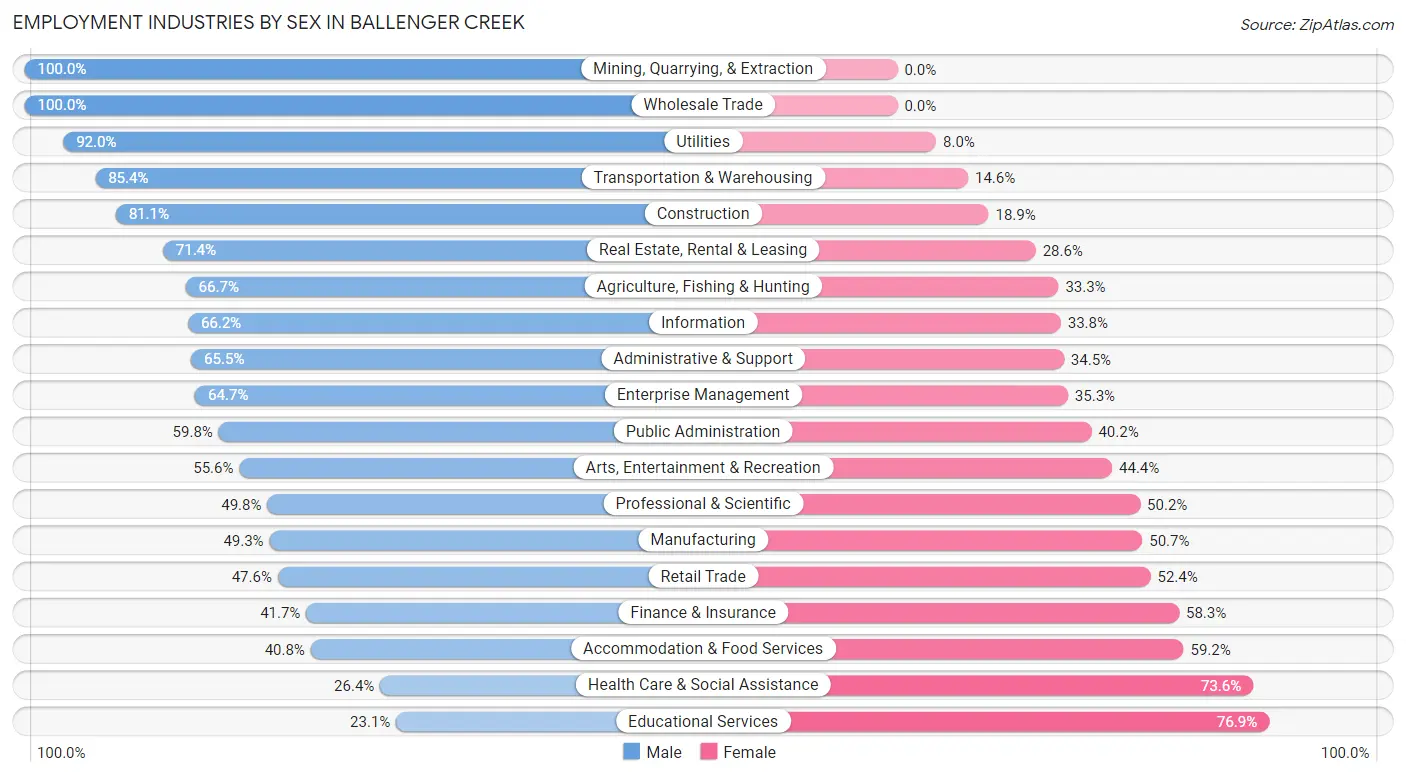
Employment Industries by Sex in Ballenger Creek
The Ballenger Creek industries that see more men than women are Mining, Quarrying, & Extraction (100.0%), Wholesale Trade (100.0%), and Utilities (92.0%), whereas the industries that tend to have a higher number of women are Educational Services (76.9%), Health Care & Social Assistance (73.6%), and Accommodation & Food Services (59.2%).
| Industry | Male | Female |
| Agriculture, Fishing & Hunting | 16 (66.7%) | 8 (33.3%) |
| Mining, Quarrying, & Extraction | 85 (100.0%) | 0 (0.0%) |
| Construction | 787 (81.1%) | 183 (18.9%) |
| Manufacturing | 290 (49.3%) | 298 (50.7%) |
| Wholesale Trade | 232 (100.0%) | 0 (0.0%) |
| Retail Trade | 785 (47.6%) | 864 (52.4%) |
| Transportation & Warehousing | 438 (85.4%) | 75 (14.6%) |
| Utilities | 23 (92.0%) | 2 (8.0%) |
| Information | 135 (66.2%) | 69 (33.8%) |
| Finance & Insurance | 264 (41.7%) | 369 (58.3%) |
| Real Estate, Rental & Leasing | 207 (71.4%) | 83 (28.6%) |
| Professional & Scientific | 949 (49.8%) | 958 (50.2%) |
| Enterprise Management | 11 (64.7%) | 6 (35.3%) |
| Administrative & Support | 504 (65.5%) | 265 (34.5%) |
| Educational Services | 263 (23.1%) | 876 (76.9%) |
| Health Care & Social Assistance | 390 (26.4%) | 1,087 (73.6%) |
| Arts, Entertainment & Recreation | 80 (55.6%) | 64 (44.4%) |
| Accommodation & Food Services | 294 (40.8%) | 427 (59.2%) |
| Public Administration | 697 (59.8%) | 468 (40.2%) |
| Total | 6,684 (51.7%) | 6,235 (48.3%) |
Education in Ballenger Creek
School Enrollment in Ballenger Creek
The most common levels of schooling among the 6,206 students in Ballenger Creek are middle school (1,283 | 20.7%), elementary school (1,173 | 18.9%), and college / undergraduate (1,047 | 16.9%).
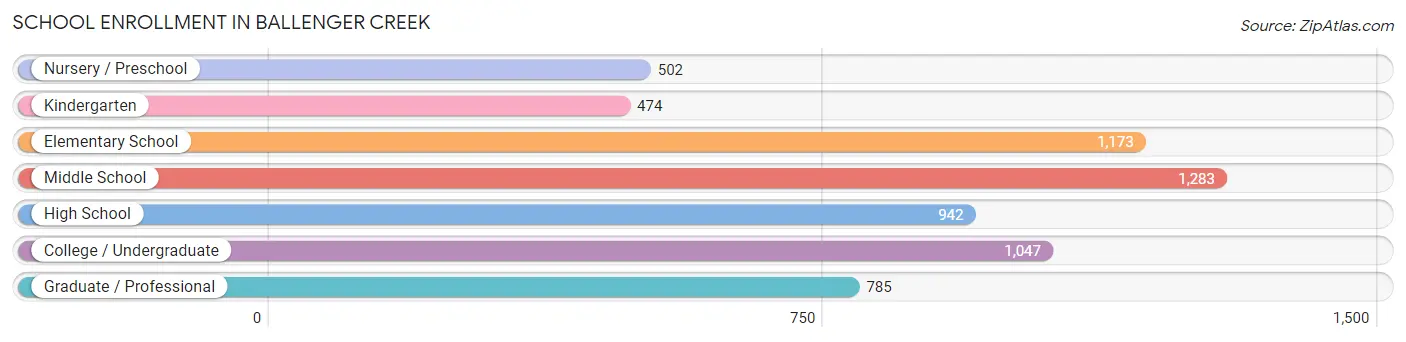
| School Level | # Students | % Students |
| Nursery / Preschool | 502 | 8.1% |
| Kindergarten | 474 | 7.6% |
| Elementary School | 1,173 | 18.9% |
| Middle School | 1,283 | 20.7% |
| High School | 942 | 15.2% |
| College / Undergraduate | 1,047 | 16.9% |
| Graduate / Professional | 785 | 12.7% |
| Total | 6,206 | 100.0% |
School Enrollment by Age by Funding Source in Ballenger Creek
Out of a total of 6,206 students who are enrolled in schools in Ballenger Creek, 832 (13.4%) attend a private institution, while the remaining 5,374 (86.6%) are enrolled in public schools. The age group of 35 years and over has the highest likelihood of being enrolled in private schools, with 157 (30.0% in the age bracket) enrolled. Conversely, the age group of 10 to 14 year olds has the lowest likelihood of being enrolled in a private school, with 1,590 (96.1% in the age bracket) attending a public institution.
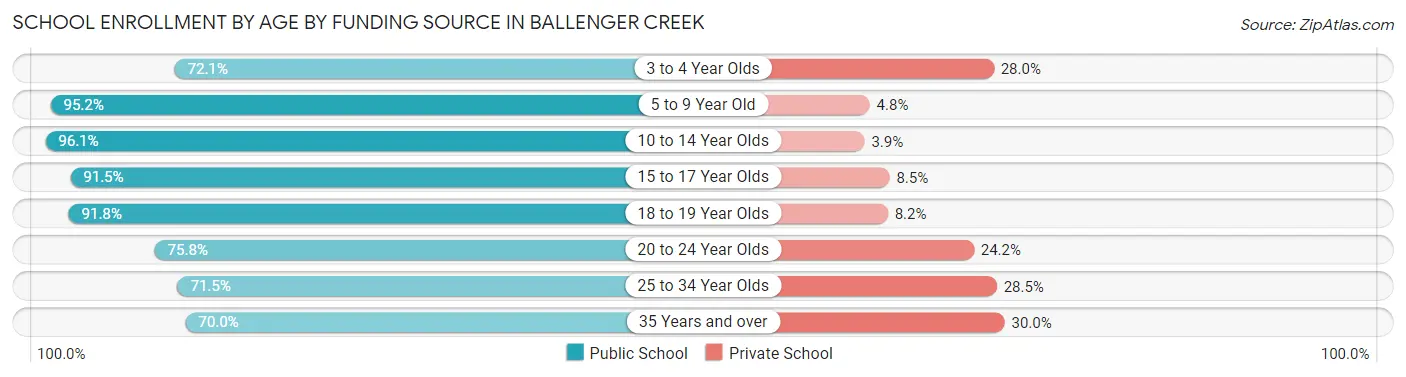
| Age Bracket | Public School | Private School |
| 3 to 4 Year Olds | 379 (72.1%) | 147 (28.0%) |
| 5 to 9 Year Old | 1,317 (95.2%) | 67 (4.8%) |
| 10 to 14 Year Olds | 1,590 (96.1%) | 64 (3.9%) |
| 15 to 17 Year Olds | 590 (91.5%) | 55 (8.5%) |
| 18 to 19 Year Olds | 235 (91.8%) | 21 (8.2%) |
| 20 to 24 Year Olds | 441 (75.8%) | 141 (24.2%) |
| 25 to 34 Year Olds | 454 (71.5%) | 181 (28.5%) |
| 35 Years and over | 367 (70.0%) | 157 (30.0%) |
| Total | 5,374 (86.6%) | 832 (13.4%) |
Educational Attainment by Field of Study in Ballenger Creek
Business (1,224 | 15.2%), engineering (927 | 11.5%), social sciences (817 | 10.1%), bio, nature & agricultural (750 | 9.3%), and education (715 | 8.9%) are the most common fields of study among 8,057 individuals in Ballenger Creek who have obtained a bachelor's degree or higher.
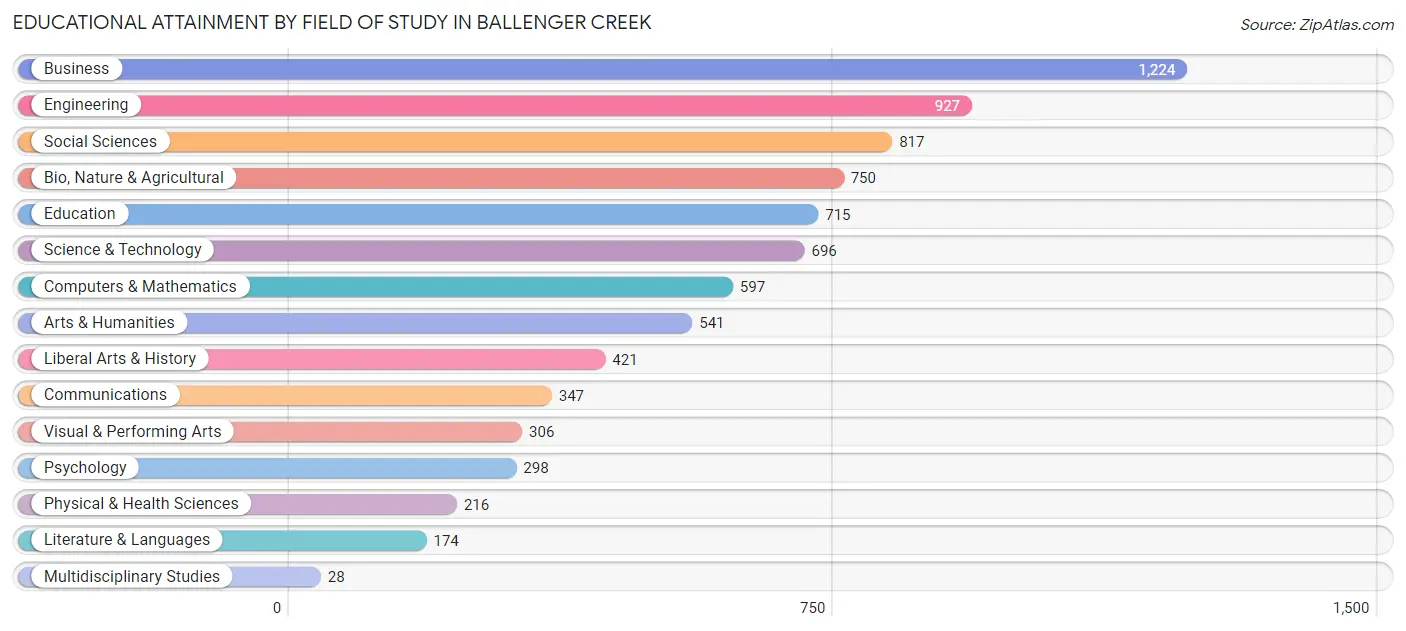
| Field of Study | # Graduates | % Graduates |
| Computers & Mathematics | 597 | 7.4% |
| Bio, Nature & Agricultural | 750 | 9.3% |
| Physical & Health Sciences | 216 | 2.7% |
| Psychology | 298 | 3.7% |
| Social Sciences | 817 | 10.1% |
| Engineering | 927 | 11.5% |
| Multidisciplinary Studies | 28 | 0.4% |
| Science & Technology | 696 | 8.6% |
| Business | 1,224 | 15.2% |
| Education | 715 | 8.9% |
| Literature & Languages | 174 | 2.2% |
| Liberal Arts & History | 421 | 5.2% |
| Visual & Performing Arts | 306 | 3.8% |
| Communications | 347 | 4.3% |
| Arts & Humanities | 541 | 6.7% |
| Total | 8,057 | 100.0% |
Transportation & Commute in Ballenger Creek
Vehicle Availability by Sex in Ballenger Creek
The most prevalent vehicle ownership categories in Ballenger Creek are males with 2 vehicles (2,847, accounting for 42.2%) and females with 2 vehicles (2,564, making up 46.9%).
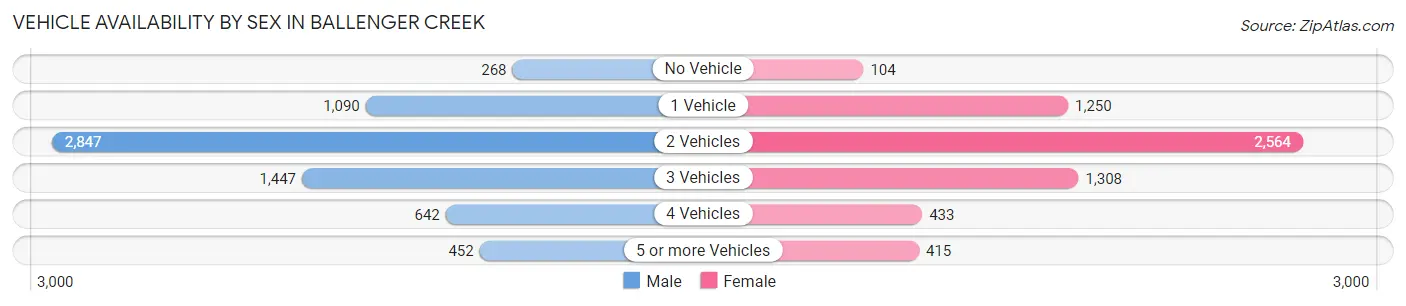
| Vehicles Available | Male | Female |
| No Vehicle | 268 (4.0%) | 104 (1.7%) |
| 1 Vehicle | 1,090 (16.2%) | 1,250 (20.6%) |
| 2 Vehicles | 2,847 (42.2%) | 2,564 (42.2%) |
| 3 Vehicles | 1,447 (21.4%) | 1,308 (21.5%) |
| 4 Vehicles | 642 (9.5%) | 433 (7.1%) |
| 5 or more Vehicles | 452 (6.7%) | 415 (6.8%) |
| Total | 6,746 (100.0%) | 6,074 (100.0%) |
Commute Time in Ballenger Creek
The most frequently occuring commute durations in Ballenger Creek are 45 to 59 minutes (1,705 commuters, 15.9%), 60 to 89 minutes (1,614 commuters, 15.1%), and 15 to 19 minutes (1,414 commuters, 13.2%).
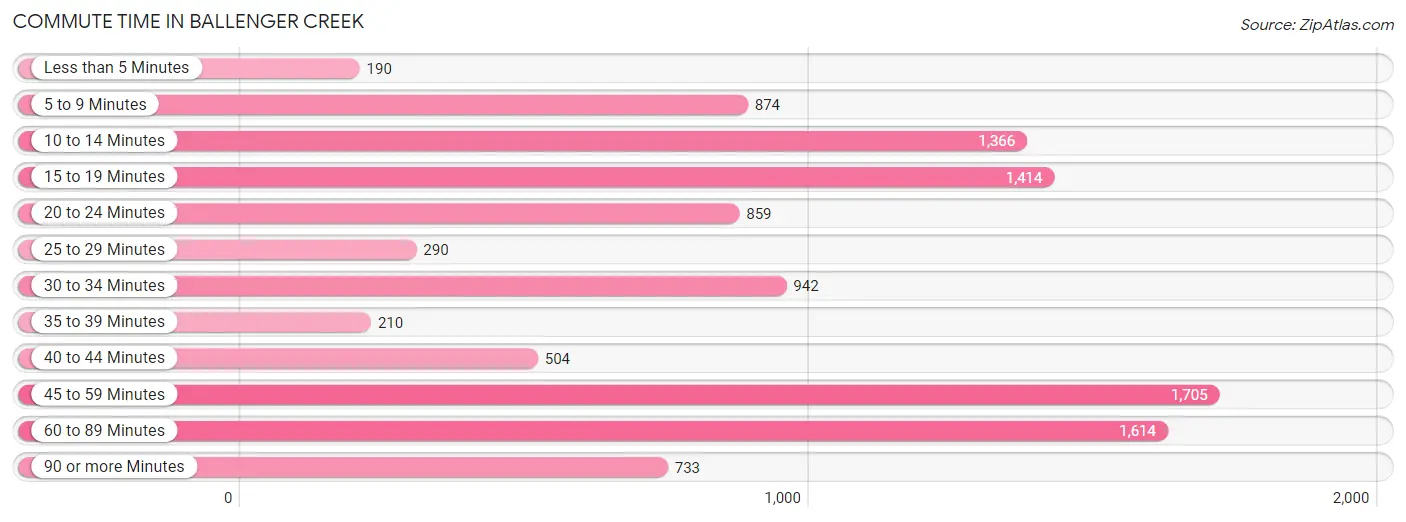
| Commute Time | # Commuters | % Commuters |
| Less than 5 Minutes | 190 | 1.8% |
| 5 to 9 Minutes | 874 | 8.2% |
| 10 to 14 Minutes | 1,366 | 12.8% |
| 15 to 19 Minutes | 1,414 | 13.2% |
| 20 to 24 Minutes | 859 | 8.0% |
| 25 to 29 Minutes | 290 | 2.7% |
| 30 to 34 Minutes | 942 | 8.8% |
| 35 to 39 Minutes | 210 | 2.0% |
| 40 to 44 Minutes | 504 | 4.7% |
| 45 to 59 Minutes | 1,705 | 15.9% |
| 60 to 89 Minutes | 1,614 | 15.1% |
| 90 or more Minutes | 733 | 6.9% |
Commute Time by Sex in Ballenger Creek
The most common commute times in Ballenger Creek are 45 to 59 minutes (1,187 commuters, 20.1%) for males and 10 to 14 minutes (801 commuters, 16.7%) for females.
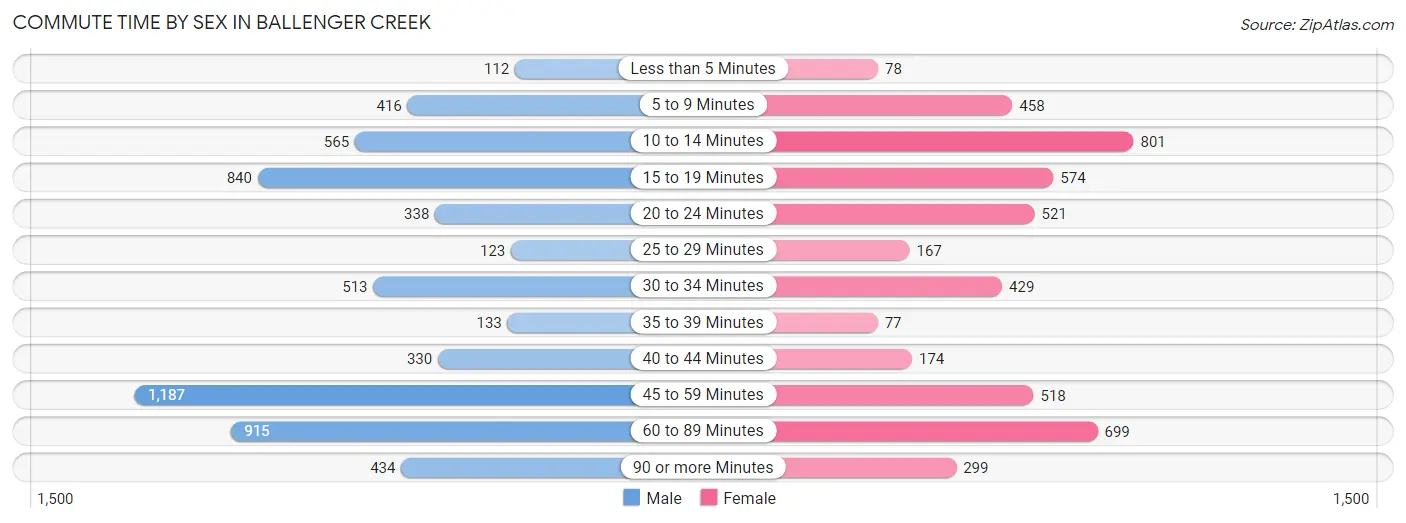
| Commute Time | Male | Female |
| Less than 5 Minutes | 112 (1.9%) | 78 (1.6%) |
| 5 to 9 Minutes | 416 (7.0%) | 458 (9.6%) |
| 10 to 14 Minutes | 565 (9.6%) | 801 (16.7%) |
| 15 to 19 Minutes | 840 (14.2%) | 574 (12.0%) |
| 20 to 24 Minutes | 338 (5.7%) | 521 (10.9%) |
| 25 to 29 Minutes | 123 (2.1%) | 167 (3.5%) |
| 30 to 34 Minutes | 513 (8.7%) | 429 (8.9%) |
| 35 to 39 Minutes | 133 (2.2%) | 77 (1.6%) |
| 40 to 44 Minutes | 330 (5.6%) | 174 (3.6%) |
| 45 to 59 Minutes | 1,187 (20.1%) | 518 (10.8%) |
| 60 to 89 Minutes | 915 (15.5%) | 699 (14.6%) |
| 90 or more Minutes | 434 (7.3%) | 299 (6.2%) |
Time of Departure to Work by Sex in Ballenger Creek
The most frequent times of departure to work in Ballenger Creek are 6:30 AM to 6:59 AM (758, 12.8%) for males and 7:30 AM to 7:59 AM (827, 17.2%) for females.
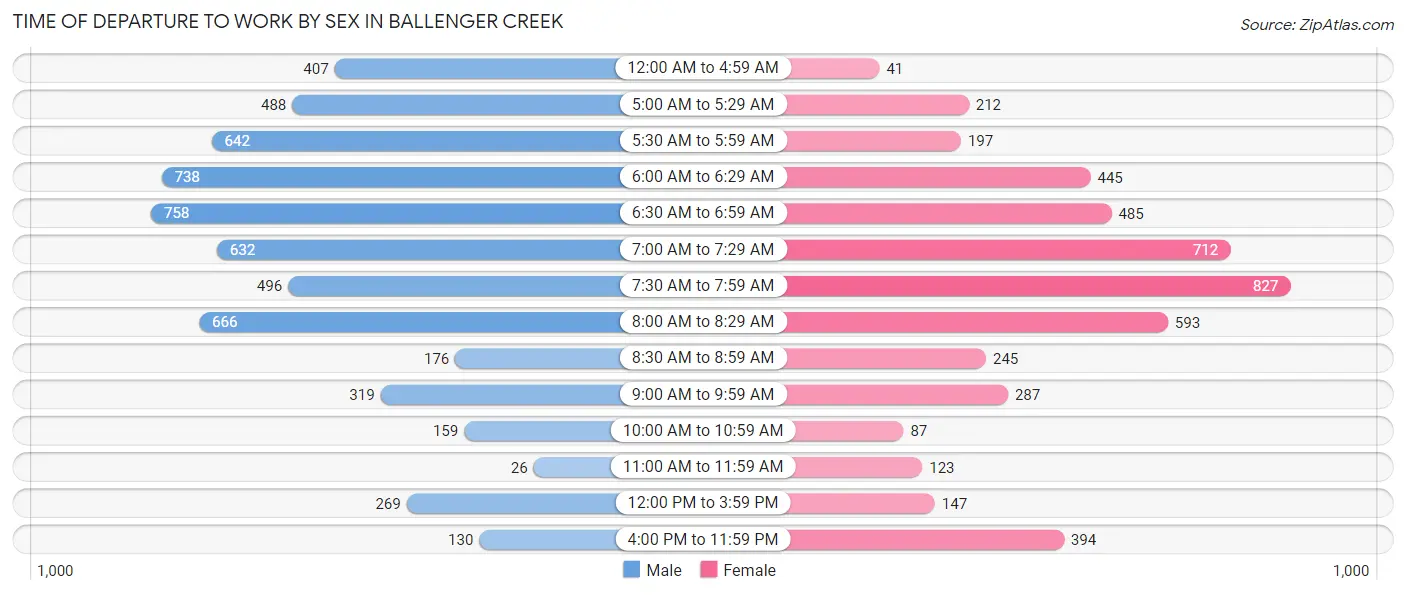
| Time of Departure | Male | Female |
| 12:00 AM to 4:59 AM | 407 (6.9%) | 41 (0.9%) |
| 5:00 AM to 5:29 AM | 488 (8.3%) | 212 (4.4%) |
| 5:30 AM to 5:59 AM | 642 (10.9%) | 197 (4.1%) |
| 6:00 AM to 6:29 AM | 738 (12.5%) | 445 (9.3%) |
| 6:30 AM to 6:59 AM | 758 (12.8%) | 485 (10.1%) |
| 7:00 AM to 7:29 AM | 632 (10.7%) | 712 (14.8%) |
| 7:30 AM to 7:59 AM | 496 (8.4%) | 827 (17.2%) |
| 8:00 AM to 8:29 AM | 666 (11.3%) | 593 (12.4%) |
| 8:30 AM to 8:59 AM | 176 (3.0%) | 245 (5.1%) |
| 9:00 AM to 9:59 AM | 319 (5.4%) | 287 (6.0%) |
| 10:00 AM to 10:59 AM | 159 (2.7%) | 87 (1.8%) |
| 11:00 AM to 11:59 AM | 26 (0.4%) | 123 (2.6%) |
| 12:00 PM to 3:59 PM | 269 (4.5%) | 147 (3.1%) |
| 4:00 PM to 11:59 PM | 130 (2.2%) | 394 (8.2%) |
| Total | 5,906 (100.0%) | 4,795 (100.0%) |
Housing Occupancy in Ballenger Creek
Occupancy by Ownership in Ballenger Creek
Of the total 9,279 dwellings in Ballenger Creek, owner-occupied units account for 6,110 (65.8%), while renter-occupied units make up 3,169 (34.2%).
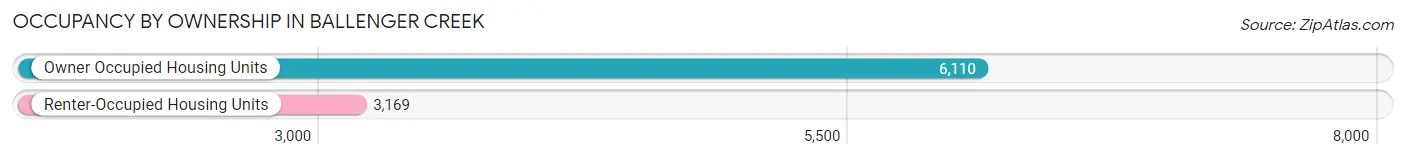
| Occupancy | # Housing Units | % Housing Units |
| Owner Occupied Housing Units | 6,110 | 65.8% |
| Renter-Occupied Housing Units | 3,169 | 34.2% |
| Total Occupied Housing Units | 9,279 | 100.0% |
Occupancy by Household Size in Ballenger Creek
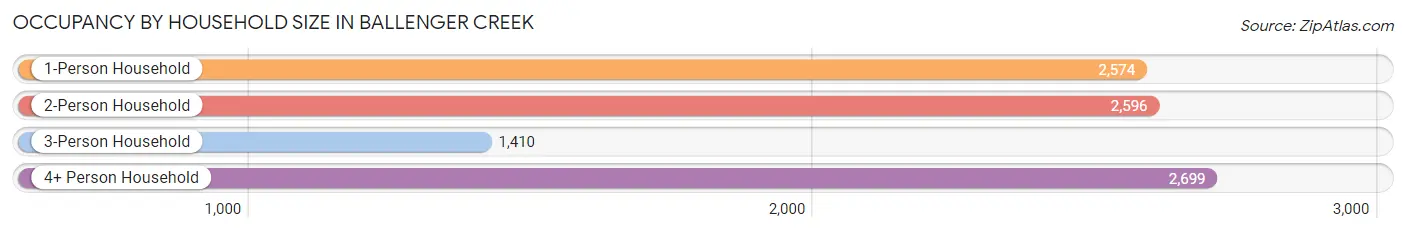
| Household Size | # Housing Units | % Housing Units |
| 1-Person Household | 2,574 | 27.7% |
| 2-Person Household | 2,596 | 28.0% |
| 3-Person Household | 1,410 | 15.2% |
| 4+ Person Household | 2,699 | 29.1% |
| Total Housing Units | 9,279 | 100.0% |
Occupancy by Ownership by Household Size in Ballenger Creek
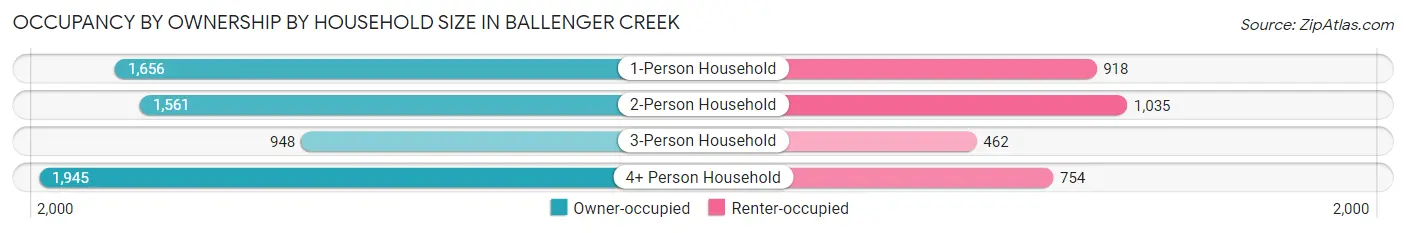
| Household Size | Owner-occupied | Renter-occupied |
| 1-Person Household | 1,656 (64.3%) | 918 (35.7%) |
| 2-Person Household | 1,561 (60.1%) | 1,035 (39.9%) |
| 3-Person Household | 948 (67.2%) | 462 (32.8%) |
| 4+ Person Household | 1,945 (72.1%) | 754 (27.9%) |
| Total Housing Units | 6,110 (65.8%) | 3,169 (34.2%) |
Occupancy by Educational Attainment in Ballenger Creek
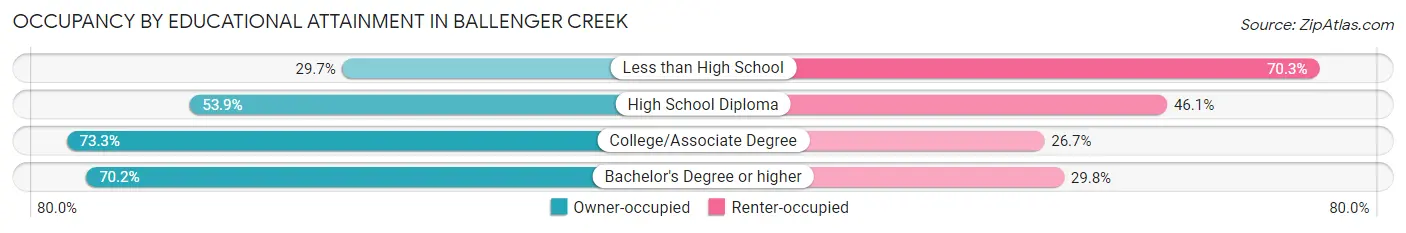
| Household Size | Owner-occupied | Renter-occupied |
| Less than High School | 121 (29.7%) | 286 (70.3%) |
| High School Diploma | 1,030 (53.9%) | 882 (46.1%) |
| College/Associate Degree | 1,694 (73.3%) | 616 (26.7%) |
| Bachelor's Degree or higher | 3,265 (70.2%) | 1,385 (29.8%) |
Occupancy by Age of Householder in Ballenger Creek
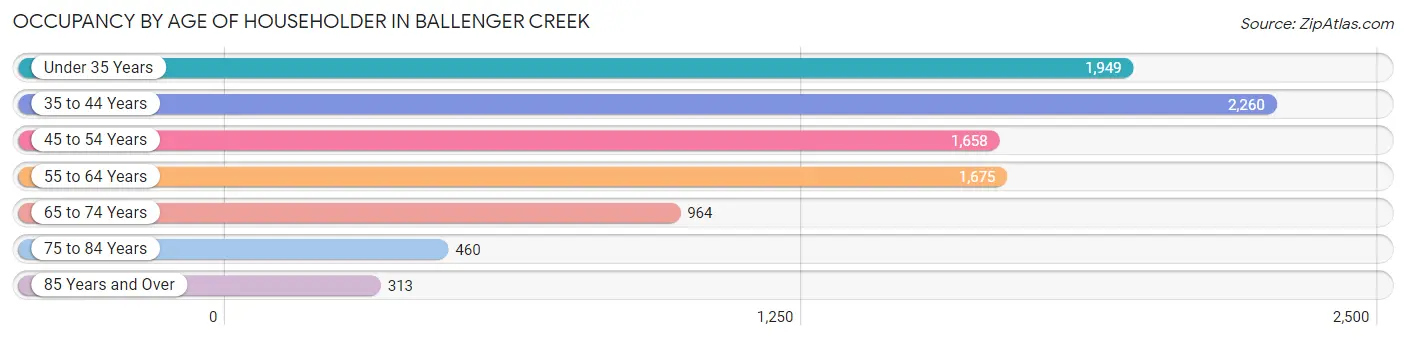
| Age Bracket | # Households | % Households |
| Under 35 Years | 1,949 | 21.0% |
| 35 to 44 Years | 2,260 | 24.4% |
| 45 to 54 Years | 1,658 | 17.9% |
| 55 to 64 Years | 1,675 | 18.0% |
| 65 to 74 Years | 964 | 10.4% |
| 75 to 84 Years | 460 | 5.0% |
| 85 Years and Over | 313 | 3.4% |
| Total | 9,279 | 100.0% |
Housing Finances in Ballenger Creek
Median Income by Occupancy in Ballenger Creek
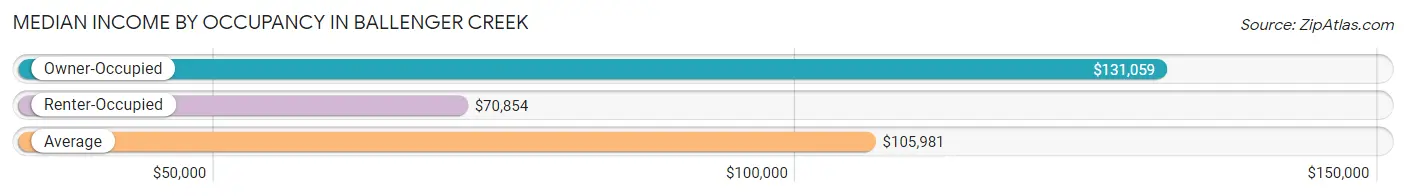
| Occupancy Type | # Households | Median Income |
| Owner-Occupied | 6,110 (65.8%) | $131,059 |
| Renter-Occupied | 3,169 (34.2%) | $70,854 |
| Average | 9,279 (100.0%) | $105,981 |
Occupancy by Householder Income Bracket in Ballenger Creek
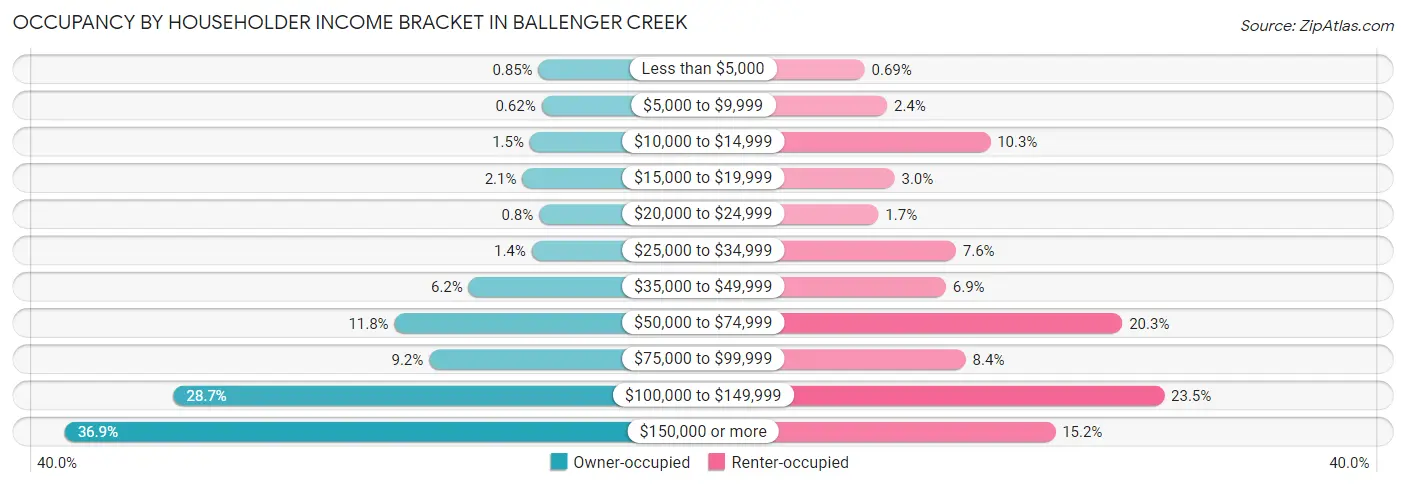
| Income Bracket | Owner-occupied | Renter-occupied |
| Less than $5,000 | 52 (0.9%) | 22 (0.7%) |
| $5,000 to $9,999 | 38 (0.6%) | 76 (2.4%) |
| $10,000 to $14,999 | 92 (1.5%) | 325 (10.3%) |
| $15,000 to $19,999 | 127 (2.1%) | 94 (3.0%) |
| $20,000 to $24,999 | 49 (0.8%) | 55 (1.7%) |
| $25,000 to $34,999 | 84 (1.4%) | 242 (7.6%) |
| $35,000 to $49,999 | 377 (6.2%) | 218 (6.9%) |
| $50,000 to $74,999 | 722 (11.8%) | 644 (20.3%) |
| $75,000 to $99,999 | 561 (9.2%) | 266 (8.4%) |
| $100,000 to $149,999 | 1,751 (28.7%) | 745 (23.5%) |
| $150,000 or more | 2,257 (36.9%) | 482 (15.2%) |
| Total | 6,110 (100.0%) | 3,169 (100.0%) |
Monthly Housing Cost Tiers in Ballenger Creek
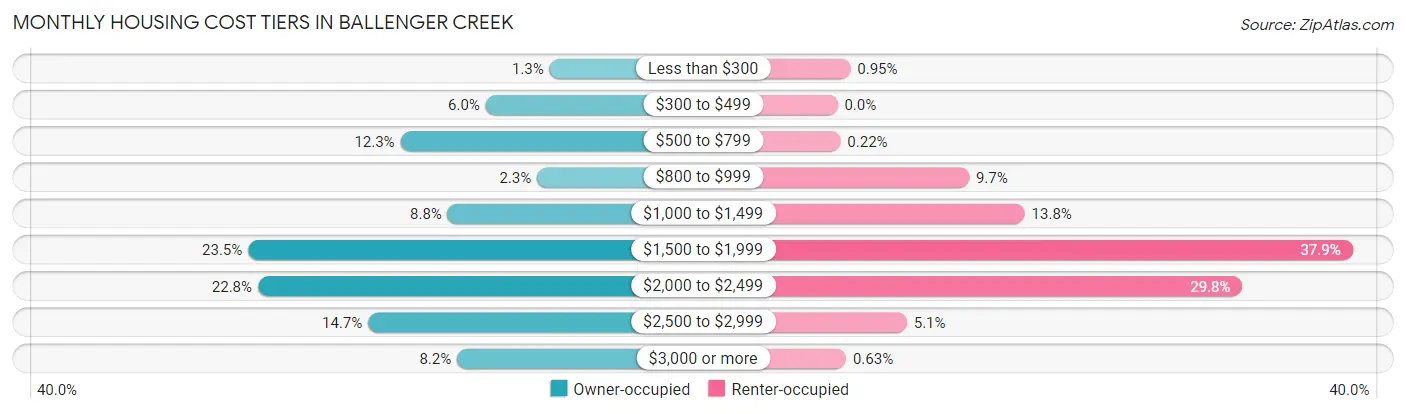
| Monthly Cost | Owner-occupied | Renter-occupied |
| Less than $300 | 82 (1.3%) | 30 (0.9%) |
| $300 to $499 | 369 (6.0%) | 0 (0.0%) |
| $500 to $799 | 753 (12.3%) | 7 (0.2%) |
| $800 to $999 | 138 (2.3%) | 307 (9.7%) |
| $1,000 to $1,499 | 540 (8.8%) | 437 (13.8%) |
| $1,500 to $1,999 | 1,438 (23.5%) | 1,202 (37.9%) |
| $2,000 to $2,499 | 1,394 (22.8%) | 945 (29.8%) |
| $2,500 to $2,999 | 898 (14.7%) | 162 (5.1%) |
| $3,000 or more | 498 (8.2%) | 20 (0.6%) |
| Total | 6,110 (100.0%) | 3,169 (100.0%) |
Physical Housing Characteristics in Ballenger Creek
Housing Structures in Ballenger Creek
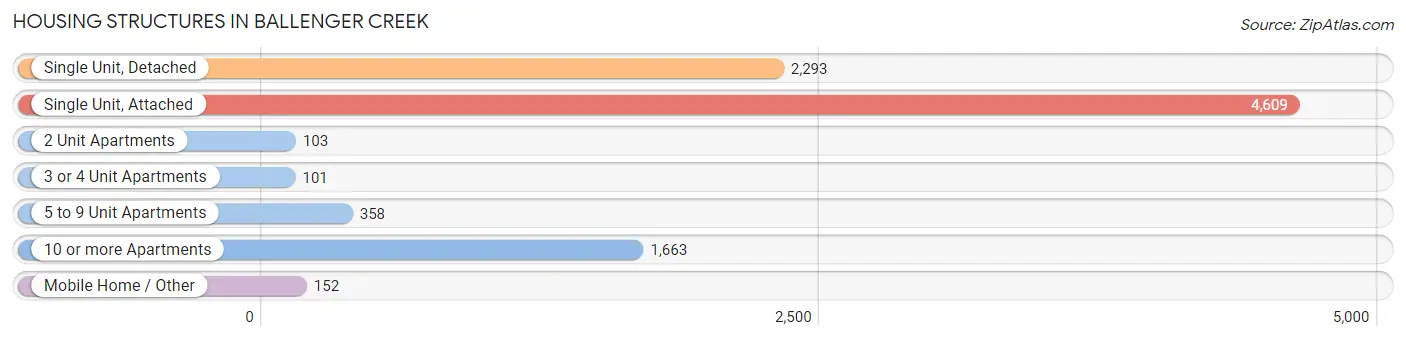
| Structure Type | # Housing Units | % Housing Units |
| Single Unit, Detached | 2,293 | 24.7% |
| Single Unit, Attached | 4,609 | 49.7% |
| 2 Unit Apartments | 103 | 1.1% |
| 3 or 4 Unit Apartments | 101 | 1.1% |
| 5 to 9 Unit Apartments | 358 | 3.9% |
| 10 or more Apartments | 1,663 | 17.9% |
| Mobile Home / Other | 152 | 1.6% |
| Total | 9,279 | 100.0% |
Housing Structures by Occupancy in Ballenger Creek
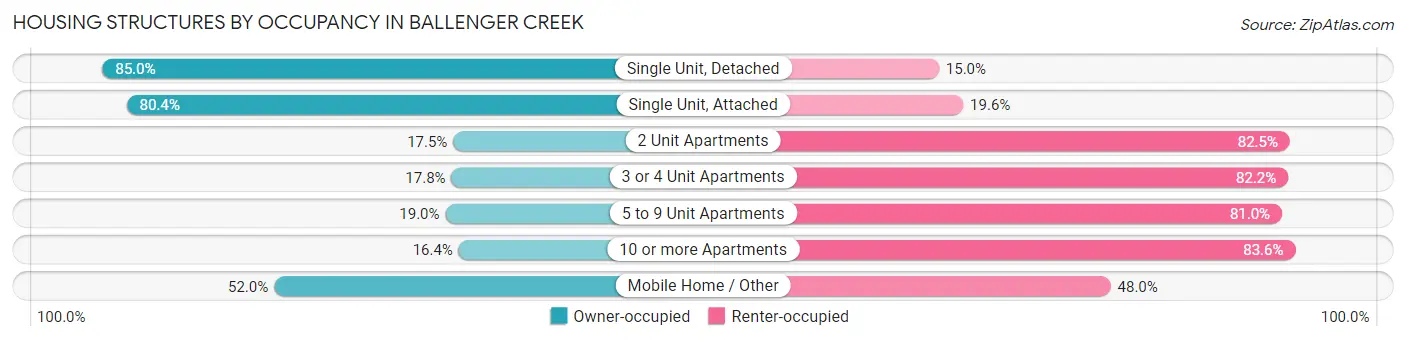
| Structure Type | Owner-occupied | Renter-occupied |
| Single Unit, Detached | 1,950 (85.0%) | 343 (15.0%) |
| Single Unit, Attached | 3,704 (80.4%) | 905 (19.6%) |
| 2 Unit Apartments | 18 (17.5%) | 85 (82.5%) |
| 3 or 4 Unit Apartments | 18 (17.8%) | 83 (82.2%) |
| 5 to 9 Unit Apartments | 68 (19.0%) | 290 (81.0%) |
| 10 or more Apartments | 273 (16.4%) | 1,390 (83.6%) |
| Mobile Home / Other | 79 (52.0%) | 73 (48.0%) |
| Total | 6,110 (65.8%) | 3,169 (34.2%) |
Housing Structures by Number of Rooms in Ballenger Creek
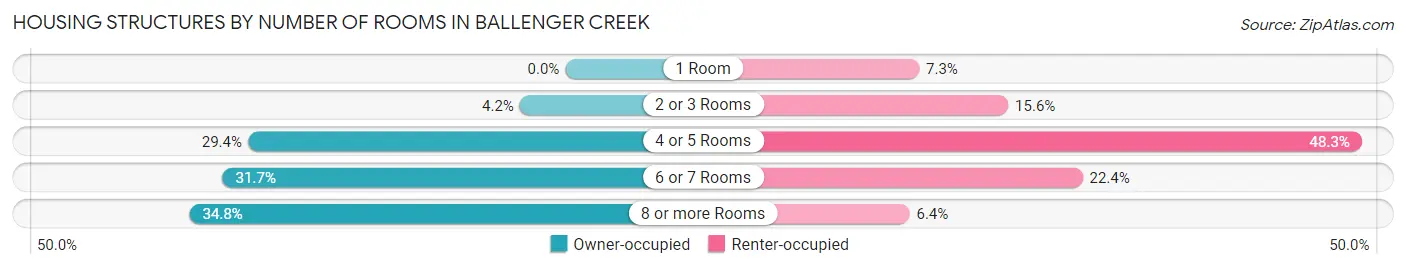
| Number of Rooms | Owner-occupied | Renter-occupied |
| 1 Room | 0 (0.0%) | 232 (7.3%) |
| 2 or 3 Rooms | 257 (4.2%) | 493 (15.6%) |
| 4 or 5 Rooms | 1,794 (29.4%) | 1,529 (48.2%) |
| 6 or 7 Rooms | 1,936 (31.7%) | 711 (22.4%) |
| 8 or more Rooms | 2,123 (34.7%) | 204 (6.4%) |
| Total | 6,110 (100.0%) | 3,169 (100.0%) |
Housing Structure by Heating Type in Ballenger Creek
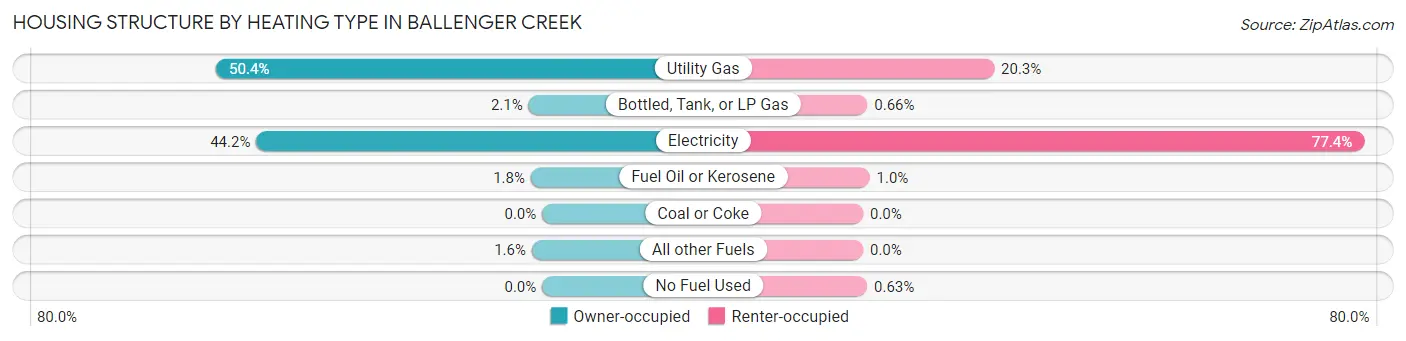
| Heating Type | Owner-occupied | Renter-occupied |
| Utility Gas | 3,078 (50.4%) | 642 (20.3%) |
| Bottled, Tank, or LP Gas | 128 (2.1%) | 21 (0.7%) |
| Electricity | 2,700 (44.2%) | 2,454 (77.4%) |
| Fuel Oil or Kerosene | 107 (1.8%) | 32 (1.0%) |
| Coal or Coke | 0 (0.0%) | 0 (0.0%) |
| All other Fuels | 97 (1.6%) | 0 (0.0%) |
| No Fuel Used | 0 (0.0%) | 20 (0.6%) |
| Total | 6,110 (100.0%) | 3,169 (100.0%) |
Household Vehicle Usage in Ballenger Creek
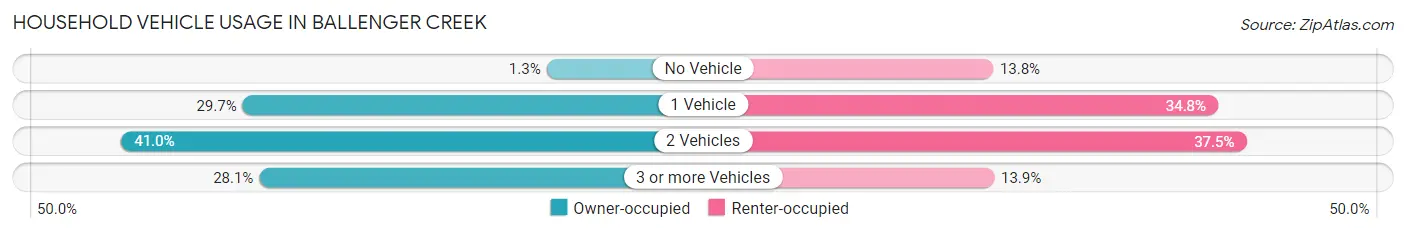
| Vehicles per Household | Owner-occupied | Renter-occupied |
| No Vehicle | 78 (1.3%) | 438 (13.8%) |
| 1 Vehicle | 1,812 (29.7%) | 1,103 (34.8%) |
| 2 Vehicles | 2,503 (41.0%) | 1,187 (37.5%) |
| 3 or more Vehicles | 1,717 (28.1%) | 441 (13.9%) |
| Total | 6,110 (100.0%) | 3,169 (100.0%) |
Real Estate & Mortgages in Ballenger Creek
Real Estate and Mortgage Overview in Ballenger Creek
| Characteristic | Without Mortgage | With Mortgage |
| Housing Units | 1,235 | 4,875 |
| Median Property Value | $310,000 | $354,600 |
| Median Household Income | $93,661 | $1,907 |
| Monthly Housing Costs | $546 | $498 |
| Real Estate Taxes | $2,902 | $73 |
Property Value by Mortgage Status in Ballenger Creek
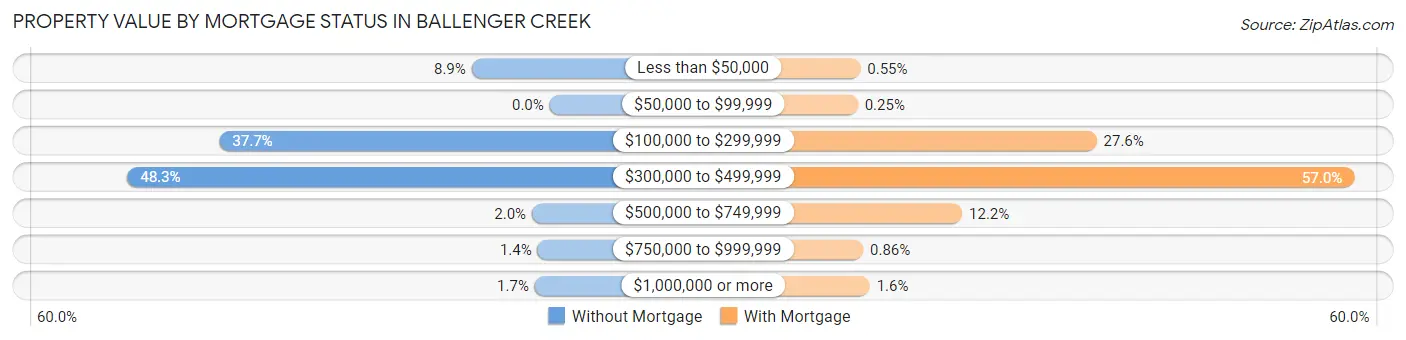
| Property Value | Without Mortgage | With Mortgage |
| Less than $50,000 | 110 (8.9%) | 27 (0.5%) |
| $50,000 to $99,999 | 0 (0.0%) | 12 (0.3%) |
| $100,000 to $299,999 | 466 (37.7%) | 1,343 (27.6%) |
| $300,000 to $499,999 | 596 (48.3%) | 2,778 (57.0%) |
| $500,000 to $749,999 | 25 (2.0%) | 594 (12.2%) |
| $750,000 to $999,999 | 17 (1.4%) | 42 (0.9%) |
| $1,000,000 or more | 21 (1.7%) | 79 (1.6%) |
| Total | 1,235 (100.0%) | 4,875 (100.0%) |
Household Income by Mortgage Status in Ballenger Creek
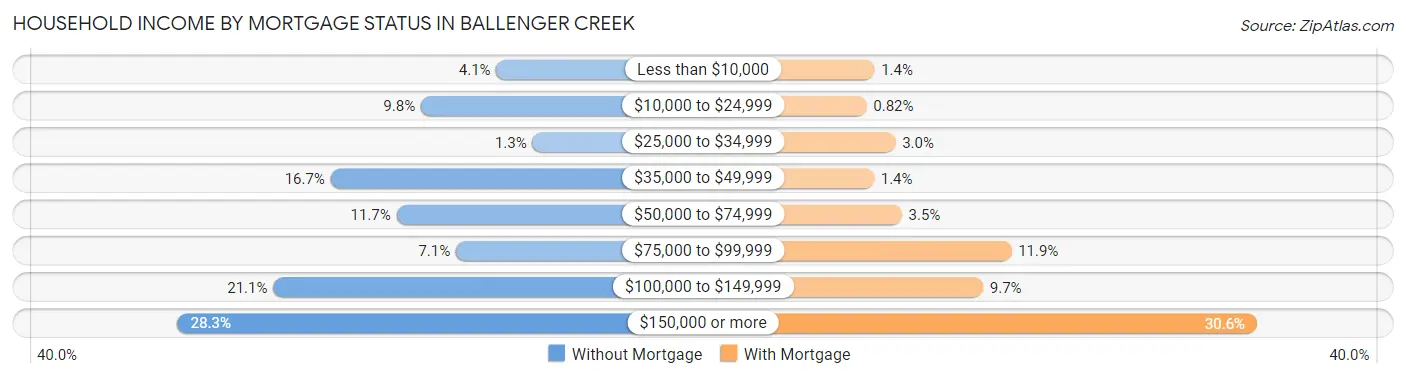
| Household Income | Without Mortgage | With Mortgage |
| Less than $10,000 | 50 (4.1%) | 69 (1.4%) |
| $10,000 to $24,999 | 121 (9.8%) | 40 (0.8%) |
| $25,000 to $34,999 | 16 (1.3%) | 147 (3.0%) |
| $35,000 to $49,999 | 206 (16.7%) | 68 (1.4%) |
| $50,000 to $74,999 | 144 (11.7%) | 171 (3.5%) |
| $75,000 to $99,999 | 88 (7.1%) | 578 (11.9%) |
| $100,000 to $149,999 | 260 (21.0%) | 473 (9.7%) |
| $150,000 or more | 350 (28.3%) | 1,491 (30.6%) |
| Total | 1,235 (100.0%) | 4,875 (100.0%) |
Property Value to Household Income Ratio in Ballenger Creek
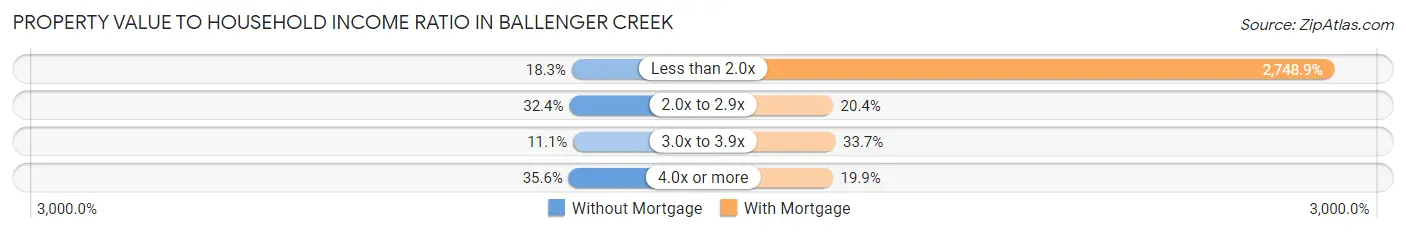
| Value-to-Income Ratio | Without Mortgage | With Mortgage |
| Less than 2.0x | 226 (18.3%) | 134,011 (2,748.9%) |
| 2.0x to 2.9x | 400 (32.4%) | 993 (20.4%) |
| 3.0x to 3.9x | 137 (11.1%) | 1,643 (33.7%) |
| 4.0x or more | 439 (35.5%) | 972 (19.9%) |
| Total | 1,235 (100.0%) | 4,875 (100.0%) |
Real Estate Taxes by Mortgage Status in Ballenger Creek
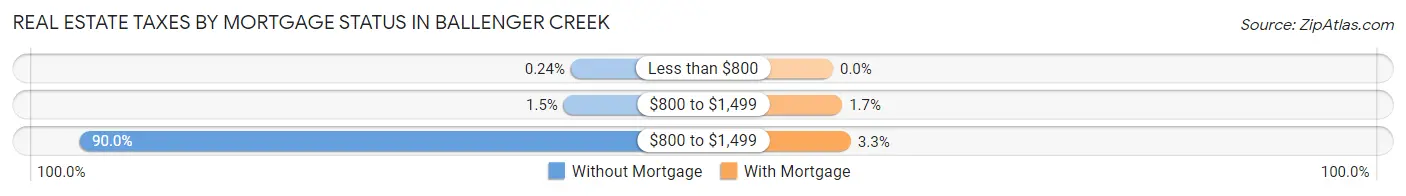
| Property Taxes | Without Mortgage | With Mortgage |
| Less than $800 | 3 (0.2%) | 0 (0.0%) |
| $800 to $1,499 | 19 (1.5%) | 82 (1.7%) |
| $800 to $1,499 | 1,112 (90.0%) | 159 (3.3%) |
| Total | 1,235 (100.0%) | 4,875 (100.0%) |
Health & Disability in Ballenger Creek
Health Insurance Coverage by Age in Ballenger Creek
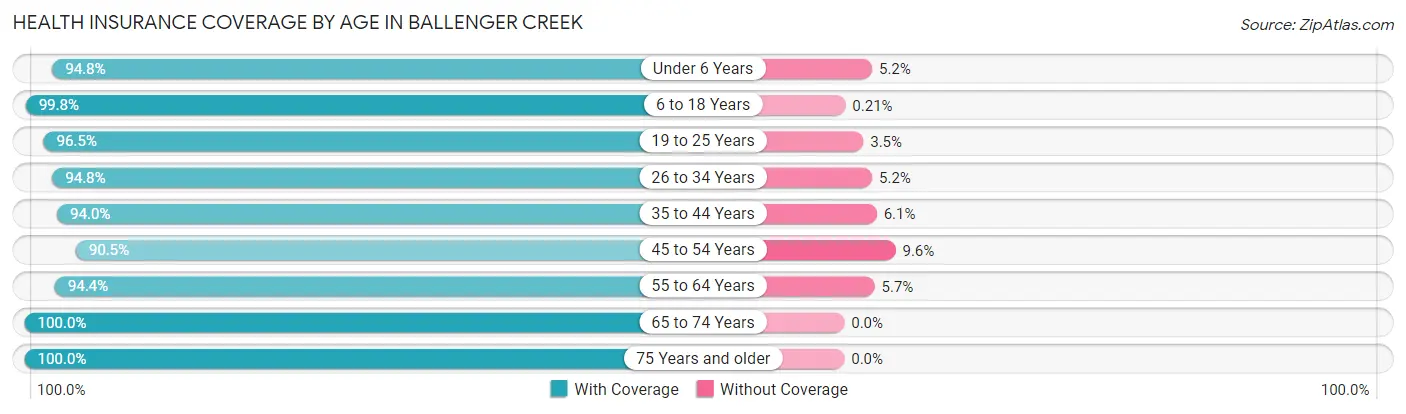
| Age Bracket | With Coverage | Without Coverage |
| Under 6 Years | 2,236 (94.8%) | 122 (5.2%) |
| 6 to 18 Years | 3,849 (99.8%) | 8 (0.2%) |
| 19 to 25 Years | 1,881 (96.5%) | 69 (3.5%) |
| 26 to 34 Years | 3,389 (94.8%) | 185 (5.2%) |
| 35 to 44 Years | 3,792 (94.0%) | 244 (6.0%) |
| 45 to 54 Years | 2,632 (90.4%) | 278 (9.6%) |
| 55 to 64 Years | 2,636 (94.4%) | 158 (5.7%) |
| 65 to 74 Years | 1,357 (100.0%) | 0 (0.0%) |
| 75 Years and older | 1,135 (100.0%) | 0 (0.0%) |
| Total | 22,907 (95.6%) | 1,064 (4.4%) |
Health Insurance Coverage by Citizenship Status in Ballenger Creek
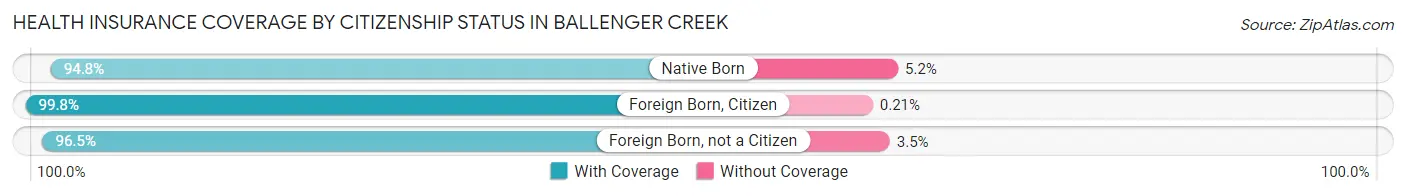
| Citizenship Status | With Coverage | Without Coverage |
| Native Born | 2,236 (94.8%) | 122 (5.2%) |
| Foreign Born, Citizen | 3,849 (99.8%) | 8 (0.2%) |
| Foreign Born, not a Citizen | 1,881 (96.5%) | 69 (3.5%) |
Health Insurance Coverage by Household Income in Ballenger Creek
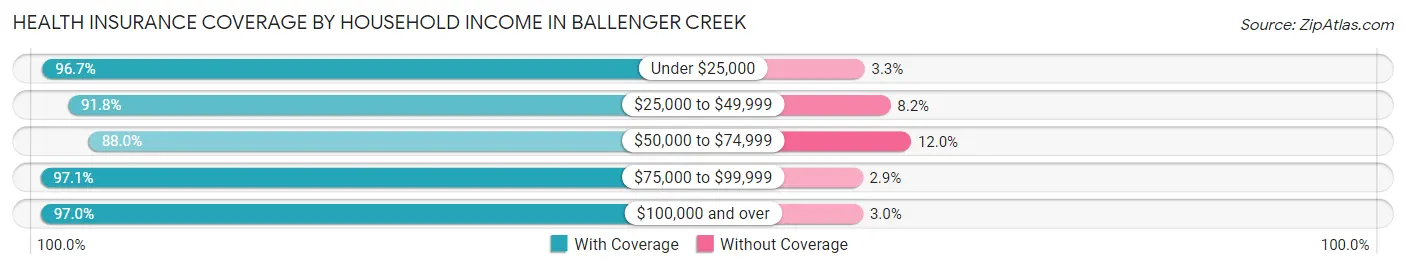
| Household Income | With Coverage | Without Coverage |
| Under $25,000 | 1,718 (96.7%) | 59 (3.3%) |
| $25,000 to $49,999 | 1,474 (91.8%) | 131 (8.2%) |
| $50,000 to $74,999 | 2,473 (88.0%) | 338 (12.0%) |
| $75,000 to $99,999 | 2,052 (97.1%) | 62 (2.9%) |
| $100,000 and over | 15,178 (97.0%) | 474 (3.0%) |
Public vs Private Health Insurance Coverage by Age in Ballenger Creek
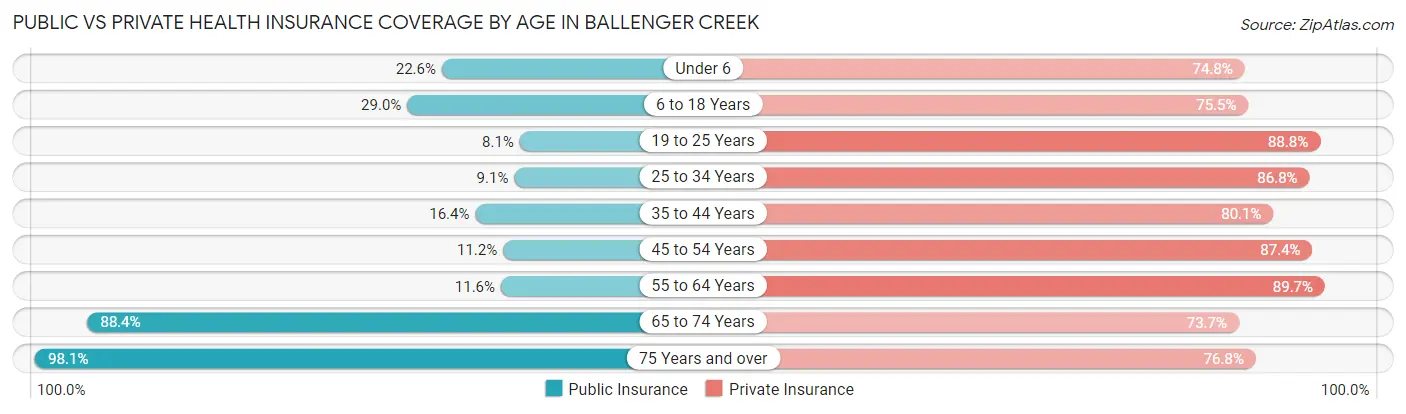
| Age Bracket | Public Insurance | Private Insurance |
| Under 6 | 532 (22.6%) | 1,763 (74.8%) |
| 6 to 18 Years | 1,118 (29.0%) | 2,910 (75.4%) |
| 19 to 25 Years | 158 (8.1%) | 1,731 (88.8%) |
| 25 to 34 Years | 326 (9.1%) | 3,102 (86.8%) |
| 35 to 44 Years | 660 (16.4%) | 3,232 (80.1%) |
| 45 to 54 Years | 326 (11.2%) | 2,542 (87.4%) |
| 55 to 64 Years | 324 (11.6%) | 2,505 (89.7%) |
| 65 to 74 Years | 1,199 (88.4%) | 1,000 (73.7%) |
| 75 Years and over | 1,113 (98.1%) | 872 (76.8%) |
| Total | 5,756 (24.0%) | 19,657 (82.0%) |
Disability Status by Sex by Age in Ballenger Creek
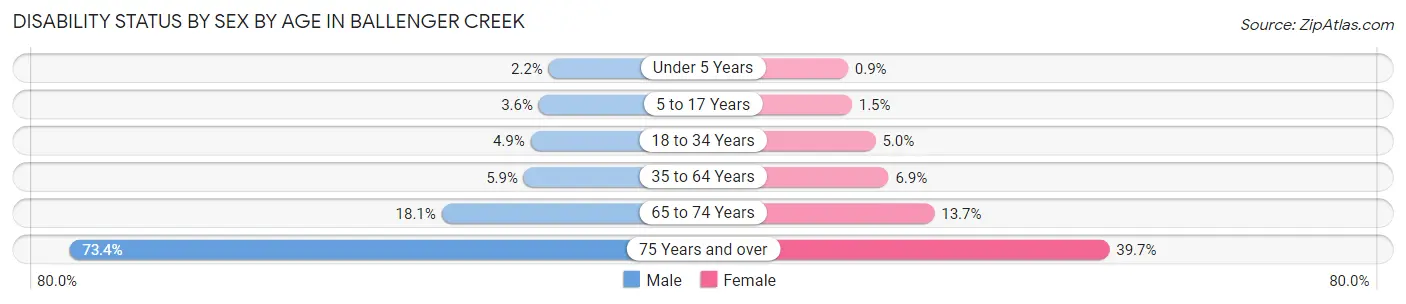
| Age Bracket | Male | Female |
| Under 5 Years | 20 (2.2%) | 10 (0.9%) |
| 5 to 17 Years | 71 (3.6%) | 28 (1.5%) |
| 18 to 34 Years | 144 (4.9%) | 146 (5.0%) |
| 35 to 64 Years | 271 (5.9%) | 355 (6.9%) |
| 65 to 74 Years | 115 (18.1%) | 99 (13.7%) |
| 75 Years and over | 201 (73.4%) | 342 (39.7%) |
Disability Class by Sex by Age in Ballenger Creek
Disability Class: Hearing Difficulty
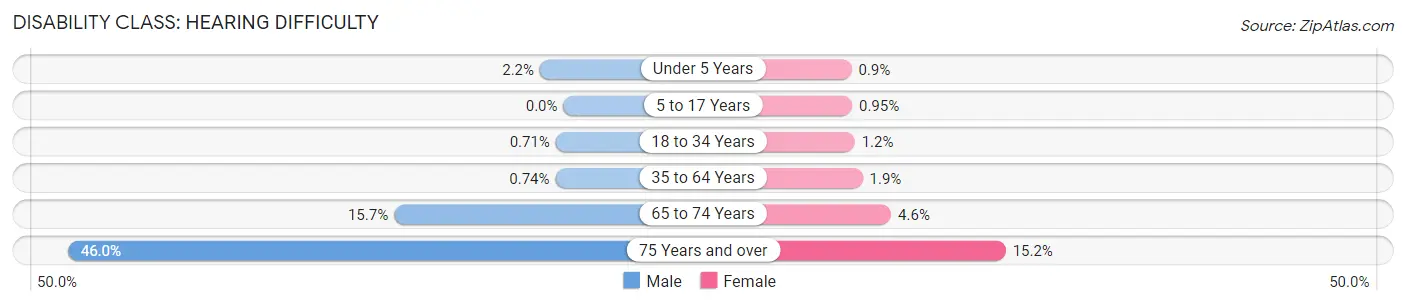
| Age Bracket | Male | Female |
| Under 5 Years | 20 (2.2%) | 10 (0.9%) |
| 5 to 17 Years | 0 (0.0%) | 18 (0.9%) |
| 18 to 34 Years | 21 (0.7%) | 35 (1.2%) |
| 35 to 64 Years | 34 (0.7%) | 99 (1.9%) |
| 65 to 74 Years | 100 (15.7%) | 33 (4.6%) |
| 75 Years and over | 126 (46.0%) | 131 (15.2%) |
Disability Class: Vision Difficulty
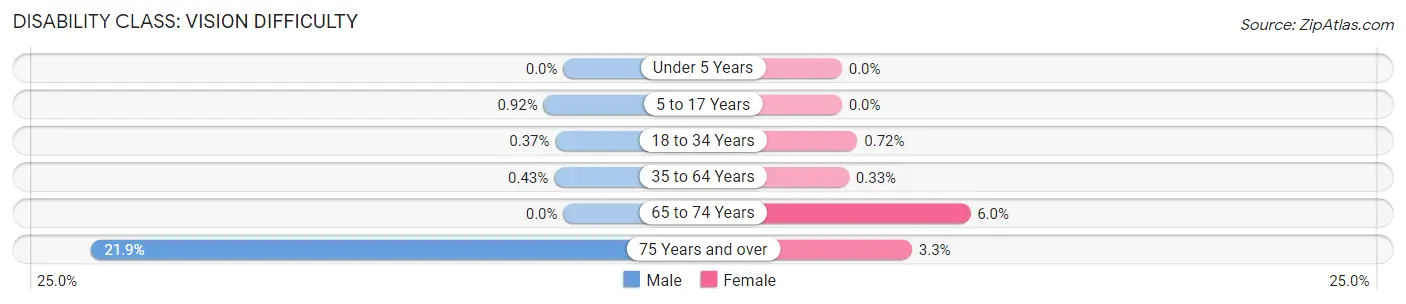
| Age Bracket | Male | Female |
| Under 5 Years | 0 (0.0%) | 0 (0.0%) |
| 5 to 17 Years | 18 (0.9%) | 0 (0.0%) |
| 18 to 34 Years | 11 (0.4%) | 21 (0.7%) |
| 35 to 64 Years | 20 (0.4%) | 17 (0.3%) |
| 65 to 74 Years | 0 (0.0%) | 43 (6.0%) |
| 75 Years and over | 60 (21.9%) | 28 (3.3%) |
Disability Class: Cognitive Difficulty
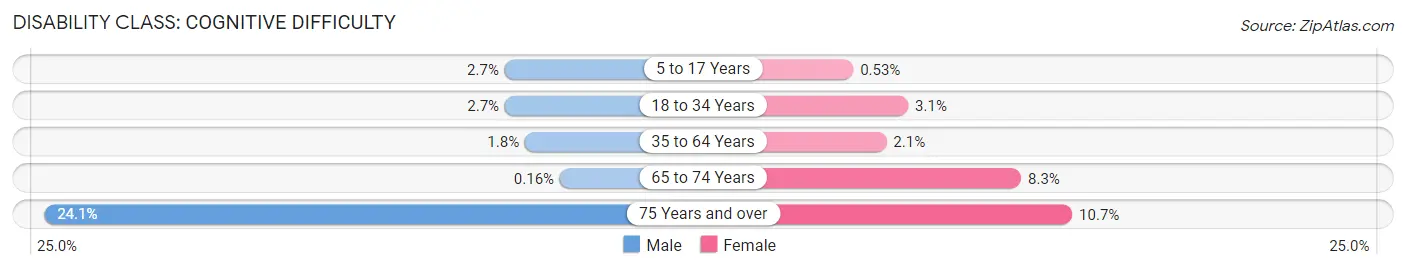
| Age Bracket | Male | Female |
| 5 to 17 Years | 53 (2.7%) | 10 (0.5%) |
| 18 to 34 Years | 80 (2.7%) | 90 (3.1%) |
| 35 to 64 Years | 82 (1.8%) | 106 (2.1%) |
| 65 to 74 Years | 1 (0.2%) | 60 (8.3%) |
| 75 Years and over | 66 (24.1%) | 92 (10.7%) |
Disability Class: Ambulatory Difficulty
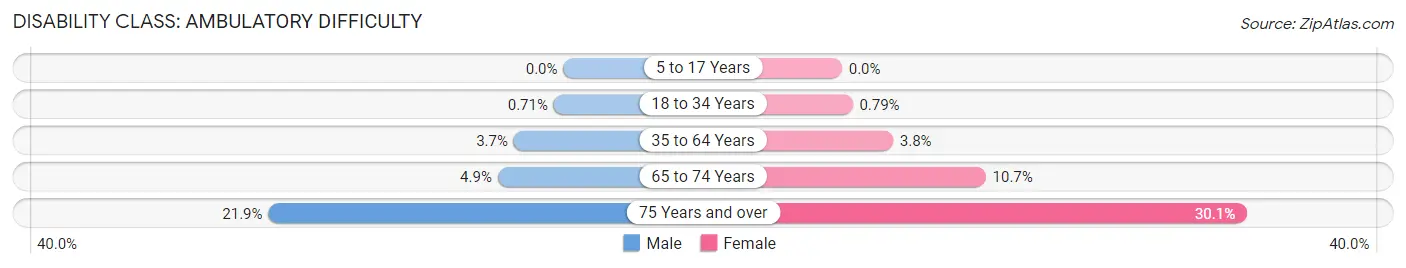
| Age Bracket | Male | Female |
| 5 to 17 Years | 0 (0.0%) | 0 (0.0%) |
| 18 to 34 Years | 21 (0.7%) | 23 (0.8%) |
| 35 to 64 Years | 170 (3.7%) | 194 (3.8%) |
| 65 to 74 Years | 31 (4.9%) | 77 (10.7%) |
| 75 Years and over | 60 (21.9%) | 259 (30.1%) |
Disability Class: Self-Care Difficulty
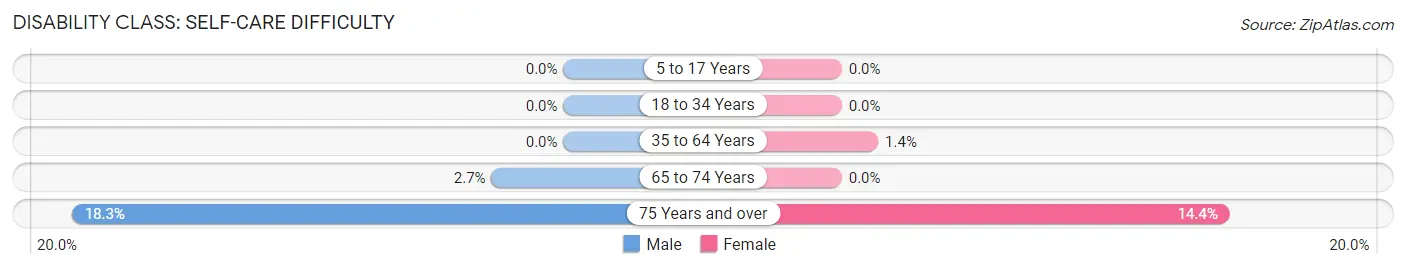
| Age Bracket | Male | Female |
| 5 to 17 Years | 0 (0.0%) | 0 (0.0%) |
| 18 to 34 Years | 0 (0.0%) | 0 (0.0%) |
| 35 to 64 Years | 0 (0.0%) | 69 (1.3%) |
| 65 to 74 Years | 17 (2.7%) | 0 (0.0%) |
| 75 Years and over | 50 (18.2%) | 124 (14.4%) |
Technology Access in Ballenger Creek
Computing Device Access in Ballenger Creek
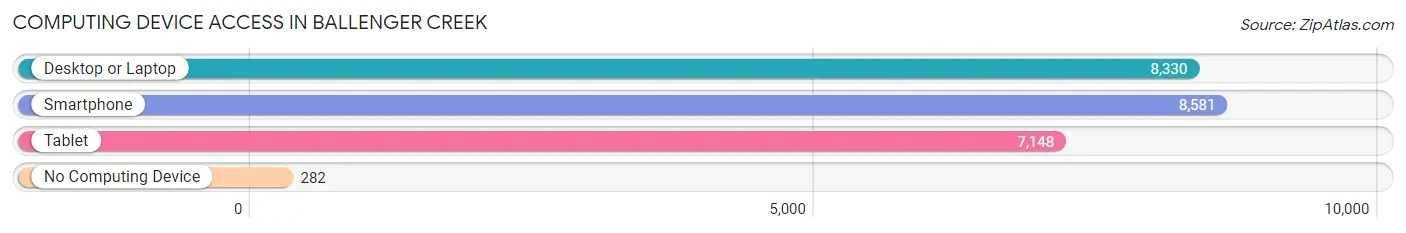
| Device Type | # Households | % Households |
| Desktop or Laptop | 8,330 | 89.8% |
| Smartphone | 8,581 | 92.5% |
| Tablet | 7,148 | 77.0% |
| No Computing Device | 282 | 3.0% |
| Total | 9,279 | 100.0% |
Internet Access in Ballenger Creek
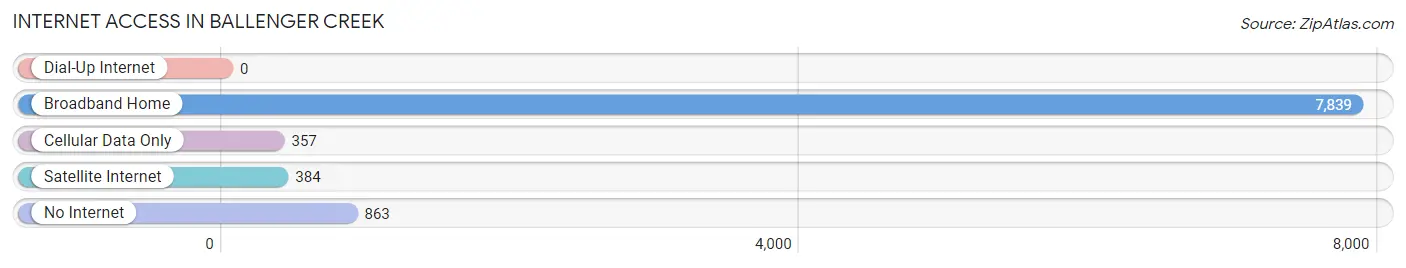
| Internet Type | # Households | % Households |
| Dial-Up Internet | 0 | 0.0% |
| Broadband Home | 7,839 | 84.5% |
| Cellular Data Only | 357 | 3.8% |
| Satellite Internet | 384 | 4.1% |
| No Internet | 863 | 9.3% |
| Total | 9,279 | 100.0% |
Ballenger Creek Summary
Ballenger Creek is a census-designated place (CDP) located in Frederick County, Maryland. It is situated in the northern part of the county, approximately 8 miles west of the city of Frederick. The population of Ballenger Creek was estimated to be 16,845 in 2019.
Geography
Ballenger Creek is located at 39°25'45"N 77°25'45"W (39.4292, -77.4292). It is situated in the northern part of Frederick County, approximately 8 miles west of the city of Frederick. The CDP has a total area of 5.2 square miles, all of which is land.
The terrain of Ballenger Creek is generally flat, with some rolling hills. The area is mostly residential, with some commercial and industrial development. The area is served by several major roads, including I-270, US 15, and MD 85.
History
Ballenger Creek was first settled in the late 1700s by German immigrants. The area was originally known as "Ballenger's Creek," after the family who owned the land. The area was primarily agricultural, with some small businesses and industries.
In the early 1900s, the area began to experience rapid growth due to the development of the nearby city of Frederick. The area was annexed by the city of Frederick in the 1950s, and the name was changed to Ballenger Creek.
Economy
The economy of Ballenger Creek is primarily based on services and retail. The area is home to several large retail stores, including Walmart, Target, and Home Depot. There are also several restaurants and other businesses in the area.
The area is also home to several industrial and manufacturing businesses, including a Coca-Cola bottling plant and a Pepsi bottling plant. The area is also home to several government and military installations, including Fort Detrick and the National Institutes of Health.
Demographics
As of the 2019 census, the population of Ballenger Creek was estimated to be 16,845. The racial makeup of the area was 79.2% White, 11.2% African American, 4.2% Asian, and 4.3% Hispanic or Latino. The median household income was $77,845, and the median home value was $346,000.
Conclusion
Ballenger Creek is a census-designated place located in Frederick County, Maryland. It is situated in the northern part of the county, approximately 8 miles west of the city of Frederick. The population of Ballenger Creek was estimated to be 16,845 in 2019. The economy of Ballenger Creek is primarily based on services and retail, with some industrial and manufacturing businesses. The area is also home to several government and military installations. The racial makeup of the area was 79.2% White, 11.2% African American, 4.2% Asian, and 4.3% Hispanic or Latino. The median household income was $77,845, and the median home value was $346,000.
Common Questions
What is Per Capita Income in Ballenger Creek?
Per Capita income in Ballenger Creek is $46,058.
What is the Median Family Income in Ballenger Creek?
Median Family Income in Ballenger Creek is $119,706.
What is the Median Household income in Ballenger Creek?
Median Household Income in Ballenger Creek is $105,981.
What is Income or Wage Gap in Ballenger Creek?
Income or Wage Gap in Ballenger Creek is 26.1%.
Women in Ballenger Creek earn 73.9 cents for every dollar earned by a man.
What is Inequality or Gini Index in Ballenger Creek?
Inequality or Gini Index in Ballenger Creek is 0.39.
What is the Total Population of Ballenger Creek?
Total Population of Ballenger Creek is 24,325.
What is the Total Male Population of Ballenger Creek?
Total Male Population of Ballenger Creek is 11,687.
What is the Total Female Population of Ballenger Creek?
Total Female Population of Ballenger Creek is 12,638.
What is the Ratio of Males per 100 Females in Ballenger Creek?
There are 92.48 Males per 100 Females in Ballenger Creek.
What is the Ratio of Females per 100 Males in Ballenger Creek?
There are 108.14 Females per 100 Males in Ballenger Creek.
What is the Median Population Age in Ballenger Creek?
Median Population Age in Ballenger Creek is 35.4 Years.
What is the Average Family Size in Ballenger Creek
Average Family Size in Ballenger Creek is 3.1 People.
What is the Average Household Size in Ballenger Creek
Average Household Size in Ballenger Creek is 2.6 People.
How Large is the Labor Force in Ballenger Creek?
There are 13,476 People in the Labor Forcein in Ballenger Creek.
What is the Percentage of People in the Labor Force in Ballenger Creek?
71.4% of People are in the Labor Force in Ballenger Creek.
What is the Unemployment Rate in Ballenger Creek?
Unemployment Rate in Ballenger Creek is 3.5%.