Cities with the Highest Renter-Occupied Median Costs of Housing in South Carolina
RELATED REPORTS & OPTIONS
Highest Renter Housing Costs
South Carolina
Compare Cities
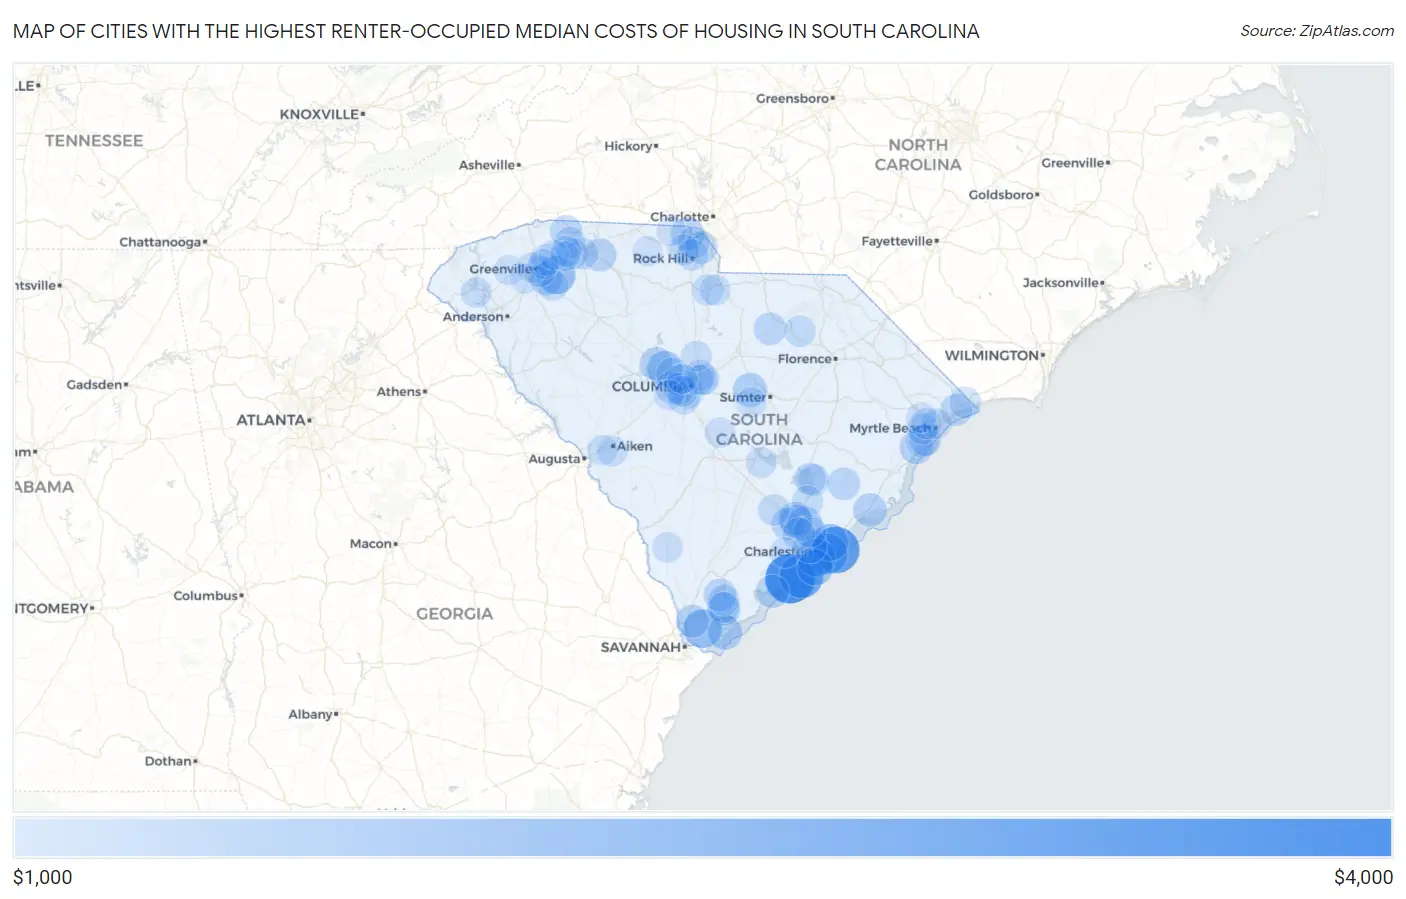
Map of Cities with the Highest Renter-Occupied Median Costs of Housing in South Carolina
$0
$4,000
Cities with the Highest Renter-Occupied Median Costs of Housing in South Carolina
| City | Housing Costs | vs State | vs National | |
| 1. | Seabrook Island | $3,501 | $1,065(+2.44k)#1 | $1,268(+2.23k)#90 |
| 2. | Isle Of Palms | $3,103 | $1,065(+2.04k)#2 | $1,268(+1.83k)#215 |
| 3. | Kiawah Island | $2,750 | $1,065(+1.69k)#3 | $1,268(+1.48k)#338 |
| 4. | Sullivan S Island | $2,321 | $1,065(+1.26k)#4 | $1,268(+1.05k)#700 |
| 5. | Five Forks | $2,053 | $1,065(+988)#5 | $1,268(+785)#1,250 |
| 6. | Bluffton | $2,050 | $1,065(+985)#6 | $1,268(+782)#1,257 |
| 7. | James Island | $2,009 | $1,065(+944)#7 | $1,268(+741)#1,350 |
| 8. | Baxter | $2,000 | $1,065(+935)#8 | $1,268(+732)#1,370 |
| 9. | Mount Pleasant | $1,901 | $1,065(+836)#9 | $1,268(+633)#1,609 |
| 10. | Folly Beach | $1,750 | $1,065(+685)#10 | $1,268(+482)#2,235 |
| 11. | Lake Murray Of Richland | $1,716 | $1,065(+651)#11 | $1,268(+448)#2,412 |
| 12. | Hilton Head Island | $1,563 | $1,065(+498)#12 | $1,268(+295)#3,275 |
| 13. | Charleston | $1,517 | $1,065(+452)#13 | $1,268(+249)#3,507 |
| 14. | Stateburg | $1,514 | $1,065(+449)#14 | $1,268(+246)#3,518 |
| 15. | Goose Creek | $1,507 | $1,065(+442)#15 | $1,268(+239)#3,551 |
| 16. | Port Royal | $1,476 | $1,065(+411)#16 | $1,268(+208)#3,716 |
| 17. | Litchfield Beach | $1,453 | $1,065(+388)#17 | $1,268(+185)#3,876 |
| 18. | Mcclellanville | $1,438 | $1,065(+373)#18 | $1,268(+170)#3,978 |
| 19. | Lake Wylie | $1,431 | $1,065(+366)#19 | $1,268(+163)#4,018 |
| 20. | Sangaree | $1,423 | $1,065(+358)#20 | $1,268(+155)#4,062 |
| 21. | Chapin | $1,418 | $1,065(+353)#21 | $1,268(+150)#4,106 |
| 22. | Carolina Forest | $1,411 | $1,065(+346)#22 | $1,268(+143)#4,157 |
| 23. | Ladson | $1,405 | $1,065(+340)#23 | $1,268(+137)#4,205 |
| 24. | Murrells Inlet | $1,404 | $1,065(+339)#24 | $1,268(+136)#4,218 |
| 25. | Hardeeville | $1,392 | $1,065(+327)#25 | $1,268(+124)#4,304 |
| 26. | Edisto Beach | $1,388 | $1,065(+323)#26 | $1,268(+120)#4,346 |
| 27. | Glendale | $1,385 | $1,065(+320)#27 | $1,268(+117)#4,367 |
| 28. | White Knoll | $1,359 | $1,065(+294)#28 | $1,268(+91.0)#4,600 |
| 29. | Buford | $1,349 | $1,065(+284)#29 | $1,268(+81.0)#4,689 |
| 30. | Laurel Bay | $1,344 | $1,065(+279)#30 | $1,268(+76.0)#4,726 |
| 31. | Mauldin | $1,342 | $1,065(+277)#31 | $1,268(+74.0)#4,743 |
| 32. | Irmo | $1,329 | $1,065(+264)#32 | $1,268(+61.0)#4,853 |
| 33. | Summerville | $1,328 | $1,065(+263)#33 | $1,268(+60.0)#4,865 |
| 34. | Bethune | $1,326 | $1,065(+261)#34 | $1,268(+58.0)#4,888 |
| 35. | Fort Mill | $1,325 | $1,065(+260)#35 | $1,268(+57.0)#4,889 |
| 36. | Garden City | $1,323 | $1,065(+258)#36 | $1,268(+55.0)#4,902 |
| 37. | Jamestown | $1,323 | $1,065(+258)#37 | $1,268(+55.0)#4,906 |
| 38. | Hanahan | $1,290 | $1,065(+225)#38 | $1,268(+22.0)#5,193 |
| 39. | North Charleston | $1,288 | $1,065(+223)#39 | $1,268(+20.0)#5,205 |
| 40. | Campobello | $1,280 | $1,065(+215)#40 | $1,268(+12.0)#5,295 |
| 41. | Lexington | $1,270 | $1,065(+205)#41 | $1,268(+2.00)#5,363 |
| 42. | North Myrtle Beach | $1,263 | $1,065(+198)#42 | $1,268(-5.00)#5,412 |
| 43. | Tega Cay | $1,253 | $1,065(+188)#43 | $1,268(-15.0)#5,481 |
| 44. | Cayce | $1,246 | $1,065(+181)#44 | $1,268(-22.0)#5,568 |
| 45. | Surfside Beach | $1,238 | $1,065(+173)#45 | $1,268(-30.0)#5,645 |
| 46. | Bonneau Beach | $1,232 | $1,065(+167)#46 | $1,268(-36.0)#5,700 |
| 47. | Oak Grove | $1,215 | $1,065(+150)#47 | $1,268(-53.0)#5,864 |
| 48. | Arcadia | $1,212 | $1,065(+147)#48 | $1,268(-56.0)#5,898 |
| 49. | Bonneau | $1,208 | $1,065(+143)#49 | $1,268(-60.0)#5,942 |
| 50. | Little River | $1,206 | $1,065(+141)#50 | $1,268(-62.0)#5,963 |
| 51. | North Hartsville | $1,204 | $1,065(+139)#51 | $1,268(-64.0)#5,981 |
| 52. | Ridgeville | $1,203 | $1,065(+138)#52 | $1,268(-65.0)#5,989 |
| 53. | Pine Ridge | $1,199 | $1,065(+134)#53 | $1,268(-69.0)#6,037 |
| 54. | Rock Hill | $1,193 | $1,065(+128)#54 | $1,268(-75.0)#6,080 |
| 55. | Simpsonville | $1,190 | $1,065(+125)#55 | $1,268(-78.0)#6,112 |
| 56. | Inman Mills | $1,186 | $1,065(+121)#56 | $1,268(-82.0)#6,188 |
| 57. | La France | $1,181 | $1,065(+116)#57 | $1,268(-87.0)#6,251 |
| 58. | Greenville | $1,173 | $1,065(+108)#58 | $1,268(-95.0)#6,349 |
| 59. | Wellford | $1,172 | $1,065(+107)#59 | $1,268(-96.0)#6,369 |
| 60. | Burton | $1,169 | $1,065(+104)#60 | $1,268(-99.0)#6,401 |
| 61. | Fort Lawn | $1,161 | $1,065(+96.0)#61 | $1,268(-107)#6,520 |
| 62. | Taylors | $1,160 | $1,065(+95.0)#62 | $1,268(-108)#6,527 |
| 63. | Newport | $1,159 | $1,065(+94.0)#63 | $1,268(-109)#6,547 |
| 64. | Hilltop | $1,159 | $1,065(+94.0)#64 | $1,268(-109)#6,548 |
| 65. | Woodfield | $1,147 | $1,065(+82.0)#65 | $1,268(-121)#6,724 |
| 66. | Lyman | $1,136 | $1,065(+71.0)#66 | $1,268(-132)#6,863 |
| 67. | Drayton | $1,135 | $1,065(+70.0)#67 | $1,268(-133)#6,882 |
| 68. | Socastee | $1,132 | $1,065(+67.0)#68 | $1,268(-136)#6,915 |
| 69. | Moncks Corner | $1,129 | $1,065(+64.0)#69 | $1,268(-139)#6,957 |
| 70. | Dentsville | $1,125 | $1,065(+60.0)#70 | $1,268(-143)#7,002 |
| 71. | Forestbrook | $1,124 | $1,065(+59.0)#71 | $1,268(-144)#7,081 |
| 72. | Seven Oaks | $1,119 | $1,065(+54.0)#72 | $1,268(-149)#7,139 |
| 73. | Utica | $1,107 | $1,065(+42.0)#73 | $1,268(-161)#7,345 |
| 74. | Columbia | $1,105 | $1,065(+40.0)#74 | $1,268(-163)#7,369 |
| 75. | Irwin | $1,099 | $1,065(+34.0)#75 | $1,268(-169)#7,478 |
| 76. | Ravenel | $1,097 | $1,065(+32.0)#76 | $1,268(-171)#7,494 |
| 77. | Springdale | $1,096 | $1,065(+31.0)#77 | $1,268(-172)#7,510 |
| 78. | Forest Acres | $1,095 | $1,065(+30.0)#78 | $1,268(-173)#7,524 |
| 79. | Blythewood | $1,094 | $1,065(+29.0)#79 | $1,268(-174)#7,542 |
| 80. | Myrtle Beach | $1,093 | $1,065(+28.0)#80 | $1,268(-175)#7,561 |
| 81. | Aiken | $1,093 | $1,065(+28.0)#81 | $1,268(-175)#7,562 |
| 82. | Luray | $1,083 | $1,065(+18.0)#82 | $1,268(-185)#7,756 |
| 83. | Vance | $1,083 | $1,065(+18.0)#83 | $1,268(-185)#7,757 |
| 84. | City View | $1,079 | $1,065(+14.0)#84 | $1,268(-189)#7,819 |
| 85. | Shell Point | $1,076 | $1,065(+11.0)#85 | $1,268(-192)#7,863 |
| 86. | Red Bank | $1,069 | $1,065(+4.00)#86 | $1,268(-199)#7,967 |
| 87. | Capitol View | $1,069 | $1,065(+4.00)#87 | $1,268(-199)#7,975 |
| 88. | Wedgefield | $1,066 | $1,065(+1.000)#88 | $1,268(-202)#8,035 |
| 89. | Greer | $1,060 | $1,065(-5.00)#89 | $1,268(-208)#8,157 |
| 90. | Red Hill | $1,058 | $1,065(-7.00)#90 | $1,268(-210)#8,186 |
| 91. | St Matthews | $1,058 | $1,065(-7.00)#91 | $1,268(-210)#8,193 |
| 92. | Whitney | $1,057 | $1,065(-8.00)#92 | $1,268(-211)#8,208 |
| 93. | Gloverville | $1,045 | $1,065(-20.0)#93 | $1,268(-223)#8,394 |
| 94. | Arial | $1,043 | $1,065(-22.0)#94 | $1,268(-225)#8,434 |
| 95. | Hickory Grove | $1,042 | $1,065(-23.0)#95 | $1,268(-226)#8,466 |
| 96. | St Andrews | $1,030 | $1,065(-35.0)#96 | $1,268(-238)#8,672 |
| 97. | Powdersville | $1,029 | $1,065(-36.0)#97 | $1,268(-239)#8,689 |
| 98. | Duncan | $1,029 | $1,065(-36.0)#98 | $1,268(-239)#8,692 |
| 99. | Clover | $1,027 | $1,065(-38.0)#99 | $1,268(-241)#8,731 |
| 100. | Wade Hampton | $1,022 | $1,065(-43.0)#100 | $1,268(-246)#8,812 |
Common Questions
What are the Top 10 Cities with the Highest Renter-Occupied Median Costs of Housing in South Carolina?
Top 10 Cities with the Highest Renter-Occupied Median Costs of Housing in South Carolina are:
#1
$3,501
#2
$3,103
#3
$2,750
#4
$2,321
#5
$2,053
#6
$2,050
#7
$2,009
#8
$1,901
#9
$1,750
#10
$1,716
What city has the Highest Renter-Occupied Median Costs of Housing in South Carolina?
Seabrook Island has the Highest Renter-Occupied Median Costs of Housing in South Carolina with $3,501.
What is the Median Renter-Occupied Housing Costs in the State of South Carolina?
Median Renter-Occupied Housing Costs in South Carolina is $1,065.
What is the Median Renter-Occupied Housing Costs in the United States?
Median Renter-Occupied Housing Costs in the United States is $1,268.