Zip Codes with the Highest Percentage of Population with a Degree in Arts and Humanities in Rockford, IL
RELATED REPORTS & OPTIONS
Arts and Humanities
Rockford
Compare Zip Codes
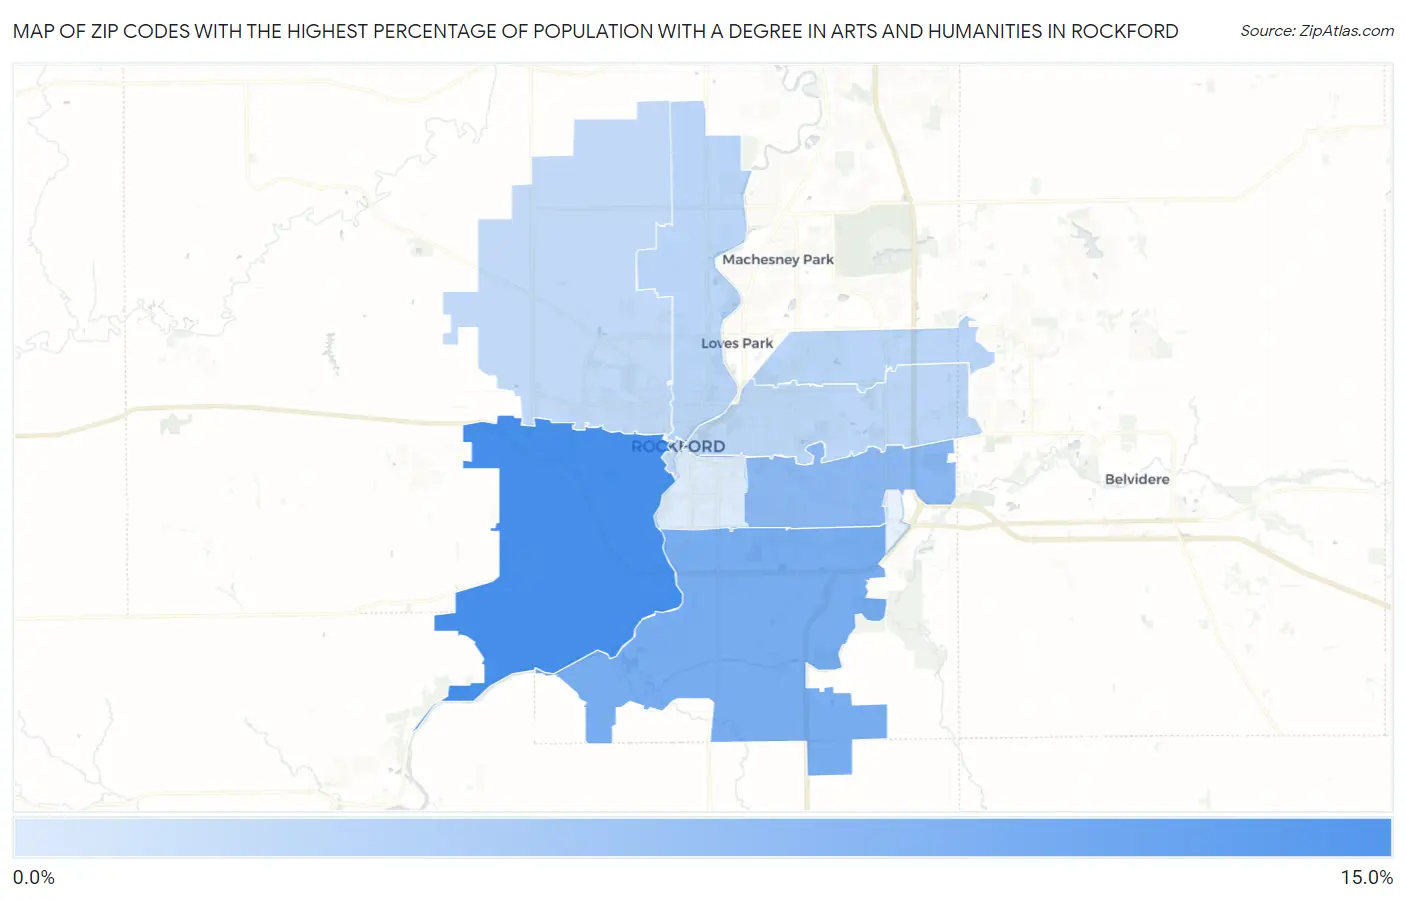
Map of Zip Codes with the Highest Percentage of Population with a Degree in Arts and Humanities in Rockford
3.6%
10.3%
Zip Codes with the Highest Percentage of Population with a Degree in Arts and Humanities in Rockford, IL
| Zip Code | % Graduates | vs State | vs National | |
| 1. | 61102 | 10.3% | 5.5%(+4.82)#293 | 6.0%(+4.32)#5,856 |
| 2. | 61109 | 8.1% | 5.5%(+2.59)#442 | 6.0%(+2.09)#9,484 |
| 3. | 61108 | 7.2% | 5.5%(+1.72)#515 | 6.0%(+1.21)#11,437 |
| 4. | 61114 | 5.1% | 5.5%(-0.432)#733 | 6.0%(-0.934)#17,413 |
| 5. | 61103 | 5.0% | 5.5%(-0.455)#738 | 6.0%(-0.957)#17,464 |
| 6. | 61107 | 5.0% | 5.5%(-0.499)#742 | 6.0%(-1.00)#17,626 |
| 7. | 61101 | 4.8% | 5.5%(-0.713)#777 | 6.0%(-1.21)#18,228 |
| 8. | 61104 | 3.6% | 5.5%(-1.93)#914 | 6.0%(-2.43)#21,427 |
1
Common Questions
What are the Top 5 Zip Codes with the Highest Percentage of Population with a Degree in Arts and Humanities in Rockford, IL?
Top 5 Zip Codes with the Highest Percentage of Population with a Degree in Arts and Humanities in Rockford, IL are:
What zip code has the Highest Percentage of Population with a Degree in Arts and Humanities in Rockford, IL?
61102 has the Highest Percentage of Population with a Degree in Arts and Humanities in Rockford, IL with 10.3%.
What is the Percentage of Population with a Degree in Arts and Humanities in Rockford, IL?
Percentage of Population with a Degree in Arts and Humanities in Rockford is 6.4%.
What is the Percentage of Population with a Degree in Arts and Humanities in Illinois?
Percentage of Population with a Degree in Arts and Humanities in Illinois is 5.5%.
What is the Percentage of Population with a Degree in Arts and Humanities in the United States?
Percentage of Population with a Degree in Arts and Humanities in the United States is 6.0%.