Cities with the Highest Percentage of Population Working from Home in Vermont
RELATED REPORTS & OPTIONS
Work from Home
Vermont
Compare Cities
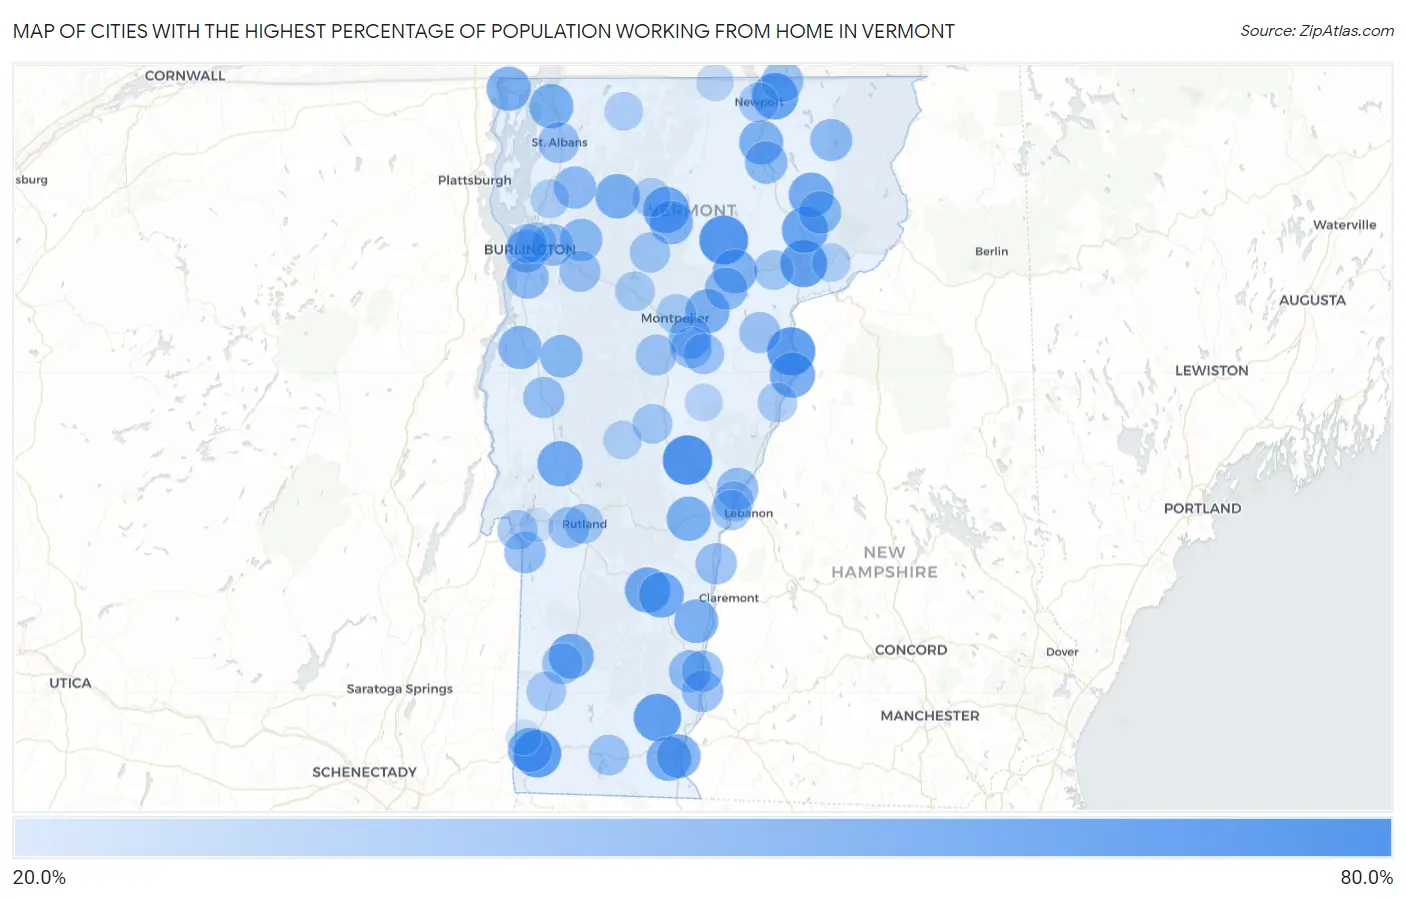
Map of Cities with the Highest Percentage of Population Working from Home in Vermont
0.0%
80.0%
Cities with the Highest Percentage of Population Working from Home in Vermont
| City | % Work from Home | vs State | vs National | |
| 1. | West Woodstock | 76.2% | 49.0%(+27.2)#1 | 44.0%(+32.2)#38 |
| 2. | South Royalton | 75.0% | 49.0%(+26.0)#2 | 44.0%(+31.0)#54 |
| 3. | Hardwick | 72.5% | 49.0%(+23.5)#3 | 44.0%(+28.5)#81 |
| 4. | Chittenden | 71.3% | 49.0%(+22.3)#4 | 44.0%(+27.3)#110 |
| 5. | Grafton | 70.5% | 49.0%(+21.5)#5 | 44.0%(+26.5)#141 |
| 6. | Wells River | 69.8% | 49.0%(+20.8)#6 | 44.0%(+25.8)#176 |
| 7. | Bennington | 67.2% | 49.0%(+18.2)#7 | 44.0%(+23.2)#305 |
| 8. | Newfane | 67.2% | 49.0%(+18.2)#8 | 44.0%(+23.2)#314 |
| 9. | St Johnsbury | 65.4% | 49.0%(+16.4)#9 | 44.0%(+21.4)#442 |
| 10. | St. George | 64.4% | 49.0%(+15.4)#10 | 44.0%(+20.4)#569 |
| 11. | Derby Center | 62.6% | 49.0%(+13.6)#11 | 44.0%(+18.6)#848 |
| 12. | Lyndonville | 62.2% | 49.0%(+13.2)#12 | 44.0%(+18.2)#942 |
| 13. | Hyde Park | 62.0% | 49.0%(+13.0)#13 | 44.0%(+18.0)#992 |
| 14. | Ludlow | 59.1% | 49.0%(+10.1)#14 | 44.0%(+15.1)#1,750 |
| 15. | Proctorsville | 58.5% | 49.0%(+9.50)#15 | 44.0%(+14.5)#1,913 |
| 16. | Newbury | 58.4% | 49.0%(+9.40)#16 | 44.0%(+14.4)#1,937 |
| 17. | Brandon | 58.1% | 49.0%(+9.10)#17 | 44.0%(+14.1)#2,052 |
| 18. | West Burke | 57.3% | 49.0%(+8.30)#18 | 44.0%(+13.3)#2,343 |
| 19. | Manchester Center | 57.2% | 49.0%(+8.20)#19 | 44.0%(+13.2)#2,367 |
| 20. | Jeffersonville | 55.8% | 49.0%(+6.80)#20 | 44.0%(+11.8)#2,899 |
| 21. | West Brattleboro | 55.6% | 49.0%(+6.60)#21 | 44.0%(+11.6)#2,948 |
| 22. | Swanton | 55.2% | 49.0%(+6.20)#22 | 44.0%(+11.2)#3,157 |
| 23. | Woodstock | 55.0% | 49.0%(+6.00)#23 | 44.0%(+11.0)#3,247 |
| 24. | Alburgh | 54.8% | 49.0%(+5.80)#24 | 44.0%(+10.8)#3,318 |
| 25. | Plainfield | 54.2% | 49.0%(+5.20)#25 | 44.0%(+10.2)#3,609 |
| 26. | Old Bennington | 54.2% | 49.0%(+5.20)#26 | 44.0%(+10.2)#3,614 |
| 27. | Cabot | 54.1% | 49.0%(+5.10)#27 | 44.0%(+10.1)#3,653 |
| 28. | Orleans | 53.7% | 49.0%(+4.70)#28 | 44.0%(+9.70)#3,784 |
| 29. | Springfield | 53.5% | 49.0%(+4.50)#29 | 44.0%(+9.50)#3,866 |
| 30. | Brattleboro | 53.3% | 49.0%(+4.30)#30 | 44.0%(+9.30)#3,985 |
| 31. | Huntington | 53.3% | 49.0%(+4.30)#31 | 44.0%(+9.30)#4,048 |
| 32. | Morrisville | 52.1% | 49.0%(+3.10)#32 | 44.0%(+8.10)#4,691 |
| 33. | East Dorset | 51.4% | 49.0%(+2.40)#33 | 44.0%(+7.40)#5,121 |
| 34. | Vergennes | 51.2% | 49.0%(+2.20)#34 | 44.0%(+7.20)#5,235 |
| 35. | Stamford | 50.5% | 49.0%(+1.50)#35 | 44.0%(+6.50)#5,739 |
| 36. | Bristol | 48.9% | 49.0%(-0.100)#36 | 44.0%(+4.90)#6,831 |
| 37. | Harmonyville | 48.6% | 49.0%(-0.400)#37 | 44.0%(+4.60)#7,070 |
| 38. | South Burlington | 48.2% | 49.0%(-0.800)#38 | 44.0%(+4.20)#7,376 |
| 39. | Barton | 48.0% | 49.0%(-1.00)#39 | 44.0%(+4.00)#7,564 |
| 40. | Marshfield | 48.0% | 49.0%(-1.00)#40 | 44.0%(+4.00)#7,570 |
| 41. | East Burke | 47.9% | 49.0%(-1.10)#41 | 44.0%(+3.90)#7,646 |
| 42. | Barre | 47.8% | 49.0%(-1.20)#42 | 44.0%(+3.80)#7,674 |
| 43. | Jericho | 47.8% | 49.0%(-1.20)#43 | 44.0%(+3.80)#7,709 |
| 44. | Killington | 47.8% | 49.0%(-1.20)#44 | 44.0%(+3.80)#7,726 |
| 45. | Lincoln | 47.8% | 49.0%(-1.20)#45 | 44.0%(+3.80)#7,733 |
| 46. | Shelburne | 47.6% | 49.0%(-1.40)#46 | 44.0%(+3.60)#7,839 |
| 47. | Proctor | 47.3% | 49.0%(-1.70)#47 | 44.0%(+3.30)#8,125 |
| 48. | Fairfax | 47.2% | 49.0%(-1.80)#48 | 44.0%(+3.20)#8,216 |
| 49. | Island Pond | 46.8% | 49.0%(-2.20)#49 | 44.0%(+2.80)#8,473 |
| 50. | Saxtons River | 46.5% | 49.0%(-2.50)#50 | 44.0%(+2.50)#8,735 |
| 51. | Essex Junction | 45.3% | 49.0%(-3.70)#51 | 44.0%(+1.30)#9,672 |
| 52. | Norwich | 45.1% | 49.0%(-3.90)#52 | 44.0%(+1.10)#9,861 |
| 53. | Derby Line | 44.7% | 49.0%(-4.30)#53 | 44.0%(+0.700)#10,181 |
| 54. | Westminster | 44.6% | 49.0%(-4.40)#54 | 44.0%(+0.600)#10,256 |
| 55. | Bellows Falls | 44.4% | 49.0%(-4.60)#55 | 44.0%(+0.400)#10,419 |
| 56. | Poultney | 44.3% | 49.0%(-4.70)#56 | 44.0%(+0.300)#10,501 |
| 57. | Windsor | 43.8% | 49.0%(-5.20)#57 | 44.0%(-0.200)#10,836 |
| 58. | Middlebury | 43.4% | 49.0%(-5.60)#58 | 44.0%(-0.600)#11,157 |
| 59. | Richmond | 42.8% | 49.0%(-6.20)#59 | 44.0%(-1.20)#11,676 |
| 60. | Groton | 42.8% | 49.0%(-6.20)#60 | 44.0%(-1.20)#11,678 |
| 61. | St Albans | 42.7% | 49.0%(-6.30)#61 | 44.0%(-1.30)#11,721 |
| 62. | South Barre | 42.3% | 49.0%(-6.70)#62 | 44.0%(-1.70)#12,096 |
| 63. | West Rutland | 42.2% | 49.0%(-6.80)#63 | 44.0%(-1.80)#12,168 |
| 64. | Manchester | 41.5% | 49.0%(-7.50)#64 | 44.0%(-2.50)#12,738 |
| 65. | Northfield | 41.2% | 49.0%(-7.80)#65 | 44.0%(-2.80)#12,940 |
| 66. | Winooski | 41.1% | 49.0%(-7.90)#66 | 44.0%(-2.90)#12,991 |
| 67. | East Barre | 40.8% | 49.0%(-8.20)#67 | 44.0%(-3.20)#13,221 |
| 68. | Wilmington | 40.6% | 49.0%(-8.40)#68 | 44.0%(-3.40)#13,370 |
| 69. | Stowe | 39.7% | 49.0%(-9.30)#69 | 44.0%(-4.30)#13,970 |
| 70. | North Hyde Park | 39.4% | 49.0%(-9.60)#70 | 44.0%(-4.60)#14,162 |
| 71. | Fair Haven | 38.9% | 49.0%(-10.1)#71 | 44.0%(-5.10)#14,392 |
| 72. | Wilder | 38.7% | 49.0%(-10.3)#72 | 44.0%(-5.30)#14,525 |
| 73. | White River Junction | 38.6% | 49.0%(-10.4)#73 | 44.0%(-5.40)#14,593 |
| 74. | Rutland | 37.9% | 49.0%(-11.1)#74 | 44.0%(-6.10)#14,935 |
| 75. | Newport | 37.8% | 49.0%(-11.2)#75 | 44.0%(-6.20)#14,998 |
| 76. | Danville | 37.8% | 49.0%(-11.2)#76 | 44.0%(-6.20)#15,029 |
| 77. | Randolph | 37.6% | 49.0%(-11.4)#77 | 44.0%(-6.40)#15,109 |
| 78. | Waterbury | 37.2% | 49.0%(-11.8)#78 | 44.0%(-6.80)#15,312 |
| 79. | Arlington | 37.0% | 49.0%(-12.0)#79 | 44.0%(-7.00)#15,376 |
| 80. | Burlington | 36.9% | 49.0%(-12.1)#80 | 44.0%(-7.10)#15,396 |
| 81. | Bradford | 36.7% | 49.0%(-12.3)#81 | 44.0%(-7.30)#15,534 |
| 82. | Montpelier | 36.4% | 49.0%(-12.6)#82 | 44.0%(-7.60)#15,663 |
| 83. | Underhill Flats | 36.0% | 49.0%(-13.0)#83 | 44.0%(-8.00)#15,802 |
| 84. | South Hero | 35.4% | 49.0%(-13.6)#84 | 44.0%(-8.60)#16,112 |
| 85. | Johnson | 35.2% | 49.0%(-13.8)#85 | 44.0%(-8.80)#16,156 |
| 86. | Pawlet | 34.6% | 49.0%(-14.4)#86 | 44.0%(-9.40)#16,385 |
| 87. | Milton | 34.3% | 49.0%(-14.7)#87 | 44.0%(-9.70)#16,474 |
| 88. | Enosburg Falls | 33.7% | 49.0%(-15.3)#88 | 44.0%(-10.3)#16,657 |
| 89. | Concord | 33.7% | 49.0%(-15.3)#89 | 44.0%(-10.3)#16,673 |
| 90. | Rochester | 32.5% | 49.0%(-16.5)#90 | 44.0%(-11.5)#17,011 |
| 91. | Bolton Valley | 31.8% | 49.0%(-17.2)#91 | 44.0%(-12.2)#17,136 |
| 92. | Chelsea | 29.5% | 49.0%(-19.5)#92 | 44.0%(-14.5)#17,552 |
| 93. | North Troy | 28.6% | 49.0%(-20.4)#93 | 44.0%(-15.4)#17,679 |
| 94. | North Bennington | 22.6% | 49.0%(-26.4)#94 | 44.0%(-21.4)#18,122 |
| 95. | Castleton | 20.2% | 49.0%(-28.8)#95 | 44.0%(-23.8)#18,293 |
1
2Common Questions
What are the Top 10 Cities with the Highest Percentage of Population Working from Home in Vermont?
Top 10 Cities with the Highest Percentage of Population Working from Home in Vermont are:
#1
75.0%
#2
72.5%
#3
69.8%
#4
67.2%
#5
67.2%
#6
65.4%
#7
62.6%
#8
62.2%
#9
62.0%
#10
59.1%
What city has the Highest Percentage of Population Working from Home in Vermont?
South Royalton has the Highest Percentage of Population Working from Home in Vermont with 75.0%.
What is the Percentage of Population Working from Home in the State of Vermont?
Percentage of Population Working from Home in Vermont is 49.0%.
What is the Percentage of Population Working from Home in the United States?
Percentage of Population Working from Home in the United States is 44.0%.