Zip Codes with the Highest Percentage of Population Employed in Agriculture, Fishing & Hunting in Cincinnati, OH
RELATED REPORTS & OPTIONS
Agriculture, Fishing & Hunting
Cincinnati
Compare Zip Codes
Map of Zip Codes with the Highest Percentage of Population Employed in Agriculture, Fishing & Hunting in Cincinnati
0.061%
1.8%
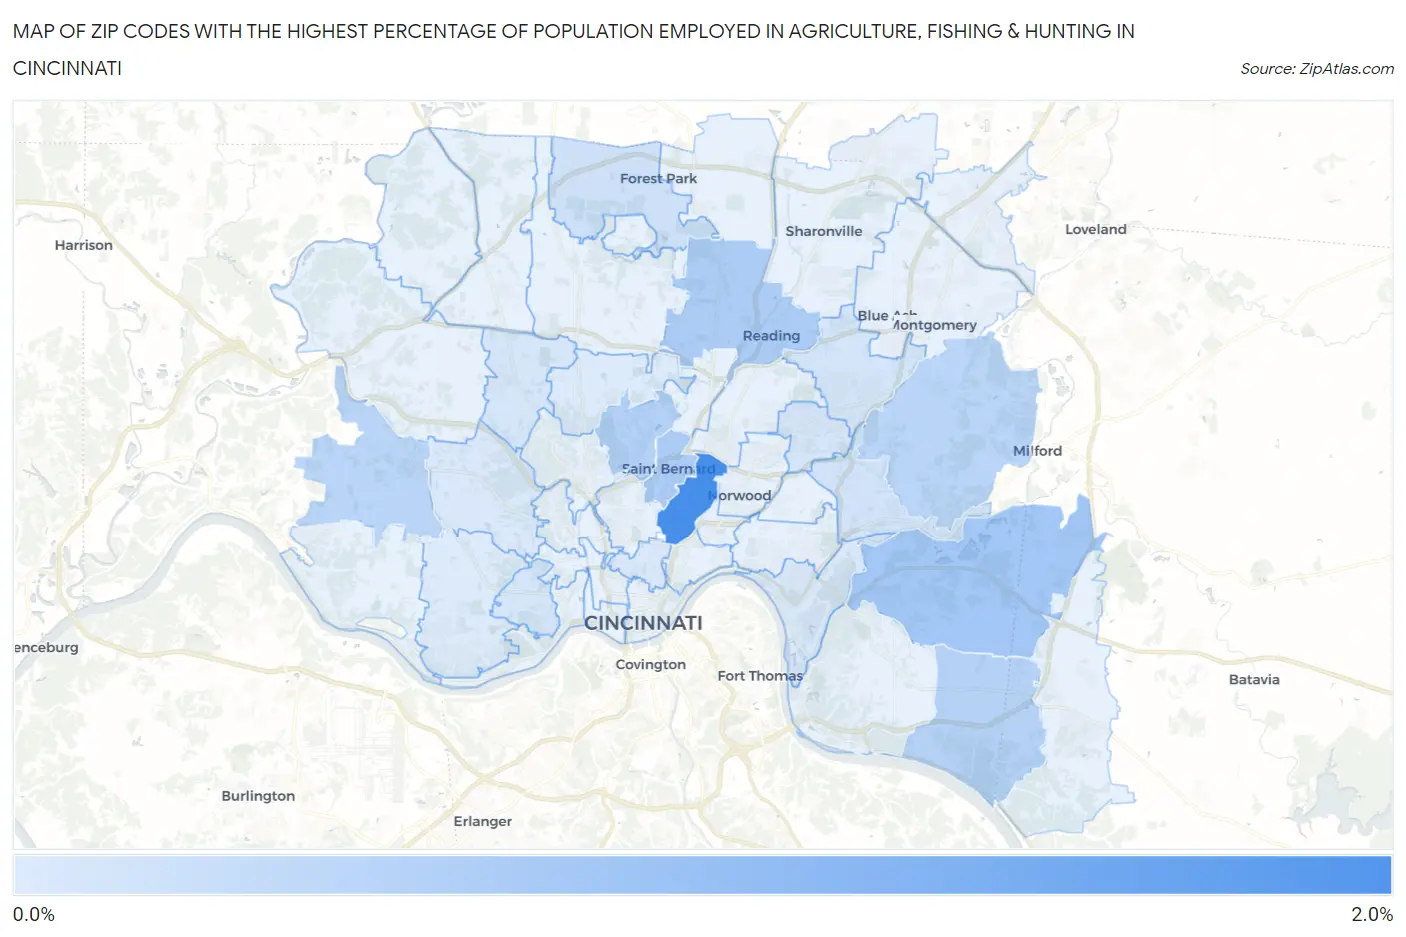
Zip Codes with the Highest Percentage of Population Employed in Agriculture, Fishing & Hunting in Cincinnati, OH
| Zip Code | % Employed | vs State | vs National | |
| 1. | 45229 | 1.8% | 0.71%(+1.07)#324 | 1.2%(+0.588)#13,371 |
| 2. | 45244 | 0.73% | 0.71%(+0.019)#501 | 1.2%(-0.466)#17,645 |
| 3. | 45217 | 0.63% | 0.71%(-0.086)#524 | 1.2%(-0.571)#18,282 |
| 4. | 45215 | 0.62% | 0.71%(-0.096)#527 | 1.2%(-0.581)#18,359 |
| 5. | 45232 | 0.53% | 0.71%(-0.188)#551 | 1.2%(-0.673)#19,047 |
| 6. | 45255 | 0.51% | 0.71%(-0.209)#557 | 1.2%(-0.693)#19,233 |
| 7. | 45243 | 0.46% | 0.71%(-0.255)#570 | 1.2%(-0.740)#19,622 |
| 8. | 45248 | 0.44% | 0.71%(-0.271)#577 | 1.2%(-0.756)#19,760 |
| 9. | 45240 | 0.22% | 0.71%(-0.496)#672 | 1.2%(-0.981)#22,120 |
| 10. | 45227 | 0.19% | 0.71%(-0.523)#693 | 1.2%(-1.01)#22,459 |
| 11. | 45236 | 0.16% | 0.71%(-0.554)#710 | 1.2%(-1.04)#22,866 |
| 12. | 45239 | 0.15% | 0.71%(-0.563)#718 | 1.2%(-1.05)#22,986 |
| 13. | 45205 | 0.14% | 0.71%(-0.577)#727 | 1.2%(-1.06)#23,191 |
| 14. | 45213 | 0.13% | 0.71%(-0.581)#729 | 1.2%(-1.07)#23,232 |
| 15. | 45219 | 0.10% | 0.71%(-0.615)#743 | 1.2%(-1.10)#23,681 |
| 16. | 45226 | 0.097% | 0.71%(-0.618)#745 | 1.2%(-1.10)#23,718 |
| 17. | 45211 | 0.086% | 0.71%(-0.628)#753 | 1.2%(-1.11)#23,873 |
| 18. | 45238 | 0.071% | 0.71%(-0.644)#762 | 1.2%(-1.13)#24,089 |
| 19. | 45224 | 0.061% | 0.71%(-0.653)#768 | 1.2%(-1.14)#24,212 |
1
Common Questions
What are the Top 10 Zip Codes with the Highest Percentage of Population Employed in Agriculture, Fishing & Hunting in Cincinnati, OH?
Top 10 Zip Codes with the Highest Percentage of Population Employed in Agriculture, Fishing & Hunting in Cincinnati, OH are:
What zip code has the Highest Percentage of Population Employed in Agriculture, Fishing & Hunting in Cincinnati, OH?
45229 has the Highest Percentage of Population Employed in Agriculture, Fishing & Hunting in Cincinnati, OH with 1.8%.
What is the Percentage of Population Employed in Agriculture, Fishing & Hunting in Cincinnati, OH?
Percentage of Population Employed in Agriculture, Fishing & Hunting in Cincinnati is 0.11%.
What is the Percentage of Population Employed in Agriculture, Fishing & Hunting in Ohio?
Percentage of Population Employed in Agriculture, Fishing & Hunting in Ohio is 0.71%.
What is the Percentage of Population Employed in Agriculture, Fishing & Hunting in the United States?
Percentage of Population Employed in Agriculture, Fishing & Hunting in the United States is 1.2%.