Zip Codes with the Highest Percentage of Population Employed in Agriculture, Fishing & Hunting in Mansfield, OH
RELATED REPORTS & OPTIONS
Agriculture, Fishing & Hunting
Mansfield
Compare Zip Codes
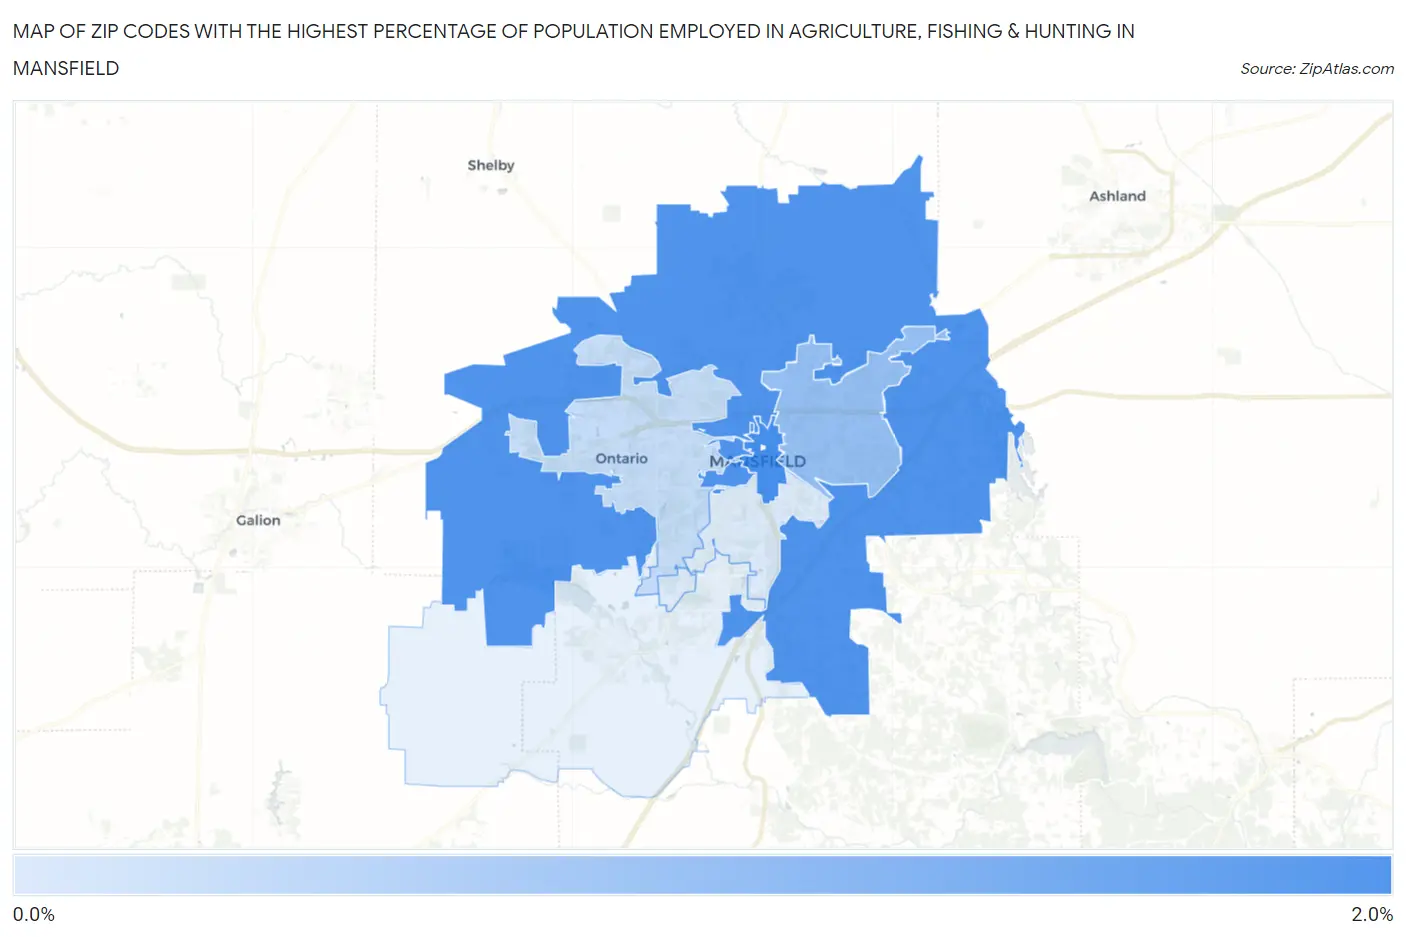
Map of Zip Codes with the Highest Percentage of Population Employed in Agriculture, Fishing & Hunting in Mansfield
0.20%
2.0%
Zip Codes with the Highest Percentage of Population Employed in Agriculture, Fishing & Hunting in Mansfield, OH
| Zip Code | % Employed | vs State | vs National | |
| 1. | 44902 | 2.0% | 0.71%(+1.24)#301 | 1.2%(+0.759)#12,874 |
| 2. | 44903 | 1.9% | 0.71%(+1.16)#311 | 1.2%(+0.679)#13,086 |
| 3. | 44905 | 1.0% | 0.71%(+0.326)#436 | 1.2%(-0.159)#16,043 |
| 4. | 44906 | 0.46% | 0.71%(-0.252)#568 | 1.2%(-0.737)#19,599 |
| 5. | 44907 | 0.20% | 0.71%(-0.510)#682 | 1.2%(-0.994)#22,302 |
1
Common Questions
What are the Top 5 Zip Codes with the Highest Percentage of Population Employed in Agriculture, Fishing & Hunting in Mansfield, OH?
Top 5 Zip Codes with the Highest Percentage of Population Employed in Agriculture, Fishing & Hunting in Mansfield, OH are:
What zip code has the Highest Percentage of Population Employed in Agriculture, Fishing & Hunting in Mansfield, OH?
44902 has the Highest Percentage of Population Employed in Agriculture, Fishing & Hunting in Mansfield, OH with 2.0%.
What is the Percentage of Population Employed in Agriculture, Fishing & Hunting in Mansfield, OH?
Percentage of Population Employed in Agriculture, Fishing & Hunting in Mansfield is 1.2%.
What is the Percentage of Population Employed in Agriculture, Fishing & Hunting in Ohio?
Percentage of Population Employed in Agriculture, Fishing & Hunting in Ohio is 0.71%.
What is the Percentage of Population Employed in Agriculture, Fishing & Hunting in the United States?
Percentage of Population Employed in Agriculture, Fishing & Hunting in the United States is 1.2%.