Zip Codes with the Highest Percentage of Population Employed in Agriculture, Fishing & Hunting in Chagrin Falls, OH
RELATED REPORTS & OPTIONS
Agriculture, Fishing & Hunting
Chagrin Falls
Compare Zip Codes
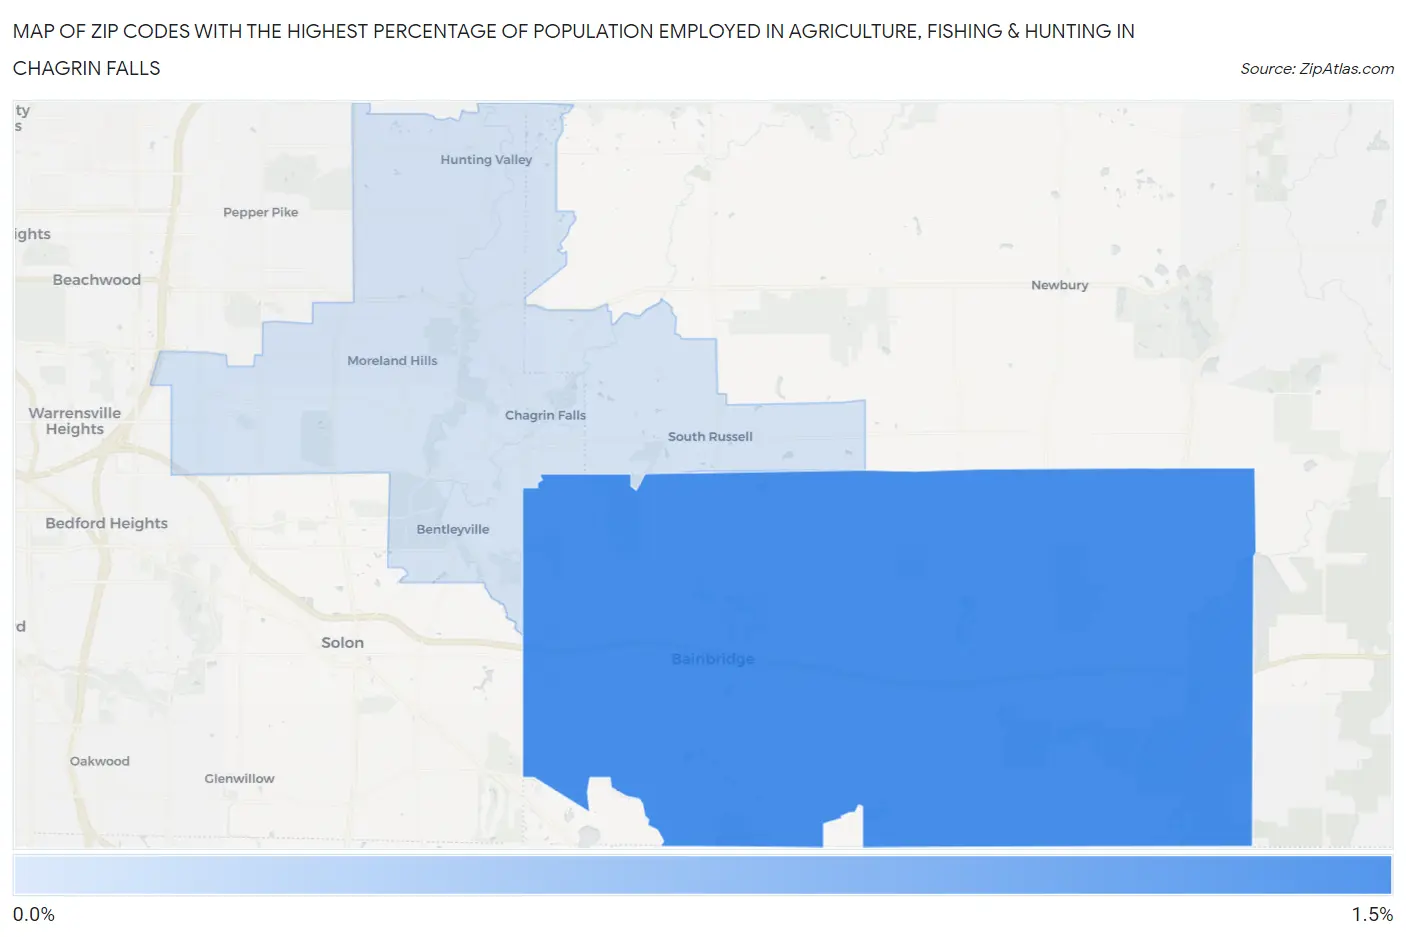
Map of Zip Codes with the Highest Percentage of Population Employed in Agriculture, Fishing & Hunting in Chagrin Falls
0.025%
1.3%
Zip Codes with the Highest Percentage of Population Employed in Agriculture, Fishing & Hunting in Chagrin Falls, OH
| Zip Code | % Employed | vs State | vs National | |
| 1. | 44023 | 1.3% | 0.71%(+0.565)#396 | 1.2%(+0.080)#15,098 |
| 2. | 44022 | 0.025% | 0.71%(-0.689)#790 | 1.2%(-1.17)#24,552 |
1
Common Questions
What are the Top Zip Codes with the Highest Percentage of Population Employed in Agriculture, Fishing & Hunting in Chagrin Falls, OH?
Top Zip Codes with the Highest Percentage of Population Employed in Agriculture, Fishing & Hunting in Chagrin Falls, OH are:
What zip code has the Highest Percentage of Population Employed in Agriculture, Fishing & Hunting in Chagrin Falls, OH?
44023 has the Highest Percentage of Population Employed in Agriculture, Fishing & Hunting in Chagrin Falls, OH with 1.3%.
What is the Percentage of Population Employed in Agriculture, Fishing & Hunting in Ohio?
Percentage of Population Employed in Agriculture, Fishing & Hunting in Ohio is 0.71%.
What is the Percentage of Population Employed in Agriculture, Fishing & Hunting in the United States?
Percentage of Population Employed in Agriculture, Fishing & Hunting in the United States is 1.2%.