Zip Codes with the Highest Percentage of Population Employed in Agriculture, Fishing & Hunting in Lorain, OH
RELATED REPORTS & OPTIONS
Agriculture, Fishing & Hunting
Lorain
Compare Zip Codes
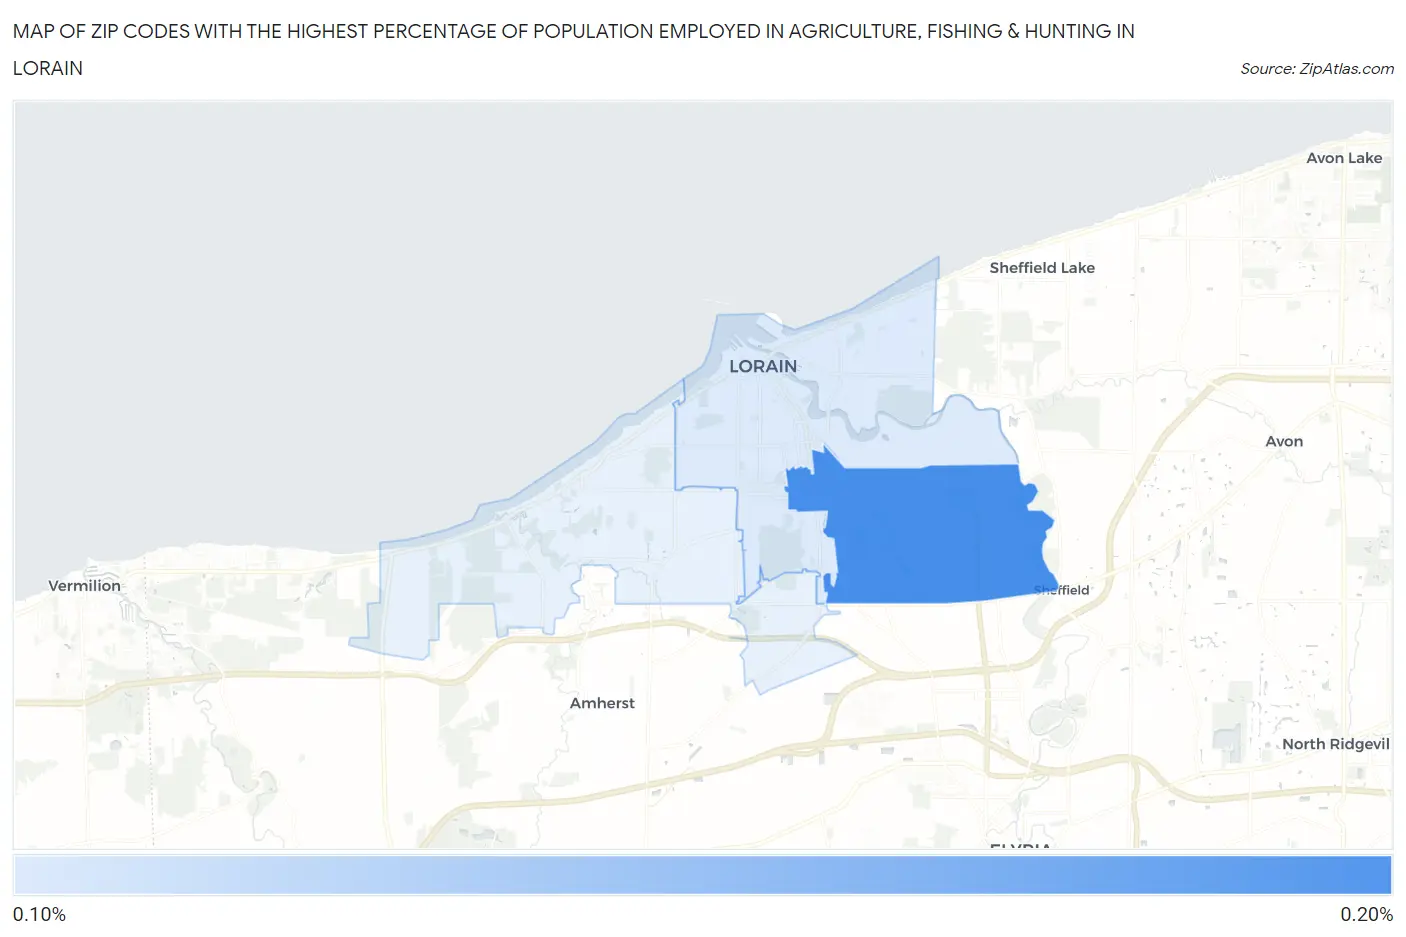
Map of Zip Codes with the Highest Percentage of Population Employed in Agriculture, Fishing & Hunting in Lorain
0.14%
0.16%
Zip Codes with the Highest Percentage of Population Employed in Agriculture, Fishing & Hunting in Lorain, OH
| Zip Code | % Employed | vs State | vs National | |
| 1. | 44055 | 0.16% | 0.71%(-0.556)#713 | 1.2%(-1.04)#22,894 |
| 2. | 44052 | 0.14% | 0.71%(-0.573)#725 | 1.2%(-1.06)#23,138 |
1
Common Questions
What are the Top Zip Codes with the Highest Percentage of Population Employed in Agriculture, Fishing & Hunting in Lorain, OH?
Top Zip Codes with the Highest Percentage of Population Employed in Agriculture, Fishing & Hunting in Lorain, OH are:
What zip code has the Highest Percentage of Population Employed in Agriculture, Fishing & Hunting in Lorain, OH?
44055 has the Highest Percentage of Population Employed in Agriculture, Fishing & Hunting in Lorain, OH with 0.16%.
What is the Percentage of Population Employed in Agriculture, Fishing & Hunting in Lorain, OH?
Percentage of Population Employed in Agriculture, Fishing & Hunting in Lorain is 0.063%.
What is the Percentage of Population Employed in Agriculture, Fishing & Hunting in Ohio?
Percentage of Population Employed in Agriculture, Fishing & Hunting in Ohio is 0.71%.
What is the Percentage of Population Employed in Agriculture, Fishing & Hunting in the United States?
Percentage of Population Employed in Agriculture, Fishing & Hunting in the United States is 1.2%.