Zip Codes with the Highest Percentage of Population Employed in Agriculture, Fishing & Hunting in Kent, OH
RELATED REPORTS & OPTIONS
Agriculture, Fishing & Hunting
Kent
Compare Zip Codes
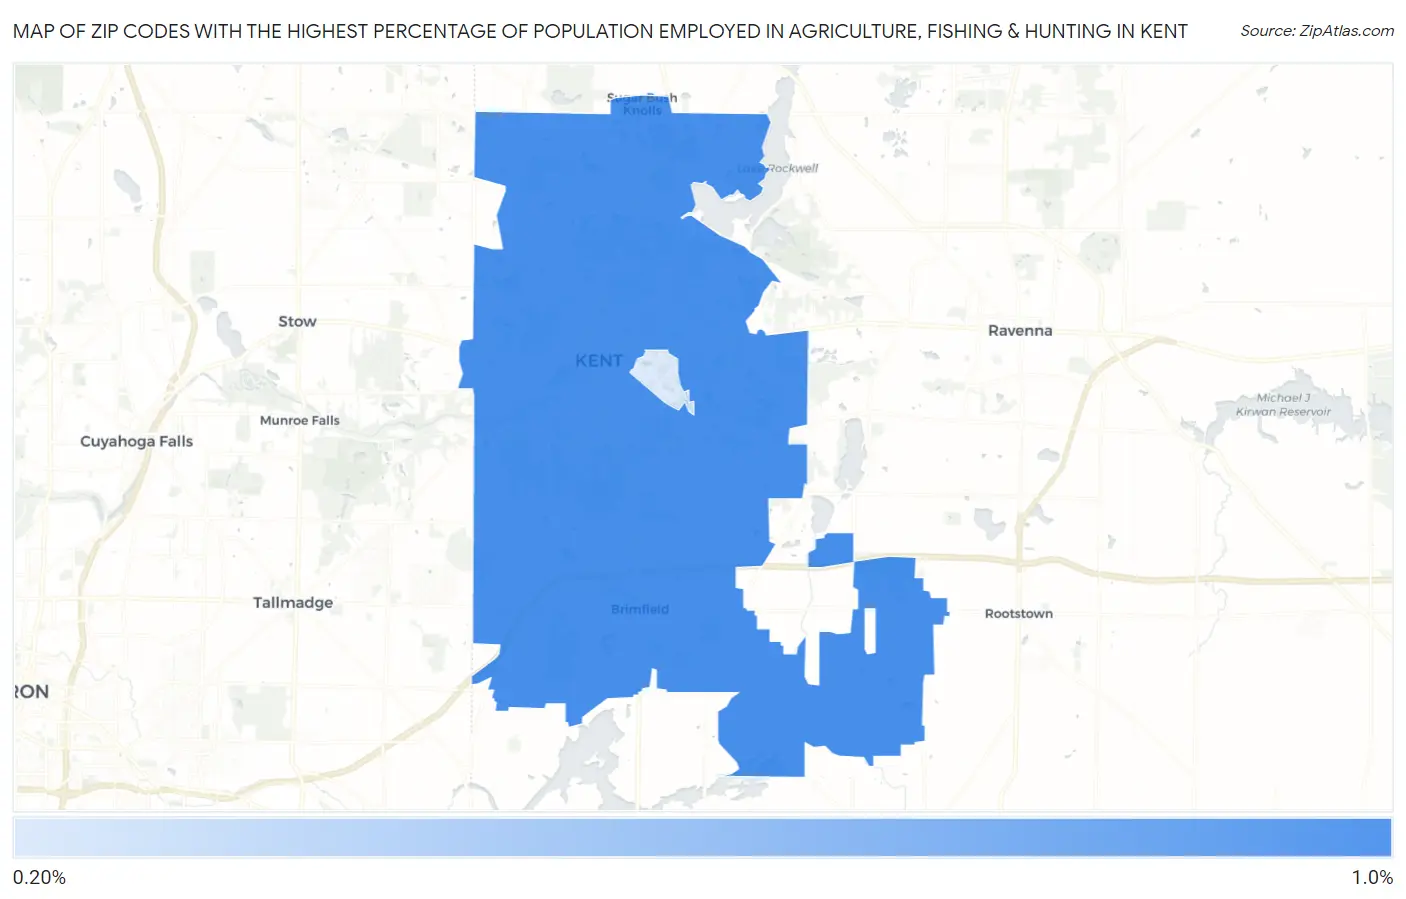
Map of Zip Codes with the Highest Percentage of Population Employed in Agriculture, Fishing & Hunting in Kent
0.21%
0.86%
Zip Codes with the Highest Percentage of Population Employed in Agriculture, Fishing & Hunting in Kent, OH
| Zip Code | % Employed | vs State | vs National | |
| 1. | 44240 | 0.86% | 0.71%(+0.142)#472 | 1.2%(-0.342)#16,938 |
| 2. | 44243 | 0.21% | 0.71%(-0.502)#676 | 1.2%(-0.986)#22,194 |
1
Common Questions
What are the Top Zip Codes with the Highest Percentage of Population Employed in Agriculture, Fishing & Hunting in Kent, OH?
Top Zip Codes with the Highest Percentage of Population Employed in Agriculture, Fishing & Hunting in Kent, OH are:
What zip code has the Highest Percentage of Population Employed in Agriculture, Fishing & Hunting in Kent, OH?
44240 has the Highest Percentage of Population Employed in Agriculture, Fishing & Hunting in Kent, OH with 0.86%.
What is the Percentage of Population Employed in Agriculture, Fishing & Hunting in Kent, OH?
Percentage of Population Employed in Agriculture, Fishing & Hunting in Kent is 1.2%.
What is the Percentage of Population Employed in Agriculture, Fishing & Hunting in Ohio?
Percentage of Population Employed in Agriculture, Fishing & Hunting in Ohio is 0.71%.
What is the Percentage of Population Employed in Agriculture, Fishing & Hunting in the United States?
Percentage of Population Employed in Agriculture, Fishing & Hunting in the United States is 1.2%.