Zip Codes with the Highest Percentage of Population Employed in Agriculture, Fishing & Hunting in Springfield, OH
RELATED REPORTS & OPTIONS
Agriculture, Fishing & Hunting
Springfield
Compare Zip Codes
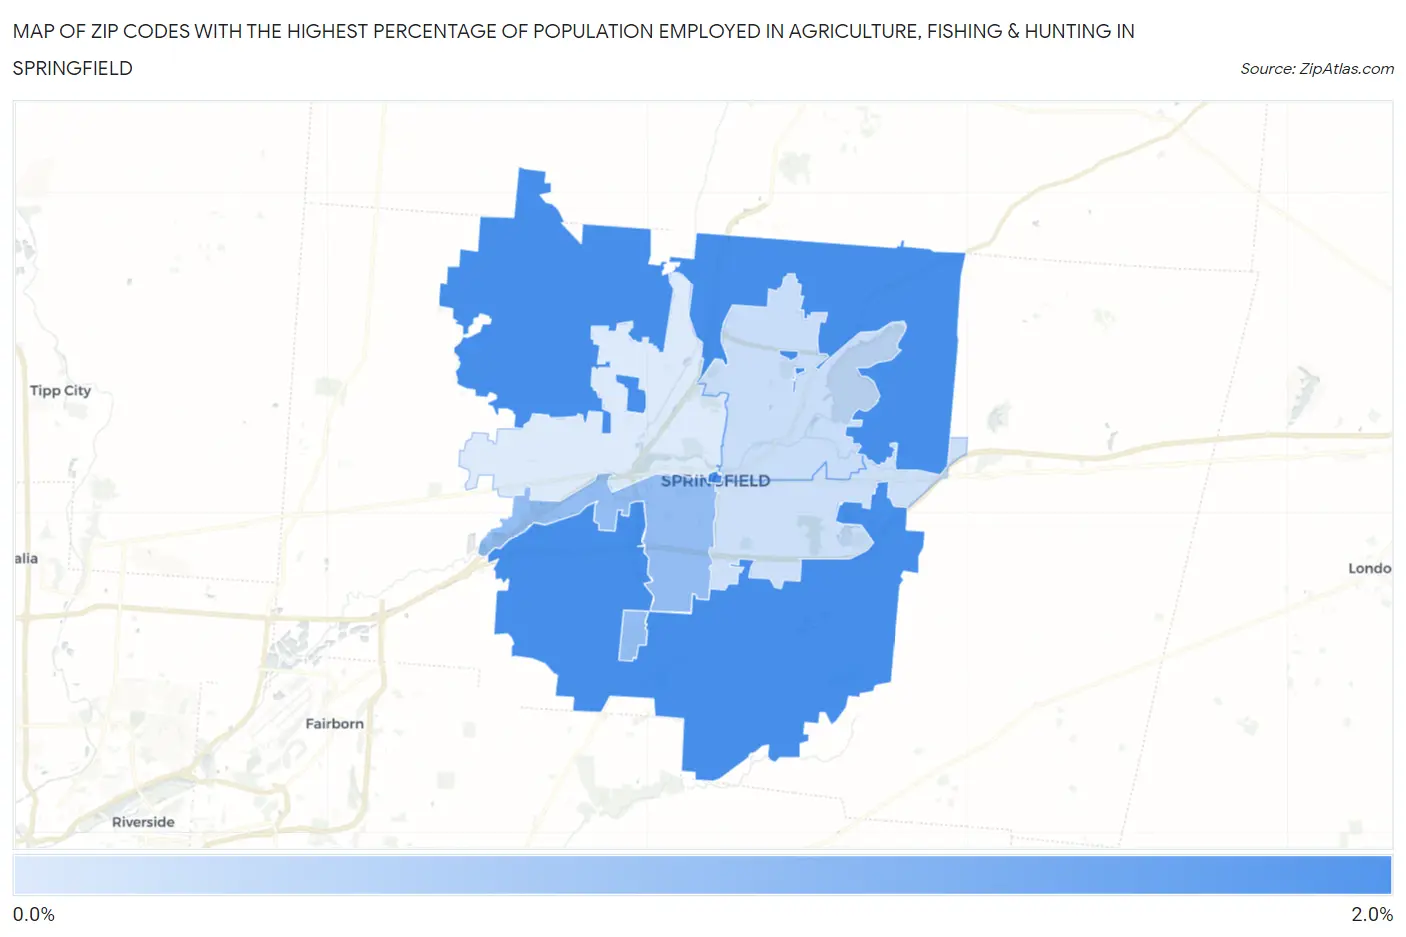
Map of Zip Codes with the Highest Percentage of Population Employed in Agriculture, Fishing & Hunting in Springfield
0.30%
1.5%
Zip Codes with the Highest Percentage of Population Employed in Agriculture, Fishing & Hunting in Springfield, OH
| Zip Code | % Employed | vs State | vs National | |
| 1. | 45502 | 1.5% | 0.71%(+0.804)#364 | 1.2%(+0.319)#14,225 |
| 2. | 45506 | 0.89% | 0.71%(+0.176)#459 | 1.2%(-0.308)#16,757 |
| 3. | 45503 | 0.47% | 0.71%(-0.246)#564 | 1.2%(-0.731)#19,546 |
| 4. | 45505 | 0.43% | 0.71%(-0.286)#584 | 1.2%(-0.771)#19,915 |
| 5. | 45504 | 0.30% | 0.71%(-0.414)#631 | 1.2%(-0.899)#21,170 |
1
Common Questions
What are the Top 3 Zip Codes with the Highest Percentage of Population Employed in Agriculture, Fishing & Hunting in Springfield, OH?
Top 3 Zip Codes with the Highest Percentage of Population Employed in Agriculture, Fishing & Hunting in Springfield, OH are:
What zip code has the Highest Percentage of Population Employed in Agriculture, Fishing & Hunting in Springfield, OH?
45502 has the Highest Percentage of Population Employed in Agriculture, Fishing & Hunting in Springfield, OH with 1.5%.
What is the Percentage of Population Employed in Agriculture, Fishing & Hunting in Springfield, OH?
Percentage of Population Employed in Agriculture, Fishing & Hunting in Springfield is 0.47%.
What is the Percentage of Population Employed in Agriculture, Fishing & Hunting in Ohio?
Percentage of Population Employed in Agriculture, Fishing & Hunting in Ohio is 0.71%.
What is the Percentage of Population Employed in Agriculture, Fishing & Hunting in the United States?
Percentage of Population Employed in Agriculture, Fishing & Hunting in the United States is 1.2%.