Zip Codes with the Highest Percentage of Population Employed in Health Diagnosing & Treating in Holland, MI
RELATED REPORTS & OPTIONS
Health Diagnosing & Treating
Holland
Compare Zip Codes
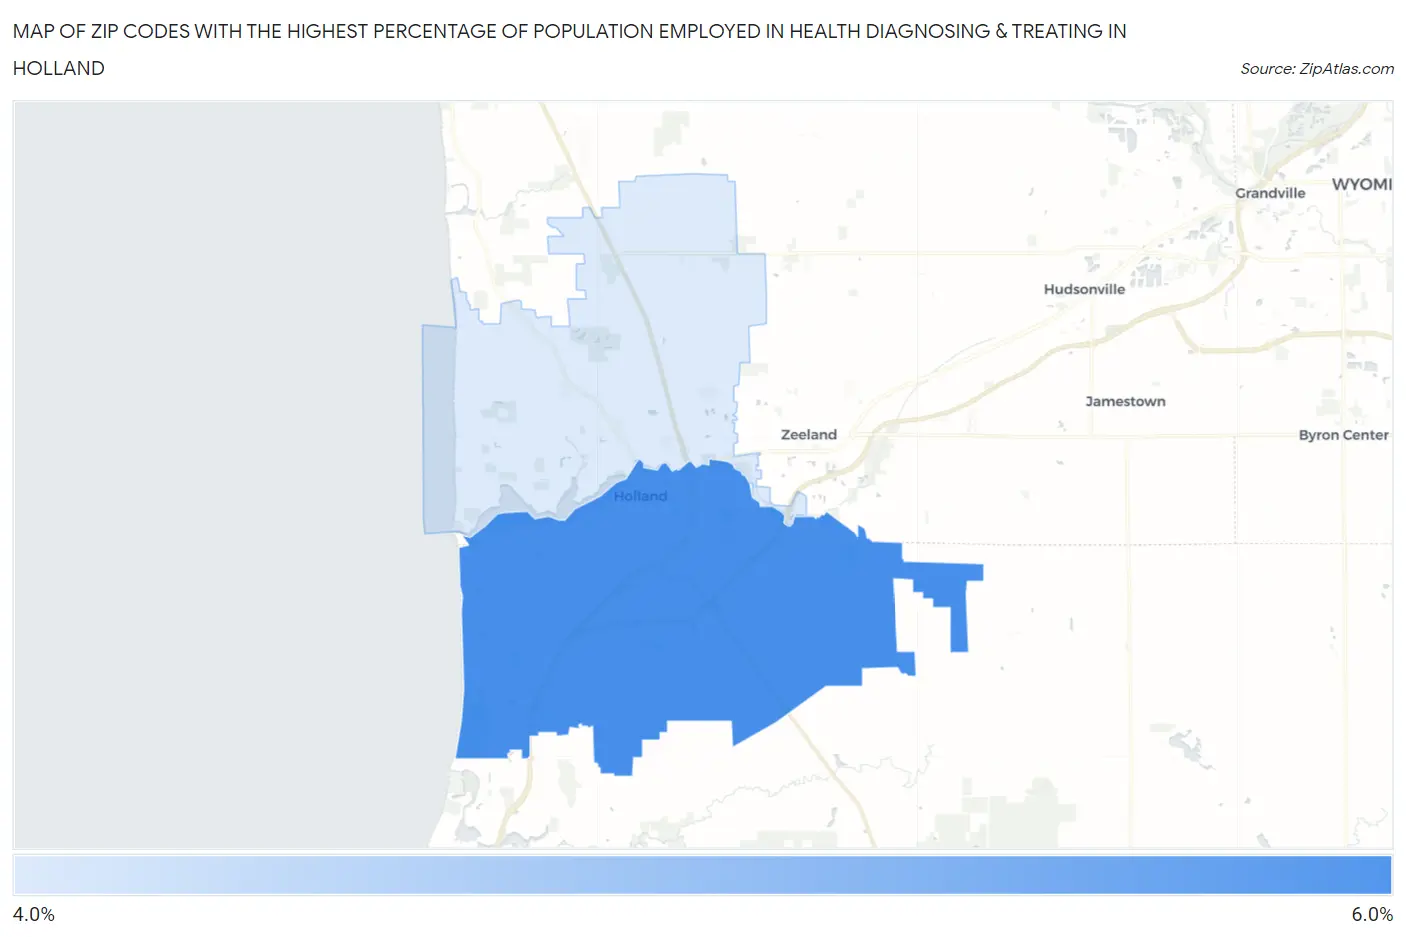
Map of Zip Codes with the Highest Percentage of Population Employed in Health Diagnosing & Treating in Holland
4.4%
5.1%
Zip Codes with the Highest Percentage of Population Employed in Health Diagnosing & Treating in Holland, MI
| Zip Code | % Employed | vs State | vs National | |
| 1. | 49423 | 5.1% | 6.6%(-1.59)#580 | 6.2%(-1.19)#17,463 |
| 2. | 49424 | 4.4% | 6.6%(-2.28)#689 | 6.2%(-1.88)#20,113 |
1
Common Questions
What are the Top Zip Codes with the Highest Percentage of Population Employed in Health Diagnosing & Treating in Holland, MI?
Top Zip Codes with the Highest Percentage of Population Employed in Health Diagnosing & Treating in Holland, MI are:
What zip code has the Highest Percentage of Population Employed in Health Diagnosing & Treating in Holland, MI?
49423 has the Highest Percentage of Population Employed in Health Diagnosing & Treating in Holland, MI with 5.1%.
What is the Percentage of Population Employed in Health Diagnosing & Treating in Holland, MI?
Percentage of Population Employed in Health Diagnosing & Treating in Holland is 4.8%.
What is the Percentage of Population Employed in Health Diagnosing & Treating in Michigan?
Percentage of Population Employed in Health Diagnosing & Treating in Michigan is 6.6%.
What is the Percentage of Population Employed in Health Diagnosing & Treating in the United States?
Percentage of Population Employed in Health Diagnosing & Treating in the United States is 6.2%.