Bay View, MI Map & Demographics
Bay View Map
Bay View Overview
$64,157
PER CAPITA INCOME
0.54
INEQUALITY / GINI INDEX
141
TOTAL POPULATION
38
MALE POPULATION
103
FEMALE POPULATION
36.89
MALES / 100 FEMALES
271.05
FEMALES / 100 MALES
74.1
MEDIAN AGE
2.4
AVG FAMILY SIZE
1.6
AVG HOUSEHOLD SIZE
53
LABOR FORCE [ PEOPLE ]
37.6%
PERCENT IN LABOR FORCE
Bay View Area Codes
Income in Bay View
Income Overview in Bay View
| Characteristic | Number | Measure |
| Per Capita Income | 141 | $64,157 |
| Median Family Income | 38 | $0 |
| Mean Family Income | 38 | $0 |
| Median Household Income | 89 | $0 |
| Mean Household Income | 89 | $101,639 |
| Income Deficit | 38 | $0 |
| Wage / Income Gap (%) | 141 | 0.00% |
| Wage / Income Gap ($) | 141 | 100.00¢ per $1 |
| Gini / Inequality Index | 141 | 0.54 |
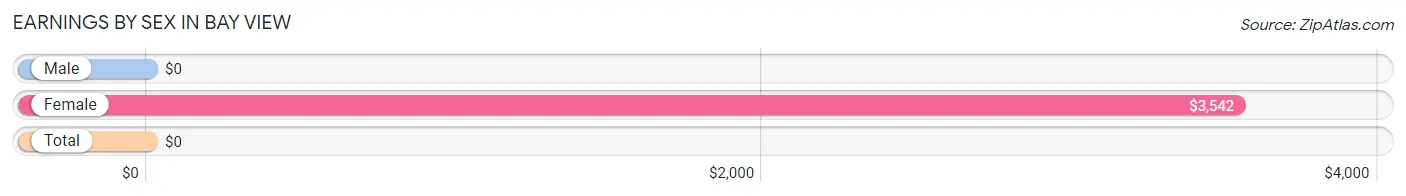
Earnings by Sex in Bay View
| Sex | Number | Average Earnings |
| Male | 13 (24.5%) | $0 |
| Female | 40 (75.5%) | $3,542 |
| Total | 53 (100.0%) | $0 |
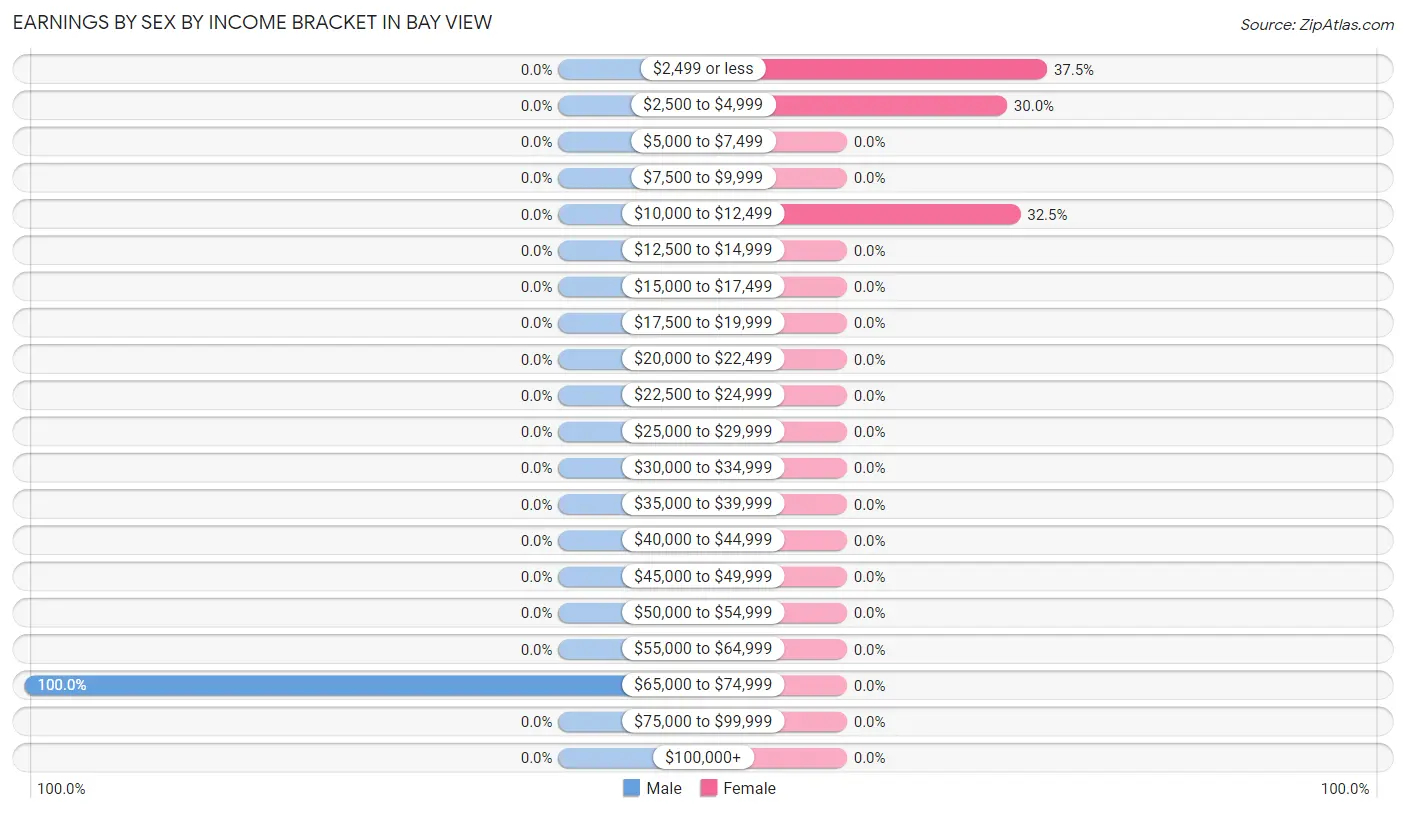
Earnings by Sex by Income Bracket in Bay View
The most common earnings brackets in Bay View are $65,000 to $74,999 for men (13 | 100.0%) and $2,499 or less for women (15 | 37.5%).
| Income | Male | Female |
| $2,499 or less | 0 (0.0%) | 15 (37.5%) |
| $2,500 to $4,999 | 0 (0.0%) | 12 (30.0%) |
| $5,000 to $7,499 | 0 (0.0%) | 0 (0.0%) |
| $7,500 to $9,999 | 0 (0.0%) | 0 (0.0%) |
| $10,000 to $12,499 | 0 (0.0%) | 13 (32.5%) |
| $12,500 to $14,999 | 0 (0.0%) | 0 (0.0%) |
| $15,000 to $17,499 | 0 (0.0%) | 0 (0.0%) |
| $17,500 to $19,999 | 0 (0.0%) | 0 (0.0%) |
| $20,000 to $22,499 | 0 (0.0%) | 0 (0.0%) |
| $22,500 to $24,999 | 0 (0.0%) | 0 (0.0%) |
| $25,000 to $29,999 | 0 (0.0%) | 0 (0.0%) |
| $30,000 to $34,999 | 0 (0.0%) | 0 (0.0%) |
| $35,000 to $39,999 | 0 (0.0%) | 0 (0.0%) |
| $40,000 to $44,999 | 0 (0.0%) | 0 (0.0%) |
| $45,000 to $49,999 | 0 (0.0%) | 0 (0.0%) |
| $50,000 to $54,999 | 0 (0.0%) | 0 (0.0%) |
| $55,000 to $64,999 | 0 (0.0%) | 0 (0.0%) |
| $65,000 to $74,999 | 13 (100.0%) | 0 (0.0%) |
| $75,000 to $99,999 | 0 (0.0%) | 0 (0.0%) |
| $100,000+ | 0 (0.0%) | 0 (0.0%) |
| Total | 13 (100.0%) | 40 (100.0%) |
Earnings by Sex by Educational Attainment in Bay View
| Educational Attainment | Male Income | Female Income |
| Less than High School | - | - |
| High School Diploma | - | - |
| College or Associate's Degree | - | - |
| Bachelor's Degree | - | - |
| Graduate Degree | - | - |
| Total | - | - |
Family Income in Bay View
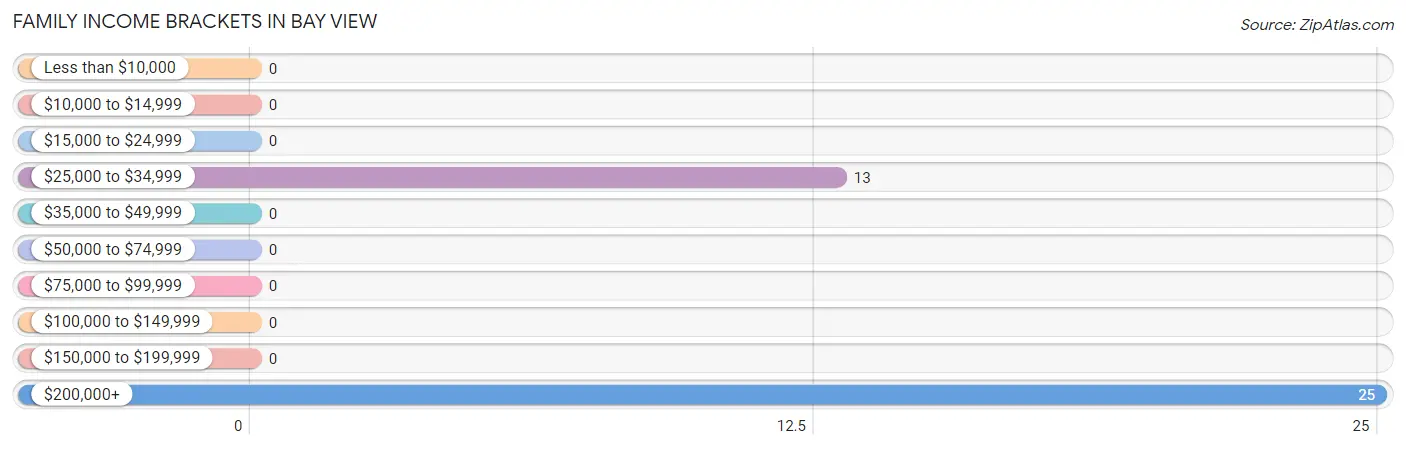
Family Income Brackets in Bay View
According to the Bay View family income data, there are 25 families falling into the $200,000+ income range, which is the most common income bracket and makes up 65.8% of all families.
| Income Bracket | # Families | % Families |
| Less than $10,000 | 0 | 0.0% |
| $10,000 to $14,999 | 0 | 0.0% |
| $15,000 to $24,999 | 0 | 0.0% |
| $25,000 to $34,999 | 13 | 34.2% |
| $35,000 to $49,999 | 0 | 0.0% |
| $50,000 to $74,999 | 0 | 0.0% |
| $75,000 to $99,999 | 0 | 0.0% |
| $100,000 to $149,999 | 0 | 0.0% |
| $150,000 to $199,999 | 0 | 0.0% |
| $200,000+ | 25 | 65.8% |
Family Income by Famaliy Size in Bay View
| Income Bracket | # Families | Median Income |
| 2-Person Families | 25 (65.8%) | $0 |
| 3-Person Families | 13 (34.2%) | $0 |
| 4-Person Families | 0 (0.0%) | $0 |
| 5-Person Families | 0 (0.0%) | $0 |
| 6-Person Families | 0 (0.0%) | $0 |
| 7+ Person Families | 0 (0.0%) | $0 |
| Total | 38 (100.0%) | $0 |
Family Income by Number of Earners in Bay View
| Number of Earners | # Families | Median Income |
| No Earners | 25 (65.8%) | $0 |
| 1 Earner | 0 (0.0%) | $0 |
| 2 Earners | 0 (0.0%) | $0 |
| 3+ Earners | 13 (34.2%) | $0 |
| Total | 38 (100.0%) | $0 |
Household Income in Bay View
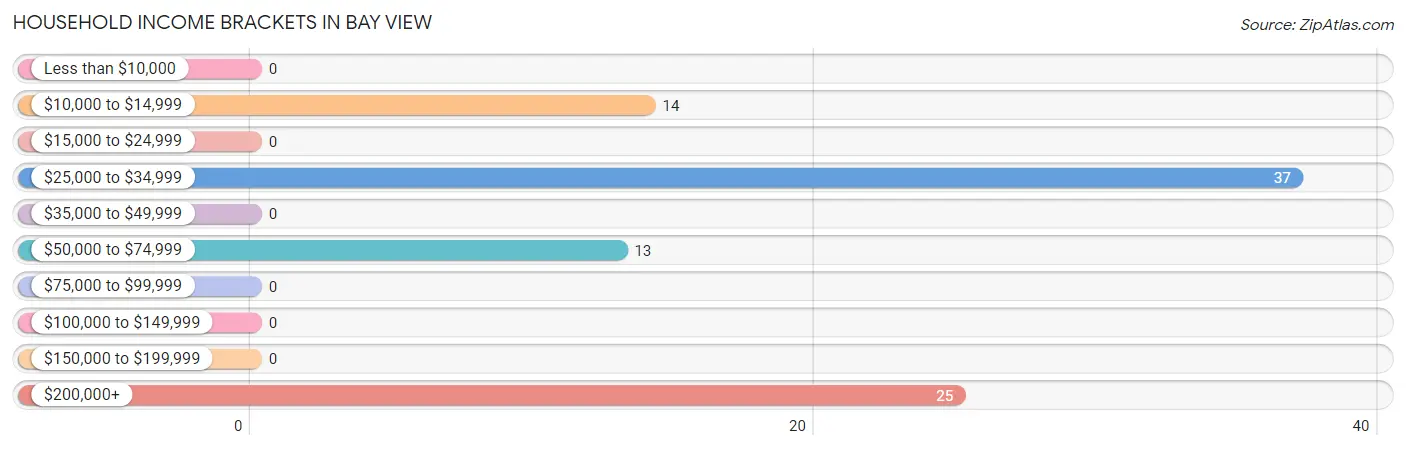
Household Income Brackets in Bay View
With 37 households falling in the category, the $25,000 to $34,999 income range is the most frequent in Bay View, accounting for 41.6% of all households.
| Income Bracket | # Households | % Households |
| Less than $10,000 | 0 | 0.0% |
| $10,000 to $14,999 | 14 | 15.7% |
| $15,000 to $24,999 | 0 | 0.0% |
| $25,000 to $34,999 | 37 | 41.6% |
| $35,000 to $49,999 | 0 | 0.0% |
| $50,000 to $74,999 | 13 | 14.6% |
| $75,000 to $99,999 | 0 | 0.0% |
| $100,000 to $149,999 | 0 | 0.0% |
| $150,000 to $199,999 | 0 | 0.0% |
| $200,000+ | 25 | 28.1% |
Household Income by Householder Age in Bay View
| Income Bracket | # Households | Median Income |
| 15 to 24 Years | 0 (0.0%) | $0 |
| 25 to 44 Years | 26 (29.2%) | $0 |
| 45 to 64 Years | 14 (15.7%) | $0 |
| 65+ Years | 49 (55.1%) | $0 |
| Total | 89 (100.0%) | $0 |
Poverty in Bay View
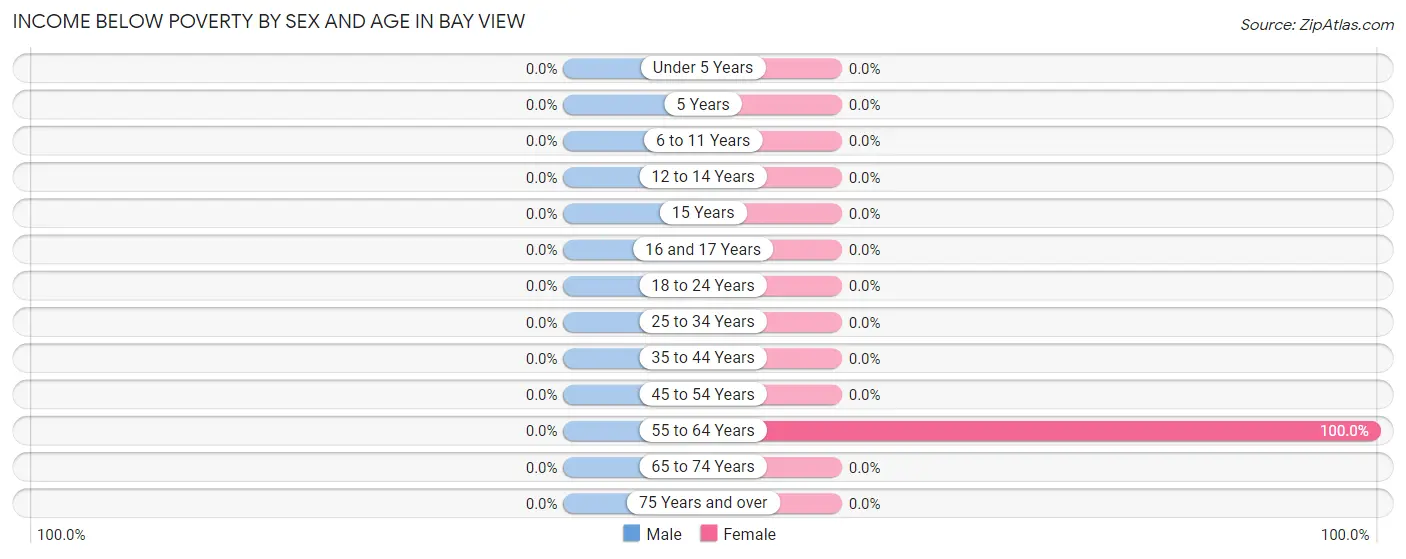
Income Below Poverty by Sex and Age in Bay View
| Age Bracket | Male | Female |
| Under 5 Years | 0 (0.0%) | 0 (0.0%) |
| 5 Years | 0 (0.0%) | 0 (0.0%) |
| 6 to 11 Years | 0 (0.0%) | 0 (0.0%) |
| 12 to 14 Years | 0 (0.0%) | 0 (0.0%) |
| 15 Years | 0 (0.0%) | 0 (0.0%) |
| 16 and 17 Years | 0 (0.0%) | 0 (0.0%) |
| 18 to 24 Years | 0 (0.0%) | 0 (0.0%) |
| 25 to 34 Years | 0 (0.0%) | 0 (0.0%) |
| 35 to 44 Years | 0 (0.0%) | 0 (0.0%) |
| 45 to 54 Years | 0 (0.0%) | 0 (0.0%) |
| 55 to 64 Years | 0 (0.0%) | 14 (100.0%) |
| 65 to 74 Years | 0 (0.0%) | 0 (0.0%) |
| 75 Years and over | 0 (0.0%) | 0 (0.0%) |
| Total | 0 (0.0%) | 14 (13.6%) |
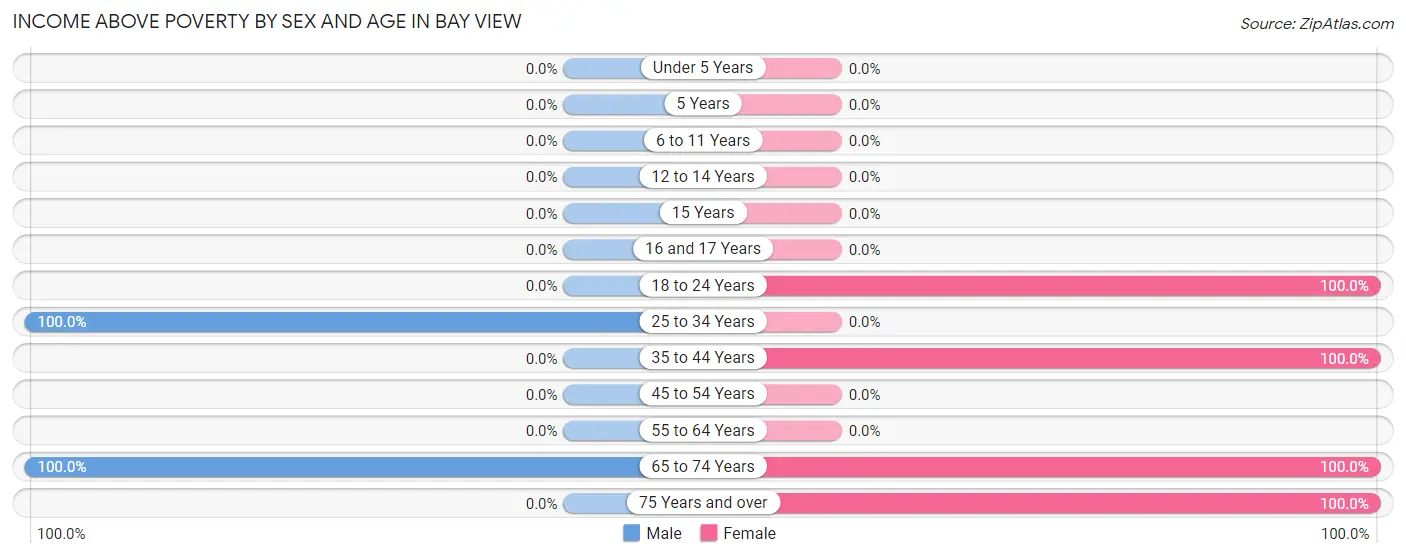
Income Above Poverty by Sex and Age in Bay View
According to the poverty statistics in Bay View, males aged 25 to 34 years and females aged 18 to 24 years are the age groups that are most secure financially, with 100.0% of males and 100.0% of females in these age groups living above the poverty line.
| Age Bracket | Male | Female |
| Under 5 Years | 0 (0.0%) | 0 (0.0%) |
| 5 Years | 0 (0.0%) | 0 (0.0%) |
| 6 to 11 Years | 0 (0.0%) | 0 (0.0%) |
| 12 to 14 Years | 0 (0.0%) | 0 (0.0%) |
| 15 Years | 0 (0.0%) | 0 (0.0%) |
| 16 and 17 Years | 0 (0.0%) | 0 (0.0%) |
| 18 to 24 Years | 0 (0.0%) | 27 (100.0%) |
| 25 to 34 Years | 13 (100.0%) | 0 (0.0%) |
| 35 to 44 Years | 0 (0.0%) | 13 (100.0%) |
| 45 to 54 Years | 0 (0.0%) | 0 (0.0%) |
| 55 to 64 Years | 0 (0.0%) | 0 (0.0%) |
| 65 to 74 Years | 25 (100.0%) | 25 (100.0%) |
| 75 Years and over | 0 (0.0%) | 24 (100.0%) |
| Total | 38 (100.0%) | 89 (86.4%) |
Income Below Poverty Among Married-Couple Families in Bay View
| Children | Above Poverty | Below Poverty |
| No Children | 25 (100.0%) | 0 (0.0%) |
| 1 or 2 Children | 0 (0.0%) | 0 (0.0%) |
| 3 or 4 Children | 0 (0.0%) | 0 (0.0%) |
| 5 or more Children | 0 (0.0%) | 0 (0.0%) |
| Total | 25 (100.0%) | 0 (0.0%) |
Income Below Poverty Among Single-Parent Households in Bay View
| Children | Single Father | Single Mother |
| No Children | 0 (0.0%) | 0 (0.0%) |
| 1 or 2 Children | 0 (0.0%) | 0 (0.0%) |
| 3 or 4 Children | 0 (0.0%) | 0 (0.0%) |
| 5 or more Children | 0 (0.0%) | 0 (0.0%) |
| Total | 0 (0.0%) | 0 (0.0%) |
Income Below Poverty Among Married-Couple vs Single-Parent Households in Bay View
| Children | Married-Couple Families | Single-Parent Households |
| No Children | 0 (0.0%) | 0 (0.0%) |
| 1 or 2 Children | 0 (0.0%) | 0 (0.0%) |
| 3 or 4 Children | 0 (0.0%) | 0 (0.0%) |
| 5 or more Children | 0 (0.0%) | 0 (0.0%) |
| Total | 0 (0.0%) | 0 (0.0%) |
Race in Bay View
The most populous races in Bay View are , and White / Caucasian (141 | 100.0%).
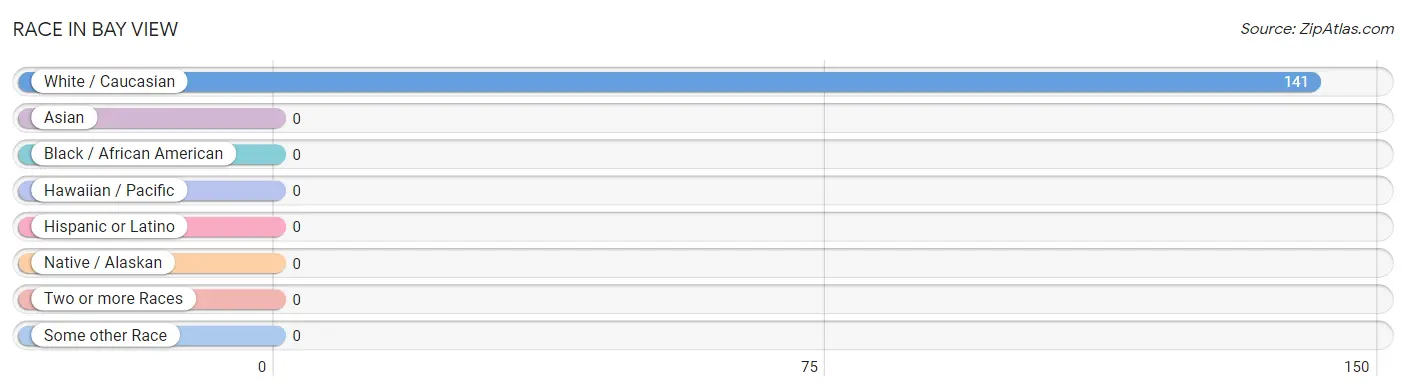
| Race | # Population | % Population |
| Asian | 0 | 0.0% |
| Black / African American | 0 | 0.0% |
| Hawaiian / Pacific | 0 | 0.0% |
| Hispanic or Latino | 0 | 0.0% |
| Native / Alaskan | 0 | 0.0% |
| White / Caucasian | 141 | 100.0% |
| Two or more Races | 0 | 0.0% |
| Some other Race | 0 | 0.0% |
| Total | 141 | 100.0% |
Ancestry in Bay View
The most populous ancestries reported in Bay View are Irish (65 | 46.1%), German (50 | 35.5%), Polish (40 | 28.4%), Norwegian (25 | 17.7%), and English (24 | 17.0%), together accounting for 144.7% of all Bay View residents.
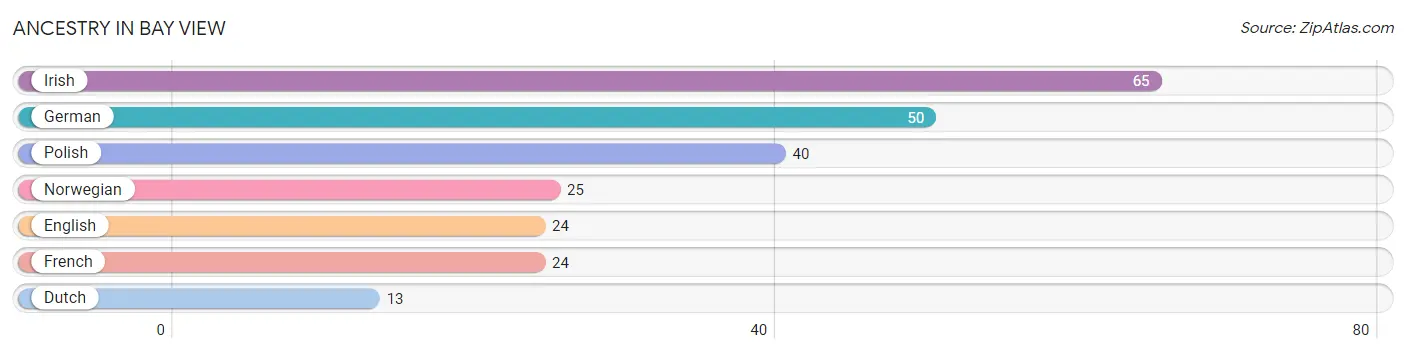
| Ancestry | # Population | % Population |
| Dutch | 13 | 9.2% |
| English | 24 | 17.0% |
| French | 24 | 17.0% |
| German | 50 | 35.5% |
| Irish | 65 | 46.1% |
| Norwegian | 25 | 17.7% |
| Polish | 40 | 28.4% | View All 7 Rows |
Immigrants in Bay View

| Immigration Origin | # Population | % Population | View All 0 Rows |
Sex and Age in Bay View
Sex and Age in Bay View
The most populous age groups in Bay View are 70 to 74 Years (25 | 65.8%) for men and 70 to 74 Years (25 | 24.3%) for women.
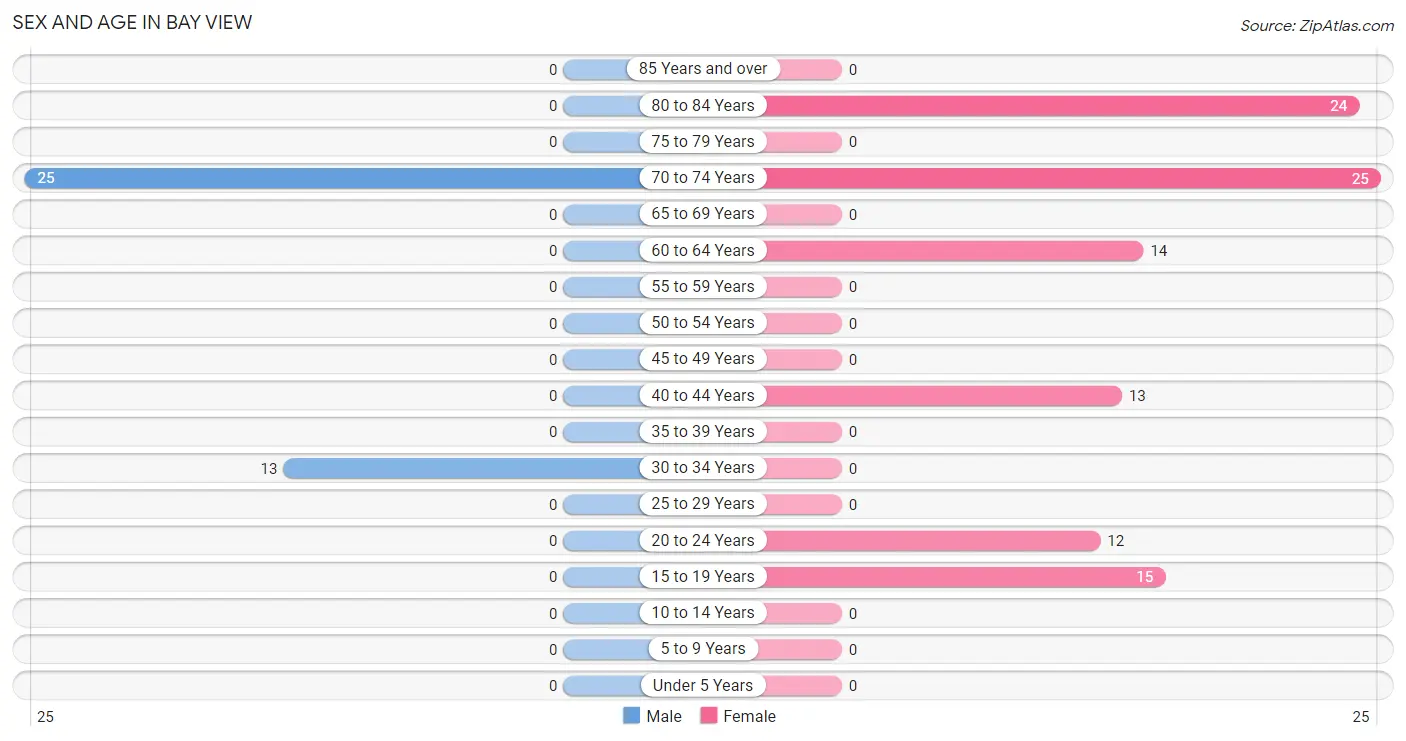
| Age Bracket | Male | Female |
| Under 5 Years | 0 (0.0%) | 0 (0.0%) |
| 5 to 9 Years | 0 (0.0%) | 0 (0.0%) |
| 10 to 14 Years | 0 (0.0%) | 0 (0.0%) |
| 15 to 19 Years | 0 (0.0%) | 15 (14.6%) |
| 20 to 24 Years | 0 (0.0%) | 12 (11.7%) |
| 25 to 29 Years | 0 (0.0%) | 0 (0.0%) |
| 30 to 34 Years | 13 (34.2%) | 0 (0.0%) |
| 35 to 39 Years | 0 (0.0%) | 0 (0.0%) |
| 40 to 44 Years | 0 (0.0%) | 13 (12.6%) |
| 45 to 49 Years | 0 (0.0%) | 0 (0.0%) |
| 50 to 54 Years | 0 (0.0%) | 0 (0.0%) |
| 55 to 59 Years | 0 (0.0%) | 0 (0.0%) |
| 60 to 64 Years | 0 (0.0%) | 14 (13.6%) |
| 65 to 69 Years | 0 (0.0%) | 0 (0.0%) |
| 70 to 74 Years | 25 (65.8%) | 25 (24.3%) |
| 75 to 79 Years | 0 (0.0%) | 0 (0.0%) |
| 80 to 84 Years | 0 (0.0%) | 24 (23.3%) |
| 85 Years and over | 0 (0.0%) | 0 (0.0%) |
| Total | 38 (100.0%) | 103 (100.0%) |
Families and Households in Bay View
Median Family Size in Bay View
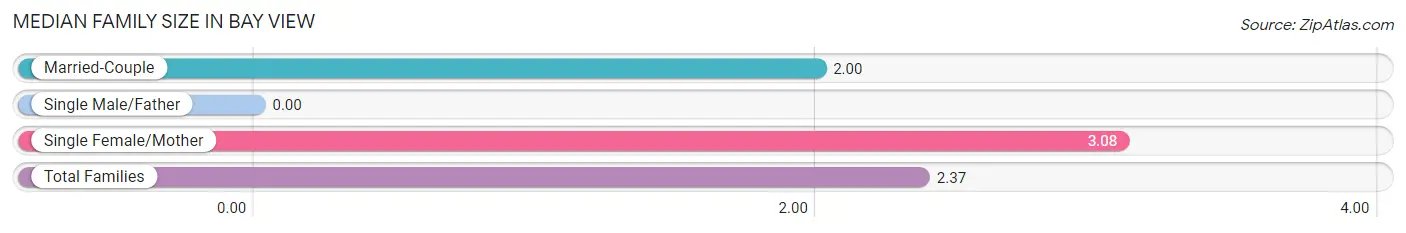
| Family Type | # Families | Family Size |
| Married-Couple | 25 (65.8%) | 2.00 |
| Single Male/Father | 0 (0.0%) | - |
| Single Female/Mother | 13 (34.2%) | 3.08 |
| Total Families | 38 (100.0%) | 2.37 |
Median Household Size in Bay View
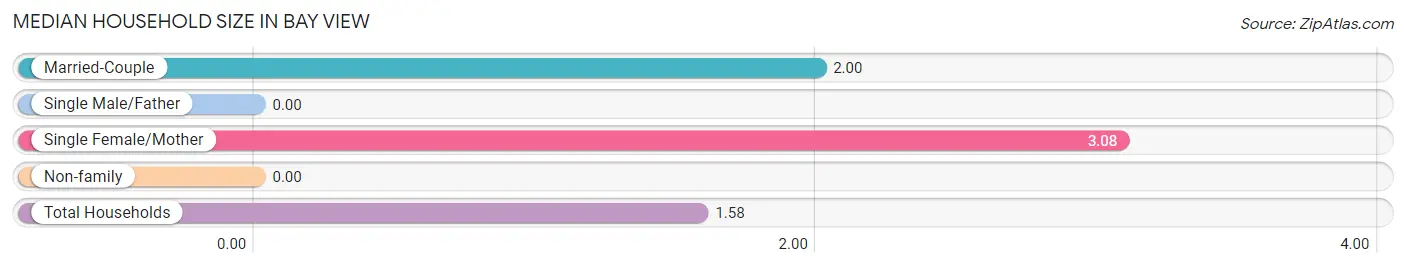
| Household Type | # Households | Household Size |
| Married-Couple | 25 (28.1%) | 2.00 |
| Single Male/Father | 0 (0.0%) | - |
| Single Female/Mother | 13 (14.6%) | 3.08 |
| Non-family | 51 (57.3%) | - |
| Total Households | 89 (100.0%) | 1.58 |
Household Size by Marriage Status in Bay View
Out of a total of 89 households in Bay View, 38 (42.7%) are family households, while 51 (57.3%) are nonfamily households. The most numerous type of family households are 2-person households, comprising 25, and the most common type of nonfamily households are 1-person households, comprising 51.
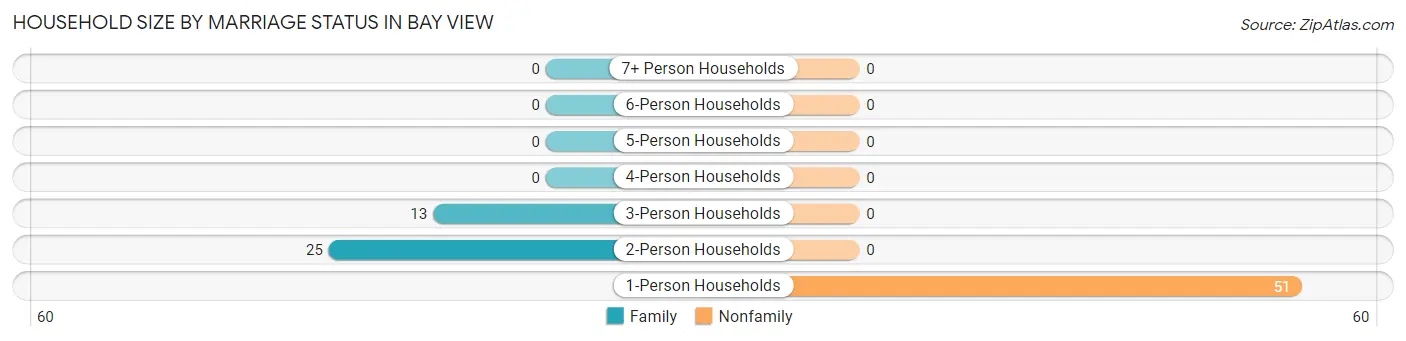
| Household Size | Family Households | Nonfamily Households |
| 1-Person Households | - | 51 (57.3%) |
| 2-Person Households | 25 (28.1%) | 0 (0.0%) |
| 3-Person Households | 13 (14.6%) | 0 (0.0%) |
| 4-Person Households | 0 (0.0%) | 0 (0.0%) |
| 5-Person Households | 0 (0.0%) | 0 (0.0%) |
| 6-Person Households | 0 (0.0%) | 0 (0.0%) |
| 7+ Person Households | 0 (0.0%) | 0 (0.0%) |
| Total | 38 (42.7%) | 51 (57.3%) |
Female Fertility in Bay View
Fertility by Age in Bay View
| Age Bracket | Women with Births | Births / 1,000 Women |
| 15 to 19 years | 0 (0.0%) | 0.0 |
| 20 to 34 years | 0 (0.0%) | 0.0 |
| 35 to 50 years | 0 (0.0%) | 0.0 |
| Total | 0 (0.0%) | 0.0 |
Fertility by Age by Marriage Status in Bay View
| Age Bracket | Married | Unmarried |
| 15 to 19 years | 0 (0.0%) | 0 (0.0%) |
| 20 to 34 years | 0 (0.0%) | 0 (0.0%) |
| 35 to 50 years | 0 (0.0%) | 0 (0.0%) |
| Total | 0 (0.0%) | 0 (0.0%) |
Fertility by Education in Bay View
| Educational Attainment | Women with Births | Births / 1,000 Women |
| Less than High School | 0 (0.0%) | 0.0 |
| High School Diploma | 0 (0.0%) | 0.0 |
| College or Associate's Degree | 0 (0.0%) | 0.0 |
| Bachelor's Degree | 0 (0.0%) | 0.0 |
| Graduate Degree | 0 (0.0%) | 0.0 |
| Total | 0 (0.0%) | 0.0 |
Fertility by Education by Marriage Status in Bay View
| Educational Attainment | Married | Unmarried |
| Less than High School | 0 (0.0%) | 0 (0.0%) |
| High School Diploma | 0 (0.0%) | 0 (0.0%) |
| College or Associate's Degree | 0 (0.0%) | 0 (0.0%) |
| Bachelor's Degree | 0 (0.0%) | 0 (0.0%) |
| Graduate Degree | 0 (0.0%) | 0 (0.0%) |
| Total | 0 (0.0%) | 0 (0.0%) |
Employment Characteristics in Bay View
Employment by Class of Employer in Bay View
Among the 53 employed individuals in Bay View, private company employees (38 | 71.7%), and not-for-profit organizations (15 | 28.3%) make up the most common classes of employment.
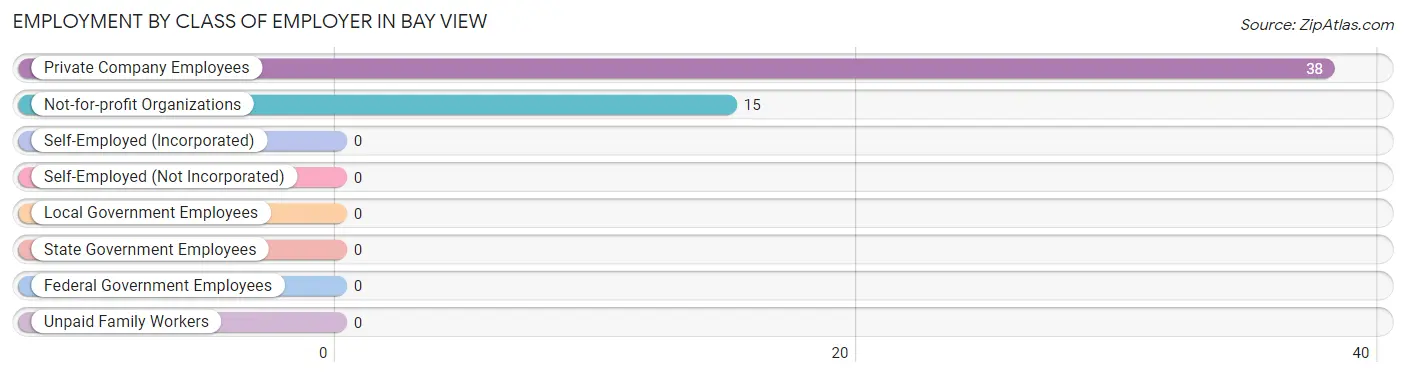
| Employer Class | # Employees | % Employees |
| Private Company Employees | 38 | 71.7% |
| Self-Employed (Incorporated) | 0 | 0.0% |
| Self-Employed (Not Incorporated) | 0 | 0.0% |
| Not-for-profit Organizations | 15 | 28.3% |
| Local Government Employees | 0 | 0.0% |
| State Government Employees | 0 | 0.0% |
| Federal Government Employees | 0 | 0.0% |
| Unpaid Family Workers | 0 | 0.0% |
| Total | 53 | 100.0% |
Employment Status by Age in Bay View
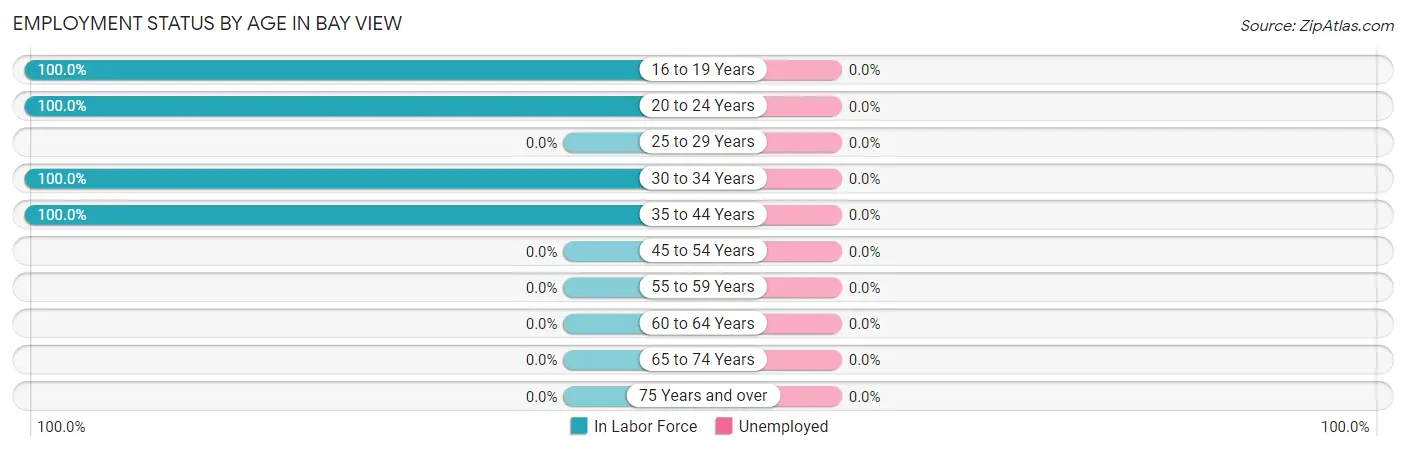
| Age Bracket | In Labor Force | Unemployed |
| 16 to 19 Years | 15 (100.0%) | 0 (0.0%) |
| 20 to 24 Years | 12 (100.0%) | 0 (0.0%) |
| 25 to 29 Years | 0 (0.0%) | 0 (0.0%) |
| 30 to 34 Years | 13 (100.0%) | 0 (0.0%) |
| 35 to 44 Years | 13 (100.0%) | 0 (0.0%) |
| 45 to 54 Years | 0 (0.0%) | 0 (0.0%) |
| 55 to 59 Years | 0 (0.0%) | 0 (0.0%) |
| 60 to 64 Years | 0 (0.0%) | 0 (0.0%) |
| 65 to 74 Years | 0 (0.0%) | 0 (0.0%) |
| 75 Years and over | 0 (0.0%) | 0 (0.0%) |
| Total | 53 (37.6%) | 0 (0.0%) |
Employment Status by Educational Attainment in Bay View
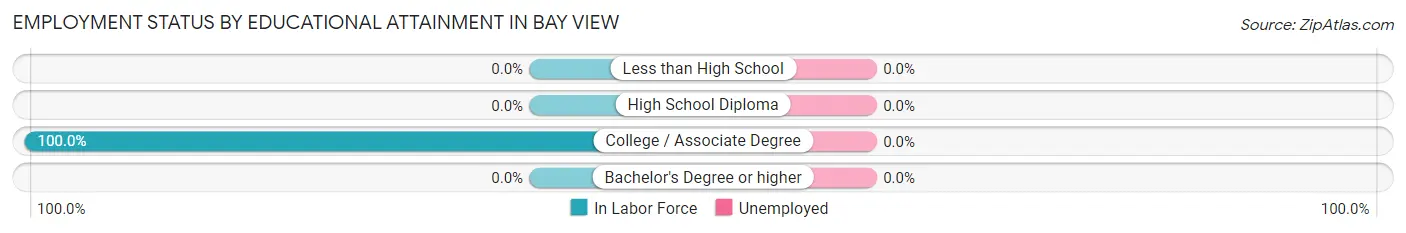
| Educational Attainment | In Labor Force | Unemployed |
| Less than High School | 0 (0.0%) | 0 (0.0%) |
| High School Diploma | 0 (0.0%) | 0 (0.0%) |
| College / Associate Degree | 26 (100.0%) | 0 (0.0%) |
| Bachelor's Degree or higher | 0 (0.0%) | 0 (0.0%) |
| Total | 26 (65.0%) | 0 (0.0%) |
Employment Occupations by Sex in Bay View
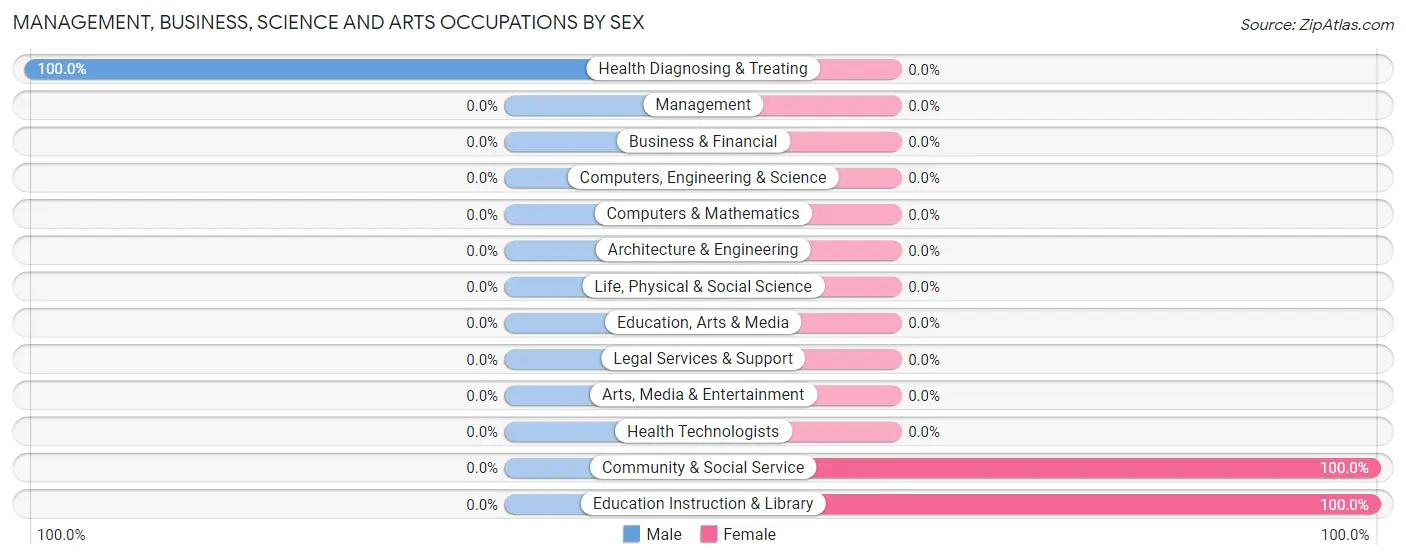
Management, Business, Science and Arts Occupations
The most common Management, Business, Science and Arts occupations in Bay View are Community & Social Service (15 | 28.3%), Education Instruction & Library (15 | 28.3%), and Health Diagnosing & Treating (13 | 24.5%).
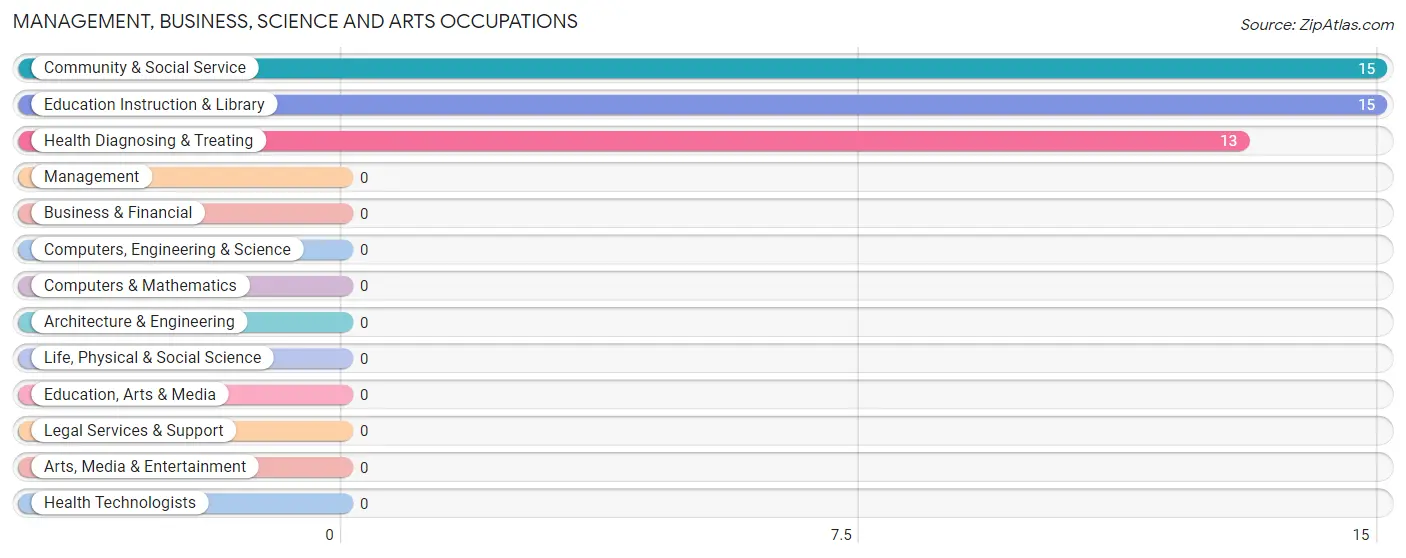
Management, Business, Science and Arts Occupations by Sex
| Occupation | Male | Female |
| Management | 0 (0.0%) | 0 (0.0%) |
| Business & Financial | 0 (0.0%) | 0 (0.0%) |
| Computers, Engineering & Science | 0 (0.0%) | 0 (0.0%) |
| Computers & Mathematics | 0 (0.0%) | 0 (0.0%) |
| Architecture & Engineering | 0 (0.0%) | 0 (0.0%) |
| Life, Physical & Social Science | 0 (0.0%) | 0 (0.0%) |
| Community & Social Service | 0 (0.0%) | 15 (100.0%) |
| Education, Arts & Media | 0 (0.0%) | 0 (0.0%) |
| Legal Services & Support | 0 (0.0%) | 0 (0.0%) |
| Education Instruction & Library | 0 (0.0%) | 15 (100.0%) |
| Arts, Media & Entertainment | 0 (0.0%) | 0 (0.0%) |
| Health Diagnosing & Treating | 13 (100.0%) | 0 (0.0%) |
| Health Technologists | 0 (0.0%) | 0 (0.0%) |
| Total (Category) | 13 (46.4%) | 15 (53.6%) |
| Total (Overall) | 13 (24.5%) | 40 (75.5%) |
Services Occupations
Services Occupations by Sex
| Occupation | Male | Female |
| Healthcare Support | 0 (0.0%) | 0 (0.0%) |
| Security & Protection | 0 (0.0%) | 0 (0.0%) |
| Firefighting & Prevention | 0 (0.0%) | 0 (0.0%) |
| Law Enforcement | 0 (0.0%) | 0 (0.0%) |
| Food Preparation & Serving | 0 (0.0%) | 0 (0.0%) |
| Cleaning & Maintenance | 0 (0.0%) | 0 (0.0%) |
| Personal Care & Service | 0 (0.0%) | 0 (0.0%) |
| Total (Category) | 0 (0.0%) | 0 (0.0%) |
| Total (Overall) | 13 (24.5%) | 40 (75.5%) |
Sales and Office Occupations
The most common Sales and Office occupations in Bay View are , and Sales & Related (25 | 47.2%).
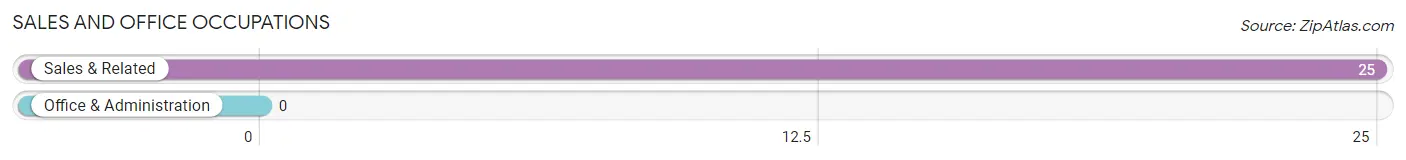
Sales and Office Occupations by Sex

| Occupation | Male | Female |
| Sales & Related | 0 (0.0%) | 25 (100.0%) |
| Office & Administration | 0 (0.0%) | 0 (0.0%) |
| Total (Category) | 0 (0.0%) | 25 (100.0%) |
| Total (Overall) | 13 (24.5%) | 40 (75.5%) |
Natural Resources, Construction and Maintenance Occupations
Natural Resources, Construction and Maintenance Occupations by Sex
| Occupation | Male | Female |
| Farming, Fishing & Forestry | 0 (0.0%) | 0 (0.0%) |
| Construction & Extraction | 0 (0.0%) | 0 (0.0%) |
| Installation, Maintenance & Repair | 0 (0.0%) | 0 (0.0%) |
| Total (Category) | 0 (0.0%) | 0 (0.0%) |
| Total (Overall) | 13 (24.5%) | 40 (75.5%) |
Production, Transportation and Moving Occupations
Production, Transportation and Moving Occupations by Sex
| Occupation | Male | Female |
| Production | 0 (0.0%) | 0 (0.0%) |
| Transportation | 0 (0.0%) | 0 (0.0%) |
| Material Moving | 0 (0.0%) | 0 (0.0%) |
| Total (Category) | 0 (0.0%) | 0 (0.0%) |
| Total (Overall) | 13 (24.5%) | 40 (75.5%) |
Employment Industries by Sex in Bay View
Employment Industries in Bay View
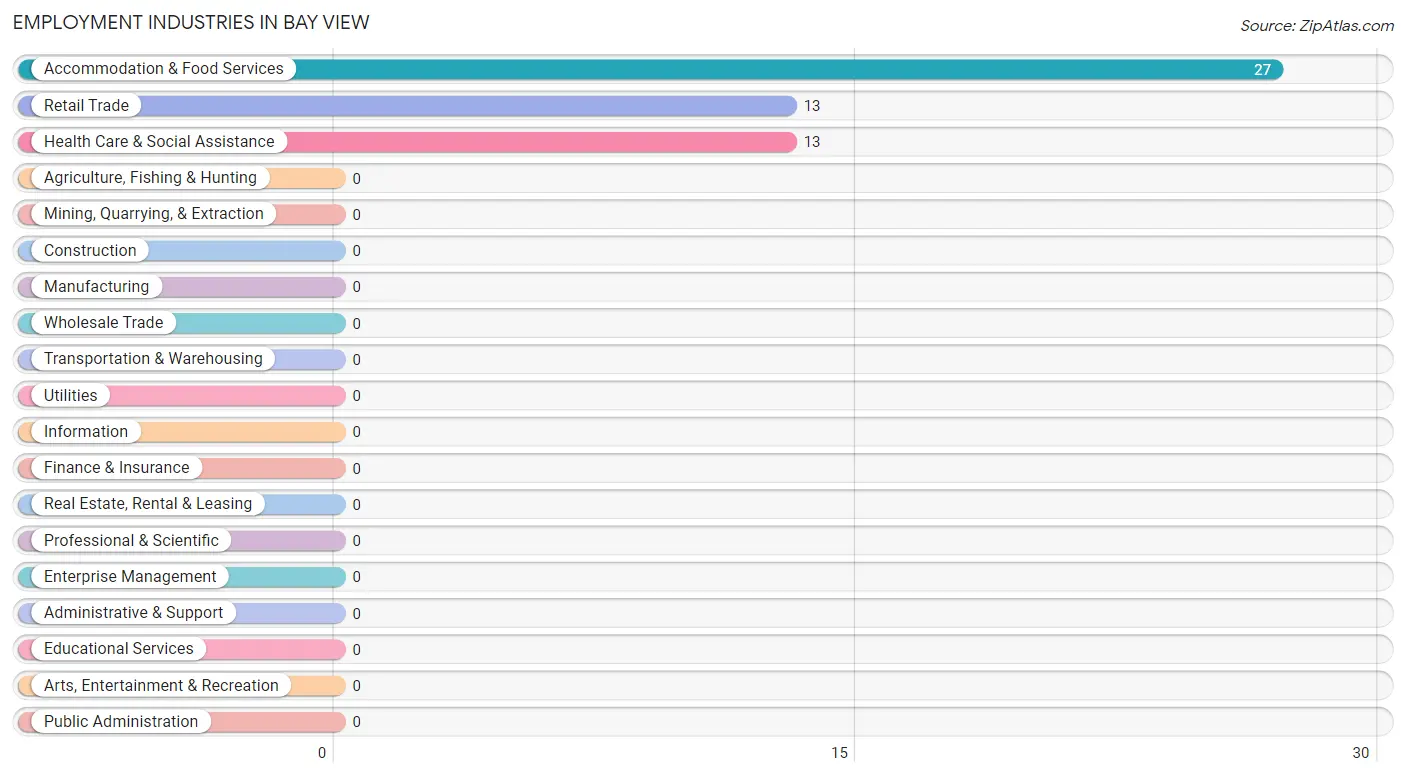
The major employment industries in Bay View include Accommodation & Food Services (27 | 50.9%), Retail Trade (13 | 24.5%), and Health Care & Social Assistance (13 | 24.5%).
Employment Industries by Sex in Bay View
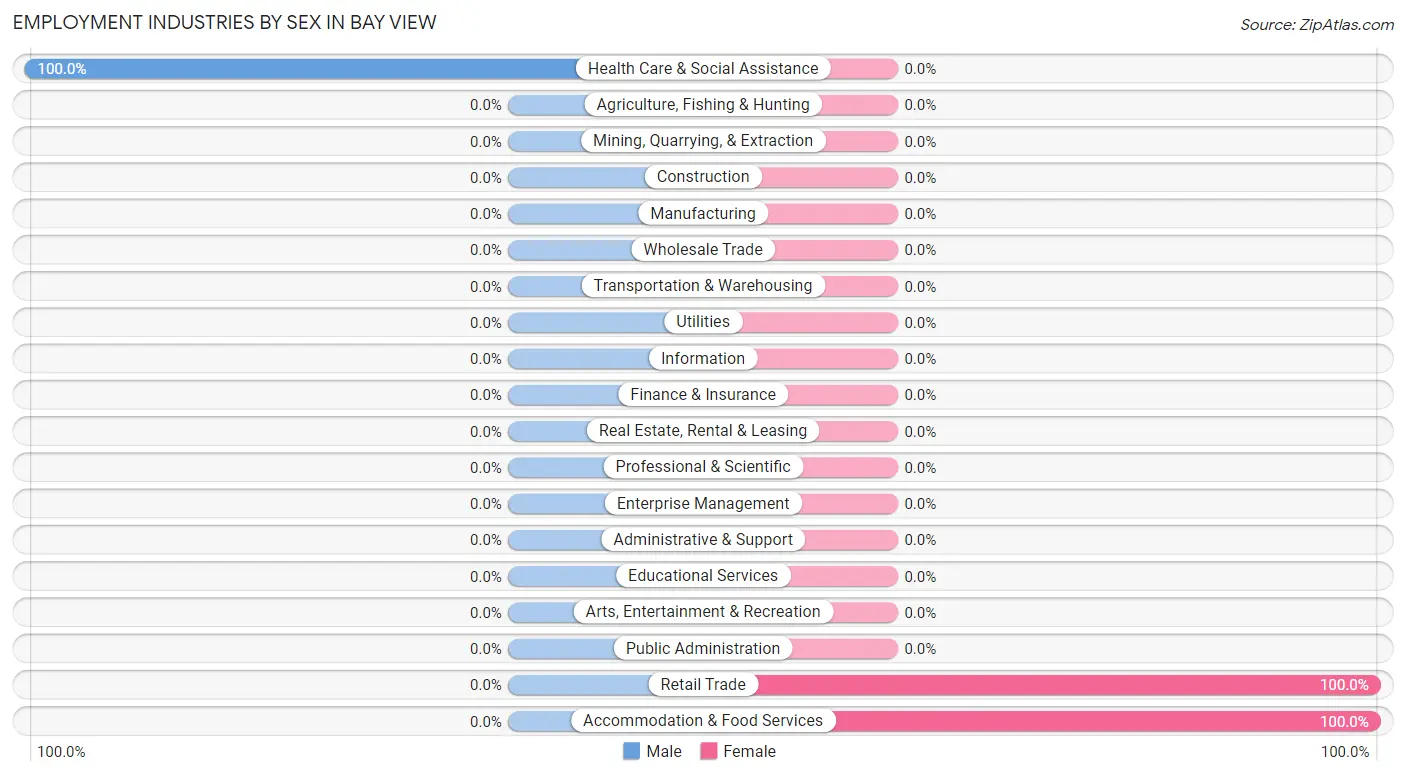
| Industry | Male | Female |
| Agriculture, Fishing & Hunting | 0 (0.0%) | 0 (0.0%) |
| Mining, Quarrying, & Extraction | 0 (0.0%) | 0 (0.0%) |
| Construction | 0 (0.0%) | 0 (0.0%) |
| Manufacturing | 0 (0.0%) | 0 (0.0%) |
| Wholesale Trade | 0 (0.0%) | 0 (0.0%) |
| Retail Trade | 0 (0.0%) | 13 (100.0%) |
| Transportation & Warehousing | 0 (0.0%) | 0 (0.0%) |
| Utilities | 0 (0.0%) | 0 (0.0%) |
| Information | 0 (0.0%) | 0 (0.0%) |
| Finance & Insurance | 0 (0.0%) | 0 (0.0%) |
| Real Estate, Rental & Leasing | 0 (0.0%) | 0 (0.0%) |
| Professional & Scientific | 0 (0.0%) | 0 (0.0%) |
| Enterprise Management | 0 (0.0%) | 0 (0.0%) |
| Administrative & Support | 0 (0.0%) | 0 (0.0%) |
| Educational Services | 0 (0.0%) | 0 (0.0%) |
| Health Care & Social Assistance | 13 (100.0%) | 0 (0.0%) |
| Arts, Entertainment & Recreation | 0 (0.0%) | 0 (0.0%) |
| Accommodation & Food Services | 0 (0.0%) | 27 (100.0%) |
| Public Administration | 0 (0.0%) | 0 (0.0%) |
| Total | 13 (24.5%) | 40 (75.5%) |
Education in Bay View
School Enrollment in Bay View
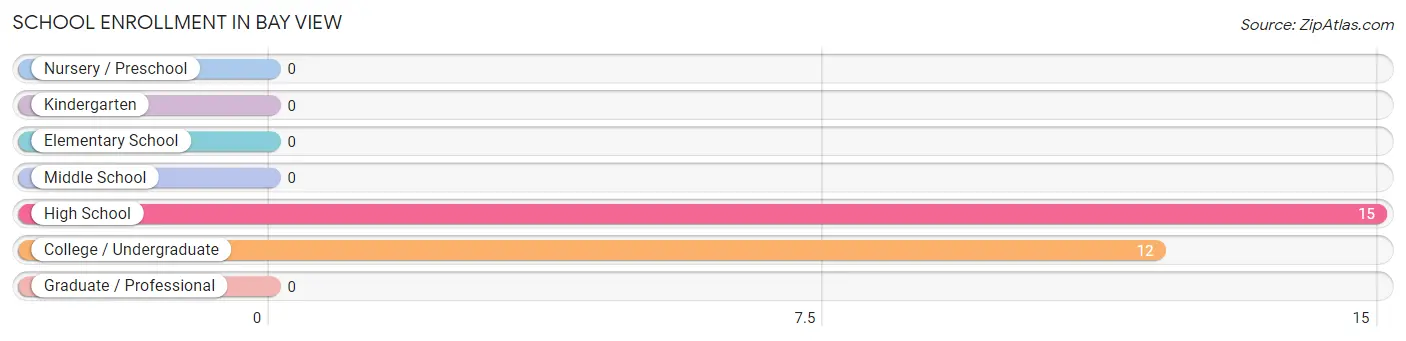
The most common levels of schooling among the 27 students in Bay View are high school (15 | 55.6%), and college / undergraduate (12 | 44.4%).
| School Level | # Students | % Students |
| Nursery / Preschool | 0 | 0.0% |
| Kindergarten | 0 | 0.0% |
| Elementary School | 0 | 0.0% |
| Middle School | 0 | 0.0% |
| High School | 15 | 55.6% |
| College / Undergraduate | 12 | 44.4% |
| Graduate / Professional | 0 | 0.0% |
| Total | 27 | 100.0% |
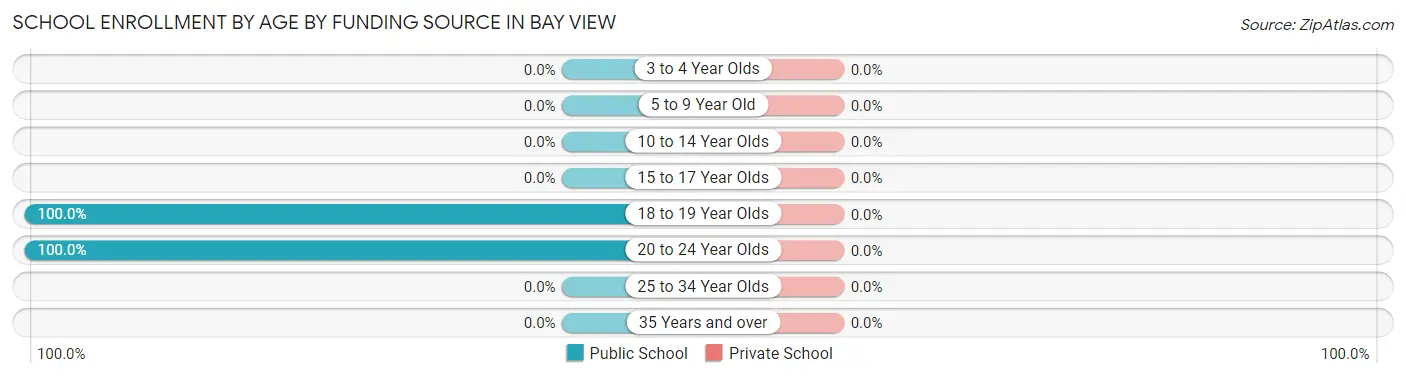
School Enrollment by Age by Funding Source in Bay View
| Age Bracket | Public School | Private School |
| 3 to 4 Year Olds | 0 (0.0%) | 0 (0.0%) |
| 5 to 9 Year Old | 0 (0.0%) | 0 (0.0%) |
| 10 to 14 Year Olds | 0 (0.0%) | 0 (0.0%) |
| 15 to 17 Year Olds | 0 (0.0%) | 0 (0.0%) |
| 18 to 19 Year Olds | 15 (100.0%) | 0 (0.0%) |
| 20 to 24 Year Olds | 12 (100.0%) | 0 (0.0%) |
| 25 to 34 Year Olds | 0 (0.0%) | 0 (0.0%) |
| 35 Years and over | 0 (0.0%) | 0 (0.0%) |
| Total | 27 (100.0%) | 0 (0.0%) |
Educational Attainment by Field of Study in Bay View
Literature & languages (25 | 33.8%), liberal arts & history (25 | 33.8%), and education (24 | 32.4%) are the most common fields of study among 74 individuals in Bay View who have obtained a bachelor's degree or higher.
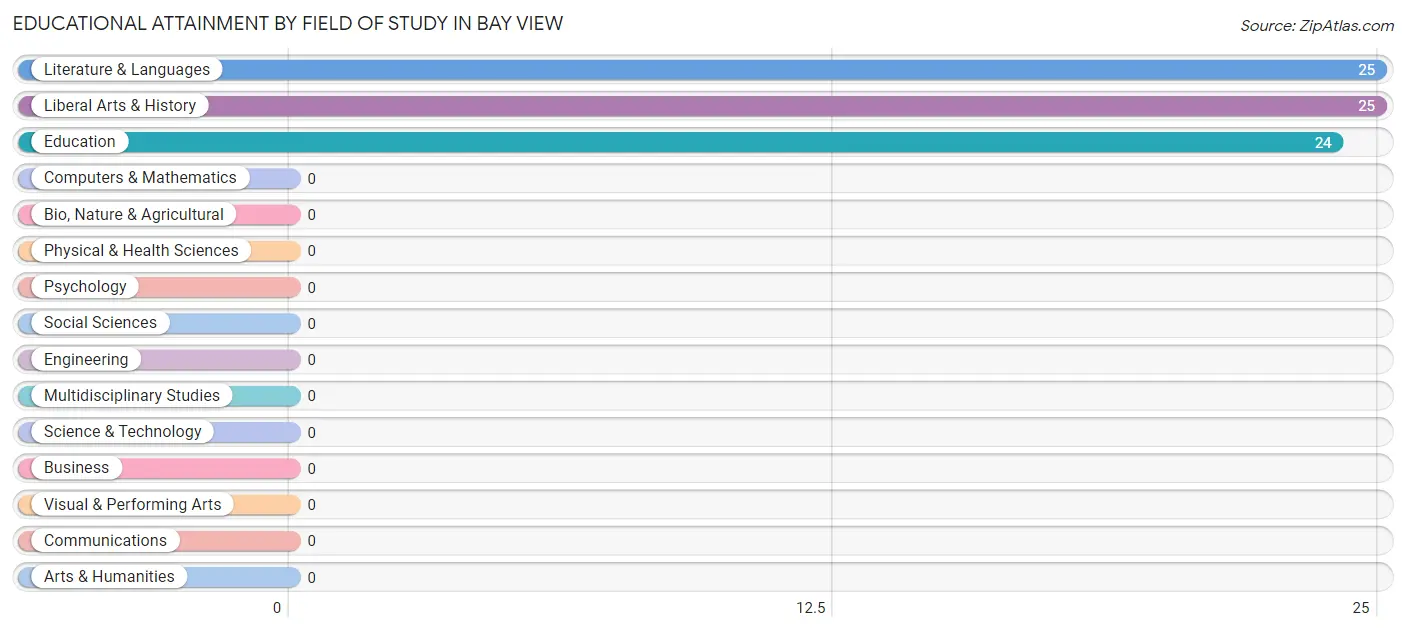
| Field of Study | # Graduates | % Graduates |
| Computers & Mathematics | 0 | 0.0% |
| Bio, Nature & Agricultural | 0 | 0.0% |
| Physical & Health Sciences | 0 | 0.0% |
| Psychology | 0 | 0.0% |
| Social Sciences | 0 | 0.0% |
| Engineering | 0 | 0.0% |
| Multidisciplinary Studies | 0 | 0.0% |
| Science & Technology | 0 | 0.0% |
| Business | 0 | 0.0% |
| Education | 24 | 32.4% |
| Literature & Languages | 25 | 33.8% |
| Liberal Arts & History | 25 | 33.8% |
| Visual & Performing Arts | 0 | 0.0% |
| Communications | 0 | 0.0% |
| Arts & Humanities | 0 | 0.0% |
| Total | 74 | 100.0% |
Transportation & Commute in Bay View
Vehicle Availability by Sex in Bay View
The most prevalent vehicle ownership categories in Bay View are males with 1 vehicle (13, accounting for 100.0%) and females with 1 vehicle (0, making up 32.5%).
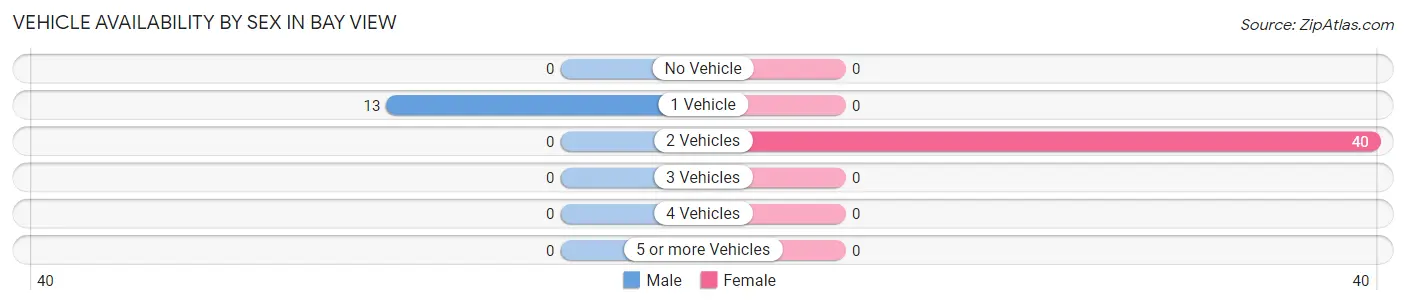
| Vehicles Available | Male | Female |
| No Vehicle | 0 (0.0%) | 0 (0.0%) |
| 1 Vehicle | 13 (100.0%) | 0 (0.0%) |
| 2 Vehicles | 0 (0.0%) | 40 (100.0%) |
| 3 Vehicles | 0 (0.0%) | 0 (0.0%) |
| 4 Vehicles | 0 (0.0%) | 0 (0.0%) |
| 5 or more Vehicles | 0 (0.0%) | 0 (0.0%) |
| Total | 13 (100.0%) | 40 (100.0%) |
Commute Time in Bay View
The most frequently occuring commute durations in Bay View are 10 to 14 minutes (26 commuters, 49.1%), 15 to 19 minutes (15 commuters, 28.3%), and 5 to 9 minutes (12 commuters, 22.6%).
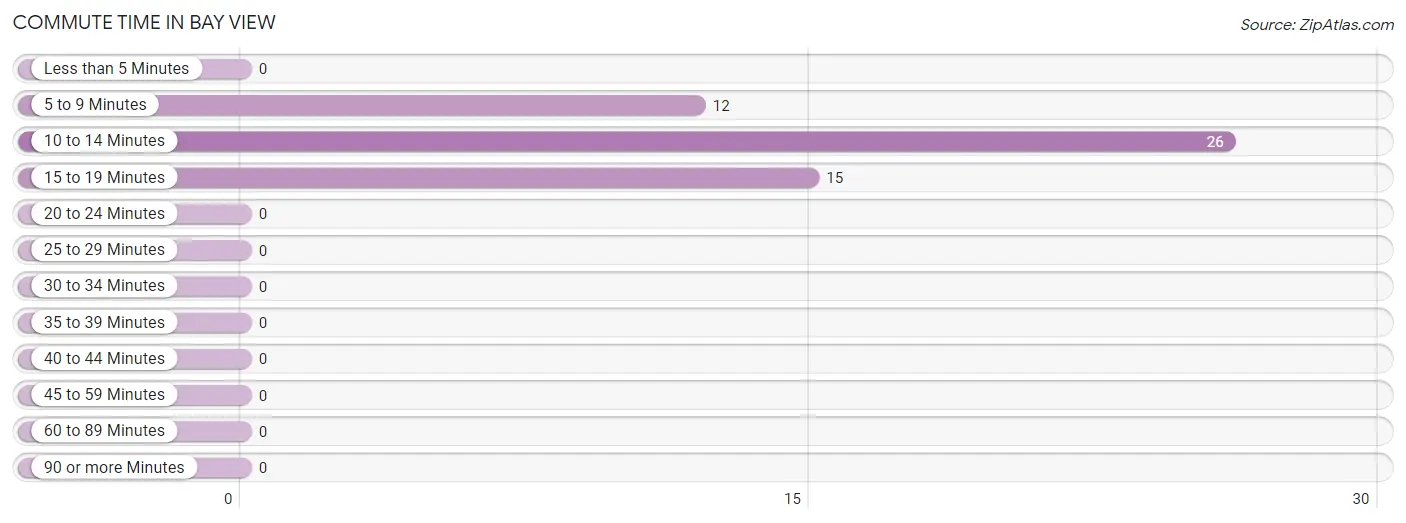
| Commute Time | # Commuters | % Commuters |
| Less than 5 Minutes | 0 | 0.0% |
| 5 to 9 Minutes | 12 | 22.6% |
| 10 to 14 Minutes | 26 | 49.1% |
| 15 to 19 Minutes | 15 | 28.3% |
| 20 to 24 Minutes | 0 | 0.0% |
| 25 to 29 Minutes | 0 | 0.0% |
| 30 to 34 Minutes | 0 | 0.0% |
| 35 to 39 Minutes | 0 | 0.0% |
| 40 to 44 Minutes | 0 | 0.0% |
| 45 to 59 Minutes | 0 | 0.0% |
| 60 to 89 Minutes | 0 | 0.0% |
| 90 or more Minutes | 0 | 0.0% |
Commute Time by Sex in Bay View
The most common commute times in Bay View are 10 to 14 minutes (13 commuters, 100.0%) for males and 15 to 19 minutes (15 commuters, 37.5%) for females.
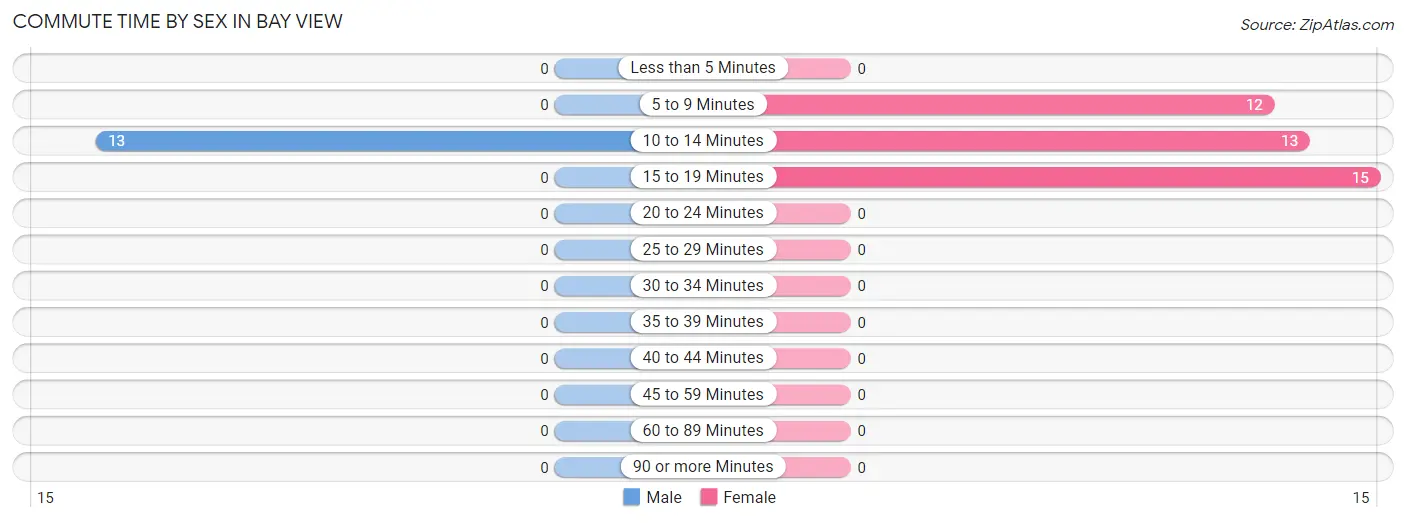
| Commute Time | Male | Female |
| Less than 5 Minutes | 0 (0.0%) | 0 (0.0%) |
| 5 to 9 Minutes | 0 (0.0%) | 12 (30.0%) |
| 10 to 14 Minutes | 13 (100.0%) | 13 (32.5%) |
| 15 to 19 Minutes | 0 (0.0%) | 15 (37.5%) |
| 20 to 24 Minutes | 0 (0.0%) | 0 (0.0%) |
| 25 to 29 Minutes | 0 (0.0%) | 0 (0.0%) |
| 30 to 34 Minutes | 0 (0.0%) | 0 (0.0%) |
| 35 to 39 Minutes | 0 (0.0%) | 0 (0.0%) |
| 40 to 44 Minutes | 0 (0.0%) | 0 (0.0%) |
| 45 to 59 Minutes | 0 (0.0%) | 0 (0.0%) |
| 60 to 89 Minutes | 0 (0.0%) | 0 (0.0%) |
| 90 or more Minutes | 0 (0.0%) | 0 (0.0%) |
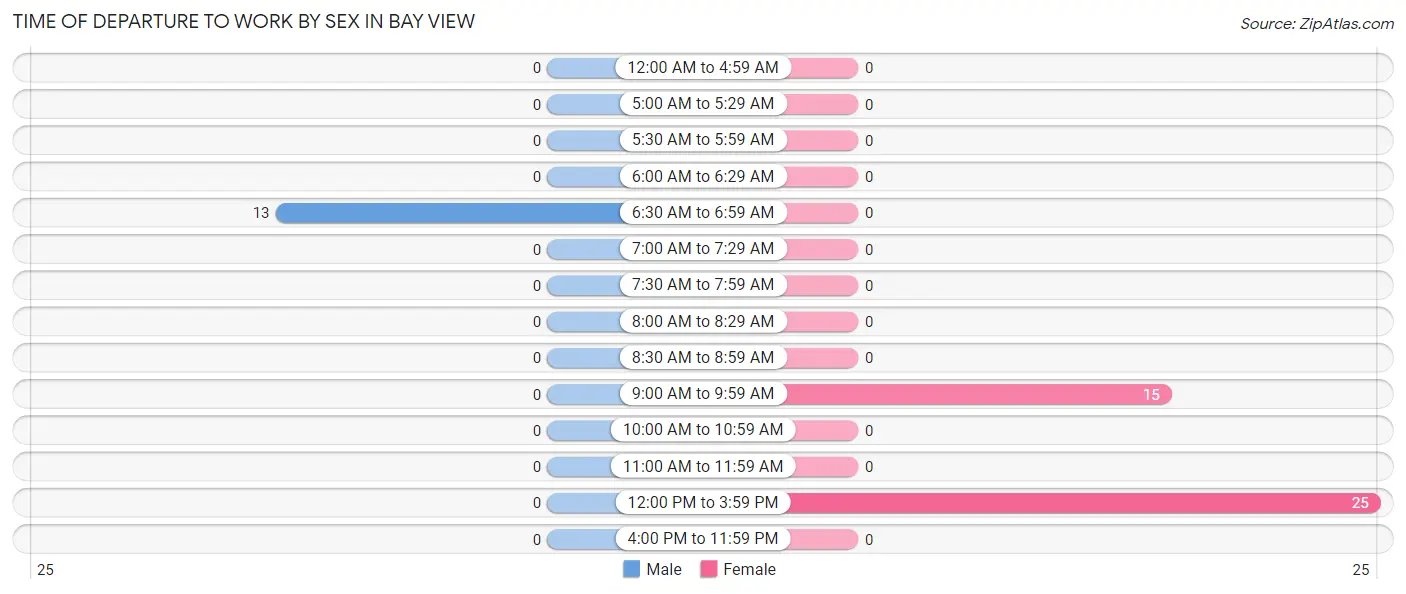
Time of Departure to Work by Sex in Bay View
The most frequent times of departure to work in Bay View are 6:30 AM to 6:59 AM (13, 100.0%) for males and 12:00 PM to 3:59 PM (25, 62.5%) for females.
| Time of Departure | Male | Female |
| 12:00 AM to 4:59 AM | 0 (0.0%) | 0 (0.0%) |
| 5:00 AM to 5:29 AM | 0 (0.0%) | 0 (0.0%) |
| 5:30 AM to 5:59 AM | 0 (0.0%) | 0 (0.0%) |
| 6:00 AM to 6:29 AM | 0 (0.0%) | 0 (0.0%) |
| 6:30 AM to 6:59 AM | 13 (100.0%) | 0 (0.0%) |
| 7:00 AM to 7:29 AM | 0 (0.0%) | 0 (0.0%) |
| 7:30 AM to 7:59 AM | 0 (0.0%) | 0 (0.0%) |
| 8:00 AM to 8:29 AM | 0 (0.0%) | 0 (0.0%) |
| 8:30 AM to 8:59 AM | 0 (0.0%) | 0 (0.0%) |
| 9:00 AM to 9:59 AM | 0 (0.0%) | 15 (37.5%) |
| 10:00 AM to 10:59 AM | 0 (0.0%) | 0 (0.0%) |
| 11:00 AM to 11:59 AM | 0 (0.0%) | 0 (0.0%) |
| 12:00 PM to 3:59 PM | 0 (0.0%) | 25 (62.5%) |
| 4:00 PM to 11:59 PM | 0 (0.0%) | 0 (0.0%) |
| Total | 13 (100.0%) | 40 (100.0%) |
Housing Occupancy in Bay View
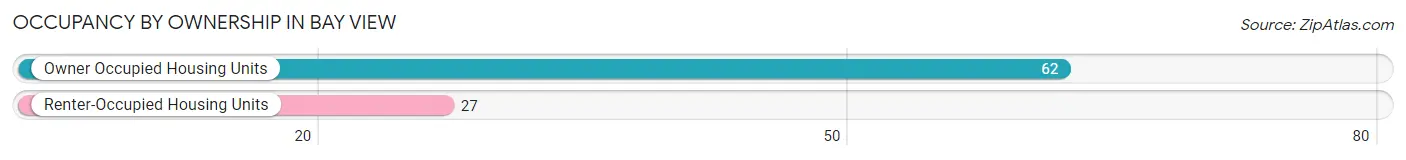
Occupancy by Ownership in Bay View
Of the total 89 dwellings in Bay View, owner-occupied units account for 62 (69.7%), while renter-occupied units make up 27 (30.3%).
| Occupancy | # Housing Units | % Housing Units |
| Owner Occupied Housing Units | 62 | 69.7% |
| Renter-Occupied Housing Units | 27 | 30.3% |
| Total Occupied Housing Units | 89 | 100.0% |
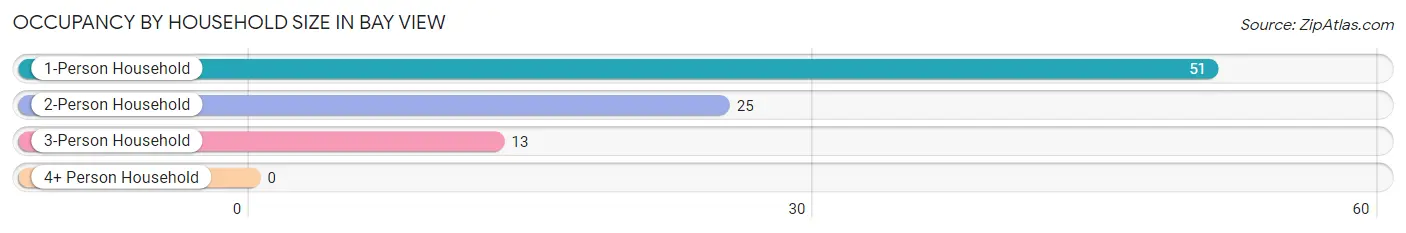
Occupancy by Household Size in Bay View
| Household Size | # Housing Units | % Housing Units |
| 1-Person Household | 51 | 57.3% |
| 2-Person Household | 25 | 28.1% |
| 3-Person Household | 13 | 14.6% |
| 4+ Person Household | 0 | 0.0% |
| Total Housing Units | 89 | 100.0% |
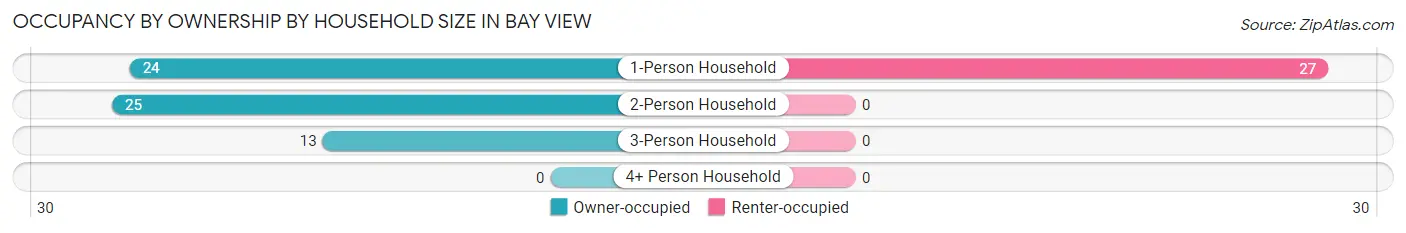
Occupancy by Ownership by Household Size in Bay View
| Household Size | Owner-occupied | Renter-occupied |
| 1-Person Household | 24 (47.1%) | 27 (52.9%) |
| 2-Person Household | 25 (100.0%) | 0 (0.0%) |
| 3-Person Household | 13 (100.0%) | 0 (0.0%) |
| 4+ Person Household | 0 (0.0%) | 0 (0.0%) |
| Total Housing Units | 62 (69.7%) | 27 (30.3%) |
Occupancy by Educational Attainment in Bay View
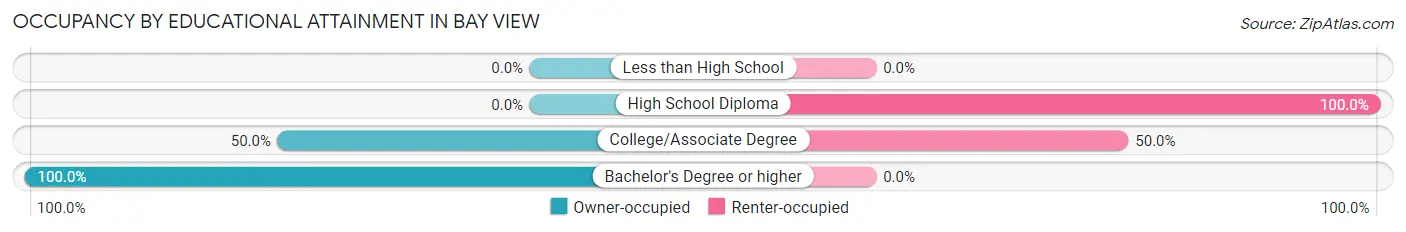
| Household Size | Owner-occupied | Renter-occupied |
| Less than High School | 0 (0.0%) | 0 (0.0%) |
| High School Diploma | 0 (0.0%) | 14 (100.0%) |
| College/Associate Degree | 13 (50.0%) | 13 (50.0%) |
| Bachelor's Degree or higher | 49 (100.0%) | 0 (0.0%) |
Occupancy by Age of Householder in Bay View
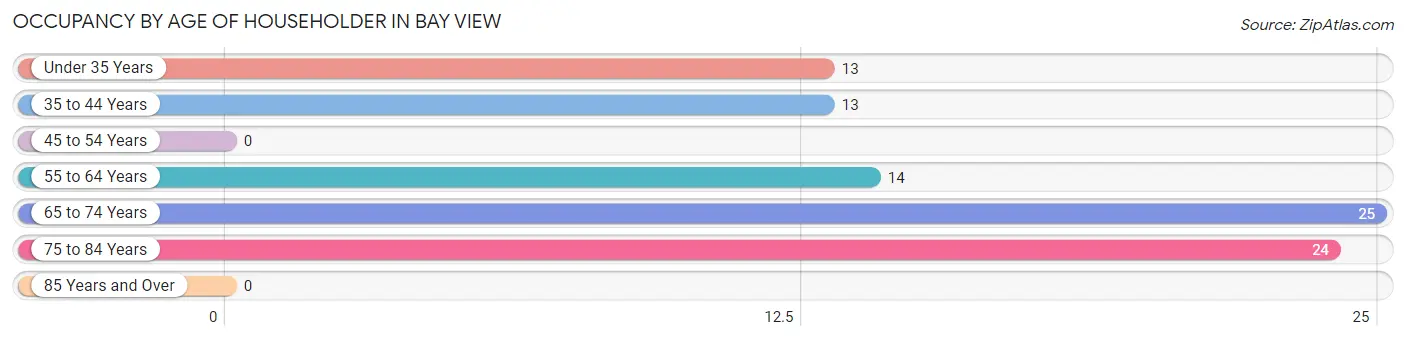
| Age Bracket | # Households | % Households |
| Under 35 Years | 13 | 14.6% |
| 35 to 44 Years | 13 | 14.6% |
| 45 to 54 Years | 0 | 0.0% |
| 55 to 64 Years | 14 | 15.7% |
| 65 to 74 Years | 25 | 28.1% |
| 75 to 84 Years | 24 | 27.0% |
| 85 Years and Over | 0 | 0.0% |
| Total | 89 | 100.0% |
Housing Finances in Bay View
Median Income by Occupancy in Bay View
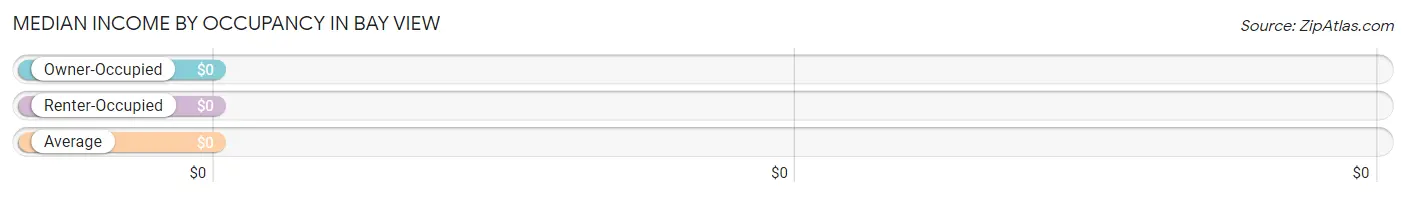
| Occupancy Type | # Households | Median Income |
| Owner-Occupied | 62 (69.7%) | $0 |
| Renter-Occupied | 27 (30.3%) | $0 |
| Average | 89 (100.0%) | $0 |
Occupancy by Householder Income Bracket in Bay View

| Income Bracket | Owner-occupied | Renter-occupied |
| Less than $5,000 | 0 (0.0%) | 0 (0.0%) |
| $5,000 to $9,999 | 0 (0.0%) | 0 (0.0%) |
| $10,000 to $14,999 | 0 (0.0%) | 14 (51.8%) |
| $15,000 to $19,999 | 0 (0.0%) | 0 (0.0%) |
| $20,000 to $24,999 | 0 (0.0%) | 0 (0.0%) |
| $25,000 to $34,999 | 37 (59.7%) | 0 (0.0%) |
| $35,000 to $49,999 | 0 (0.0%) | 0 (0.0%) |
| $50,000 to $74,999 | 0 (0.0%) | 13 (48.1%) |
| $75,000 to $99,999 | 0 (0.0%) | 0 (0.0%) |
| $100,000 to $149,999 | 0 (0.0%) | 0 (0.0%) |
| $150,000 or more | 25 (40.3%) | 0 (0.0%) |
| Total | 62 (100.0%) | 27 (100.0%) |
Monthly Housing Cost Tiers in Bay View
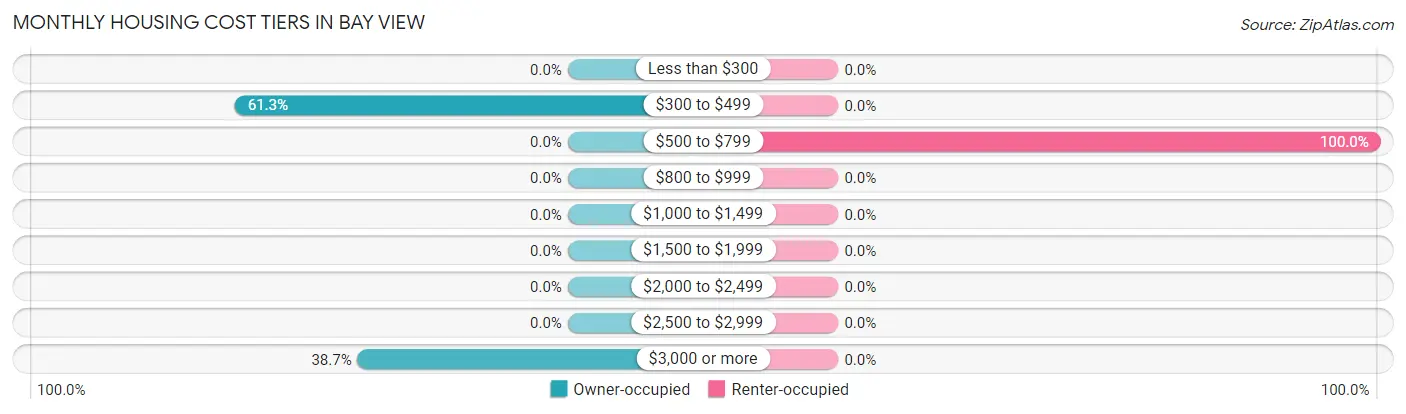
| Monthly Cost | Owner-occupied | Renter-occupied |
| Less than $300 | 0 (0.0%) | 0 (0.0%) |
| $300 to $499 | 38 (61.3%) | 0 (0.0%) |
| $500 to $799 | 0 (0.0%) | 27 (100.0%) |
| $800 to $999 | 0 (0.0%) | 0 (0.0%) |
| $1,000 to $1,499 | 0 (0.0%) | 0 (0.0%) |
| $1,500 to $1,999 | 0 (0.0%) | 0 (0.0%) |
| $2,000 to $2,499 | 0 (0.0%) | 0 (0.0%) |
| $2,500 to $2,999 | 0 (0.0%) | 0 (0.0%) |
| $3,000 or more | 24 (38.7%) | 0 (0.0%) |
| Total | 62 (100.0%) | 27 (100.0%) |
Physical Housing Characteristics in Bay View
Housing Structures in Bay View
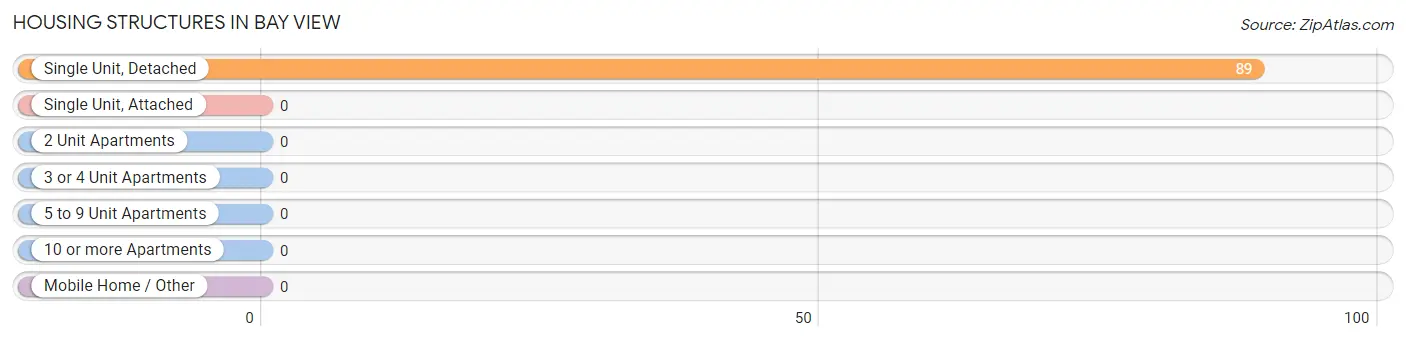
| Structure Type | # Housing Units | % Housing Units |
| Single Unit, Detached | 89 | 100.0% |
| Single Unit, Attached | 0 | 0.0% |
| 2 Unit Apartments | 0 | 0.0% |
| 3 or 4 Unit Apartments | 0 | 0.0% |
| 5 to 9 Unit Apartments | 0 | 0.0% |
| 10 or more Apartments | 0 | 0.0% |
| Mobile Home / Other | 0 | 0.0% |
| Total | 89 | 100.0% |
Housing Structures by Occupancy in Bay View
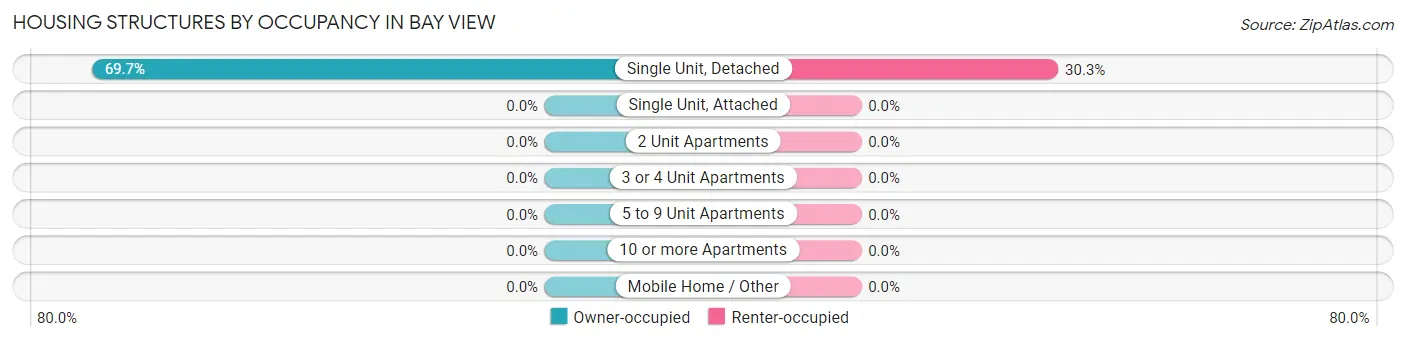
| Structure Type | Owner-occupied | Renter-occupied |
| Single Unit, Detached | 62 (69.7%) | 27 (30.3%) |
| Single Unit, Attached | 0 (0.0%) | 0 (0.0%) |
| 2 Unit Apartments | 0 (0.0%) | 0 (0.0%) |
| 3 or 4 Unit Apartments | 0 (0.0%) | 0 (0.0%) |
| 5 to 9 Unit Apartments | 0 (0.0%) | 0 (0.0%) |
| 10 or more Apartments | 0 (0.0%) | 0 (0.0%) |
| Mobile Home / Other | 0 (0.0%) | 0 (0.0%) |
| Total | 62 (69.7%) | 27 (30.3%) |
Housing Structures by Number of Rooms in Bay View
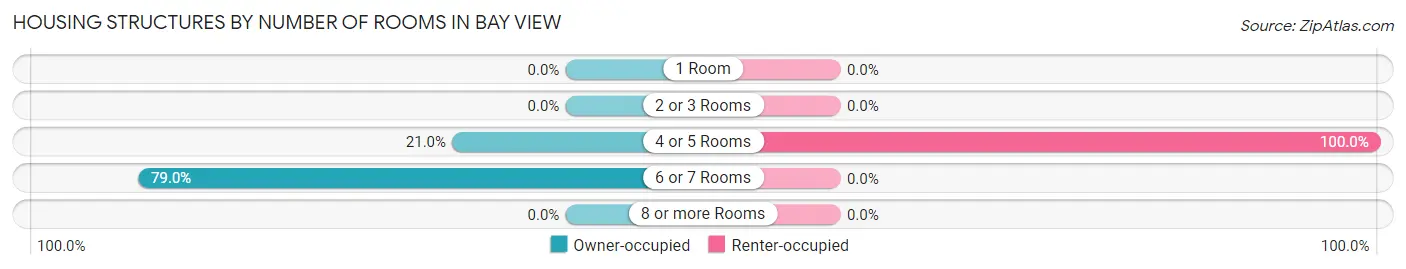
| Number of Rooms | Owner-occupied | Renter-occupied |
| 1 Room | 0 (0.0%) | 0 (0.0%) |
| 2 or 3 Rooms | 0 (0.0%) | 0 (0.0%) |
| 4 or 5 Rooms | 13 (21.0%) | 27 (100.0%) |
| 6 or 7 Rooms | 49 (79.0%) | 0 (0.0%) |
| 8 or more Rooms | 0 (0.0%) | 0 (0.0%) |
| Total | 62 (100.0%) | 27 (100.0%) |
Housing Structure by Heating Type in Bay View
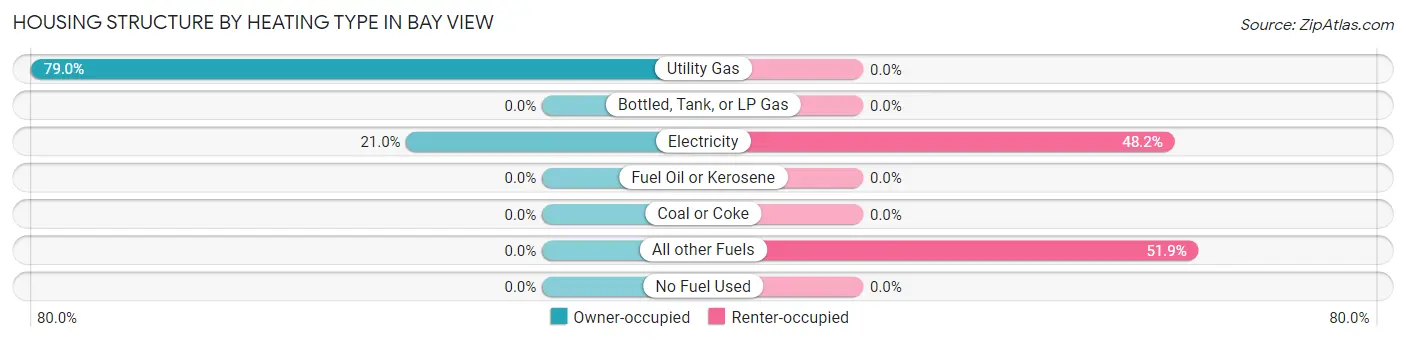
| Heating Type | Owner-occupied | Renter-occupied |
| Utility Gas | 49 (79.0%) | 0 (0.0%) |
| Bottled, Tank, or LP Gas | 0 (0.0%) | 0 (0.0%) |
| Electricity | 13 (21.0%) | 13 (48.1%) |
| Fuel Oil or Kerosene | 0 (0.0%) | 0 (0.0%) |
| Coal or Coke | 0 (0.0%) | 0 (0.0%) |
| All other Fuels | 0 (0.0%) | 14 (51.8%) |
| No Fuel Used | 0 (0.0%) | 0 (0.0%) |
| Total | 62 (100.0%) | 27 (100.0%) |
Household Vehicle Usage in Bay View
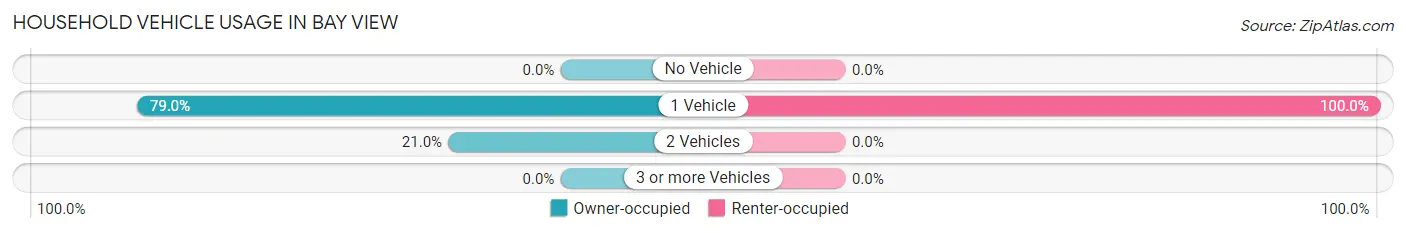
| Vehicles per Household | Owner-occupied | Renter-occupied |
| No Vehicle | 0 (0.0%) | 0 (0.0%) |
| 1 Vehicle | 49 (79.0%) | 27 (100.0%) |
| 2 Vehicles | 13 (21.0%) | 0 (0.0%) |
| 3 or more Vehicles | 0 (0.0%) | 0 (0.0%) |
| Total | 62 (100.0%) | 27 (100.0%) |
Real Estate & Mortgages in Bay View
Real Estate and Mortgage Overview in Bay View
| Characteristic | Without Mortgage | With Mortgage |
| Housing Units | 38 | 24 |
| Median Property Value | - | - |
| Median Household Income | - | - |
| Monthly Housing Costs | - | - |
| Real Estate Taxes | - | - |
Property Value by Mortgage Status in Bay View
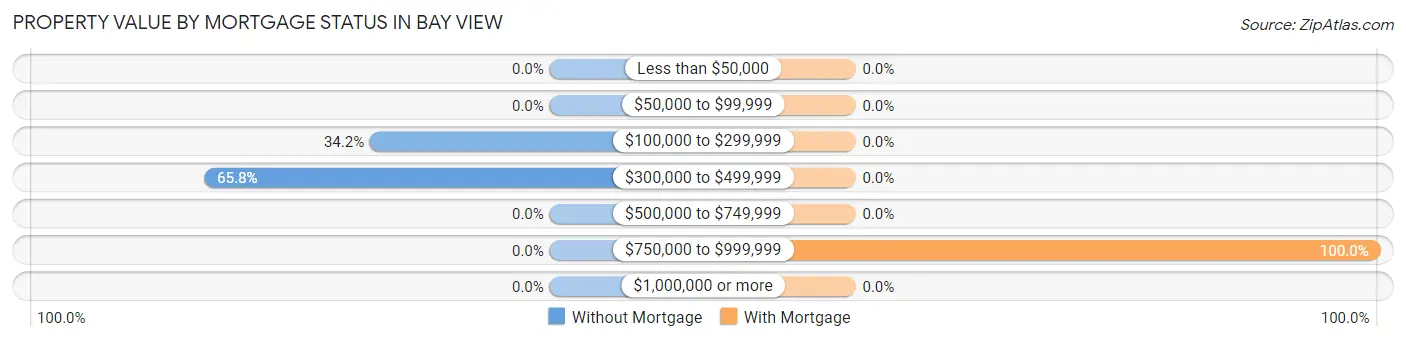
| Property Value | Without Mortgage | With Mortgage |
| Less than $50,000 | 0 (0.0%) | 0 (0.0%) |
| $50,000 to $99,999 | 0 (0.0%) | 0 (0.0%) |
| $100,000 to $299,999 | 13 (34.2%) | 0 (0.0%) |
| $300,000 to $499,999 | 25 (65.8%) | 0 (0.0%) |
| $500,000 to $749,999 | 0 (0.0%) | 0 (0.0%) |
| $750,000 to $999,999 | 0 (0.0%) | 24 (100.0%) |
| $1,000,000 or more | 0 (0.0%) | 0 (0.0%) |
| Total | 38 (100.0%) | 24 (100.0%) |
Household Income by Mortgage Status in Bay View
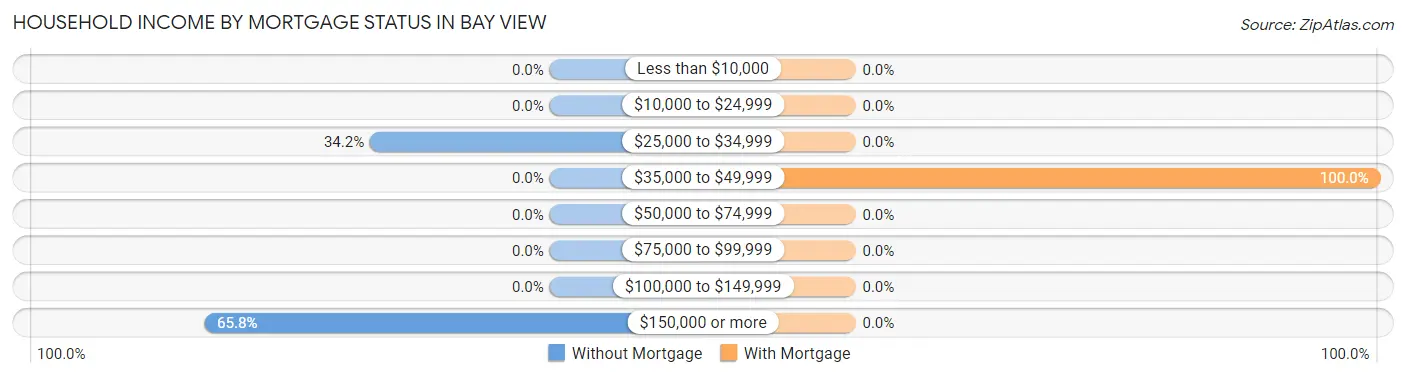
| Household Income | Without Mortgage | With Mortgage |
| Less than $10,000 | 0 (0.0%) | 0 (0.0%) |
| $10,000 to $24,999 | 0 (0.0%) | 0 (0.0%) |
| $25,000 to $34,999 | 13 (34.2%) | 0 (0.0%) |
| $35,000 to $49,999 | 0 (0.0%) | 24 (100.0%) |
| $50,000 to $74,999 | 0 (0.0%) | 0 (0.0%) |
| $75,000 to $99,999 | 0 (0.0%) | 0 (0.0%) |
| $100,000 to $149,999 | 0 (0.0%) | 0 (0.0%) |
| $150,000 or more | 25 (65.8%) | 0 (0.0%) |
| Total | 38 (100.0%) | 24 (100.0%) |
Property Value to Household Income Ratio in Bay View
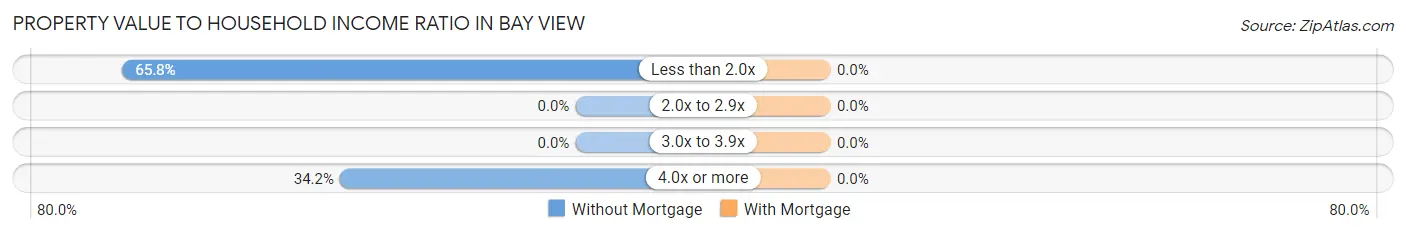
| Value-to-Income Ratio | Without Mortgage | With Mortgage |
| Less than 2.0x | 25 (65.8%) | 0 (0.0%) |
| 2.0x to 2.9x | 0 (0.0%) | 0 (0.0%) |
| 3.0x to 3.9x | 0 (0.0%) | 0 (0.0%) |
| 4.0x or more | 13 (34.2%) | 0 (0.0%) |
| Total | 38 (100.0%) | 24 (100.0%) |
Real Estate Taxes by Mortgage Status in Bay View
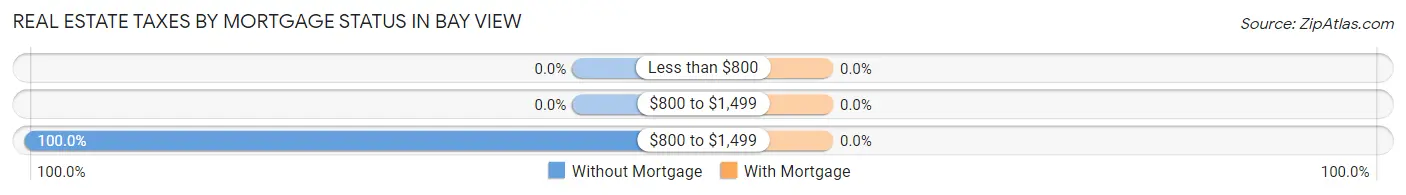
| Property Taxes | Without Mortgage | With Mortgage |
| Less than $800 | 0 (0.0%) | 0 (0.0%) |
| $800 to $1,499 | 0 (0.0%) | 0 (0.0%) |
| $800 to $1,499 | 38 (100.0%) | 0 (0.0%) |
| Total | 38 (100.0%) | 24 (100.0%) |
Health & Disability in Bay View
Health Insurance Coverage by Age in Bay View
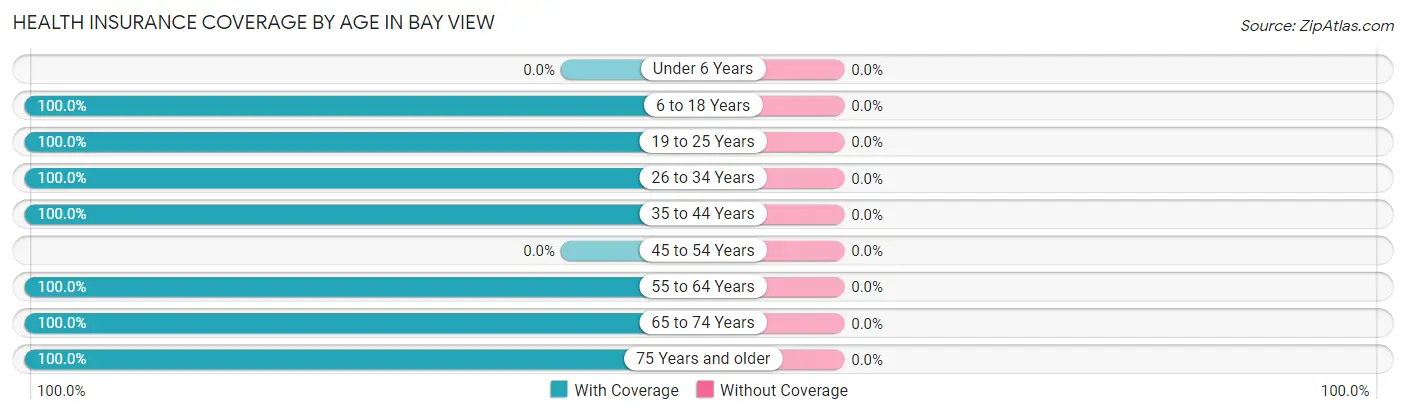
| Age Bracket | With Coverage | Without Coverage |
| Under 6 Years | 0 (0.0%) | 0 (0.0%) |
| 6 to 18 Years | 15 (100.0%) | 0 (0.0%) |
| 19 to 25 Years | 12 (100.0%) | 0 (0.0%) |
| 26 to 34 Years | 13 (100.0%) | 0 (0.0%) |
| 35 to 44 Years | 13 (100.0%) | 0 (0.0%) |
| 45 to 54 Years | 0 (0.0%) | 0 (0.0%) |
| 55 to 64 Years | 14 (100.0%) | 0 (0.0%) |
| 65 to 74 Years | 50 (100.0%) | 0 (0.0%) |
| 75 Years and older | 24 (100.0%) | 0 (0.0%) |
| Total | 141 (100.0%) | 0 (0.0%) |
Health Insurance Coverage by Citizenship Status in Bay View
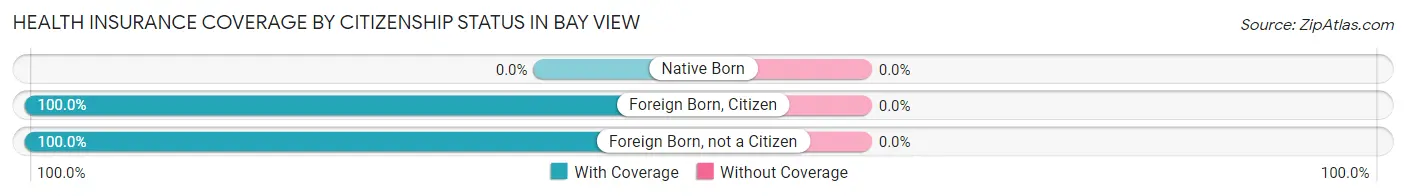
| Citizenship Status | With Coverage | Without Coverage |
| Native Born | 0 (0.0%) | 0 (0.0%) |
| Foreign Born, Citizen | 15 (100.0%) | 0 (0.0%) |
| Foreign Born, not a Citizen | 12 (100.0%) | 0 (0.0%) |
Health Insurance Coverage by Household Income in Bay View
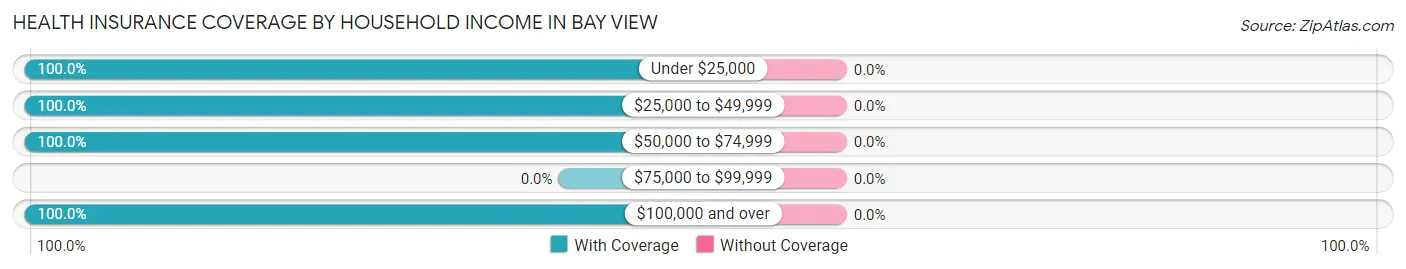
| Household Income | With Coverage | Without Coverage |
| Under $25,000 | 14 (100.0%) | 0 (0.0%) |
| $25,000 to $49,999 | 64 (100.0%) | 0 (0.0%) |
| $50,000 to $74,999 | 13 (100.0%) | 0 (0.0%) |
| $75,000 to $99,999 | 0 (0.0%) | 0 (0.0%) |
| $100,000 and over | 50 (100.0%) | 0 (0.0%) |
Public vs Private Health Insurance Coverage by Age in Bay View
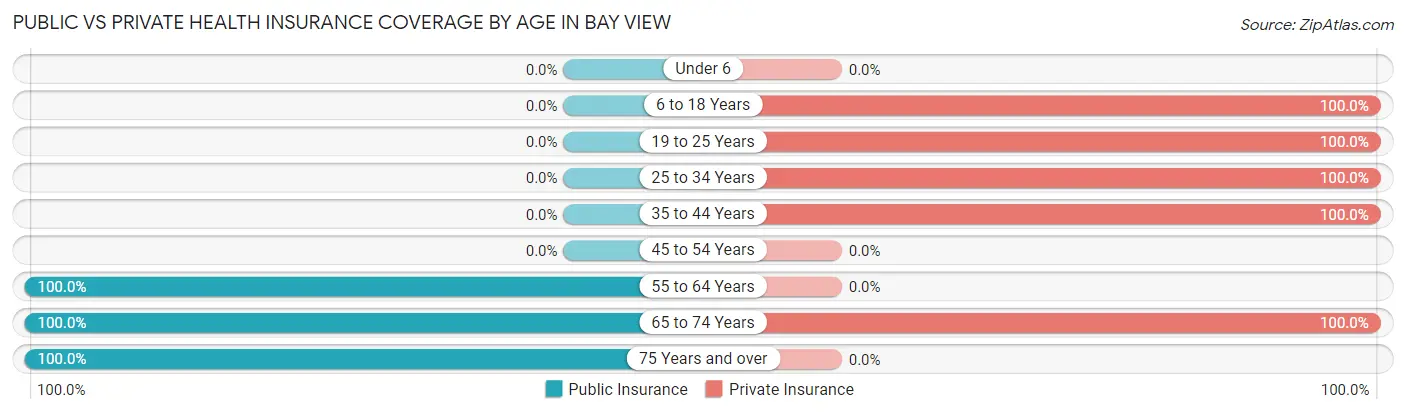
| Age Bracket | Public Insurance | Private Insurance |
| Under 6 | 0 (0.0%) | 0 (0.0%) |
| 6 to 18 Years | 0 (0.0%) | 15 (100.0%) |
| 19 to 25 Years | 0 (0.0%) | 12 (100.0%) |
| 25 to 34 Years | 0 (0.0%) | 13 (100.0%) |
| 35 to 44 Years | 0 (0.0%) | 13 (100.0%) |
| 45 to 54 Years | 0 (0.0%) | 0 (0.0%) |
| 55 to 64 Years | 14 (100.0%) | 0 (0.0%) |
| 65 to 74 Years | 50 (100.0%) | 50 (100.0%) |
| 75 Years and over | 24 (100.0%) | 0 (0.0%) |
| Total | 88 (62.4%) | 103 (73.1%) |
Disability Status by Sex by Age in Bay View
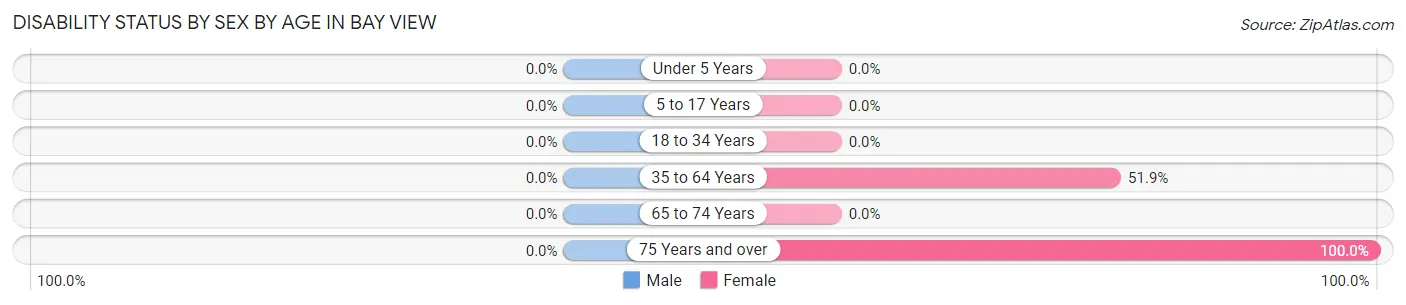
| Age Bracket | Male | Female |
| Under 5 Years | 0 (0.0%) | 0 (0.0%) |
| 5 to 17 Years | 0 (0.0%) | 0 (0.0%) |
| 18 to 34 Years | 0 (0.0%) | 0 (0.0%) |
| 35 to 64 Years | 0 (0.0%) | 14 (51.8%) |
| 65 to 74 Years | 0 (0.0%) | 0 (0.0%) |
| 75 Years and over | 0 (0.0%) | 24 (100.0%) |
Disability Class by Sex by Age in Bay View
Disability Class: Hearing Difficulty
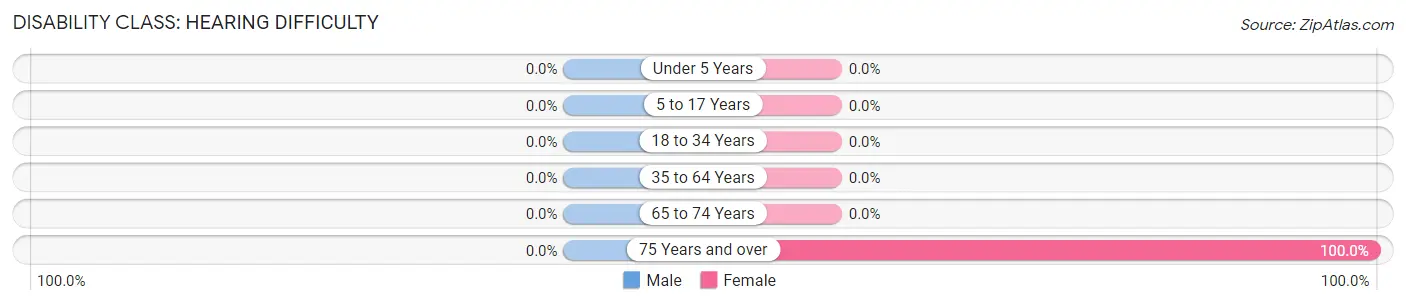
| Age Bracket | Male | Female |
| Under 5 Years | 0 (0.0%) | 0 (0.0%) |
| 5 to 17 Years | 0 (0.0%) | 0 (0.0%) |
| 18 to 34 Years | 0 (0.0%) | 0 (0.0%) |
| 35 to 64 Years | 0 (0.0%) | 0 (0.0%) |
| 65 to 74 Years | 0 (0.0%) | 0 (0.0%) |
| 75 Years and over | 0 (0.0%) | 24 (100.0%) |
Disability Class: Vision Difficulty
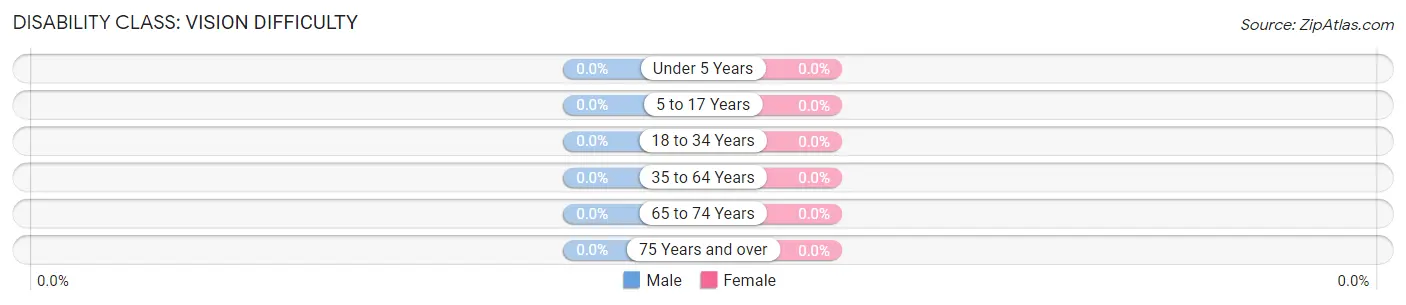
| Age Bracket | Male | Female |
| Under 5 Years | 0 (0.0%) | 0 (0.0%) |
| 5 to 17 Years | 0 (0.0%) | 0 (0.0%) |
| 18 to 34 Years | 0 (0.0%) | 0 (0.0%) |
| 35 to 64 Years | 0 (0.0%) | 0 (0.0%) |
| 65 to 74 Years | 0 (0.0%) | 0 (0.0%) |
| 75 Years and over | 0 (0.0%) | 0 (0.0%) |
Disability Class: Cognitive Difficulty
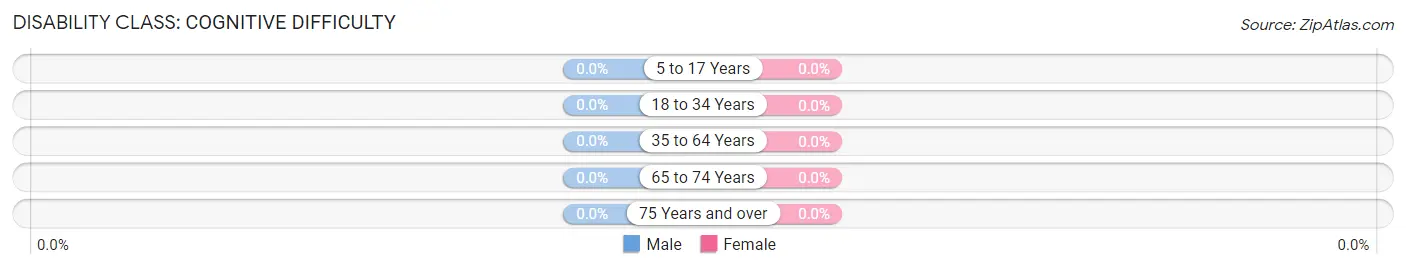
| Age Bracket | Male | Female |
| 5 to 17 Years | 0 (0.0%) | 0 (0.0%) |
| 18 to 34 Years | 0 (0.0%) | 0 (0.0%) |
| 35 to 64 Years | 0 (0.0%) | 0 (0.0%) |
| 65 to 74 Years | 0 (0.0%) | 0 (0.0%) |
| 75 Years and over | 0 (0.0%) | 0 (0.0%) |
Disability Class: Ambulatory Difficulty
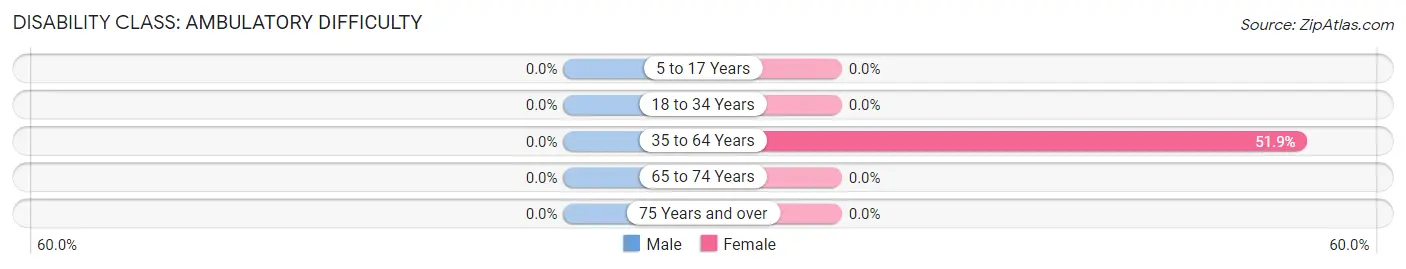
| Age Bracket | Male | Female |
| 5 to 17 Years | 0 (0.0%) | 0 (0.0%) |
| 18 to 34 Years | 0 (0.0%) | 0 (0.0%) |
| 35 to 64 Years | 0 (0.0%) | 14 (51.8%) |
| 65 to 74 Years | 0 (0.0%) | 0 (0.0%) |
| 75 Years and over | 0 (0.0%) | 0 (0.0%) |
Disability Class: Self-Care Difficulty
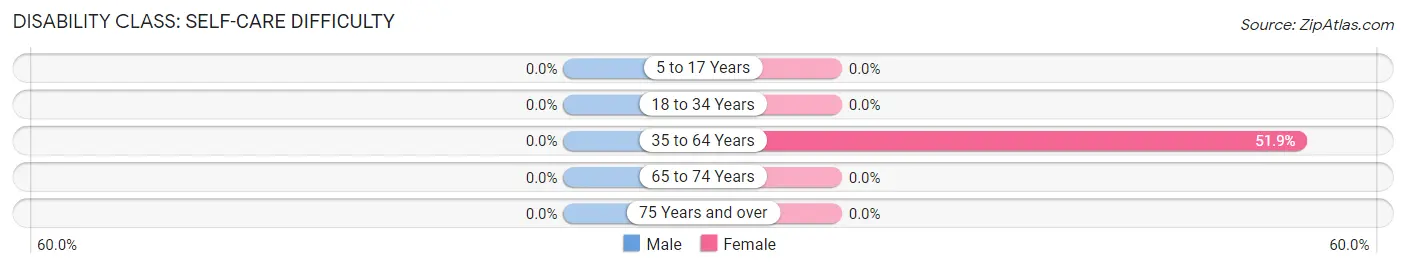
| Age Bracket | Male | Female |
| 5 to 17 Years | 0 (0.0%) | 0 (0.0%) |
| 18 to 34 Years | 0 (0.0%) | 0 (0.0%) |
| 35 to 64 Years | 0 (0.0%) | 14 (51.8%) |
| 65 to 74 Years | 0 (0.0%) | 0 (0.0%) |
| 75 Years and over | 0 (0.0%) | 0 (0.0%) |
Technology Access in Bay View
Computing Device Access in Bay View
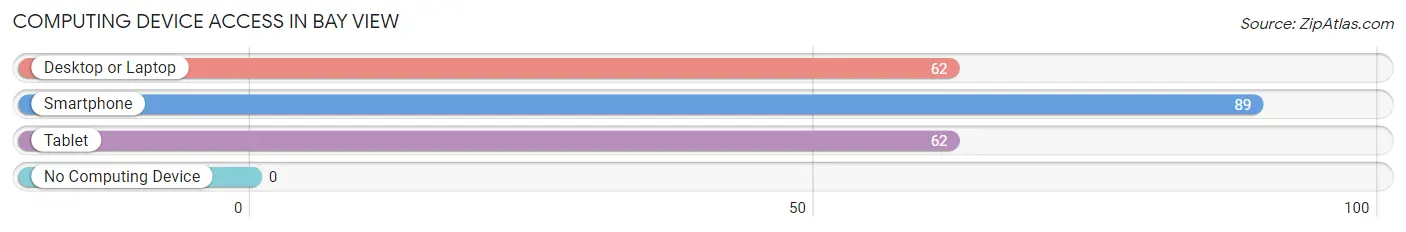
| Device Type | # Households | % Households |
| Desktop or Laptop | 62 | 69.7% |
| Smartphone | 89 | 100.0% |
| Tablet | 62 | 69.7% |
| No Computing Device | 0 | 0.0% |
| Total | 89 | 100.0% |
Internet Access in Bay View
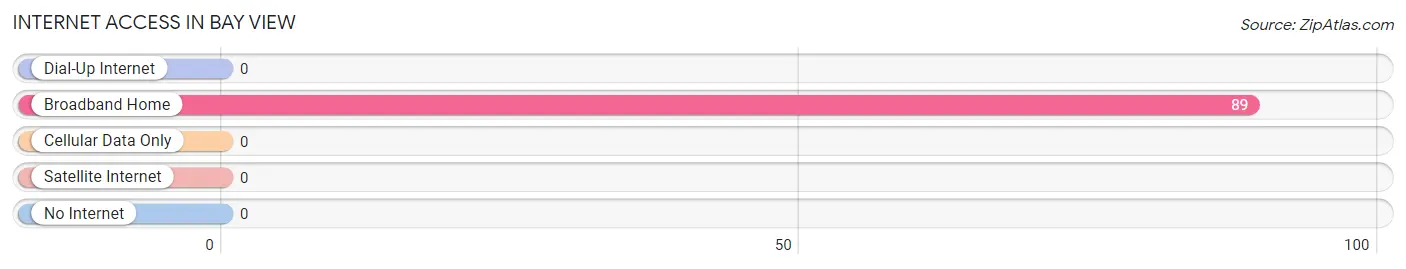
| Internet Type | # Households | % Households |
| Dial-Up Internet | 0 | 0.0% |
| Broadband Home | 89 | 100.0% |
| Cellular Data Only | 0 | 0.0% |
| Satellite Internet | 0 | 0.0% |
| No Internet | 0 | 0.0% |
| Total | 89 | 100.0% |
Bay View Summary
Bay View, Michigan is a small village located in the northern part of the state, just south of the city of Petoskey. It is situated on the shores of Little Traverse Bay, a part of Lake Michigan. The village is home to a population of just over 1,000 people, and is a popular tourist destination due to its proximity to the lake and its many outdoor activities.
History
The area that is now Bay View was first settled in the late 1800s by a group of settlers from Ohio. The settlers were attracted to the area due to its natural beauty and the abundance of fish and game in the area. The village was officially incorporated in 1891 and was named after the bay that it overlooks.
In the early 1900s, Bay View became a popular summer destination for wealthy families from Detroit and Chicago. The village was home to several large resorts, including the Bay View Hotel, which was built in 1906. The hotel was a popular destination for wealthy families who wanted to escape the hustle and bustle of the city.
In the 1950s, Bay View began to decline in popularity as a tourist destination. The resorts closed and the population began to decline. However, in the late 1970s, the village began to experience a resurgence in popularity as a tourist destination. The village was designated as a National Historic Landmark in 1979, and the Bay View Association was formed to preserve the village’s historic character.
Geography
Bay View is located in the northern part of Michigan, just south of the city of Petoskey. It is situated on the shores of Little Traverse Bay, a part of Lake Michigan. The village is surrounded by rolling hills and forests, and is home to several small lakes and streams.
The climate in Bay View is typical of the northern part of the state, with cold winters and warm summers. The average temperature in the winter is around 20 degrees Fahrenheit, and the average temperature in the summer is around 70 degrees Fahrenheit.
Economy
The economy of Bay View is largely based on tourism. The village is home to several resorts and hotels, as well as a variety of restaurants and shops. The village also has a marina, which is popular with boaters and fishermen.
In addition to tourism, Bay View is home to several small businesses, including a lumber mill, a boat repair shop, and a few small manufacturing companies. The village also has a small airport, which is used for private planes and charter flights.
Demographics
As of the 2010 census, the population of Bay View was 1,072. The population is predominantly white (94.3%), with small percentages of African American (2.2%), Native American (1.2%), and Asian (1.2%) residents. The median household income in Bay View is $41,250, and the median age is 44.
Bay View is a small, close-knit community with a strong sense of community and pride. The village is home to several churches, a library, and a community center. The village also hosts several annual events, including a Fourth of July parade and a summer festival.
Common Questions
What is Per Capita Income in Bay View?
Per Capita income in Bay View is $64,157.
What is Inequality or Gini Index in Bay View?
Inequality or Gini Index in Bay View is 0.54.
What is the Total Population of Bay View?
Total Population of Bay View is 141.
What is the Total Male Population of Bay View?
Total Male Population of Bay View is 38.
What is the Total Female Population of Bay View?
Total Female Population of Bay View is 103.
What is the Ratio of Males per 100 Females in Bay View?
There are 36.89 Males per 100 Females in Bay View.
What is the Ratio of Females per 100 Males in Bay View?
There are 271.05 Females per 100 Males in Bay View.
What is the Median Population Age in Bay View?
Median Population Age in Bay View is 74.1 Years.
What is the Average Family Size in Bay View
Average Family Size in Bay View is 2.4 People.
What is the Average Household Size in Bay View
Average Household Size in Bay View is 1.6 People.
How Large is the Labor Force in Bay View?
There are 53 People in the Labor Forcein in Bay View.
What is the Percentage of People in the Labor Force in Bay View?
37.6% of People are in the Labor Force in Bay View.