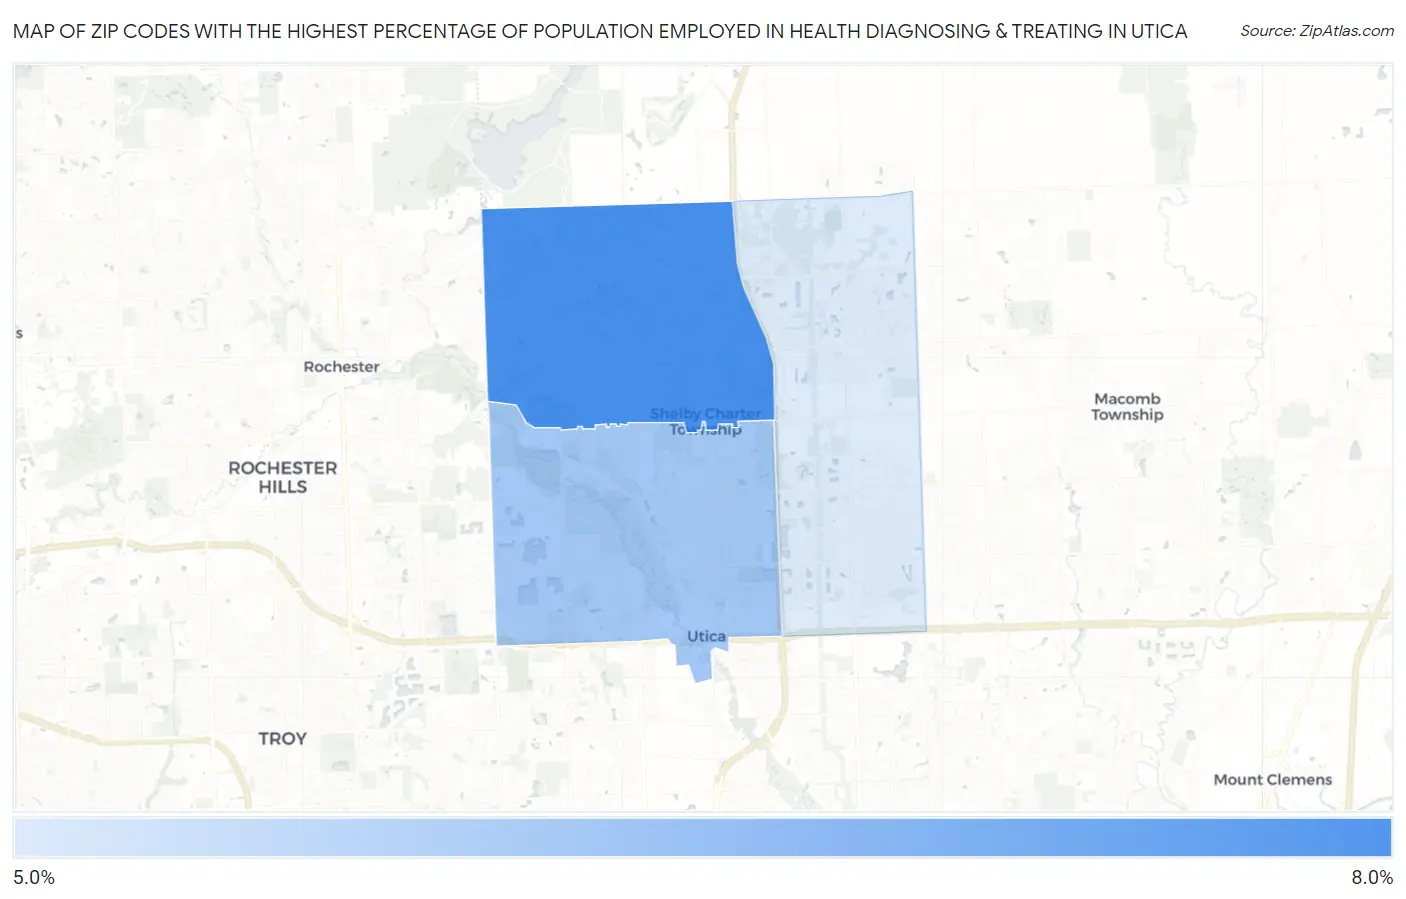
Zip Codes with the Highest Percentage of Population Employed in Health Diagnosing & Treating in Utica, MI
RELATED REPORTS & OPTIONS
Health Diagnosing & Treating
Utica
Compare Zip Codes
Map of Zip Codes with the Highest Percentage of Population Employed in Health Diagnosing & Treating in Utica
5.6%
7.8%
Zip Codes with the Highest Percentage of Population Employed in Health Diagnosing & Treating in Utica, MI
| Zip Code | % Employed | vs State | vs National | |
| 1. | 48316 | 7.8% | 6.6%(+1.16)#228 | 6.2%(+1.56)#7,978 |
| 2. | 48317 | 6.5% | 6.6%(-0.188)#392 | 6.2%(+0.213)#12,172 |
| 3. | 48315 | 5.6% | 6.6%(-1.05)#493 | 6.2%(-0.645)#15,395 |
1
Common Questions
What are the Top Zip Codes with the Highest Percentage of Population Employed in Health Diagnosing & Treating in Utica, MI?
Top Zip Codes with the Highest Percentage of Population Employed in Health Diagnosing & Treating in Utica, MI are:
What zip code has the Highest Percentage of Population Employed in Health Diagnosing & Treating in Utica, MI?
48316 has the Highest Percentage of Population Employed in Health Diagnosing & Treating in Utica, MI with 7.8%.
What is the Percentage of Population Employed in Health Diagnosing & Treating in Utica, MI?
Percentage of Population Employed in Health Diagnosing & Treating in Utica is 8.0%.
What is the Percentage of Population Employed in Health Diagnosing & Treating in Michigan?
Percentage of Population Employed in Health Diagnosing & Treating in Michigan is 6.6%.
What is the Percentage of Population Employed in Health Diagnosing & Treating in the United States?
Percentage of Population Employed in Health Diagnosing & Treating in the United States is 6.2%.