Zip Codes with the Highest Percentage of Population Employed in Health Diagnosing & Treating in Southfield, MI
RELATED REPORTS & OPTIONS
Health Diagnosing & Treating
Southfield
Compare Zip Codes
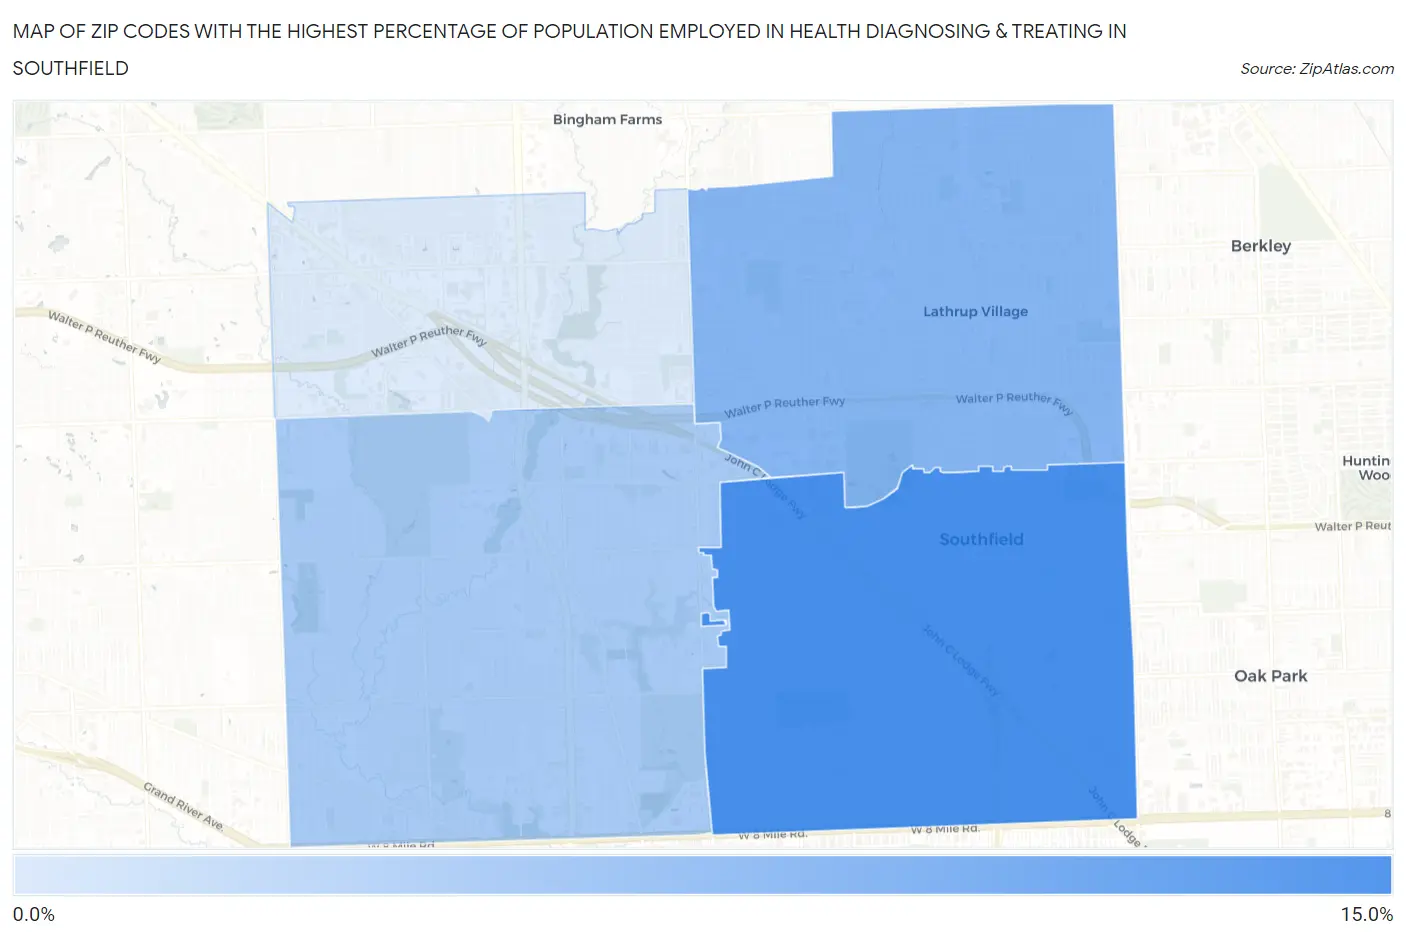
Map of Zip Codes with the Highest Percentage of Population Employed in Health Diagnosing & Treating in Southfield
2.9%
11.3%
Zip Codes with the Highest Percentage of Population Employed in Health Diagnosing & Treating in Southfield, MI
| Zip Code | % Employed | vs State | vs National | |
| 1. | 48075 | 11.3% | 6.6%(+4.67)#52 | 6.2%(+5.08)#2,645 |
| 2. | 48076 | 7.8% | 6.6%(+1.15)#231 | 6.2%(+1.55)#8,012 |
| 3. | 48033 | 5.8% | 6.6%(-0.849)#468 | 6.2%(-0.448)#14,617 |
| 4. | 48034 | 2.9% | 6.6%(-3.74)#833 | 6.2%(-3.34)#24,560 |
1
Common Questions
What are the Top 3 Zip Codes with the Highest Percentage of Population Employed in Health Diagnosing & Treating in Southfield, MI?
Top 3 Zip Codes with the Highest Percentage of Population Employed in Health Diagnosing & Treating in Southfield, MI are:
What zip code has the Highest Percentage of Population Employed in Health Diagnosing & Treating in Southfield, MI?
48075 has the Highest Percentage of Population Employed in Health Diagnosing & Treating in Southfield, MI with 11.3%.
What is the Percentage of Population Employed in Health Diagnosing & Treating in Southfield, MI?
Percentage of Population Employed in Health Diagnosing & Treating in Southfield is 7.3%.
What is the Percentage of Population Employed in Health Diagnosing & Treating in Michigan?
Percentage of Population Employed in Health Diagnosing & Treating in Michigan is 6.6%.
What is the Percentage of Population Employed in Health Diagnosing & Treating in the United States?
Percentage of Population Employed in Health Diagnosing & Treating in the United States is 6.2%.