East Tawas, MI Map & Demographics
East Tawas Map
East Tawas Overview
$29,632
PER CAPITA INCOME
$59,875
AVG FAMILY INCOME
$40,833
AVG HOUSEHOLD INCOME
30.6%
WAGE / INCOME GAP [ % ]
69.4¢/ $1
WAGE / INCOME GAP [ $ ]
0.40
INEQUALITY / GINI INDEX
2,677
TOTAL POPULATION
1,266
MALE POPULATION
1,411
FEMALE POPULATION
89.72
MALES / 100 FEMALES
111.45
FEMALES / 100 MALES
59.1
MEDIAN AGE
2.7
AVG FAMILY SIZE
1.8
AVG HOUSEHOLD SIZE
1,049
LABOR FORCE [ PEOPLE ]
43.8%
PERCENT IN LABOR FORCE
10.2%
UNEMPLOYMENT RATE
East Tawas Zip Codes
East Tawas Area Codes
Income in East Tawas
Income Overview in East Tawas
Per Capita Income in East Tawas is $29,632, while median incomes of families and households are $59,875 and $40,833 respectively.
| Characteristic | Number | Measure |
| Per Capita Income | 2,677 | $29,632 |
| Median Family Income | 571 | $59,875 |
| Mean Family Income | 571 | $71,746 |
| Median Household Income | 1,488 | $40,833 |
| Mean Household Income | 1,488 | $50,356 |
| Income Deficit | 571 | $0 |
| Wage / Income Gap (%) | 2,677 | 30.57% |
| Wage / Income Gap ($) | 2,677 | 69.43¢ per $1 |
| Gini / Inequality Index | 2,677 | 0.40 |
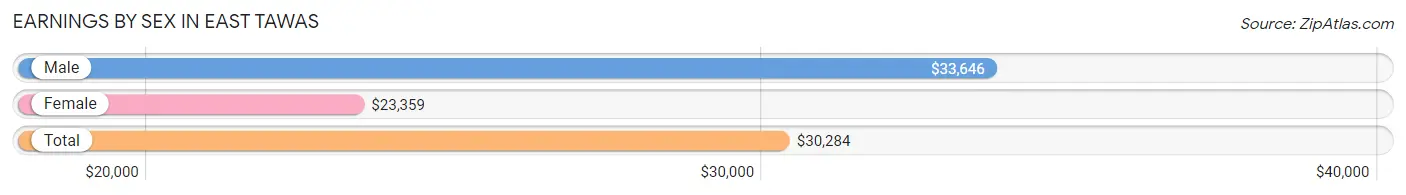
Earnings by Sex in East Tawas
Average Earnings in East Tawas are $30,284, $33,646 for men and $23,359 for women, a difference of 30.6%.
| Sex | Number | Average Earnings |
| Male | 573 (51.9%) | $33,646 |
| Female | 530 (48.0%) | $23,359 |
| Total | 1,103 (100.0%) | $30,284 |
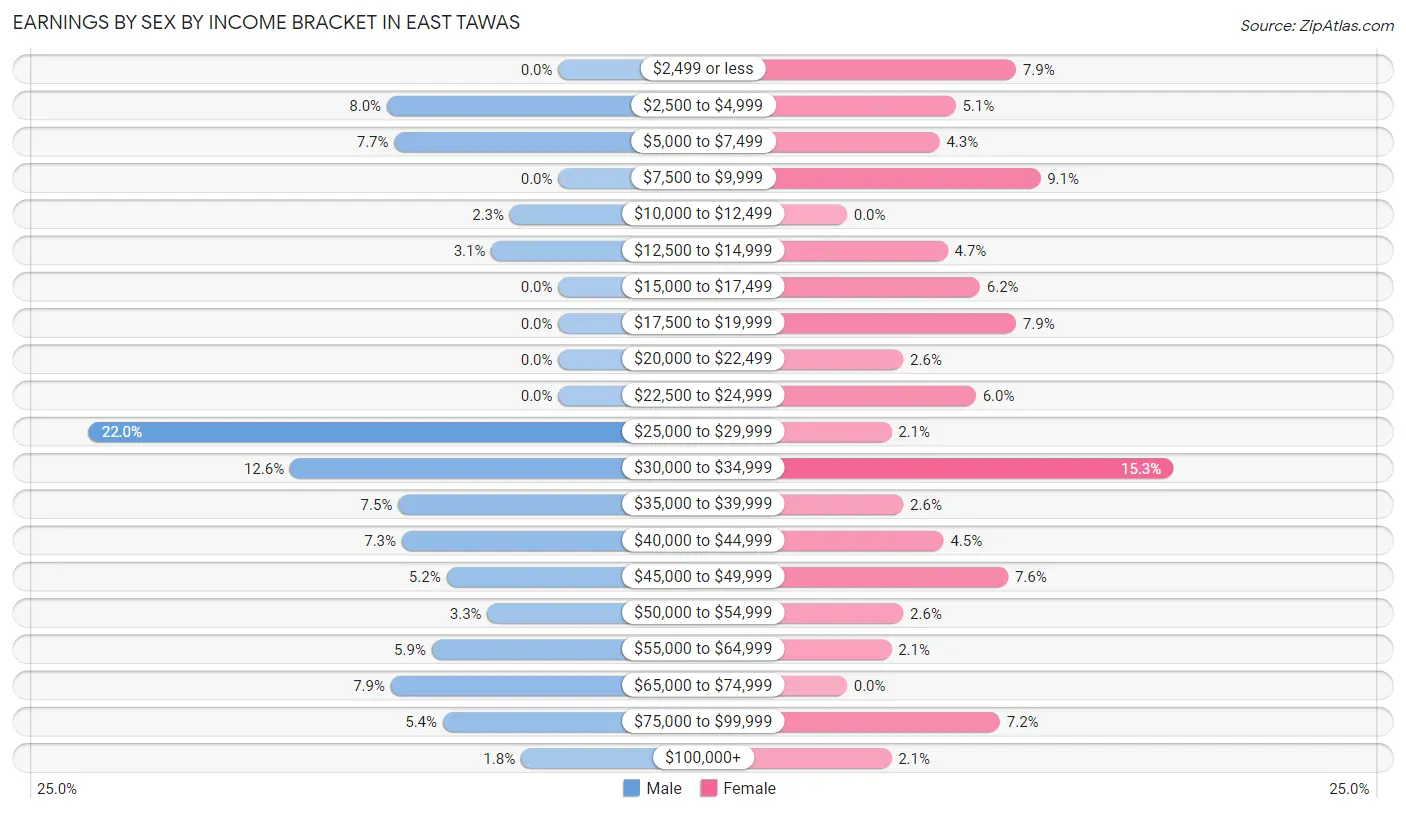
Earnings by Sex by Income Bracket in East Tawas
The most common earnings brackets in East Tawas are $25,000 to $29,999 for men (126 | 22.0%) and $30,000 to $34,999 for women (81 | 15.3%).
| Income | Male | Female |
| $2,499 or less | 0 (0.0%) | 42 (7.9%) |
| $2,500 to $4,999 | 46 (8.0%) | 27 (5.1%) |
| $5,000 to $7,499 | 44 (7.7%) | 23 (4.3%) |
| $7,500 to $9,999 | 0 (0.0%) | 48 (9.1%) |
| $10,000 to $12,499 | 13 (2.3%) | 0 (0.0%) |
| $12,500 to $14,999 | 18 (3.1%) | 25 (4.7%) |
| $15,000 to $17,499 | 0 (0.0%) | 33 (6.2%) |
| $17,500 to $19,999 | 0 (0.0%) | 42 (7.9%) |
| $20,000 to $22,499 | 0 (0.0%) | 14 (2.6%) |
| $22,500 to $24,999 | 0 (0.0%) | 32 (6.0%) |
| $25,000 to $29,999 | 126 (22.0%) | 11 (2.1%) |
| $30,000 to $34,999 | 72 (12.6%) | 81 (15.3%) |
| $35,000 to $39,999 | 43 (7.5%) | 14 (2.6%) |
| $40,000 to $44,999 | 42 (7.3%) | 24 (4.5%) |
| $45,000 to $49,999 | 30 (5.2%) | 40 (7.5%) |
| $50,000 to $54,999 | 19 (3.3%) | 14 (2.6%) |
| $55,000 to $64,999 | 34 (5.9%) | 11 (2.1%) |
| $65,000 to $74,999 | 45 (7.9%) | 0 (0.0%) |
| $75,000 to $99,999 | 31 (5.4%) | 38 (7.2%) |
| $100,000+ | 10 (1.8%) | 11 (2.1%) |
| Total | 573 (100.0%) | 530 (100.0%) |
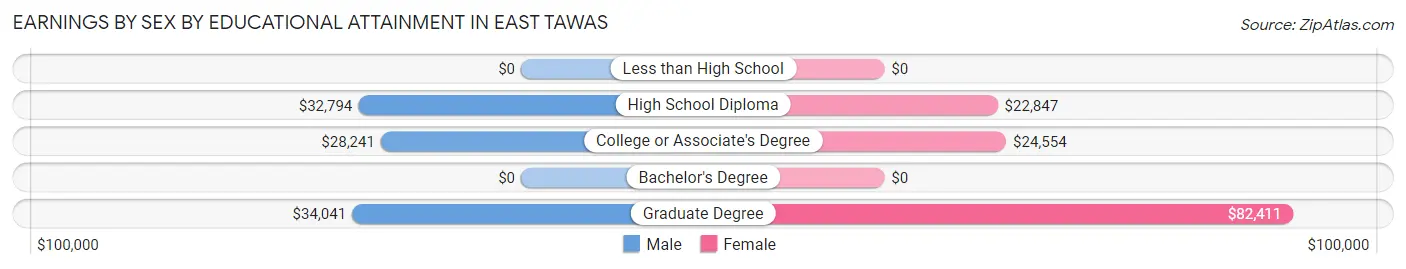
Earnings by Sex by Educational Attainment in East Tawas
Average earnings in East Tawas are $33,375 for men and $27,727 for women, a difference of 16.9%. Men with an educational attainment of graduate degree enjoy the highest average annual earnings of $34,041, while those with college or associate's degree education earn the least with $28,241. Women with an educational attainment of graduate degree earn the most with the average annual earnings of $82,411, while those with high school diploma education have the smallest earnings of $22,847.
| Educational Attainment | Male Income | Female Income |
| Less than High School | - | - |
| High School Diploma | $32,794 | $22,847 |
| College or Associate's Degree | $28,241 | $24,554 |
| Bachelor's Degree | - | - |
| Graduate Degree | $34,041 | $82,411 |
| Total | $33,375 | $27,727 |
Family Income in East Tawas
Family Income Brackets in East Tawas
According to the East Tawas family income data, there are 136 families falling into the $50,000 to $74,999 income range, which is the most common income bracket and makes up 23.8% of all families. Conversely, the less than $10,000 income bracket is the least frequent group with only 10 families (1.8%) belonging to this category.
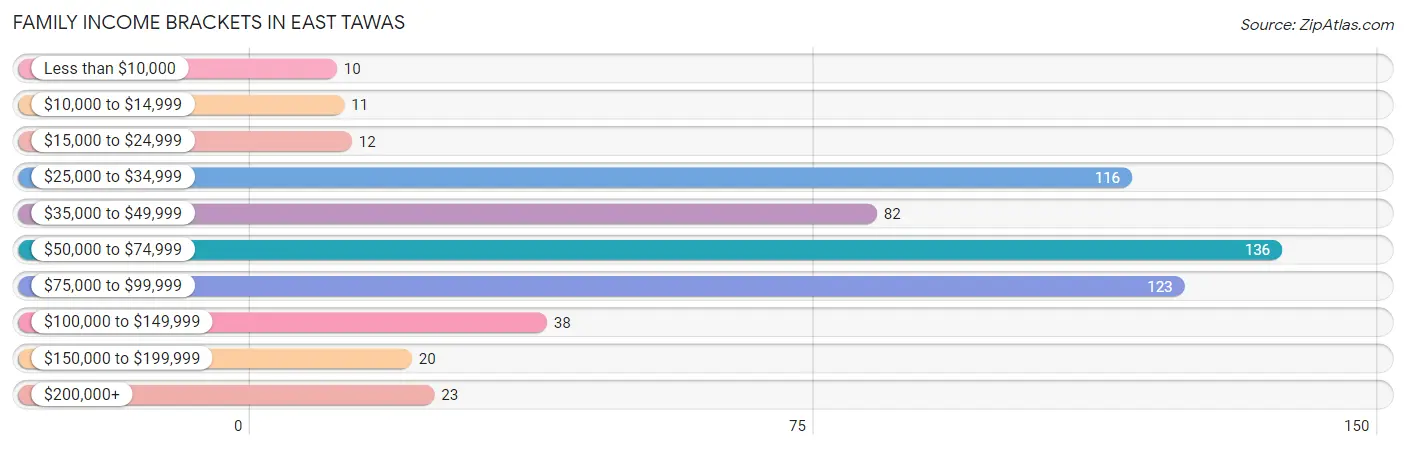
| Income Bracket | # Families | % Families |
| Less than $10,000 | 10 | 1.8% |
| $10,000 to $14,999 | 11 | 1.9% |
| $15,000 to $24,999 | 12 | 2.1% |
| $25,000 to $34,999 | 116 | 20.3% |
| $35,000 to $49,999 | 82 | 14.4% |
| $50,000 to $74,999 | 136 | 23.8% |
| $75,000 to $99,999 | 123 | 21.5% |
| $100,000 to $149,999 | 38 | 6.7% |
| $150,000 to $199,999 | 20 | 3.5% |
| $200,000+ | 23 | 4.0% |
Family Income by Famaliy Size in East Tawas
3-person families (37 | 6.5%) account for the highest median family income in East Tawas with $114,219 per family, while 3-person families (37 | 6.5%) have the highest median income of $38,073 per family member.
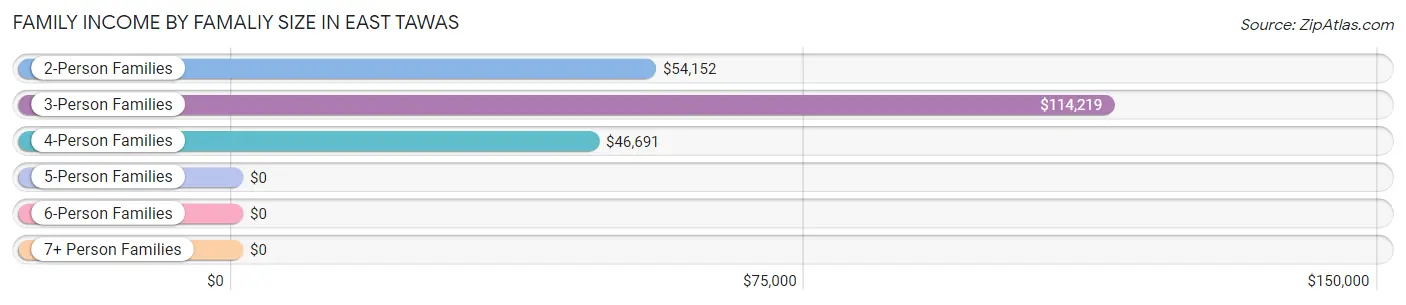
| Income Bracket | # Families | Median Income |
| 2-Person Families | 445 (77.9%) | $54,152 |
| 3-Person Families | 37 (6.5%) | $114,219 |
| 4-Person Families | 77 (13.5%) | $46,691 |
| 5-Person Families | 0 (0.0%) | $0 |
| 6-Person Families | 12 (2.1%) | $0 |
| 7+ Person Families | 0 (0.0%) | $0 |
| Total | 571 (100.0%) | $59,875 |
Family Income by Number of Earners in East Tawas
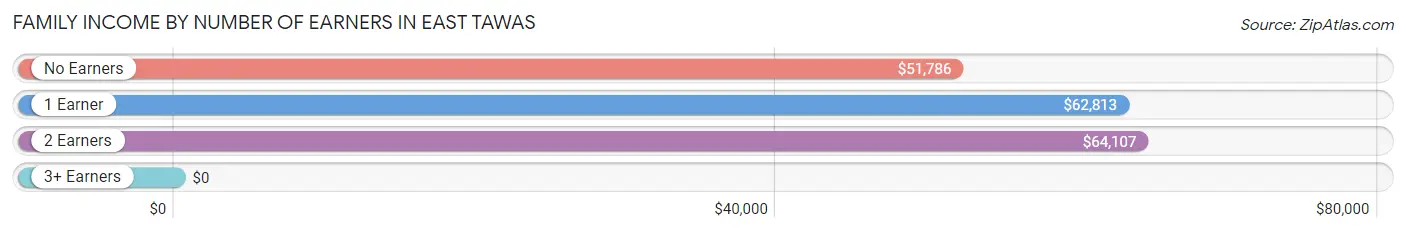
| Number of Earners | # Families | Median Income |
| No Earners | 214 (37.5%) | $51,786 |
| 1 Earner | 212 (37.1%) | $62,813 |
| 2 Earners | 131 (22.9%) | $64,107 |
| 3+ Earners | 14 (2.5%) | $0 |
| Total | 571 (100.0%) | $59,875 |
Household Income in East Tawas
Household Income Brackets in East Tawas
With 338 households falling in the category, the $35,000 to $49,999 income range is the most frequent in East Tawas, accounting for 22.7% of all households. In contrast, only 19 households (1.3%) fall into the $150,000 to $199,999 income bracket, making it the least populous group.
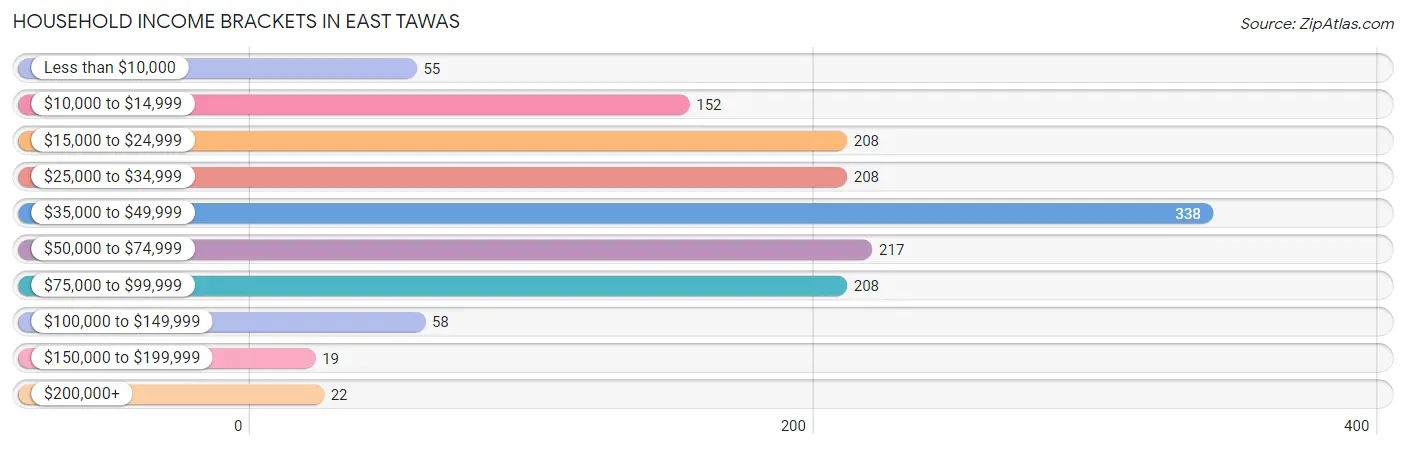
| Income Bracket | # Households | % Households |
| Less than $10,000 | 55 | 3.7% |
| $10,000 to $14,999 | 152 | 10.2% |
| $15,000 to $24,999 | 208 | 14.0% |
| $25,000 to $34,999 | 208 | 14.0% |
| $35,000 to $49,999 | 338 | 22.7% |
| $50,000 to $74,999 | 217 | 14.6% |
| $75,000 to $99,999 | 208 | 14.0% |
| $100,000 to $149,999 | 58 | 3.9% |
| $150,000 to $199,999 | 19 | 1.3% |
| $200,000+ | 22 | 1.5% |
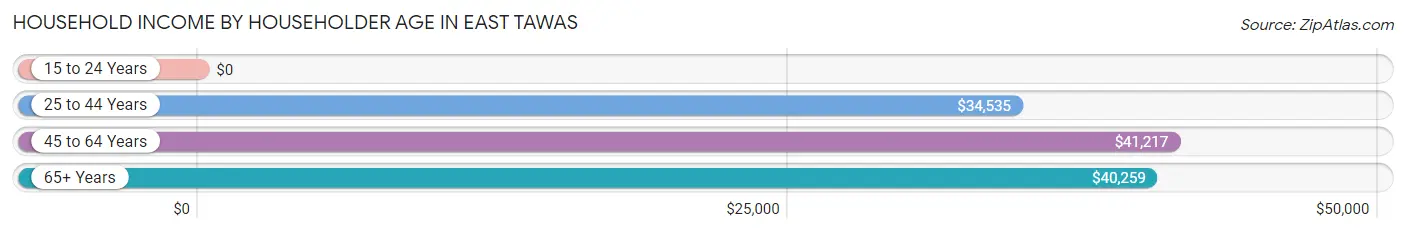
Household Income by Householder Age in East Tawas
The median household income in East Tawas is $40,833, with the highest median household income of $41,217 found in the 45 to 64 years age bracket for the primary householder. A total of 501 households (33.7%) fall into this category. Meanwhile, the 15 to 24 years age bracket for the primary householder has the lowest median household income of $0, with 27 households (1.8%) in this group.
| Income Bracket | # Households | Median Income |
| 15 to 24 Years | 27 (1.8%) | $0 |
| 25 to 44 Years | 212 (14.2%) | $34,535 |
| 45 to 64 Years | 501 (33.7%) | $41,217 |
| 65+ Years | 748 (50.3%) | $40,259 |
| Total | 1,488 (100.0%) | $40,833 |
Poverty in East Tawas
Income Below Poverty by Sex and Age in East Tawas
With 12.1% poverty level for males and 16.1% for females among the residents of East Tawas, 25 to 34 year old males and under 5 year old females are the most vulnerable to poverty, with 53 males (40.2%) and 22 females (100.0%) in their respective age groups living below the poverty level.
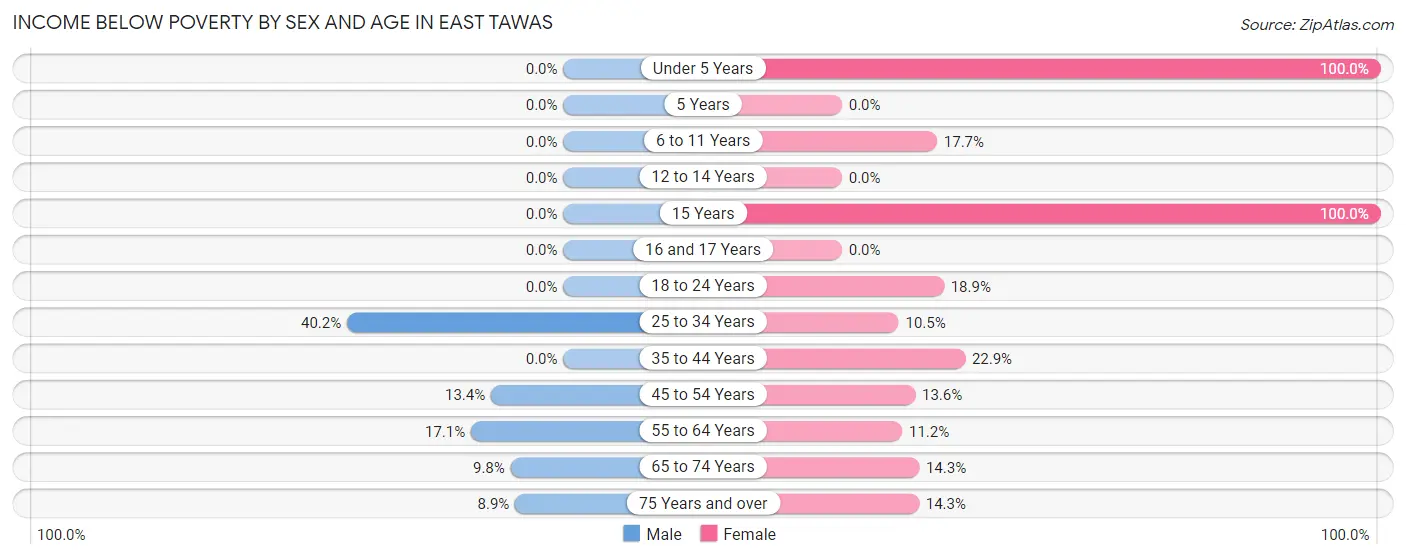
| Age Bracket | Male | Female |
| Under 5 Years | 0 (0.0%) | 22 (100.0%) |
| 5 Years | 0 (0.0%) | 0 (0.0%) |
| 6 to 11 Years | 0 (0.0%) | 12 (17.6%) |
| 12 to 14 Years | 0 (0.0%) | 0 (0.0%) |
| 15 Years | 0 (0.0%) | 14 (100.0%) |
| 16 and 17 Years | 0 (0.0%) | 0 (0.0%) |
| 18 to 24 Years | 0 (0.0%) | 14 (18.9%) |
| 25 to 34 Years | 53 (40.2%) | 10 (10.5%) |
| 35 to 44 Years | 0 (0.0%) | 16 (22.9%) |
| 45 to 54 Years | 20 (13.4%) | 31 (13.6%) |
| 55 to 64 Years | 37 (17.1%) | 30 (11.2%) |
| 65 to 74 Years | 32 (9.8%) | 50 (14.3%) |
| 75 Years and over | 11 (8.9%) | 28 (14.3%) |
| Total | 153 (12.1%) | 227 (16.1%) |
Income Above Poverty by Sex and Age in East Tawas
According to the poverty statistics in East Tawas, males aged under 5 years and females aged 12 to 14 years are the age groups that are most secure financially, with 100.0% of males and 100.0% of females in these age groups living above the poverty line.
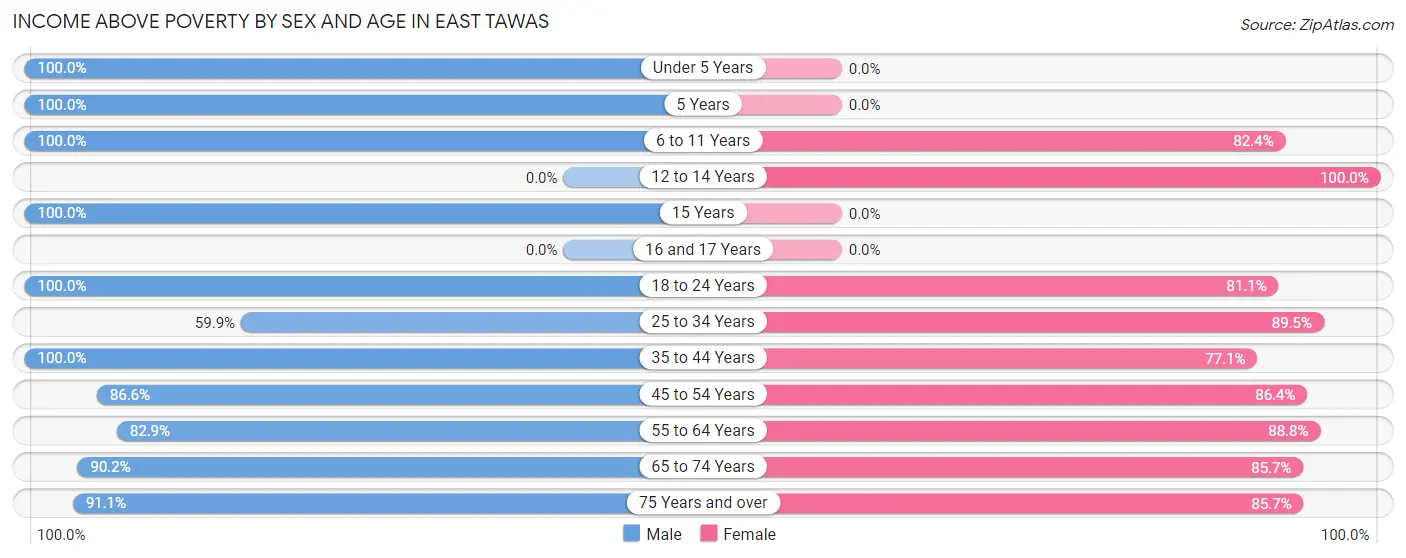
| Age Bracket | Male | Female |
| Under 5 Years | 46 (100.0%) | 0 (0.0%) |
| 5 Years | 33 (100.0%) | 0 (0.0%) |
| 6 to 11 Years | 36 (100.0%) | 56 (82.4%) |
| 12 to 14 Years | 0 (0.0%) | 24 (100.0%) |
| 15 Years | 38 (100.0%) | 0 (0.0%) |
| 16 and 17 Years | 0 (0.0%) | 0 (0.0%) |
| 18 to 24 Years | 30 (100.0%) | 60 (81.1%) |
| 25 to 34 Years | 79 (59.9%) | 85 (89.5%) |
| 35 to 44 Years | 136 (100.0%) | 54 (77.1%) |
| 45 to 54 Years | 129 (86.6%) | 197 (86.4%) |
| 55 to 64 Years | 179 (82.9%) | 238 (88.8%) |
| 65 to 74 Years | 295 (90.2%) | 299 (85.7%) |
| 75 Years and over | 112 (91.1%) | 168 (85.7%) |
| Total | 1,113 (87.9%) | 1,181 (83.9%) |
Income Below Poverty Among Married-Couple Families in East Tawas
The poverty statistics for married-couple families in East Tawas show that 5.1% or 24 of the total 466 families live below the poverty line. Families with 1 or 2 children have the highest poverty rate of 16.3%, comprising of 13 families. On the other hand, families with 3 or 4 children have the lowest poverty rate of 0.0%, which includes 0 families.
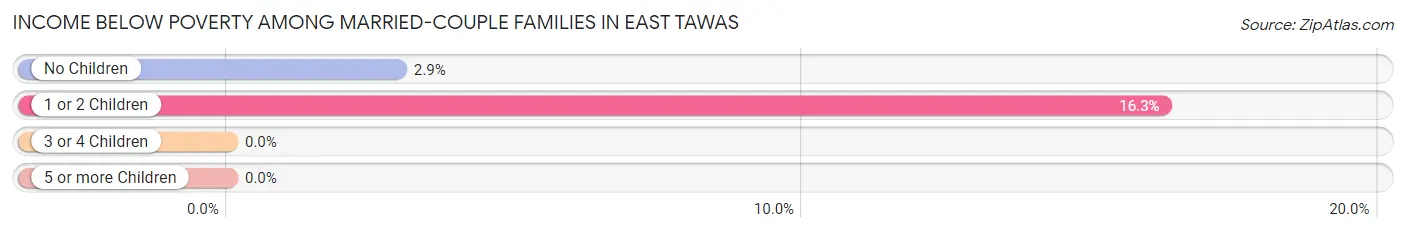
| Children | Above Poverty | Below Poverty |
| No Children | 363 (97.1%) | 11 (2.9%) |
| 1 or 2 Children | 67 (83.8%) | 13 (16.3%) |
| 3 or 4 Children | 12 (100.0%) | 0 (0.0%) |
| 5 or more Children | 0 (0.0%) | 0 (0.0%) |
| Total | 442 (94.9%) | 24 (5.1%) |
Income Below Poverty Among Single-Parent Households in East Tawas
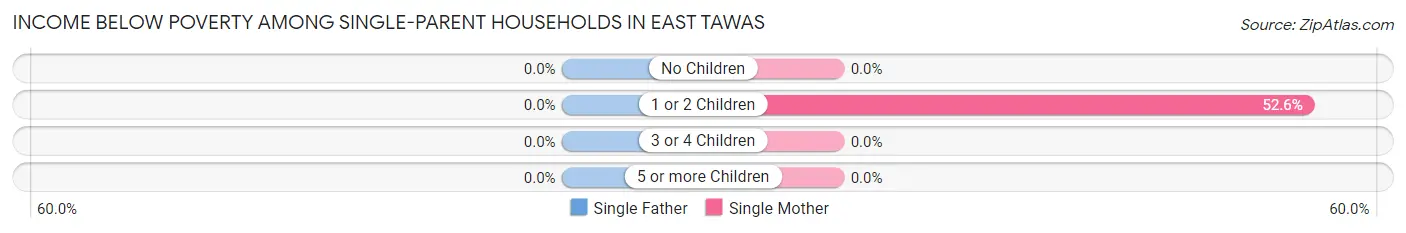
| Children | Single Father | Single Mother |
| No Children | 0 (0.0%) | 0 (0.0%) |
| 1 or 2 Children | 0 (0.0%) | 10 (52.6%) |
| 3 or 4 Children | 0 (0.0%) | 0 (0.0%) |
| 5 or more Children | 0 (0.0%) | 0 (0.0%) |
| Total | 0 (0.0%) | 10 (19.6%) |
Income Below Poverty Among Married-Couple vs Single-Parent Households in East Tawas
The poverty data for East Tawas shows that 24 of the married-couple family households (5.1%) and 10 of the single-parent households (9.5%) are living below the poverty level. Within the married-couple family households, those with 1 or 2 children have the highest poverty rate, with 13 households (16.3%) falling below the poverty line. Among the single-parent households, those with 1 or 2 children have the highest poverty rate, with 10 household (21.3%) living below poverty.
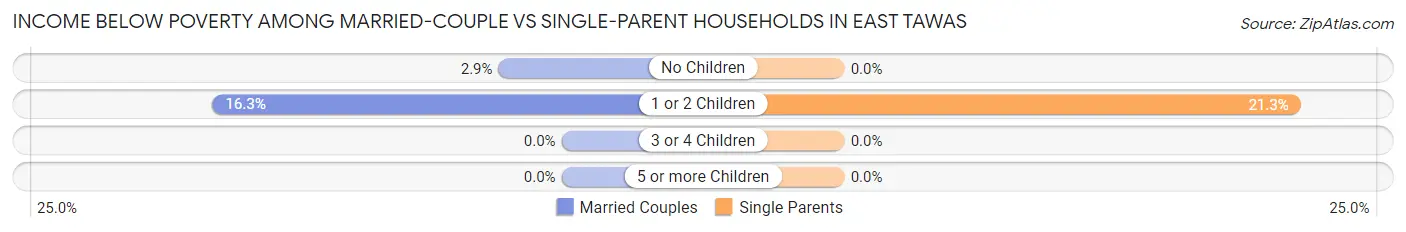
| Children | Married-Couple Families | Single-Parent Households |
| No Children | 11 (2.9%) | 0 (0.0%) |
| 1 or 2 Children | 13 (16.3%) | 10 (21.3%) |
| 3 or 4 Children | 0 (0.0%) | 0 (0.0%) |
| 5 or more Children | 0 (0.0%) | 0 (0.0%) |
| Total | 24 (5.1%) | 10 (9.5%) |
Race in East Tawas
The most populous races in East Tawas are White / Caucasian (2,464 | 92.0%), Two or more Races (81 | 3.0%), and Black / African American (64 | 2.4%).
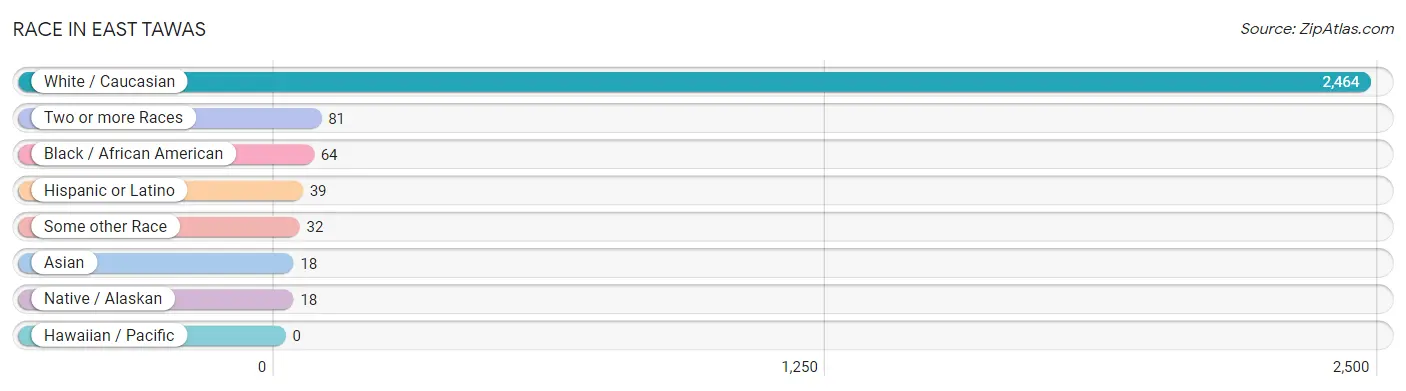
| Race | # Population | % Population |
| Asian | 18 | 0.7% |
| Black / African American | 64 | 2.4% |
| Hawaiian / Pacific | 0 | 0.0% |
| Hispanic or Latino | 39 | 1.5% |
| Native / Alaskan | 18 | 0.7% |
| White / Caucasian | 2,464 | 92.0% |
| Two or more Races | 81 | 3.0% |
| Some other Race | 32 | 1.2% |
| Total | 2,677 | 100.0% |
Ancestry in East Tawas
The most populous ancestries reported in East Tawas are German (760 | 28.4%), English (449 | 16.8%), Polish (303 | 11.3%), Irish (210 | 7.8%), and French (193 | 7.2%), together accounting for 71.5% of all East Tawas residents.
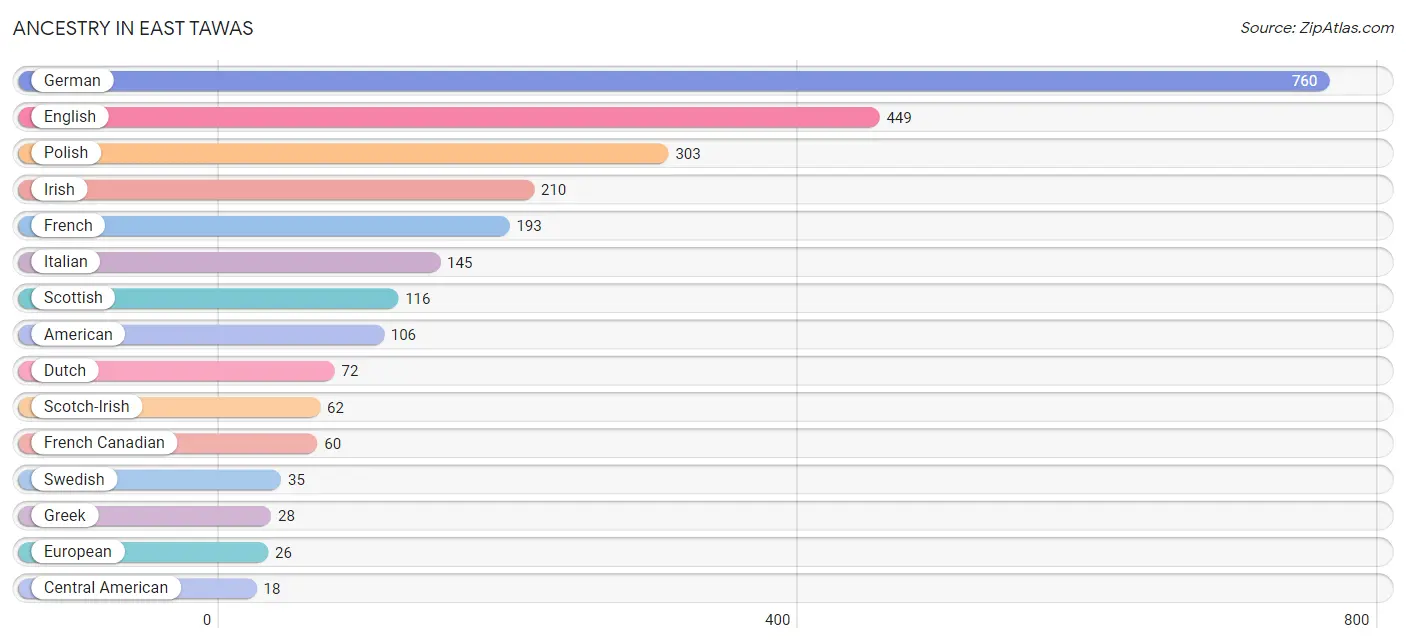
| Ancestry | # Population | % Population |
| American | 106 | 4.0% |
| Austrian | 11 | 0.4% |
| Belgian | 14 | 0.5% |
| British | 15 | 0.6% |
| Central American | 18 | 0.7% |
| Chippewa | 4 | 0.2% |
| Croatian | 13 | 0.5% |
| Czech | 16 | 0.6% |
| Czechoslovakian | 14 | 0.5% |
| Dutch | 72 | 2.7% |
| English | 449 | 16.8% |
| Estonian | 14 | 0.5% |
| European | 26 | 1.0% |
| Finnish | 12 | 0.4% |
| French | 193 | 7.2% |
| French Canadian | 60 | 2.2% |
| German | 760 | 28.4% |
| Greek | 28 | 1.1% |
| Guamanian / Chamorro | 10 | 0.4% |
| Guatemalan | 18 | 0.7% |
| Hungarian | 5 | 0.2% |
| Irish | 210 | 7.8% |
| Italian | 145 | 5.4% |
| Korean | 18 | 0.7% |
| Mexican | 6 | 0.2% |
| Norwegian | 14 | 0.5% |
| Peruvian | 15 | 0.6% |
| Polish | 303 | 11.3% |
| Portuguese | 11 | 0.4% |
| Romanian | 14 | 0.5% |
| Russian | 10 | 0.4% |
| Scotch-Irish | 62 | 2.3% |
| Scottish | 116 | 4.3% |
| Sioux | 18 | 0.7% |
| South American | 15 | 0.6% |
| Swedish | 35 | 1.3% | View All 36 Rows |
Immigrants in East Tawas
The most numerous immigrant groups reported in East Tawas came from Europe (35 | 1.3%), Germany (35 | 1.3%), Western Europe (35 | 1.3%), Latin America (25 | 0.9%), and Peru (25 | 0.9%), together accounting for 5.8% of all East Tawas residents.
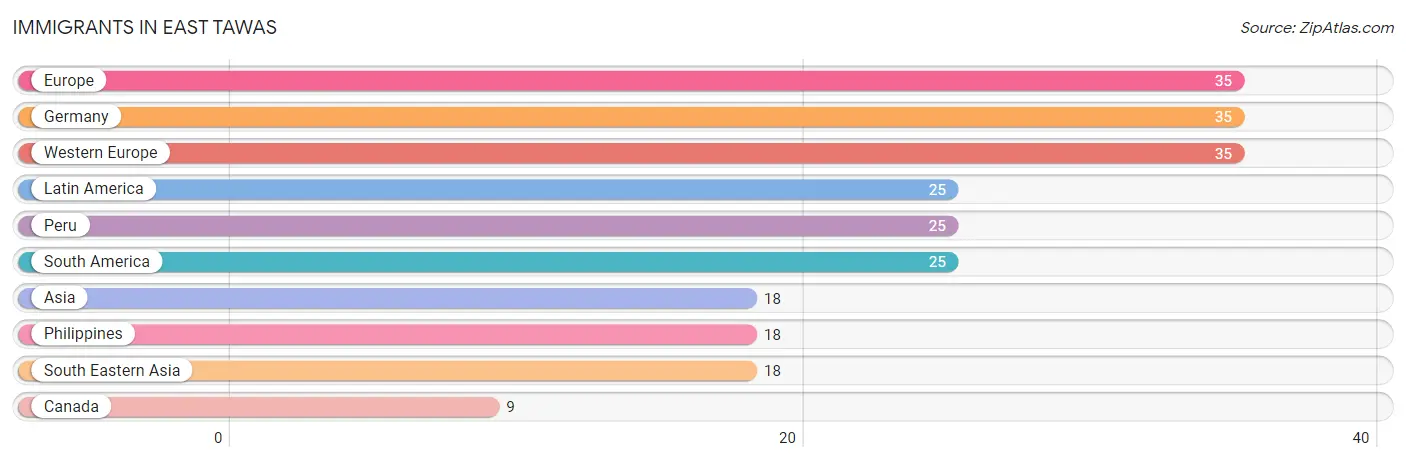
| Immigration Origin | # Population | % Population |
| Asia | 18 | 0.7% |
| Canada | 9 | 0.3% |
| Europe | 35 | 1.3% |
| Germany | 35 | 1.3% |
| Latin America | 25 | 0.9% |
| Peru | 25 | 0.9% |
| Philippines | 18 | 0.7% |
| South America | 25 | 0.9% |
| South Eastern Asia | 18 | 0.7% |
| Western Europe | 35 | 1.3% | View All 10 Rows |
Sex and Age in East Tawas
Sex and Age in East Tawas
The most populous age groups in East Tawas are 65 to 69 Years (239 | 18.9%) for men and 50 to 54 Years (211 | 14.9%) for women.
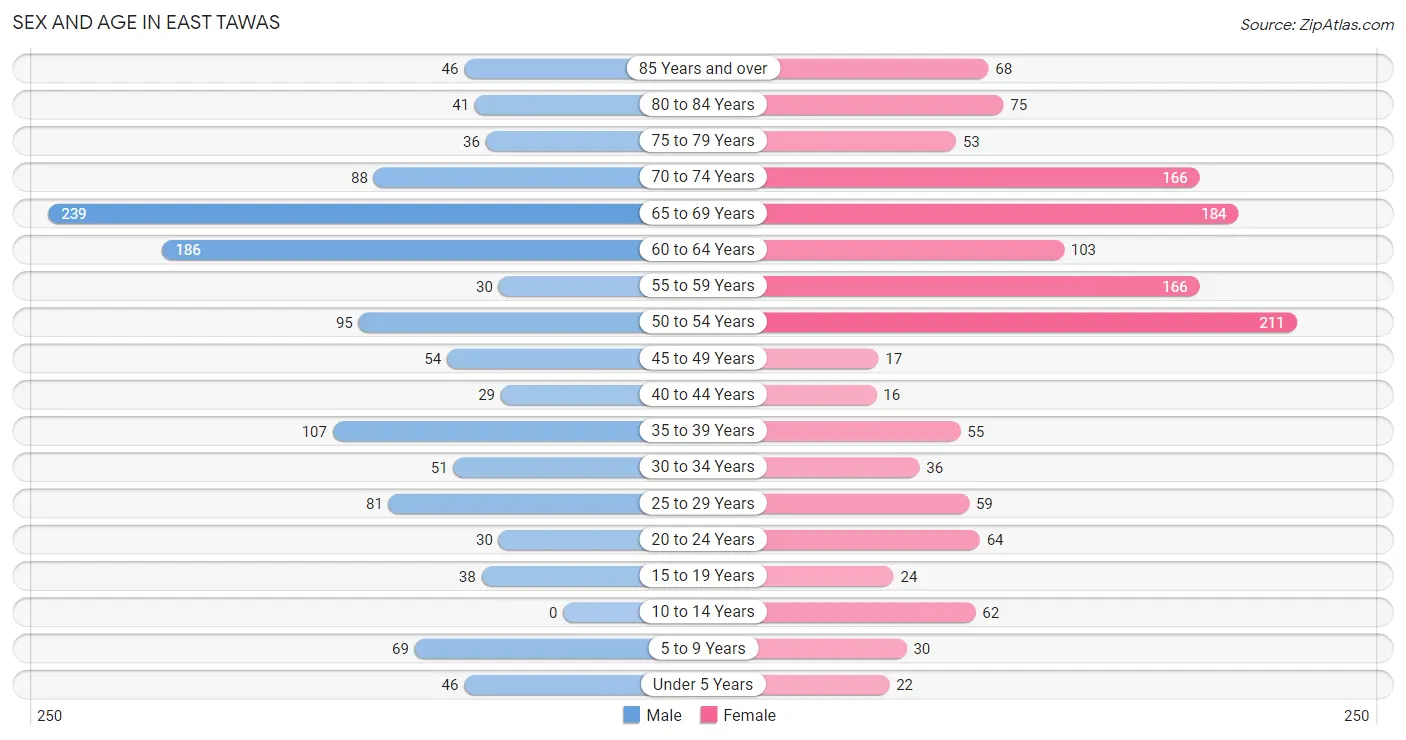
| Age Bracket | Male | Female |
| Under 5 Years | 46 (3.6%) | 22 (1.6%) |
| 5 to 9 Years | 69 (5.4%) | 30 (2.1%) |
| 10 to 14 Years | 0 (0.0%) | 62 (4.4%) |
| 15 to 19 Years | 38 (3.0%) | 24 (1.7%) |
| 20 to 24 Years | 30 (2.4%) | 64 (4.5%) |
| 25 to 29 Years | 81 (6.4%) | 59 (4.2%) |
| 30 to 34 Years | 51 (4.0%) | 36 (2.5%) |
| 35 to 39 Years | 107 (8.5%) | 55 (3.9%) |
| 40 to 44 Years | 29 (2.3%) | 16 (1.1%) |
| 45 to 49 Years | 54 (4.3%) | 17 (1.2%) |
| 50 to 54 Years | 95 (7.5%) | 211 (14.9%) |
| 55 to 59 Years | 30 (2.4%) | 166 (11.8%) |
| 60 to 64 Years | 186 (14.7%) | 103 (7.3%) |
| 65 to 69 Years | 239 (18.9%) | 184 (13.0%) |
| 70 to 74 Years | 88 (7.0%) | 166 (11.8%) |
| 75 to 79 Years | 36 (2.8%) | 53 (3.8%) |
| 80 to 84 Years | 41 (3.2%) | 75 (5.3%) |
| 85 Years and over | 46 (3.6%) | 68 (4.8%) |
| Total | 1,266 (100.0%) | 1,411 (100.0%) |
Families and Households in East Tawas
Median Family Size in East Tawas
The median family size in East Tawas is 2.71 persons per family, with single female/mother families (51 | 8.9%) accounting for the largest median family size of 3.73 persons per family. On the other hand, single male/father families (54 | 9.5%) represent the smallest median family size with 2.22 persons per family.
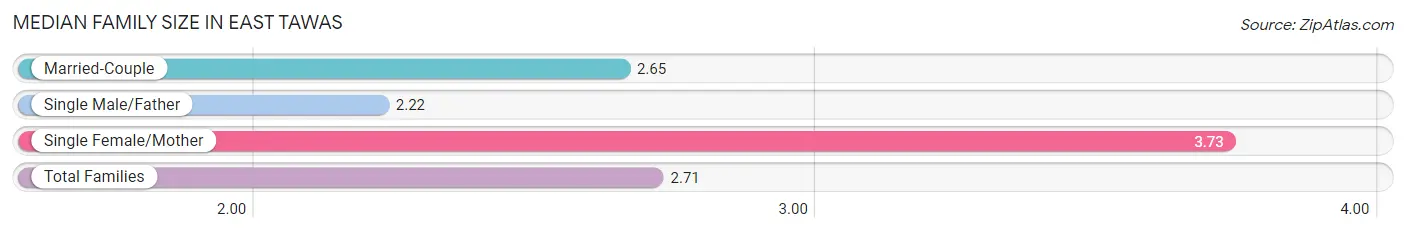
| Family Type | # Families | Family Size |
| Married-Couple | 466 (81.6%) | 2.65 |
| Single Male/Father | 54 (9.5%) | 2.22 |
| Single Female/Mother | 51 (8.9%) | 3.73 |
| Total Families | 571 (100.0%) | 2.71 |
Median Household Size in East Tawas
The median household size in East Tawas is 1.79 persons per household, with single female/mother households (51 | 3.4%) accounting for the largest median household size of 4.16 persons per household. non-family households (917 | 61.6%) represent the smallest median household size with 1.17 persons per household.
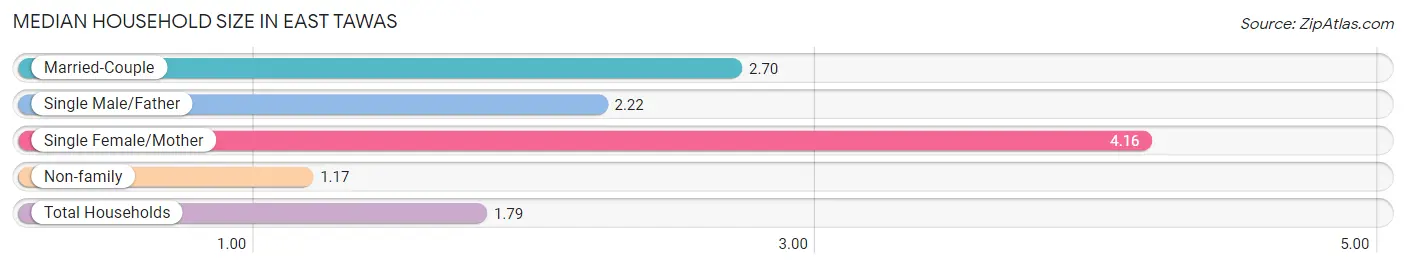
| Household Type | # Households | Household Size |
| Married-Couple | 466 (31.3%) | 2.70 |
| Single Male/Father | 54 (3.6%) | 2.22 |
| Single Female/Mother | 51 (3.4%) | 4.16 |
| Non-family | 917 (61.6%) | 1.17 |
| Total Households | 1,488 (100.0%) | 1.79 |
Household Size by Marriage Status in East Tawas
Out of a total of 1,488 households in East Tawas, 571 (38.4%) are family households, while 917 (61.6%) are nonfamily households. The most numerous type of family households are 2-person households, comprising 435, and the most common type of nonfamily households are 1-person households, comprising 802.
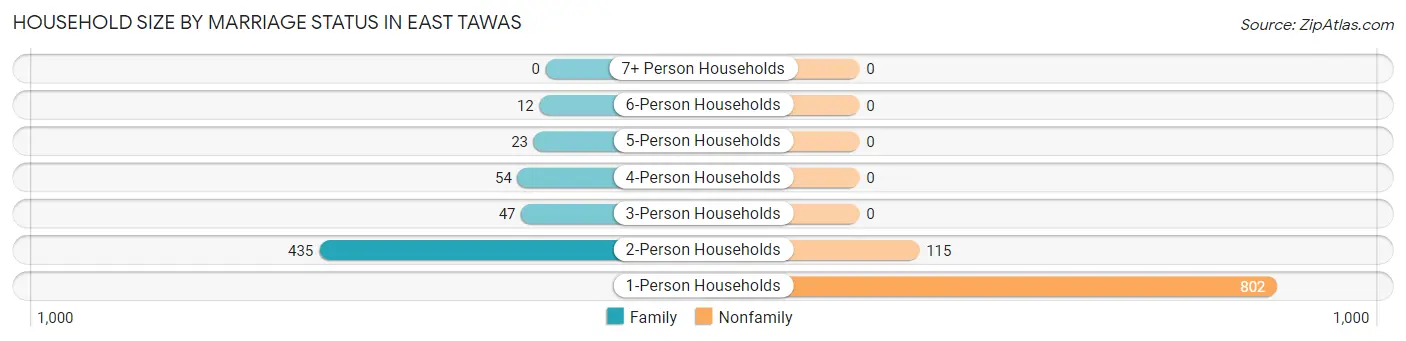
| Household Size | Family Households | Nonfamily Households |
| 1-Person Households | - | 802 (53.9%) |
| 2-Person Households | 435 (29.2%) | 115 (7.7%) |
| 3-Person Households | 47 (3.2%) | 0 (0.0%) |
| 4-Person Households | 54 (3.6%) | 0 (0.0%) |
| 5-Person Households | 23 (1.5%) | 0 (0.0%) |
| 6-Person Households | 12 (0.8%) | 0 (0.0%) |
| 7+ Person Households | 0 (0.0%) | 0 (0.0%) |
| Total | 571 (38.4%) | 917 (61.6%) |
Female Fertility in East Tawas
Fertility by Age in East Tawas
Average fertility rate in East Tawas is 67.0 births per 1,000 women. Women in the age bracket of 20 to 34 years have the highest fertility rate with 138.0 births per 1,000 women. Women in the age bracket of 20 to 34 years acount for 100.0% of all women with births.
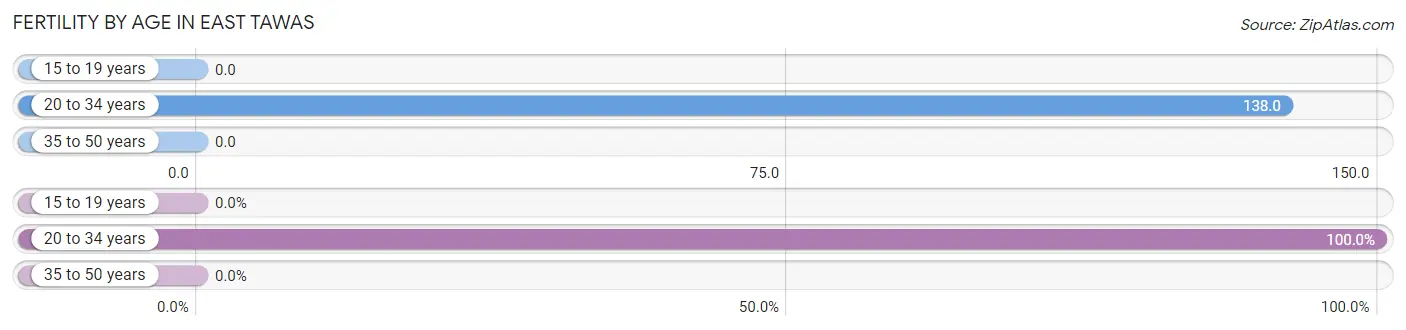
| Age Bracket | Women with Births | Births / 1,000 Women |
| 15 to 19 years | 0 (0.0%) | 0.0 |
| 20 to 34 years | 22 (100.0%) | 138.0 |
| 35 to 50 years | 0 (0.0%) | 0.0 |
| Total | 22 (100.0%) | 67.0 |
Fertility by Age by Marriage Status in East Tawas
9.1% of women with births (22) in East Tawas are married. The highest percentage of unmarried women with births falls into 20 to 34 years age bracket with 90.9% of them unmarried at the time of birth, while the lowest percentage of unmarried women with births belong to 20 to 34 years age bracket with 90.9% of them unmarried.
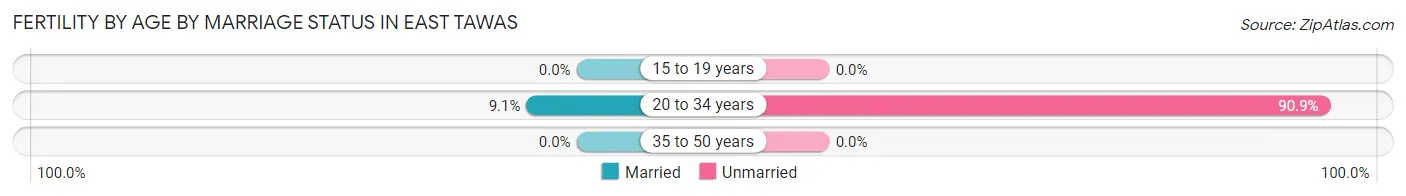
| Age Bracket | Married | Unmarried |
| 15 to 19 years | 0 (0.0%) | 0 (0.0%) |
| 20 to 34 years | 2 (9.1%) | 20 (90.9%) |
| 35 to 50 years | 0 (0.0%) | 0 (0.0%) |
| Total | 2 (9.1%) | 20 (90.9%) |
Fertility by Education in East Tawas
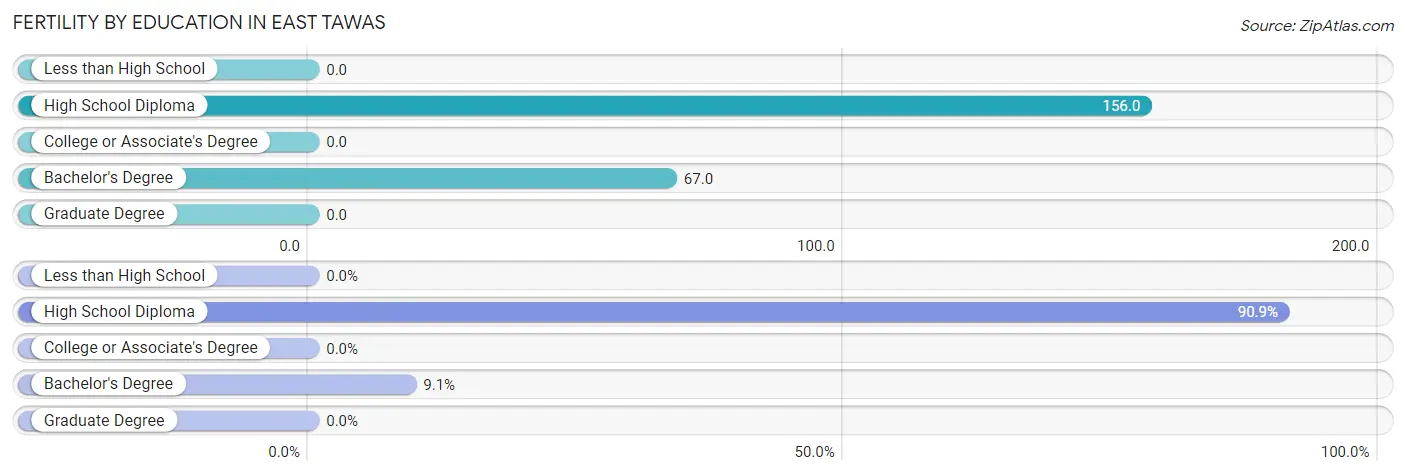
| Educational Attainment | Women with Births | Births / 1,000 Women |
| Less than High School | 0 (0.0%) | 0.0 |
| High School Diploma | 20 (90.9%) | 156.0 |
| College or Associate's Degree | 0 (0.0%) | 0.0 |
| Bachelor's Degree | 2 (9.1%) | 67.0 |
| Graduate Degree | 0 (0.0%) | 0.0 |
| Total | 22 (100.0%) | 67.0 |
Fertility by Education by Marriage Status in East Tawas
90.9% of women with births in East Tawas are unmarried. Women with the educational attainment of bachelor's degree are most likely to be married with 100.0% of them married at childbirth, while women with the educational attainment of high school diploma are least likely to be married with 100.0% of them unmarried at childbirth.
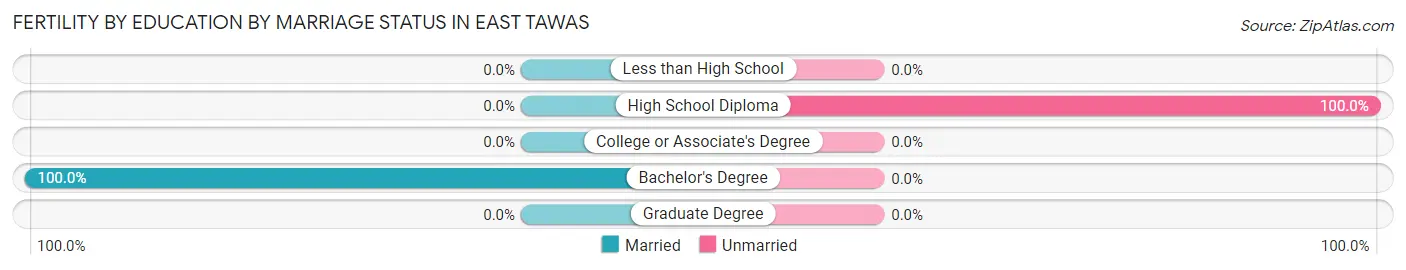
| Educational Attainment | Married | Unmarried |
| Less than High School | 0 (0.0%) | 0 (0.0%) |
| High School Diploma | 0 (0.0%) | 20 (100.0%) |
| College or Associate's Degree | 0 (0.0%) | 0 (0.0%) |
| Bachelor's Degree | 2 (100.0%) | 0 (0.0%) |
| Graduate Degree | 0 (0.0%) | 0 (0.0%) |
| Total | 2 (9.1%) | 20 (90.9%) |
Employment Characteristics in East Tawas
Employment by Class of Employer in East Tawas
Among the 929 employed individuals in East Tawas, private company employees (581 | 62.5%), not-for-profit organizations (179 | 19.3%), and self-employed (not incorporated) (77 | 8.3%) make up the most common classes of employment.
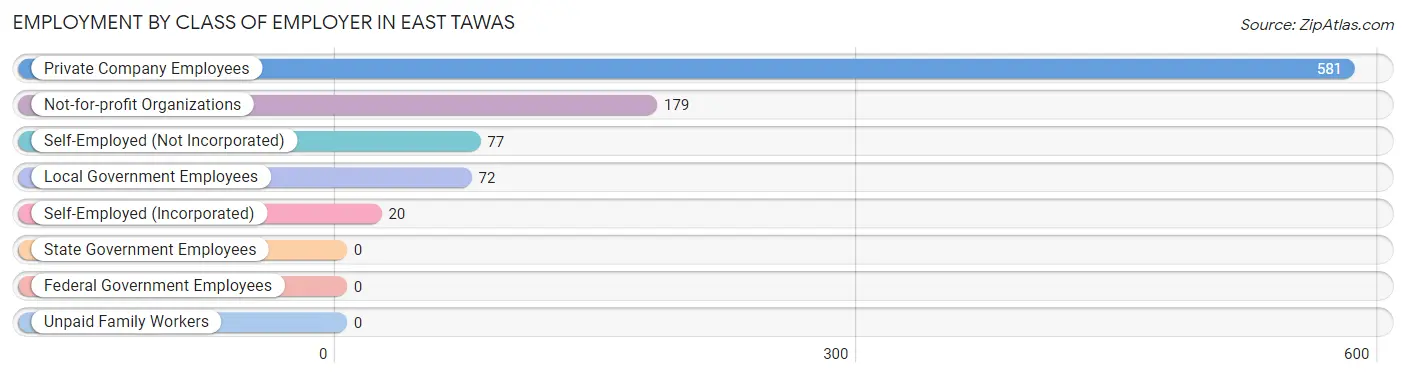
| Employer Class | # Employees | % Employees |
| Private Company Employees | 581 | 62.5% |
| Self-Employed (Incorporated) | 20 | 2.1% |
| Self-Employed (Not Incorporated) | 77 | 8.3% |
| Not-for-profit Organizations | 179 | 19.3% |
| Local Government Employees | 72 | 7.7% |
| State Government Employees | 0 | 0.0% |
| Federal Government Employees | 0 | 0.0% |
| Unpaid Family Workers | 0 | 0.0% |
| Total | 929 | 100.0% |
Employment Status by Age in East Tawas
According to the labor force statistics for East Tawas, out of the total population over 16 years of age (2,396), 43.8% or 1,049 individuals are in the labor force, with 10.2% or 107 of them unemployed. The age group with the highest labor force participation rate is 25 to 29 years, with 84.3% or 118 individuals in the labor force. Within the labor force, the 20 to 24 years age range has the highest percentage of unemployed individuals, with 41.9% or 31 of them being unemployed.
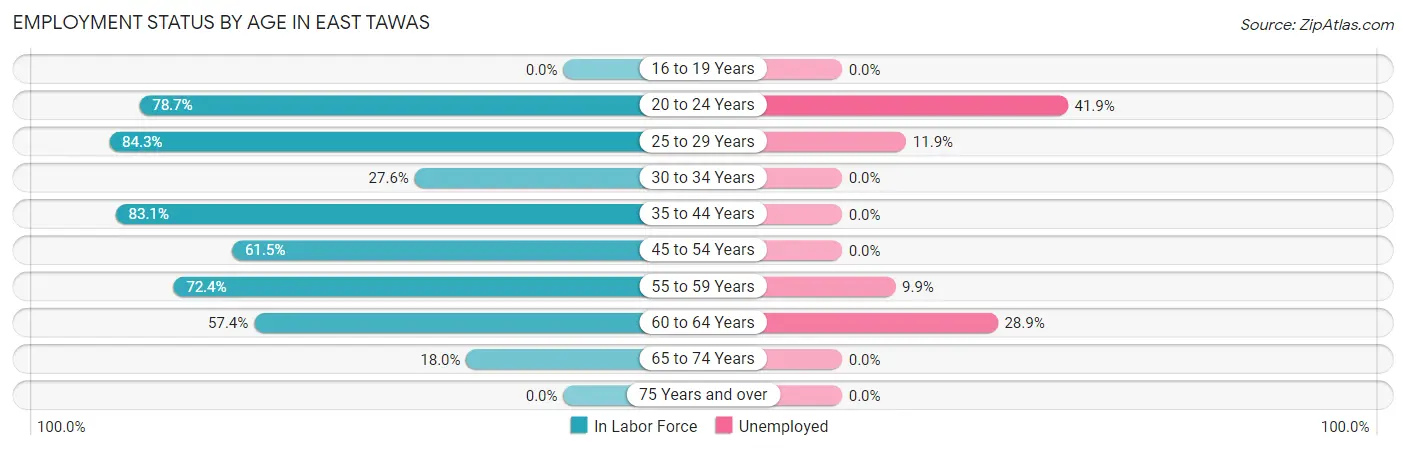
| Age Bracket | In Labor Force | Unemployed |
| 16 to 19 Years | 0 (0.0%) | 0 (0.0%) |
| 20 to 24 Years | 74 (78.7%) | 31 (41.9%) |
| 25 to 29 Years | 118 (84.3%) | 14 (11.9%) |
| 30 to 34 Years | 24 (27.6%) | 0 (0.0%) |
| 35 to 44 Years | 172 (83.1%) | 0 (0.0%) |
| 45 to 54 Years | 232 (61.5%) | 0 (0.0%) |
| 55 to 59 Years | 142 (72.4%) | 14 (9.9%) |
| 60 to 64 Years | 166 (57.4%) | 48 (28.9%) |
| 65 to 74 Years | 122 (18.0%) | 0 (0.0%) |
| 75 Years and over | 0 (0.0%) | 0 (0.0%) |
| Total | 1,049 (43.8%) | 107 (10.2%) |
Employment Status by Educational Attainment in East Tawas
According to labor force statistics for East Tawas, 65.9% of individuals (854) out of the total population between 25 and 64 years of age (1,296) are in the labor force, with 8.9% or 76 of them being unemployed. The group with the highest labor force participation rate are those with the educational attainment of bachelor's degree or higher, with 84.3% or 209 individuals in the labor force. Within the labor force, individuals with bachelor's degree or higher education have the highest percentage of unemployment, with 18.2% or 38 of them being unemployed.
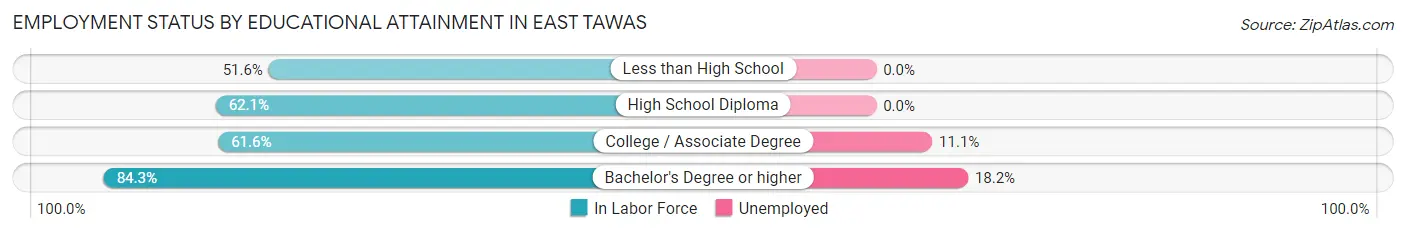
| Educational Attainment | In Labor Force | Unemployed |
| Less than High School | 16 (51.6%) | 0 (0.0%) |
| High School Diploma | 287 (62.1%) | 0 (0.0%) |
| College / Associate Degree | 342 (61.6%) | 62 (11.1%) |
| Bachelor's Degree or higher | 209 (84.3%) | 45 (18.2%) |
| Total | 854 (65.9%) | 115 (8.9%) |
Employment Occupations by Sex in East Tawas
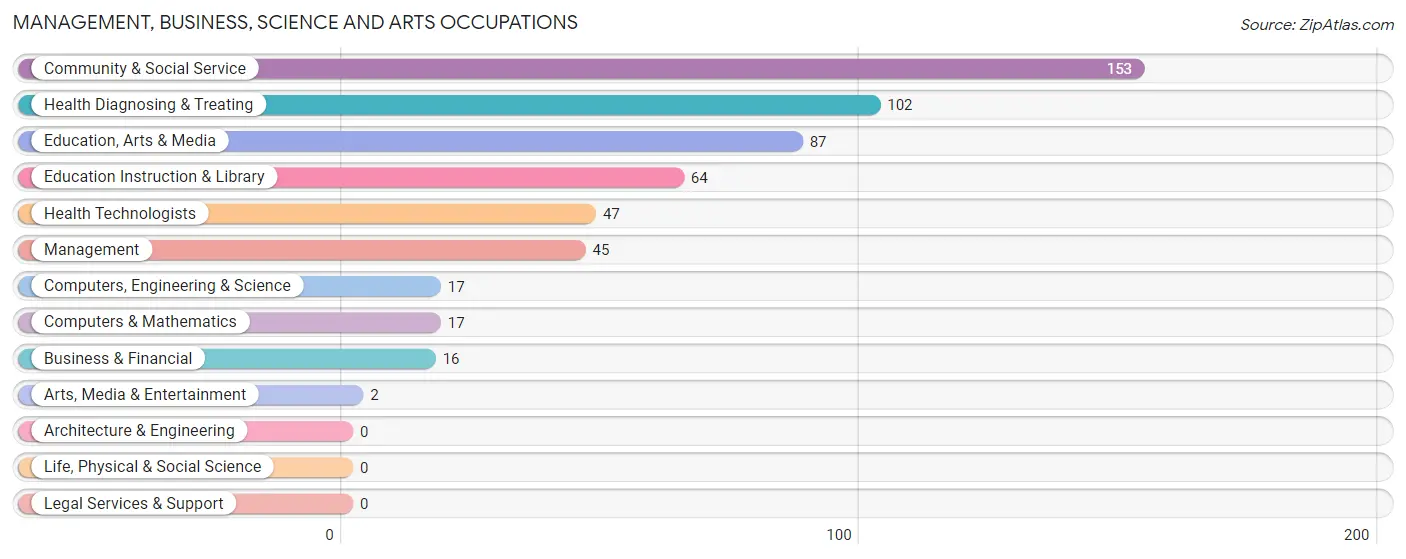
Management, Business, Science and Arts Occupations
The most common Management, Business, Science and Arts occupations in East Tawas are Community & Social Service (153 | 16.2%), Health Diagnosing & Treating (102 | 10.8%), Education, Arts & Media (87 | 9.2%), Education Instruction & Library (64 | 6.8%), and Health Technologists (47 | 5.0%).
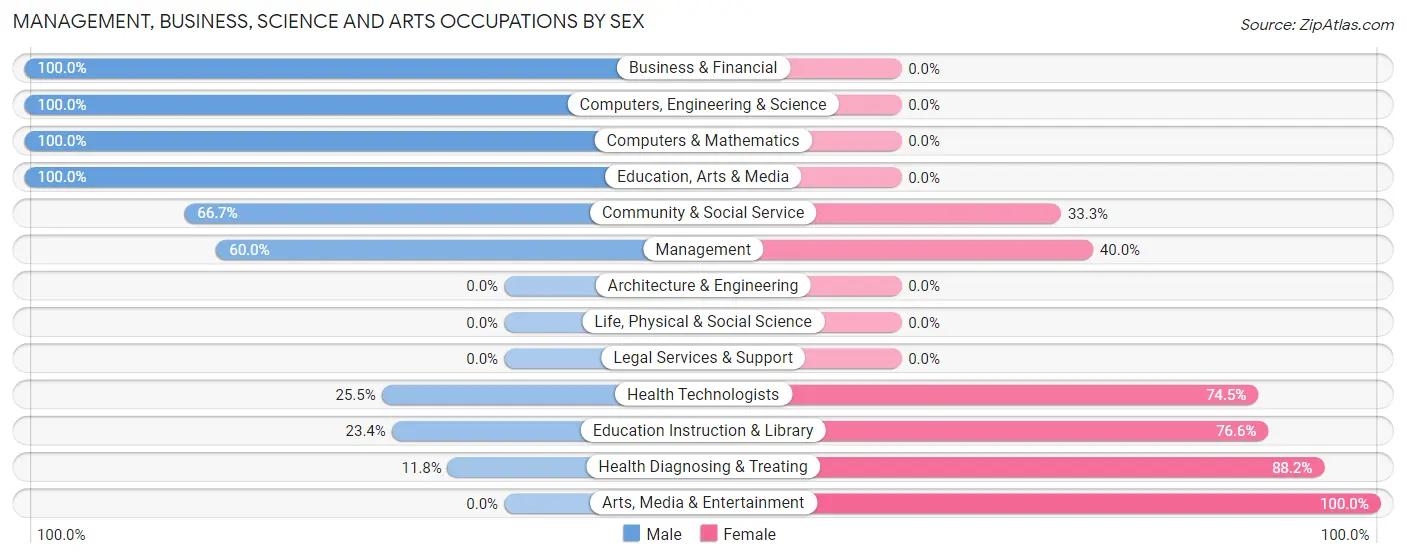
Management, Business, Science and Arts Occupations by Sex
Within the Management, Business, Science and Arts occupations in East Tawas, the most male-oriented occupations are Business & Financial (100.0%), Computers, Engineering & Science (100.0%), and Computers & Mathematics (100.0%), while the most female-oriented occupations are Arts, Media & Entertainment (100.0%), Health Diagnosing & Treating (88.2%), and Education Instruction & Library (76.6%).
| Occupation | Male | Female |
| Management | 27 (60.0%) | 18 (40.0%) |
| Business & Financial | 16 (100.0%) | 0 (0.0%) |
| Computers, Engineering & Science | 17 (100.0%) | 0 (0.0%) |
| Computers & Mathematics | 17 (100.0%) | 0 (0.0%) |
| Architecture & Engineering | 0 (0.0%) | 0 (0.0%) |
| Life, Physical & Social Science | 0 (0.0%) | 0 (0.0%) |
| Community & Social Service | 102 (66.7%) | 51 (33.3%) |
| Education, Arts & Media | 87 (100.0%) | 0 (0.0%) |
| Legal Services & Support | 0 (0.0%) | 0 (0.0%) |
| Education Instruction & Library | 15 (23.4%) | 49 (76.6%) |
| Arts, Media & Entertainment | 0 (0.0%) | 2 (100.0%) |
| Health Diagnosing & Treating | 12 (11.8%) | 90 (88.2%) |
| Health Technologists | 12 (25.5%) | 35 (74.5%) |
| Total (Category) | 174 (52.2%) | 159 (47.7%) |
| Total (Overall) | 474 (50.3%) | 469 (49.7%) |
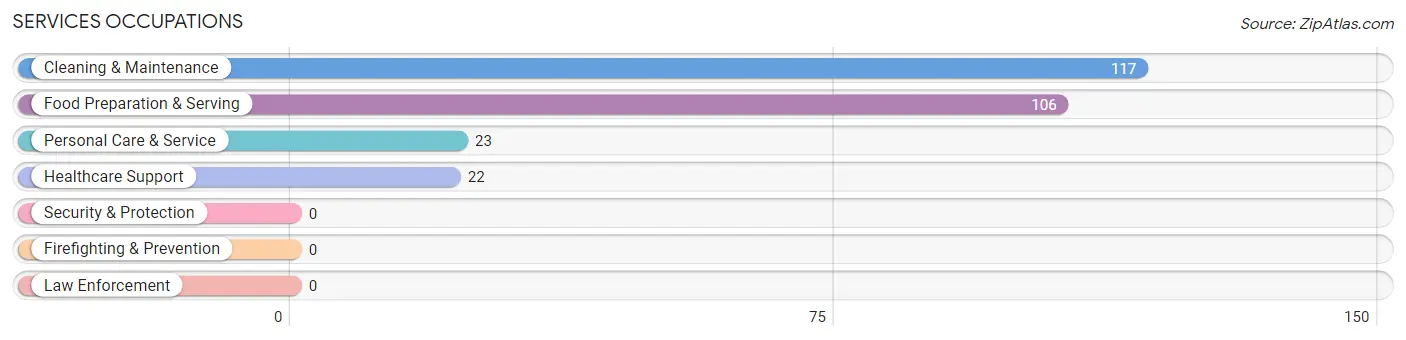
Services Occupations
The most common Services occupations in East Tawas are Cleaning & Maintenance (117 | 12.4%), Food Preparation & Serving (106 | 11.2%), Personal Care & Service (23 | 2.4%), and Healthcare Support (22 | 2.3%).
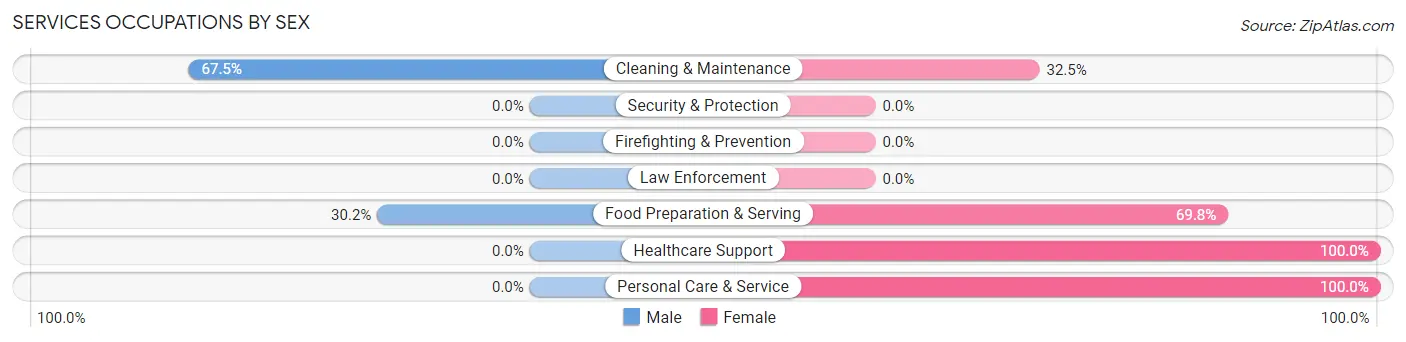
Services Occupations by Sex
Within the Services occupations in East Tawas, the most male-oriented occupations are Cleaning & Maintenance (67.5%), and Food Preparation & Serving (30.2%), while the most female-oriented occupations are Healthcare Support (100.0%), Personal Care & Service (100.0%), and Food Preparation & Serving (69.8%).
| Occupation | Male | Female |
| Healthcare Support | 0 (0.0%) | 22 (100.0%) |
| Security & Protection | 0 (0.0%) | 0 (0.0%) |
| Firefighting & Prevention | 0 (0.0%) | 0 (0.0%) |
| Law Enforcement | 0 (0.0%) | 0 (0.0%) |
| Food Preparation & Serving | 32 (30.2%) | 74 (69.8%) |
| Cleaning & Maintenance | 79 (67.5%) | 38 (32.5%) |
| Personal Care & Service | 0 (0.0%) | 23 (100.0%) |
| Total (Category) | 111 (41.4%) | 157 (58.6%) |
| Total (Overall) | 474 (50.3%) | 469 (49.7%) |
Sales and Office Occupations
The most common Sales and Office occupations in East Tawas are Office & Administration (120 | 12.7%), and Sales & Related (47 | 5.0%).
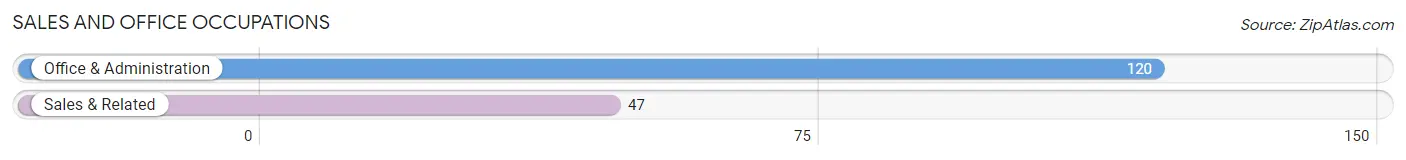
Sales and Office Occupations by Sex

| Occupation | Male | Female |
| Sales & Related | 14 (29.8%) | 33 (70.2%) |
| Office & Administration | 0 (0.0%) | 120 (100.0%) |
| Total (Category) | 14 (8.4%) | 153 (91.6%) |
| Total (Overall) | 474 (50.3%) | 469 (49.7%) |
Natural Resources, Construction and Maintenance Occupations
The most common Natural Resources, Construction and Maintenance occupations in East Tawas are Installation, Maintenance & Repair (81 | 8.6%), and Construction & Extraction (12 | 1.3%).
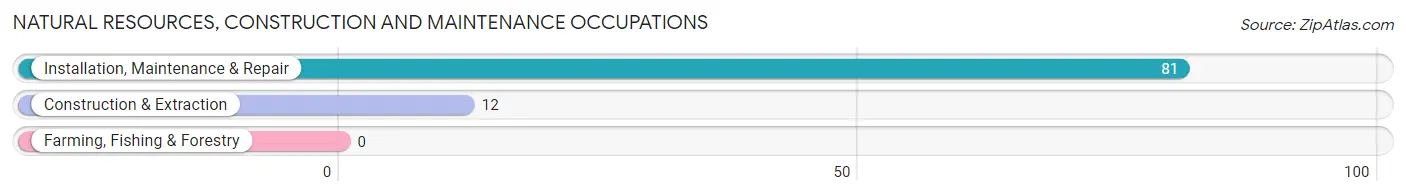
Natural Resources, Construction and Maintenance Occupations by Sex
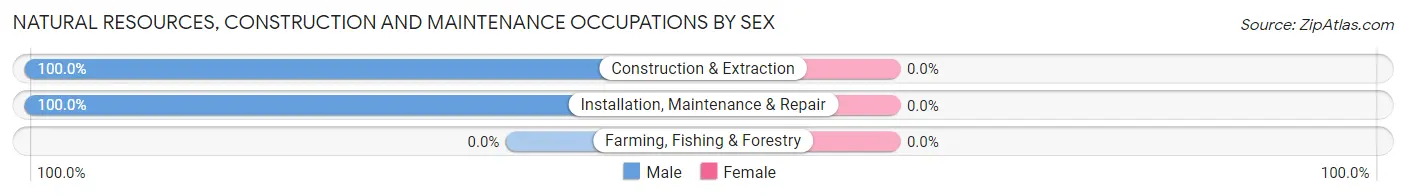
| Occupation | Male | Female |
| Farming, Fishing & Forestry | 0 (0.0%) | 0 (0.0%) |
| Construction & Extraction | 12 (100.0%) | 0 (0.0%) |
| Installation, Maintenance & Repair | 81 (100.0%) | 0 (0.0%) |
| Total (Category) | 93 (100.0%) | 0 (0.0%) |
| Total (Overall) | 474 (50.3%) | 469 (49.7%) |
Production, Transportation and Moving Occupations
The most common Production, Transportation and Moving occupations in East Tawas are Production (59 | 6.3%), and Transportation (23 | 2.4%).
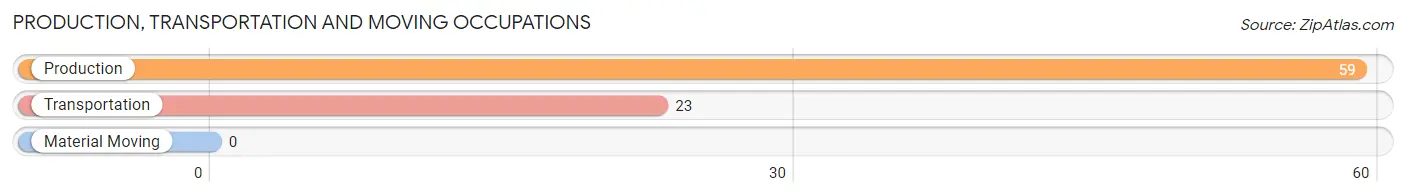
Production, Transportation and Moving Occupations by Sex
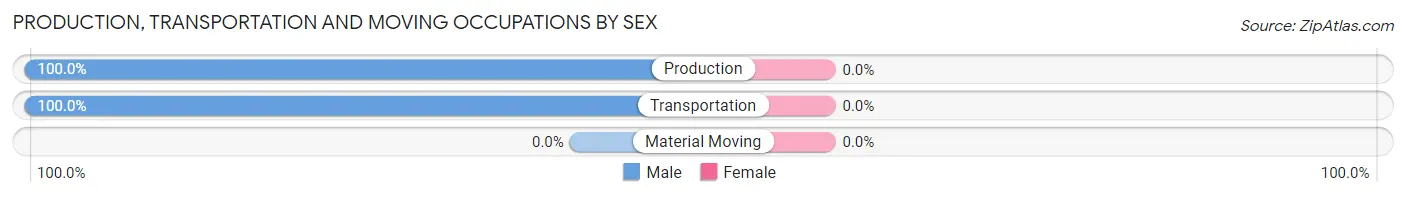
| Occupation | Male | Female |
| Production | 59 (100.0%) | 0 (0.0%) |
| Transportation | 23 (100.0%) | 0 (0.0%) |
| Material Moving | 0 (0.0%) | 0 (0.0%) |
| Total (Category) | 82 (100.0%) | 0 (0.0%) |
| Total (Overall) | 474 (50.3%) | 469 (49.7%) |
Employment Industries by Sex in East Tawas
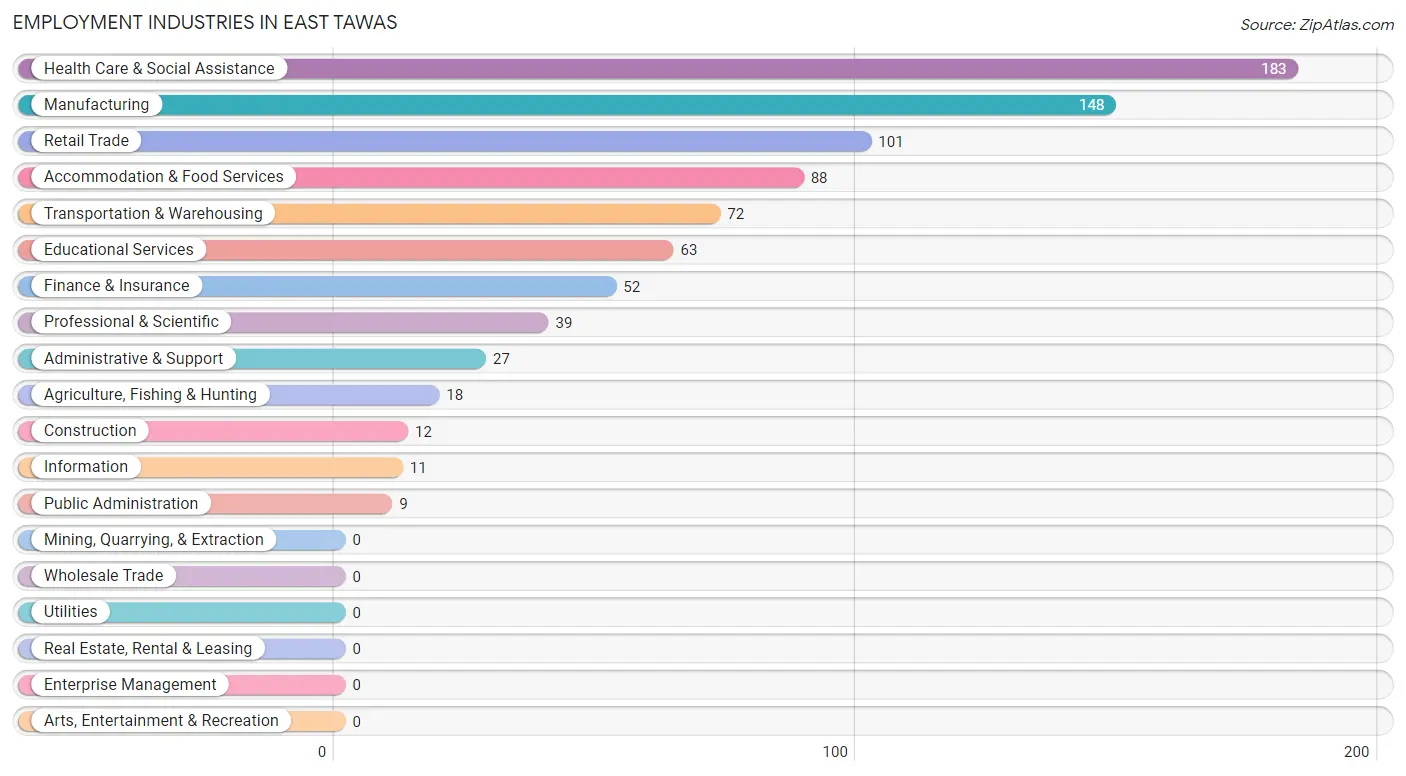
Employment Industries in East Tawas
The major employment industries in East Tawas include Health Care & Social Assistance (183 | 19.4%), Manufacturing (148 | 15.7%), Retail Trade (101 | 10.7%), Accommodation & Food Services (88 | 9.3%), and Transportation & Warehousing (72 | 7.6%).
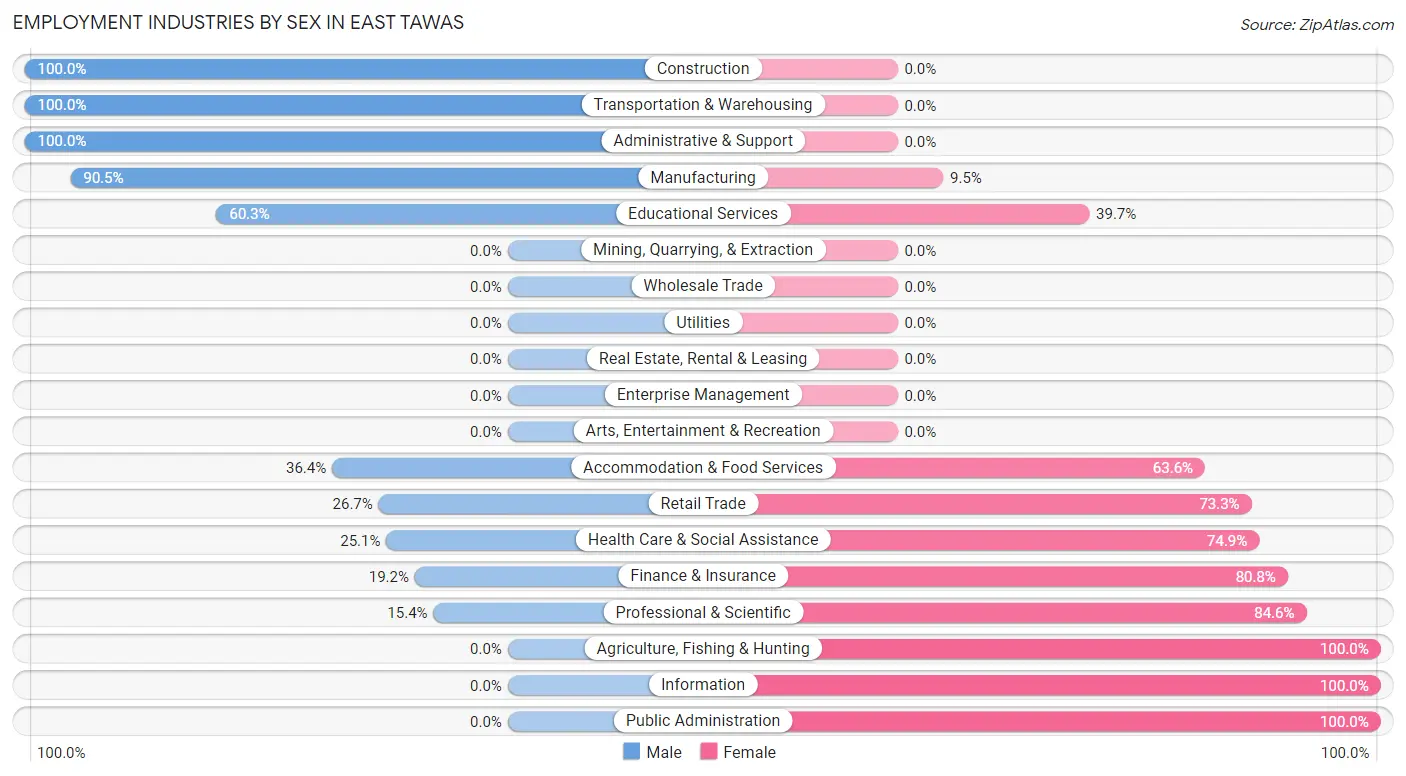
Employment Industries by Sex in East Tawas
The East Tawas industries that see more men than women are Construction (100.0%), Transportation & Warehousing (100.0%), and Administrative & Support (100.0%), whereas the industries that tend to have a higher number of women are Agriculture, Fishing & Hunting (100.0%), Information (100.0%), and Public Administration (100.0%).
| Industry | Male | Female |
| Agriculture, Fishing & Hunting | 0 (0.0%) | 18 (100.0%) |
| Mining, Quarrying, & Extraction | 0 (0.0%) | 0 (0.0%) |
| Construction | 12 (100.0%) | 0 (0.0%) |
| Manufacturing | 134 (90.5%) | 14 (9.5%) |
| Wholesale Trade | 0 (0.0%) | 0 (0.0%) |
| Retail Trade | 27 (26.7%) | 74 (73.3%) |
| Transportation & Warehousing | 72 (100.0%) | 0 (0.0%) |
| Utilities | 0 (0.0%) | 0 (0.0%) |
| Information | 0 (0.0%) | 11 (100.0%) |
| Finance & Insurance | 10 (19.2%) | 42 (80.8%) |
| Real Estate, Rental & Leasing | 0 (0.0%) | 0 (0.0%) |
| Professional & Scientific | 6 (15.4%) | 33 (84.6%) |
| Enterprise Management | 0 (0.0%) | 0 (0.0%) |
| Administrative & Support | 27 (100.0%) | 0 (0.0%) |
| Educational Services | 38 (60.3%) | 25 (39.7%) |
| Health Care & Social Assistance | 46 (25.1%) | 137 (74.9%) |
| Arts, Entertainment & Recreation | 0 (0.0%) | 0 (0.0%) |
| Accommodation & Food Services | 32 (36.4%) | 56 (63.6%) |
| Public Administration | 0 (0.0%) | 9 (100.0%) |
| Total | 474 (50.3%) | 469 (49.7%) |
Education in East Tawas
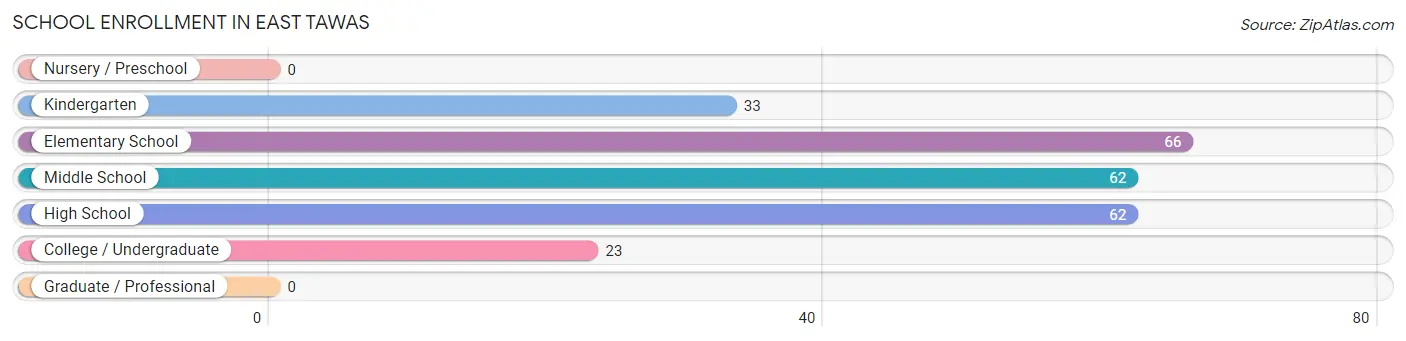
School Enrollment in East Tawas
The most common levels of schooling among the 246 students in East Tawas are elementary school (66 | 26.8%), middle school (62 | 25.2%), and high school (62 | 25.2%).
| School Level | # Students | % Students |
| Nursery / Preschool | 0 | 0.0% |
| Kindergarten | 33 | 13.4% |
| Elementary School | 66 | 26.8% |
| Middle School | 62 | 25.2% |
| High School | 62 | 25.2% |
| College / Undergraduate | 23 | 9.3% |
| Graduate / Professional | 0 | 0.0% |
| Total | 246 | 100.0% |
School Enrollment by Age by Funding Source in East Tawas
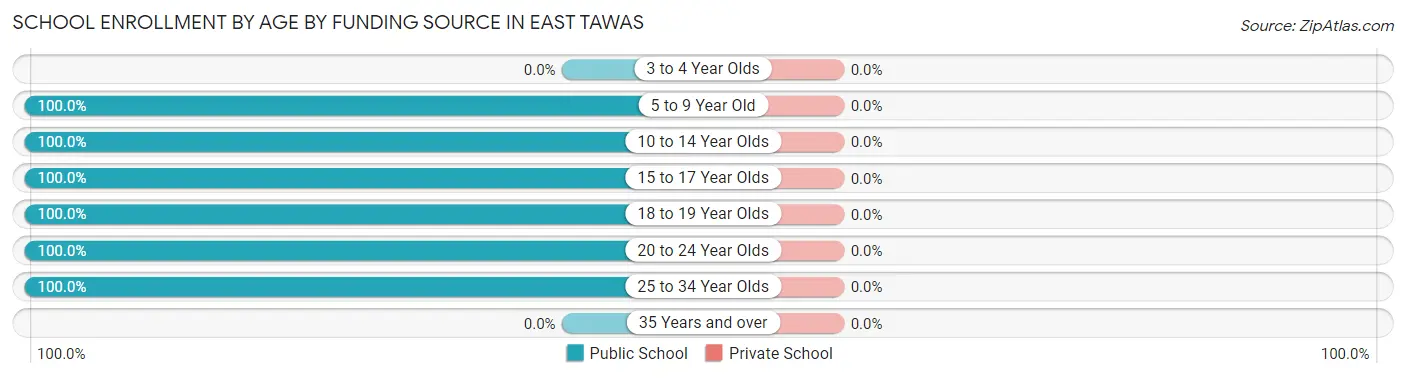
| Age Bracket | Public School | Private School |
| 3 to 4 Year Olds | 0 (0.0%) | 0 (0.0%) |
| 5 to 9 Year Old | 99 (100.0%) | 0 (0.0%) |
| 10 to 14 Year Olds | 62 (100.0%) | 0 (0.0%) |
| 15 to 17 Year Olds | 52 (100.0%) | 0 (0.0%) |
| 18 to 19 Year Olds | 10 (100.0%) | 0 (0.0%) |
| 20 to 24 Year Olds | 14 (100.0%) | 0 (0.0%) |
| 25 to 34 Year Olds | 9 (100.0%) | 0 (0.0%) |
| 35 Years and over | 0 (0.0%) | 0 (0.0%) |
| Total | 246 (100.0%) | 0 (0.0%) |
Educational Attainment by Field of Study in East Tawas
Education (129 | 29.0%), science & technology (68 | 15.3%), bio, nature & agricultural (55 | 12.4%), business (55 | 12.4%), and computers & mathematics (41 | 9.2%) are the most common fields of study among 445 individuals in East Tawas who have obtained a bachelor's degree or higher.
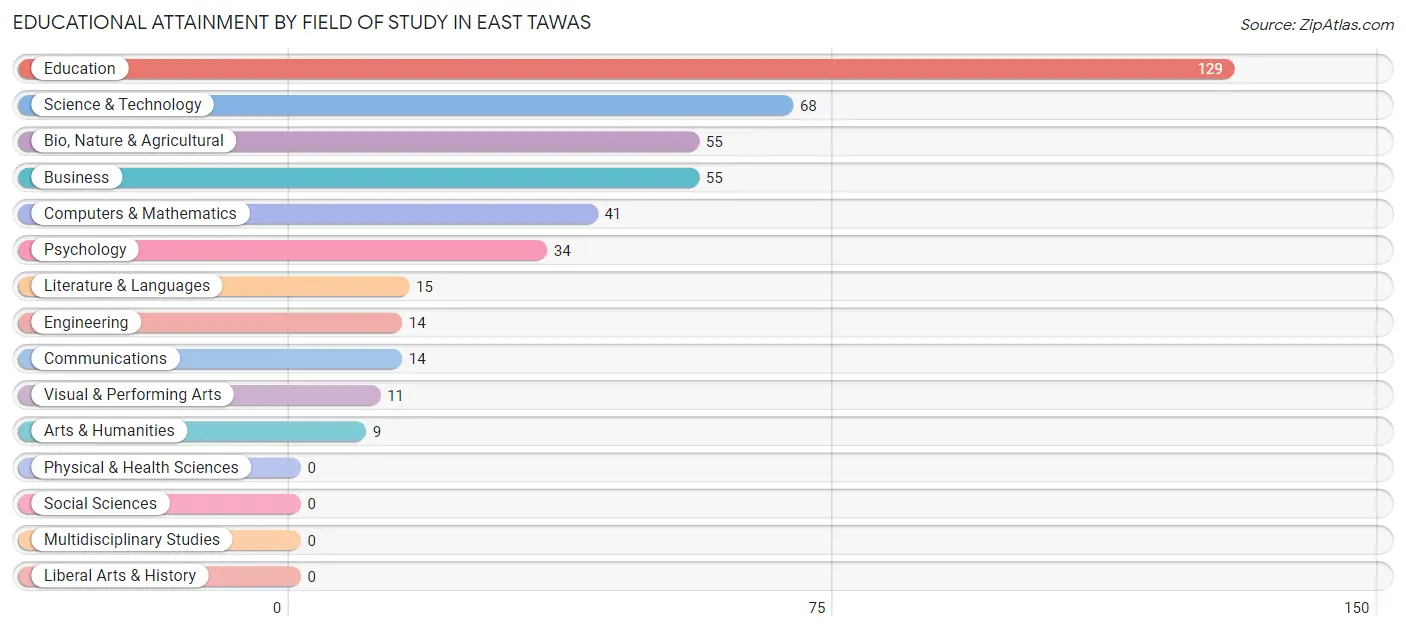
| Field of Study | # Graduates | % Graduates |
| Computers & Mathematics | 41 | 9.2% |
| Bio, Nature & Agricultural | 55 | 12.4% |
| Physical & Health Sciences | 0 | 0.0% |
| Psychology | 34 | 7.6% |
| Social Sciences | 0 | 0.0% |
| Engineering | 14 | 3.2% |
| Multidisciplinary Studies | 0 | 0.0% |
| Science & Technology | 68 | 15.3% |
| Business | 55 | 12.4% |
| Education | 129 | 29.0% |
| Literature & Languages | 15 | 3.4% |
| Liberal Arts & History | 0 | 0.0% |
| Visual & Performing Arts | 11 | 2.5% |
| Communications | 14 | 3.2% |
| Arts & Humanities | 9 | 2.0% |
| Total | 445 | 100.0% |
Transportation & Commute in East Tawas
Vehicle Availability by Sex in East Tawas
The most prevalent vehicle ownership categories in East Tawas are males with 2 vehicles (234, accounting for 49.4%) and females with 2 vehicles (198, making up 51.4%).
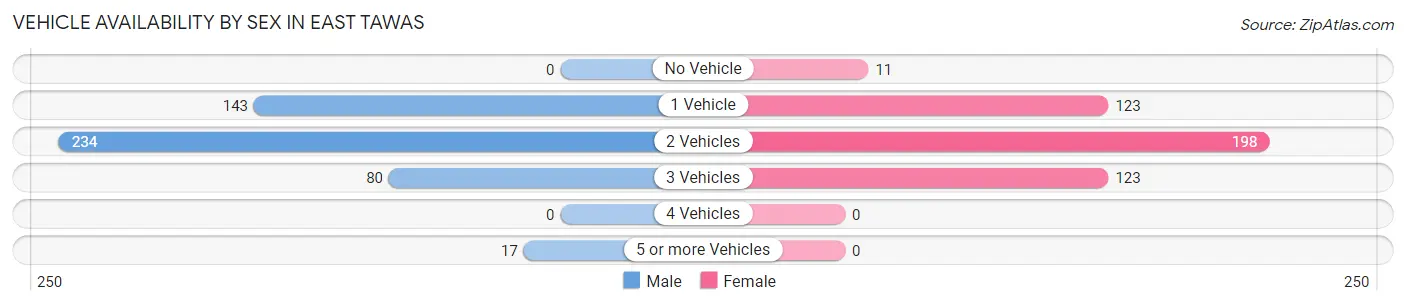
| Vehicles Available | Male | Female |
| No Vehicle | 0 (0.0%) | 11 (2.4%) |
| 1 Vehicle | 143 (30.2%) | 123 (27.0%) |
| 2 Vehicles | 234 (49.4%) | 198 (43.5%) |
| 3 Vehicles | 80 (16.9%) | 123 (27.0%) |
| 4 Vehicles | 0 (0.0%) | 0 (0.0%) |
| 5 or more Vehicles | 17 (3.6%) | 0 (0.0%) |
| Total | 474 (100.0%) | 455 (100.0%) |
Commute Time in East Tawas
The most frequently occuring commute durations in East Tawas are 5 to 9 minutes (388 commuters, 42.4%), 10 to 14 minutes (236 commuters, 25.8%), and less than 5 minutes (89 commuters, 9.7%).
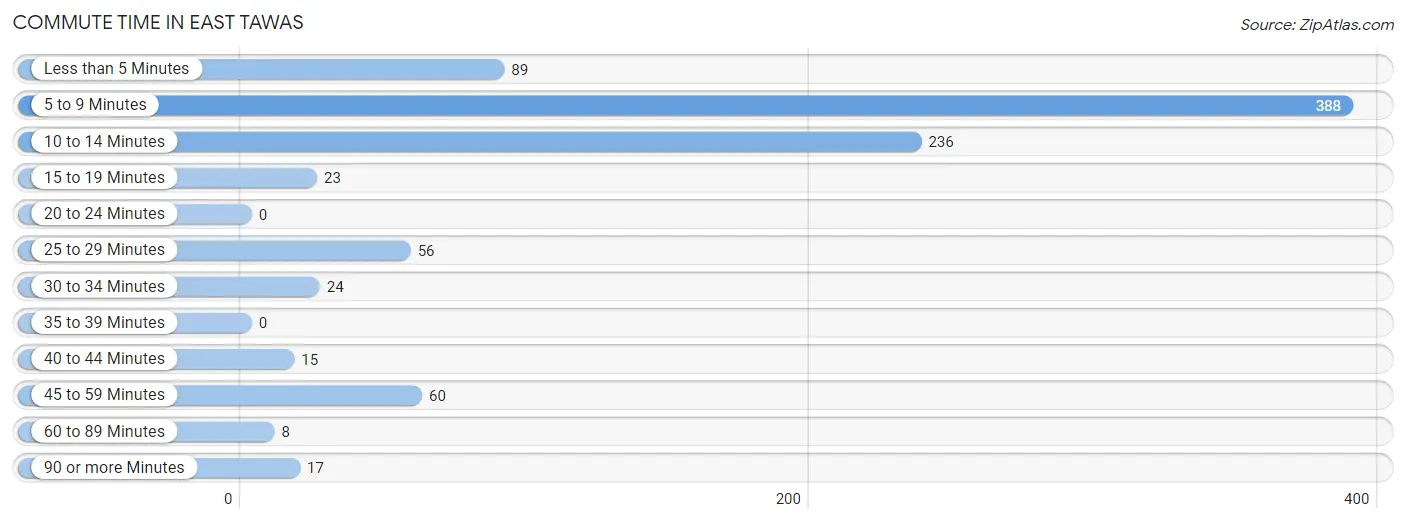
| Commute Time | # Commuters | % Commuters |
| Less than 5 Minutes | 89 | 9.7% |
| 5 to 9 Minutes | 388 | 42.4% |
| 10 to 14 Minutes | 236 | 25.8% |
| 15 to 19 Minutes | 23 | 2.5% |
| 20 to 24 Minutes | 0 | 0.0% |
| 25 to 29 Minutes | 56 | 6.1% |
| 30 to 34 Minutes | 24 | 2.6% |
| 35 to 39 Minutes | 0 | 0.0% |
| 40 to 44 Minutes | 15 | 1.6% |
| 45 to 59 Minutes | 60 | 6.6% |
| 60 to 89 Minutes | 8 | 0.9% |
| 90 or more Minutes | 17 | 1.9% |
Commute Time by Sex in East Tawas
The most common commute times in East Tawas are 5 to 9 minutes (185 commuters, 39.0%) for males and 5 to 9 minutes (203 commuters, 45.9%) for females.
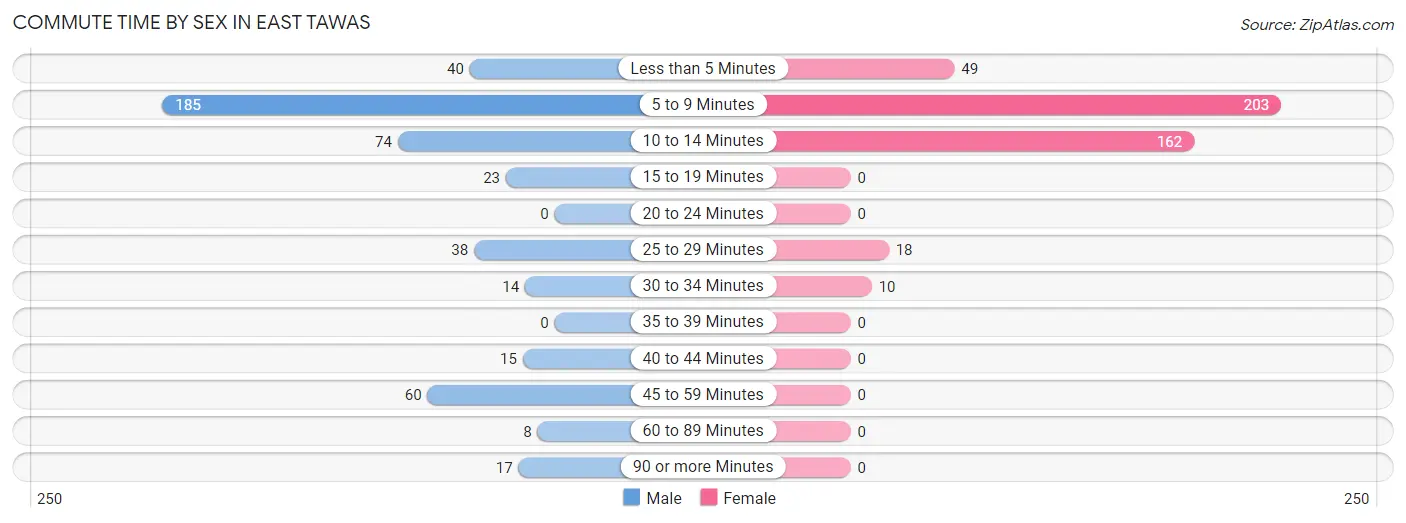
| Commute Time | Male | Female |
| Less than 5 Minutes | 40 (8.4%) | 49 (11.1%) |
| 5 to 9 Minutes | 185 (39.0%) | 203 (45.9%) |
| 10 to 14 Minutes | 74 (15.6%) | 162 (36.6%) |
| 15 to 19 Minutes | 23 (4.9%) | 0 (0.0%) |
| 20 to 24 Minutes | 0 (0.0%) | 0 (0.0%) |
| 25 to 29 Minutes | 38 (8.0%) | 18 (4.1%) |
| 30 to 34 Minutes | 14 (2.9%) | 10 (2.3%) |
| 35 to 39 Minutes | 0 (0.0%) | 0 (0.0%) |
| 40 to 44 Minutes | 15 (3.2%) | 0 (0.0%) |
| 45 to 59 Minutes | 60 (12.7%) | 0 (0.0%) |
| 60 to 89 Minutes | 8 (1.7%) | 0 (0.0%) |
| 90 or more Minutes | 17 (3.6%) | 0 (0.0%) |
Time of Departure to Work by Sex in East Tawas
The most frequent times of departure to work in East Tawas are 6:00 AM to 6:29 AM (113, 23.8%) for males and 8:00 AM to 8:29 AM (89, 20.1%) for females.
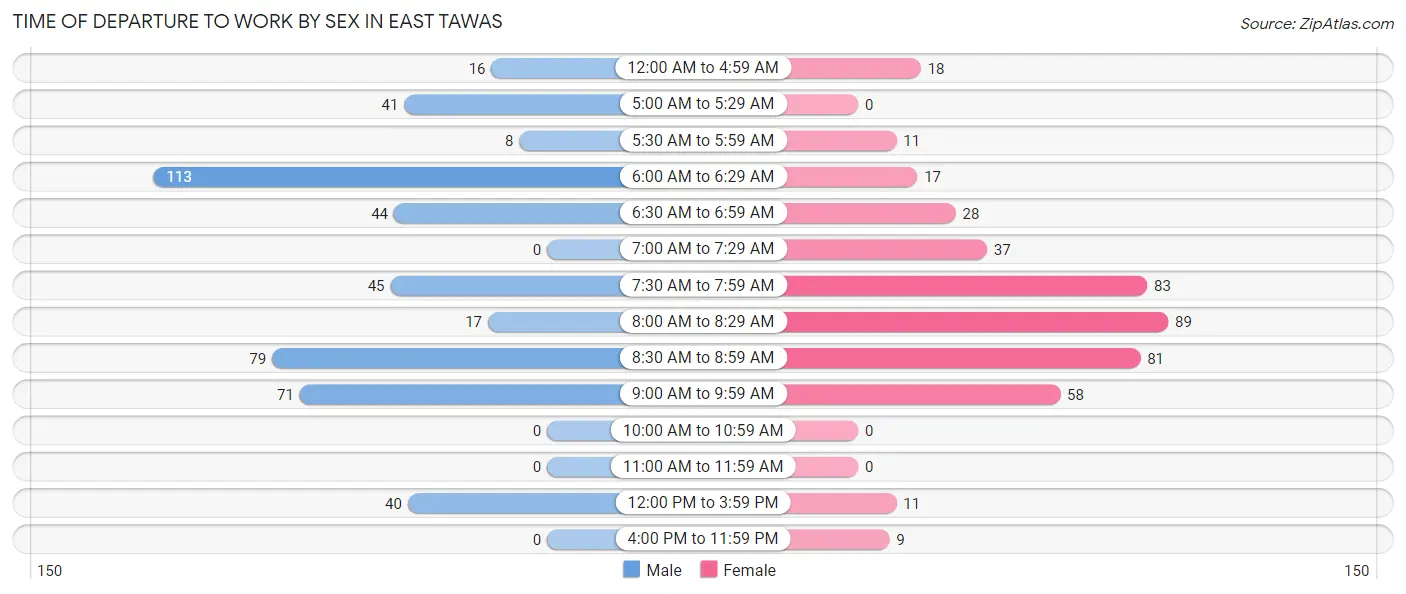
| Time of Departure | Male | Female |
| 12:00 AM to 4:59 AM | 16 (3.4%) | 18 (4.1%) |
| 5:00 AM to 5:29 AM | 41 (8.6%) | 0 (0.0%) |
| 5:30 AM to 5:59 AM | 8 (1.7%) | 11 (2.5%) |
| 6:00 AM to 6:29 AM | 113 (23.8%) | 17 (3.8%) |
| 6:30 AM to 6:59 AM | 44 (9.3%) | 28 (6.3%) |
| 7:00 AM to 7:29 AM | 0 (0.0%) | 37 (8.4%) |
| 7:30 AM to 7:59 AM | 45 (9.5%) | 83 (18.8%) |
| 8:00 AM to 8:29 AM | 17 (3.6%) | 89 (20.1%) |
| 8:30 AM to 8:59 AM | 79 (16.7%) | 81 (18.3%) |
| 9:00 AM to 9:59 AM | 71 (15.0%) | 58 (13.1%) |
| 10:00 AM to 10:59 AM | 0 (0.0%) | 0 (0.0%) |
| 11:00 AM to 11:59 AM | 0 (0.0%) | 0 (0.0%) |
| 12:00 PM to 3:59 PM | 40 (8.4%) | 11 (2.5%) |
| 4:00 PM to 11:59 PM | 0 (0.0%) | 9 (2.0%) |
| Total | 474 (100.0%) | 442 (100.0%) |
Housing Occupancy in East Tawas
Occupancy by Ownership in East Tawas
Of the total 1,488 dwellings in East Tawas, owner-occupied units account for 992 (66.7%), while renter-occupied units make up 496 (33.3%).
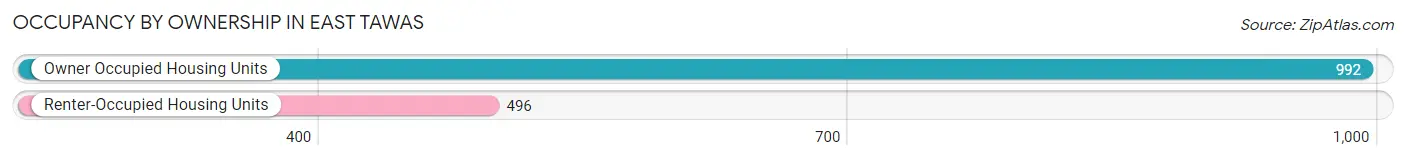
| Occupancy | # Housing Units | % Housing Units |
| Owner Occupied Housing Units | 992 | 66.7% |
| Renter-Occupied Housing Units | 496 | 33.3% |
| Total Occupied Housing Units | 1,488 | 100.0% |
Occupancy by Household Size in East Tawas
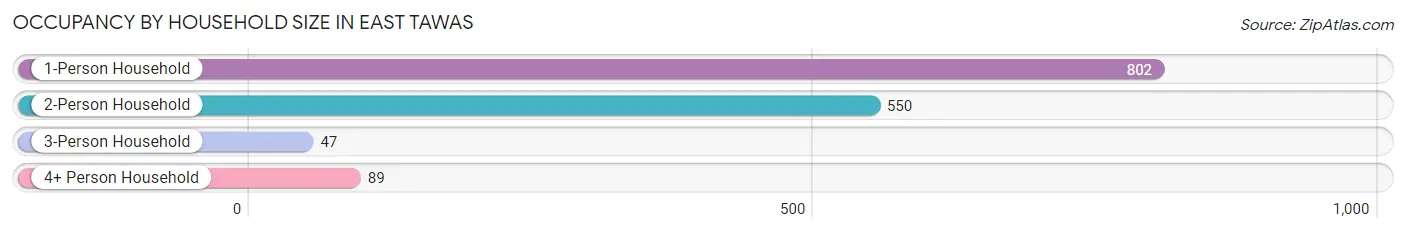
| Household Size | # Housing Units | % Housing Units |
| 1-Person Household | 802 | 53.9% |
| 2-Person Household | 550 | 37.0% |
| 3-Person Household | 47 | 3.2% |
| 4+ Person Household | 89 | 6.0% |
| Total Housing Units | 1,488 | 100.0% |
Occupancy by Ownership by Household Size in East Tawas
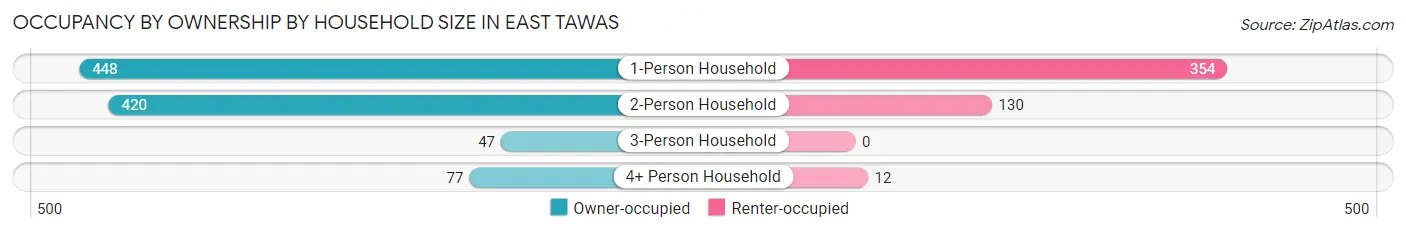
| Household Size | Owner-occupied | Renter-occupied |
| 1-Person Household | 448 (55.9%) | 354 (44.1%) |
| 2-Person Household | 420 (76.4%) | 130 (23.6%) |
| 3-Person Household | 47 (100.0%) | 0 (0.0%) |
| 4+ Person Household | 77 (86.5%) | 12 (13.5%) |
| Total Housing Units | 992 (66.7%) | 496 (33.3%) |
Occupancy by Educational Attainment in East Tawas
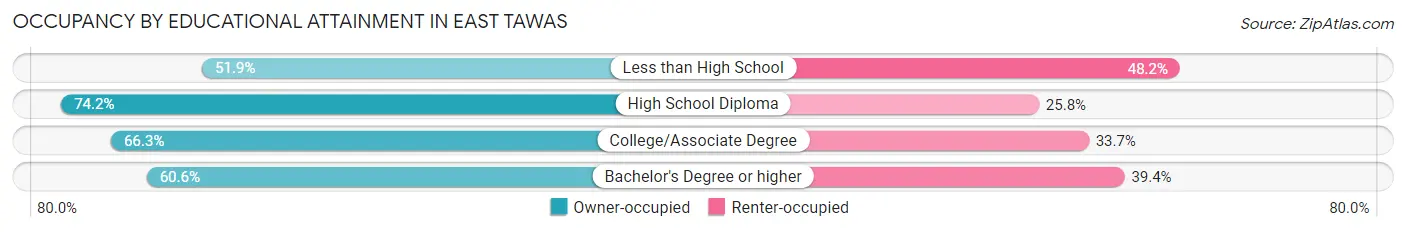
| Household Size | Owner-occupied | Renter-occupied |
| Less than High School | 28 (51.8%) | 26 (48.1%) |
| High School Diploma | 296 (74.2%) | 103 (25.8%) |
| College/Associate Degree | 474 (66.3%) | 241 (33.7%) |
| Bachelor's Degree or higher | 194 (60.6%) | 126 (39.4%) |
Occupancy by Age of Householder in East Tawas
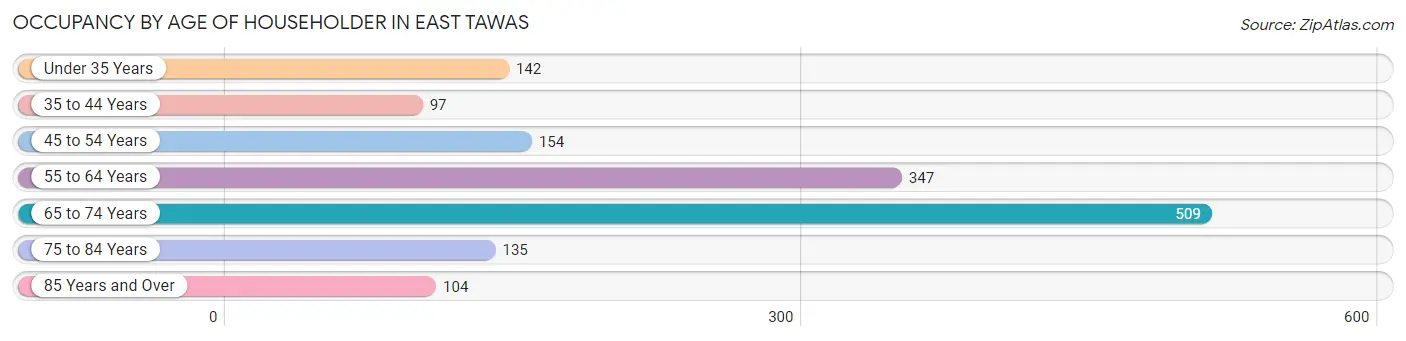
| Age Bracket | # Households | % Households |
| Under 35 Years | 142 | 9.5% |
| 35 to 44 Years | 97 | 6.5% |
| 45 to 54 Years | 154 | 10.3% |
| 55 to 64 Years | 347 | 23.3% |
| 65 to 74 Years | 509 | 34.2% |
| 75 to 84 Years | 135 | 9.1% |
| 85 Years and Over | 104 | 7.0% |
| Total | 1,488 | 100.0% |
Housing Finances in East Tawas
Median Income by Occupancy in East Tawas
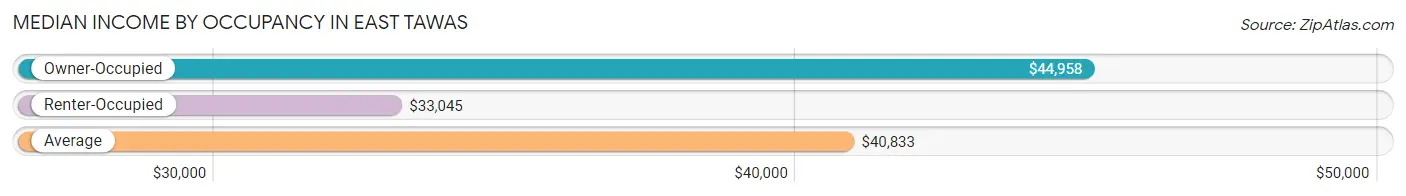
| Occupancy Type | # Households | Median Income |
| Owner-Occupied | 992 (66.7%) | $44,958 |
| Renter-Occupied | 496 (33.3%) | $33,045 |
| Average | 1,488 (100.0%) | $40,833 |
Occupancy by Householder Income Bracket in East Tawas
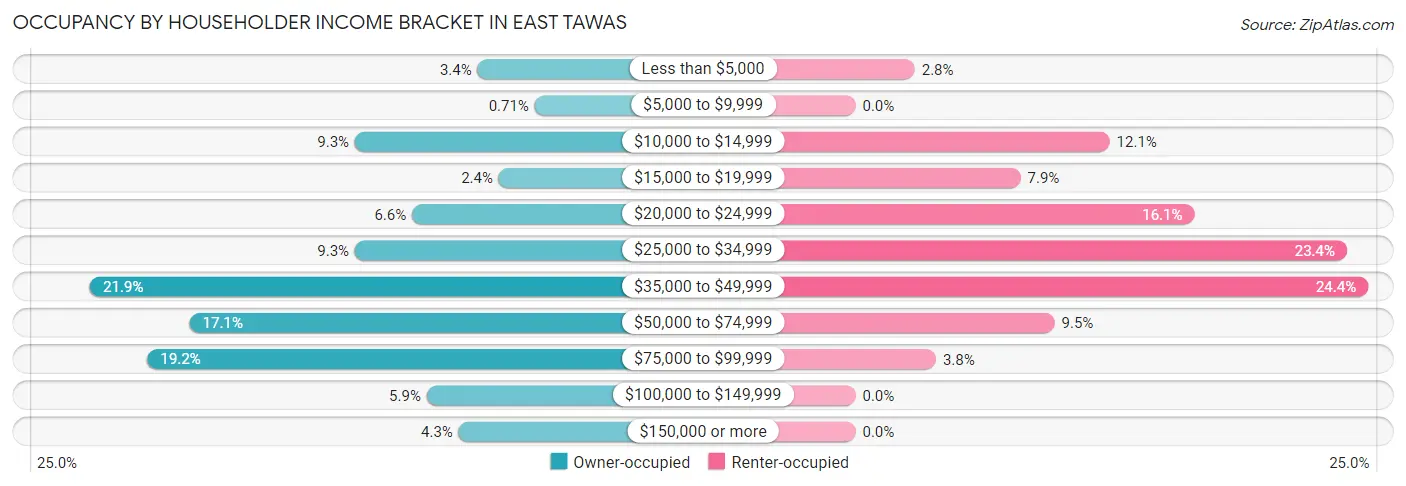
| Income Bracket | Owner-occupied | Renter-occupied |
| Less than $5,000 | 34 (3.4%) | 14 (2.8%) |
| $5,000 to $9,999 | 7 (0.7%) | 0 (0.0%) |
| $10,000 to $14,999 | 92 (9.3%) | 60 (12.1%) |
| $15,000 to $19,999 | 24 (2.4%) | 39 (7.9%) |
| $20,000 to $24,999 | 65 (6.6%) | 80 (16.1%) |
| $25,000 to $34,999 | 92 (9.3%) | 116 (23.4%) |
| $35,000 to $49,999 | 217 (21.9%) | 121 (24.4%) |
| $50,000 to $74,999 | 170 (17.1%) | 47 (9.5%) |
| $75,000 to $99,999 | 190 (19.2%) | 19 (3.8%) |
| $100,000 to $149,999 | 58 (5.9%) | 0 (0.0%) |
| $150,000 or more | 43 (4.3%) | 0 (0.0%) |
| Total | 992 (100.0%) | 496 (100.0%) |
Monthly Housing Cost Tiers in East Tawas
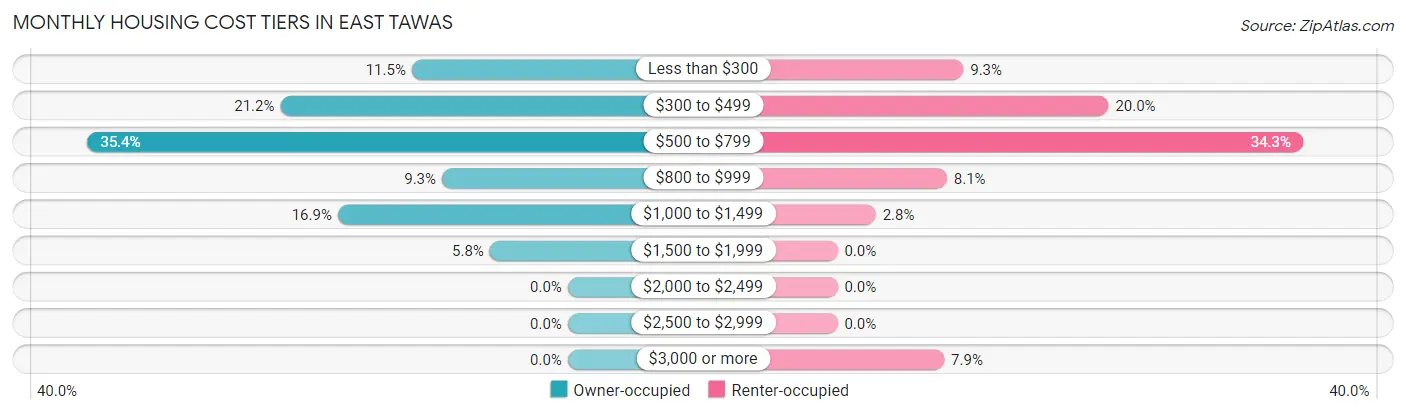
| Monthly Cost | Owner-occupied | Renter-occupied |
| Less than $300 | 114 (11.5%) | 46 (9.3%) |
| $300 to $499 | 210 (21.2%) | 99 (20.0%) |
| $500 to $799 | 351 (35.4%) | 170 (34.3%) |
| $800 to $999 | 92 (9.3%) | 40 (8.1%) |
| $1,000 to $1,499 | 168 (16.9%) | 14 (2.8%) |
| $1,500 to $1,999 | 57 (5.8%) | 0 (0.0%) |
| $2,000 to $2,499 | 0 (0.0%) | 0 (0.0%) |
| $2,500 to $2,999 | 0 (0.0%) | 0 (0.0%) |
| $3,000 or more | 0 (0.0%) | 39 (7.9%) |
| Total | 992 (100.0%) | 496 (100.0%) |
Physical Housing Characteristics in East Tawas
Housing Structures in East Tawas
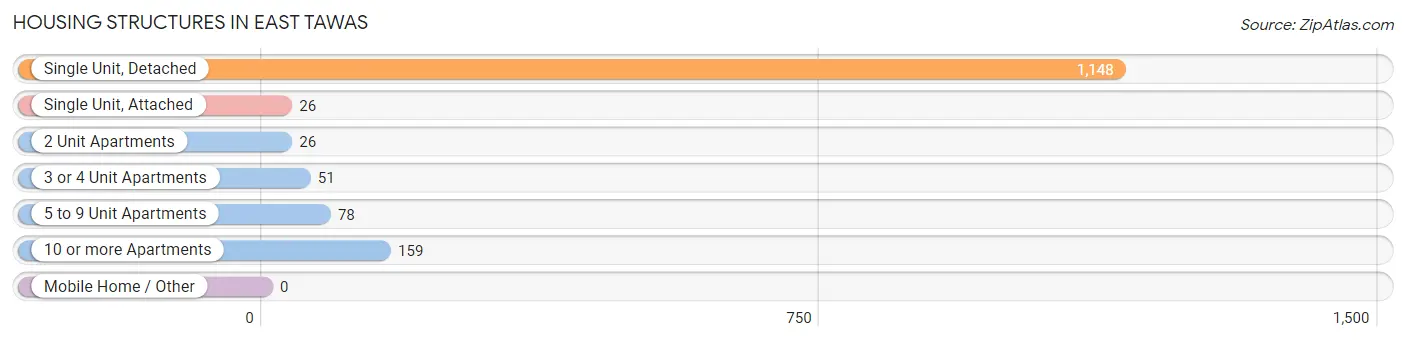
| Structure Type | # Housing Units | % Housing Units |
| Single Unit, Detached | 1,148 | 77.1% |
| Single Unit, Attached | 26 | 1.8% |
| 2 Unit Apartments | 26 | 1.8% |
| 3 or 4 Unit Apartments | 51 | 3.4% |
| 5 to 9 Unit Apartments | 78 | 5.2% |
| 10 or more Apartments | 159 | 10.7% |
| Mobile Home / Other | 0 | 0.0% |
| Total | 1,488 | 100.0% |
Housing Structures by Occupancy in East Tawas
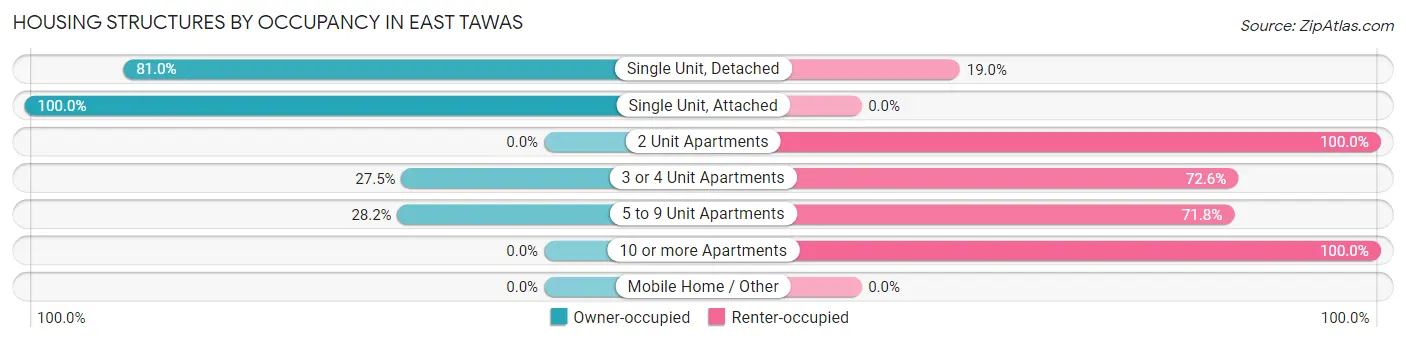
| Structure Type | Owner-occupied | Renter-occupied |
| Single Unit, Detached | 930 (81.0%) | 218 (19.0%) |
| Single Unit, Attached | 26 (100.0%) | 0 (0.0%) |
| 2 Unit Apartments | 0 (0.0%) | 26 (100.0%) |
| 3 or 4 Unit Apartments | 14 (27.5%) | 37 (72.6%) |
| 5 to 9 Unit Apartments | 22 (28.2%) | 56 (71.8%) |
| 10 or more Apartments | 0 (0.0%) | 159 (100.0%) |
| Mobile Home / Other | 0 (0.0%) | 0 (0.0%) |
| Total | 992 (66.7%) | 496 (33.3%) |
Housing Structures by Number of Rooms in East Tawas
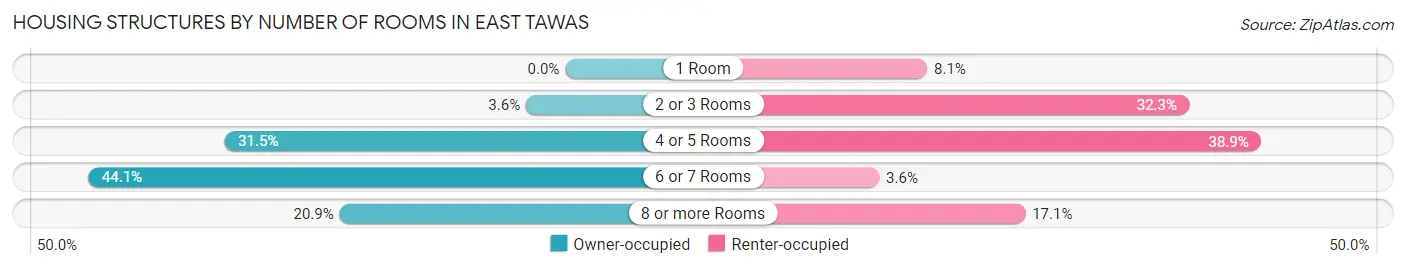
| Number of Rooms | Owner-occupied | Renter-occupied |
| 1 Room | 0 (0.0%) | 40 (8.1%) |
| 2 or 3 Rooms | 36 (3.6%) | 160 (32.3%) |
| 4 or 5 Rooms | 312 (31.5%) | 193 (38.9%) |
| 6 or 7 Rooms | 437 (44.1%) | 18 (3.6%) |
| 8 or more Rooms | 207 (20.9%) | 85 (17.1%) |
| Total | 992 (100.0%) | 496 (100.0%) |
Housing Structure by Heating Type in East Tawas
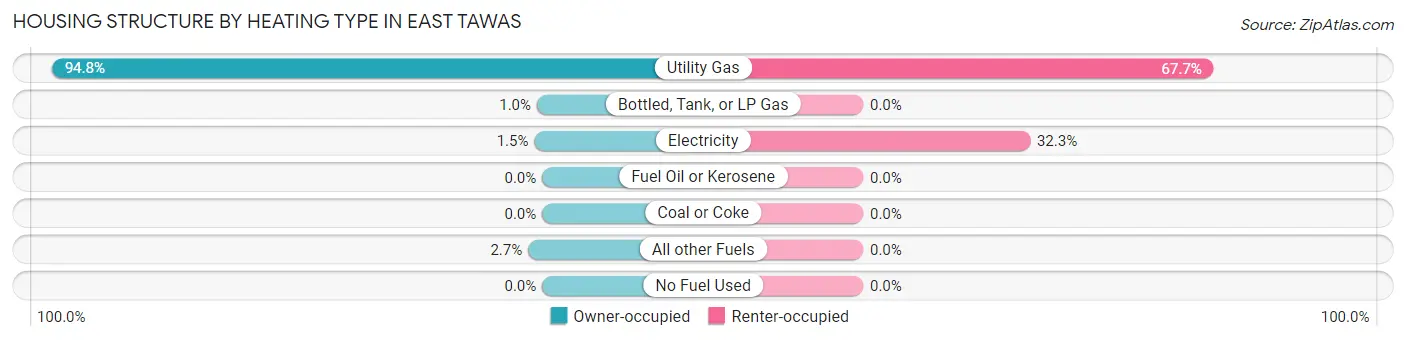
| Heating Type | Owner-occupied | Renter-occupied |
| Utility Gas | 940 (94.8%) | 336 (67.7%) |
| Bottled, Tank, or LP Gas | 10 (1.0%) | 0 (0.0%) |
| Electricity | 15 (1.5%) | 160 (32.3%) |
| Fuel Oil or Kerosene | 0 (0.0%) | 0 (0.0%) |
| Coal or Coke | 0 (0.0%) | 0 (0.0%) |
| All other Fuels | 27 (2.7%) | 0 (0.0%) |
| No Fuel Used | 0 (0.0%) | 0 (0.0%) |
| Total | 992 (100.0%) | 496 (100.0%) |
Household Vehicle Usage in East Tawas
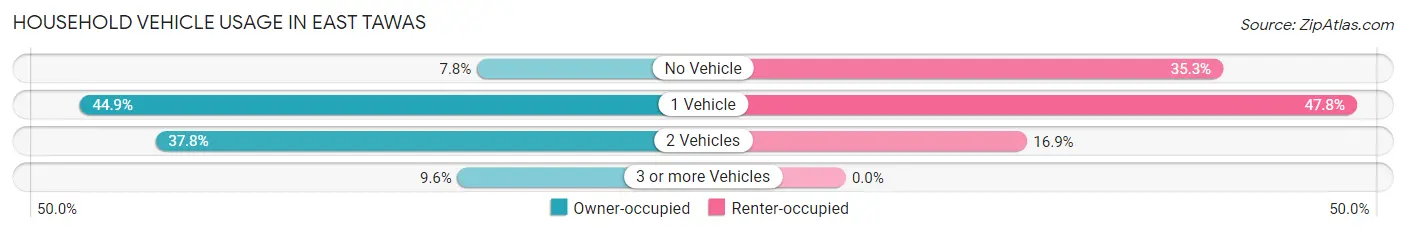
| Vehicles per Household | Owner-occupied | Renter-occupied |
| No Vehicle | 77 (7.8%) | 175 (35.3%) |
| 1 Vehicle | 445 (44.9%) | 237 (47.8%) |
| 2 Vehicles | 375 (37.8%) | 84 (16.9%) |
| 3 or more Vehicles | 95 (9.6%) | 0 (0.0%) |
| Total | 992 (100.0%) | 496 (100.0%) |
Real Estate & Mortgages in East Tawas
Real Estate and Mortgage Overview in East Tawas
| Characteristic | Without Mortgage | With Mortgage |
| Housing Units | 471 | 521 |
| Median Property Value | $98,600 | $109,200 |
| Median Household Income | $36,287 | $9 |
| Monthly Housing Costs | $396 | $0 |
| Real Estate Taxes | $1,337 | $43 |
Property Value by Mortgage Status in East Tawas
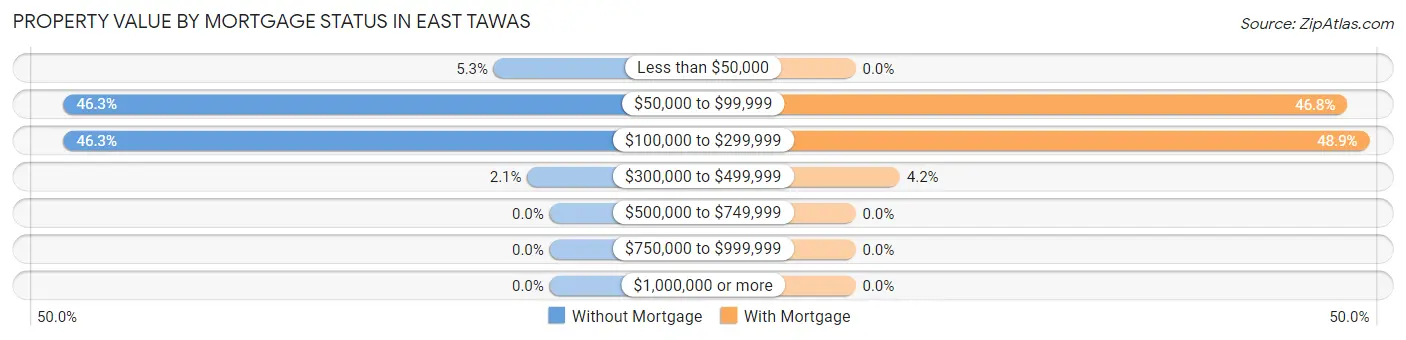
| Property Value | Without Mortgage | With Mortgage |
| Less than $50,000 | 25 (5.3%) | 0 (0.0%) |
| $50,000 to $99,999 | 218 (46.3%) | 244 (46.8%) |
| $100,000 to $299,999 | 218 (46.3%) | 255 (48.9%) |
| $300,000 to $499,999 | 10 (2.1%) | 22 (4.2%) |
| $500,000 to $749,999 | 0 (0.0%) | 0 (0.0%) |
| $750,000 to $999,999 | 0 (0.0%) | 0 (0.0%) |
| $1,000,000 or more | 0 (0.0%) | 0 (0.0%) |
| Total | 471 (100.0%) | 521 (100.0%) |
Household Income by Mortgage Status in East Tawas
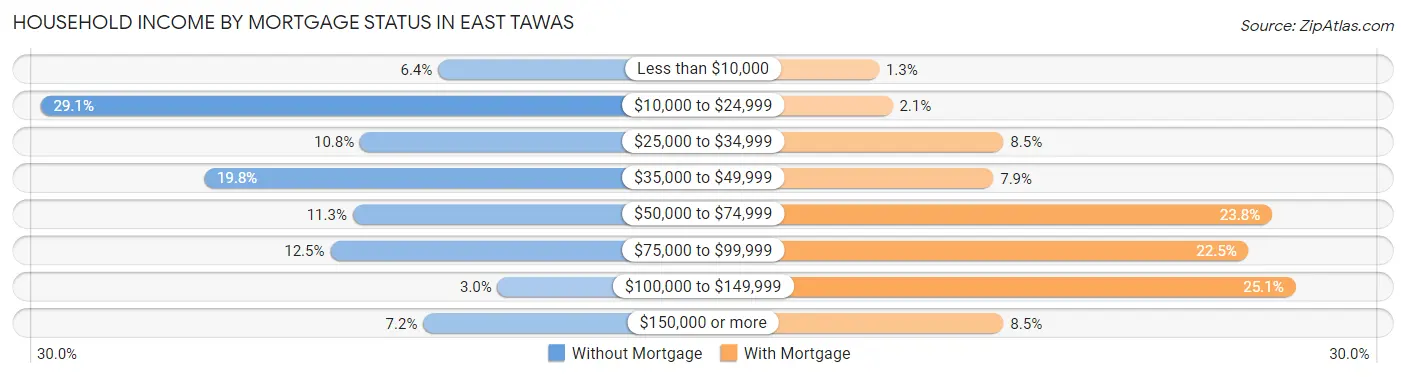
| Household Income | Without Mortgage | With Mortgage |
| Less than $10,000 | 30 (6.4%) | 7 (1.3%) |
| $10,000 to $24,999 | 137 (29.1%) | 11 (2.1%) |
| $25,000 to $34,999 | 51 (10.8%) | 44 (8.5%) |
| $35,000 to $49,999 | 93 (19.8%) | 41 (7.9%) |
| $50,000 to $74,999 | 53 (11.3%) | 124 (23.8%) |
| $75,000 to $99,999 | 59 (12.5%) | 117 (22.5%) |
| $100,000 to $149,999 | 14 (3.0%) | 131 (25.1%) |
| $150,000 or more | 34 (7.2%) | 44 (8.5%) |
| Total | 471 (100.0%) | 521 (100.0%) |
Property Value to Household Income Ratio in East Tawas
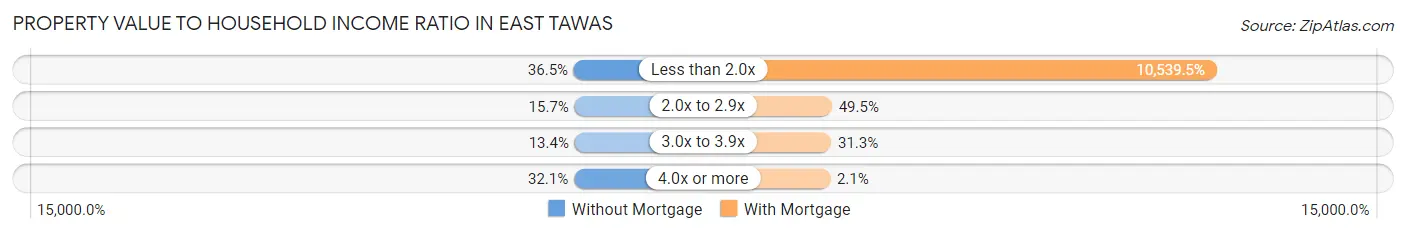
| Value-to-Income Ratio | Without Mortgage | With Mortgage |
| Less than 2.0x | 172 (36.5%) | 54,911 (10,539.5%) |
| 2.0x to 2.9x | 74 (15.7%) | 258 (49.5%) |
| 3.0x to 3.9x | 63 (13.4%) | 163 (31.3%) |
| 4.0x or more | 151 (32.1%) | 11 (2.1%) |
| Total | 471 (100.0%) | 521 (100.0%) |
Real Estate Taxes by Mortgage Status in East Tawas
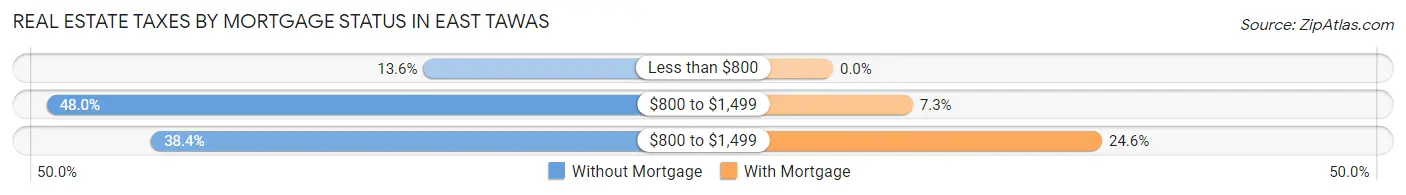
| Property Taxes | Without Mortgage | With Mortgage |
| Less than $800 | 64 (13.6%) | 0 (0.0%) |
| $800 to $1,499 | 226 (48.0%) | 38 (7.3%) |
| $800 to $1,499 | 181 (38.4%) | 128 (24.6%) |
| Total | 471 (100.0%) | 521 (100.0%) |
Health & Disability in East Tawas
Health Insurance Coverage by Age in East Tawas
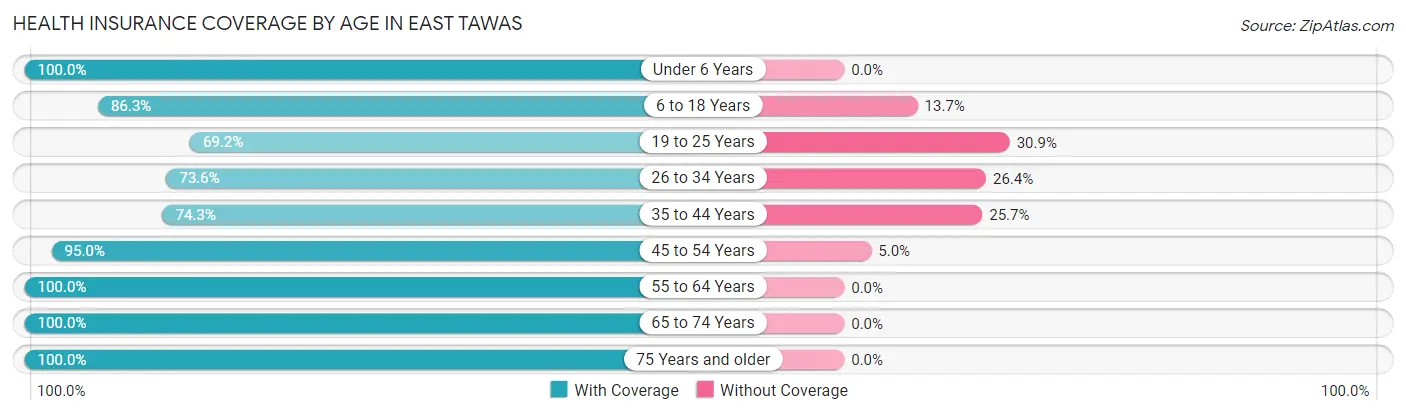
| Age Bracket | With Coverage | Without Coverage |
| Under 6 Years | 101 (100.0%) | 0 (0.0%) |
| 6 to 18 Years | 164 (86.3%) | 26 (13.7%) |
| 19 to 25 Years | 65 (69.2%) | 29 (30.8%) |
| 26 to 34 Years | 167 (73.6%) | 60 (26.4%) |
| 35 to 44 Years | 153 (74.3%) | 53 (25.7%) |
| 45 to 54 Years | 358 (95.0%) | 19 (5.0%) |
| 55 to 64 Years | 484 (100.0%) | 0 (0.0%) |
| 65 to 74 Years | 676 (100.0%) | 0 (0.0%) |
| 75 Years and older | 319 (100.0%) | 0 (0.0%) |
| Total | 2,487 (93.0%) | 187 (7.0%) |
Health Insurance Coverage by Citizenship Status in East Tawas
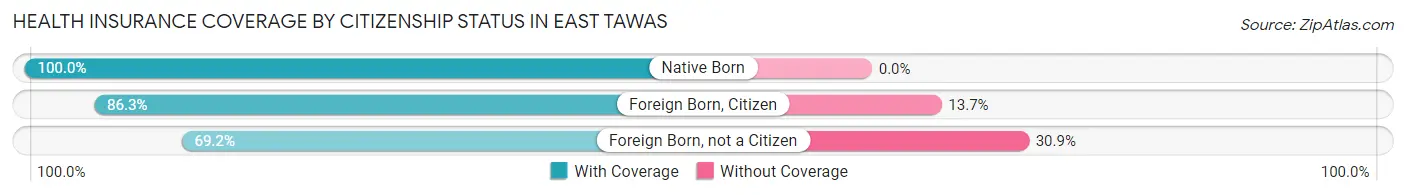
| Citizenship Status | With Coverage | Without Coverage |
| Native Born | 101 (100.0%) | 0 (0.0%) |
| Foreign Born, Citizen | 164 (86.3%) | 26 (13.7%) |
| Foreign Born, not a Citizen | 65 (69.2%) | 29 (30.8%) |
Health Insurance Coverage by Household Income in East Tawas
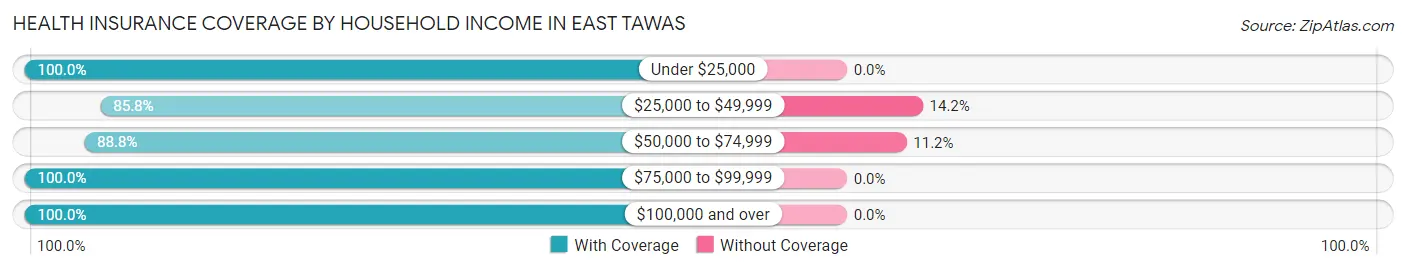
| Household Income | With Coverage | Without Coverage |
| Under $25,000 | 459 (100.0%) | 0 (0.0%) |
| $25,000 to $49,999 | 822 (85.8%) | 136 (14.2%) |
| $50,000 to $74,999 | 406 (88.8%) | 51 (11.2%) |
| $75,000 to $99,999 | 442 (100.0%) | 0 (0.0%) |
| $100,000 and over | 349 (100.0%) | 0 (0.0%) |
Public vs Private Health Insurance Coverage by Age in East Tawas
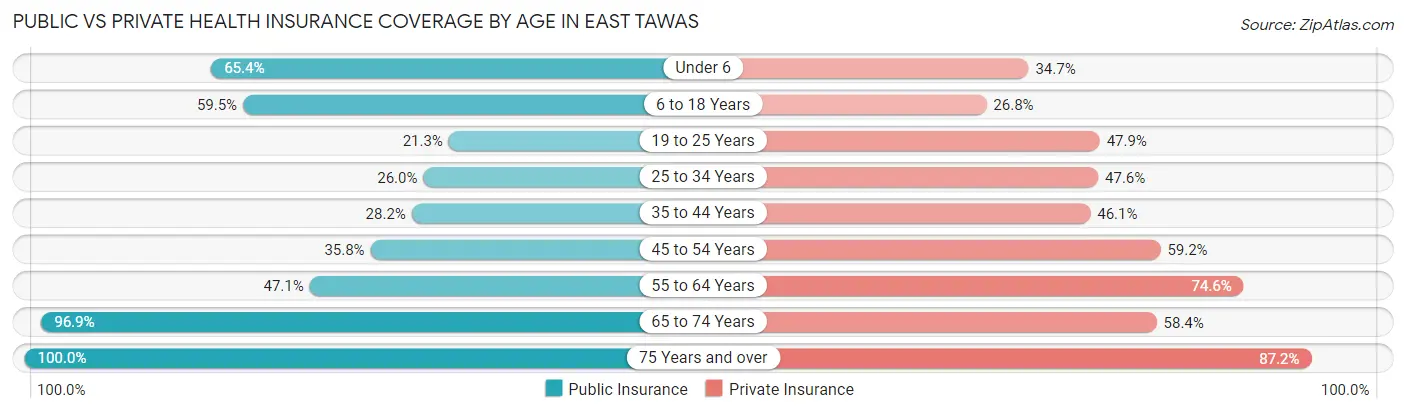
| Age Bracket | Public Insurance | Private Insurance |
| Under 6 | 66 (65.3%) | 35 (34.6%) |
| 6 to 18 Years | 113 (59.5%) | 51 (26.8%) |
| 19 to 25 Years | 20 (21.3%) | 45 (47.9%) |
| 25 to 34 Years | 59 (26.0%) | 108 (47.6%) |
| 35 to 44 Years | 58 (28.2%) | 95 (46.1%) |
| 45 to 54 Years | 135 (35.8%) | 223 (59.2%) |
| 55 to 64 Years | 228 (47.1%) | 361 (74.6%) |
| 65 to 74 Years | 655 (96.9%) | 395 (58.4%) |
| 75 Years and over | 319 (100.0%) | 278 (87.2%) |
| Total | 1,653 (61.8%) | 1,591 (59.5%) |
Disability Status by Sex by Age in East Tawas
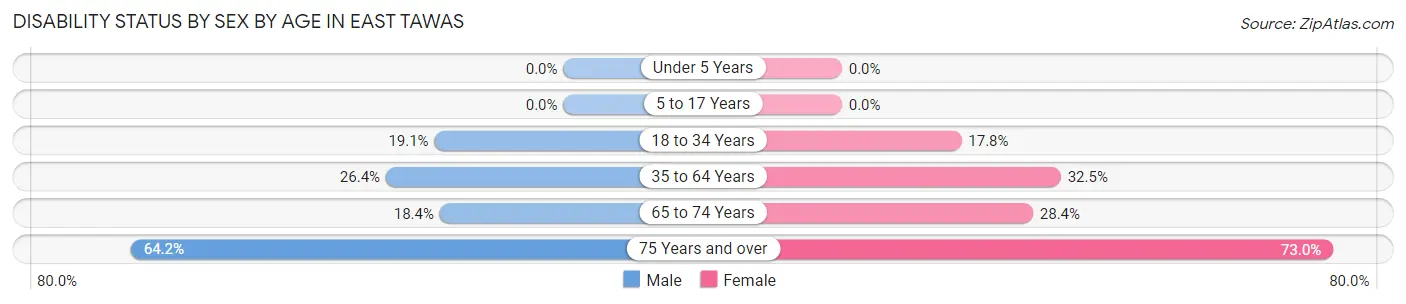
| Age Bracket | Male | Female |
| Under 5 Years | 0 (0.0%) | 0 (0.0%) |
| 5 to 17 Years | 0 (0.0%) | 0 (0.0%) |
| 18 to 34 Years | 31 (19.1%) | 30 (17.7%) |
| 35 to 64 Years | 132 (26.4%) | 184 (32.5%) |
| 65 to 74 Years | 60 (18.3%) | 99 (28.4%) |
| 75 Years and over | 79 (64.2%) | 143 (73.0%) |
Disability Class by Sex by Age in East Tawas
Disability Class: Hearing Difficulty
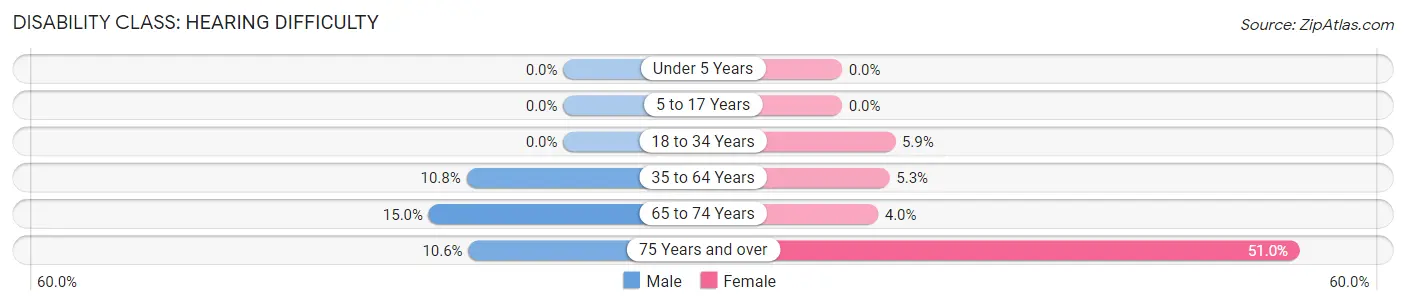
| Age Bracket | Male | Female |
| Under 5 Years | 0 (0.0%) | 0 (0.0%) |
| 5 to 17 Years | 0 (0.0%) | 0 (0.0%) |
| 18 to 34 Years | 0 (0.0%) | 10 (5.9%) |
| 35 to 64 Years | 54 (10.8%) | 30 (5.3%) |
| 65 to 74 Years | 49 (15.0%) | 14 (4.0%) |
| 75 Years and over | 13 (10.6%) | 100 (51.0%) |
Disability Class: Vision Difficulty
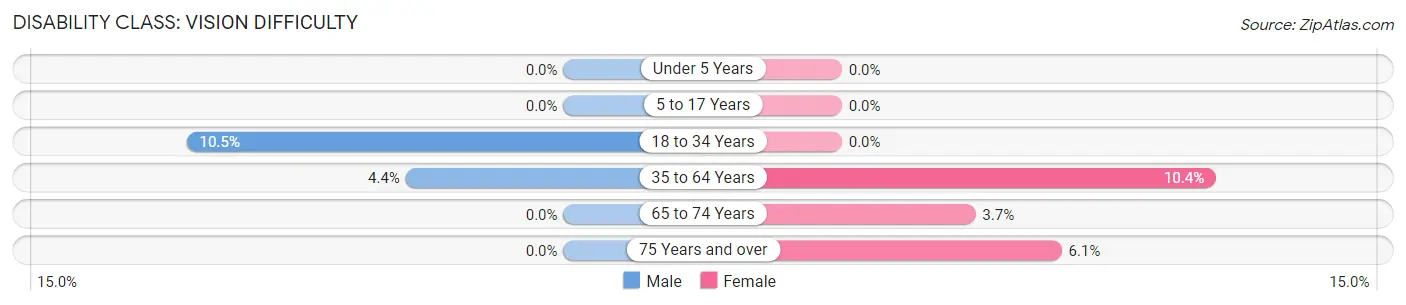
| Age Bracket | Male | Female |
| Under 5 Years | 0 (0.0%) | 0 (0.0%) |
| 5 to 17 Years | 0 (0.0%) | 0 (0.0%) |
| 18 to 34 Years | 17 (10.5%) | 0 (0.0%) |
| 35 to 64 Years | 22 (4.4%) | 59 (10.4%) |
| 65 to 74 Years | 0 (0.0%) | 13 (3.7%) |
| 75 Years and over | 0 (0.0%) | 12 (6.1%) |
Disability Class: Cognitive Difficulty
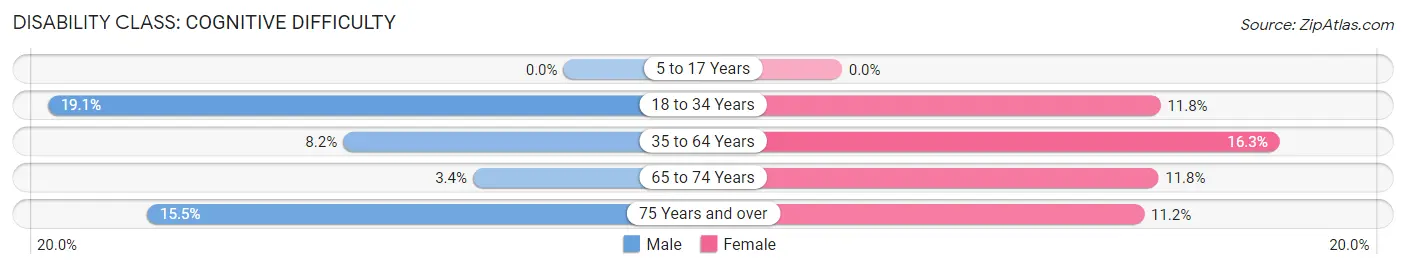
| Age Bracket | Male | Female |
| 5 to 17 Years | 0 (0.0%) | 0 (0.0%) |
| 18 to 34 Years | 31 (19.1%) | 20 (11.8%) |
| 35 to 64 Years | 41 (8.2%) | 92 (16.3%) |
| 65 to 74 Years | 11 (3.4%) | 41 (11.7%) |
| 75 Years and over | 19 (15.4%) | 22 (11.2%) |
Disability Class: Ambulatory Difficulty
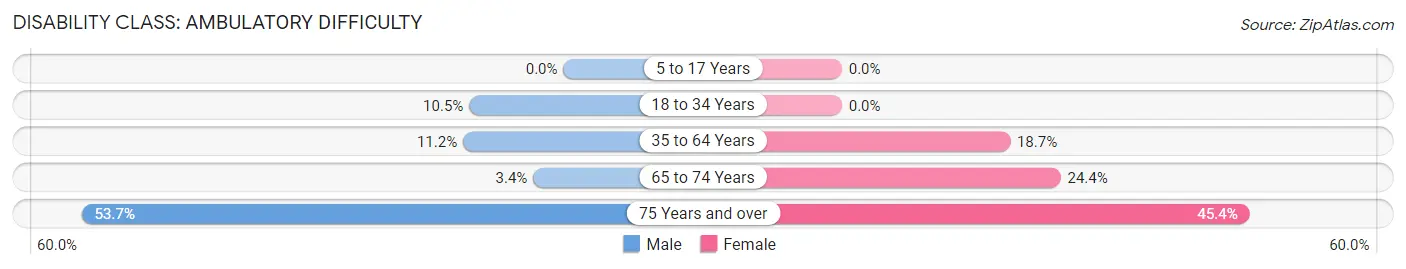
| Age Bracket | Male | Female |
| 5 to 17 Years | 0 (0.0%) | 0 (0.0%) |
| 18 to 34 Years | 17 (10.5%) | 0 (0.0%) |
| 35 to 64 Years | 56 (11.2%) | 106 (18.7%) |
| 65 to 74 Years | 11 (3.4%) | 85 (24.4%) |
| 75 Years and over | 66 (53.7%) | 89 (45.4%) |
Disability Class: Self-Care Difficulty
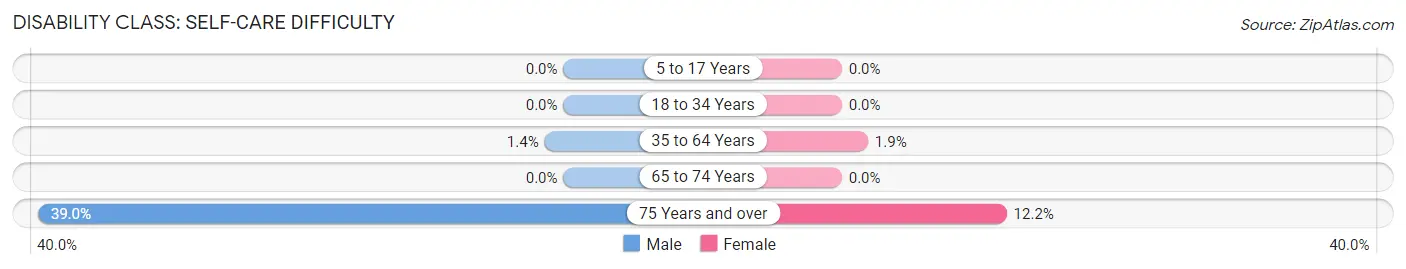
| Age Bracket | Male | Female |
| 5 to 17 Years | 0 (0.0%) | 0 (0.0%) |
| 18 to 34 Years | 0 (0.0%) | 0 (0.0%) |
| 35 to 64 Years | 7 (1.4%) | 11 (1.9%) |
| 65 to 74 Years | 0 (0.0%) | 0 (0.0%) |
| 75 Years and over | 48 (39.0%) | 24 (12.2%) |
Technology Access in East Tawas
Computing Device Access in East Tawas
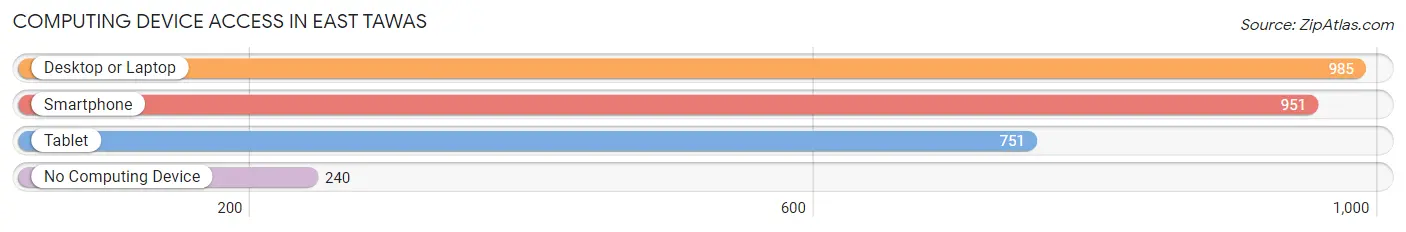
| Device Type | # Households | % Households |
| Desktop or Laptop | 985 | 66.2% |
| Smartphone | 951 | 63.9% |
| Tablet | 751 | 50.5% |
| No Computing Device | 240 | 16.1% |
| Total | 1,488 | 100.0% |
Internet Access in East Tawas
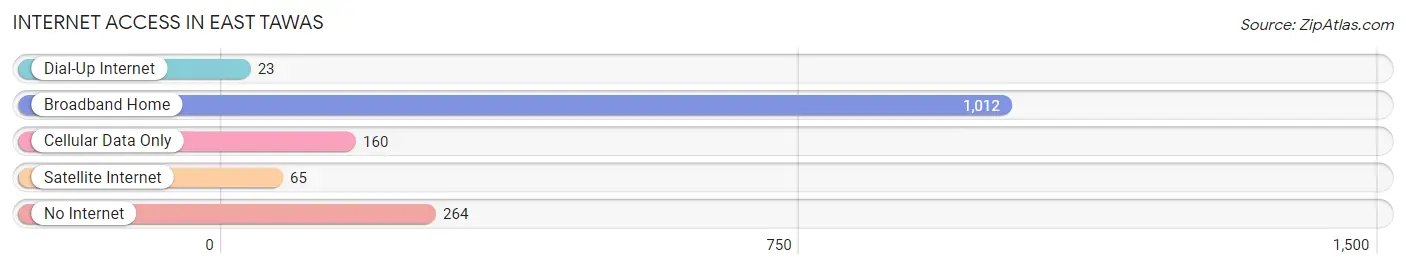
| Internet Type | # Households | % Households |
| Dial-Up Internet | 23 | 1.5% |
| Broadband Home | 1,012 | 68.0% |
| Cellular Data Only | 160 | 10.7% |
| Satellite Internet | 65 | 4.4% |
| No Internet | 264 | 17.7% |
| Total | 1,488 | 100.0% |
East Tawas Summary
East Tawas is a city located in Iosco County in the U.S. state of Michigan. It is situated on the shore of Lake Huron, about 30 miles (48 km) northeast of the city of Alpena. The population was 2,808 at the 2010 census.
History
East Tawas was first settled in 1854 by William B. Moore, who named the settlement after the nearby Tawas River. The settlement was incorporated as a village in 1871 and as a city in 1883.
The city was a major lumbering center in the late 19th century, and the lumber industry continued to be an important part of the local economy until the mid-20th century. The city was also a major port for shipping lumber and other goods to other parts of the Great Lakes region.
Geography
East Tawas is located at 44°20′N 83°33′W (44.33, -83.55). According to the United States Census Bureau, the city has a total area of 3.2 square miles (8.3 km2), of which 2.9 square miles (7.5 km2) is land and 0.3 square miles (0.8 km2) is water.
Economy
The economy of East Tawas is largely based on tourism and services. The city is a popular destination for fishing, boating, and other outdoor activities. The city also has a number of restaurants, shops, and other businesses that cater to tourists.
Demographics
As of the census of 2010, there were 2,808 people, 1,213 households, and 745 families residing in the city. The population density was 967.1 people per square mile (373.7/km2). There were 1,521 housing units at an average density of 527.2 per square mile (203.5/km2). The racial makeup of the city was 95.2% White, 0.7% African American, 0.7% Native American, 0.7% Asian, 0.1% Pacific Islander, 0.9% from other races, and 1.7% from two or more races. Hispanic or Latino of any race were 3.2% of the population.
There were 1,213 households, out of which 24.2% had children under the age of 18 living with them, 46.2% were married couples living together, 11.7% had a female householder with no husband present, and 37.2% were non-families. 32.2% of all households were made up of individuals, and 15.2% had someone living alone who was 65 years of age or older. The average household size was 2.25 and the average family size was 2.81.
In the city, the population was spread out, with 21.2% under the age of 18, 6.7% from 18 to 24, 24.2% from 25 to 44, 27.2% from 45 to 64, and 20.7% who were 65 years of age or older. The median age was 43 years. For every 100 females, there were 91.2 males. For every 100 females age 18 and over, there were 87.2 males.
The median income for a household in the city was $31,944, and the median income for a family was $41,250. Males had a median income of $31,250 versus $22,500 for females. The per capita income for the city was $17,945. About 9.2% of families and 12.2% of the population were below the poverty line, including 16.2% of those under age 18 and 8.2% of those age 65 or over.
Common Questions
What is Per Capita Income in East Tawas?
Per Capita income in East Tawas is $29,632.
What is the Median Family Income in East Tawas?
Median Family Income in East Tawas is $59,875.
What is the Median Household income in East Tawas?
Median Household Income in East Tawas is $40,833.
What is Income or Wage Gap in East Tawas?
Income or Wage Gap in East Tawas is 30.6%.
Women in East Tawas earn 69.4 cents for every dollar earned by a man.
What is Inequality or Gini Index in East Tawas?
Inequality or Gini Index in East Tawas is 0.40.
What is the Total Population of East Tawas?
Total Population of East Tawas is 2,677.
What is the Total Male Population of East Tawas?
Total Male Population of East Tawas is 1,266.
What is the Total Female Population of East Tawas?
Total Female Population of East Tawas is 1,411.
What is the Ratio of Males per 100 Females in East Tawas?
There are 89.72 Males per 100 Females in East Tawas.
What is the Ratio of Females per 100 Males in East Tawas?
There are 111.45 Females per 100 Males in East Tawas.
What is the Median Population Age in East Tawas?
Median Population Age in East Tawas is 59.1 Years.
What is the Average Family Size in East Tawas
Average Family Size in East Tawas is 2.7 People.
What is the Average Household Size in East Tawas
Average Household Size in East Tawas is 1.8 People.
How Large is the Labor Force in East Tawas?
There are 1,049 People in the Labor Forcein in East Tawas.
What is the Percentage of People in the Labor Force in East Tawas?
43.8% of People are in the Labor Force in East Tawas.
What is the Unemployment Rate in East Tawas?
Unemployment Rate in East Tawas is 10.2%.