Zip Codes with the Highest Percentage of Population Employed in Health Diagnosing & Treating in Northville, MI
RELATED REPORTS & OPTIONS
Health Diagnosing & Treating
Northville
Compare Zip Codes
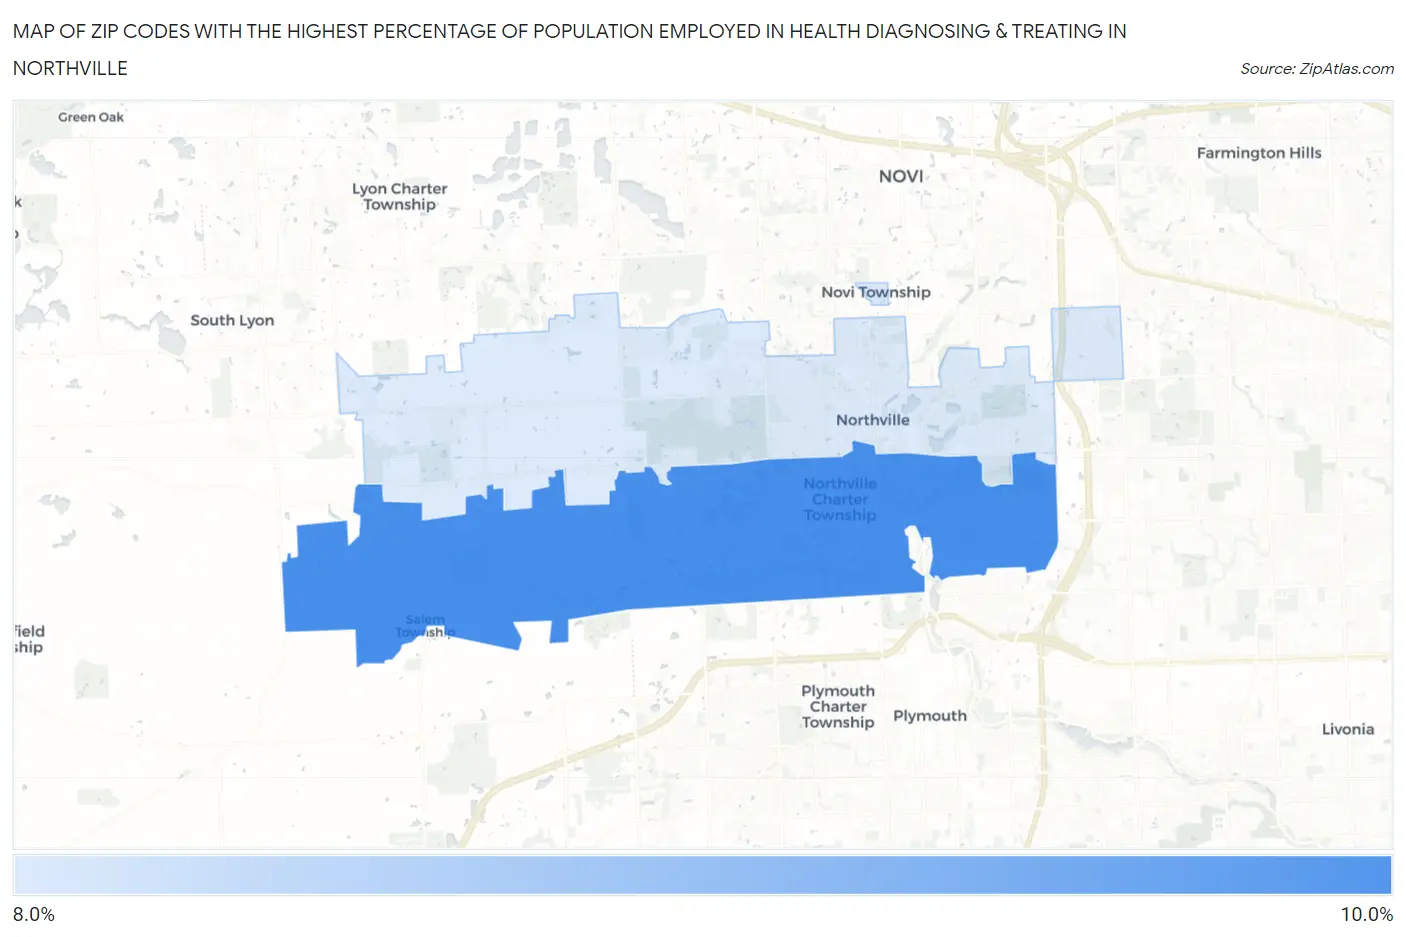
Map of Zip Codes with the Highest Percentage of Population Employed in Health Diagnosing & Treating in Northville
8.1%
9.9%
Zip Codes with the Highest Percentage of Population Employed in Health Diagnosing & Treating in Northville, MI
| Zip Code | % Employed | vs State | vs National | |
| 1. | 48168 | 9.9% | 6.6%(+3.26)#93 | 6.2%(+3.66)#3,993 |
| 2. | 48167 | 8.1% | 6.6%(+1.50)#202 | 6.2%(+1.90)#7,128 |
1
Common Questions
What are the Top Zip Codes with the Highest Percentage of Population Employed in Health Diagnosing & Treating in Northville, MI?
Top Zip Codes with the Highest Percentage of Population Employed in Health Diagnosing & Treating in Northville, MI are:
What zip code has the Highest Percentage of Population Employed in Health Diagnosing & Treating in Northville, MI?
48168 has the Highest Percentage of Population Employed in Health Diagnosing & Treating in Northville, MI with 9.9%.
What is the Percentage of Population Employed in Health Diagnosing & Treating in Northville, MI?
Percentage of Population Employed in Health Diagnosing & Treating in Northville is 7.7%.
What is the Percentage of Population Employed in Health Diagnosing & Treating in Michigan?
Percentage of Population Employed in Health Diagnosing & Treating in Michigan is 6.6%.
What is the Percentage of Population Employed in Health Diagnosing & Treating in the United States?
Percentage of Population Employed in Health Diagnosing & Treating in the United States is 6.2%.