Grawn, MI Map & Demographics
Grawn Map
Grawn Overview
$26,024
PER CAPITA INCOME
$66,818
AVG FAMILY INCOME
$65,795
AVG HOUSEHOLD INCOME
44.0%
WAGE / INCOME GAP [ % ]
56.0¢/ $1
WAGE / INCOME GAP [ $ ]
0.23
INEQUALITY / GINI INDEX
852
TOTAL POPULATION
429
MALE POPULATION
423
FEMALE POPULATION
101.42
MALES / 100 FEMALES
98.60
FEMALES / 100 MALES
38.0
MEDIAN AGE
2.7
AVG FAMILY SIZE
2.8
AVG HOUSEHOLD SIZE
509
LABOR FORCE [ PEOPLE ]
71.2%
PERCENT IN LABOR FORCE
Grawn Zip Codes
Grawn Area Codes
Income in Grawn
Income Overview in Grawn
Per Capita Income in Grawn is $26,024, while median incomes of families and households are $66,818 and $65,795 respectively.
| Characteristic | Number | Measure |
| Per Capita Income | 852 | $26,024 |
| Median Family Income | 222 | $66,818 |
| Mean Family Income | 222 | $69,402 |
| Median Household Income | 309 | $65,795 |
| Mean Household Income | 309 | $71,124 |
| Income Deficit | 222 | $0 |
| Wage / Income Gap (%) | 852 | 43.99% |
| Wage / Income Gap ($) | 852 | 56.01¢ per $1 |
| Gini / Inequality Index | 852 | 0.23 |
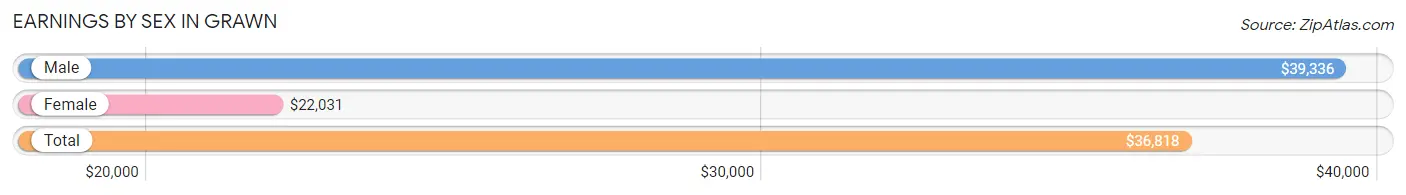
Earnings by Sex in Grawn
Average Earnings in Grawn are $36,818, $39,336 for men and $22,031 for women, a difference of 44.0%.
| Sex | Number | Average Earnings |
| Male | 287 (49.6%) | $39,336 |
| Female | 291 (50.3%) | $22,031 |
| Total | 578 (100.0%) | $36,818 |
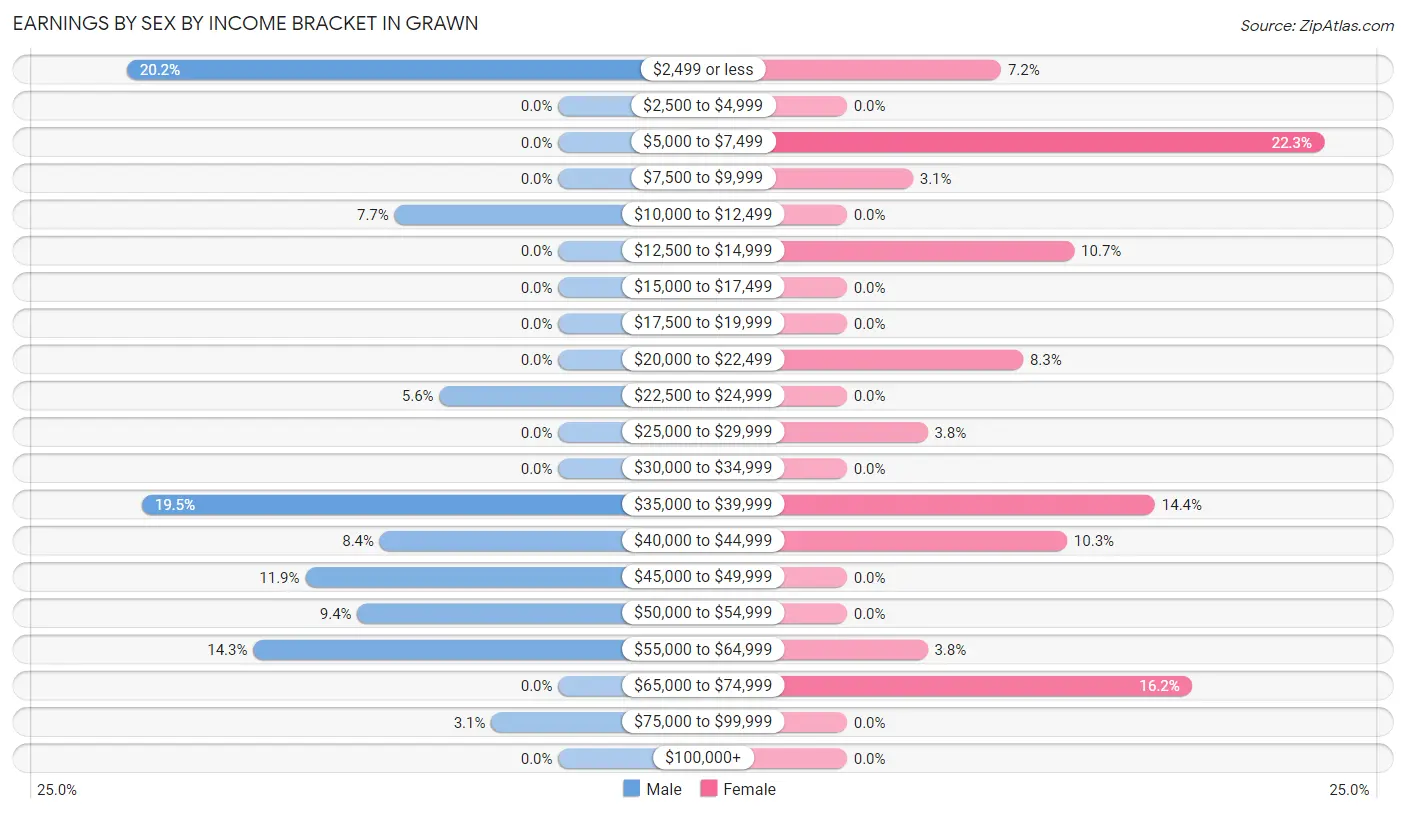
Earnings by Sex by Income Bracket in Grawn
The most common earnings brackets in Grawn are $2,499 or less for men (58 | 20.2%) and $5,000 to $7,499 for women (65 | 22.3%).
| Income | Male | Female |
| $2,499 or less | 58 (20.2%) | 21 (7.2%) |
| $2,500 to $4,999 | 0 (0.0%) | 0 (0.0%) |
| $5,000 to $7,499 | 0 (0.0%) | 65 (22.3%) |
| $7,500 to $9,999 | 0 (0.0%) | 9 (3.1%) |
| $10,000 to $12,499 | 22 (7.7%) | 0 (0.0%) |
| $12,500 to $14,999 | 0 (0.0%) | 31 (10.6%) |
| $15,000 to $17,499 | 0 (0.0%) | 0 (0.0%) |
| $17,500 to $19,999 | 0 (0.0%) | 0 (0.0%) |
| $20,000 to $22,499 | 0 (0.0%) | 24 (8.3%) |
| $22,500 to $24,999 | 16 (5.6%) | 0 (0.0%) |
| $25,000 to $29,999 | 0 (0.0%) | 11 (3.8%) |
| $30,000 to $34,999 | 0 (0.0%) | 0 (0.0%) |
| $35,000 to $39,999 | 56 (19.5%) | 42 (14.4%) |
| $40,000 to $44,999 | 24 (8.4%) | 30 (10.3%) |
| $45,000 to $49,999 | 34 (11.8%) | 0 (0.0%) |
| $50,000 to $54,999 | 27 (9.4%) | 0 (0.0%) |
| $55,000 to $64,999 | 41 (14.3%) | 11 (3.8%) |
| $65,000 to $74,999 | 0 (0.0%) | 47 (16.2%) |
| $75,000 to $99,999 | 9 (3.1%) | 0 (0.0%) |
| $100,000+ | 0 (0.0%) | 0 (0.0%) |
| Total | 287 (100.0%) | 291 (100.0%) |
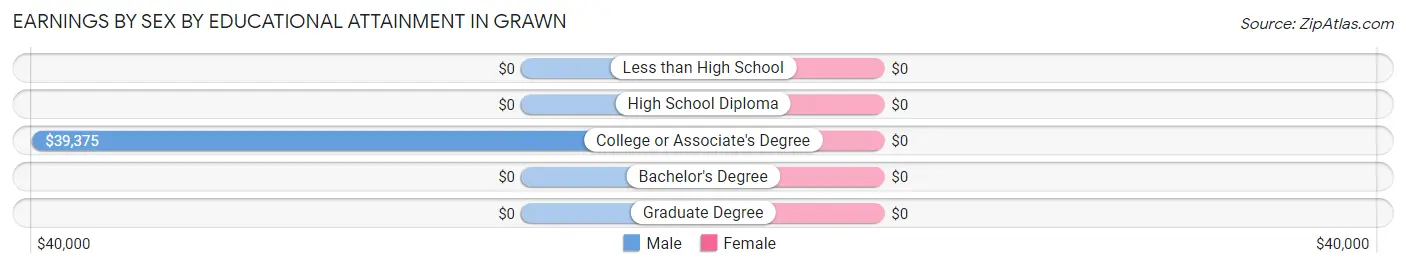
Earnings by Sex by Educational Attainment in Grawn
| Educational Attainment | Male Income | Female Income |
| Less than High School | - | - |
| High School Diploma | - | - |
| College or Associate's Degree | $39,375 | $0 |
| Bachelor's Degree | - | - |
| Graduate Degree | - | - |
| Total | $48,051 | $36,313 |
Family Income in Grawn
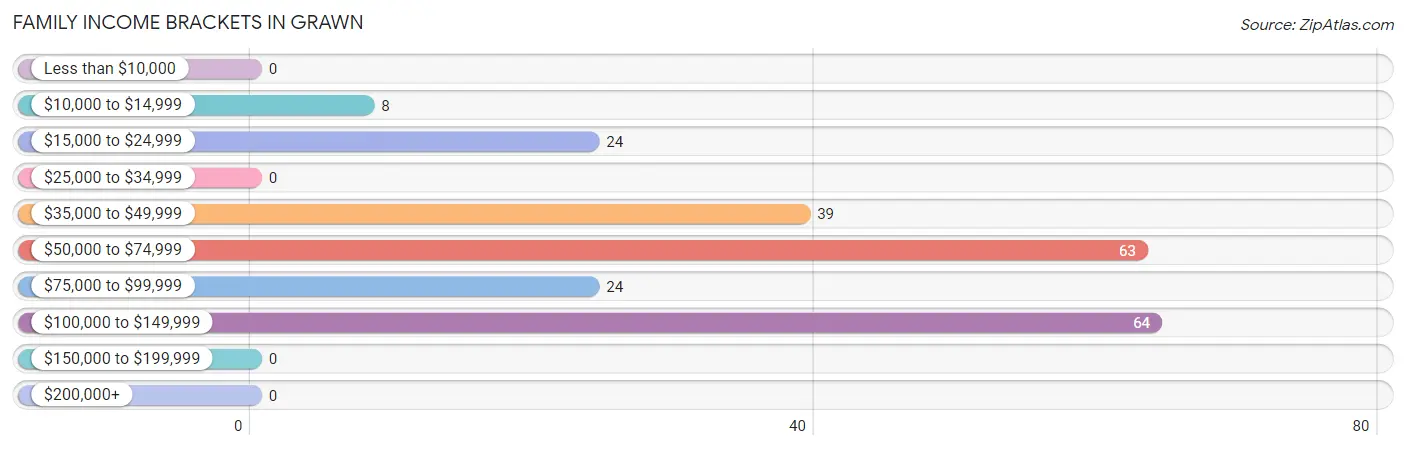
Family Income Brackets in Grawn
According to the Grawn family income data, there are 64 families falling into the $100,000 to $149,999 income range, which is the most common income bracket and makes up 28.8% of all families.
| Income Bracket | # Families | % Families |
| Less than $10,000 | 0 | 0.0% |
| $10,000 to $14,999 | 8 | 3.6% |
| $15,000 to $24,999 | 24 | 10.8% |
| $25,000 to $34,999 | 0 | 0.0% |
| $35,000 to $49,999 | 39 | 17.6% |
| $50,000 to $74,999 | 63 | 28.4% |
| $75,000 to $99,999 | 24 | 10.8% |
| $100,000 to $149,999 | 64 | 28.8% |
| $150,000 to $199,999 | 0 | 0.0% |
| $200,000+ | 0 | 0.0% |
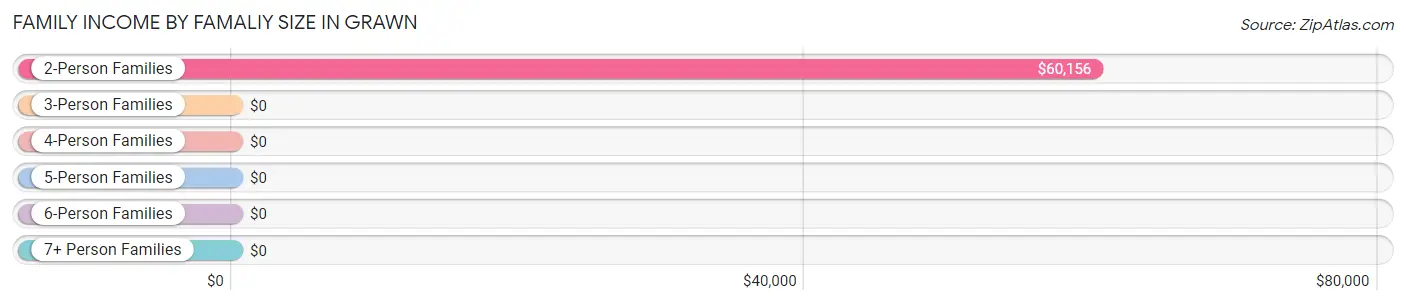
Family Income by Famaliy Size in Grawn
2-person families (146 | 65.8%) account for the highest median family income in Grawn with $60,156 per family, while 2-person families (146 | 65.8%) have the highest median income of $30,078 per family member.
| Income Bracket | # Families | Median Income |
| 2-Person Families | 146 (65.8%) | $60,156 |
| 3-Person Families | 44 (19.8%) | $0 |
| 4-Person Families | 32 (14.4%) | $0 |
| 5-Person Families | 0 (0.0%) | $0 |
| 6-Person Families | 0 (0.0%) | $0 |
| 7+ Person Families | 0 (0.0%) | $0 |
| Total | 222 (100.0%) | $66,818 |
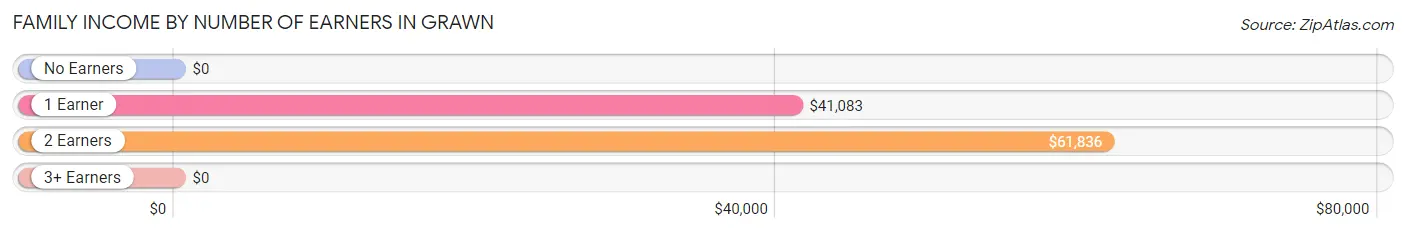
Family Income by Number of Earners in Grawn
| Number of Earners | # Families | Median Income |
| No Earners | 31 (14.0%) | $0 |
| 1 Earner | 74 (33.3%) | $41,083 |
| 2 Earners | 65 (29.3%) | $61,836 |
| 3+ Earners | 52 (23.4%) | $0 |
| Total | 222 (100.0%) | $66,818 |
Household Income in Grawn
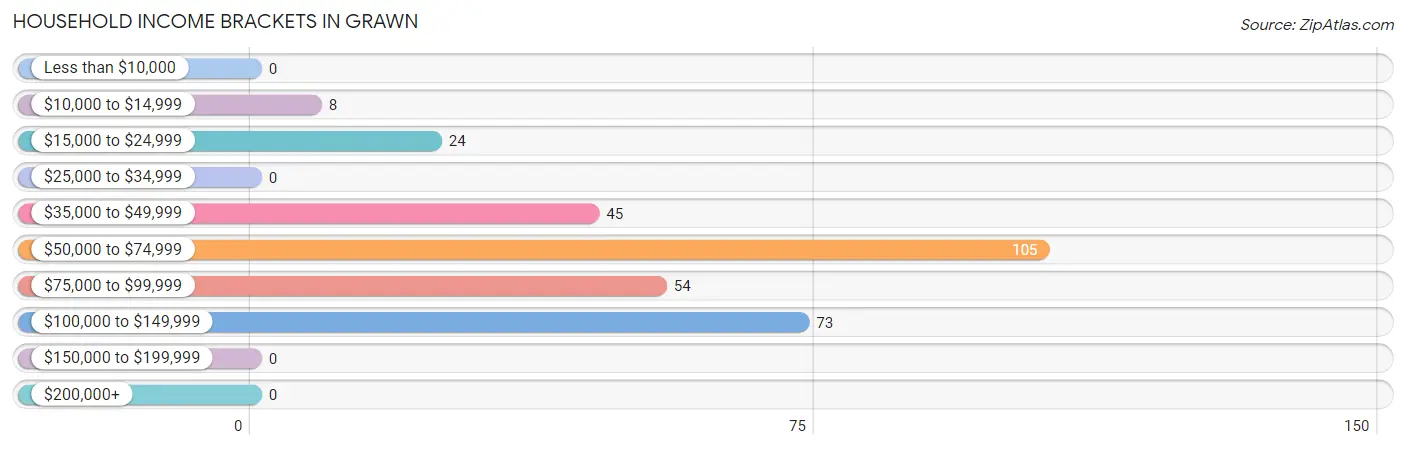
Household Income Brackets in Grawn
With 105 households falling in the category, the $50,000 to $74,999 income range is the most frequent in Grawn, accounting for 34.0% of all households.
| Income Bracket | # Households | % Households |
| Less than $10,000 | 0 | 0.0% |
| $10,000 to $14,999 | 8 | 2.6% |
| $15,000 to $24,999 | 24 | 7.8% |
| $25,000 to $34,999 | 0 | 0.0% |
| $35,000 to $49,999 | 45 | 14.6% |
| $50,000 to $74,999 | 105 | 34.0% |
| $75,000 to $99,999 | 54 | 17.5% |
| $100,000 to $149,999 | 73 | 23.6% |
| $150,000 to $199,999 | 0 | 0.0% |
| $200,000+ | 0 | 0.0% |
Household Income by Householder Age in Grawn
The median household income in Grawn is $65,795, with the highest median household income of $80,781 found in the 45 to 64 years age bracket for the primary householder. A total of 137 households (44.3%) fall into this category. Meanwhile, the 15 to 24 years age bracket for the primary householder has the lowest median household income of $0, with 22 households (7.1%) in this group.
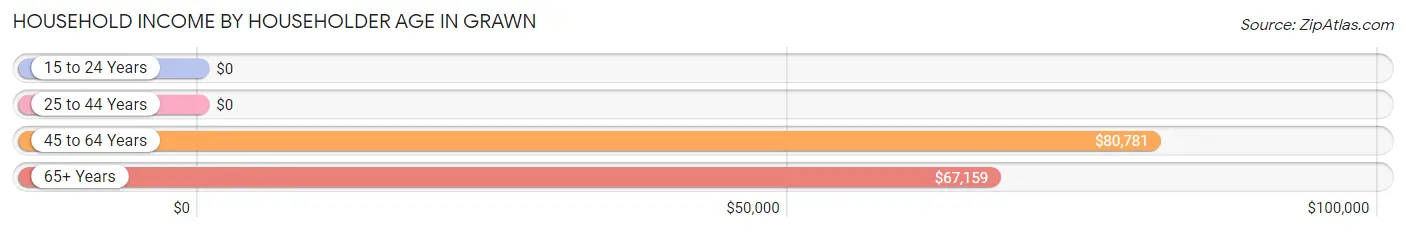
| Income Bracket | # Households | Median Income |
| 15 to 24 Years | 22 (7.1%) | $0 |
| 25 to 44 Years | 83 (26.9%) | $0 |
| 45 to 64 Years | 137 (44.3%) | $80,781 |
| 65+ Years | 67 (21.7%) | $67,159 |
| Total | 309 (100.0%) | $65,795 |
Poverty in Grawn
Income Below Poverty by Sex and Age in Grawn
With 14.5% poverty level for males and 9.4% for females among the residents of Grawn, 15 year old males and 55 to 64 year old females are the most vulnerable to poverty, with 25 males (100.0%) and 29 females (37.7%) in their respective age groups living below the poverty level.
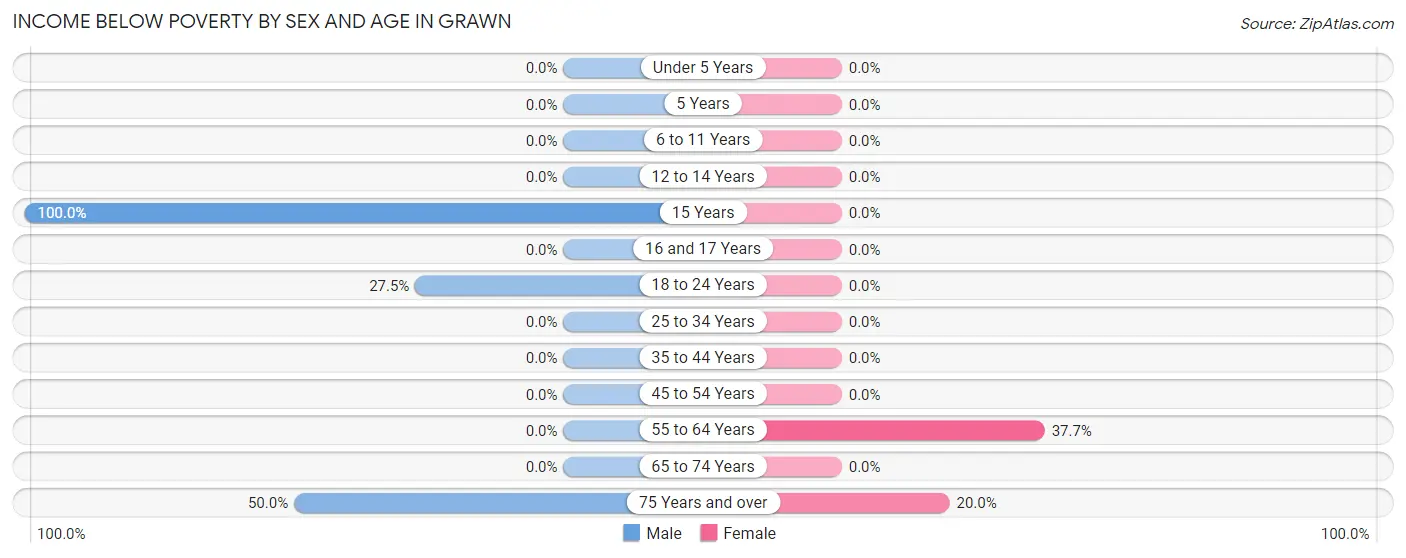
| Age Bracket | Male | Female |
| Under 5 Years | 0 (0.0%) | 0 (0.0%) |
| 5 Years | 0 (0.0%) | 0 (0.0%) |
| 6 to 11 Years | 0 (0.0%) | 0 (0.0%) |
| 12 to 14 Years | 0 (0.0%) | 0 (0.0%) |
| 15 Years | 25 (100.0%) | 0 (0.0%) |
| 16 and 17 Years | 0 (0.0%) | 0 (0.0%) |
| 18 to 24 Years | 22 (27.5%) | 0 (0.0%) |
| 25 to 34 Years | 0 (0.0%) | 0 (0.0%) |
| 35 to 44 Years | 0 (0.0%) | 0 (0.0%) |
| 45 to 54 Years | 0 (0.0%) | 0 (0.0%) |
| 55 to 64 Years | 0 (0.0%) | 29 (37.7%) |
| 65 to 74 Years | 0 (0.0%) | 0 (0.0%) |
| 75 Years and over | 11 (50.0%) | 8 (20.0%) |
| Total | 58 (14.5%) | 37 (9.4%) |
Income Above Poverty by Sex and Age in Grawn
According to the poverty statistics in Grawn, males aged 12 to 14 years and females aged 12 to 14 years are the age groups that are most secure financially, with 100.0% of males and 100.0% of females in these age groups living above the poverty line.
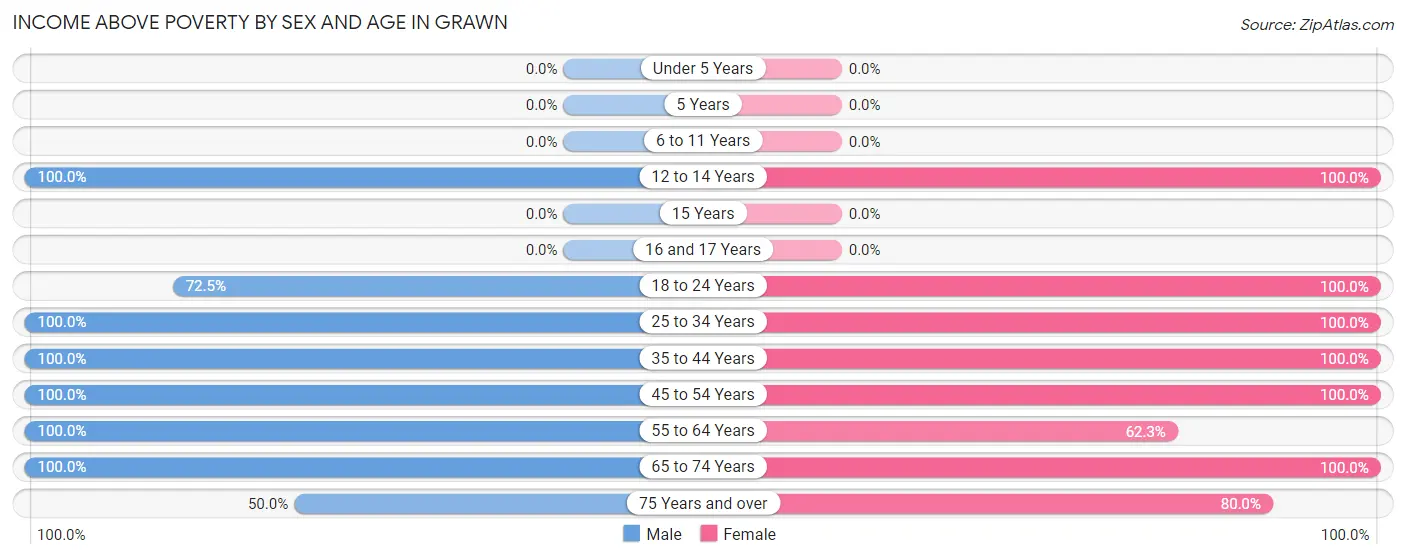
| Age Bracket | Male | Female |
| Under 5 Years | 0 (0.0%) | 0 (0.0%) |
| 5 Years | 0 (0.0%) | 0 (0.0%) |
| 6 to 11 Years | 0 (0.0%) | 0 (0.0%) |
| 12 to 14 Years | 30 (100.0%) | 22 (100.0%) |
| 15 Years | 0 (0.0%) | 0 (0.0%) |
| 16 and 17 Years | 0 (0.0%) | 0 (0.0%) |
| 18 to 24 Years | 58 (72.5%) | 96 (100.0%) |
| 25 to 34 Years | 4 (100.0%) | 31 (100.0%) |
| 35 to 44 Years | 36 (100.0%) | 76 (100.0%) |
| 45 to 54 Years | 24 (100.0%) | 40 (100.0%) |
| 55 to 64 Years | 151 (100.0%) | 48 (62.3%) |
| 65 to 74 Years | 27 (100.0%) | 11 (100.0%) |
| 75 Years and over | 11 (50.0%) | 32 (80.0%) |
| Total | 341 (85.5%) | 356 (90.6%) |
Income Below Poverty Among Married-Couple Families in Grawn
The poverty statistics for married-couple families in Grawn show that 5.8% or 8 of the total 137 families live below the poverty line. Families with no children have the highest poverty rate of 5.8%, comprising of 8 families. On the other hand, families with no children have the lowest poverty rate of 5.8%, which includes 8 families.
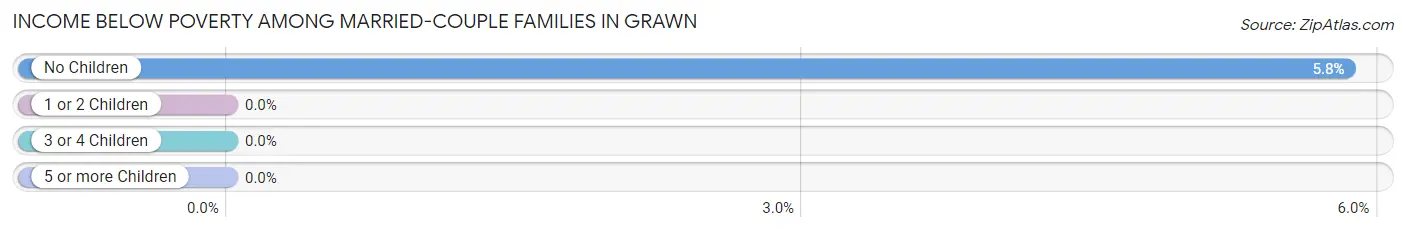
| Children | Above Poverty | Below Poverty |
| No Children | 129 (94.2%) | 8 (5.8%) |
| 1 or 2 Children | 0 (0.0%) | 0 (0.0%) |
| 3 or 4 Children | 0 (0.0%) | 0 (0.0%) |
| 5 or more Children | 0 (0.0%) | 0 (0.0%) |
| Total | 129 (94.2%) | 8 (5.8%) |
Income Below Poverty Among Single-Parent Households in Grawn
| Children | Single Father | Single Mother |
| No Children | 0 (0.0%) | 0 (0.0%) |
| 1 or 2 Children | 0 (0.0%) | 0 (0.0%) |
| 3 or 4 Children | 0 (0.0%) | 0 (0.0%) |
| 5 or more Children | 0 (0.0%) | 0 (0.0%) |
| Total | 0 (0.0%) | 0 (0.0%) |
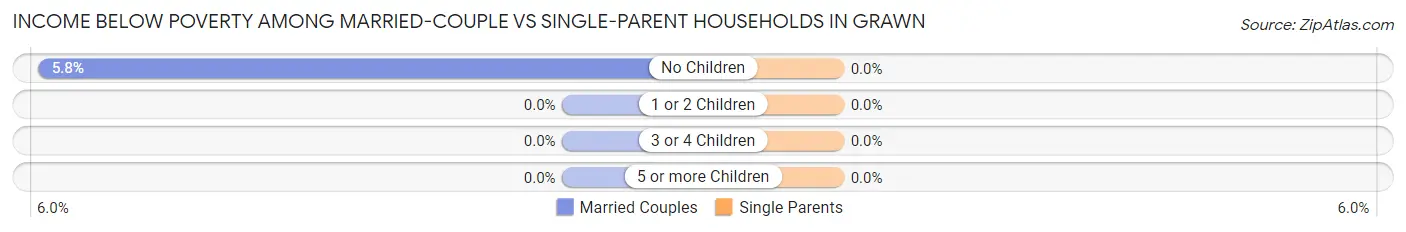
Income Below Poverty Among Married-Couple vs Single-Parent Households in Grawn
| Children | Married-Couple Families | Single-Parent Households |
| No Children | 8 (5.8%) | 0 (0.0%) |
| 1 or 2 Children | 0 (0.0%) | 0 (0.0%) |
| 3 or 4 Children | 0 (0.0%) | 0 (0.0%) |
| 5 or more Children | 0 (0.0%) | 0 (0.0%) |
| Total | 8 (5.8%) | 0 (0.0%) |
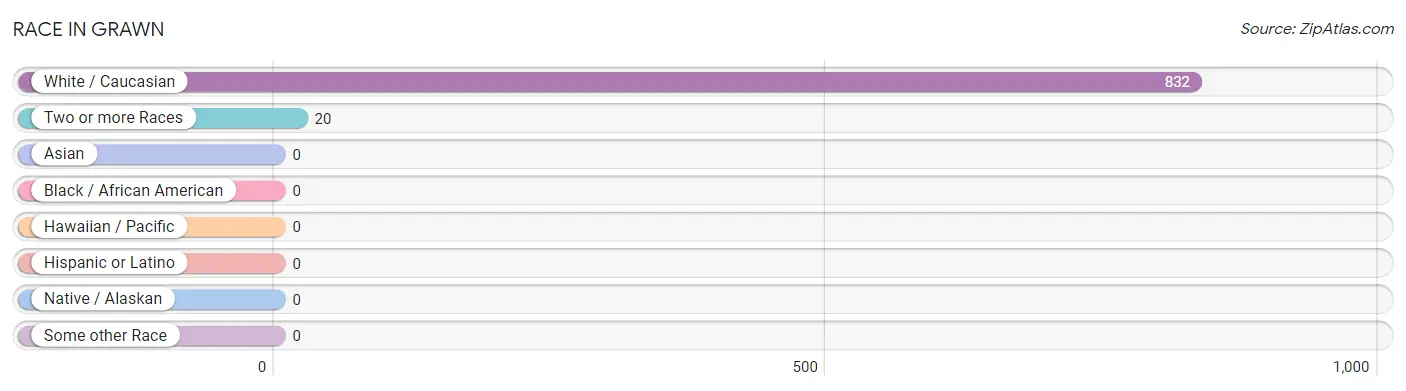
Race in Grawn
The most populous races in Grawn are White / Caucasian (832 | 97.7%), and Two or more Races (20 | 2.4%).
| Race | # Population | % Population |
| Asian | 0 | 0.0% |
| Black / African American | 0 | 0.0% |
| Hawaiian / Pacific | 0 | 0.0% |
| Hispanic or Latino | 0 | 0.0% |
| Native / Alaskan | 0 | 0.0% |
| White / Caucasian | 832 | 97.7% |
| Two or more Races | 20 | 2.4% |
| Some other Race | 0 | 0.0% |
| Total | 852 | 100.0% |
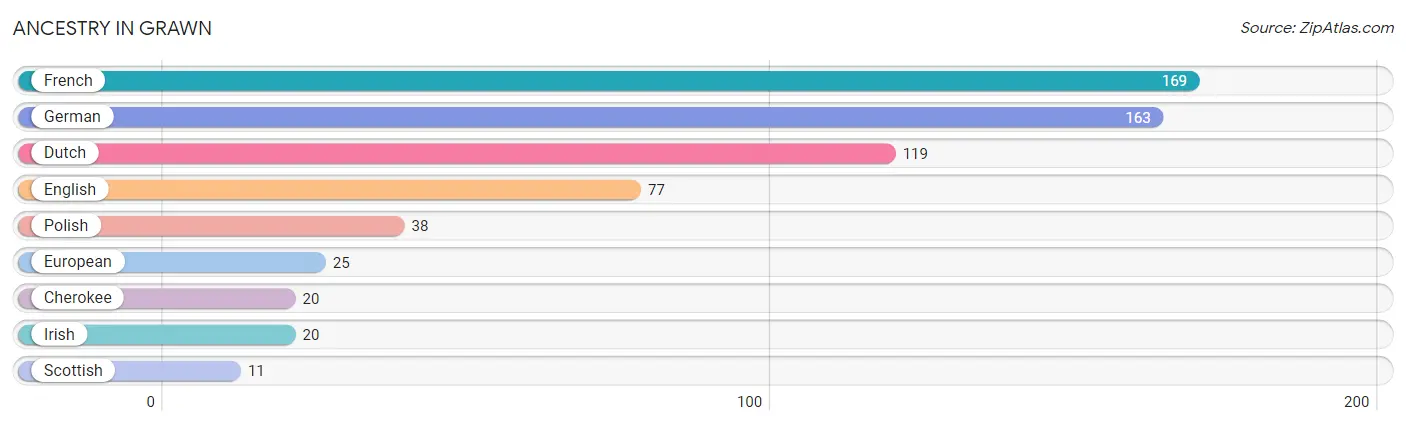
Ancestry in Grawn
The most populous ancestries reported in Grawn are French (169 | 19.8%), German (163 | 19.1%), Dutch (119 | 14.0%), English (77 | 9.0%), and Polish (38 | 4.5%), together accounting for 66.4% of all Grawn residents.
| Ancestry | # Population | % Population |
| Cherokee | 20 | 2.4% |
| Dutch | 119 | 14.0% |
| English | 77 | 9.0% |
| European | 25 | 2.9% |
| French | 169 | 19.8% |
| German | 163 | 19.1% |
| Irish | 20 | 2.4% |
| Polish | 38 | 4.5% |
| Scottish | 11 | 1.3% | View All 9 Rows |
Immigrants in Grawn

| Immigration Origin | # Population | % Population | View All 0 Rows |
Sex and Age in Grawn
Sex and Age in Grawn
The most populous age groups in Grawn are 60 to 64 Years (130 | 30.3%) for men and 20 to 24 Years (96 | 22.7%) for women.
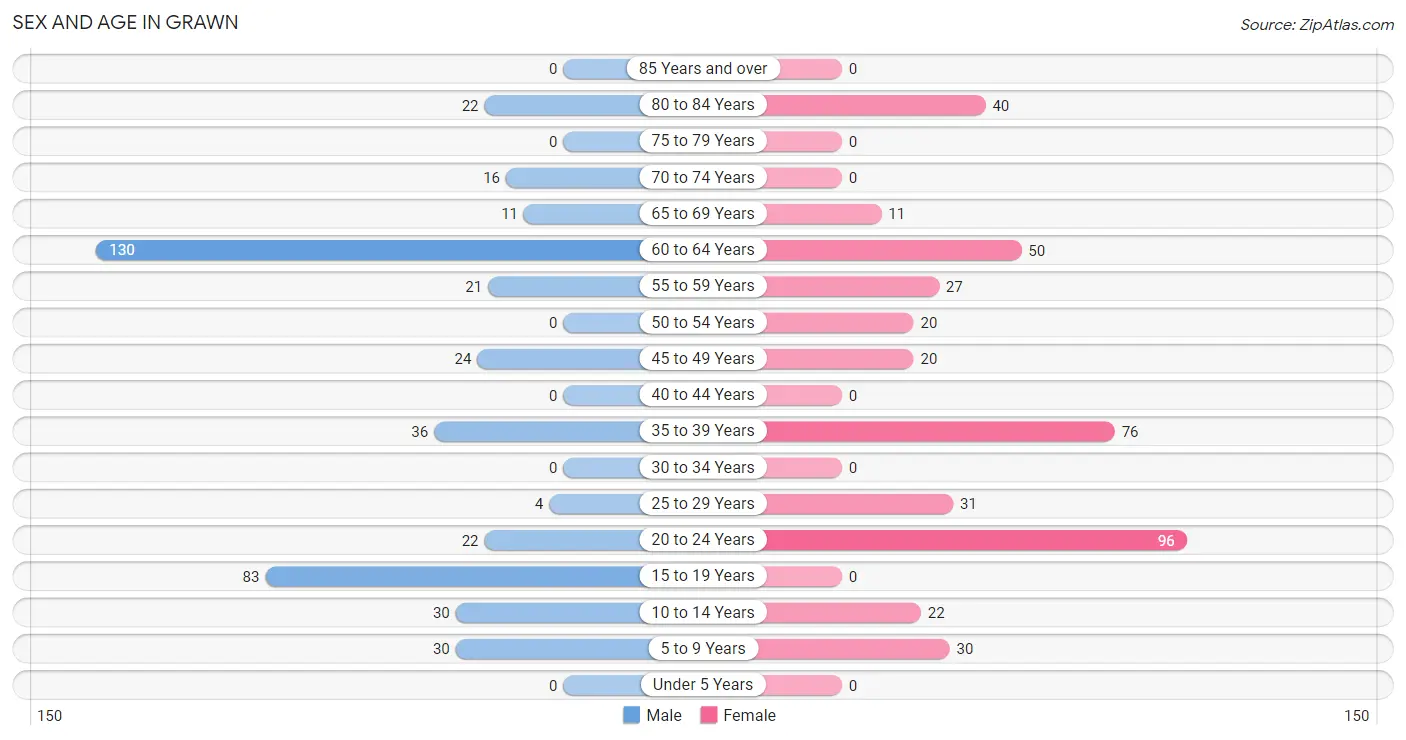
| Age Bracket | Male | Female |
| Under 5 Years | 0 (0.0%) | 0 (0.0%) |
| 5 to 9 Years | 30 (7.0%) | 30 (7.1%) |
| 10 to 14 Years | 30 (7.0%) | 22 (5.2%) |
| 15 to 19 Years | 83 (19.4%) | 0 (0.0%) |
| 20 to 24 Years | 22 (5.1%) | 96 (22.7%) |
| 25 to 29 Years | 4 (0.9%) | 31 (7.3%) |
| 30 to 34 Years | 0 (0.0%) | 0 (0.0%) |
| 35 to 39 Years | 36 (8.4%) | 76 (18.0%) |
| 40 to 44 Years | 0 (0.0%) | 0 (0.0%) |
| 45 to 49 Years | 24 (5.6%) | 20 (4.7%) |
| 50 to 54 Years | 0 (0.0%) | 20 (4.7%) |
| 55 to 59 Years | 21 (4.9%) | 27 (6.4%) |
| 60 to 64 Years | 130 (30.3%) | 50 (11.8%) |
| 65 to 69 Years | 11 (2.6%) | 11 (2.6%) |
| 70 to 74 Years | 16 (3.7%) | 0 (0.0%) |
| 75 to 79 Years | 0 (0.0%) | 0 (0.0%) |
| 80 to 84 Years | 22 (5.1%) | 40 (9.5%) |
| 85 Years and over | 0 (0.0%) | 0 (0.0%) |
| Total | 429 (100.0%) | 423 (100.0%) |
Families and Households in Grawn
Median Family Size in Grawn
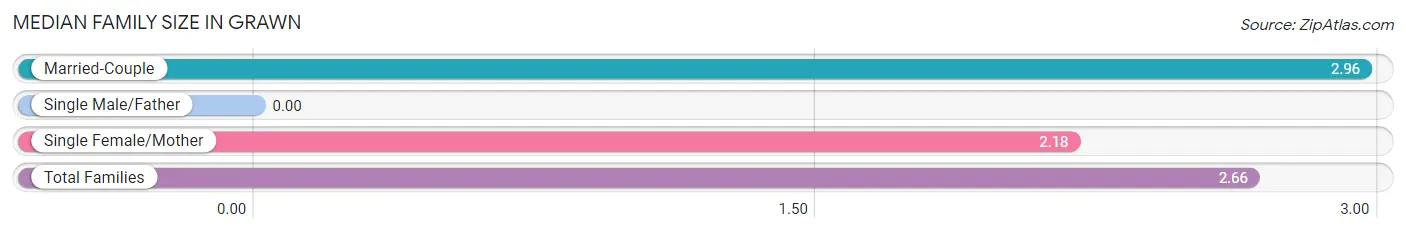
| Family Type | # Families | Family Size |
| Married-Couple | 137 (61.7%) | 2.96 |
| Single Male/Father | 0 (0.0%) | - |
| Single Female/Mother | 85 (38.3%) | 2.18 |
| Total Families | 222 (100.0%) | 2.66 |
Median Household Size in Grawn
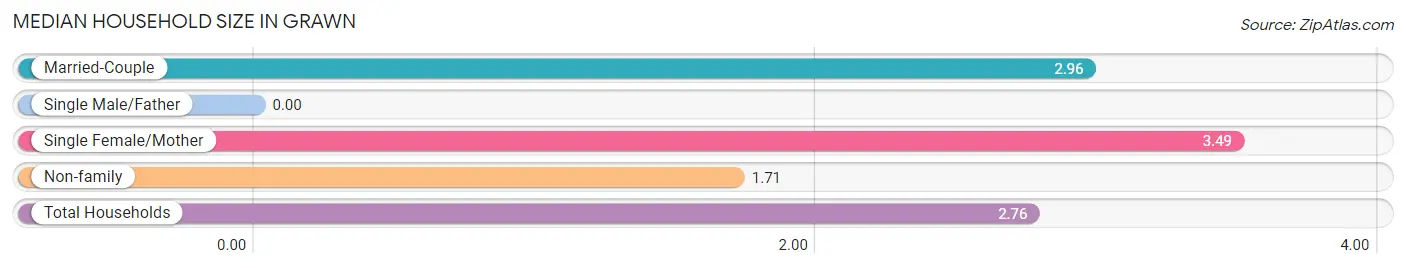
| Household Type | # Households | Household Size |
| Married-Couple | 137 (44.3%) | 2.96 |
| Single Male/Father | 0 (0.0%) | - |
| Single Female/Mother | 85 (27.5%) | 3.49 |
| Non-family | 87 (28.2%) | 1.71 |
| Total Households | 309 (100.0%) | 2.76 |
Household Size by Marriage Status in Grawn
Out of a total of 309 households in Grawn, 222 (71.8%) are family households, while 87 (28.2%) are nonfamily households. The most numerous type of family households are 2-person households, comprising 116, and the most common type of nonfamily households are 2-person households, comprising 67.
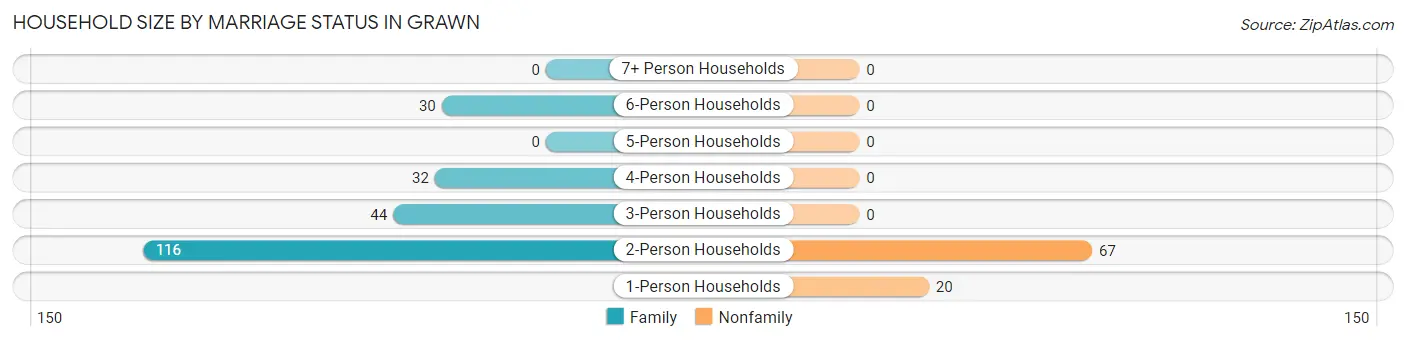
| Household Size | Family Households | Nonfamily Households |
| 1-Person Households | - | 20 (6.5%) |
| 2-Person Households | 116 (37.5%) | 67 (21.7%) |
| 3-Person Households | 44 (14.2%) | 0 (0.0%) |
| 4-Person Households | 32 (10.4%) | 0 (0.0%) |
| 5-Person Households | 0 (0.0%) | 0 (0.0%) |
| 6-Person Households | 30 (9.7%) | 0 (0.0%) |
| 7+ Person Households | 0 (0.0%) | 0 (0.0%) |
| Total | 222 (71.8%) | 87 (28.2%) |
Female Fertility in Grawn
Fertility by Age in Grawn
| Age Bracket | Women with Births | Births / 1,000 Women |
| 15 to 19 years | 0 (0.0%) | 0.0 |
| 20 to 34 years | 0 (0.0%) | 0.0 |
| 35 to 50 years | 0 (0.0%) | 0.0 |
| Total | 0 (0.0%) | 0.0 |
Fertility by Age by Marriage Status in Grawn
| Age Bracket | Married | Unmarried |
| 15 to 19 years | 0 (0.0%) | 0 (0.0%) |
| 20 to 34 years | 0 (0.0%) | 0 (0.0%) |
| 35 to 50 years | 0 (0.0%) | 0 (0.0%) |
| Total | 0 (0.0%) | 0 (0.0%) |
Fertility by Education in Grawn
| Educational Attainment | Women with Births | Births / 1,000 Women |
| Less than High School | 0 (0.0%) | 0.0 |
| High School Diploma | 0 (0.0%) | 0.0 |
| College or Associate's Degree | 0 (0.0%) | 0.0 |
| Bachelor's Degree | 0 (0.0%) | 0.0 |
| Graduate Degree | 0 (0.0%) | 0.0 |
| Total | 0 (0.0%) | 0.0 |
Fertility by Education by Marriage Status in Grawn
| Educational Attainment | Married | Unmarried |
| Less than High School | 0 (0.0%) | 0 (0.0%) |
| High School Diploma | 0 (0.0%) | 0 (0.0%) |
| College or Associate's Degree | 0 (0.0%) | 0 (0.0%) |
| Bachelor's Degree | 0 (0.0%) | 0 (0.0%) |
| Graduate Degree | 0 (0.0%) | 0 (0.0%) |
| Total | 0 (0.0%) | 0 (0.0%) |
Employment Characteristics in Grawn
Employment by Class of Employer in Grawn
Among the 455 employed individuals in Grawn, private company employees (378 | 83.1%), state government employees (44 | 9.7%), and self-employed (not incorporated) (33 | 7.2%) make up the most common classes of employment.
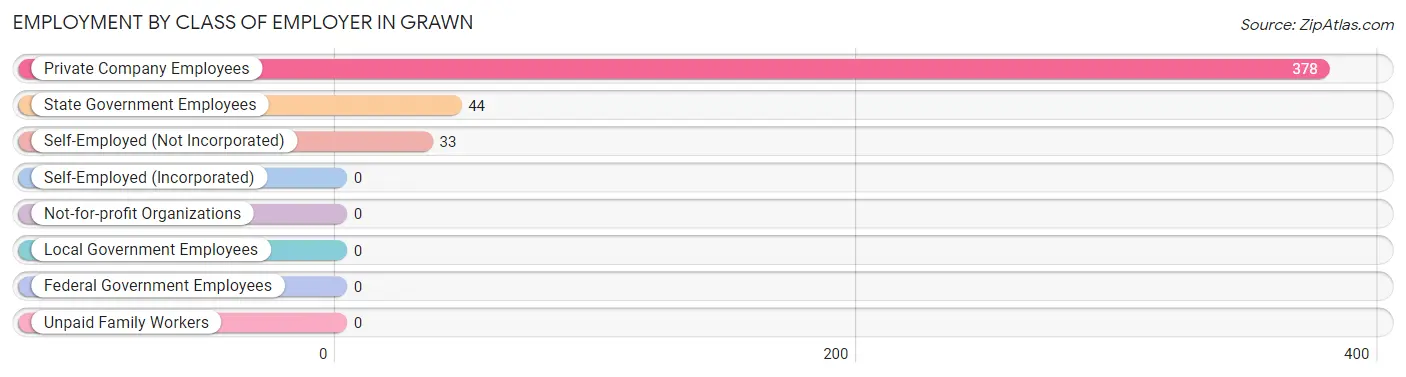
| Employer Class | # Employees | % Employees |
| Private Company Employees | 378 | 83.1% |
| Self-Employed (Incorporated) | 0 | 0.0% |
| Self-Employed (Not Incorporated) | 33 | 7.2% |
| Not-for-profit Organizations | 0 | 0.0% |
| Local Government Employees | 0 | 0.0% |
| State Government Employees | 44 | 9.7% |
| Federal Government Employees | 0 | 0.0% |
| Unpaid Family Workers | 0 | 0.0% |
| Total | 455 | 100.0% |
Employment Status by Age in Grawn
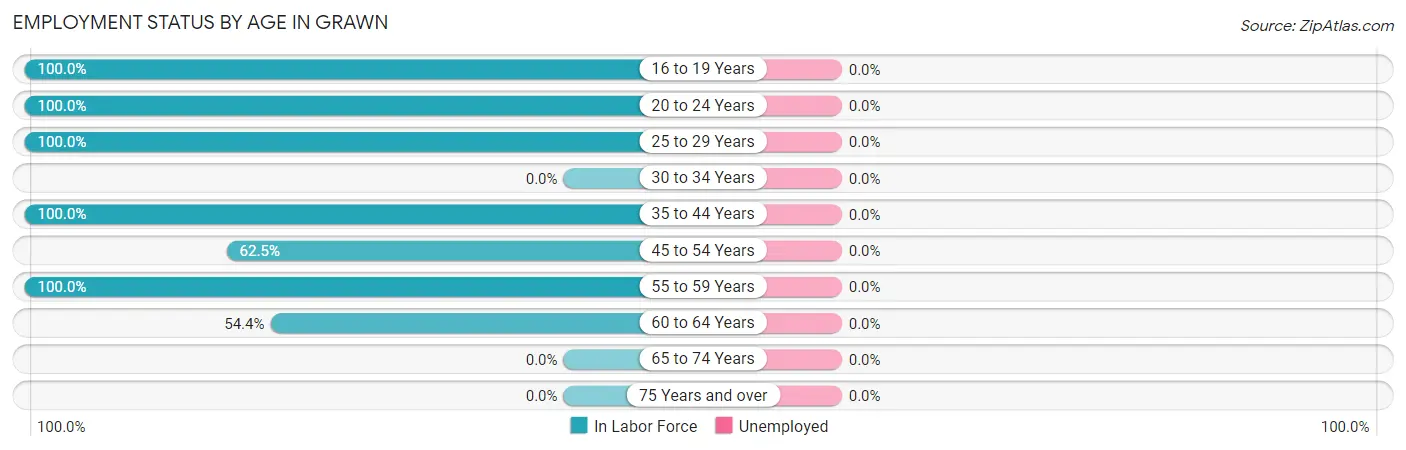
| Age Bracket | In Labor Force | Unemployed |
| 16 to 19 Years | 58 (100.0%) | 0 (0.0%) |
| 20 to 24 Years | 118 (100.0%) | 0 (0.0%) |
| 25 to 29 Years | 35 (100.0%) | 0 (0.0%) |
| 30 to 34 Years | 0 (0.0%) | 0 (0.0%) |
| 35 to 44 Years | 112 (100.0%) | 0 (0.0%) |
| 45 to 54 Years | 40 (62.5%) | 0 (0.0%) |
| 55 to 59 Years | 48 (100.0%) | 0 (0.0%) |
| 60 to 64 Years | 98 (54.4%) | 0 (0.0%) |
| 65 to 74 Years | 0 (0.0%) | 0 (0.0%) |
| 75 Years and over | 0 (0.0%) | 0 (0.0%) |
| Total | 509 (71.2%) | 0 (0.0%) |
Employment Status by Educational Attainment in Grawn
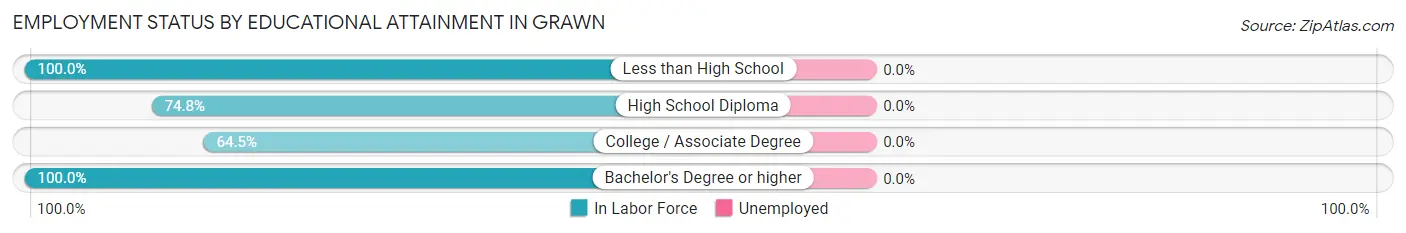
| Educational Attainment | In Labor Force | Unemployed |
| Less than High School | 45 (100.0%) | 0 (0.0%) |
| High School Diploma | 86 (74.8%) | 0 (0.0%) |
| College / Associate Degree | 140 (64.5%) | 0 (0.0%) |
| Bachelor's Degree or higher | 62 (100.0%) | 0 (0.0%) |
| Total | 333 (75.9%) | 0 (0.0%) |
Employment Occupations by Sex in Grawn
Management, Business, Science and Arts Occupations
The most common Management, Business, Science and Arts occupations in Grawn are Management (74 | 14.5%), Health Diagnosing & Treating (51 | 10.0%), Health Technologists (20 | 3.9%), and Business & Financial (11 | 2.2%).
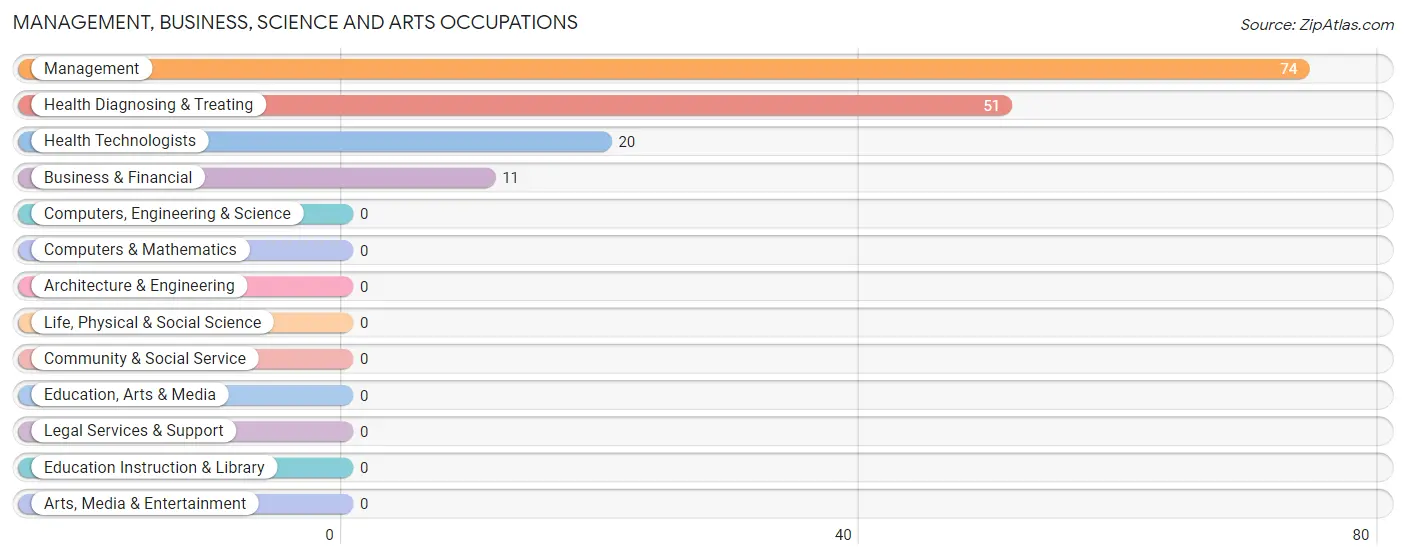
Management, Business, Science and Arts Occupations by Sex
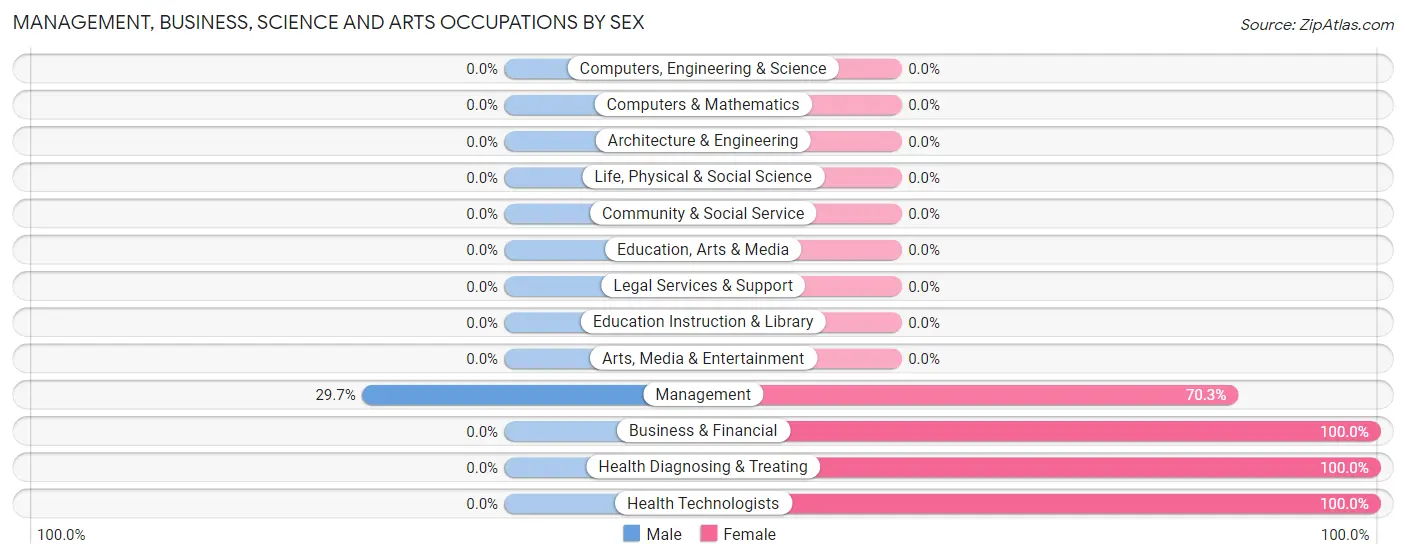
| Occupation | Male | Female |
| Management | 22 (29.7%) | 52 (70.3%) |
| Business & Financial | 0 (0.0%) | 11 (100.0%) |
| Computers, Engineering & Science | 0 (0.0%) | 0 (0.0%) |
| Computers & Mathematics | 0 (0.0%) | 0 (0.0%) |
| Architecture & Engineering | 0 (0.0%) | 0 (0.0%) |
| Life, Physical & Social Science | 0 (0.0%) | 0 (0.0%) |
| Community & Social Service | 0 (0.0%) | 0 (0.0%) |
| Education, Arts & Media | 0 (0.0%) | 0 (0.0%) |
| Legal Services & Support | 0 (0.0%) | 0 (0.0%) |
| Education Instruction & Library | 0 (0.0%) | 0 (0.0%) |
| Arts, Media & Entertainment | 0 (0.0%) | 0 (0.0%) |
| Health Diagnosing & Treating | 0 (0.0%) | 51 (100.0%) |
| Health Technologists | 0 (0.0%) | 20 (100.0%) |
| Total (Category) | 22 (16.2%) | 114 (83.8%) |
| Total (Overall) | 239 (46.9%) | 270 (53.0%) |
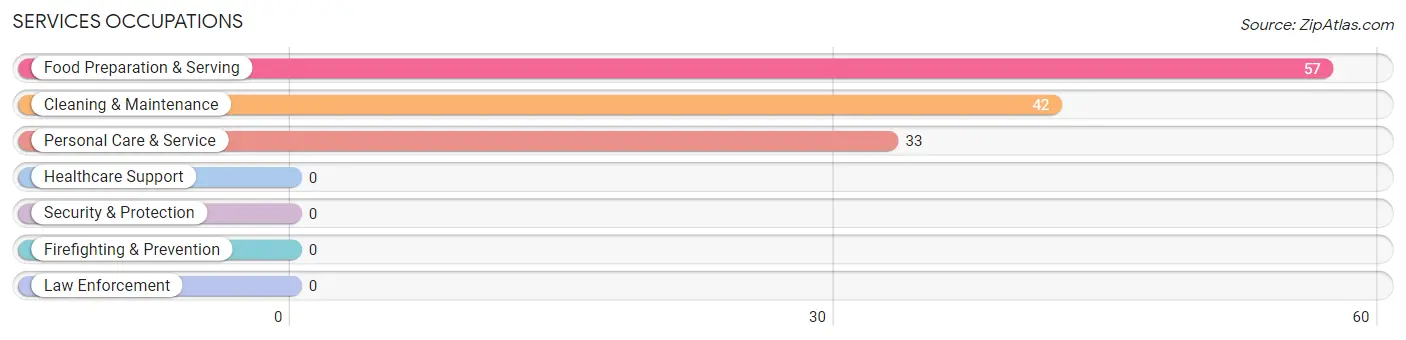
Services Occupations
The most common Services occupations in Grawn are Food Preparation & Serving (57 | 11.2%), Cleaning & Maintenance (42 | 8.3%), and Personal Care & Service (33 | 6.5%).
Services Occupations by Sex
Within the Services occupations in Grawn, the most male-oriented occupations are Cleaning & Maintenance (47.6%), and Food Preparation & Serving (24.6%), while the most female-oriented occupations are Personal Care & Service (100.0%), Food Preparation & Serving (75.4%), and Cleaning & Maintenance (52.4%).
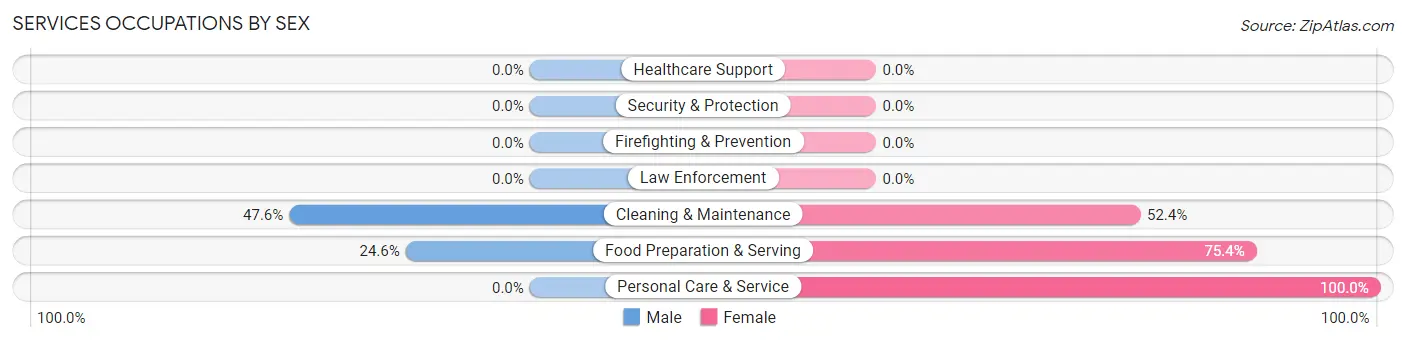
| Occupation | Male | Female |
| Healthcare Support | 0 (0.0%) | 0 (0.0%) |
| Security & Protection | 0 (0.0%) | 0 (0.0%) |
| Firefighting & Prevention | 0 (0.0%) | 0 (0.0%) |
| Law Enforcement | 0 (0.0%) | 0 (0.0%) |
| Food Preparation & Serving | 14 (24.6%) | 43 (75.4%) |
| Cleaning & Maintenance | 20 (47.6%) | 22 (52.4%) |
| Personal Care & Service | 0 (0.0%) | 33 (100.0%) |
| Total (Category) | 34 (25.8%) | 98 (74.2%) |
| Total (Overall) | 239 (46.9%) | 270 (53.0%) |
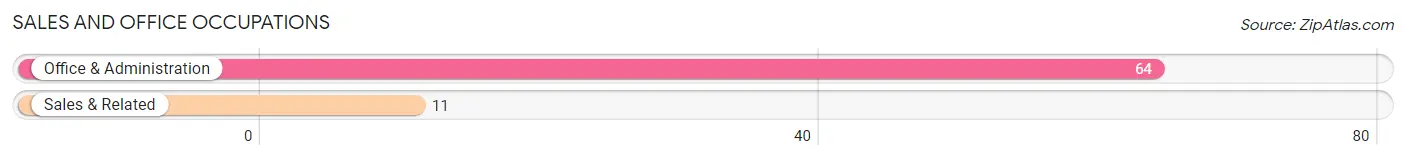
Sales and Office Occupations
The most common Sales and Office occupations in Grawn are Office & Administration (64 | 12.6%), and Sales & Related (11 | 2.2%).
Sales and Office Occupations by Sex
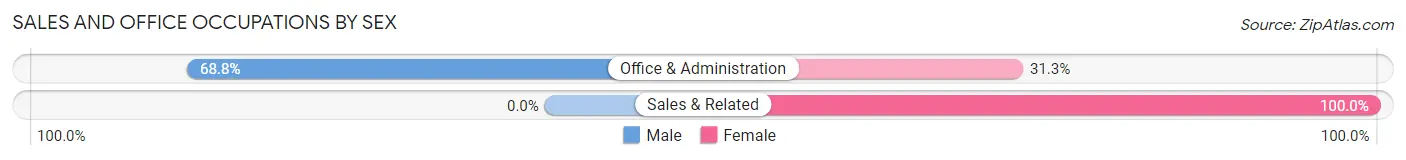
| Occupation | Male | Female |
| Sales & Related | 0 (0.0%) | 11 (100.0%) |
| Office & Administration | 44 (68.8%) | 20 (31.2%) |
| Total (Category) | 44 (58.7%) | 31 (41.3%) |
| Total (Overall) | 239 (46.9%) | 270 (53.0%) |
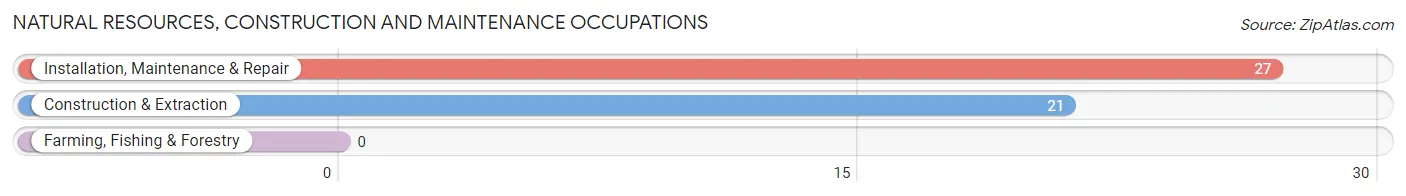
Natural Resources, Construction and Maintenance Occupations
The most common Natural Resources, Construction and Maintenance occupations in Grawn are Installation, Maintenance & Repair (27 | 5.3%), and Construction & Extraction (21 | 4.1%).
Natural Resources, Construction and Maintenance Occupations by Sex
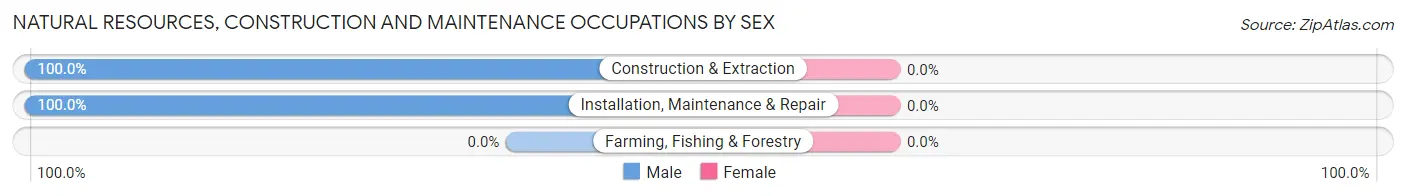
| Occupation | Male | Female |
| Farming, Fishing & Forestry | 0 (0.0%) | 0 (0.0%) |
| Construction & Extraction | 21 (100.0%) | 0 (0.0%) |
| Installation, Maintenance & Repair | 27 (100.0%) | 0 (0.0%) |
| Total (Category) | 48 (100.0%) | 0 (0.0%) |
| Total (Overall) | 239 (46.9%) | 270 (53.0%) |
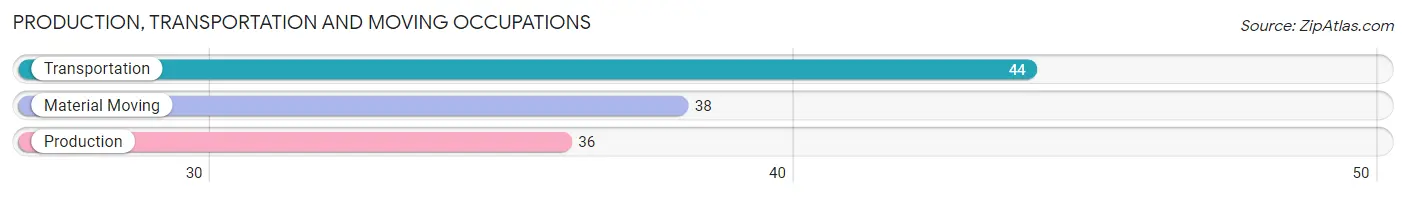
Production, Transportation and Moving Occupations
The most common Production, Transportation and Moving occupations in Grawn are Transportation (44 | 8.6%), Material Moving (38 | 7.5%), and Production (36 | 7.1%).
Production, Transportation and Moving Occupations by Sex
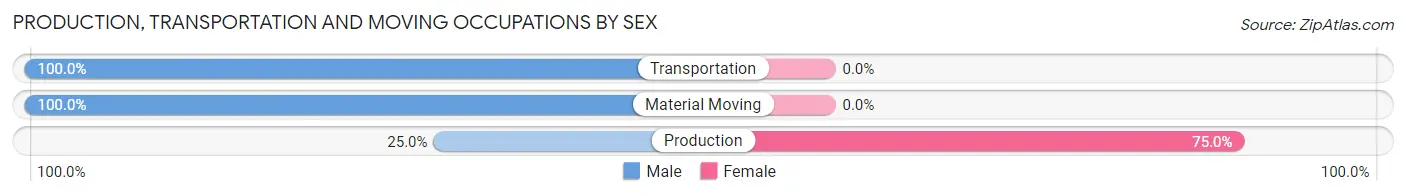
| Occupation | Male | Female |
| Production | 9 (25.0%) | 27 (75.0%) |
| Transportation | 44 (100.0%) | 0 (0.0%) |
| Material Moving | 38 (100.0%) | 0 (0.0%) |
| Total (Category) | 91 (77.1%) | 27 (22.9%) |
| Total (Overall) | 239 (46.9%) | 270 (53.0%) |
Employment Industries by Sex in Grawn
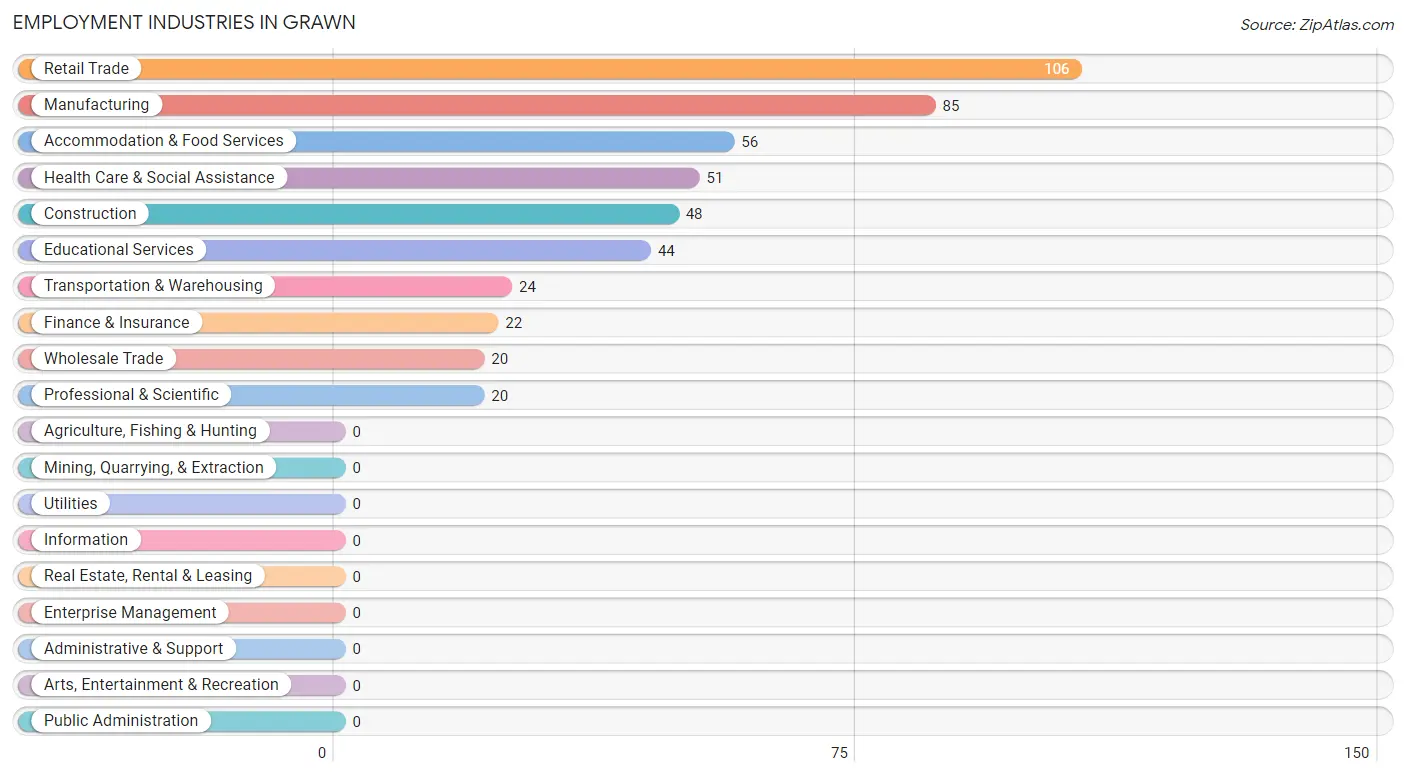
Employment Industries in Grawn
The major employment industries in Grawn include Retail Trade (106 | 20.8%), Manufacturing (85 | 16.7%), Accommodation & Food Services (56 | 11.0%), Health Care & Social Assistance (51 | 10.0%), and Construction (48 | 9.4%).
Employment Industries by Sex in Grawn
The Grawn industries that see more men than women are Construction (100.0%), Transportation & Warehousing (100.0%), and Educational Services (100.0%), whereas the industries that tend to have a higher number of women are Wholesale Trade (100.0%), Retail Trade (100.0%), and Finance & Insurance (100.0%).
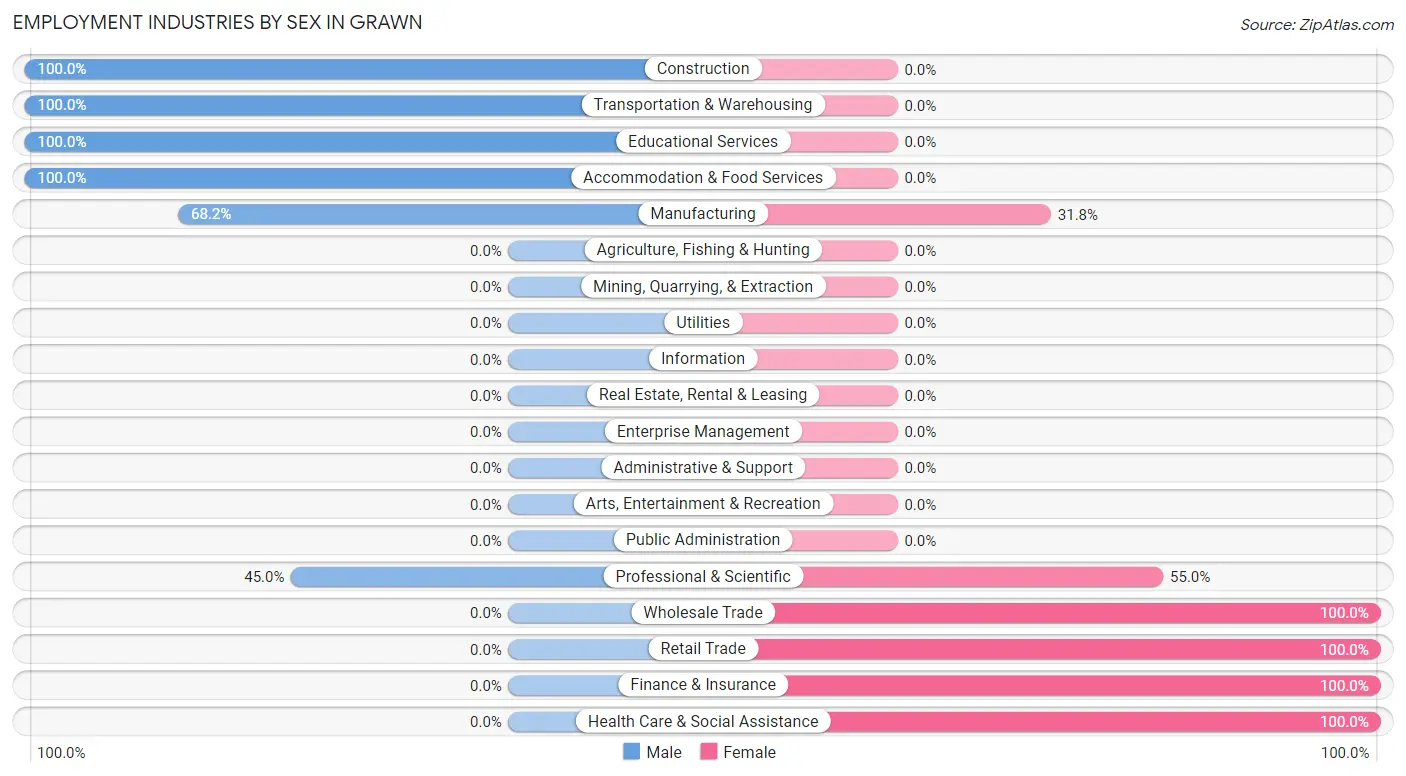
| Industry | Male | Female |
| Agriculture, Fishing & Hunting | 0 (0.0%) | 0 (0.0%) |
| Mining, Quarrying, & Extraction | 0 (0.0%) | 0 (0.0%) |
| Construction | 48 (100.0%) | 0 (0.0%) |
| Manufacturing | 58 (68.2%) | 27 (31.8%) |
| Wholesale Trade | 0 (0.0%) | 20 (100.0%) |
| Retail Trade | 0 (0.0%) | 106 (100.0%) |
| Transportation & Warehousing | 24 (100.0%) | 0 (0.0%) |
| Utilities | 0 (0.0%) | 0 (0.0%) |
| Information | 0 (0.0%) | 0 (0.0%) |
| Finance & Insurance | 0 (0.0%) | 22 (100.0%) |
| Real Estate, Rental & Leasing | 0 (0.0%) | 0 (0.0%) |
| Professional & Scientific | 9 (45.0%) | 11 (55.0%) |
| Enterprise Management | 0 (0.0%) | 0 (0.0%) |
| Administrative & Support | 0 (0.0%) | 0 (0.0%) |
| Educational Services | 44 (100.0%) | 0 (0.0%) |
| Health Care & Social Assistance | 0 (0.0%) | 51 (100.0%) |
| Arts, Entertainment & Recreation | 0 (0.0%) | 0 (0.0%) |
| Accommodation & Food Services | 56 (100.0%) | 0 (0.0%) |
| Public Administration | 0 (0.0%) | 0 (0.0%) |
| Total | 239 (46.9%) | 270 (53.0%) |
Education in Grawn
School Enrollment in Grawn
The most common levels of schooling among the 258 students in Grawn are college / undergraduate (107 | 41.5%), elementary school (60 | 23.3%), and middle school (52 | 20.2%).
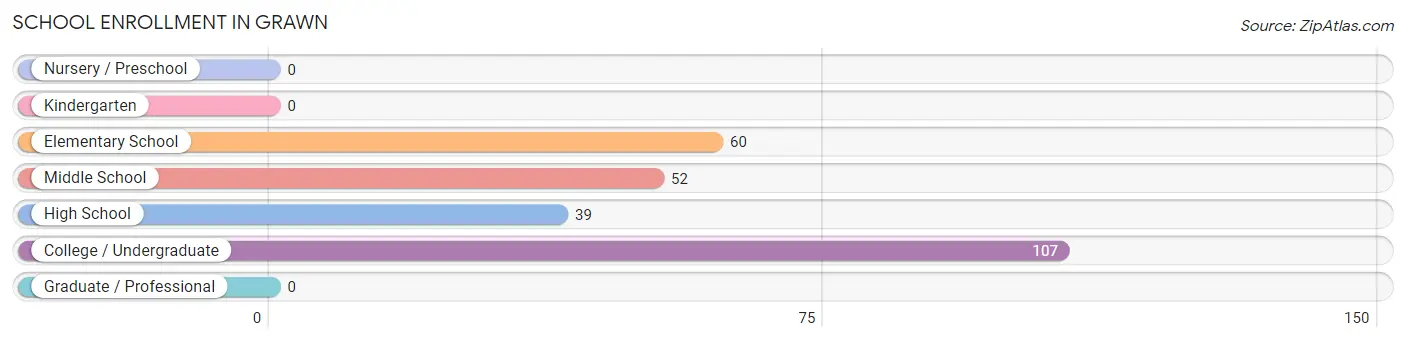
| School Level | # Students | % Students |
| Nursery / Preschool | 0 | 0.0% |
| Kindergarten | 0 | 0.0% |
| Elementary School | 60 | 23.3% |
| Middle School | 52 | 20.2% |
| High School | 39 | 15.1% |
| College / Undergraduate | 107 | 41.5% |
| Graduate / Professional | 0 | 0.0% |
| Total | 258 | 100.0% |
School Enrollment by Age by Funding Source in Grawn
Out of a total of 258 students who are enrolled in schools in Grawn, 44 (17.1%) attend a private institution, while the remaining 214 (82.9%) are enrolled in public schools. The age group of 18 to 19 year olds has the highest likelihood of being enrolled in private schools, with 44 (75.9% in the age bracket) enrolled. Conversely, the age group of 5 to 9 year old has the lowest likelihood of being enrolled in a private school, with 60 (100.0% in the age bracket) attending a public institution.
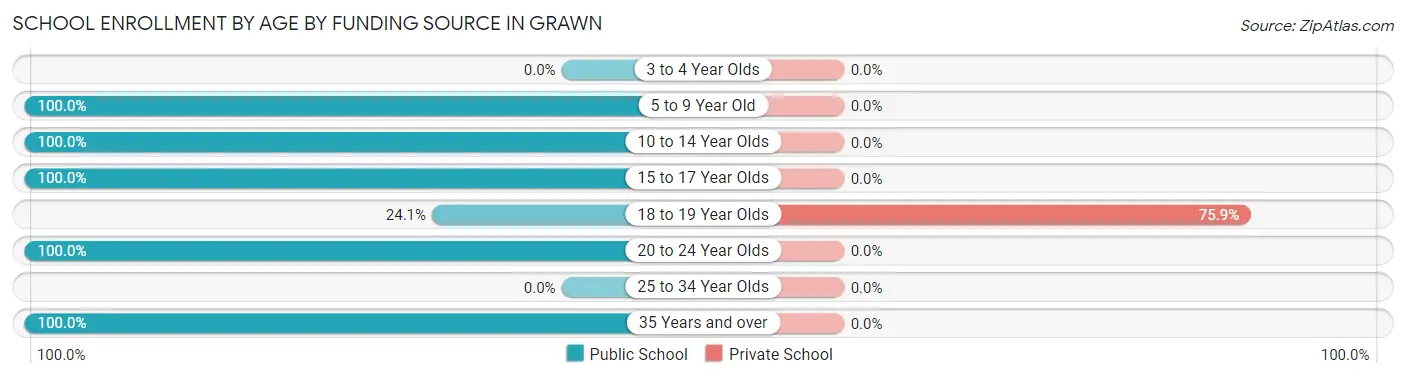
| Age Bracket | Public School | Private School |
| 3 to 4 Year Olds | 0 (0.0%) | 0 (0.0%) |
| 5 to 9 Year Old | 60 (100.0%) | 0 (0.0%) |
| 10 to 14 Year Olds | 52 (100.0%) | 0 (0.0%) |
| 15 to 17 Year Olds | 25 (100.0%) | 0 (0.0%) |
| 18 to 19 Year Olds | 14 (24.1%) | 44 (75.9%) |
| 20 to 24 Year Olds | 43 (100.0%) | 0 (0.0%) |
| 25 to 34 Year Olds | 0 (0.0%) | 0 (0.0%) |
| 35 Years and over | 20 (100.0%) | 0 (0.0%) |
| Total | 214 (82.9%) | 44 (17.1%) |
Educational Attainment by Field of Study in Grawn
Education (27 | 43.5%), liberal arts & history (24 | 38.7%), and business (11 | 17.7%) are the most common fields of study among 62 individuals in Grawn who have obtained a bachelor's degree or higher.
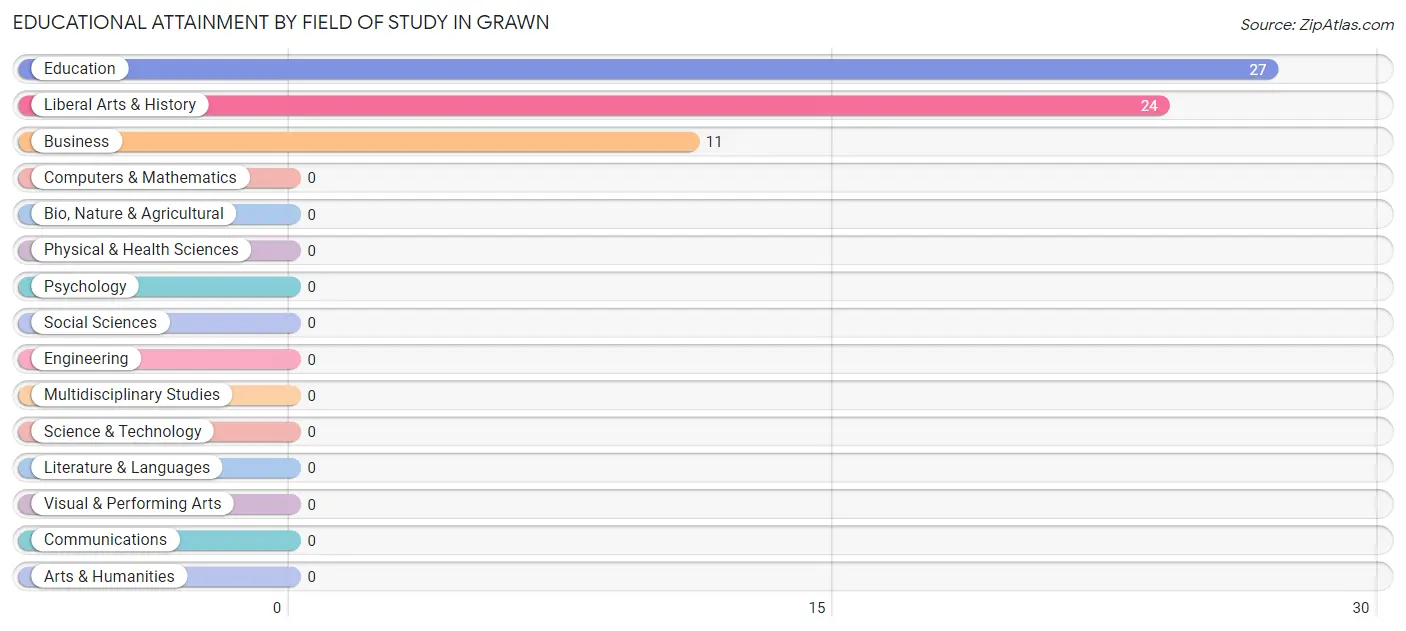
| Field of Study | # Graduates | % Graduates |
| Computers & Mathematics | 0 | 0.0% |
| Bio, Nature & Agricultural | 0 | 0.0% |
| Physical & Health Sciences | 0 | 0.0% |
| Psychology | 0 | 0.0% |
| Social Sciences | 0 | 0.0% |
| Engineering | 0 | 0.0% |
| Multidisciplinary Studies | 0 | 0.0% |
| Science & Technology | 0 | 0.0% |
| Business | 11 | 17.7% |
| Education | 27 | 43.5% |
| Literature & Languages | 0 | 0.0% |
| Liberal Arts & History | 24 | 38.7% |
| Visual & Performing Arts | 0 | 0.0% |
| Communications | 0 | 0.0% |
| Arts & Humanities | 0 | 0.0% |
| Total | 62 | 100.0% |
Transportation & Commute in Grawn
Vehicle Availability by Sex in Grawn
The most prevalent vehicle ownership categories in Grawn are males with 2 vehicles (84, accounting for 45.4%) and females with 2 vehicles (66, making up 31.1%).
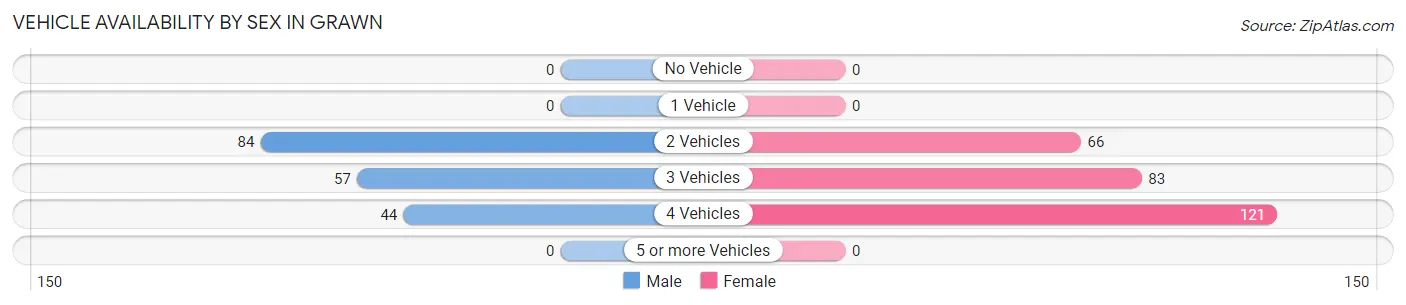
| Vehicles Available | Male | Female |
| No Vehicle | 0 (0.0%) | 0 (0.0%) |
| 1 Vehicle | 0 (0.0%) | 0 (0.0%) |
| 2 Vehicles | 84 (45.4%) | 66 (24.4%) |
| 3 Vehicles | 57 (30.8%) | 83 (30.7%) |
| 4 Vehicles | 44 (23.8%) | 121 (44.8%) |
| 5 or more Vehicles | 0 (0.0%) | 0 (0.0%) |
| Total | 185 (100.0%) | 270 (100.0%) |
Commute Time in Grawn
The most frequently occuring commute durations in Grawn are 25 to 29 minutes (134 commuters, 30.2%), 20 to 24 minutes (98 commuters, 22.1%), and 15 to 19 minutes (86 commuters, 19.4%).
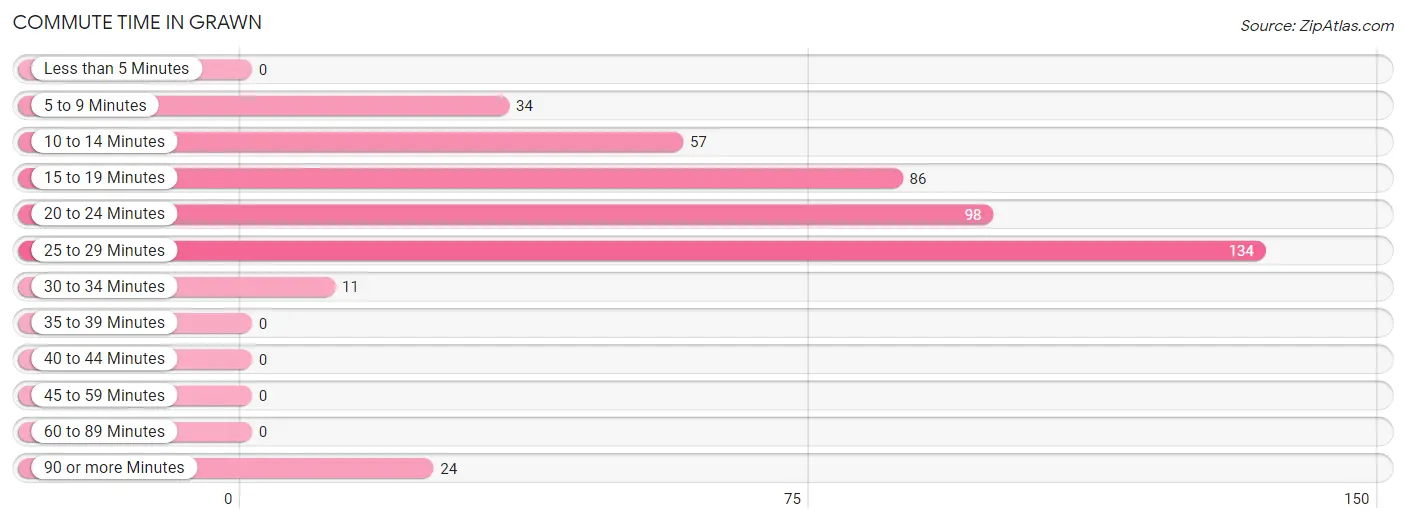
| Commute Time | # Commuters | % Commuters |
| Less than 5 Minutes | 0 | 0.0% |
| 5 to 9 Minutes | 34 | 7.7% |
| 10 to 14 Minutes | 57 | 12.8% |
| 15 to 19 Minutes | 86 | 19.4% |
| 20 to 24 Minutes | 98 | 22.1% |
| 25 to 29 Minutes | 134 | 30.2% |
| 30 to 34 Minutes | 11 | 2.5% |
| 35 to 39 Minutes | 0 | 0.0% |
| 40 to 44 Minutes | 0 | 0.0% |
| 45 to 59 Minutes | 0 | 0.0% |
| 60 to 89 Minutes | 0 | 0.0% |
| 90 or more Minutes | 24 | 5.4% |
Commute Time by Sex in Grawn
The most common commute times in Grawn are 25 to 29 minutes (64 commuters, 34.6%) for males and 20 to 24 minutes (77 commuters, 29.7%) for females.
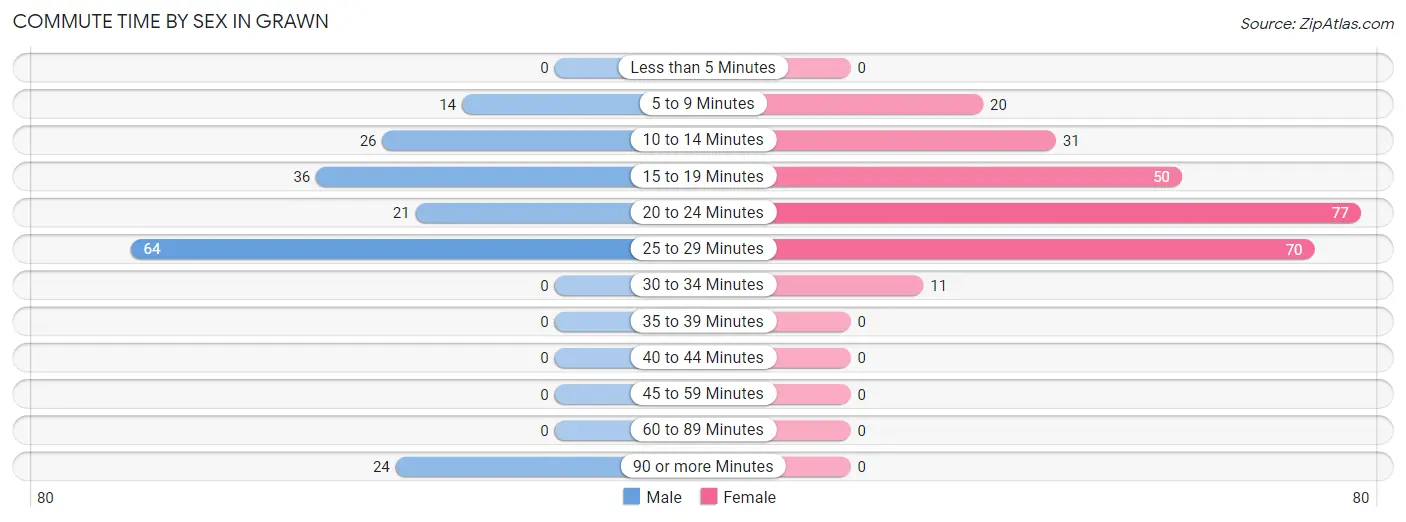
| Commute Time | Male | Female |
| Less than 5 Minutes | 0 (0.0%) | 0 (0.0%) |
| 5 to 9 Minutes | 14 (7.6%) | 20 (7.7%) |
| 10 to 14 Minutes | 26 (14.1%) | 31 (12.0%) |
| 15 to 19 Minutes | 36 (19.5%) | 50 (19.3%) |
| 20 to 24 Minutes | 21 (11.4%) | 77 (29.7%) |
| 25 to 29 Minutes | 64 (34.6%) | 70 (27.0%) |
| 30 to 34 Minutes | 0 (0.0%) | 11 (4.3%) |
| 35 to 39 Minutes | 0 (0.0%) | 0 (0.0%) |
| 40 to 44 Minutes | 0 (0.0%) | 0 (0.0%) |
| 45 to 59 Minutes | 0 (0.0%) | 0 (0.0%) |
| 60 to 89 Minutes | 0 (0.0%) | 0 (0.0%) |
| 90 or more Minutes | 24 (13.0%) | 0 (0.0%) |
Time of Departure to Work by Sex in Grawn
The most frequent times of departure to work in Grawn are 9:00 AM to 9:59 AM (73, 39.5%) for males and 7:30 AM to 7:59 AM (72, 27.8%) for females.
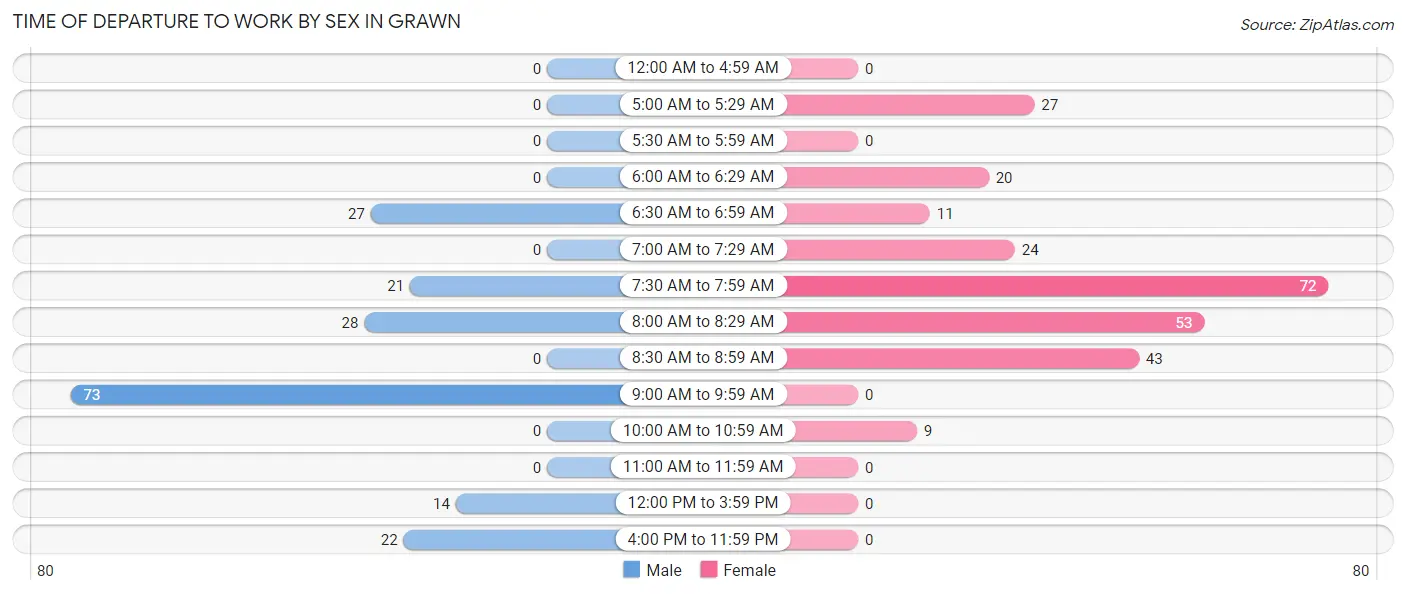
| Time of Departure | Male | Female |
| 12:00 AM to 4:59 AM | 0 (0.0%) | 0 (0.0%) |
| 5:00 AM to 5:29 AM | 0 (0.0%) | 27 (10.4%) |
| 5:30 AM to 5:59 AM | 0 (0.0%) | 0 (0.0%) |
| 6:00 AM to 6:29 AM | 0 (0.0%) | 20 (7.7%) |
| 6:30 AM to 6:59 AM | 27 (14.6%) | 11 (4.3%) |
| 7:00 AM to 7:29 AM | 0 (0.0%) | 24 (9.3%) |
| 7:30 AM to 7:59 AM | 21 (11.4%) | 72 (27.8%) |
| 8:00 AM to 8:29 AM | 28 (15.1%) | 53 (20.5%) |
| 8:30 AM to 8:59 AM | 0 (0.0%) | 43 (16.6%) |
| 9:00 AM to 9:59 AM | 73 (39.5%) | 0 (0.0%) |
| 10:00 AM to 10:59 AM | 0 (0.0%) | 9 (3.5%) |
| 11:00 AM to 11:59 AM | 0 (0.0%) | 0 (0.0%) |
| 12:00 PM to 3:59 PM | 14 (7.6%) | 0 (0.0%) |
| 4:00 PM to 11:59 PM | 22 (11.9%) | 0 (0.0%) |
| Total | 185 (100.0%) | 259 (100.0%) |
Housing Occupancy in Grawn
Occupancy by Ownership in Grawn
Of the total 309 dwellings in Grawn, owner-occupied units account for 279 (90.3%), while renter-occupied units make up 30 (9.7%).
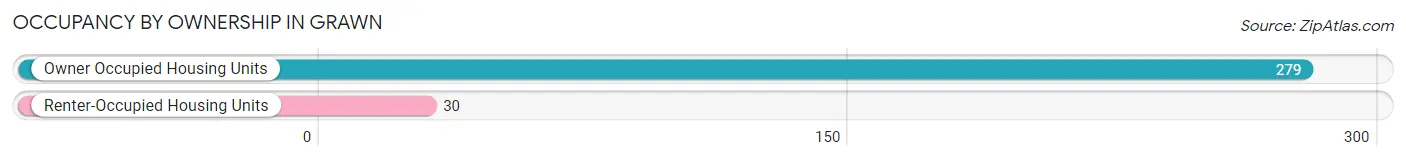
| Occupancy | # Housing Units | % Housing Units |
| Owner Occupied Housing Units | 279 | 90.3% |
| Renter-Occupied Housing Units | 30 | 9.7% |
| Total Occupied Housing Units | 309 | 100.0% |
Occupancy by Household Size in Grawn
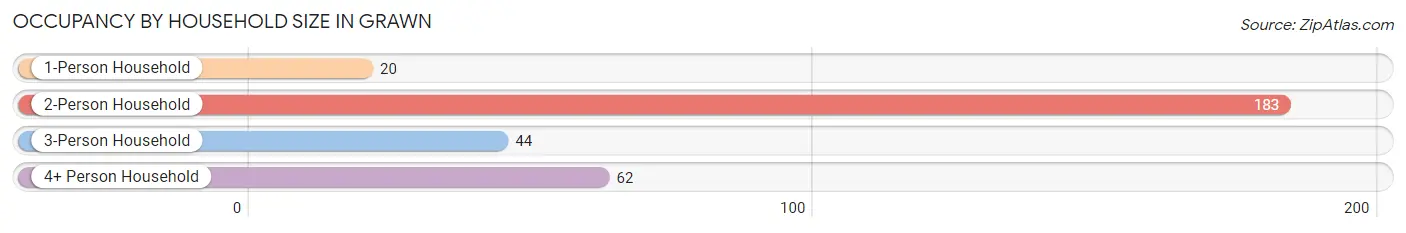
| Household Size | # Housing Units | % Housing Units |
| 1-Person Household | 20 | 6.5% |
| 2-Person Household | 183 | 59.2% |
| 3-Person Household | 44 | 14.2% |
| 4+ Person Household | 62 | 20.1% |
| Total Housing Units | 309 | 100.0% |
Occupancy by Ownership by Household Size in Grawn
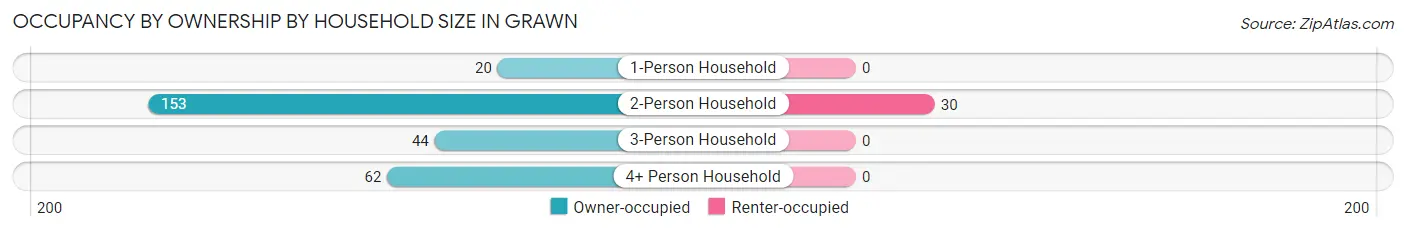
| Household Size | Owner-occupied | Renter-occupied |
| 1-Person Household | 20 (100.0%) | 0 (0.0%) |
| 2-Person Household | 153 (83.6%) | 30 (16.4%) |
| 3-Person Household | 44 (100.0%) | 0 (0.0%) |
| 4+ Person Household | 62 (100.0%) | 0 (0.0%) |
| Total Housing Units | 279 (90.3%) | 30 (9.7%) |
Occupancy by Educational Attainment in Grawn
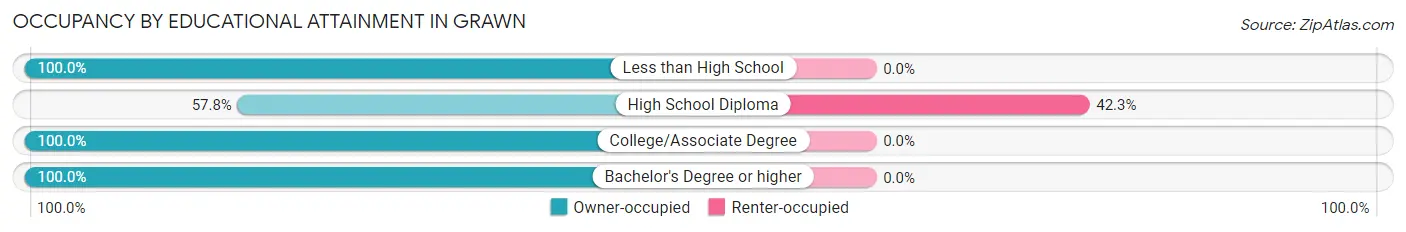
| Household Size | Owner-occupied | Renter-occupied |
| Less than High School | 44 (100.0%) | 0 (0.0%) |
| High School Diploma | 41 (57.8%) | 30 (42.2%) |
| College/Associate Degree | 183 (100.0%) | 0 (0.0%) |
| Bachelor's Degree or higher | 11 (100.0%) | 0 (0.0%) |
Occupancy by Age of Householder in Grawn
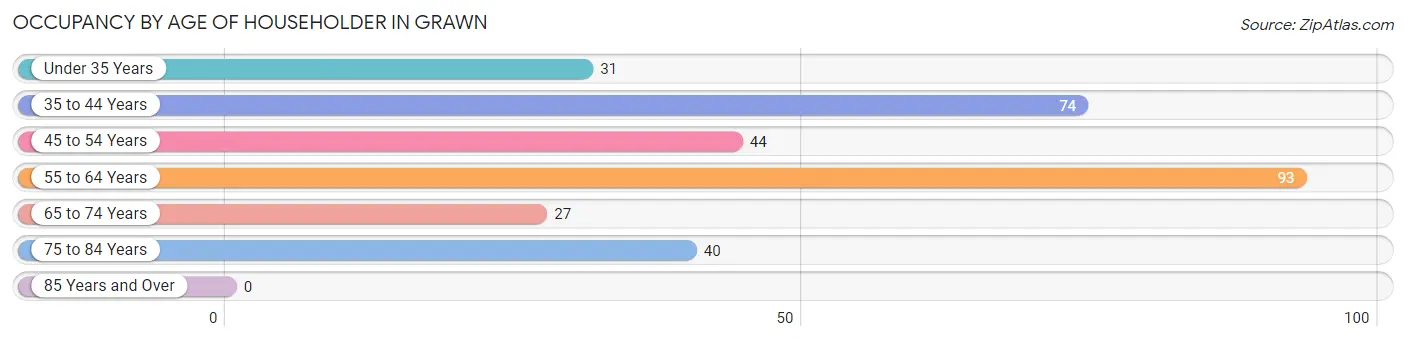
| Age Bracket | # Households | % Households |
| Under 35 Years | 31 | 10.0% |
| 35 to 44 Years | 74 | 23.9% |
| 45 to 54 Years | 44 | 14.2% |
| 55 to 64 Years | 93 | 30.1% |
| 65 to 74 Years | 27 | 8.7% |
| 75 to 84 Years | 40 | 12.9% |
| 85 Years and Over | 0 | 0.0% |
| Total | 309 | 100.0% |
Housing Finances in Grawn
Median Income by Occupancy in Grawn
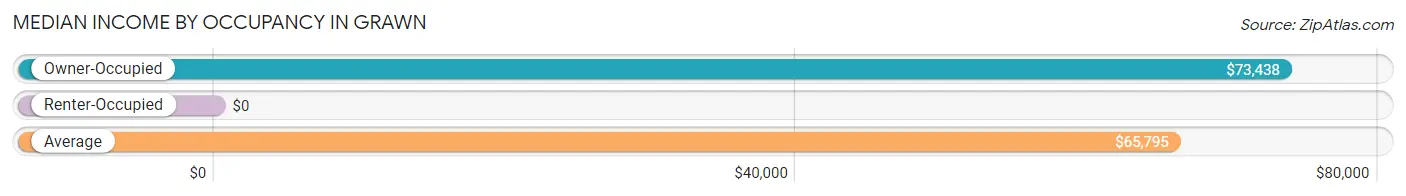
| Occupancy Type | # Households | Median Income |
| Owner-Occupied | 279 (90.3%) | $73,438 |
| Renter-Occupied | 30 (9.7%) | $0 |
| Average | 309 (100.0%) | $65,795 |
Occupancy by Householder Income Bracket in Grawn
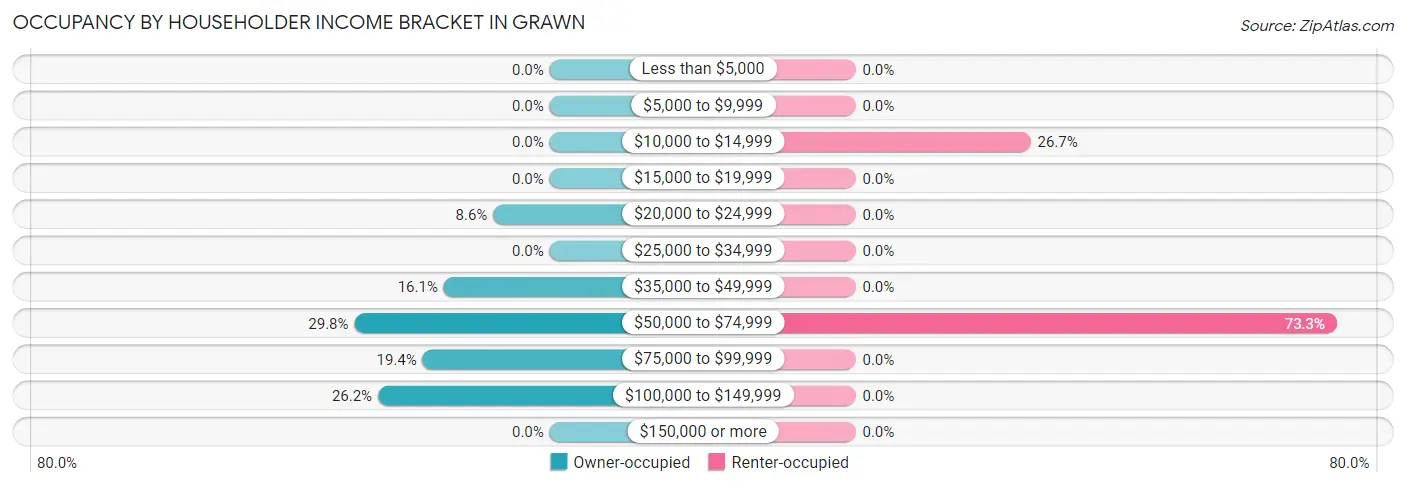
| Income Bracket | Owner-occupied | Renter-occupied |
| Less than $5,000 | 0 (0.0%) | 0 (0.0%) |
| $5,000 to $9,999 | 0 (0.0%) | 0 (0.0%) |
| $10,000 to $14,999 | 0 (0.0%) | 8 (26.7%) |
| $15,000 to $19,999 | 0 (0.0%) | 0 (0.0%) |
| $20,000 to $24,999 | 24 (8.6%) | 0 (0.0%) |
| $25,000 to $34,999 | 0 (0.0%) | 0 (0.0%) |
| $35,000 to $49,999 | 45 (16.1%) | 0 (0.0%) |
| $50,000 to $74,999 | 83 (29.7%) | 22 (73.3%) |
| $75,000 to $99,999 | 54 (19.4%) | 0 (0.0%) |
| $100,000 to $149,999 | 73 (26.2%) | 0 (0.0%) |
| $150,000 or more | 0 (0.0%) | 0 (0.0%) |
| Total | 279 (100.0%) | 30 (100.0%) |
Monthly Housing Cost Tiers in Grawn
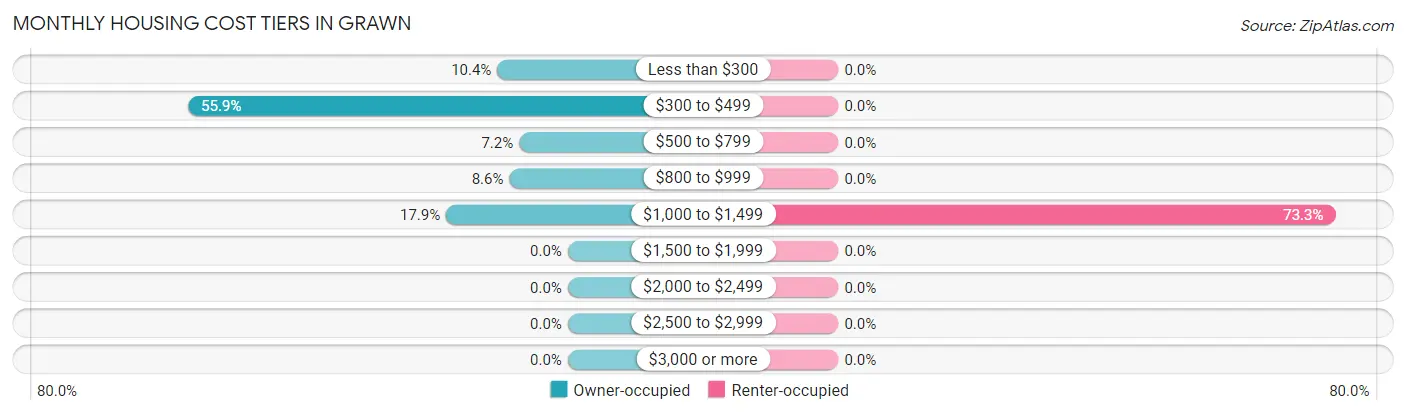
| Monthly Cost | Owner-occupied | Renter-occupied |
| Less than $300 | 29 (10.4%) | 0 (0.0%) |
| $300 to $499 | 156 (55.9%) | 0 (0.0%) |
| $500 to $799 | 20 (7.2%) | 0 (0.0%) |
| $800 to $999 | 24 (8.6%) | 0 (0.0%) |
| $1,000 to $1,499 | 50 (17.9%) | 22 (73.3%) |
| $1,500 to $1,999 | 0 (0.0%) | 0 (0.0%) |
| $2,000 to $2,499 | 0 (0.0%) | 0 (0.0%) |
| $2,500 to $2,999 | 0 (0.0%) | 0 (0.0%) |
| $3,000 or more | 0 (0.0%) | 0 (0.0%) |
| Total | 279 (100.0%) | 30 (100.0%) |
Physical Housing Characteristics in Grawn
Housing Structures in Grawn
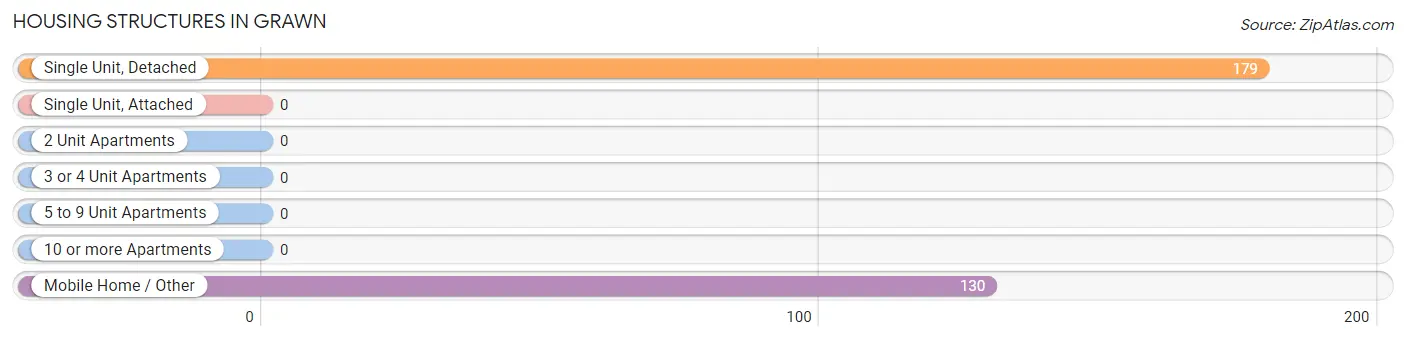
| Structure Type | # Housing Units | % Housing Units |
| Single Unit, Detached | 179 | 57.9% |
| Single Unit, Attached | 0 | 0.0% |
| 2 Unit Apartments | 0 | 0.0% |
| 3 or 4 Unit Apartments | 0 | 0.0% |
| 5 to 9 Unit Apartments | 0 | 0.0% |
| 10 or more Apartments | 0 | 0.0% |
| Mobile Home / Other | 130 | 42.1% |
| Total | 309 | 100.0% |
Housing Structures by Occupancy in Grawn
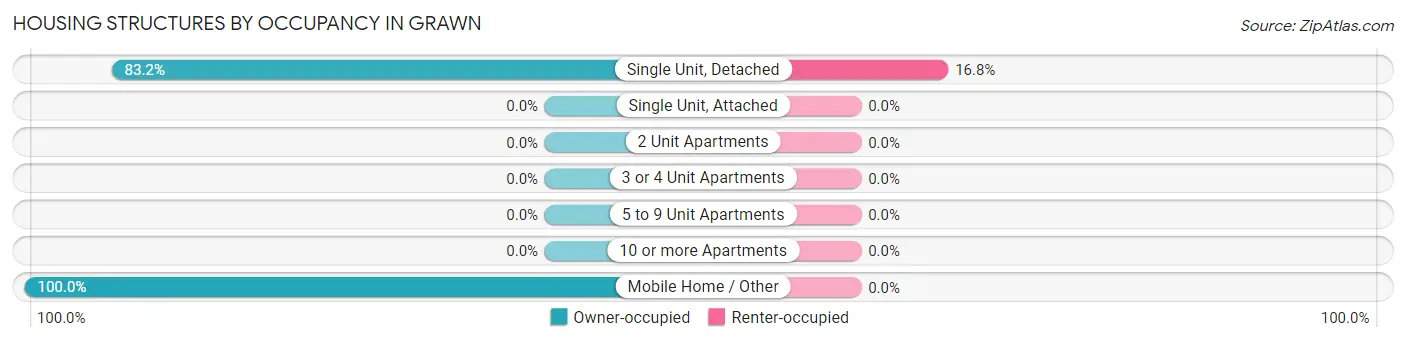
| Structure Type | Owner-occupied | Renter-occupied |
| Single Unit, Detached | 149 (83.2%) | 30 (16.8%) |
| Single Unit, Attached | 0 (0.0%) | 0 (0.0%) |
| 2 Unit Apartments | 0 (0.0%) | 0 (0.0%) |
| 3 or 4 Unit Apartments | 0 (0.0%) | 0 (0.0%) |
| 5 to 9 Unit Apartments | 0 (0.0%) | 0 (0.0%) |
| 10 or more Apartments | 0 (0.0%) | 0 (0.0%) |
| Mobile Home / Other | 130 (100.0%) | 0 (0.0%) |
| Total | 279 (90.3%) | 30 (9.7%) |
Housing Structures by Number of Rooms in Grawn
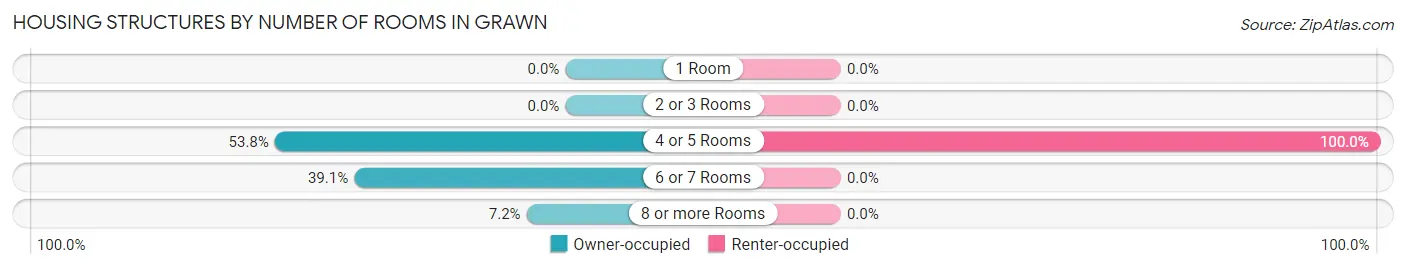
| Number of Rooms | Owner-occupied | Renter-occupied |
| 1 Room | 0 (0.0%) | 0 (0.0%) |
| 2 or 3 Rooms | 0 (0.0%) | 0 (0.0%) |
| 4 or 5 Rooms | 150 (53.8%) | 30 (100.0%) |
| 6 or 7 Rooms | 109 (39.1%) | 0 (0.0%) |
| 8 or more Rooms | 20 (7.2%) | 0 (0.0%) |
| Total | 279 (100.0%) | 30 (100.0%) |
Housing Structure by Heating Type in Grawn
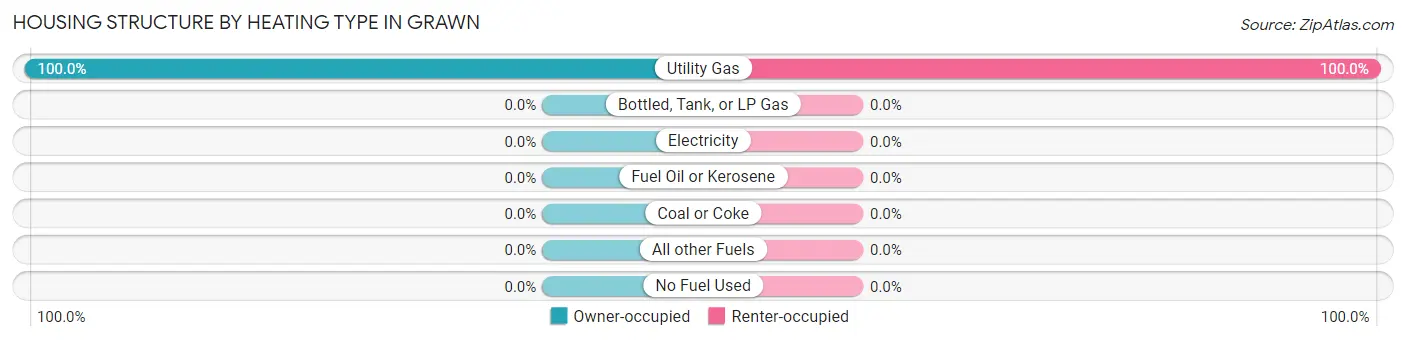
| Heating Type | Owner-occupied | Renter-occupied |
| Utility Gas | 279 (100.0%) | 30 (100.0%) |
| Bottled, Tank, or LP Gas | 0 (0.0%) | 0 (0.0%) |
| Electricity | 0 (0.0%) | 0 (0.0%) |
| Fuel Oil or Kerosene | 0 (0.0%) | 0 (0.0%) |
| Coal or Coke | 0 (0.0%) | 0 (0.0%) |
| All other Fuels | 0 (0.0%) | 0 (0.0%) |
| No Fuel Used | 0 (0.0%) | 0 (0.0%) |
| Total | 279 (100.0%) | 30 (100.0%) |
Household Vehicle Usage in Grawn
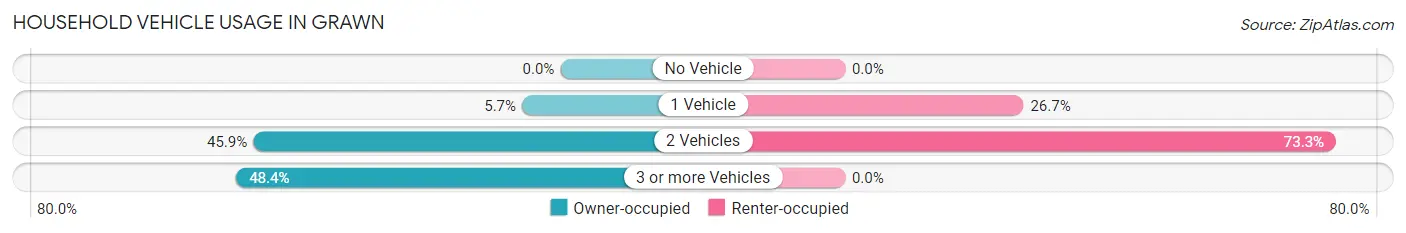
| Vehicles per Household | Owner-occupied | Renter-occupied |
| No Vehicle | 0 (0.0%) | 0 (0.0%) |
| 1 Vehicle | 16 (5.7%) | 8 (26.7%) |
| 2 Vehicles | 128 (45.9%) | 22 (73.3%) |
| 3 or more Vehicles | 135 (48.4%) | 0 (0.0%) |
| Total | 279 (100.0%) | 30 (100.0%) |
Real Estate & Mortgages in Grawn
Real Estate and Mortgage Overview in Grawn
| Characteristic | Without Mortgage | With Mortgage |
| Housing Units | 185 | 94 |
| Median Property Value | $133,000 | $122,200 |
| Median Household Income | $80,469 | $0 |
| Monthly Housing Costs | $367 | $0 |
| Real Estate Taxes | $1,152 | $0 |
Property Value by Mortgage Status in Grawn
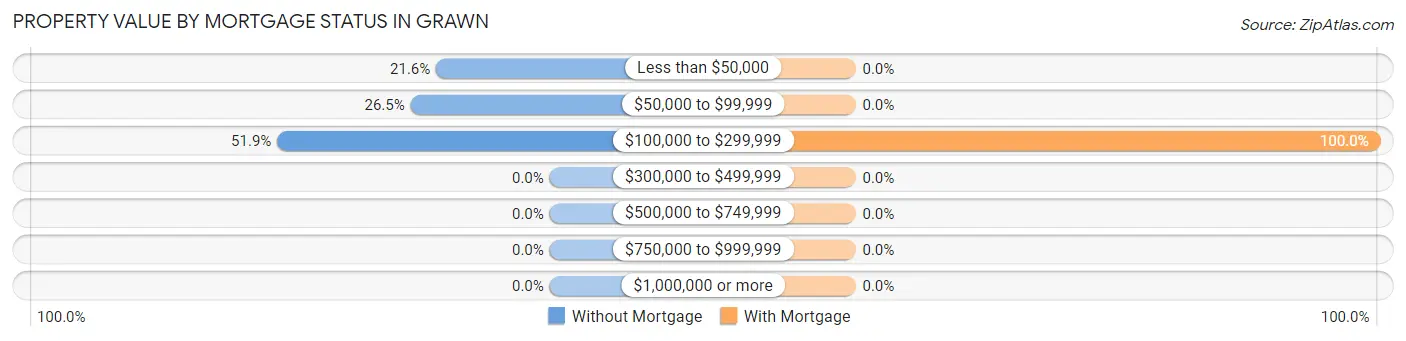
| Property Value | Without Mortgage | With Mortgage |
| Less than $50,000 | 40 (21.6%) | 0 (0.0%) |
| $50,000 to $99,999 | 49 (26.5%) | 0 (0.0%) |
| $100,000 to $299,999 | 96 (51.9%) | 94 (100.0%) |
| $300,000 to $499,999 | 0 (0.0%) | 0 (0.0%) |
| $500,000 to $749,999 | 0 (0.0%) | 0 (0.0%) |
| $750,000 to $999,999 | 0 (0.0%) | 0 (0.0%) |
| $1,000,000 or more | 0 (0.0%) | 0 (0.0%) |
| Total | 185 (100.0%) | 94 (100.0%) |
Household Income by Mortgage Status in Grawn
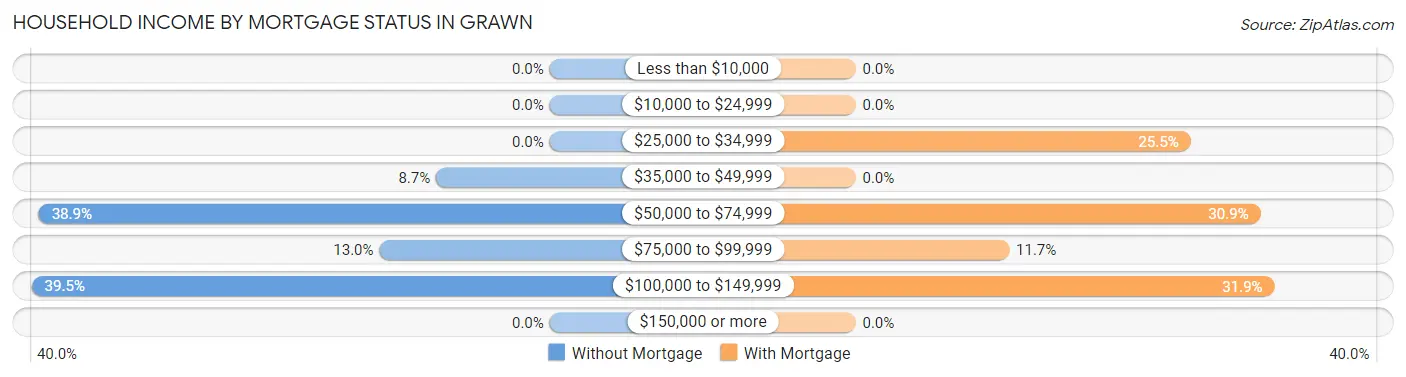
| Household Income | Without Mortgage | With Mortgage |
| Less than $10,000 | 0 (0.0%) | 0 (0.0%) |
| $10,000 to $24,999 | 0 (0.0%) | 0 (0.0%) |
| $25,000 to $34,999 | 0 (0.0%) | 24 (25.5%) |
| $35,000 to $49,999 | 16 (8.6%) | 0 (0.0%) |
| $50,000 to $74,999 | 72 (38.9%) | 29 (30.8%) |
| $75,000 to $99,999 | 24 (13.0%) | 11 (11.7%) |
| $100,000 to $149,999 | 73 (39.5%) | 30 (31.9%) |
| $150,000 or more | 0 (0.0%) | 0 (0.0%) |
| Total | 185 (100.0%) | 94 (100.0%) |
Property Value to Household Income Ratio in Grawn
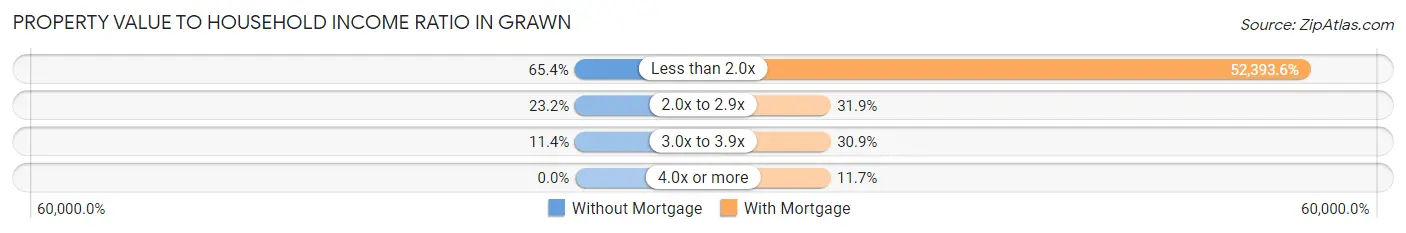
| Value-to-Income Ratio | Without Mortgage | With Mortgage |
| Less than 2.0x | 121 (65.4%) | 49,250 (52,393.6%) |
| 2.0x to 2.9x | 43 (23.2%) | 30 (31.9%) |
| 3.0x to 3.9x | 21 (11.4%) | 29 (30.8%) |
| 4.0x or more | 0 (0.0%) | 11 (11.7%) |
| Total | 185 (100.0%) | 94 (100.0%) |
Real Estate Taxes by Mortgage Status in Grawn
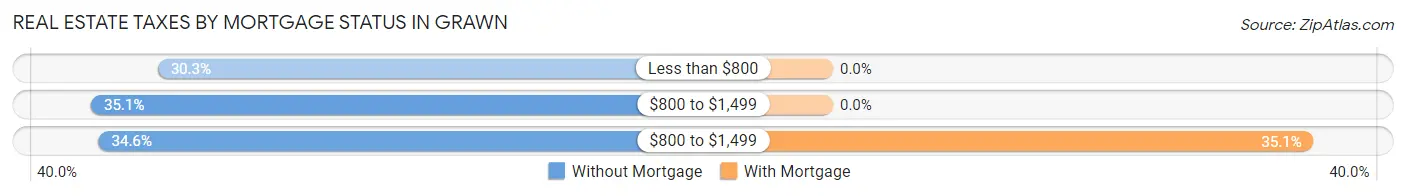
| Property Taxes | Without Mortgage | With Mortgage |
| Less than $800 | 56 (30.3%) | 0 (0.0%) |
| $800 to $1,499 | 65 (35.1%) | 0 (0.0%) |
| $800 to $1,499 | 64 (34.6%) | 33 (35.1%) |
| Total | 185 (100.0%) | 94 (100.0%) |
Health & Disability in Grawn
Health Insurance Coverage by Age in Grawn
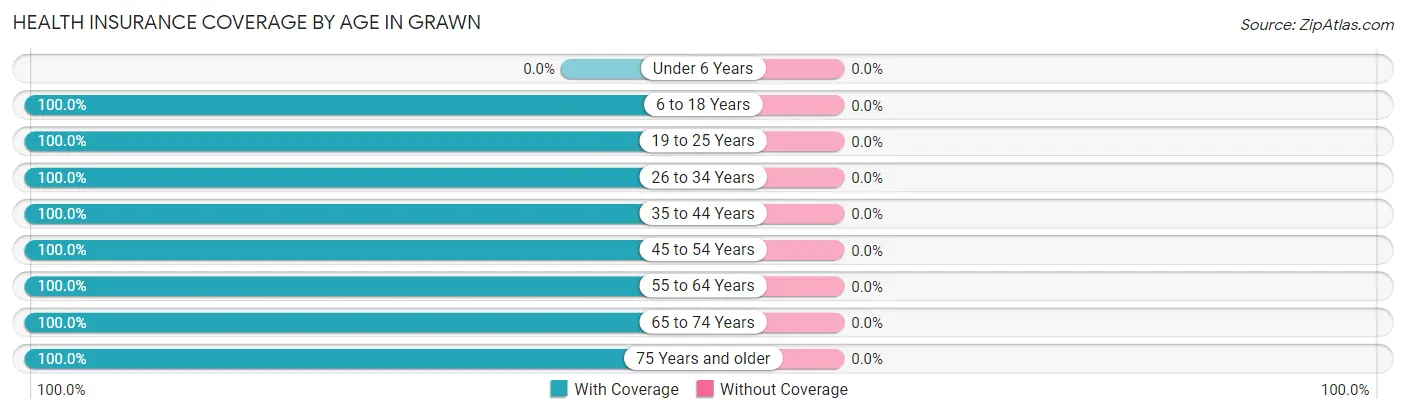
| Age Bracket | With Coverage | Without Coverage |
| Under 6 Years | 0 (0.0%) | 0 (0.0%) |
| 6 to 18 Years | 151 (100.0%) | 0 (0.0%) |
| 19 to 25 Years | 162 (100.0%) | 0 (0.0%) |
| 26 to 34 Years | 35 (100.0%) | 0 (0.0%) |
| 35 to 44 Years | 112 (100.0%) | 0 (0.0%) |
| 45 to 54 Years | 64 (100.0%) | 0 (0.0%) |
| 55 to 64 Years | 228 (100.0%) | 0 (0.0%) |
| 65 to 74 Years | 38 (100.0%) | 0 (0.0%) |
| 75 Years and older | 62 (100.0%) | 0 (0.0%) |
| Total | 852 (100.0%) | 0 (0.0%) |
Health Insurance Coverage by Citizenship Status in Grawn
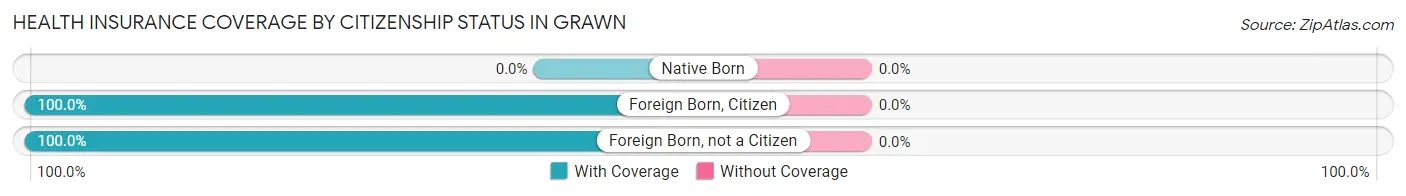
| Citizenship Status | With Coverage | Without Coverage |
| Native Born | 0 (0.0%) | 0 (0.0%) |
| Foreign Born, Citizen | 151 (100.0%) | 0 (0.0%) |
| Foreign Born, not a Citizen | 162 (100.0%) | 0 (0.0%) |
Health Insurance Coverage by Household Income in Grawn
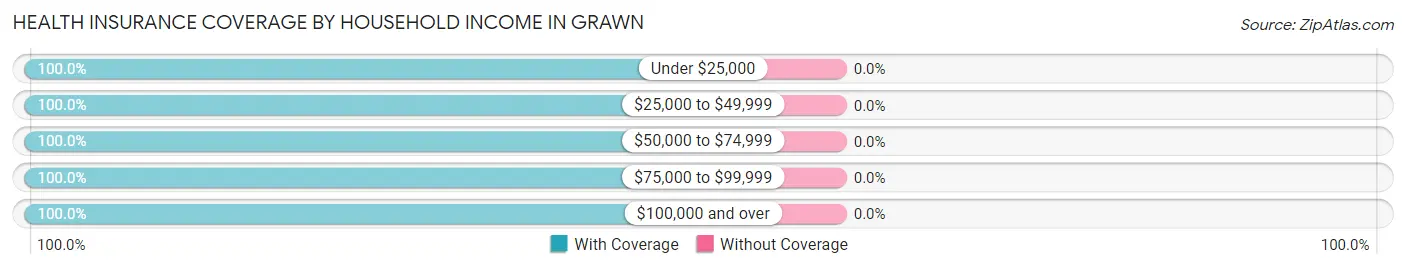
| Household Income | With Coverage | Without Coverage |
| Under $25,000 | 65 (100.0%) | 0 (0.0%) |
| $25,000 to $49,999 | 78 (100.0%) | 0 (0.0%) |
| $50,000 to $74,999 | 210 (100.0%) | 0 (0.0%) |
| $75,000 to $99,999 | 247 (100.0%) | 0 (0.0%) |
| $100,000 and over | 252 (100.0%) | 0 (0.0%) |
Public vs Private Health Insurance Coverage by Age in Grawn
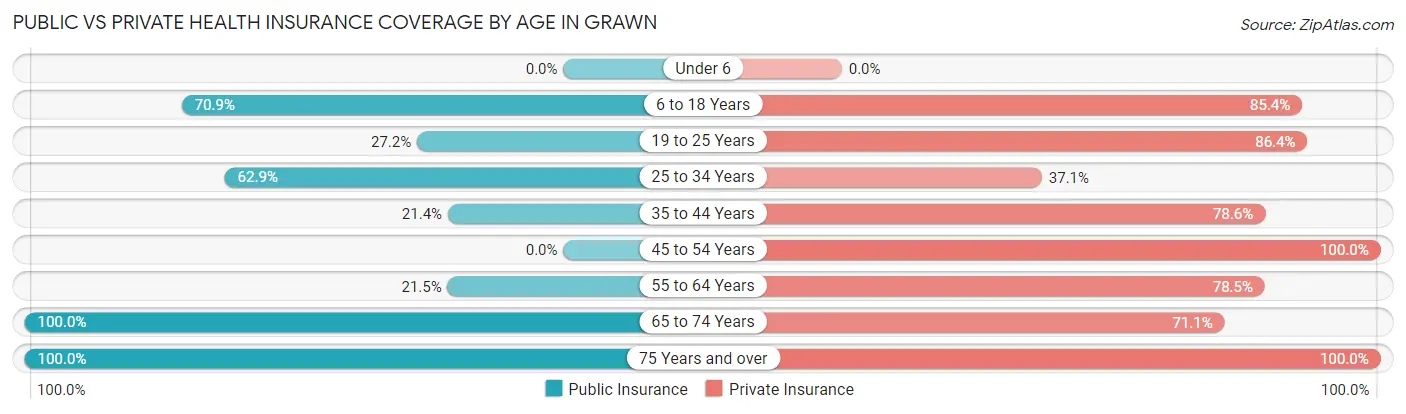
| Age Bracket | Public Insurance | Private Insurance |
| Under 6 | 0 (0.0%) | 0 (0.0%) |
| 6 to 18 Years | 107 (70.9%) | 129 (85.4%) |
| 19 to 25 Years | 44 (27.2%) | 140 (86.4%) |
| 25 to 34 Years | 22 (62.9%) | 13 (37.1%) |
| 35 to 44 Years | 24 (21.4%) | 88 (78.6%) |
| 45 to 54 Years | 0 (0.0%) | 64 (100.0%) |
| 55 to 64 Years | 49 (21.5%) | 179 (78.5%) |
| 65 to 74 Years | 38 (100.0%) | 27 (71.1%) |
| 75 Years and over | 62 (100.0%) | 62 (100.0%) |
| Total | 346 (40.6%) | 702 (82.4%) |
Disability Status by Sex by Age in Grawn
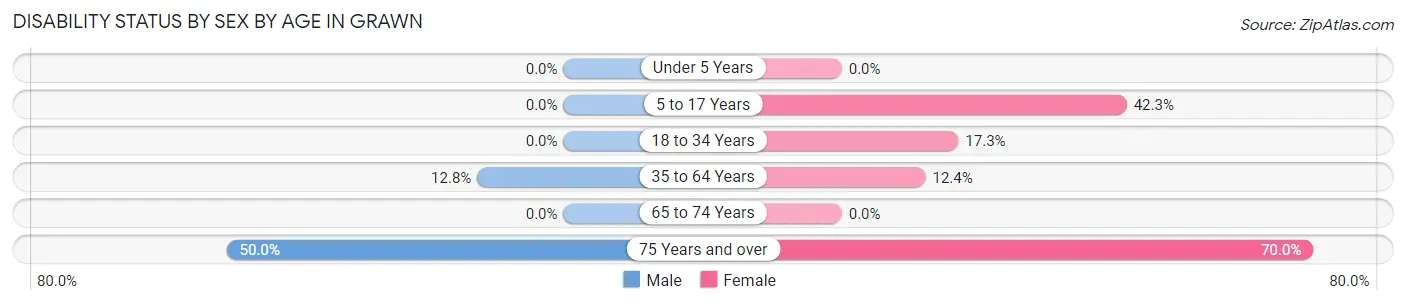
| Age Bracket | Male | Female |
| Under 5 Years | 0 (0.0%) | 0 (0.0%) |
| 5 to 17 Years | 0 (0.0%) | 22 (42.3%) |
| 18 to 34 Years | 0 (0.0%) | 22 (17.3%) |
| 35 to 64 Years | 27 (12.8%) | 24 (12.4%) |
| 65 to 74 Years | 0 (0.0%) | 0 (0.0%) |
| 75 Years and over | 11 (50.0%) | 28 (70.0%) |
Disability Class by Sex by Age in Grawn
Disability Class: Hearing Difficulty
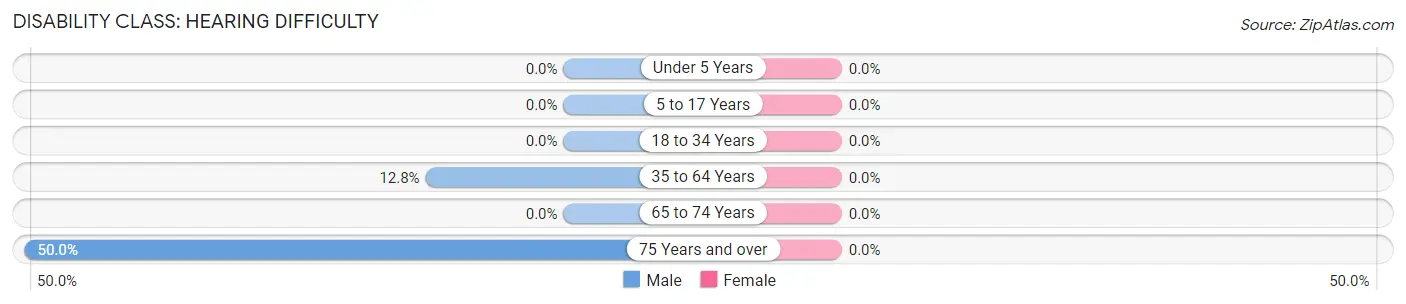
| Age Bracket | Male | Female |
| Under 5 Years | 0 (0.0%) | 0 (0.0%) |
| 5 to 17 Years | 0 (0.0%) | 0 (0.0%) |
| 18 to 34 Years | 0 (0.0%) | 0 (0.0%) |
| 35 to 64 Years | 27 (12.8%) | 0 (0.0%) |
| 65 to 74 Years | 0 (0.0%) | 0 (0.0%) |
| 75 Years and over | 11 (50.0%) | 0 (0.0%) |
Disability Class: Vision Difficulty
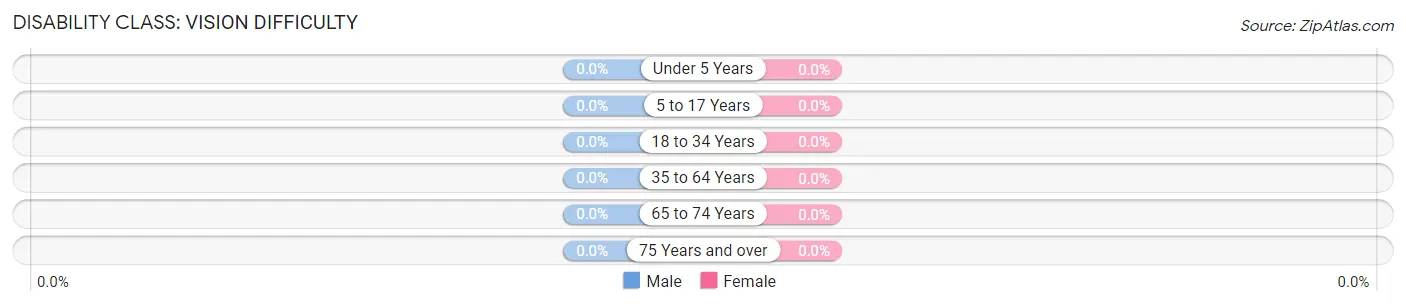
| Age Bracket | Male | Female |
| Under 5 Years | 0 (0.0%) | 0 (0.0%) |
| 5 to 17 Years | 0 (0.0%) | 0 (0.0%) |
| 18 to 34 Years | 0 (0.0%) | 0 (0.0%) |
| 35 to 64 Years | 0 (0.0%) | 0 (0.0%) |
| 65 to 74 Years | 0 (0.0%) | 0 (0.0%) |
| 75 Years and over | 0 (0.0%) | 0 (0.0%) |
Disability Class: Cognitive Difficulty
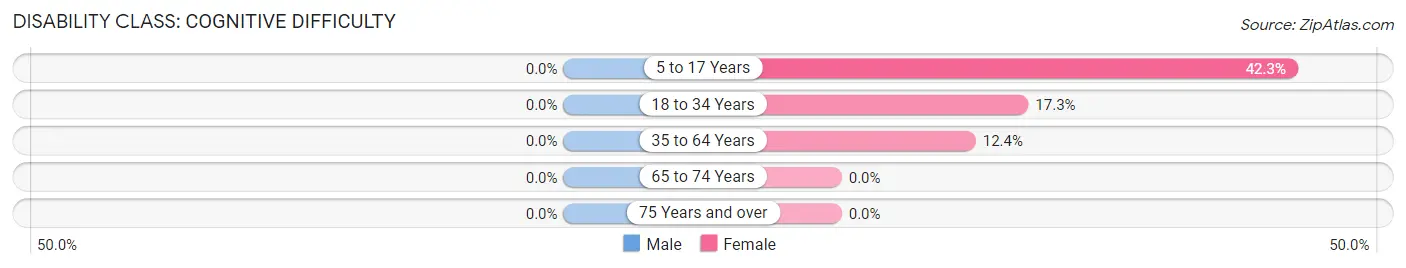
| Age Bracket | Male | Female |
| 5 to 17 Years | 0 (0.0%) | 22 (42.3%) |
| 18 to 34 Years | 0 (0.0%) | 22 (17.3%) |
| 35 to 64 Years | 0 (0.0%) | 24 (12.4%) |
| 65 to 74 Years | 0 (0.0%) | 0 (0.0%) |
| 75 Years and over | 0 (0.0%) | 0 (0.0%) |
Disability Class: Ambulatory Difficulty
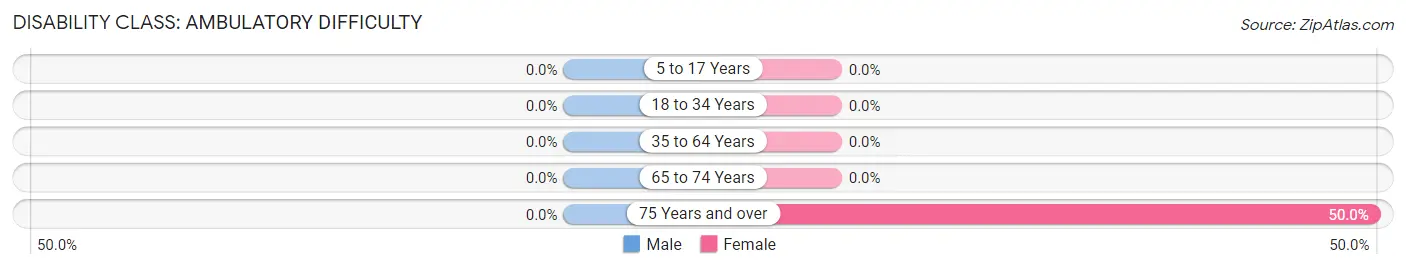
| Age Bracket | Male | Female |
| 5 to 17 Years | 0 (0.0%) | 0 (0.0%) |
| 18 to 34 Years | 0 (0.0%) | 0 (0.0%) |
| 35 to 64 Years | 0 (0.0%) | 0 (0.0%) |
| 65 to 74 Years | 0 (0.0%) | 0 (0.0%) |
| 75 Years and over | 0 (0.0%) | 20 (50.0%) |
Disability Class: Self-Care Difficulty
| Age Bracket | Male | Female |
| 5 to 17 Years | 0 (0.0%) | 0 (0.0%) |
| 18 to 34 Years | 0 (0.0%) | 0 (0.0%) |
| 35 to 64 Years | 0 (0.0%) | 0 (0.0%) |
| 65 to 74 Years | 0 (0.0%) | 0 (0.0%) |
| 75 Years and over | 0 (0.0%) | 0 (0.0%) |
Technology Access in Grawn
Computing Device Access in Grawn
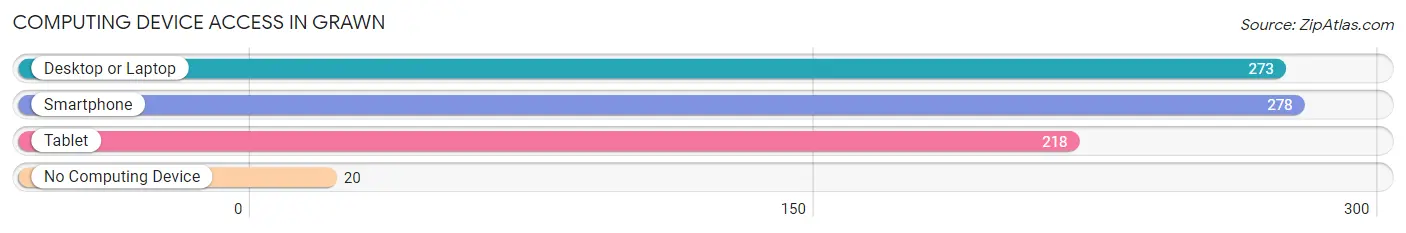
| Device Type | # Households | % Households |
| Desktop or Laptop | 273 | 88.3% |
| Smartphone | 278 | 90.0% |
| Tablet | 218 | 70.6% |
| No Computing Device | 20 | 6.5% |
| Total | 309 | 100.0% |
Internet Access in Grawn
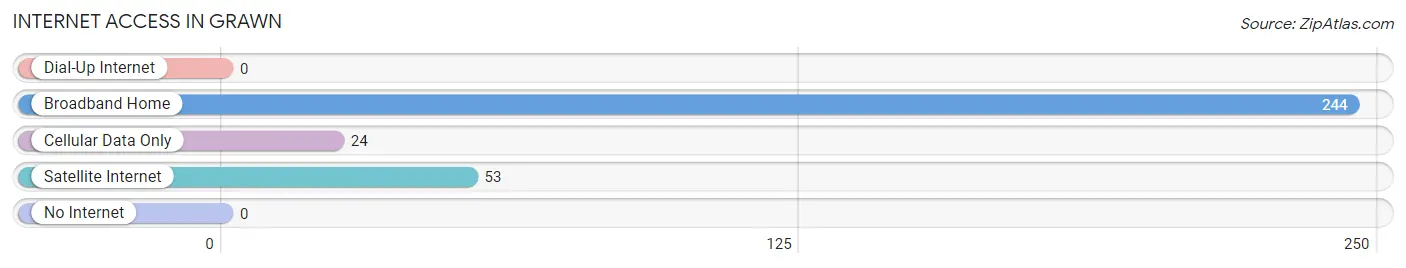
| Internet Type | # Households | % Households |
| Dial-Up Internet | 0 | 0.0% |
| Broadband Home | 244 | 79.0% |
| Cellular Data Only | 24 | 7.8% |
| Satellite Internet | 53 | 17.2% |
| No Internet | 0 | 0.0% |
| Total | 309 | 100.0% |
Grawn Summary
Grawn is a small unincorporated community located in Grand Traverse County, Michigan. It is situated in the northwest corner of the county, just south of Traverse City. The population of Grawn was estimated to be 1,072 in the 2010 census.
History
Grawn was first settled in 1871 by a group of settlers from Canada. The settlement was originally called "Grawnville" after the first settler, John Grawn. The settlement was later renamed Grawn in 1881.
Grawn was officially incorporated as a village in 1891. The village was home to a variety of businesses, including a sawmill, a grist mill, a blacksmith shop, a general store, and a post office.
In the early 1900s, Grawn was a popular tourist destination. The village was home to several resorts, including the Grawn Hotel, which was built in 1902. The hotel was a popular destination for visitors from all over the country.
In the 1920s, Grawn was home to a large apple orchard. The orchard was owned by the Grawn family and was one of the largest in the area. The orchard was destroyed in a fire in the 1930s.
In the 1950s, Grawn was home to a large dairy farm. The farm was owned by the Grawn family and was one of the largest in the area. The farm was sold in the 1970s and is now a residential area.
Geography
Grawn is located in the northwest corner of Grand Traverse County, Michigan. It is situated on the west side of the Grand Traverse Bay, just south of Traverse City. The village is bordered by the townships of Garfield, East Bay, and Peninsula.
Grawn is located in a rural area and is surrounded by farmland and forests. The village is home to several small lakes, including Grawn Lake, which is located just south of the village.
Economy
Grawn is a small, rural community with a limited economy. The village is home to several small businesses, including a general store, a gas station, and a few restaurants.
The village is also home to several farms, including a dairy farm, a fruit farm, and a vegetable farm. The farms provide employment for many of the residents of Grawn.
Demographics
Grawn is a small, rural community with a population of 1,072 as of the 2010 census. The population is predominantly white, with a small percentage of African Americans and Native Americans.
The median household income in Grawn is $41,250, which is slightly lower than the national average. The median age in Grawn is 44.7, which is slightly higher than the national average.
Conclusion
Grawn is a small, rural community located in Grand Traverse County, Michigan. It is situated in the northwest corner of the county, just south of Traverse City. The population of Grawn was estimated to be 1,072 in the 2010 census. The village is home to several small businesses, farms, and lakes. The median household income in Grawn is $41,250, which is slightly lower than the national average. The median age in Grawn is 44.7, which is slightly higher than the national average.
Common Questions
What is Per Capita Income in Grawn?
Per Capita income in Grawn is $26,024.
What is the Median Family Income in Grawn?
Median Family Income in Grawn is $66,818.
What is the Median Household income in Grawn?
Median Household Income in Grawn is $65,795.
What is Income or Wage Gap in Grawn?
Income or Wage Gap in Grawn is 44.0%.
Women in Grawn earn 56.0 cents for every dollar earned by a man.
What is Inequality or Gini Index in Grawn?
Inequality or Gini Index in Grawn is 0.23.
What is the Total Population of Grawn?
Total Population of Grawn is 852.
What is the Total Male Population of Grawn?
Total Male Population of Grawn is 429.
What is the Total Female Population of Grawn?
Total Female Population of Grawn is 423.
What is the Ratio of Males per 100 Females in Grawn?
There are 101.42 Males per 100 Females in Grawn.
What is the Ratio of Females per 100 Males in Grawn?
There are 98.60 Females per 100 Males in Grawn.
What is the Median Population Age in Grawn?
Median Population Age in Grawn is 38.0 Years.
What is the Average Family Size in Grawn
Average Family Size in Grawn is 2.7 People.
What is the Average Household Size in Grawn
Average Household Size in Grawn is 2.8 People.
How Large is the Labor Force in Grawn?
There are 509 People in the Labor Forcein in Grawn.
What is the Percentage of People in the Labor Force in Grawn?
71.2% of People are in the Labor Force in Grawn.