Zip Codes with the Highest Percentage of Population Employed in Health Diagnosing & Treating in Michigan
RELATED REPORTS & OPTIONS
Health Diagnosing & Treating
Michigan
Compare Zip Codes
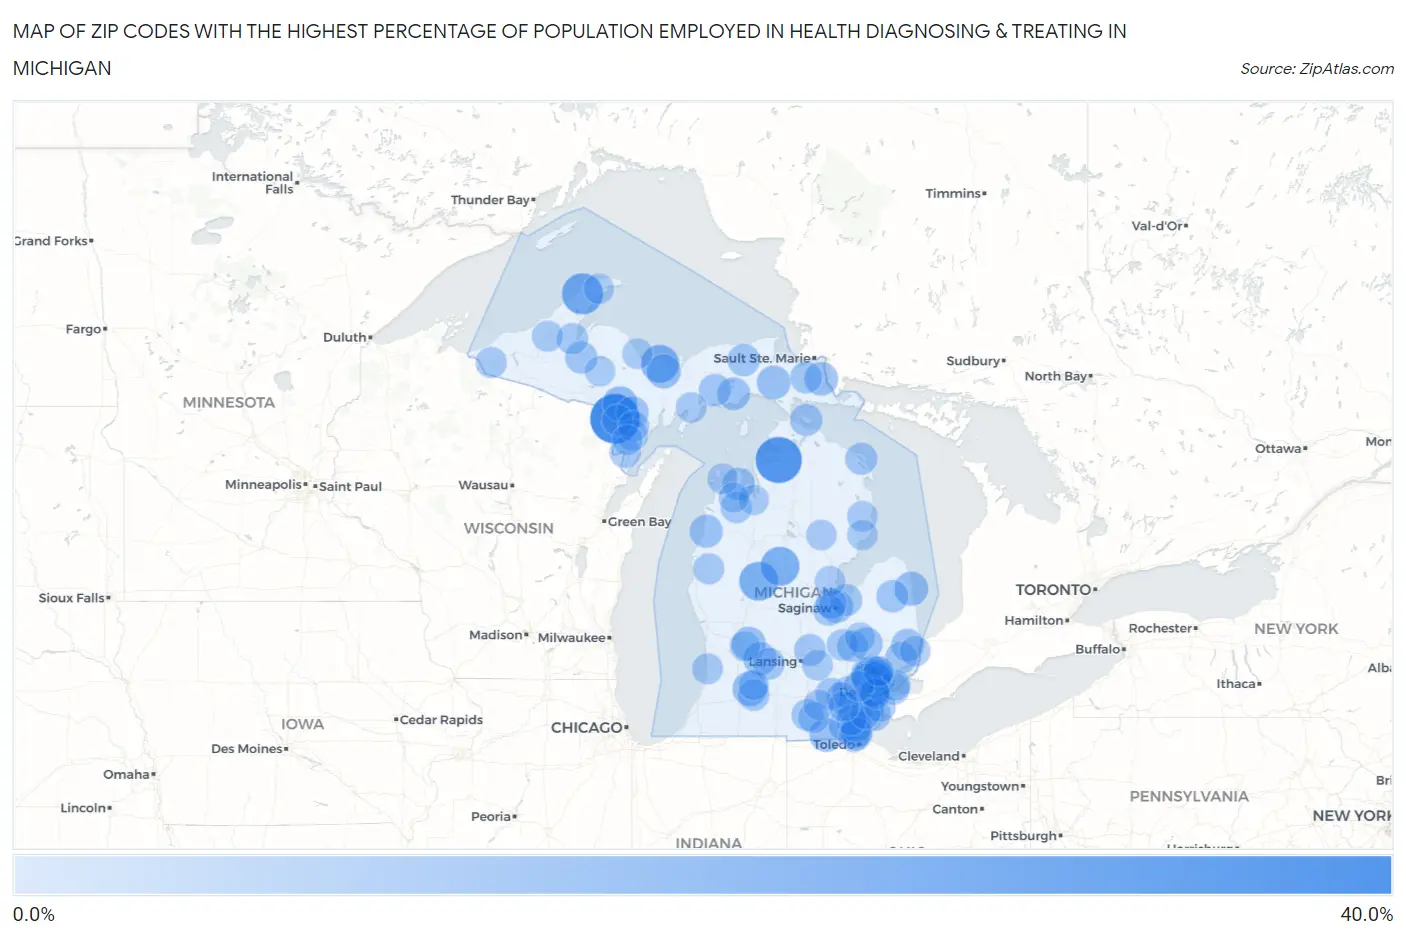
Map of Zip Codes with the Highest Percentage of Population Employed in Health Diagnosing & Treating in Michigan
0.0%
40.0%
Zip Codes with the Highest Percentage of Population Employed in Health Diagnosing & Treating in Michigan
| Zip Code | % Employed | vs State | vs National | |
| 1. | 49852 | 38.5% | 6.6%(+31.8)#1 | 6.2%(+32.2)#126 |
| 2. | 49796 | 33.3% | 6.6%(+26.7)#2 | 6.2%(+27.1)#167 |
| 3. | 49901 | 25.4% | 6.6%(+18.8)#3 | 6.2%(+19.2)#313 |
| 4. | 49320 | 22.4% | 6.6%(+15.8)#4 | 6.2%(+16.2)#415 |
| 5. | 48633 | 22.2% | 6.6%(+15.6)#5 | 6.2%(+16.0)#421 |
| 6. | 49822 | 20.9% | 6.6%(+14.2)#6 | 6.2%(+14.6)#491 |
| 7. | 49834 | 16.4% | 6.6%(+9.78)#7 | 6.2%(+10.2)#891 |
| 8. | 49083 | 16.2% | 6.6%(+9.60)#8 | 6.2%(+10.00)#921 |
| 9. | 48190 | 16.0% | 6.6%(+9.38)#9 | 6.2%(+9.79)#951 |
| 10. | 49825 | 15.4% | 6.6%(+8.74)#10 | 6.2%(+9.14)#1,062 |
| 11. | 48434 | 15.2% | 6.6%(+8.51)#11 | 6.2%(+8.91)#1,121 |
| 12. | 49301 | 15.0% | 6.6%(+8.33)#12 | 6.2%(+8.73)#1,161 |
| 13. | 49289 | 14.8% | 6.6%(+8.17)#13 | 6.2%(+8.57)#1,199 |
| 14. | 49710 | 14.6% | 6.6%(+7.99)#14 | 6.2%(+8.39)#1,232 |
| 15. | 49793 | 14.6% | 6.6%(+7.99)#15 | 6.2%(+8.39)#1,233 |
| 16. | 48302 | 14.4% | 6.6%(+7.79)#16 | 6.2%(+8.19)#1,283 |
| 17. | 49325 | 14.3% | 6.6%(+7.69)#17 | 6.2%(+8.09)#1,310 |
| 18. | 48607 | 14.0% | 6.6%(+7.36)#18 | 6.2%(+7.76)#1,411 |
| 19. | 49675 | 13.9% | 6.6%(+7.25)#19 | 6.2%(+7.65)#1,438 |
| 20. | 49238 | 13.9% | 6.6%(+7.24)#20 | 6.2%(+7.64)#1,442 |
| 21. | 49838 | 13.5% | 6.6%(+6.90)#21 | 6.2%(+7.30)#1,557 |
| 22. | 48128 | 13.5% | 6.6%(+6.86)#22 | 6.2%(+7.26)#1,568 |
| 23. | 48440 | 13.4% | 6.6%(+6.77)#23 | 6.2%(+7.17)#1,606 |
| 24. | 48301 | 13.2% | 6.6%(+6.52)#24 | 6.2%(+6.92)#1,685 |
| 25. | 48182 | 13.0% | 6.6%(+6.39)#25 | 6.2%(+6.79)#1,724 |
| 26. | 49682 | 13.0% | 6.6%(+6.37)#26 | 6.2%(+6.77)#1,735 |
| 27. | 48323 | 13.0% | 6.6%(+6.35)#27 | 6.2%(+6.75)#1,744 |
| 28. | 48027 | 12.9% | 6.6%(+6.25)#28 | 6.2%(+6.65)#1,781 |
| 29. | 49873 | 12.8% | 6.6%(+6.12)#29 | 6.2%(+6.52)#1,841 |
| 30. | 48105 | 12.8% | 6.6%(+6.10)#30 | 6.2%(+6.51)#1,849 |
| 31. | 49868 | 12.6% | 6.6%(+5.93)#31 | 6.2%(+6.33)#1,923 |
| 32. | 49840 | 12.6% | 6.6%(+5.91)#32 | 6.2%(+6.31)#1,929 |
| 33. | 48410 | 12.5% | 6.6%(+5.85)#33 | 6.2%(+6.26)#1,962 |
| 34. | 49919 | 12.5% | 6.6%(+5.85)#34 | 6.2%(+6.26)#1,964 |
| 35. | 49775 | 12.5% | 6.6%(+5.85)#35 | 6.2%(+6.26)#1,965 |
| 36. | 49777 | 12.4% | 6.6%(+5.74)#36 | 6.2%(+6.15)#2,006 |
| 37. | 48164 | 12.1% | 6.6%(+5.50)#37 | 6.2%(+5.90)#2,138 |
| 38. | 48747 | 12.1% | 6.6%(+5.48)#38 | 6.2%(+5.88)#2,149 |
| 39. | 48322 | 12.0% | 6.6%(+5.40)#39 | 6.2%(+5.80)#2,204 |
| 40. | 48304 | 12.0% | 6.6%(+5.35)#40 | 6.2%(+5.75)#2,227 |
| 41. | 48050 | 12.0% | 6.6%(+5.32)#41 | 6.2%(+5.72)#2,238 |
| 42. | 48848 | 12.0% | 6.6%(+5.31)#42 | 6.2%(+5.71)#2,246 |
| 43. | 48118 | 11.9% | 6.6%(+5.30)#43 | 6.2%(+5.70)#2,252 |
| 44. | 48897 | 11.9% | 6.6%(+5.27)#44 | 6.2%(+5.67)#2,271 |
| 45. | 49249 | 11.8% | 6.6%(+5.20)#45 | 6.2%(+5.60)#2,301 |
| 46. | 49752 | 11.8% | 6.6%(+5.16)#46 | 6.2%(+5.56)#2,324 |
| 47. | 48230 | 11.6% | 6.6%(+4.95)#47 | 6.2%(+5.35)#2,451 |
| 48. | 48179 | 11.5% | 6.6%(+4.89)#48 | 6.2%(+5.29)#2,497 |
| 49. | 49908 | 11.5% | 6.6%(+4.86)#49 | 6.2%(+5.26)#2,523 |
| 50. | 49053 | 11.5% | 6.6%(+4.84)#50 | 6.2%(+5.25)#2,528 |
| 51. | 48609 | 11.5% | 6.6%(+4.82)#51 | 6.2%(+5.23)#2,545 |
| 52. | 48075 | 11.3% | 6.6%(+4.67)#52 | 6.2%(+5.08)#2,645 |
| 53. | 48473 | 11.3% | 6.6%(+4.67)#53 | 6.2%(+5.07)#2,647 |
| 54. | 49220 | 11.2% | 6.6%(+4.59)#54 | 6.2%(+4.99)#2,704 |
| 55. | 49685 | 11.2% | 6.6%(+4.55)#55 | 6.2%(+4.95)#2,743 |
| 56. | 48439 | 11.2% | 6.6%(+4.54)#56 | 6.2%(+4.94)#2,749 |
| 57. | 48138 | 11.1% | 6.6%(+4.50)#57 | 6.2%(+4.90)#2,783 |
| 58. | 48025 | 11.1% | 6.6%(+4.49)#58 | 6.2%(+4.89)#2,785 |
| 59. | 48070 | 11.1% | 6.6%(+4.43)#59 | 6.2%(+4.83)#2,832 |
| 60. | 48144 | 11.0% | 6.6%(+4.36)#60 | 6.2%(+4.76)#2,883 |
| 61. | 48103 | 11.0% | 6.6%(+4.34)#61 | 6.2%(+4.74)#2,896 |
| 62. | 48140 | 11.0% | 6.6%(+4.31)#62 | 6.2%(+4.71)#2,922 |
| 63. | 49812 | 11.0% | 6.6%(+4.31)#63 | 6.2%(+4.71)#2,923 |
| 64. | 48603 | 10.9% | 6.6%(+4.25)#64 | 6.2%(+4.65)#2,968 |
| 65. | 49405 | 10.9% | 6.6%(+4.24)#65 | 6.2%(+4.64)#2,970 |
| 66. | 48236 | 10.9% | 6.6%(+4.24)#66 | 6.2%(+4.64)#2,974 |
| 67. | 49948 | 10.9% | 6.6%(+4.21)#67 | 6.2%(+4.61)#3,002 |
| 68. | 49892 | 10.8% | 6.6%(+4.17)#68 | 6.2%(+4.57)#3,036 |
| 69. | 48177 | 10.8% | 6.6%(+4.15)#69 | 6.2%(+4.55)#3,060 |
| 70. | 49959 | 10.8% | 6.6%(+4.15)#70 | 6.2%(+4.55)#3,061 |
| 71. | 49848 | 10.7% | 6.6%(+4.07)#71 | 6.2%(+4.47)#3,128 |
| 72. | 49406 | 10.6% | 6.6%(+3.96)#72 | 6.2%(+4.36)#3,221 |
| 73. | 49886 | 10.5% | 6.6%(+3.90)#73 | 6.2%(+4.30)#3,265 |
| 74. | 48895 | 10.4% | 6.6%(+3.77)#74 | 6.2%(+4.17)#3,397 |
| 75. | 49817 | 10.4% | 6.6%(+3.74)#75 | 6.2%(+4.14)#3,432 |
| 76. | 48131 | 10.3% | 6.6%(+3.67)#76 | 6.2%(+4.07)#3,510 |
| 77. | 48079 | 10.3% | 6.6%(+3.64)#77 | 6.2%(+4.04)#3,544 |
| 78. | 48331 | 10.3% | 6.6%(+3.62)#78 | 6.2%(+4.02)#3,571 |
| 79. | 48009 | 10.2% | 6.6%(+3.57)#79 | 6.2%(+3.97)#3,627 |
| 80. | 48745 | 10.2% | 6.6%(+3.52)#80 | 6.2%(+3.92)#3,674 |
| 81. | 49654 | 10.2% | 6.6%(+3.52)#81 | 6.2%(+3.92)#3,684 |
| 82. | 48117 | 10.1% | 6.6%(+3.49)#82 | 6.2%(+3.89)#3,709 |
| 83. | 48127 | 10.1% | 6.6%(+3.49)#83 | 6.2%(+3.89)#3,712 |
| 84. | 49261 | 10.1% | 6.6%(+3.49)#84 | 6.2%(+3.89)#3,714 |
| 85. | 48634 | 10.1% | 6.6%(+3.44)#85 | 6.2%(+3.84)#3,786 |
| 86. | 49821 | 10.1% | 6.6%(+3.42)#86 | 6.2%(+3.82)#3,809 |
| 87. | 49855 | 10.0% | 6.6%(+3.36)#87 | 6.2%(+3.76)#3,881 |
| 88. | 48661 | 10.0% | 6.6%(+3.33)#88 | 6.2%(+3.73)#3,927 |
| 89. | 48124 | 9.9% | 6.6%(+3.29)#89 | 6.2%(+3.69)#3,967 |
| 90. | 48730 | 9.9% | 6.6%(+3.28)#90 | 6.2%(+3.68)#3,976 |
| 91. | 48176 | 9.9% | 6.6%(+3.27)#91 | 6.2%(+3.68)#3,979 |
| 92. | 49950 | 9.9% | 6.6%(+3.26)#92 | 6.2%(+3.66)#3,992 |
| 93. | 48168 | 9.9% | 6.6%(+3.26)#93 | 6.2%(+3.66)#3,993 |
| 94. | 49546 | 9.9% | 6.6%(+3.26)#94 | 6.2%(+3.66)#3,997 |
| 95. | 49879 | 9.8% | 6.6%(+3.15)#95 | 6.2%(+3.55)#4,115 |
| 96. | 49060 | 9.8% | 6.6%(+3.14)#96 | 6.2%(+3.54)#4,130 |
| 97. | 49690 | 9.7% | 6.6%(+3.10)#97 | 6.2%(+3.50)#4,193 |
| 98. | 48423 | 9.7% | 6.6%(+3.09)#98 | 6.2%(+3.49)#4,209 |
| 99. | 48098 | 9.7% | 6.6%(+3.03)#99 | 6.2%(+3.43)#4,292 |
| 100. | 49684 | 9.7% | 6.6%(+3.02)#100 | 6.2%(+3.43)#4,294 |
Common Questions
What are the Top 10 Zip Codes with the Highest Percentage of Population Employed in Health Diagnosing & Treating in Michigan?
Top 10 Zip Codes with the Highest Percentage of Population Employed in Health Diagnosing & Treating in Michigan are:
What zip code has the Highest Percentage of Population Employed in Health Diagnosing & Treating in Michigan?
49852 has the Highest Percentage of Population Employed in Health Diagnosing & Treating in Michigan with 38.5%.
What is the Percentage of Population Employed in Health Diagnosing & Treating in the State of Michigan?
Percentage of Population Employed in Health Diagnosing & Treating in Michigan is 6.6%.
What is the Percentage of Population Employed in Health Diagnosing & Treating in the United States?
Percentage of Population Employed in Health Diagnosing & Treating in the United States is 6.2%.