Beverly Hills, MI Map & Demographics
Beverly Hills Map
Beverly Hills Overview
$77,323
PER CAPITA INCOME
$195,350
AVG FAMILY INCOME
$162,364
AVG HOUSEHOLD INCOME
42.5%
WAGE / INCOME GAP [ % ]
57.5¢/ $1
WAGE / INCOME GAP [ $ ]
0.39
INEQUALITY / GINI INDEX
10,550
TOTAL POPULATION
5,175
MALE POPULATION
5,375
FEMALE POPULATION
96.28
MALES / 100 FEMALES
103.86
FEMALES / 100 MALES
47.1
MEDIAN AGE
3.0
AVG FAMILY SIZE
2.5
AVG HOUSEHOLD SIZE
5,472
LABOR FORCE [ PEOPLE ]
65.7%
PERCENT IN LABOR FORCE
1.9%
UNEMPLOYMENT RATE
Beverly Hills Area Codes
Income in Beverly Hills
Income Overview in Beverly Hills
Per Capita Income in Beverly Hills is $77,323, while median incomes of families and households are $195,350 and $162,364 respectively.
| Characteristic | Number | Measure |
| Per Capita Income | 10,550 | $77,323 |
| Median Family Income | 3,103 | $195,350 |
| Mean Family Income | 3,103 | $221,143 |
| Median Household Income | 4,183 | $162,364 |
| Mean Household Income | 4,183 | $195,699 |
| Income Deficit | 3,103 | $0 |
| Wage / Income Gap (%) | 10,550 | 42.51% |
| Wage / Income Gap ($) | 10,550 | 57.49¢ per $1 |
| Gini / Inequality Index | 10,550 | 0.39 |
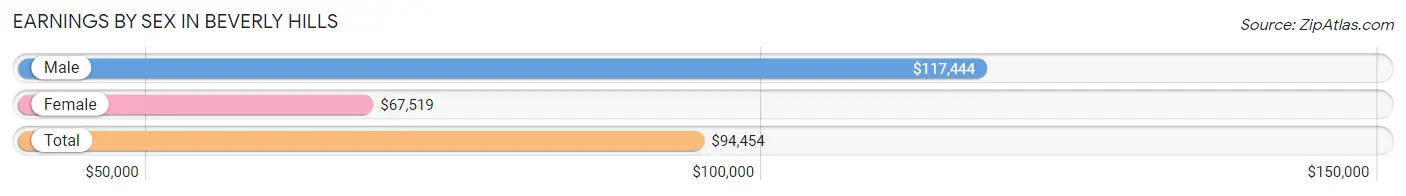
Earnings by Sex in Beverly Hills
Average Earnings in Beverly Hills are $94,454, $117,444 for men and $67,519 for women, a difference of 42.5%.
| Sex | Number | Average Earnings |
| Male | 3,116 (53.1%) | $117,444 |
| Female | 2,747 (46.9%) | $67,519 |
| Total | 5,863 (100.0%) | $94,454 |
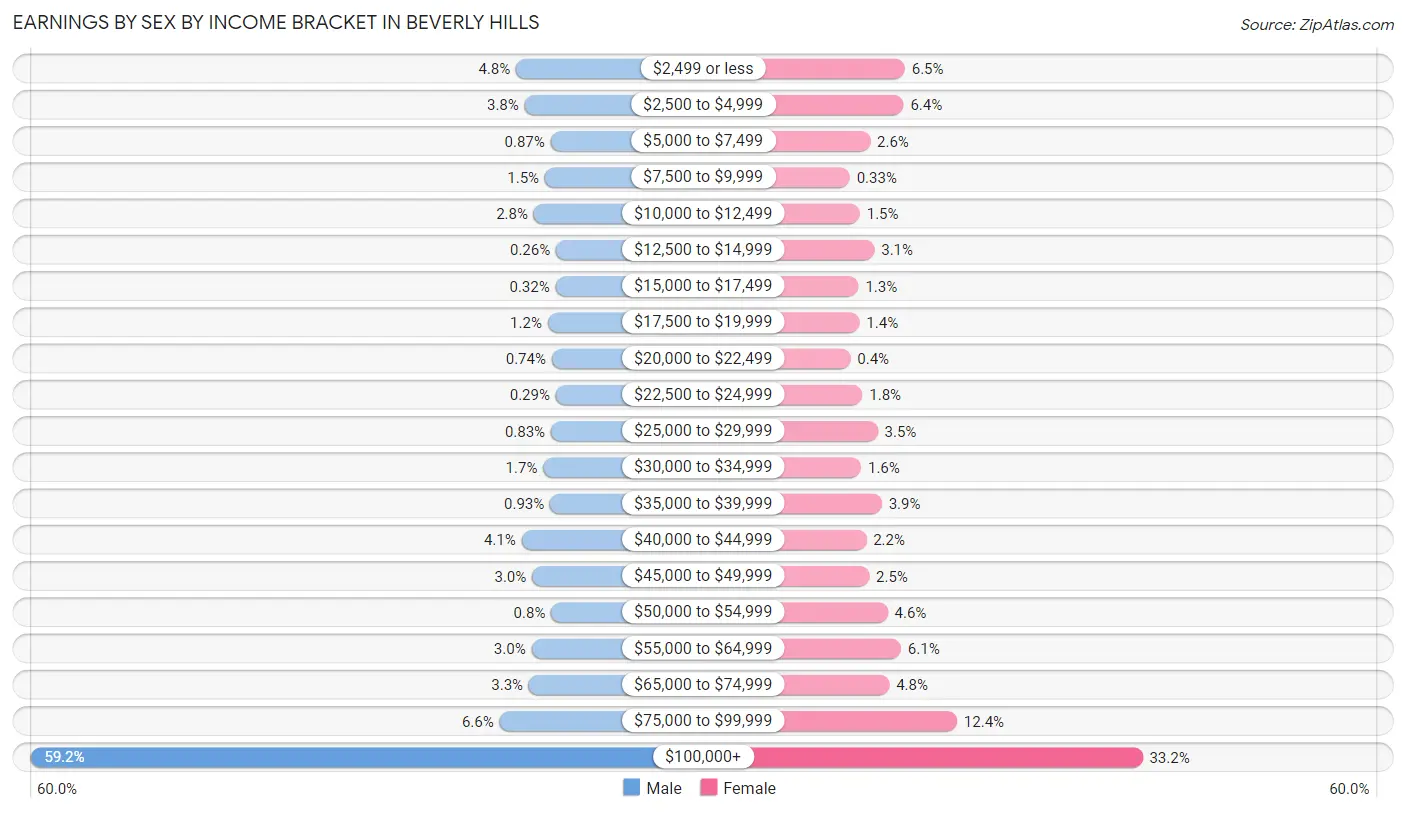
Earnings by Sex by Income Bracket in Beverly Hills
The most common earnings brackets in Beverly Hills are $100,000+ for men (1,846 | 59.2%) and $100,000+ for women (913 | 33.2%).
| Income | Male | Female |
| $2,499 or less | 148 (4.8%) | 179 (6.5%) |
| $2,500 to $4,999 | 118 (3.8%) | 175 (6.4%) |
| $5,000 to $7,499 | 27 (0.9%) | 72 (2.6%) |
| $7,500 to $9,999 | 47 (1.5%) | 9 (0.3%) |
| $10,000 to $12,499 | 86 (2.8%) | 40 (1.5%) |
| $12,500 to $14,999 | 8 (0.3%) | 85 (3.1%) |
| $15,000 to $17,499 | 10 (0.3%) | 36 (1.3%) |
| $17,500 to $19,999 | 37 (1.2%) | 39 (1.4%) |
| $20,000 to $22,499 | 23 (0.7%) | 11 (0.4%) |
| $22,500 to $24,999 | 9 (0.3%) | 48 (1.8%) |
| $25,000 to $29,999 | 26 (0.8%) | 95 (3.5%) |
| $30,000 to $34,999 | 53 (1.7%) | 44 (1.6%) |
| $35,000 to $39,999 | 29 (0.9%) | 108 (3.9%) |
| $40,000 to $44,999 | 129 (4.1%) | 60 (2.2%) |
| $45,000 to $49,999 | 92 (2.9%) | 69 (2.5%) |
| $50,000 to $54,999 | 25 (0.8%) | 126 (4.6%) |
| $55,000 to $64,999 | 94 (3.0%) | 167 (6.1%) |
| $65,000 to $74,999 | 103 (3.3%) | 131 (4.8%) |
| $75,000 to $99,999 | 206 (6.6%) | 340 (12.4%) |
| $100,000+ | 1,846 (59.2%) | 913 (33.2%) |
| Total | 3,116 (100.0%) | 2,747 (100.0%) |
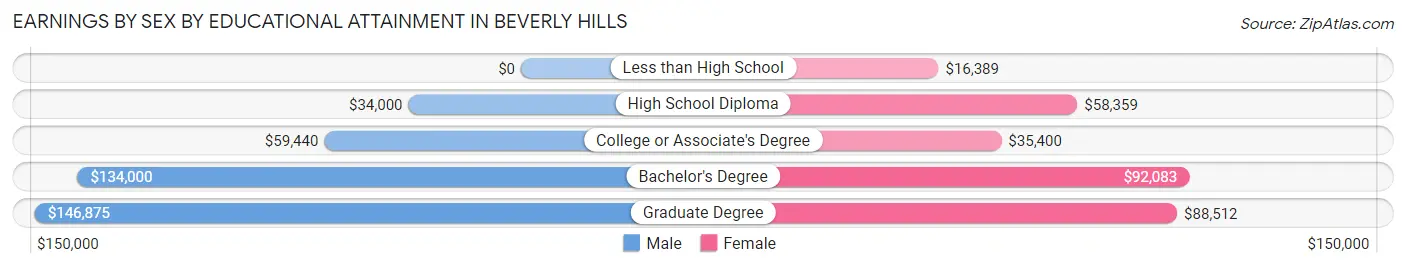
Earnings by Sex by Educational Attainment in Beverly Hills
Average earnings in Beverly Hills are $130,529 for men and $77,566 for women, a difference of 40.6%. Men with an educational attainment of graduate degree enjoy the highest average annual earnings of $146,875, while those with high school diploma education earn the least with $34,000. Women with an educational attainment of bachelor's degree earn the most with the average annual earnings of $92,083, while those with less than high school education have the smallest earnings of $16,389.
| Educational Attainment | Male Income | Female Income |
| Less than High School | - | - |
| High School Diploma | $34,000 | $58,359 |
| College or Associate's Degree | $59,440 | $35,400 |
| Bachelor's Degree | $134,000 | $92,083 |
| Graduate Degree | $146,875 | $88,512 |
| Total | $130,529 | $77,566 |
Family Income in Beverly Hills
Family Income Brackets in Beverly Hills
According to the Beverly Hills family income data, there are 1,505 families falling into the $200,000+ income range, which is the most common income bracket and makes up 48.5% of all families. Conversely, the $15,000 to $24,999 income bracket is the least frequent group with only 9 families (0.3%) belonging to this category.
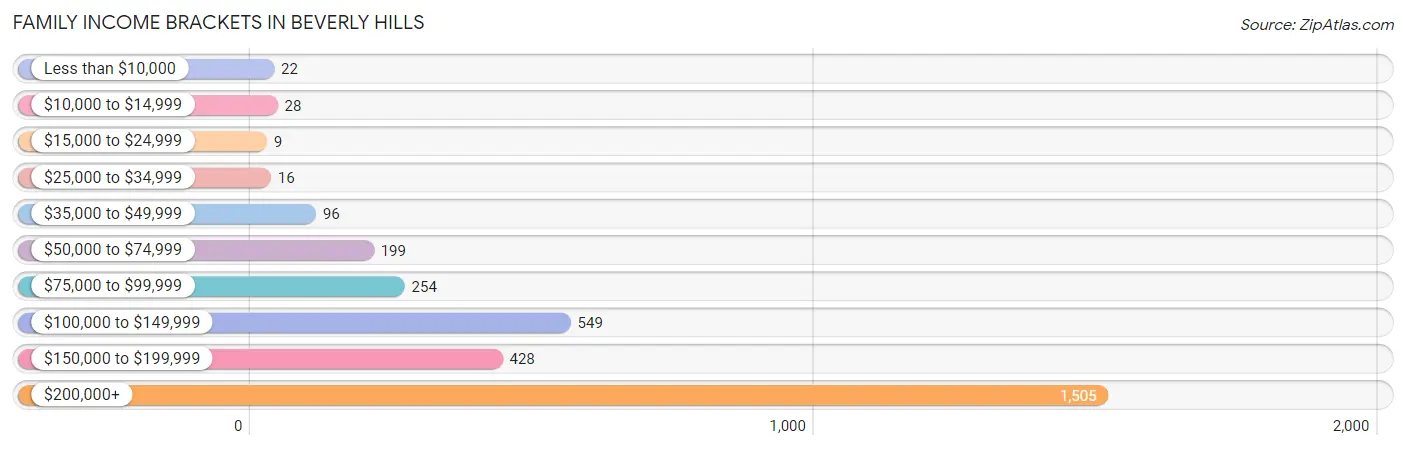
| Income Bracket | # Families | % Families |
| Less than $10,000 | 22 | 0.7% |
| $10,000 to $14,999 | 28 | 0.9% |
| $15,000 to $24,999 | 9 | 0.3% |
| $25,000 to $34,999 | 16 | 0.5% |
| $35,000 to $49,999 | 96 | 3.1% |
| $50,000 to $74,999 | 199 | 6.4% |
| $75,000 to $99,999 | 254 | 8.2% |
| $100,000 to $149,999 | 549 | 17.7% |
| $150,000 to $199,999 | 428 | 13.8% |
| $200,000+ | 1,505 | 48.5% |
Family Income by Famaliy Size in Beverly Hills
5-person families (253 | 8.2%) account for the highest median family income in Beverly Hills with $226,344 per family, while 2-person families (1,450 | 46.7%) have the highest median income of $75,724 per family member.
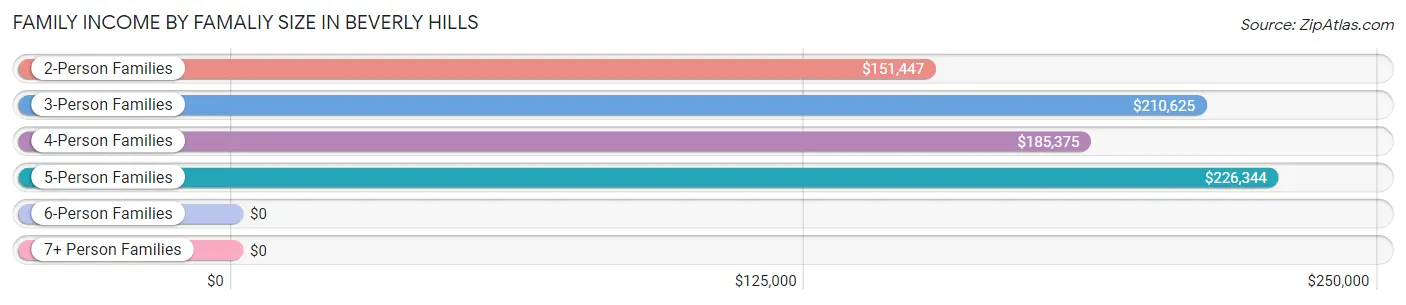
| Income Bracket | # Families | Median Income |
| 2-Person Families | 1,450 (46.7%) | $151,447 |
| 3-Person Families | 829 (26.7%) | $210,625 |
| 4-Person Families | 533 (17.2%) | $185,375 |
| 5-Person Families | 253 (8.2%) | $226,344 |
| 6-Person Families | 8 (0.3%) | $0 |
| 7+ Person Families | 30 (1.0%) | $0 |
| Total | 3,103 (100.0%) | $195,350 |
Family Income by Number of Earners in Beverly Hills
The median family income in Beverly Hills is $195,350, with families comprising 3+ earners (352) having the highest median family income of $231,406, while families with no earners (325) have the lowest median family income of $93,854, accounting for 11.3% and 10.5% of families, respectively.
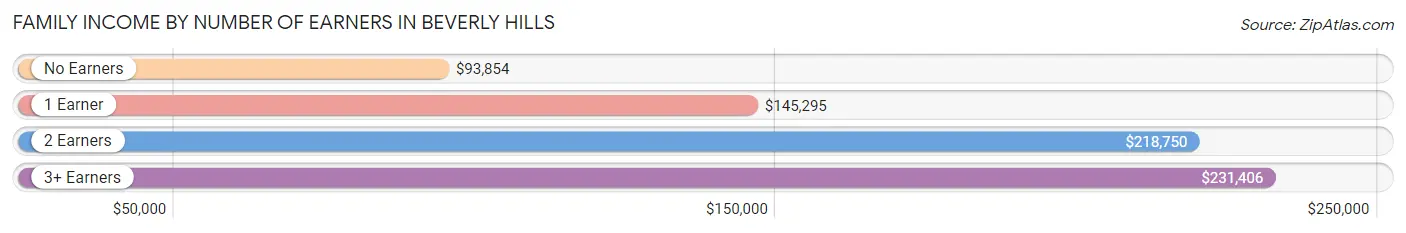
| Number of Earners | # Families | Median Income |
| No Earners | 325 (10.5%) | $93,854 |
| 1 Earner | 905 (29.2%) | $145,295 |
| 2 Earners | 1,521 (49.0%) | $218,750 |
| 3+ Earners | 352 (11.3%) | $231,406 |
| Total | 3,103 (100.0%) | $195,350 |
Household Income in Beverly Hills
Household Income Brackets in Beverly Hills
With 1,669 households falling in the category, the $200,000+ income range is the most frequent in Beverly Hills, accounting for 39.9% of all households. In contrast, only 29 households (0.7%) fall into the $15,000 to $24,999 income bracket, making it the least populous group.
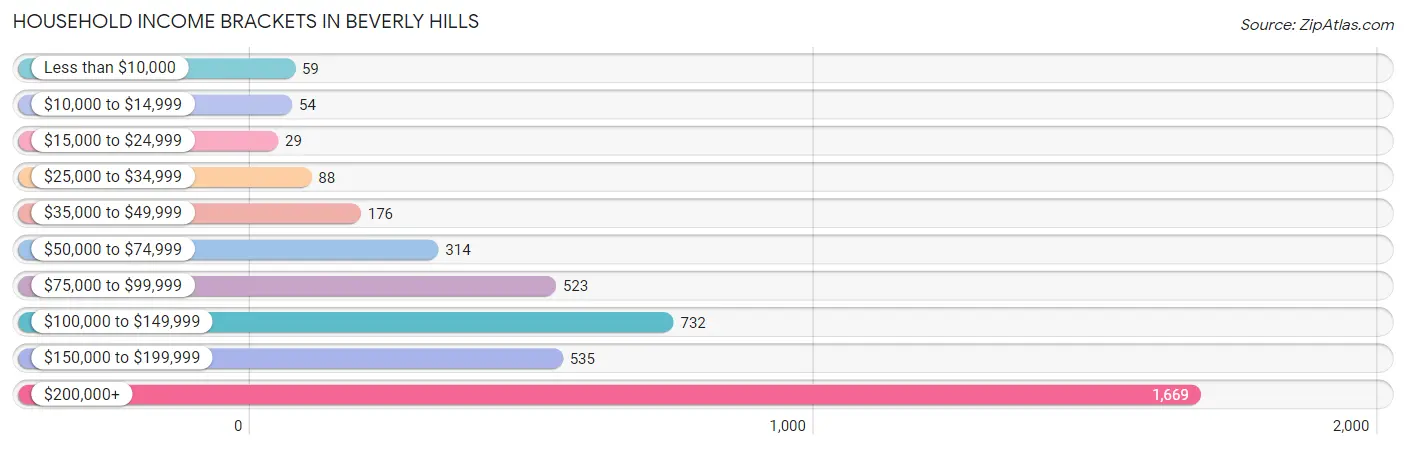
| Income Bracket | # Households | % Households |
| Less than $10,000 | 59 | 1.4% |
| $10,000 to $14,999 | 54 | 1.3% |
| $15,000 to $24,999 | 29 | 0.7% |
| $25,000 to $34,999 | 88 | 2.1% |
| $35,000 to $49,999 | 176 | 4.2% |
| $50,000 to $74,999 | 314 | 7.5% |
| $75,000 to $99,999 | 523 | 12.5% |
| $100,000 to $149,999 | 732 | 17.5% |
| $150,000 to $199,999 | 535 | 12.8% |
| $200,000+ | 1,669 | 39.9% |
Household Income by Householder Age in Beverly Hills
The median household income in Beverly Hills is $162,364, with the highest median household income of $206,250 found in the 25 to 44 years age bracket for the primary householder. A total of 966 households (23.1%) fall into this category. Meanwhile, the 15 to 24 years age bracket for the primary householder has the lowest median household income of $0, with 7 households (0.2%) in this group.
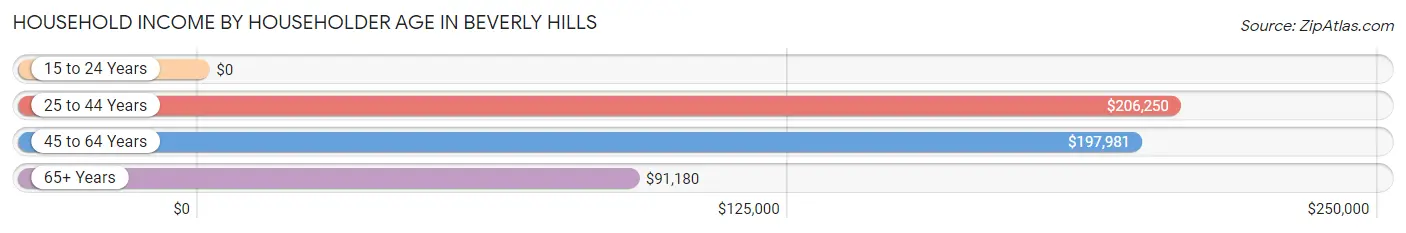
| Income Bracket | # Households | Median Income |
| 15 to 24 Years | 7 (0.2%) | $0 |
| 25 to 44 Years | 966 (23.1%) | $206,250 |
| 45 to 64 Years | 1,842 (44.0%) | $197,981 |
| 65+ Years | 1,368 (32.7%) | $91,180 |
| Total | 4,183 (100.0%) | $162,364 |
Poverty in Beverly Hills
Income Below Poverty by Sex and Age in Beverly Hills
With 2.0% poverty level for males and 3.1% for females among the residents of Beverly Hills, 12 to 14 year old males and 12 to 14 year old females are the most vulnerable to poverty, with 32 males (13.1%) and 49 females (21.7%) in their respective age groups living below the poverty level.
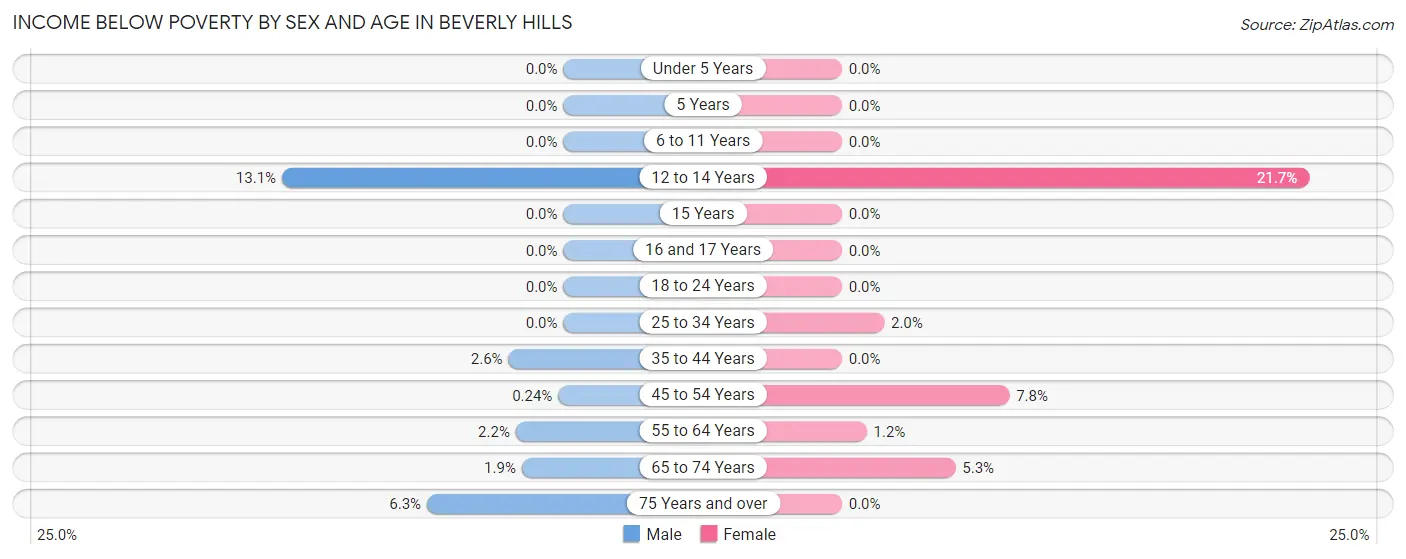
| Age Bracket | Male | Female |
| Under 5 Years | 0 (0.0%) | 0 (0.0%) |
| 5 Years | 0 (0.0%) | 0 (0.0%) |
| 6 to 11 Years | 0 (0.0%) | 0 (0.0%) |
| 12 to 14 Years | 32 (13.1%) | 49 (21.7%) |
| 15 Years | 0 (0.0%) | 0 (0.0%) |
| 16 and 17 Years | 0 (0.0%) | 0 (0.0%) |
| 18 to 24 Years | 0 (0.0%) | 0 (0.0%) |
| 25 to 34 Years | 0 (0.0%) | 9 (2.0%) |
| 35 to 44 Years | 14 (2.5%) | 0 (0.0%) |
| 45 to 54 Years | 2 (0.2%) | 63 (7.8%) |
| 55 to 64 Years | 16 (2.2%) | 9 (1.1%) |
| 65 to 74 Years | 11 (1.9%) | 37 (5.3%) |
| 75 Years and over | 26 (6.3%) | 0 (0.0%) |
| Total | 101 (2.0%) | 167 (3.1%) |
Income Above Poverty by Sex and Age in Beverly Hills
According to the poverty statistics in Beverly Hills, males aged under 5 years and females aged under 5 years are the age groups that are most secure financially, with 100.0% of males and 100.0% of females in these age groups living above the poverty line.
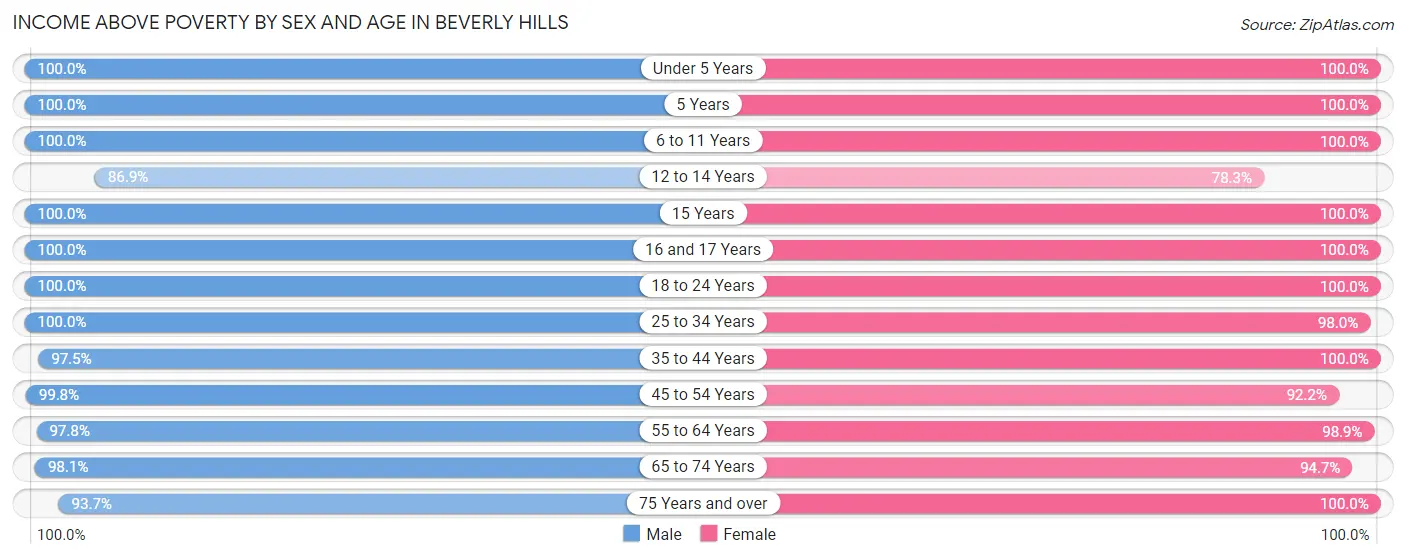
| Age Bracket | Male | Female |
| Under 5 Years | 381 (100.0%) | 272 (100.0%) |
| 5 Years | 74 (100.0%) | 72 (100.0%) |
| 6 to 11 Years | 469 (100.0%) | 396 (100.0%) |
| 12 to 14 Years | 213 (86.9%) | 177 (78.3%) |
| 15 Years | 36 (100.0%) | 50 (100.0%) |
| 16 and 17 Years | 191 (100.0%) | 101 (100.0%) |
| 18 to 24 Years | 239 (100.0%) | 270 (100.0%) |
| 25 to 34 Years | 423 (100.0%) | 450 (98.0%) |
| 35 to 44 Years | 534 (97.5%) | 657 (100.0%) |
| 45 to 54 Years | 832 (99.8%) | 748 (92.2%) |
| 55 to 64 Years | 709 (97.8%) | 771 (98.9%) |
| 65 to 74 Years | 558 (98.1%) | 665 (94.7%) |
| 75 Years and over | 385 (93.7%) | 538 (100.0%) |
| Total | 5,044 (98.0%) | 5,167 (96.9%) |
Income Below Poverty Among Married-Couple Families in Beverly Hills
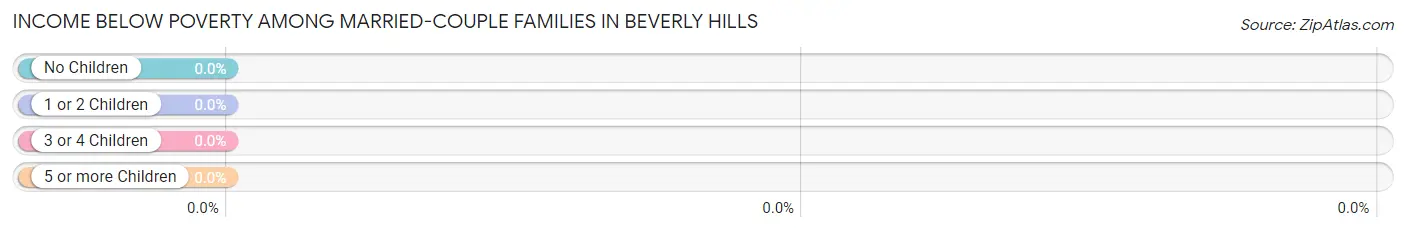
| Children | Above Poverty | Below Poverty |
| No Children | 1,446 (100.0%) | 0 (0.0%) |
| 1 or 2 Children | 981 (100.0%) | 0 (0.0%) |
| 3 or 4 Children | 159 (100.0%) | 0 (0.0%) |
| 5 or more Children | 10 (100.0%) | 0 (0.0%) |
| Total | 2,596 (100.0%) | 0 (0.0%) |
Income Below Poverty Among Single-Parent Households in Beverly Hills
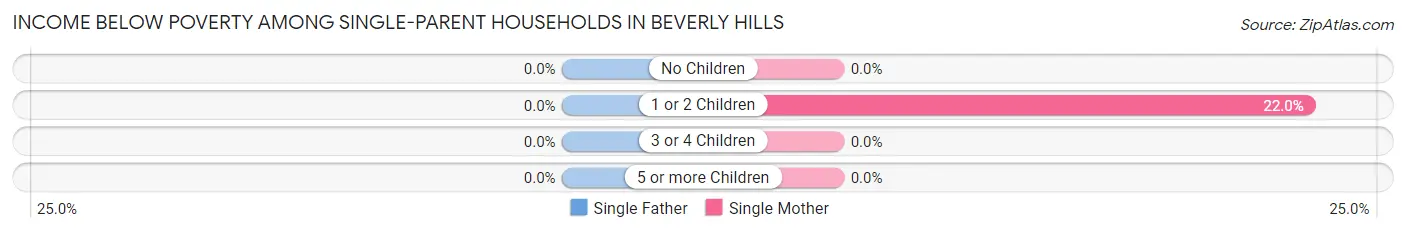
| Children | Single Father | Single Mother |
| No Children | 0 (0.0%) | 0 (0.0%) |
| 1 or 2 Children | 0 (0.0%) | 49 (22.0%) |
| 3 or 4 Children | 0 (0.0%) | 0 (0.0%) |
| 5 or more Children | 0 (0.0%) | 0 (0.0%) |
| Total | 0 (0.0%) | 49 (13.1%) |
Income Below Poverty Among Married-Couple vs Single-Parent Households in Beverly Hills
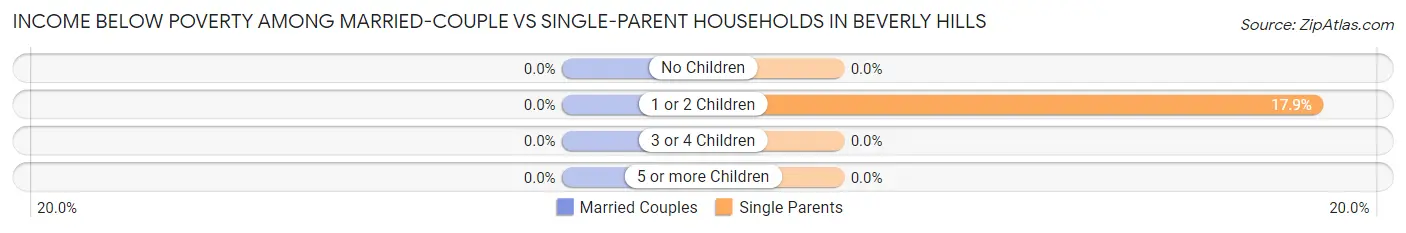
| Children | Married-Couple Families | Single-Parent Households |
| No Children | 0 (0.0%) | 0 (0.0%) |
| 1 or 2 Children | 0 (0.0%) | 49 (17.9%) |
| 3 or 4 Children | 0 (0.0%) | 0 (0.0%) |
| 5 or more Children | 0 (0.0%) | 0 (0.0%) |
| Total | 0 (0.0%) | 49 (9.7%) |
Race in Beverly Hills
The most populous races in Beverly Hills are White / Caucasian (8,781 | 83.2%), Black / African American (695 | 6.6%), and Two or more Races (615 | 5.8%).
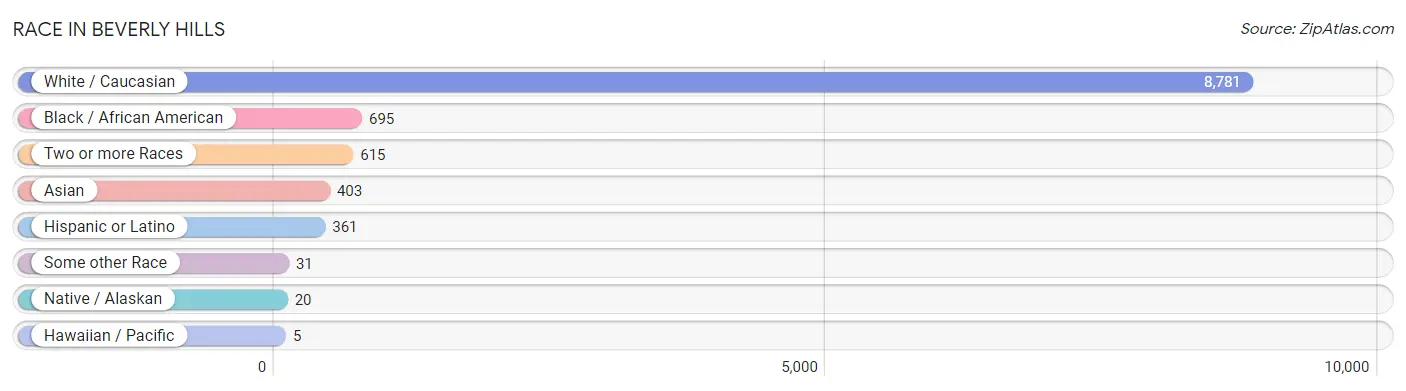
| Race | # Population | % Population |
| Asian | 403 | 3.8% |
| Black / African American | 695 | 6.6% |
| Hawaiian / Pacific | 5 | 0.1% |
| Hispanic or Latino | 361 | 3.4% |
| Native / Alaskan | 20 | 0.2% |
| White / Caucasian | 8,781 | 83.2% |
| Two or more Races | 615 | 5.8% |
| Some other Race | 31 | 0.3% |
| Total | 10,550 | 100.0% |
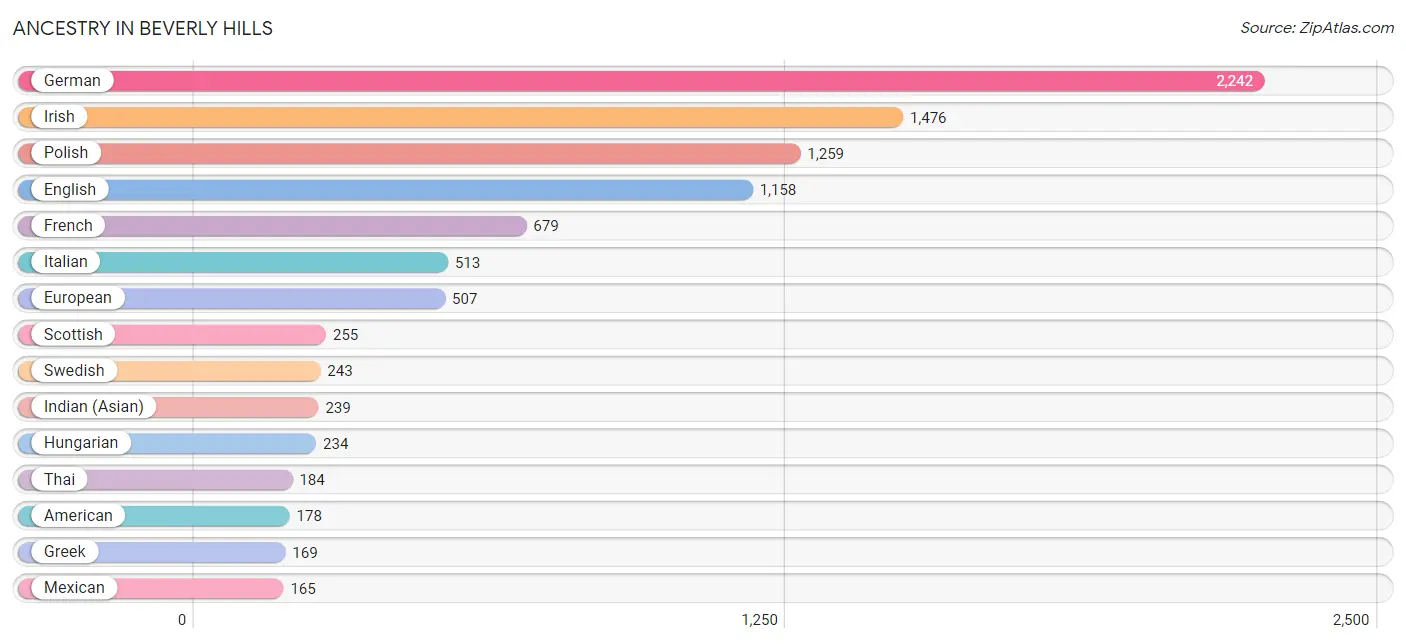
Ancestry in Beverly Hills
The most populous ancestries reported in Beverly Hills are German (2,242 | 21.2%), Irish (1,476 | 14.0%), Polish (1,259 | 11.9%), English (1,158 | 11.0%), and French (679 | 6.4%), together accounting for 64.6% of all Beverly Hills residents.
| Ancestry | # Population | % Population |
| American | 178 | 1.7% |
| Arab | 61 | 0.6% |
| Armenian | 61 | 0.6% |
| Assyrian / Chaldean / Syriac | 9 | 0.1% |
| Australian | 15 | 0.1% |
| Austrian | 47 | 0.4% |
| Belgian | 164 | 1.5% |
| Bhutanese | 40 | 0.4% |
| British | 72 | 0.7% |
| Bulgarian | 9 | 0.1% |
| Burmese | 68 | 0.6% |
| Canadian | 46 | 0.4% |
| Central American | 19 | 0.2% |
| Cherokee | 6 | 0.1% |
| Chippewa | 19 | 0.2% |
| Choctaw | 20 | 0.2% |
| Croatian | 78 | 0.7% |
| Cuban | 9 | 0.1% |
| Czech | 30 | 0.3% |
| Czechoslovakian | 41 | 0.4% |
| Danish | 44 | 0.4% |
| Dutch | 55 | 0.5% |
| Eastern European | 86 | 0.8% |
| English | 1,158 | 11.0% |
| European | 507 | 4.8% |
| Filipino | 13 | 0.1% |
| Finnish | 36 | 0.3% |
| French | 679 | 6.4% |
| French Canadian | 101 | 1.0% |
| German | 2,242 | 21.2% |
| Greek | 169 | 1.6% |
| Honduran | 19 | 0.2% |
| Hungarian | 234 | 2.2% |
| Icelander | 10 | 0.1% |
| Indian (Asian) | 239 | 2.3% |
| Iraqi | 9 | 0.1% |
| Irish | 1,476 | 14.0% |
| Italian | 513 | 4.9% |
| Jamaican | 131 | 1.2% |
| Korean | 64 | 0.6% |
| Lebanese | 31 | 0.3% |
| Lithuanian | 37 | 0.4% |
| Maltese | 13 | 0.1% |
| Mexican | 165 | 1.6% |
| Native Hawaiian | 5 | 0.1% |
| Nigerian | 72 | 0.7% |
| Northern European | 20 | 0.2% |
| Norwegian | 73 | 0.7% |
| Paraguayan | 9 | 0.1% |
| Polish | 1,259 | 11.9% |
| Portuguese | 32 | 0.3% |
| Romanian | 164 | 1.5% |
| Russian | 163 | 1.5% |
| Scandinavian | 23 | 0.2% |
| Scotch-Irish | 153 | 1.5% |
| Scottish | 255 | 2.4% |
| Sioux | 23 | 0.2% |
| Slovak | 73 | 0.7% |
| South American | 35 | 0.3% |
| South American Indian | 9 | 0.1% |
| Spaniard | 123 | 1.2% |
| Subsaharan African | 72 | 0.7% |
| Swedish | 243 | 2.3% |
| Swiss | 30 | 0.3% |
| Syrian | 10 | 0.1% |
| Thai | 184 | 1.7% |
| Ukrainian | 62 | 0.6% |
| Venezuelan | 26 | 0.3% |
| Welsh | 86 | 0.8% |
| Yugoslavian | 12 | 0.1% | View All 70 Rows |
Immigrants in Beverly Hills
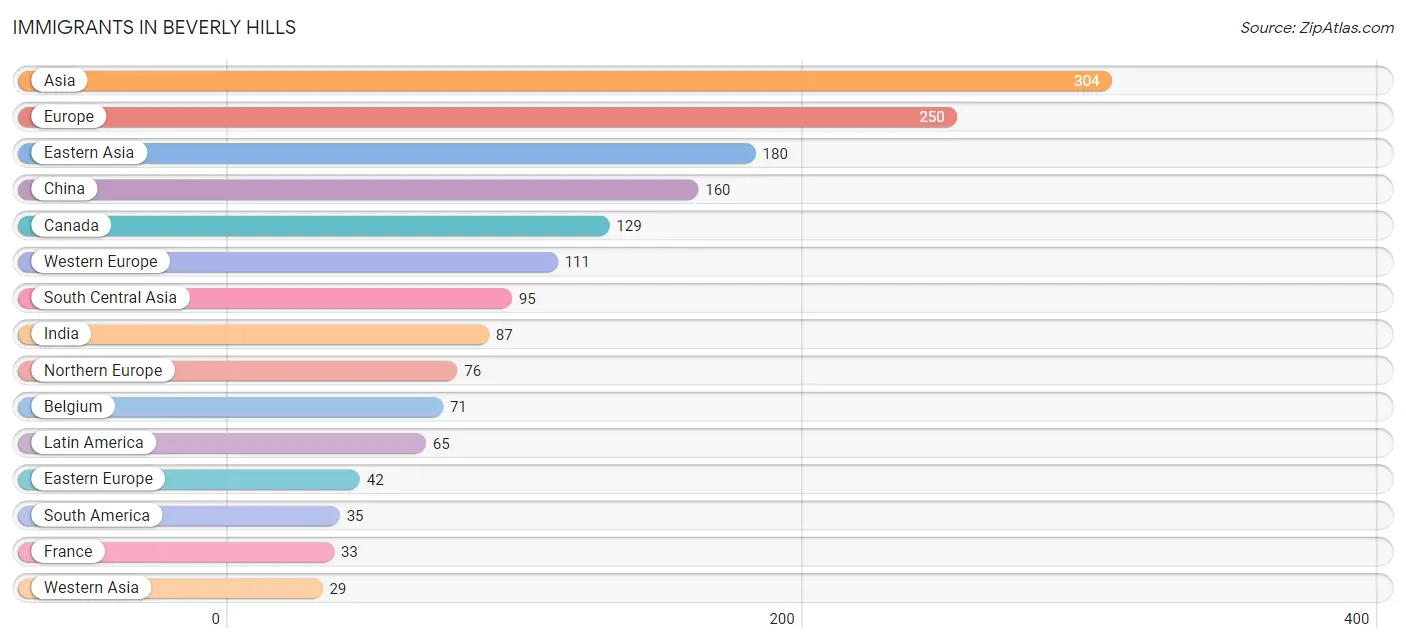
The most numerous immigrant groups reported in Beverly Hills came from Asia (304 | 2.9%), Europe (250 | 2.4%), Eastern Asia (180 | 1.7%), China (160 | 1.5%), and Canada (129 | 1.2%), together accounting for 9.7% of all Beverly Hills residents.
| Immigration Origin | # Population | % Population |
| Africa | 10 | 0.1% |
| Armenia | 4 | 0.0% |
| Asia | 304 | 2.9% |
| Belgium | 71 | 0.7% |
| Canada | 129 | 1.2% |
| Caribbean | 9 | 0.1% |
| Central America | 21 | 0.2% |
| China | 160 | 1.5% |
| Cuba | 9 | 0.1% |
| Eastern Asia | 180 | 1.7% |
| Eastern Europe | 42 | 0.4% |
| Europe | 250 | 2.4% |
| France | 33 | 0.3% |
| Germany | 1 | 0.0% |
| India | 87 | 0.8% |
| Iran | 8 | 0.1% |
| Iraq | 17 | 0.2% |
| Italy | 21 | 0.2% |
| Korea | 20 | 0.2% |
| Latin America | 65 | 0.6% |
| Mexico | 21 | 0.2% |
| Nigeria | 10 | 0.1% |
| Northern Europe | 76 | 0.7% |
| Poland | 8 | 0.1% |
| Romania | 9 | 0.1% |
| Saudi Arabia | 8 | 0.1% |
| Scotland | 24 | 0.2% |
| South America | 35 | 0.3% |
| South Central Asia | 95 | 0.9% |
| Southern Europe | 21 | 0.2% |
| Sweden | 23 | 0.2% |
| Switzerland | 6 | 0.1% |
| Taiwan | 20 | 0.2% |
| Ukraine | 25 | 0.2% |
| Venezuela | 26 | 0.3% |
| Western Africa | 10 | 0.1% |
| Western Asia | 29 | 0.3% |
| Western Europe | 111 | 1.1% | View All 38 Rows |
Sex and Age in Beverly Hills
Sex and Age in Beverly Hills
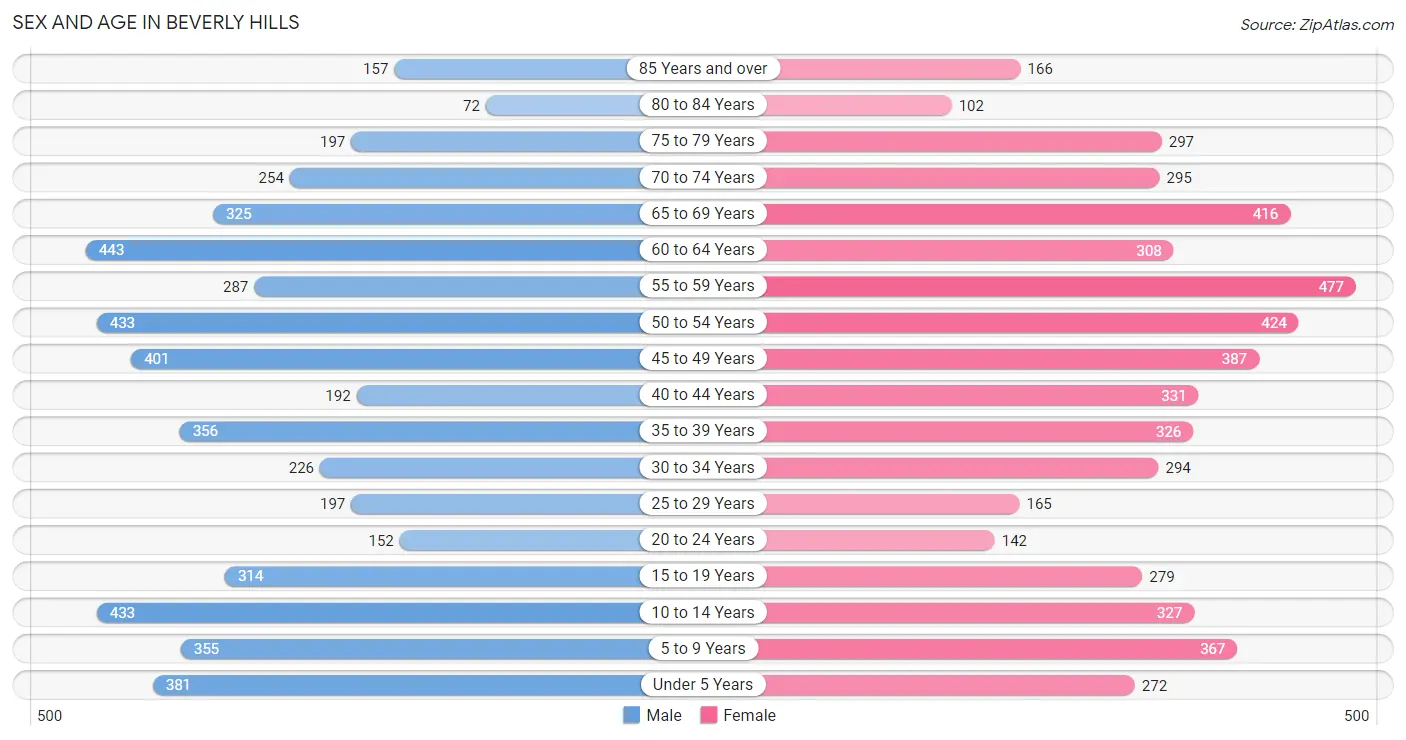
The most populous age groups in Beverly Hills are 60 to 64 Years (443 | 8.6%) for men and 55 to 59 Years (477 | 8.9%) for women.
| Age Bracket | Male | Female |
| Under 5 Years | 381 (7.4%) | 272 (5.1%) |
| 5 to 9 Years | 355 (6.9%) | 367 (6.8%) |
| 10 to 14 Years | 433 (8.4%) | 327 (6.1%) |
| 15 to 19 Years | 314 (6.1%) | 279 (5.2%) |
| 20 to 24 Years | 152 (2.9%) | 142 (2.6%) |
| 25 to 29 Years | 197 (3.8%) | 165 (3.1%) |
| 30 to 34 Years | 226 (4.4%) | 294 (5.5%) |
| 35 to 39 Years | 356 (6.9%) | 326 (6.1%) |
| 40 to 44 Years | 192 (3.7%) | 331 (6.2%) |
| 45 to 49 Years | 401 (7.7%) | 387 (7.2%) |
| 50 to 54 Years | 433 (8.4%) | 424 (7.9%) |
| 55 to 59 Years | 287 (5.6%) | 477 (8.9%) |
| 60 to 64 Years | 443 (8.6%) | 308 (5.7%) |
| 65 to 69 Years | 325 (6.3%) | 416 (7.7%) |
| 70 to 74 Years | 254 (4.9%) | 295 (5.5%) |
| 75 to 79 Years | 197 (3.8%) | 297 (5.5%) |
| 80 to 84 Years | 72 (1.4%) | 102 (1.9%) |
| 85 Years and over | 157 (3.0%) | 166 (3.1%) |
| Total | 5,175 (100.0%) | 5,375 (100.0%) |
Families and Households in Beverly Hills
Median Family Size in Beverly Hills
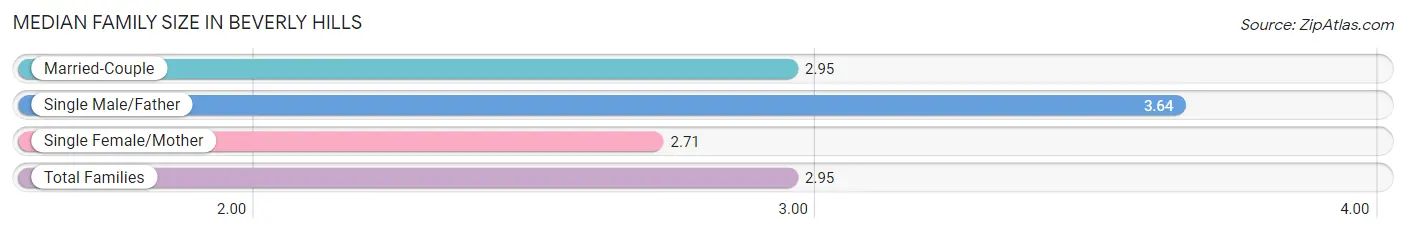
The median family size in Beverly Hills is 2.95 persons per family, with single male/father families (132 | 4.3%) accounting for the largest median family size of 3.64 persons per family. On the other hand, single female/mother families (375 | 12.1%) represent the smallest median family size with 2.71 persons per family.
| Family Type | # Families | Family Size |
| Married-Couple | 2,596 (83.7%) | 2.95 |
| Single Male/Father | 132 (4.3%) | 3.64 |
| Single Female/Mother | 375 (12.1%) | 2.71 |
| Total Families | 3,103 (100.0%) | 2.95 |
Median Household Size in Beverly Hills
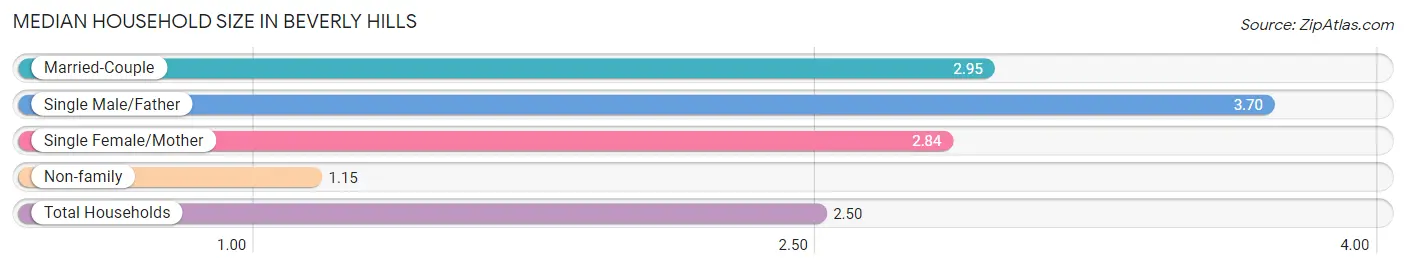
The median household size in Beverly Hills is 2.50 persons per household, with single male/father households (132 | 3.2%) accounting for the largest median household size of 3.7 persons per household. non-family households (1,080 | 25.8%) represent the smallest median household size with 1.15 persons per household.
| Household Type | # Households | Household Size |
| Married-Couple | 2,596 (62.1%) | 2.95 |
| Single Male/Father | 132 (3.2%) | 3.70 |
| Single Female/Mother | 375 (9.0%) | 2.84 |
| Non-family | 1,080 (25.8%) | 1.15 |
| Total Households | 4,183 (100.0%) | 2.50 |
Household Size by Marriage Status in Beverly Hills
Out of a total of 4,183 households in Beverly Hills, 3,103 (74.2%) are family households, while 1,080 (25.8%) are nonfamily households. The most numerous type of family households are 2-person households, comprising 1,417, and the most common type of nonfamily households are 1-person households, comprising 902.
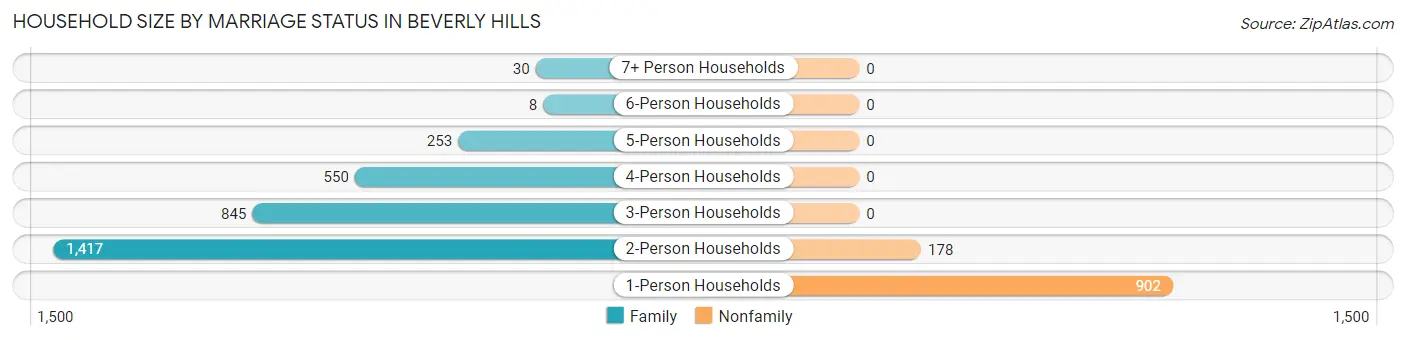
| Household Size | Family Households | Nonfamily Households |
| 1-Person Households | - | 902 (21.6%) |
| 2-Person Households | 1,417 (33.9%) | 178 (4.3%) |
| 3-Person Households | 845 (20.2%) | 0 (0.0%) |
| 4-Person Households | 550 (13.2%) | 0 (0.0%) |
| 5-Person Households | 253 (6.0%) | 0 (0.0%) |
| 6-Person Households | 8 (0.2%) | 0 (0.0%) |
| 7+ Person Households | 30 (0.7%) | 0 (0.0%) |
| Total | 3,103 (74.2%) | 1,080 (25.8%) |
Female Fertility in Beverly Hills
Fertility by Age in Beverly Hills
Average fertility rate in Beverly Hills is 27.0 births per 1,000 women. Women in the age bracket of 20 to 34 years have the highest fertility rate with 50.0 births per 1,000 women. Women in the age bracket of 20 to 34 years acount for 54.5% of all women with births.
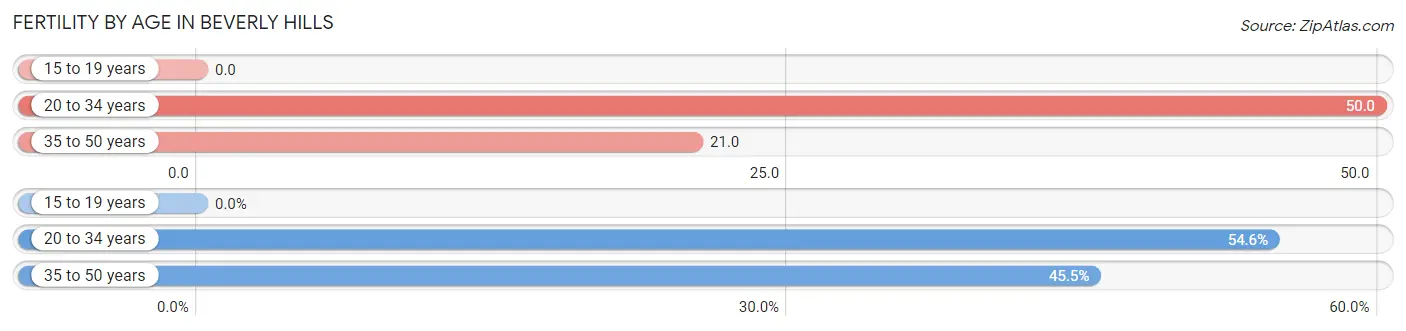
| Age Bracket | Women with Births | Births / 1,000 Women |
| 15 to 19 years | 0 (0.0%) | 0.0 |
| 20 to 34 years | 30 (54.5%) | 50.0 |
| 35 to 50 years | 25 (45.5%) | 21.0 |
| Total | 55 (100.0%) | 27.0 |
Fertility by Age by Marriage Status in Beverly Hills
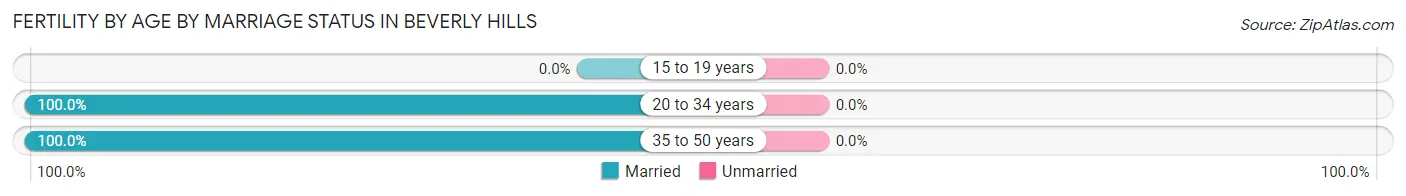
| Age Bracket | Married | Unmarried |
| 15 to 19 years | 0 (0.0%) | 0 (0.0%) |
| 20 to 34 years | 30 (100.0%) | 0 (0.0%) |
| 35 to 50 years | 25 (100.0%) | 0 (0.0%) |
| Total | 55 (100.0%) | 0 (0.0%) |
Fertility by Education in Beverly Hills
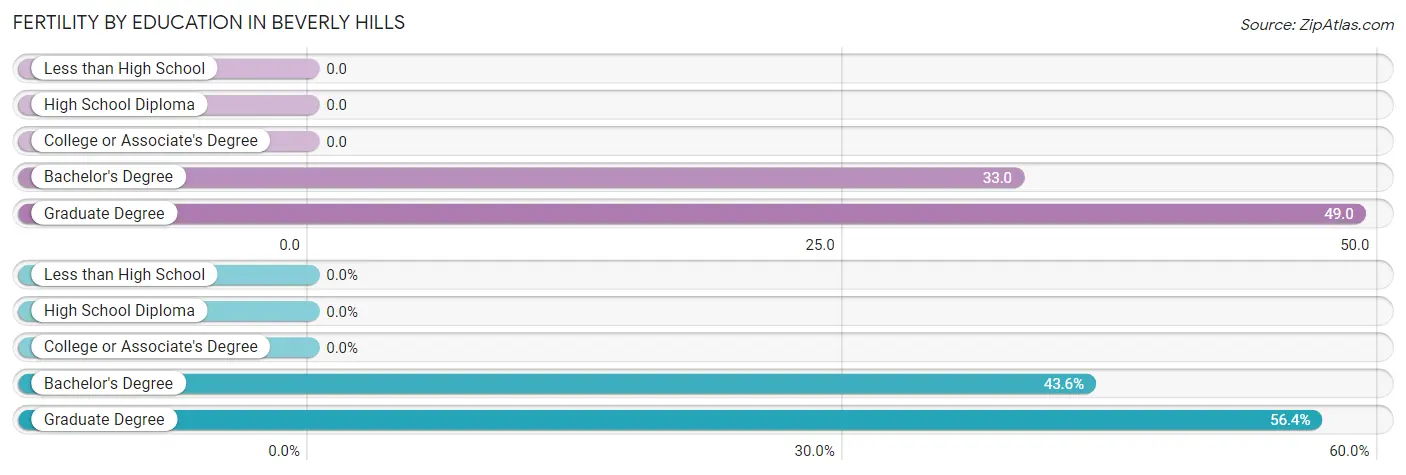
| Educational Attainment | Women with Births | Births / 1,000 Women |
| Less than High School | 0 (0.0%) | 0.0 |
| High School Diploma | 0 (0.0%) | 0.0 |
| College or Associate's Degree | 0 (0.0%) | 0.0 |
| Bachelor's Degree | 24 (43.6%) | 33.0 |
| Graduate Degree | 31 (56.4%) | 49.0 |
| Total | 55 (100.0%) | 27.0 |
Fertility by Education by Marriage Status in Beverly Hills
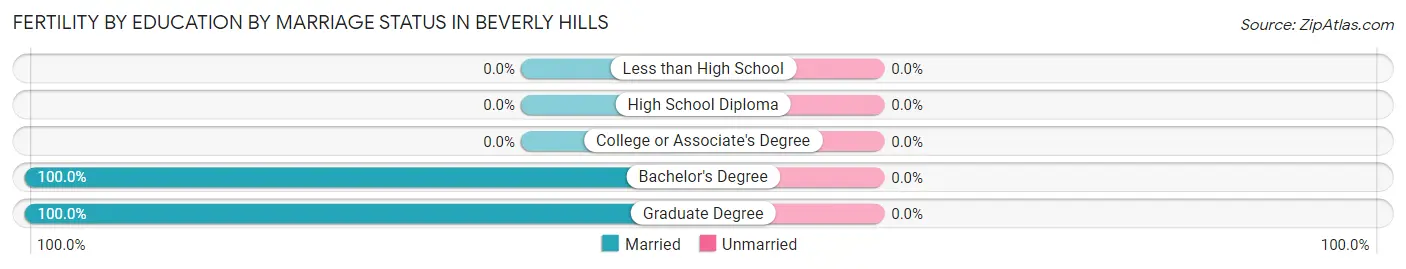
| Educational Attainment | Married | Unmarried |
| Less than High School | 0 (0.0%) | 0 (0.0%) |
| High School Diploma | 0 (0.0%) | 0 (0.0%) |
| College or Associate's Degree | 0 (0.0%) | 0 (0.0%) |
| Bachelor's Degree | 24 (100.0%) | 0 (0.0%) |
| Graduate Degree | 31 (100.0%) | 0 (0.0%) |
| Total | 55 (100.0%) | 0 (0.0%) |
Employment Characteristics in Beverly Hills
Employment by Class of Employer in Beverly Hills
Among the 5,310 employed individuals in Beverly Hills, private company employees (3,598 | 67.8%), not-for-profit organizations (523 | 9.9%), and self-employed (not incorporated) (351 | 6.6%) make up the most common classes of employment.
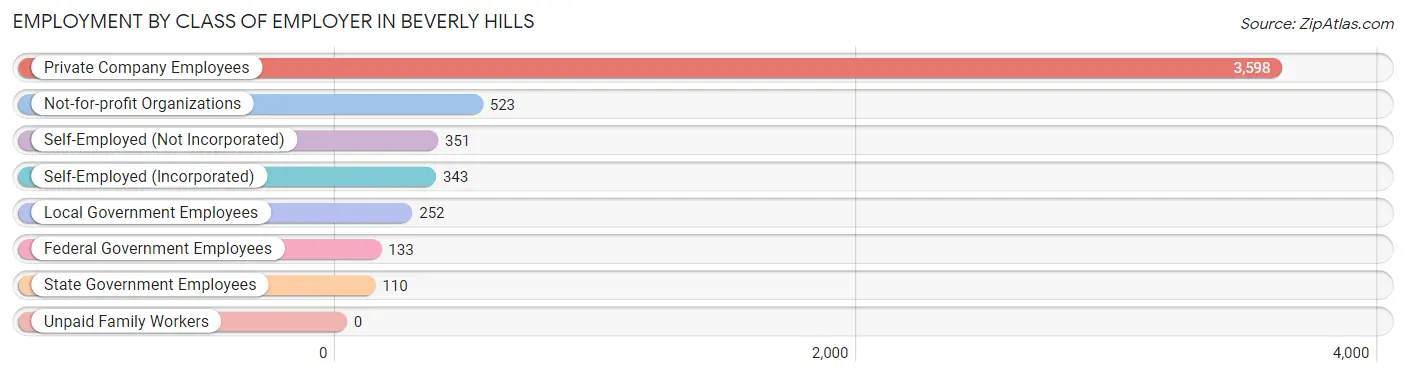
| Employer Class | # Employees | % Employees |
| Private Company Employees | 3,598 | 67.8% |
| Self-Employed (Incorporated) | 343 | 6.5% |
| Self-Employed (Not Incorporated) | 351 | 6.6% |
| Not-for-profit Organizations | 523 | 9.9% |
| Local Government Employees | 252 | 4.8% |
| State Government Employees | 110 | 2.1% |
| Federal Government Employees | 133 | 2.5% |
| Unpaid Family Workers | 0 | 0.0% |
| Total | 5,310 | 100.0% |
Employment Status by Age in Beverly Hills
According to the labor force statistics for Beverly Hills, out of the total population over 16 years of age (8,329), 65.7% or 5,472 individuals are in the labor force, with 1.9% or 104 of them unemployed. The age group with the highest labor force participation rate is 25 to 29 years, with 95.3% or 345 individuals in the labor force. Within the labor force, the 20 to 24 years age range has the highest percentage of unemployed individuals, with 5.1% or 9 of them being unemployed.
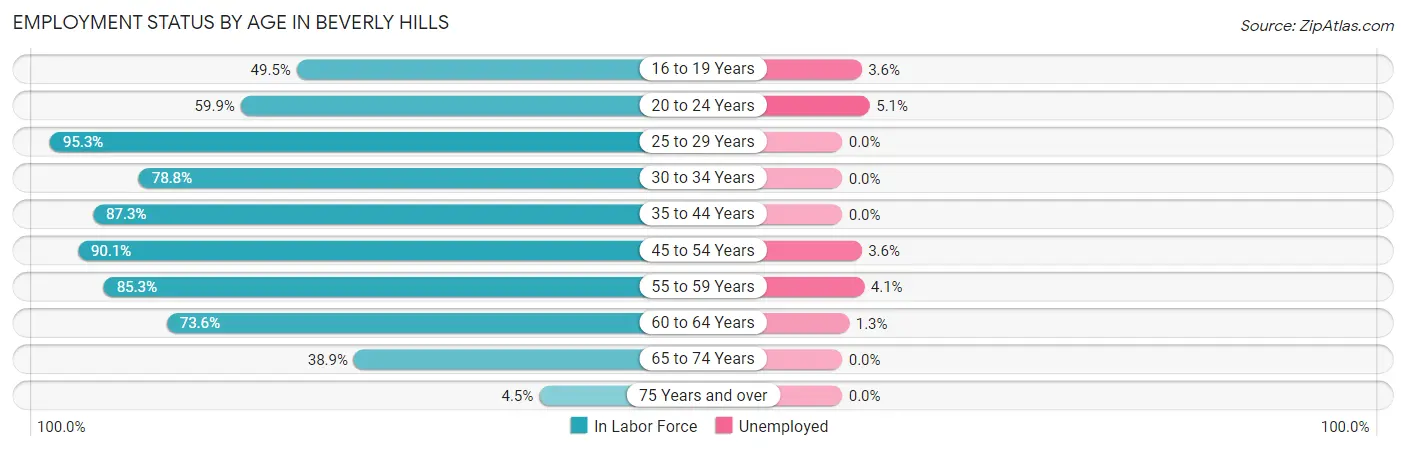
| Age Bracket | In Labor Force | Unemployed |
| 16 to 19 Years | 251 (49.5%) | 9 (3.6%) |
| 20 to 24 Years | 176 (59.9%) | 9 (5.1%) |
| 25 to 29 Years | 345 (95.3%) | 0 (0.0%) |
| 30 to 34 Years | 410 (78.8%) | 0 (0.0%) |
| 35 to 44 Years | 1,052 (87.3%) | 0 (0.0%) |
| 45 to 54 Years | 1,482 (90.1%) | 53 (3.6%) |
| 55 to 59 Years | 652 (85.3%) | 27 (4.1%) |
| 60 to 64 Years | 553 (73.6%) | 7 (1.3%) |
| 65 to 74 Years | 502 (38.9%) | 0 (0.0%) |
| 75 Years and over | 45 (4.5%) | 0 (0.0%) |
| Total | 5,472 (65.7%) | 104 (1.9%) |
Employment Status by Educational Attainment in Beverly Hills
According to labor force statistics for Beverly Hills, 85.6% of individuals (4,491) out of the total population between 25 and 64 years of age (5,247) are in the labor force, with 2.0% or 90 of them being unemployed. The group with the highest labor force participation rate are those with the educational attainment of bachelor's degree or higher, with 87.7% or 3,747 individuals in the labor force. Within the labor force, individuals with bachelor's degree or higher education have the highest percentage of unemployment, with 2.2% or 82 of them being unemployed.
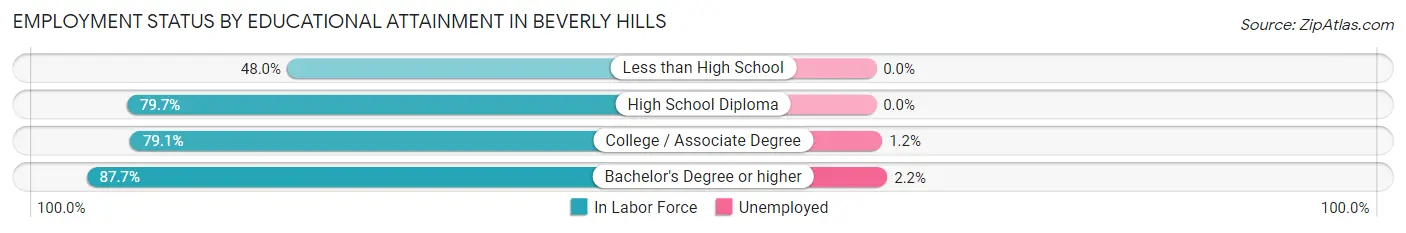
| Educational Attainment | In Labor Force | Unemployed |
| Less than High School | 36 (48.0%) | 0 (0.0%) |
| High School Diploma | 141 (79.7%) | 0 (0.0%) |
| College / Associate Degree | 572 (79.1%) | 9 (1.2%) |
| Bachelor's Degree or higher | 3,747 (87.7%) | 94 (2.2%) |
| Total | 4,491 (85.6%) | 105 (2.0%) |
Employment Occupations by Sex in Beverly Hills
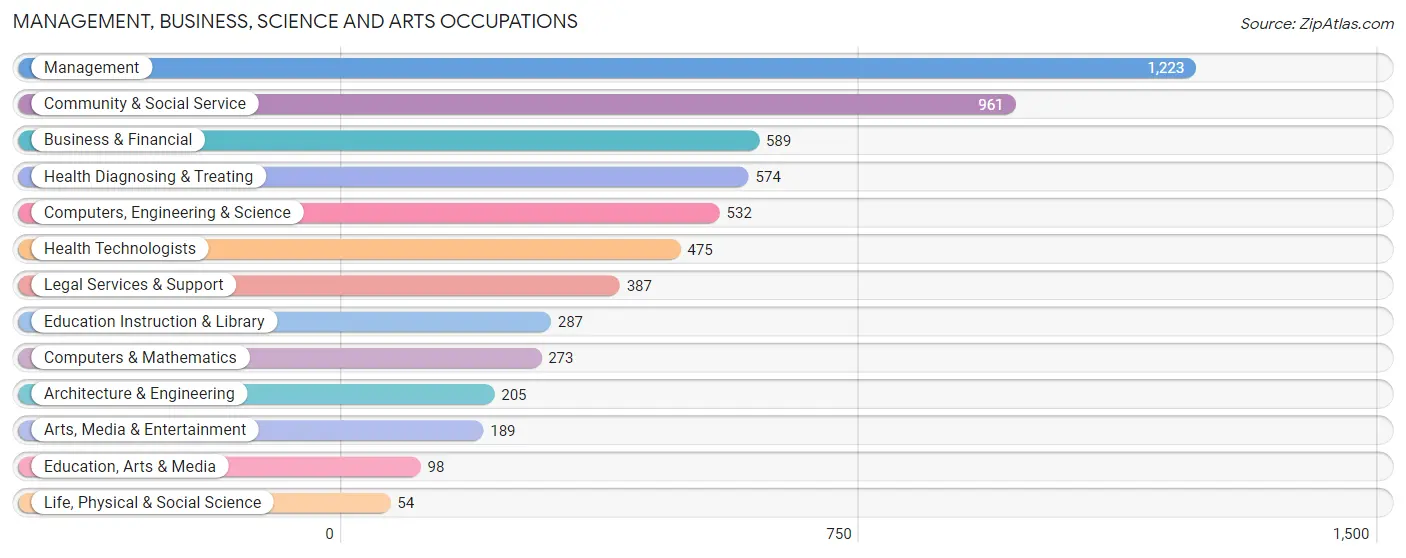
Management, Business, Science and Arts Occupations
The most common Management, Business, Science and Arts occupations in Beverly Hills are Management (1,223 | 22.8%), Community & Social Service (961 | 17.9%), Business & Financial (589 | 11.0%), Health Diagnosing & Treating (574 | 10.7%), and Computers, Engineering & Science (532 | 9.9%).
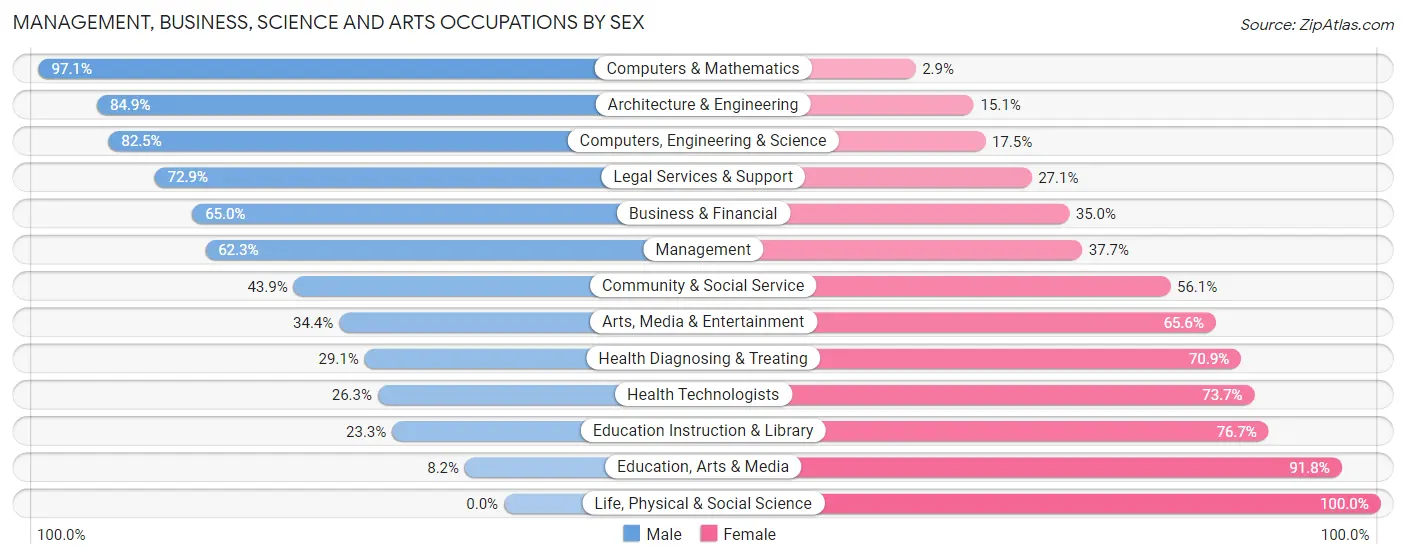
Management, Business, Science and Arts Occupations by Sex
Within the Management, Business, Science and Arts occupations in Beverly Hills, the most male-oriented occupations are Computers & Mathematics (97.1%), Architecture & Engineering (84.9%), and Computers, Engineering & Science (82.5%), while the most female-oriented occupations are Life, Physical & Social Science (100.0%), Education, Arts & Media (91.8%), and Education Instruction & Library (76.7%).
| Occupation | Male | Female |
| Management | 762 (62.3%) | 461 (37.7%) |
| Business & Financial | 383 (65.0%) | 206 (35.0%) |
| Computers, Engineering & Science | 439 (82.5%) | 93 (17.5%) |
| Computers & Mathematics | 265 (97.1%) | 8 (2.9%) |
| Architecture & Engineering | 174 (84.9%) | 31 (15.1%) |
| Life, Physical & Social Science | 0 (0.0%) | 54 (100.0%) |
| Community & Social Service | 422 (43.9%) | 539 (56.1%) |
| Education, Arts & Media | 8 (8.2%) | 90 (91.8%) |
| Legal Services & Support | 282 (72.9%) | 105 (27.1%) |
| Education Instruction & Library | 67 (23.3%) | 220 (76.7%) |
| Arts, Media & Entertainment | 65 (34.4%) | 124 (65.6%) |
| Health Diagnosing & Treating | 167 (29.1%) | 407 (70.9%) |
| Health Technologists | 125 (26.3%) | 350 (73.7%) |
| Total (Category) | 2,173 (56.0%) | 1,706 (44.0%) |
| Total (Overall) | 2,861 (53.4%) | 2,501 (46.6%) |
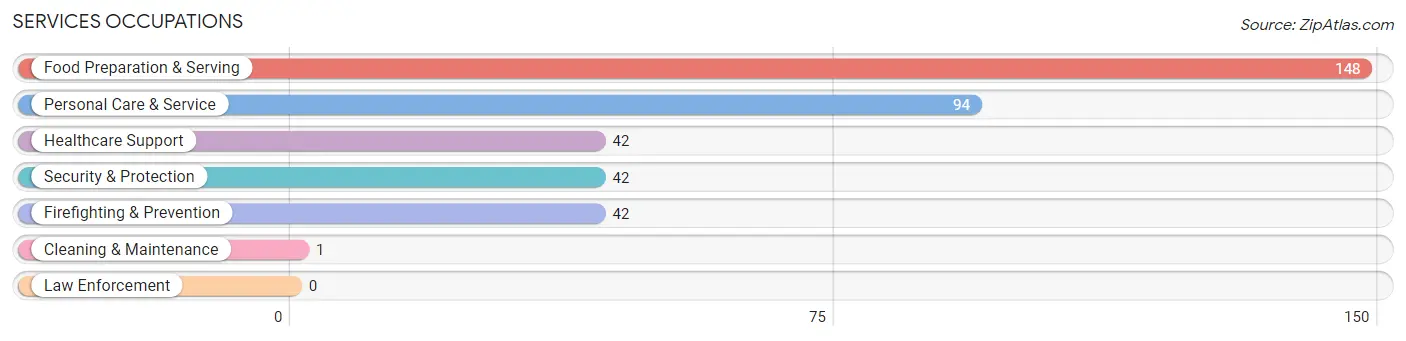
Services Occupations
The most common Services occupations in Beverly Hills are Food Preparation & Serving (148 | 2.8%), Personal Care & Service (94 | 1.8%), Healthcare Support (42 | 0.8%), Security & Protection (42 | 0.8%), and Firefighting & Prevention (42 | 0.8%).
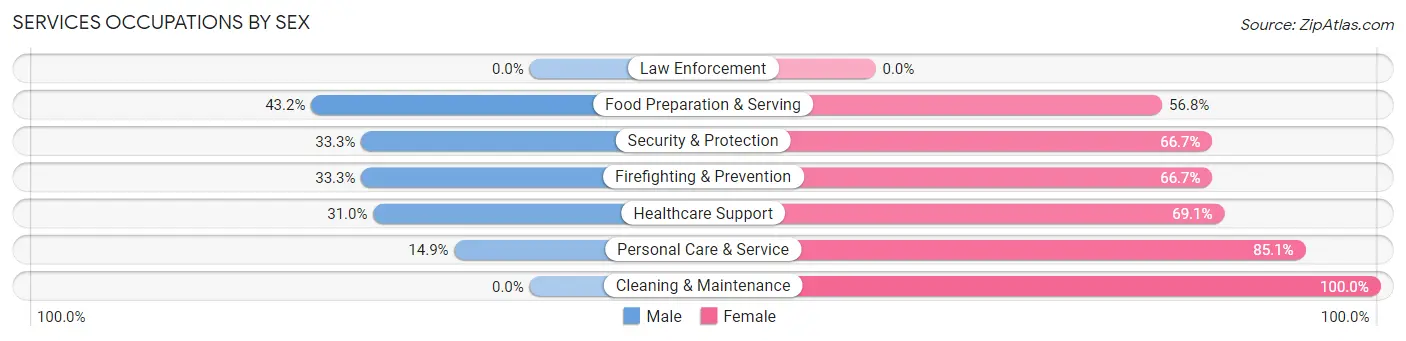
Services Occupations by Sex
Within the Services occupations in Beverly Hills, the most male-oriented occupations are Food Preparation & Serving (43.2%), Security & Protection (33.3%), and Firefighting & Prevention (33.3%), while the most female-oriented occupations are Cleaning & Maintenance (100.0%), Personal Care & Service (85.1%), and Healthcare Support (69.1%).
| Occupation | Male | Female |
| Healthcare Support | 13 (30.9%) | 29 (69.1%) |
| Security & Protection | 14 (33.3%) | 28 (66.7%) |
| Firefighting & Prevention | 14 (33.3%) | 28 (66.7%) |
| Law Enforcement | 0 (0.0%) | 0 (0.0%) |
| Food Preparation & Serving | 64 (43.2%) | 84 (56.8%) |
| Cleaning & Maintenance | 0 (0.0%) | 1 (100.0%) |
| Personal Care & Service | 14 (14.9%) | 80 (85.1%) |
| Total (Category) | 105 (32.1%) | 222 (67.9%) |
| Total (Overall) | 2,861 (53.4%) | 2,501 (46.6%) |
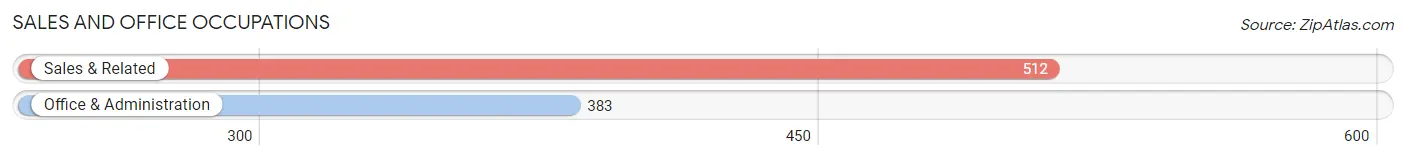
Sales and Office Occupations
The most common Sales and Office occupations in Beverly Hills are Sales & Related (512 | 9.6%), and Office & Administration (383 | 7.1%).
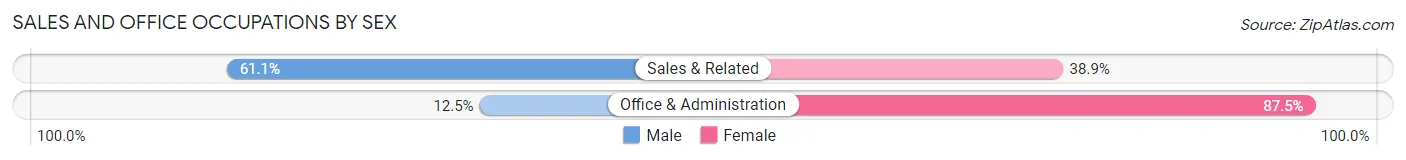
Sales and Office Occupations by Sex
| Occupation | Male | Female |
| Sales & Related | 313 (61.1%) | 199 (38.9%) |
| Office & Administration | 48 (12.5%) | 335 (87.5%) |
| Total (Category) | 361 (40.3%) | 534 (59.7%) |
| Total (Overall) | 2,861 (53.4%) | 2,501 (46.6%) |
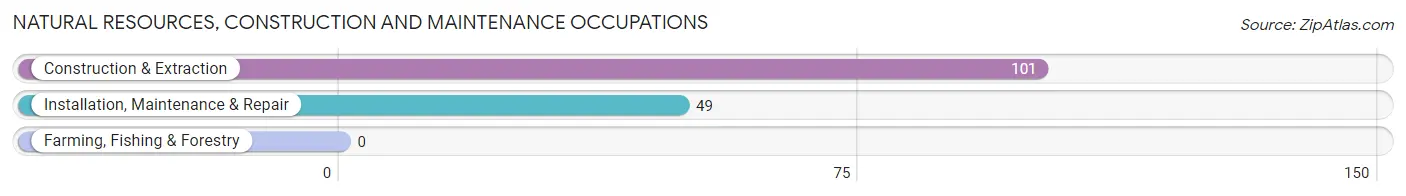
Natural Resources, Construction and Maintenance Occupations
The most common Natural Resources, Construction and Maintenance occupations in Beverly Hills are Construction & Extraction (101 | 1.9%), and Installation, Maintenance & Repair (49 | 0.9%).
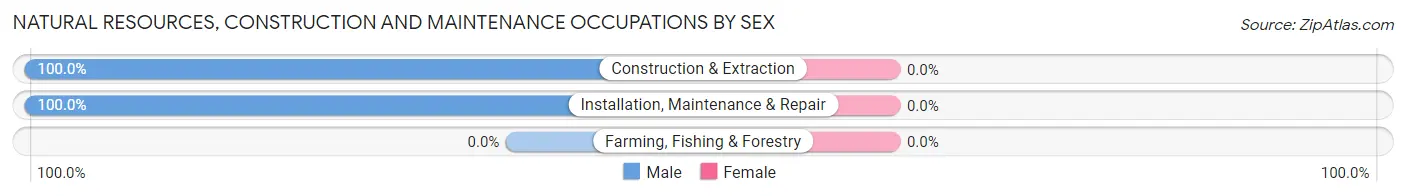
Natural Resources, Construction and Maintenance Occupations by Sex
| Occupation | Male | Female |
| Farming, Fishing & Forestry | 0 (0.0%) | 0 (0.0%) |
| Construction & Extraction | 101 (100.0%) | 0 (0.0%) |
| Installation, Maintenance & Repair | 49 (100.0%) | 0 (0.0%) |
| Total (Category) | 150 (100.0%) | 0 (0.0%) |
| Total (Overall) | 2,861 (53.4%) | 2,501 (46.6%) |
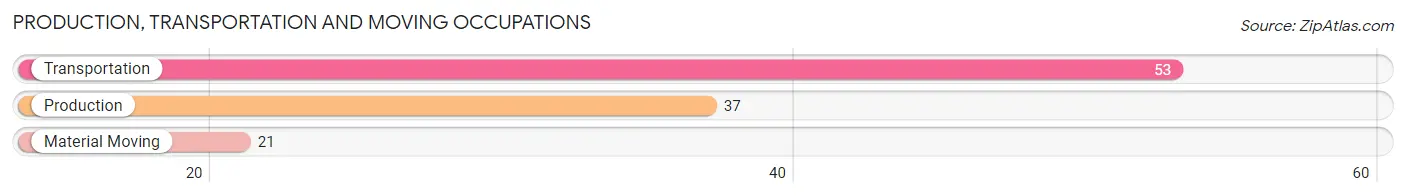
Production, Transportation and Moving Occupations
The most common Production, Transportation and Moving occupations in Beverly Hills are Transportation (53 | 1.0%), Production (37 | 0.7%), and Material Moving (21 | 0.4%).
Production, Transportation and Moving Occupations by Sex
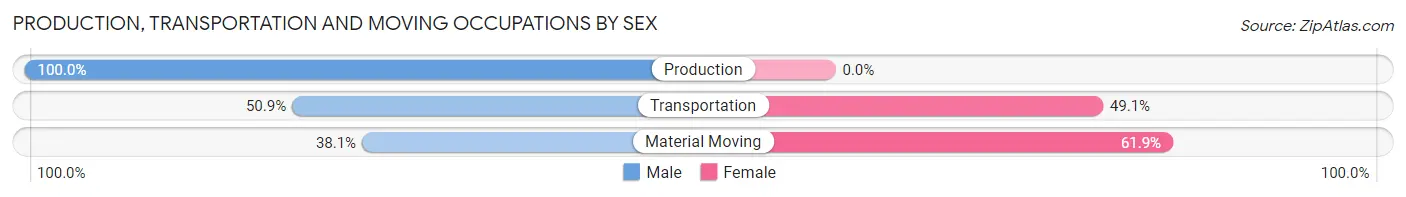
| Occupation | Male | Female |
| Production | 37 (100.0%) | 0 (0.0%) |
| Transportation | 27 (50.9%) | 26 (49.1%) |
| Material Moving | 8 (38.1%) | 13 (61.9%) |
| Total (Category) | 72 (64.9%) | 39 (35.1%) |
| Total (Overall) | 2,861 (53.4%) | 2,501 (46.6%) |
Employment Industries by Sex in Beverly Hills
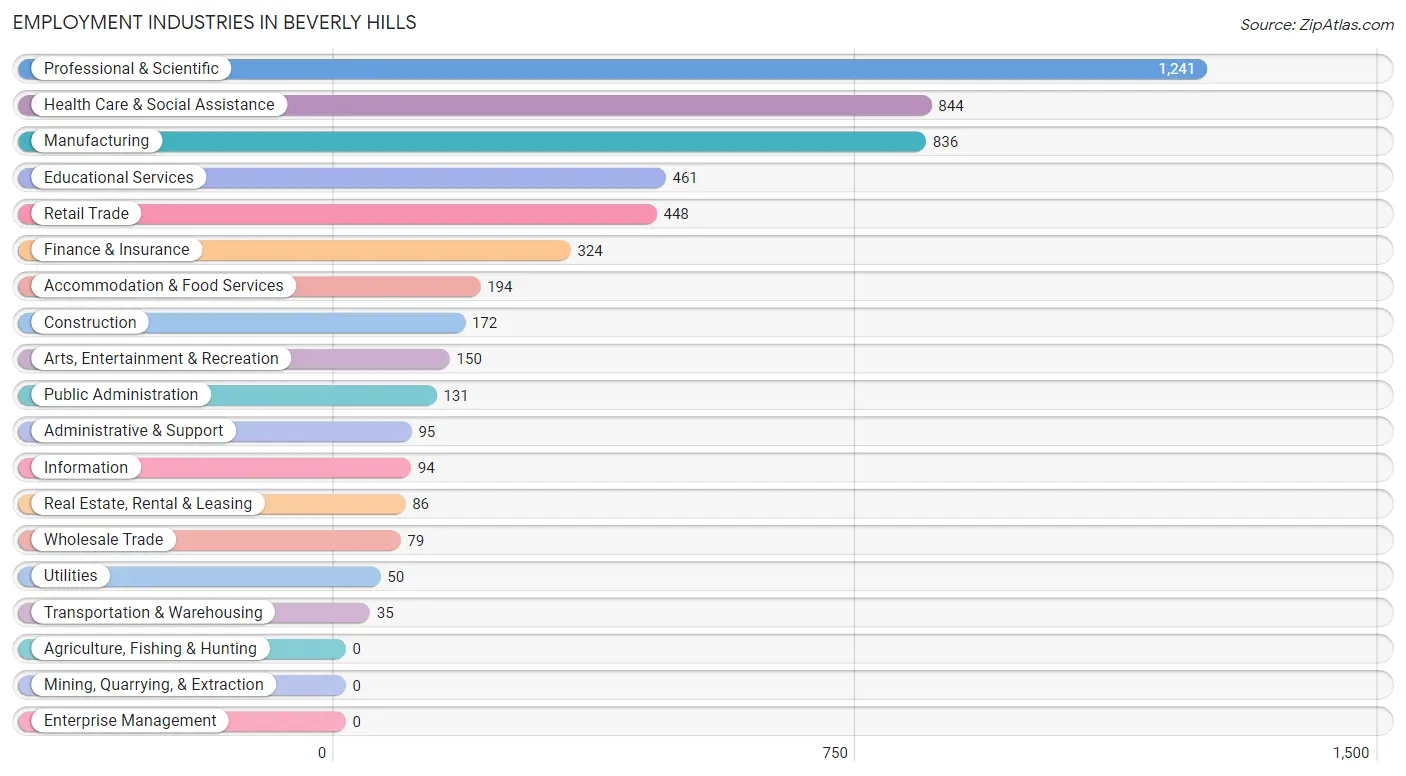
Employment Industries in Beverly Hills
The major employment industries in Beverly Hills include Professional & Scientific (1,241 | 23.1%), Health Care & Social Assistance (844 | 15.7%), Manufacturing (836 | 15.6%), Educational Services (461 | 8.6%), and Retail Trade (448 | 8.4%).
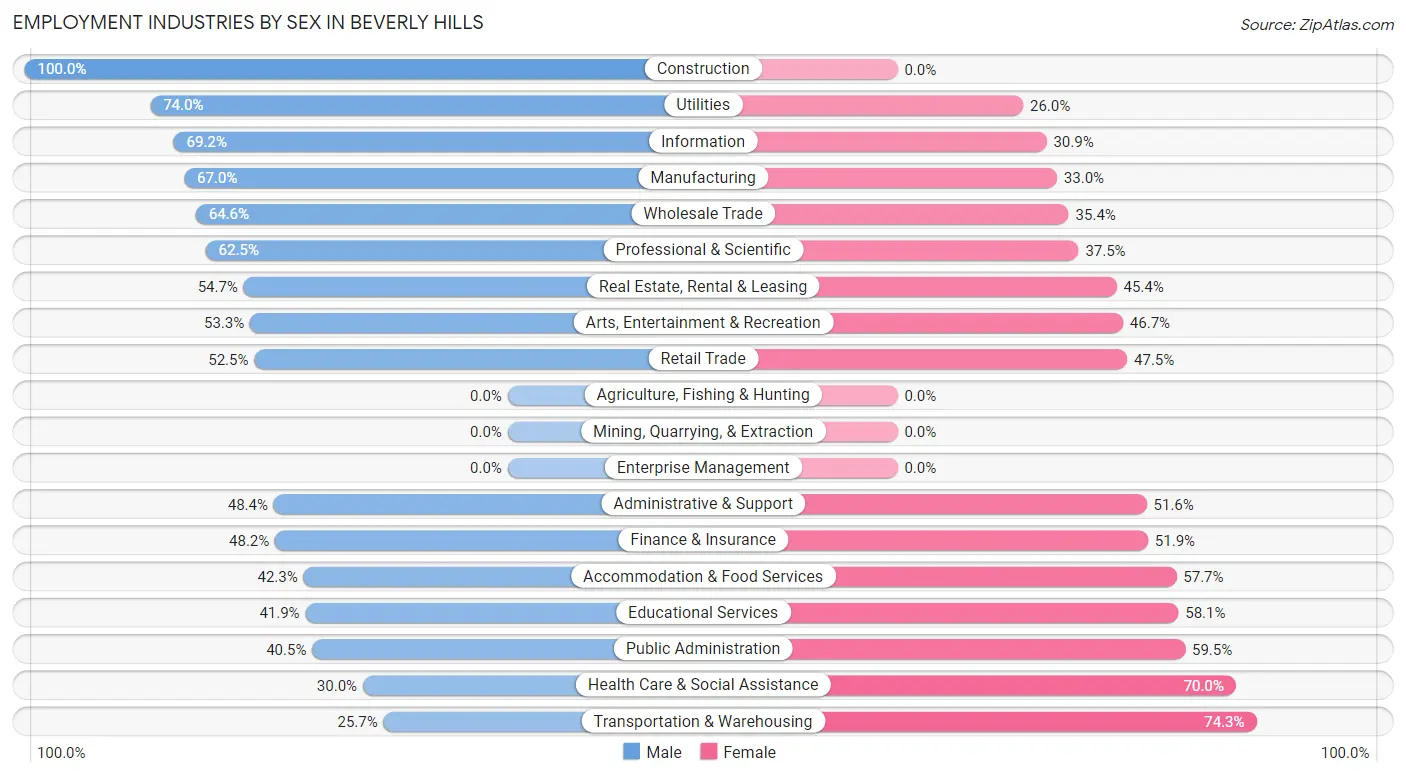
Employment Industries by Sex in Beverly Hills
The Beverly Hills industries that see more men than women are Construction (100.0%), Utilities (74.0%), and Information (69.2%), whereas the industries that tend to have a higher number of women are Transportation & Warehousing (74.3%), Health Care & Social Assistance (70.0%), and Public Administration (59.5%).
| Industry | Male | Female |
| Agriculture, Fishing & Hunting | 0 (0.0%) | 0 (0.0%) |
| Mining, Quarrying, & Extraction | 0 (0.0%) | 0 (0.0%) |
| Construction | 172 (100.0%) | 0 (0.0%) |
| Manufacturing | 560 (67.0%) | 276 (33.0%) |
| Wholesale Trade | 51 (64.6%) | 28 (35.4%) |
| Retail Trade | 235 (52.5%) | 213 (47.5%) |
| Transportation & Warehousing | 9 (25.7%) | 26 (74.3%) |
| Utilities | 37 (74.0%) | 13 (26.0%) |
| Information | 65 (69.2%) | 29 (30.8%) |
| Finance & Insurance | 156 (48.1%) | 168 (51.8%) |
| Real Estate, Rental & Leasing | 47 (54.6%) | 39 (45.4%) |
| Professional & Scientific | 776 (62.5%) | 465 (37.5%) |
| Enterprise Management | 0 (0.0%) | 0 (0.0%) |
| Administrative & Support | 46 (48.4%) | 49 (51.6%) |
| Educational Services | 193 (41.9%) | 268 (58.1%) |
| Health Care & Social Assistance | 253 (30.0%) | 591 (70.0%) |
| Arts, Entertainment & Recreation | 80 (53.3%) | 70 (46.7%) |
| Accommodation & Food Services | 82 (42.3%) | 112 (57.7%) |
| Public Administration | 53 (40.5%) | 78 (59.5%) |
| Total | 2,861 (53.4%) | 2,501 (46.6%) |
Education in Beverly Hills
School Enrollment in Beverly Hills
The most common levels of schooling among the 2,539 students in Beverly Hills are high school (619 | 24.4%), middle school (585 | 23.0%), and elementary school (437 | 17.2%).
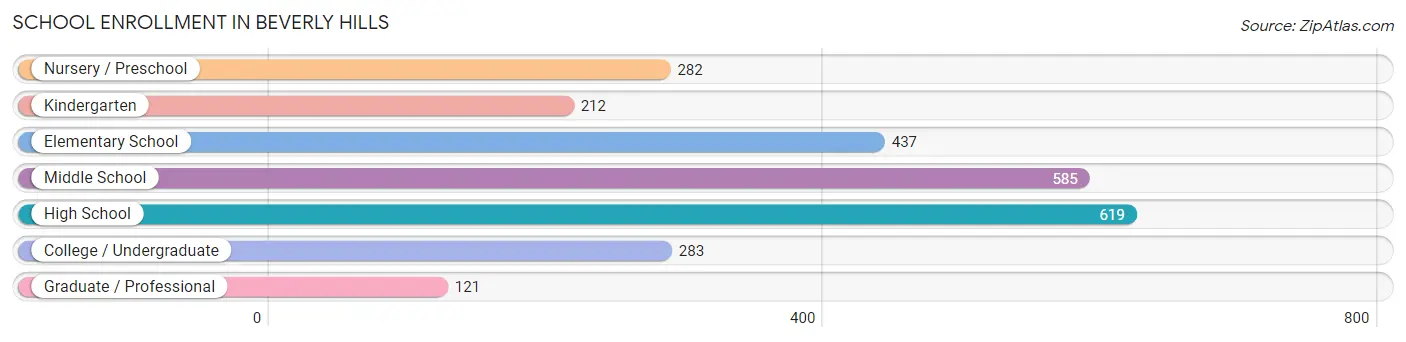
| School Level | # Students | % Students |
| Nursery / Preschool | 282 | 11.1% |
| Kindergarten | 212 | 8.4% |
| Elementary School | 437 | 17.2% |
| Middle School | 585 | 23.0% |
| High School | 619 | 24.4% |
| College / Undergraduate | 283 | 11.2% |
| Graduate / Professional | 121 | 4.8% |
| Total | 2,539 | 100.0% |
School Enrollment by Age by Funding Source in Beverly Hills
Out of a total of 2,539 students who are enrolled in schools in Beverly Hills, 663 (26.1%) attend a private institution, while the remaining 1,876 (73.9%) are enrolled in public schools. The age group of 3 to 4 year olds has the highest likelihood of being enrolled in private schools, with 199 (82.2% in the age bracket) enrolled. Conversely, the age group of 18 to 19 year olds has the lowest likelihood of being enrolled in a private school, with 189 (92.2% in the age bracket) attending a public institution.
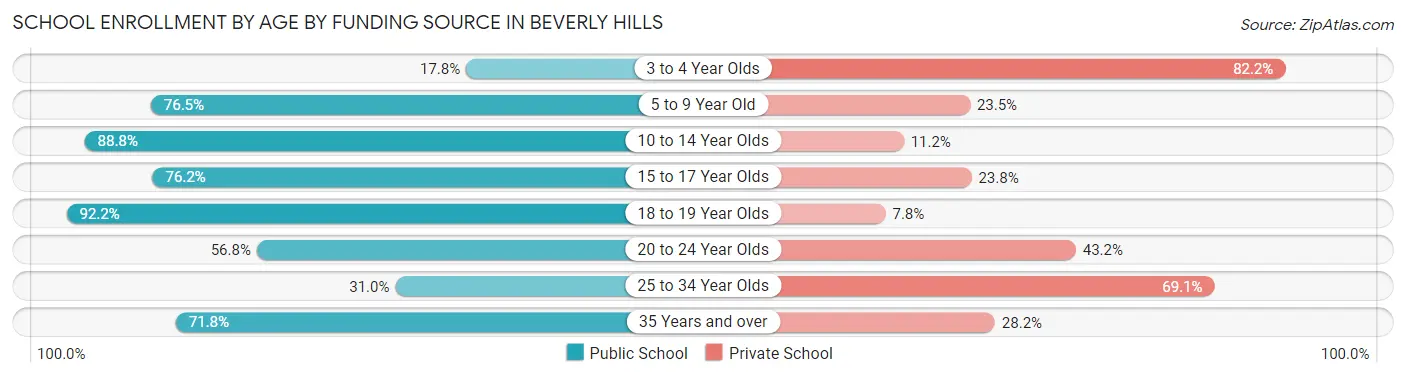
| Age Bracket | Public School | Private School |
| 3 to 4 Year Olds | 43 (17.8%) | 199 (82.2%) |
| 5 to 9 Year Old | 504 (76.5%) | 155 (23.5%) |
| 10 to 14 Year Olds | 675 (88.8%) | 85 (11.2%) |
| 15 to 17 Year Olds | 288 (76.2%) | 90 (23.8%) |
| 18 to 19 Year Olds | 189 (92.2%) | 16 (7.8%) |
| 20 to 24 Year Olds | 63 (56.8%) | 48 (43.2%) |
| 25 to 34 Year Olds | 13 (30.9%) | 29 (69.1%) |
| 35 Years and over | 102 (71.8%) | 40 (28.2%) |
| Total | 1,876 (73.9%) | 663 (26.1%) |
Educational Attainment by Field of Study in Beverly Hills
Business (1,348 | 21.0%), social sciences (731 | 11.4%), engineering (649 | 10.1%), communications (603 | 9.4%), and science & technology (554 | 8.6%) are the most common fields of study among 6,407 individuals in Beverly Hills who have obtained a bachelor's degree or higher.
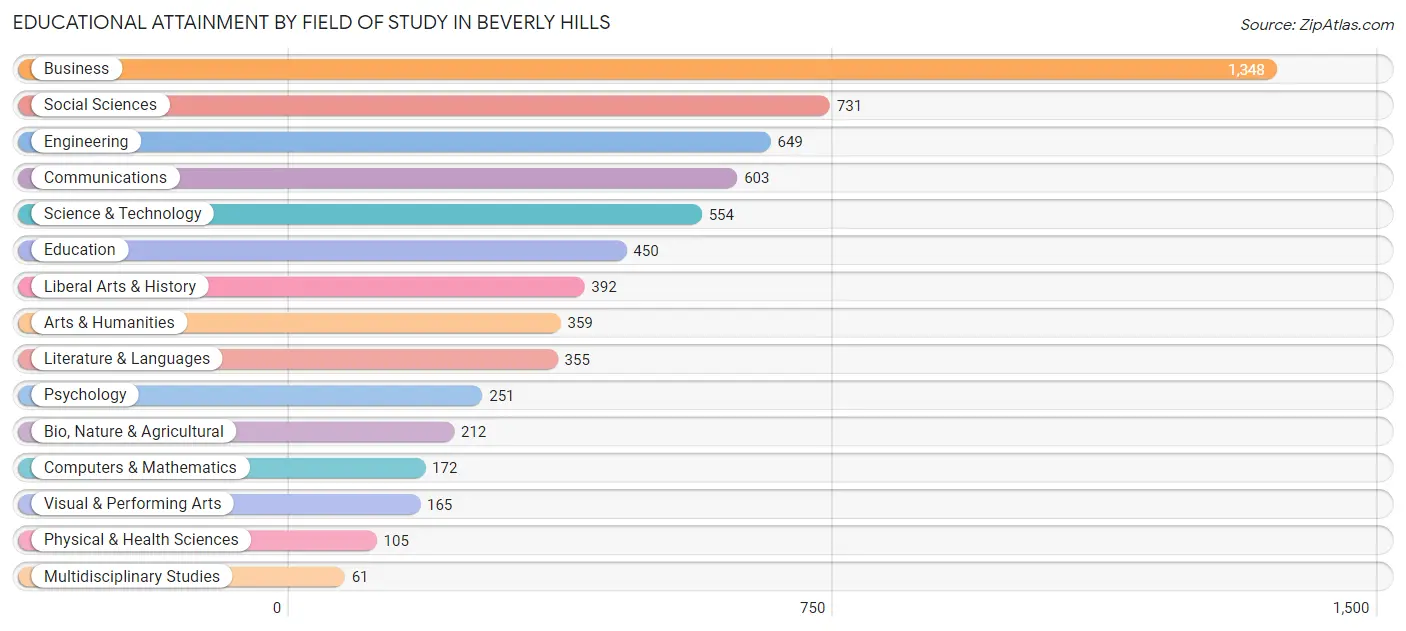
| Field of Study | # Graduates | % Graduates |
| Computers & Mathematics | 172 | 2.7% |
| Bio, Nature & Agricultural | 212 | 3.3% |
| Physical & Health Sciences | 105 | 1.6% |
| Psychology | 251 | 3.9% |
| Social Sciences | 731 | 11.4% |
| Engineering | 649 | 10.1% |
| Multidisciplinary Studies | 61 | 0.9% |
| Science & Technology | 554 | 8.6% |
| Business | 1,348 | 21.0% |
| Education | 450 | 7.0% |
| Literature & Languages | 355 | 5.5% |
| Liberal Arts & History | 392 | 6.1% |
| Visual & Performing Arts | 165 | 2.6% |
| Communications | 603 | 9.4% |
| Arts & Humanities | 359 | 5.6% |
| Total | 6,407 | 100.0% |
Transportation & Commute in Beverly Hills
Vehicle Availability by Sex in Beverly Hills
The most prevalent vehicle ownership categories in Beverly Hills are males with 2 vehicles (1,661, accounting for 58.5%) and females with 2 vehicles (1,347, making up 67.3%).

| Vehicles Available | Male | Female |
| No Vehicle | 10 (0.4%) | 15 (0.6%) |
| 1 Vehicle | 234 (8.2%) | 376 (15.2%) |
| 2 Vehicles | 1,661 (58.5%) | 1,347 (54.6%) |
| 3 Vehicles | 622 (21.9%) | 460 (18.6%) |
| 4 Vehicles | 178 (6.3%) | 192 (7.8%) |
| 5 or more Vehicles | 136 (4.8%) | 77 (3.1%) |
| Total | 2,841 (100.0%) | 2,467 (100.0%) |
Commute Time in Beverly Hills
The most frequently occuring commute durations in Beverly Hills are 15 to 19 minutes (832 commuters, 20.8%), 20 to 24 minutes (639 commuters, 16.0%), and 30 to 34 minutes (626 commuters, 15.7%).
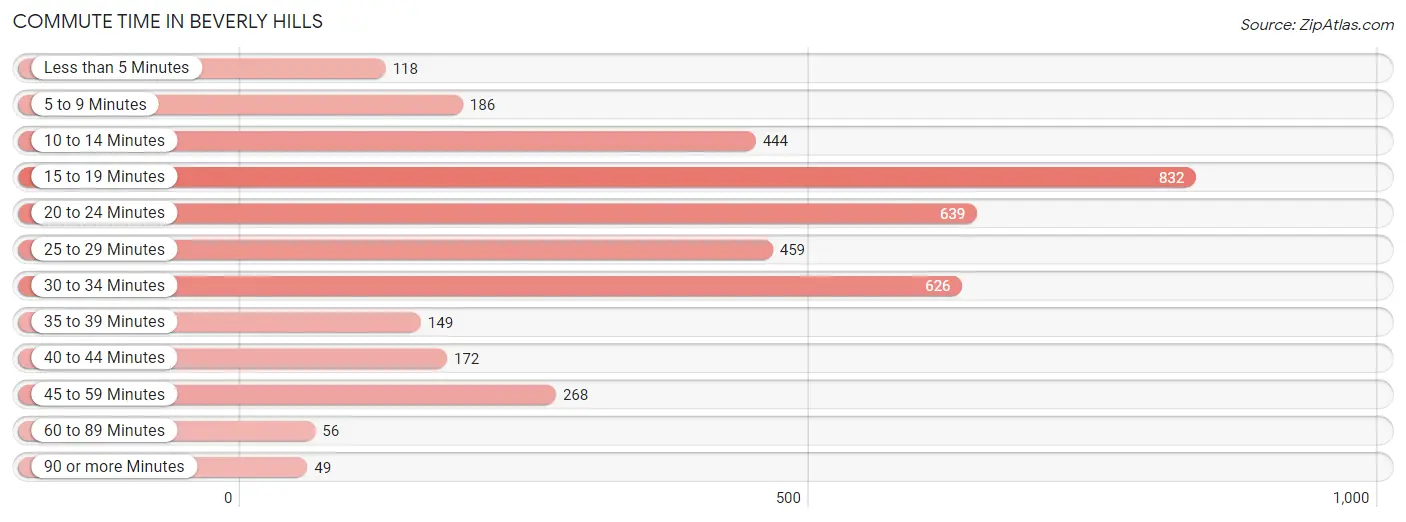
| Commute Time | # Commuters | % Commuters |
| Less than 5 Minutes | 118 | 2.9% |
| 5 to 9 Minutes | 186 | 4.6% |
| 10 to 14 Minutes | 444 | 11.1% |
| 15 to 19 Minutes | 832 | 20.8% |
| 20 to 24 Minutes | 639 | 16.0% |
| 25 to 29 Minutes | 459 | 11.5% |
| 30 to 34 Minutes | 626 | 15.7% |
| 35 to 39 Minutes | 149 | 3.7% |
| 40 to 44 Minutes | 172 | 4.3% |
| 45 to 59 Minutes | 268 | 6.7% |
| 60 to 89 Minutes | 56 | 1.4% |
| 90 or more Minutes | 49 | 1.2% |
Commute Time by Sex in Beverly Hills
The most common commute times in Beverly Hills are 20 to 24 minutes (482 commuters, 23.6%) for males and 15 to 19 minutes (455 commuters, 23.3%) for females.
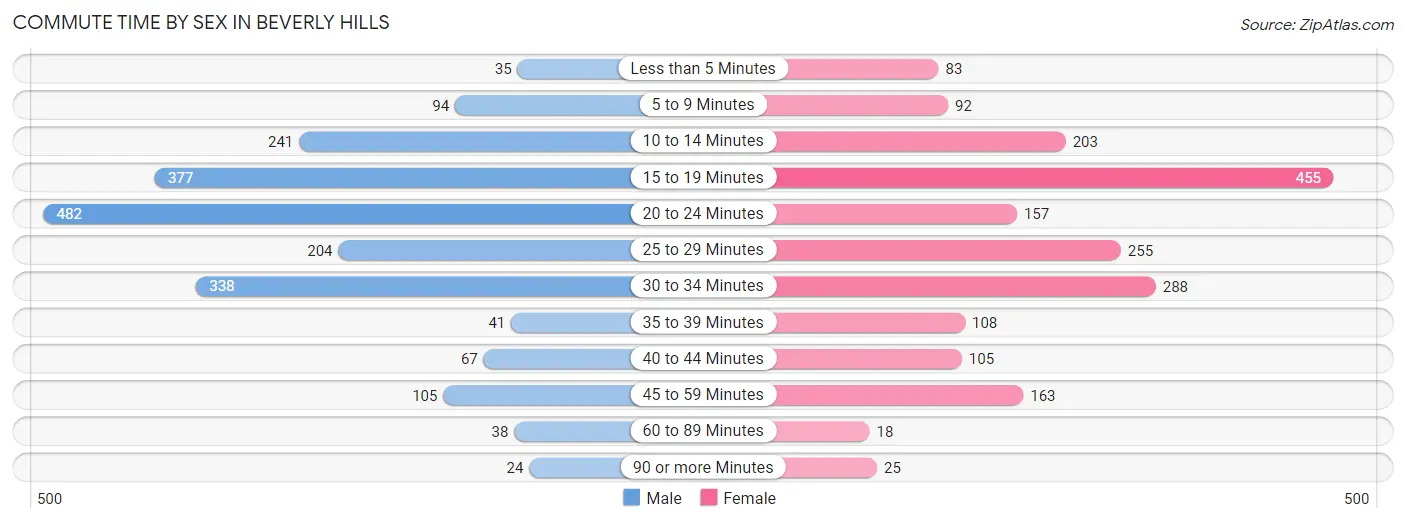
| Commute Time | Male | Female |
| Less than 5 Minutes | 35 (1.7%) | 83 (4.3%) |
| 5 to 9 Minutes | 94 (4.6%) | 92 (4.7%) |
| 10 to 14 Minutes | 241 (11.8%) | 203 (10.4%) |
| 15 to 19 Minutes | 377 (18.4%) | 455 (23.3%) |
| 20 to 24 Minutes | 482 (23.6%) | 157 (8.0%) |
| 25 to 29 Minutes | 204 (10.0%) | 255 (13.1%) |
| 30 to 34 Minutes | 338 (16.5%) | 288 (14.7%) |
| 35 to 39 Minutes | 41 (2.0%) | 108 (5.5%) |
| 40 to 44 Minutes | 67 (3.3%) | 105 (5.4%) |
| 45 to 59 Minutes | 105 (5.1%) | 163 (8.4%) |
| 60 to 89 Minutes | 38 (1.9%) | 18 (0.9%) |
| 90 or more Minutes | 24 (1.2%) | 25 (1.3%) |
Time of Departure to Work by Sex in Beverly Hills
The most frequent times of departure to work in Beverly Hills are 7:30 AM to 7:59 AM (417, 20.4%) for males and 8:00 AM to 8:29 AM (452, 23.2%) for females.
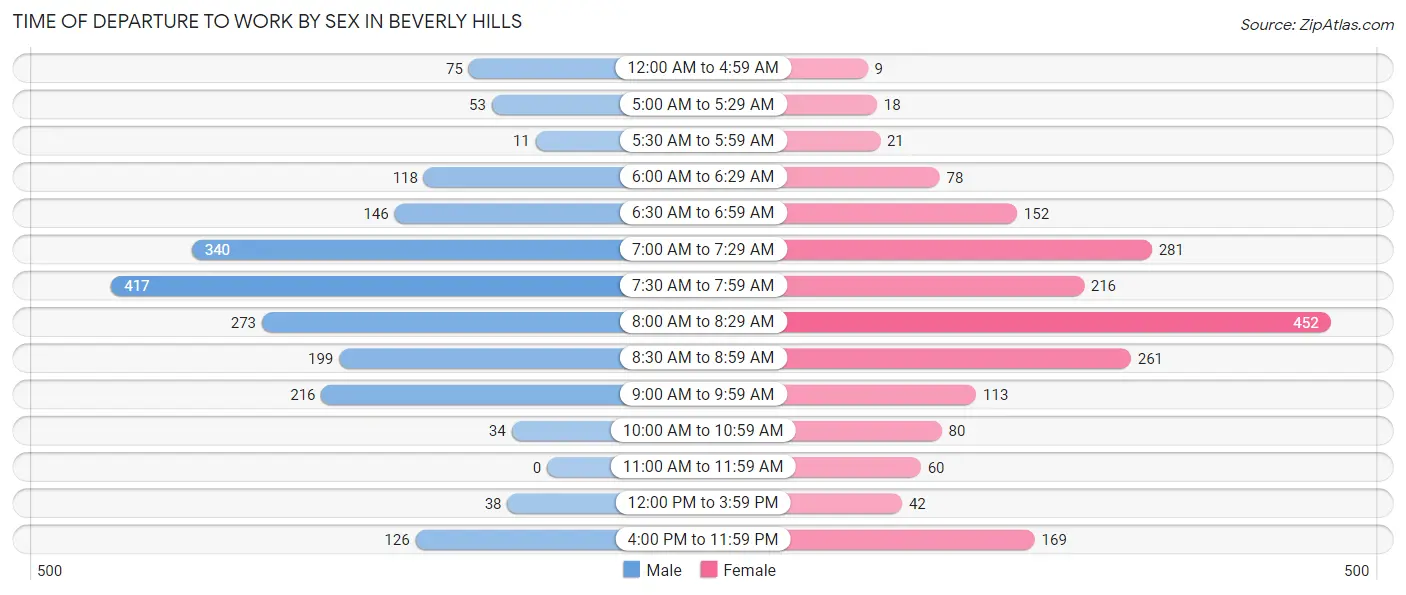
| Time of Departure | Male | Female |
| 12:00 AM to 4:59 AM | 75 (3.7%) | 9 (0.5%) |
| 5:00 AM to 5:29 AM | 53 (2.6%) | 18 (0.9%) |
| 5:30 AM to 5:59 AM | 11 (0.5%) | 21 (1.1%) |
| 6:00 AM to 6:29 AM | 118 (5.8%) | 78 (4.0%) |
| 6:30 AM to 6:59 AM | 146 (7.1%) | 152 (7.8%) |
| 7:00 AM to 7:29 AM | 340 (16.6%) | 281 (14.4%) |
| 7:30 AM to 7:59 AM | 417 (20.4%) | 216 (11.1%) |
| 8:00 AM to 8:29 AM | 273 (13.3%) | 452 (23.2%) |
| 8:30 AM to 8:59 AM | 199 (9.7%) | 261 (13.4%) |
| 9:00 AM to 9:59 AM | 216 (10.6%) | 113 (5.8%) |
| 10:00 AM to 10:59 AM | 34 (1.7%) | 80 (4.1%) |
| 11:00 AM to 11:59 AM | 0 (0.0%) | 60 (3.1%) |
| 12:00 PM to 3:59 PM | 38 (1.9%) | 42 (2.1%) |
| 4:00 PM to 11:59 PM | 126 (6.2%) | 169 (8.7%) |
| Total | 2,046 (100.0%) | 1,952 (100.0%) |
Housing Occupancy in Beverly Hills
Occupancy by Ownership in Beverly Hills
Of the total 4,183 dwellings in Beverly Hills, owner-occupied units account for 3,928 (93.9%), while renter-occupied units make up 255 (6.1%).
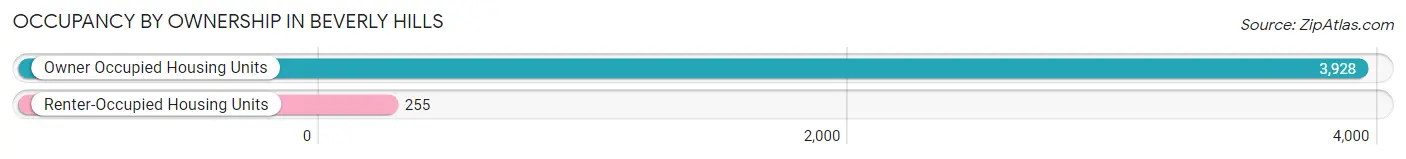
| Occupancy | # Housing Units | % Housing Units |
| Owner Occupied Housing Units | 3,928 | 93.9% |
| Renter-Occupied Housing Units | 255 | 6.1% |
| Total Occupied Housing Units | 4,183 | 100.0% |
Occupancy by Household Size in Beverly Hills
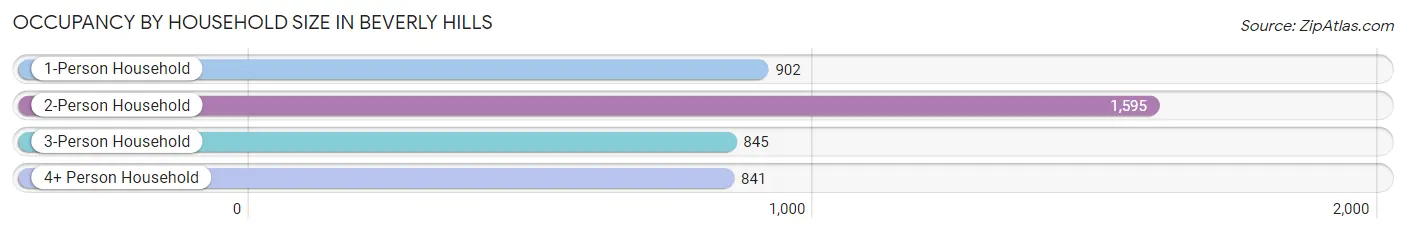
| Household Size | # Housing Units | % Housing Units |
| 1-Person Household | 902 | 21.6% |
| 2-Person Household | 1,595 | 38.1% |
| 3-Person Household | 845 | 20.2% |
| 4+ Person Household | 841 | 20.1% |
| Total Housing Units | 4,183 | 100.0% |
Occupancy by Ownership by Household Size in Beverly Hills
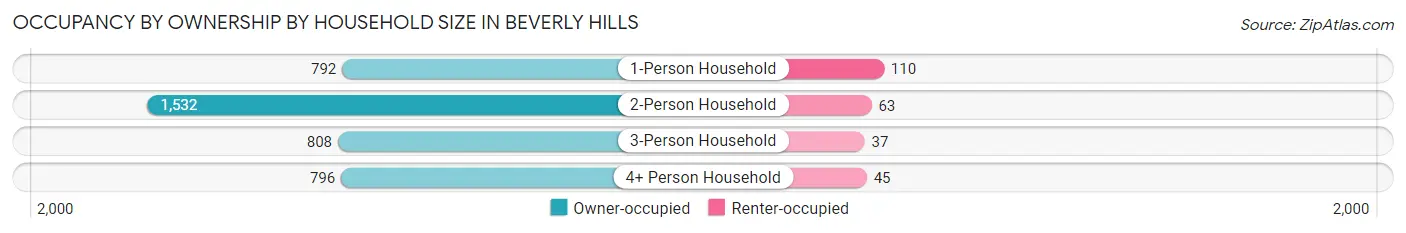
| Household Size | Owner-occupied | Renter-occupied |
| 1-Person Household | 792 (87.8%) | 110 (12.2%) |
| 2-Person Household | 1,532 (96.1%) | 63 (4.0%) |
| 3-Person Household | 808 (95.6%) | 37 (4.4%) |
| 4+ Person Household | 796 (94.7%) | 45 (5.3%) |
| Total Housing Units | 3,928 (93.9%) | 255 (6.1%) |
Occupancy by Educational Attainment in Beverly Hills
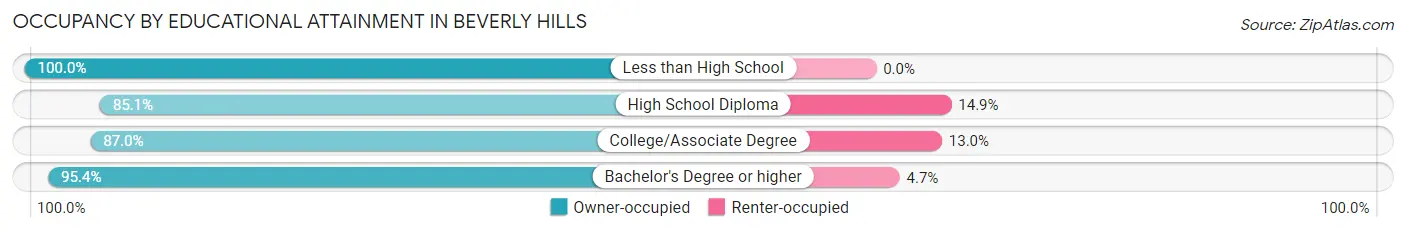
| Household Size | Owner-occupied | Renter-occupied |
| Less than High School | 6 (100.0%) | 0 (0.0%) |
| High School Diploma | 137 (85.1%) | 24 (14.9%) |
| College/Associate Degree | 461 (87.0%) | 69 (13.0%) |
| Bachelor's Degree or higher | 3,324 (95.4%) | 162 (4.6%) |
Occupancy by Age of Householder in Beverly Hills
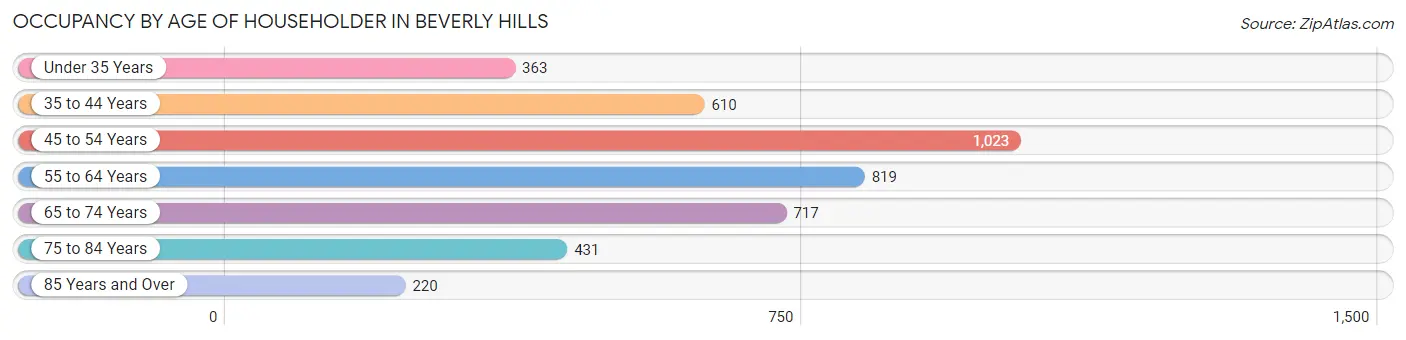
| Age Bracket | # Households | % Households |
| Under 35 Years | 363 | 8.7% |
| 35 to 44 Years | 610 | 14.6% |
| 45 to 54 Years | 1,023 | 24.5% |
| 55 to 64 Years | 819 | 19.6% |
| 65 to 74 Years | 717 | 17.1% |
| 75 to 84 Years | 431 | 10.3% |
| 85 Years and Over | 220 | 5.3% |
| Total | 4,183 | 100.0% |
Housing Finances in Beverly Hills
Median Income by Occupancy in Beverly Hills
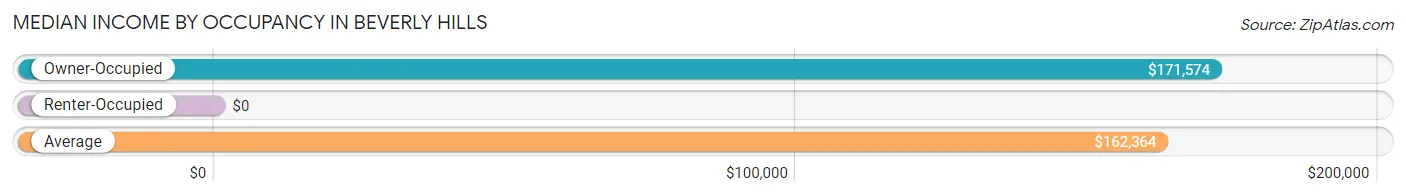
| Occupancy Type | # Households | Median Income |
| Owner-Occupied | 3,928 (93.9%) | $171,574 |
| Renter-Occupied | 255 (6.1%) | $0 |
| Average | 4,183 (100.0%) | $162,364 |
Occupancy by Householder Income Bracket in Beverly Hills
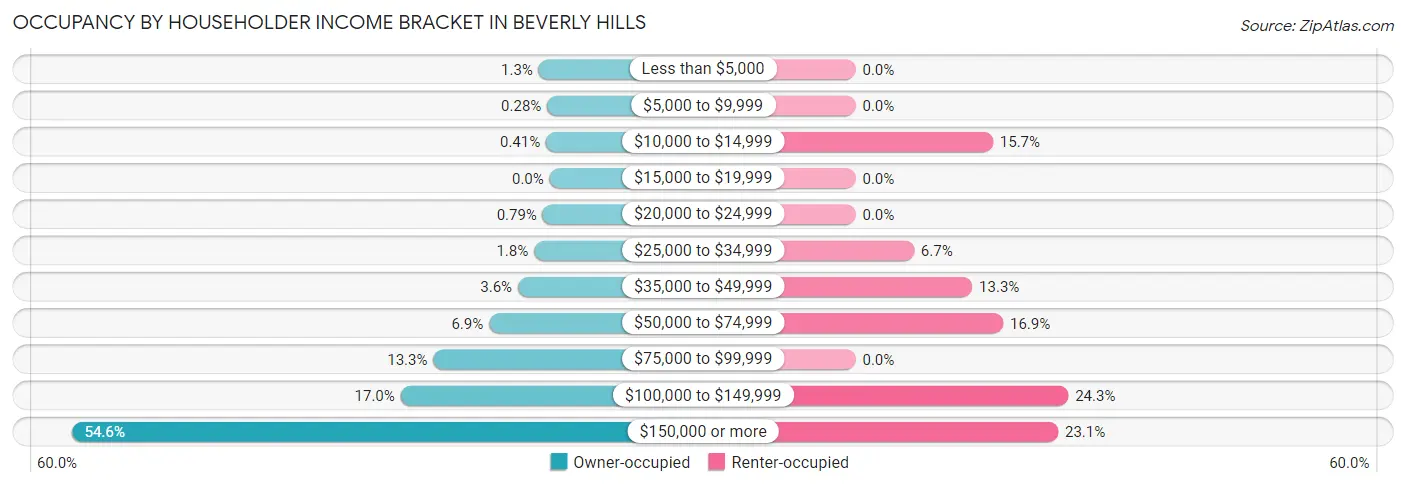
| Income Bracket | Owner-occupied | Renter-occupied |
| Less than $5,000 | 49 (1.3%) | 0 (0.0%) |
| $5,000 to $9,999 | 11 (0.3%) | 0 (0.0%) |
| $10,000 to $14,999 | 16 (0.4%) | 40 (15.7%) |
| $15,000 to $19,999 | 0 (0.0%) | 0 (0.0%) |
| $20,000 to $24,999 | 31 (0.8%) | 0 (0.0%) |
| $25,000 to $34,999 | 70 (1.8%) | 17 (6.7%) |
| $35,000 to $49,999 | 142 (3.6%) | 34 (13.3%) |
| $50,000 to $74,999 | 272 (6.9%) | 43 (16.9%) |
| $75,000 to $99,999 | 522 (13.3%) | 0 (0.0%) |
| $100,000 to $149,999 | 669 (17.0%) | 62 (24.3%) |
| $150,000 or more | 2,146 (54.6%) | 59 (23.1%) |
| Total | 3,928 (100.0%) | 255 (100.0%) |
Monthly Housing Cost Tiers in Beverly Hills
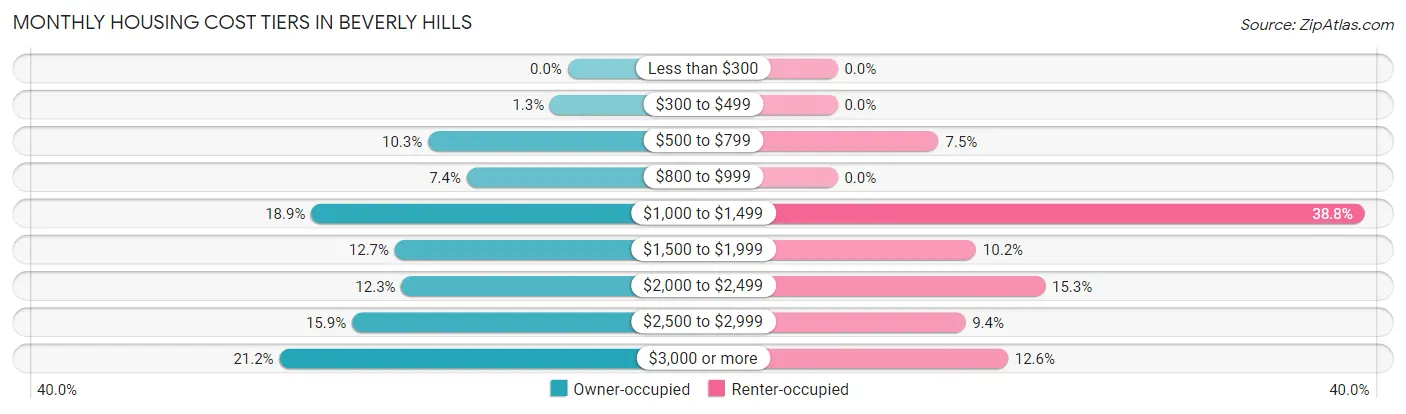
| Monthly Cost | Owner-occupied | Renter-occupied |
| Less than $300 | 0 (0.0%) | 0 (0.0%) |
| $300 to $499 | 51 (1.3%) | 0 (0.0%) |
| $500 to $799 | 404 (10.3%) | 19 (7.4%) |
| $800 to $999 | 292 (7.4%) | 0 (0.0%) |
| $1,000 to $1,499 | 742 (18.9%) | 99 (38.8%) |
| $1,500 to $1,999 | 500 (12.7%) | 26 (10.2%) |
| $2,000 to $2,499 | 481 (12.2%) | 39 (15.3%) |
| $2,500 to $2,999 | 624 (15.9%) | 24 (9.4%) |
| $3,000 or more | 834 (21.2%) | 32 (12.6%) |
| Total | 3,928 (100.0%) | 255 (100.0%) |
Physical Housing Characteristics in Beverly Hills
Housing Structures in Beverly Hills
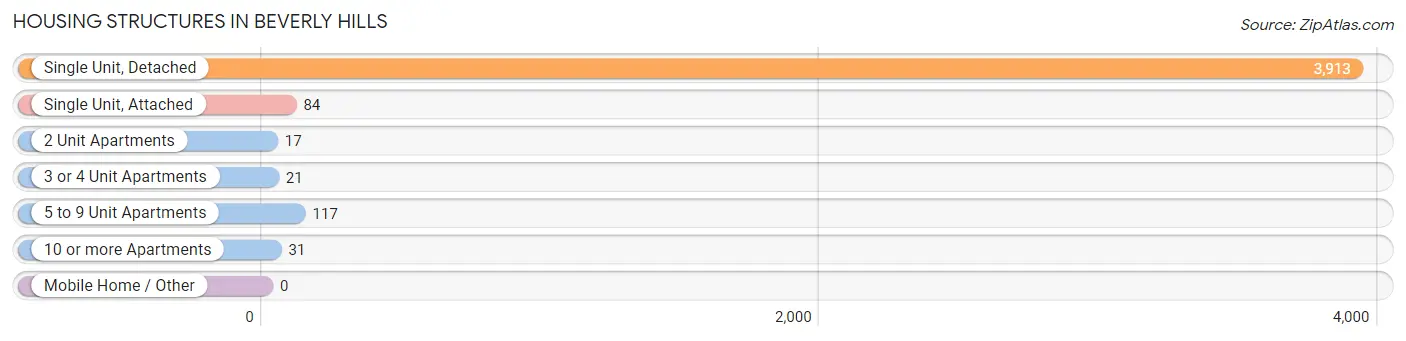
| Structure Type | # Housing Units | % Housing Units |
| Single Unit, Detached | 3,913 | 93.5% |
| Single Unit, Attached | 84 | 2.0% |
| 2 Unit Apartments | 17 | 0.4% |
| 3 or 4 Unit Apartments | 21 | 0.5% |
| 5 to 9 Unit Apartments | 117 | 2.8% |
| 10 or more Apartments | 31 | 0.7% |
| Mobile Home / Other | 0 | 0.0% |
| Total | 4,183 | 100.0% |
Housing Structures by Occupancy in Beverly Hills
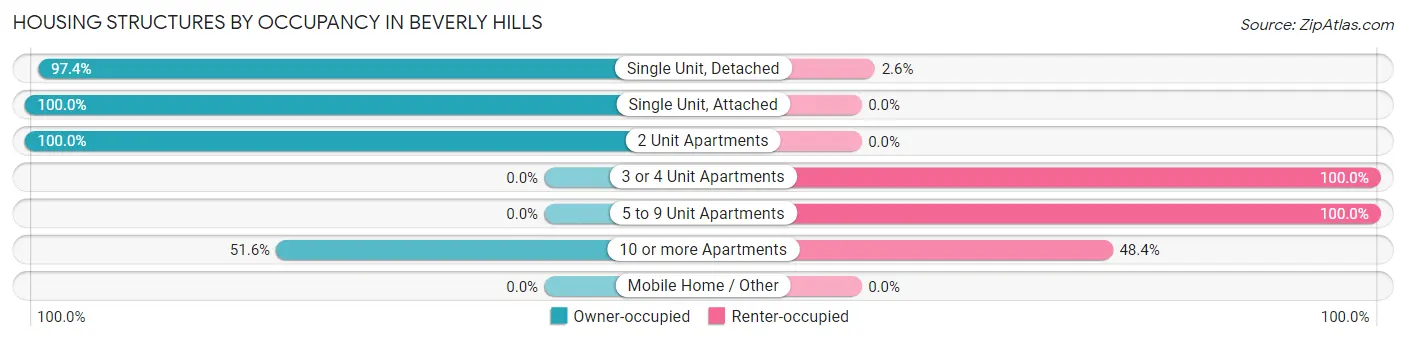
| Structure Type | Owner-occupied | Renter-occupied |
| Single Unit, Detached | 3,811 (97.4%) | 102 (2.6%) |
| Single Unit, Attached | 84 (100.0%) | 0 (0.0%) |
| 2 Unit Apartments | 17 (100.0%) | 0 (0.0%) |
| 3 or 4 Unit Apartments | 0 (0.0%) | 21 (100.0%) |
| 5 to 9 Unit Apartments | 0 (0.0%) | 117 (100.0%) |
| 10 or more Apartments | 16 (51.6%) | 15 (48.4%) |
| Mobile Home / Other | 0 (0.0%) | 0 (0.0%) |
| Total | 3,928 (93.9%) | 255 (6.1%) |
Housing Structures by Number of Rooms in Beverly Hills
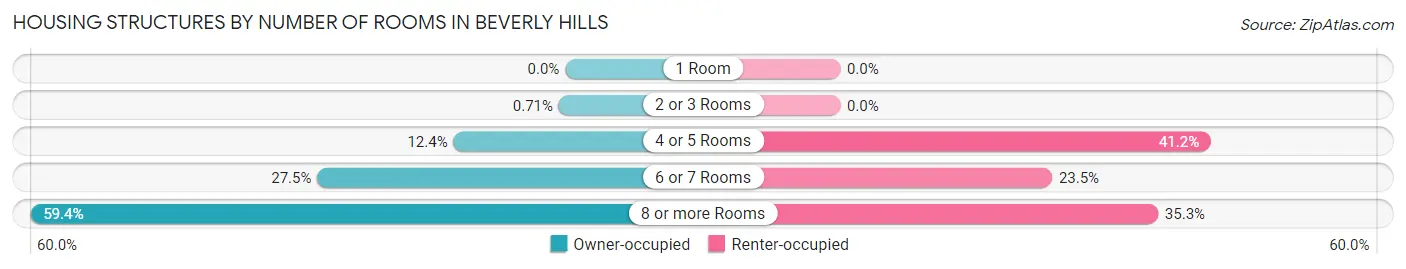
| Number of Rooms | Owner-occupied | Renter-occupied |
| 1 Room | 0 (0.0%) | 0 (0.0%) |
| 2 or 3 Rooms | 28 (0.7%) | 0 (0.0%) |
| 4 or 5 Rooms | 487 (12.4%) | 105 (41.2%) |
| 6 or 7 Rooms | 1,081 (27.5%) | 60 (23.5%) |
| 8 or more Rooms | 2,332 (59.4%) | 90 (35.3%) |
| Total | 3,928 (100.0%) | 255 (100.0%) |
Housing Structure by Heating Type in Beverly Hills
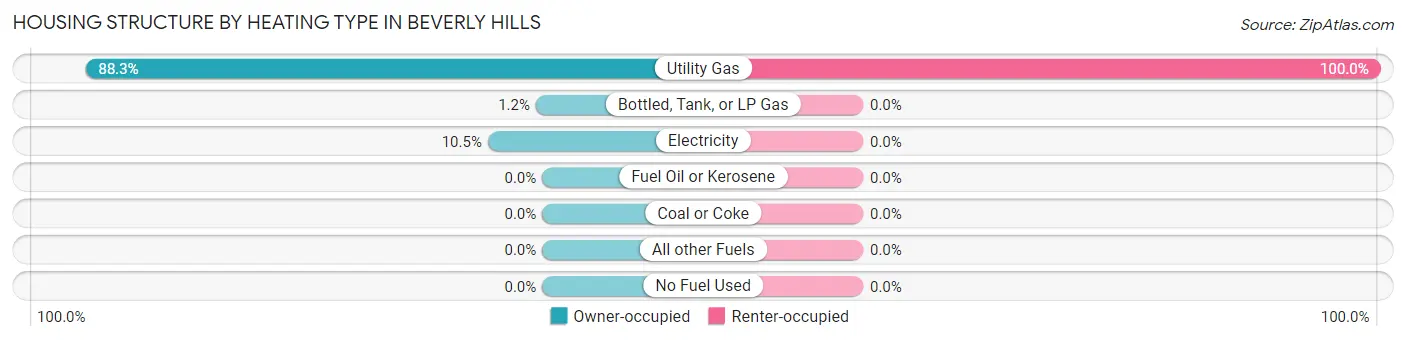
| Heating Type | Owner-occupied | Renter-occupied |
| Utility Gas | 3,467 (88.3%) | 255 (100.0%) |
| Bottled, Tank, or LP Gas | 48 (1.2%) | 0 (0.0%) |
| Electricity | 413 (10.5%) | 0 (0.0%) |
| Fuel Oil or Kerosene | 0 (0.0%) | 0 (0.0%) |
| Coal or Coke | 0 (0.0%) | 0 (0.0%) |
| All other Fuels | 0 (0.0%) | 0 (0.0%) |
| No Fuel Used | 0 (0.0%) | 0 (0.0%) |
| Total | 3,928 (100.0%) | 255 (100.0%) |
Household Vehicle Usage in Beverly Hills
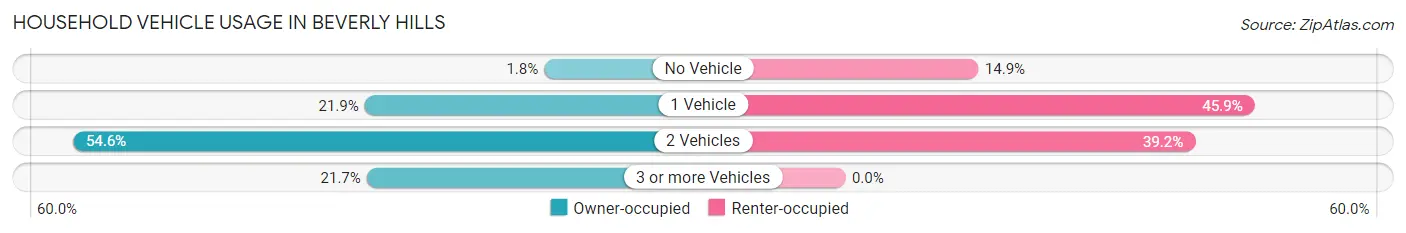
| Vehicles per Household | Owner-occupied | Renter-occupied |
| No Vehicle | 71 (1.8%) | 38 (14.9%) |
| 1 Vehicle | 861 (21.9%) | 117 (45.9%) |
| 2 Vehicles | 2,144 (54.6%) | 100 (39.2%) |
| 3 or more Vehicles | 852 (21.7%) | 0 (0.0%) |
| Total | 3,928 (100.0%) | 255 (100.0%) |
Real Estate & Mortgages in Beverly Hills
Real Estate and Mortgage Overview in Beverly Hills
| Characteristic | Without Mortgage | With Mortgage |
| Housing Units | 1,359 | 2,569 |
| Median Property Value | $405,200 | $483,500 |
| Median Household Income | $99,159 | $1,679 |
| Monthly Housing Costs | $979 | $834 |
| Real Estate Taxes | $6,166 | $23 |
Property Value by Mortgage Status in Beverly Hills
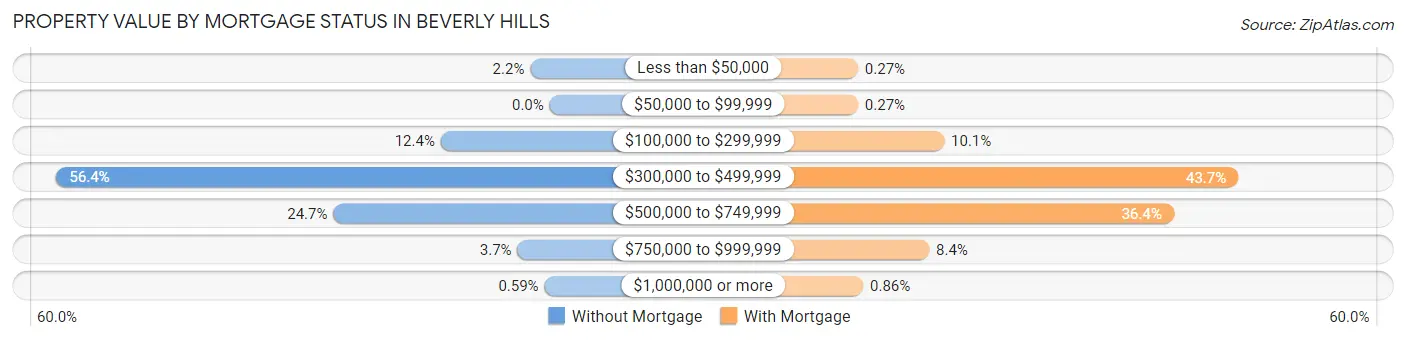
| Property Value | Without Mortgage | With Mortgage |
| Less than $50,000 | 30 (2.2%) | 7 (0.3%) |
| $50,000 to $99,999 | 0 (0.0%) | 7 (0.3%) |
| $100,000 to $299,999 | 169 (12.4%) | 260 (10.1%) |
| $300,000 to $499,999 | 766 (56.4%) | 1,123 (43.7%) |
| $500,000 to $749,999 | 336 (24.7%) | 934 (36.4%) |
| $750,000 to $999,999 | 50 (3.7%) | 216 (8.4%) |
| $1,000,000 or more | 8 (0.6%) | 22 (0.9%) |
| Total | 1,359 (100.0%) | 2,569 (100.0%) |
Household Income by Mortgage Status in Beverly Hills
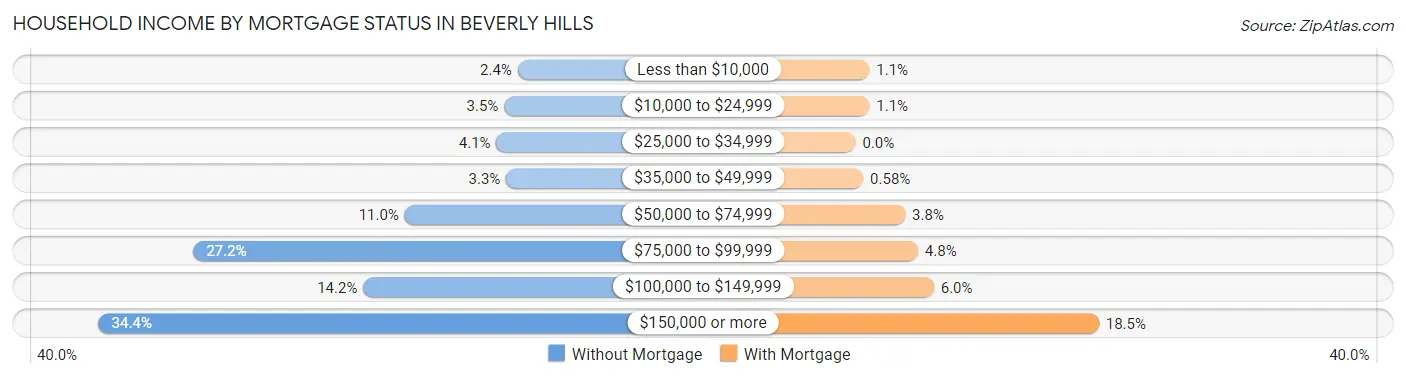
| Household Income | Without Mortgage | With Mortgage |
| Less than $10,000 | 33 (2.4%) | 27 (1.1%) |
| $10,000 to $24,999 | 47 (3.5%) | 27 (1.1%) |
| $25,000 to $34,999 | 55 (4.1%) | 0 (0.0%) |
| $35,000 to $49,999 | 45 (3.3%) | 15 (0.6%) |
| $50,000 to $74,999 | 150 (11.0%) | 97 (3.8%) |
| $75,000 to $99,999 | 369 (27.2%) | 122 (4.8%) |
| $100,000 to $149,999 | 193 (14.2%) | 153 (6.0%) |
| $150,000 or more | 467 (34.4%) | 476 (18.5%) |
| Total | 1,359 (100.0%) | 2,569 (100.0%) |
Property Value to Household Income Ratio in Beverly Hills
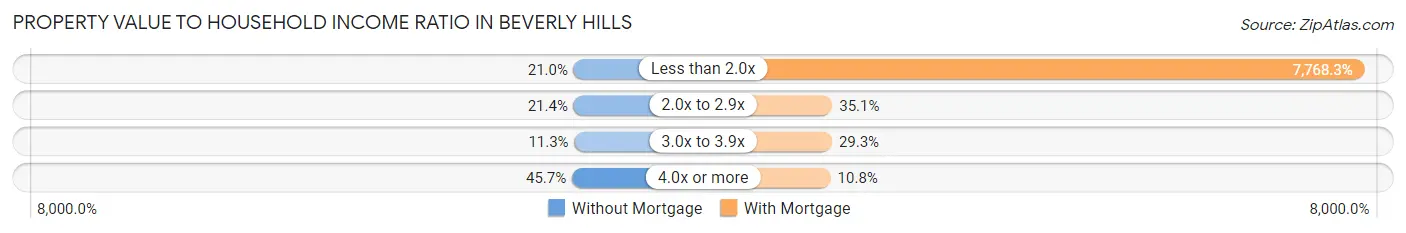
| Value-to-Income Ratio | Without Mortgage | With Mortgage |
| Less than 2.0x | 285 (21.0%) | 199,567 (7,768.3%) |
| 2.0x to 2.9x | 291 (21.4%) | 901 (35.1%) |
| 3.0x to 3.9x | 153 (11.3%) | 753 (29.3%) |
| 4.0x or more | 621 (45.7%) | 278 (10.8%) |
| Total | 1,359 (100.0%) | 2,569 (100.0%) |
Real Estate Taxes by Mortgage Status in Beverly Hills
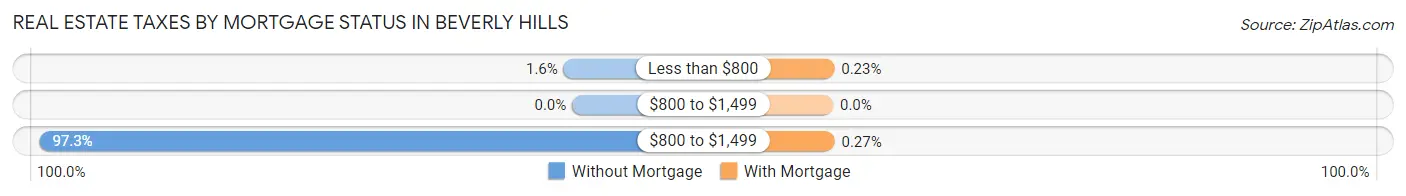
| Property Taxes | Without Mortgage | With Mortgage |
| Less than $800 | 21 (1.5%) | 6 (0.2%) |
| $800 to $1,499 | 0 (0.0%) | 0 (0.0%) |
| $800 to $1,499 | 1,322 (97.3%) | 7 (0.3%) |
| Total | 1,359 (100.0%) | 2,569 (100.0%) |
Health & Disability in Beverly Hills
Health Insurance Coverage by Age in Beverly Hills
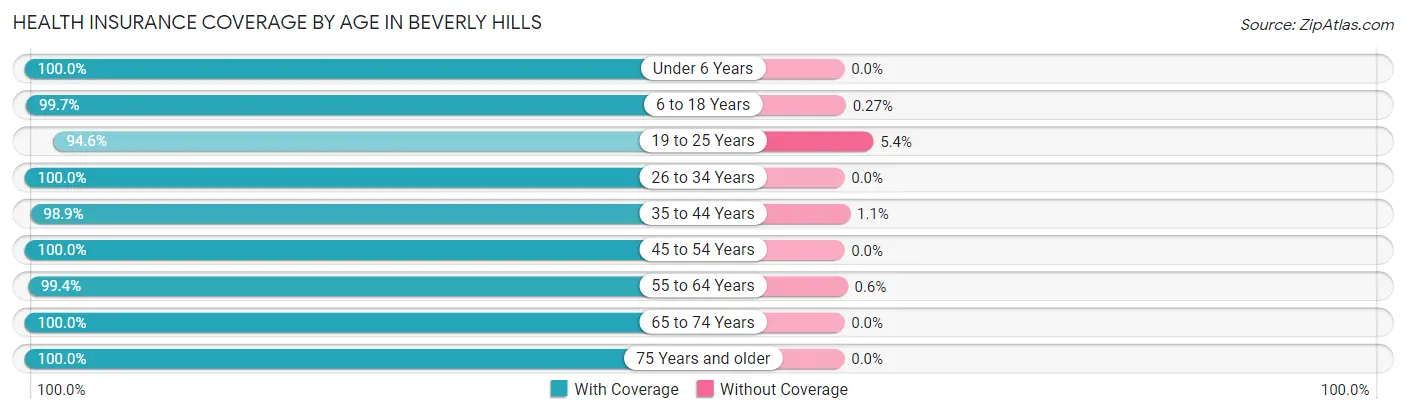
| Age Bracket | With Coverage | Without Coverage |
| Under 6 Years | 799 (100.0%) | 0 (0.0%) |
| 6 to 18 Years | 1,863 (99.7%) | 5 (0.3%) |
| 19 to 25 Years | 367 (94.6%) | 21 (5.4%) |
| 26 to 34 Years | 849 (100.0%) | 0 (0.0%) |
| 35 to 44 Years | 1,192 (98.9%) | 13 (1.1%) |
| 45 to 54 Years | 1,645 (100.0%) | 0 (0.0%) |
| 55 to 64 Years | 1,496 (99.4%) | 9 (0.6%) |
| 65 to 74 Years | 1,271 (100.0%) | 0 (0.0%) |
| 75 Years and older | 949 (100.0%) | 0 (0.0%) |
| Total | 10,431 (99.5%) | 48 (0.5%) |
Health Insurance Coverage by Citizenship Status in Beverly Hills
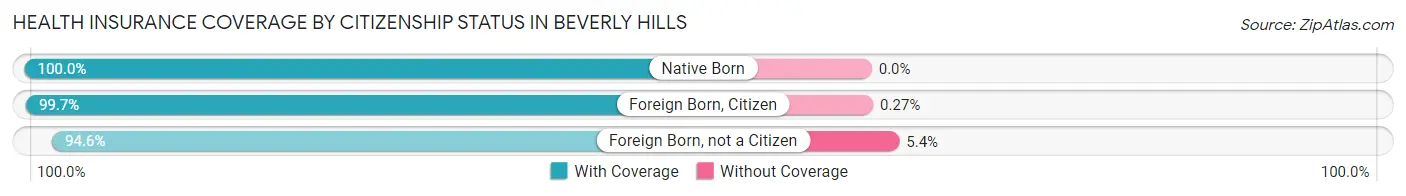
| Citizenship Status | With Coverage | Without Coverage |
| Native Born | 799 (100.0%) | 0 (0.0%) |
| Foreign Born, Citizen | 1,863 (99.7%) | 5 (0.3%) |
| Foreign Born, not a Citizen | 367 (94.6%) | 21 (5.4%) |
Health Insurance Coverage by Household Income in Beverly Hills
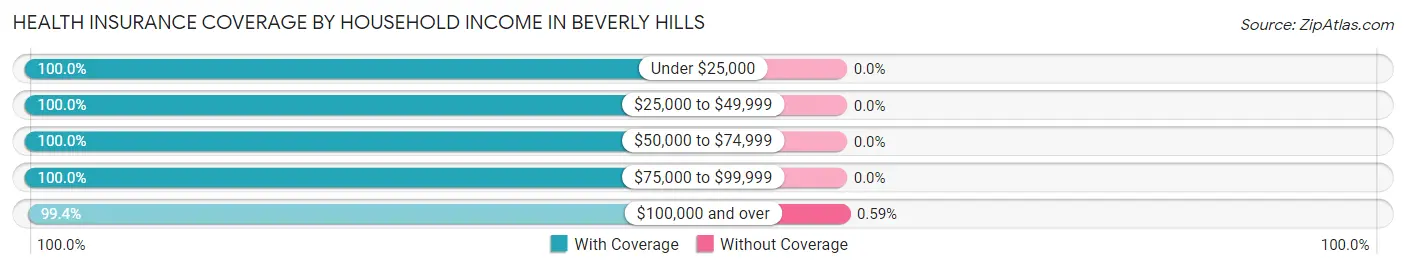
| Household Income | With Coverage | Without Coverage |
| Under $25,000 | 289 (100.0%) | 0 (0.0%) |
| $25,000 to $49,999 | 508 (100.0%) | 0 (0.0%) |
| $50,000 to $74,999 | 568 (100.0%) | 0 (0.0%) |
| $75,000 to $99,999 | 992 (100.0%) | 0 (0.0%) |
| $100,000 and over | 8,056 (99.4%) | 48 (0.6%) |
Public vs Private Health Insurance Coverage by Age in Beverly Hills
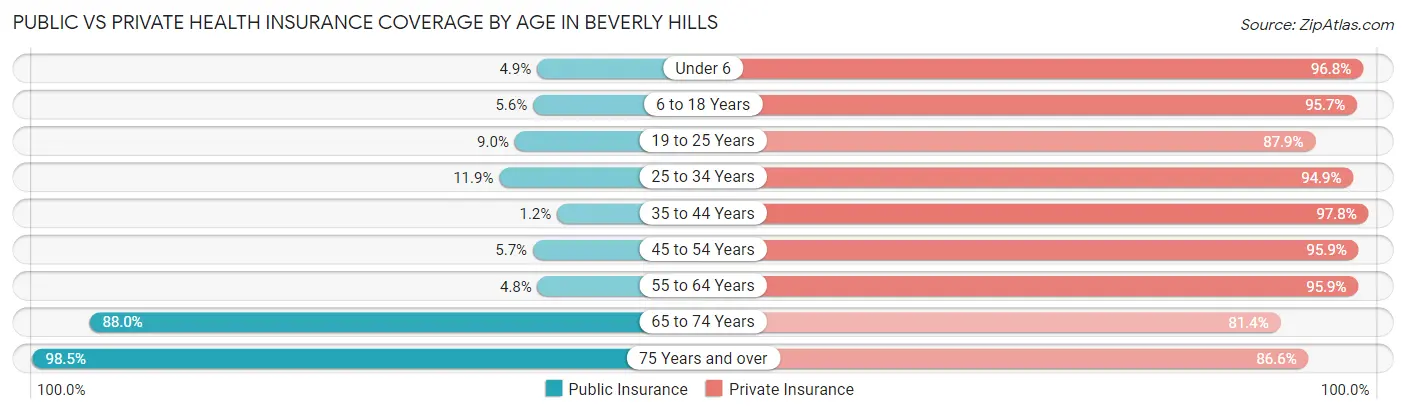
| Age Bracket | Public Insurance | Private Insurance |
| Under 6 | 39 (4.9%) | 773 (96.8%) |
| 6 to 18 Years | 105 (5.6%) | 1,787 (95.7%) |
| 19 to 25 Years | 35 (9.0%) | 341 (87.9%) |
| 25 to 34 Years | 101 (11.9%) | 806 (94.9%) |
| 35 to 44 Years | 14 (1.2%) | 1,178 (97.8%) |
| 45 to 54 Years | 93 (5.7%) | 1,578 (95.9%) |
| 55 to 64 Years | 72 (4.8%) | 1,443 (95.9%) |
| 65 to 74 Years | 1,118 (88.0%) | 1,035 (81.4%) |
| 75 Years and over | 935 (98.5%) | 822 (86.6%) |
| Total | 2,512 (24.0%) | 9,763 (93.2%) |
Disability Status by Sex by Age in Beverly Hills
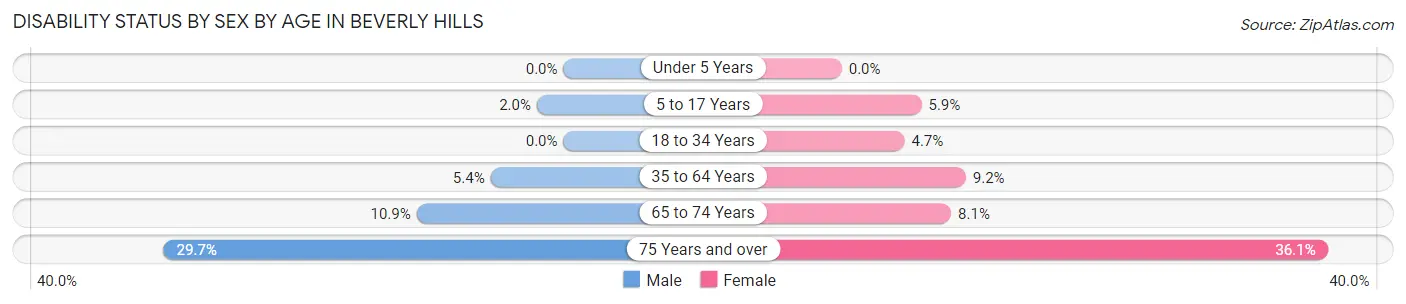
| Age Bracket | Male | Female |
| Under 5 Years | 0 (0.0%) | 0 (0.0%) |
| 5 to 17 Years | 20 (2.0%) | 50 (5.9%) |
| 18 to 34 Years | 0 (0.0%) | 34 (4.7%) |
| 35 to 64 Years | 114 (5.4%) | 207 (9.2%) |
| 65 to 74 Years | 62 (10.9%) | 57 (8.1%) |
| 75 Years and over | 122 (29.7%) | 194 (36.1%) |
Disability Class by Sex by Age in Beverly Hills
Disability Class: Hearing Difficulty
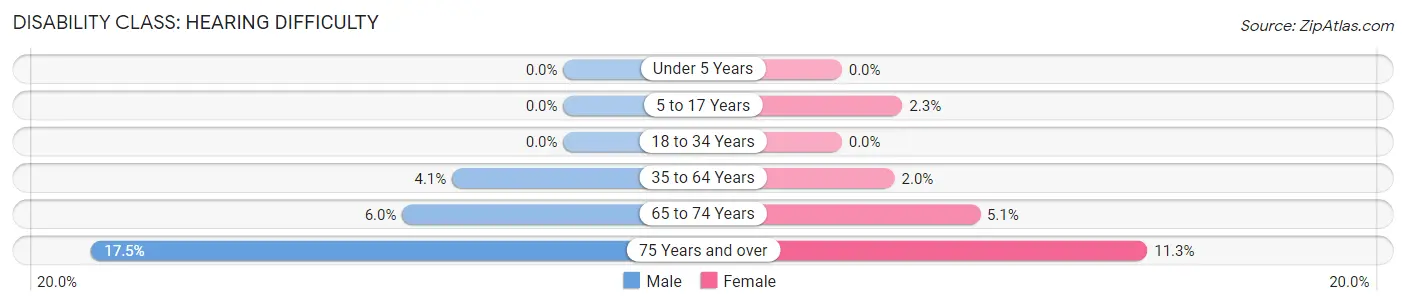
| Age Bracket | Male | Female |
| Under 5 Years | 0 (0.0%) | 0 (0.0%) |
| 5 to 17 Years | 0 (0.0%) | 19 (2.2%) |
| 18 to 34 Years | 0 (0.0%) | 0 (0.0%) |
| 35 to 64 Years | 87 (4.1%) | 44 (2.0%) |
| 65 to 74 Years | 34 (6.0%) | 36 (5.1%) |
| 75 Years and over | 72 (17.5%) | 61 (11.3%) |
Disability Class: Vision Difficulty
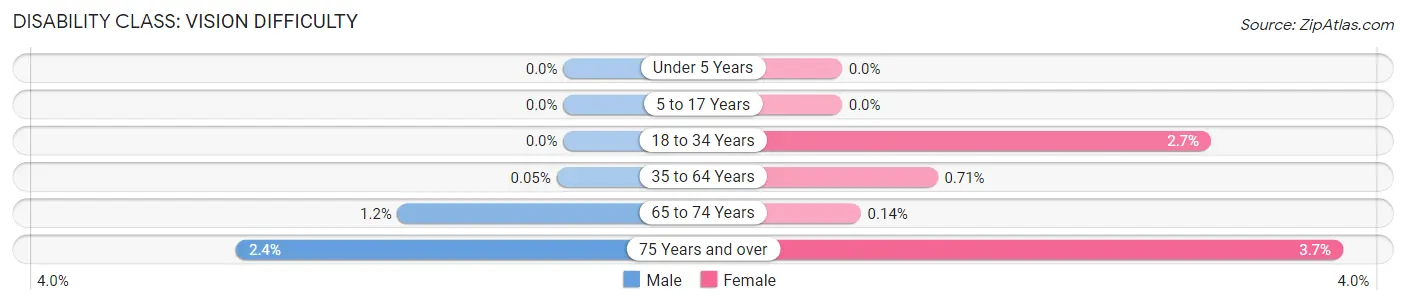
| Age Bracket | Male | Female |
| Under 5 Years | 0 (0.0%) | 0 (0.0%) |
| 5 to 17 Years | 0 (0.0%) | 0 (0.0%) |
| 18 to 34 Years | 0 (0.0%) | 20 (2.7%) |
| 35 to 64 Years | 1 (0.1%) | 16 (0.7%) |
| 65 to 74 Years | 7 (1.2%) | 1 (0.1%) |
| 75 Years and over | 10 (2.4%) | 20 (3.7%) |
Disability Class: Cognitive Difficulty
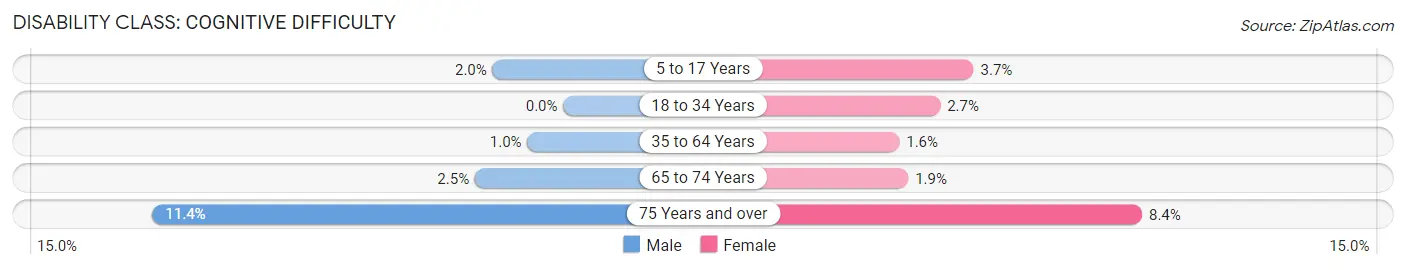
| Age Bracket | Male | Female |
| 5 to 17 Years | 20 (2.0%) | 31 (3.7%) |
| 18 to 34 Years | 0 (0.0%) | 20 (2.7%) |
| 35 to 64 Years | 21 (1.0%) | 36 (1.6%) |
| 65 to 74 Years | 14 (2.5%) | 13 (1.8%) |
| 75 Years and over | 47 (11.4%) | 45 (8.4%) |
Disability Class: Ambulatory Difficulty
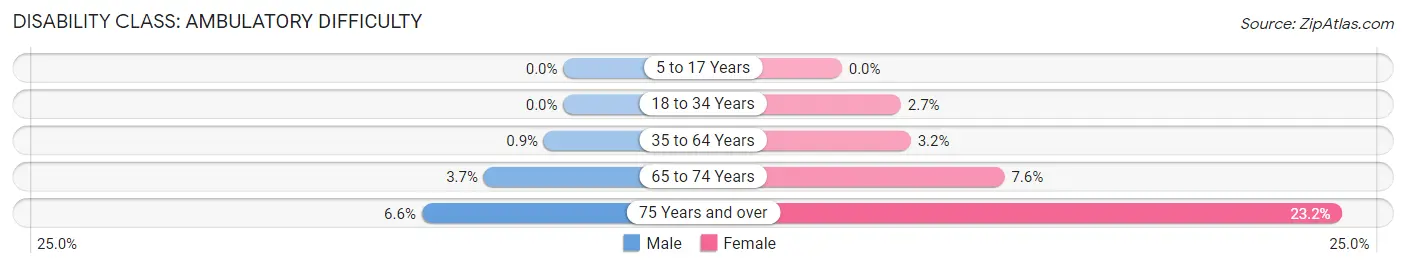
| Age Bracket | Male | Female |
| 5 to 17 Years | 0 (0.0%) | 0 (0.0%) |
| 18 to 34 Years | 0 (0.0%) | 20 (2.7%) |
| 35 to 64 Years | 19 (0.9%) | 72 (3.2%) |
| 65 to 74 Years | 21 (3.7%) | 53 (7.5%) |
| 75 Years and over | 27 (6.6%) | 125 (23.2%) |
Disability Class: Self-Care Difficulty
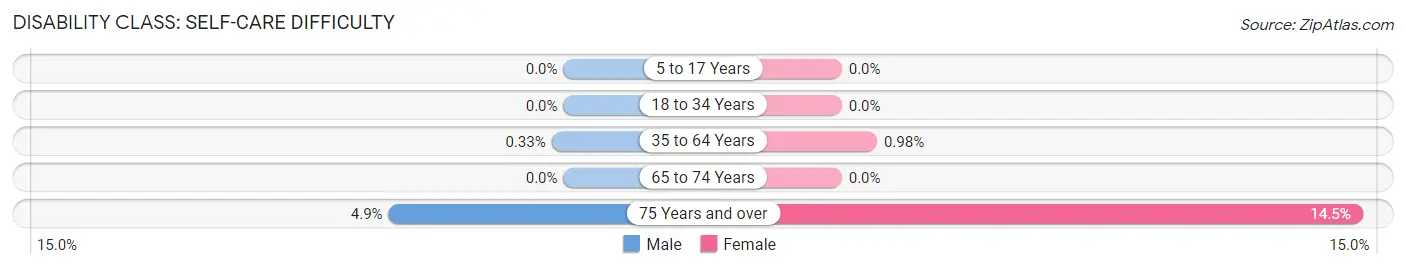
| Age Bracket | Male | Female |
| 5 to 17 Years | 0 (0.0%) | 0 (0.0%) |
| 18 to 34 Years | 0 (0.0%) | 0 (0.0%) |
| 35 to 64 Years | 7 (0.3%) | 22 (1.0%) |
| 65 to 74 Years | 0 (0.0%) | 0 (0.0%) |
| 75 Years and over | 20 (4.9%) | 78 (14.5%) |
Technology Access in Beverly Hills
Computing Device Access in Beverly Hills
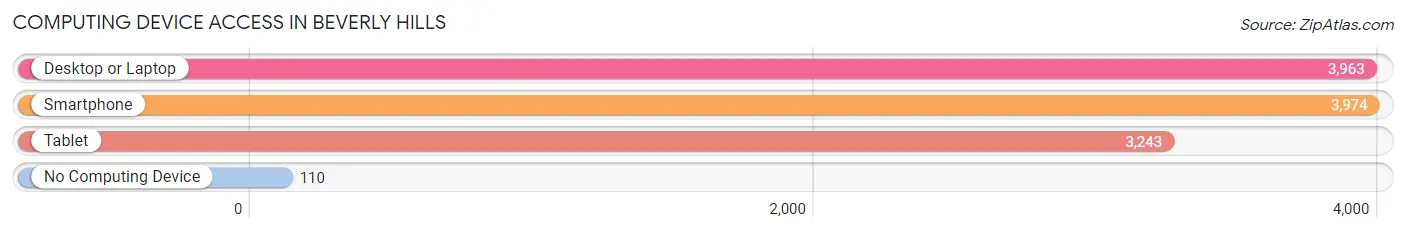
| Device Type | # Households | % Households |
| Desktop or Laptop | 3,963 | 94.7% |
| Smartphone | 3,974 | 95.0% |
| Tablet | 3,243 | 77.5% |
| No Computing Device | 110 | 2.6% |
| Total | 4,183 | 100.0% |
Internet Access in Beverly Hills
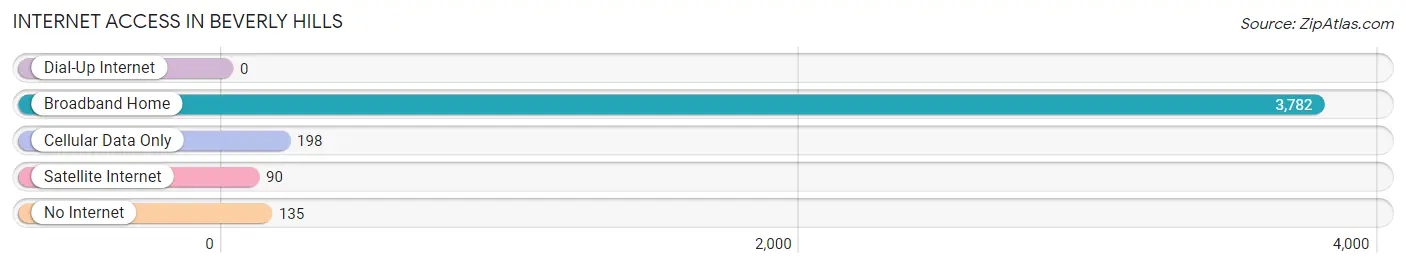
| Internet Type | # Households | % Households |
| Dial-Up Internet | 0 | 0.0% |
| Broadband Home | 3,782 | 90.4% |
| Cellular Data Only | 198 | 4.7% |
| Satellite Internet | 90 | 2.1% |
| No Internet | 135 | 3.2% |
| Total | 4,183 | 100.0% |
Beverly Hills Summary
Beverly Hills is a small city located in Oakland County, Michigan. It is a suburb of Detroit and is part of the Detroit metropolitan area. The city is located in the northwest corner of the county, just south of the city of Birmingham. As of the 2010 census, the city had a population of 10,267.
History
The area that is now Beverly Hills was first settled in the early 1800s by farmers from New York and New England. The area was known as "Beverly" after the town of Beverly, Massachusetts. In 1836, the area was incorporated as the village of Beverly. In 1867, the village was renamed to Beverly Hills.
In the late 1800s, the area began to develop as a summer resort destination for wealthy Detroiters. The area was known for its large estates and luxurious homes. In the early 1900s, the area began to develop into a residential community.
Geography
Beverly Hills is located in Oakland County, Michigan. It is situated in the northwest corner of the county, just south of the city of Birmingham. The city is bordered by the cities of Birmingham and Bloomfield Hills to the north, Southfield to the east, and Troy to the south. The city has a total area of 4.2 square miles, all of which is land.
Economy
Beverly Hills is a primarily residential community. The city has a small commercial district along Woodward Avenue, which includes a variety of restaurants, shops, and services. The city is also home to several corporate offices, including those of the automotive supplier Lear Corporation and the medical device manufacturer Stryker Corporation.
Demographics
As of the 2010 census, there were 10,267 people, 4,541 households, and 2,845 families residing in the city. The population density was 2,444.3 people per square mile. The racial makeup of the city was 87.2% White, 5.3% African American, 0.2% Native American, 4.3% Asian, 0.1% Pacific Islander, 1.2% from other races, and 1.7% from two or more races. Hispanic or Latino of any race were 3.2% of the population.
The median income for a household in the city was $90,945, and the median income for a family was $106,945. Males had a median income of $76,945 versus $50,945 for females. The per capita income for the city was $45,945. About 2.2% of families and 3.3% of the population were below the poverty line, including 3.7% of those under age 18 and 3.2% of those age 65 or over.
Common Questions
What is Per Capita Income in Beverly Hills?
Per Capita income in Beverly Hills is $77,323.
What is the Median Family Income in Beverly Hills?
Median Family Income in Beverly Hills is $195,350.
What is the Median Household income in Beverly Hills?
Median Household Income in Beverly Hills is $162,364.
What is Income or Wage Gap in Beverly Hills?
Income or Wage Gap in Beverly Hills is 42.5%.
Women in Beverly Hills earn 57.5 cents for every dollar earned by a man.
What is Inequality or Gini Index in Beverly Hills?
Inequality or Gini Index in Beverly Hills is 0.39.
What is the Total Population of Beverly Hills?
Total Population of Beverly Hills is 10,550.
What is the Total Male Population of Beverly Hills?
Total Male Population of Beverly Hills is 5,175.
What is the Total Female Population of Beverly Hills?
Total Female Population of Beverly Hills is 5,375.
What is the Ratio of Males per 100 Females in Beverly Hills?
There are 96.28 Males per 100 Females in Beverly Hills.
What is the Ratio of Females per 100 Males in Beverly Hills?
There are 103.86 Females per 100 Males in Beverly Hills.
What is the Median Population Age in Beverly Hills?
Median Population Age in Beverly Hills is 47.1 Years.
What is the Average Family Size in Beverly Hills
Average Family Size in Beverly Hills is 3.0 People.
What is the Average Household Size in Beverly Hills
Average Household Size in Beverly Hills is 2.5 People.
How Large is the Labor Force in Beverly Hills?
There are 5,472 People in the Labor Forcein in Beverly Hills.
What is the Percentage of People in the Labor Force in Beverly Hills?
65.7% of People are in the Labor Force in Beverly Hills.
What is the Unemployment Rate in Beverly Hills?
Unemployment Rate in Beverly Hills is 1.9%.