Zip Codes with the Highest Percentage of Population Employed in Health Diagnosing & Treating in Washington, MI
RELATED REPORTS & OPTIONS
Health Diagnosing & Treating
Washington
Compare Zip Codes
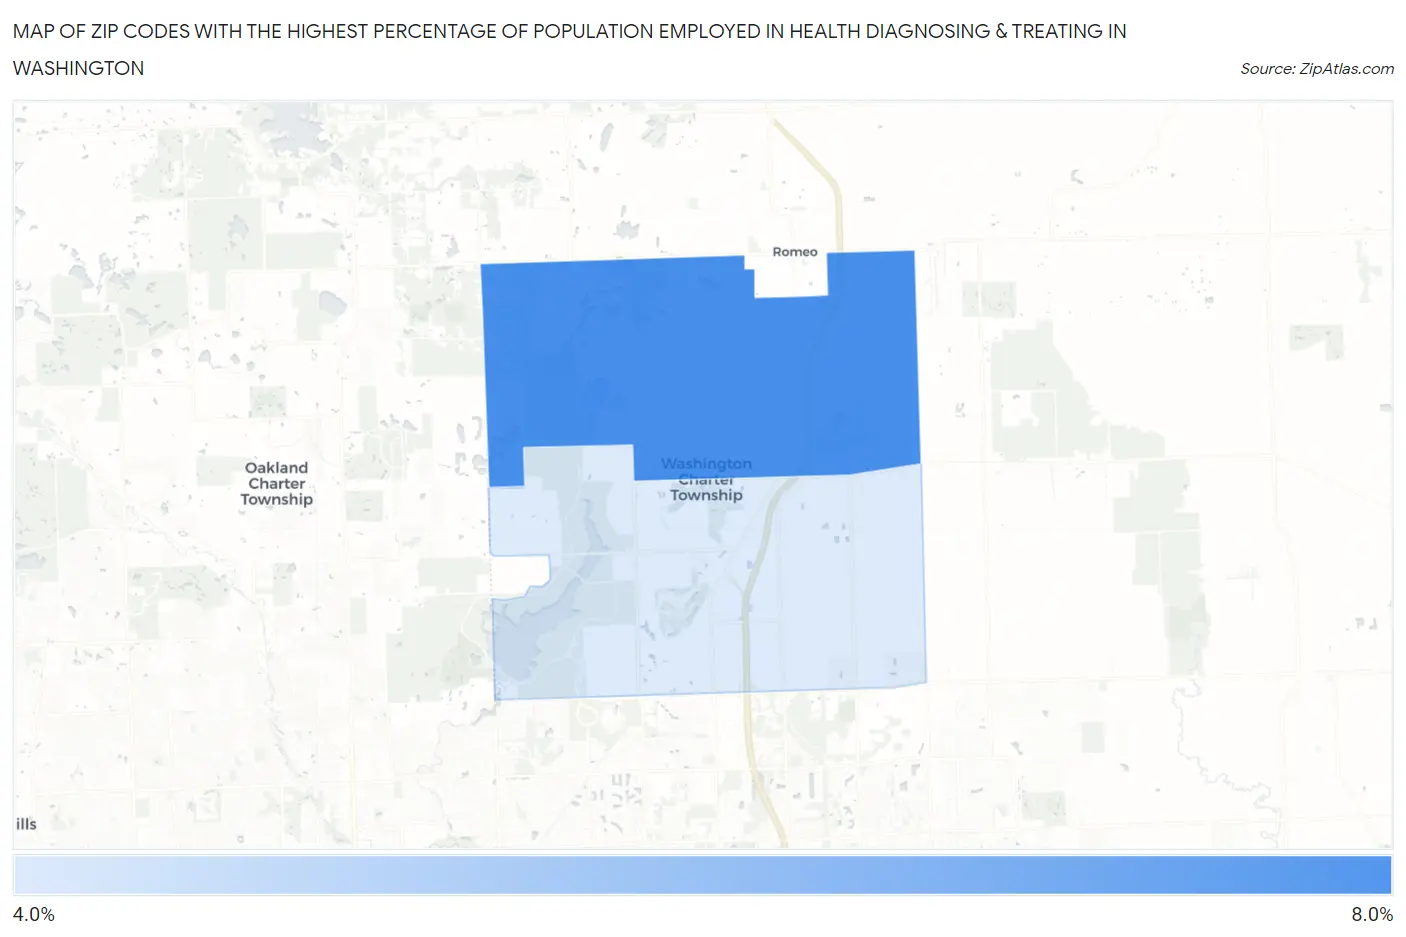
Map of Zip Codes with the Highest Percentage of Population Employed in Health Diagnosing & Treating in Washington
4.7%
8.0%
Zip Codes with the Highest Percentage of Population Employed in Health Diagnosing & Treating in Washington, MI
| Zip Code | % Employed | vs State | vs National | |
| 1. | 48095 | 8.0% | 6.6%(+1.33)#214 | 6.2%(+1.73)#7,563 |
| 2. | 48094 | 4.7% | 6.6%(-1.97)#640 | 6.2%(-1.57)#18,956 |
1
Common Questions
What are the Top Zip Codes with the Highest Percentage of Population Employed in Health Diagnosing & Treating in Washington, MI?
Top Zip Codes with the Highest Percentage of Population Employed in Health Diagnosing & Treating in Washington, MI are:
What zip code has the Highest Percentage of Population Employed in Health Diagnosing & Treating in Washington, MI?
48095 has the Highest Percentage of Population Employed in Health Diagnosing & Treating in Washington, MI with 8.0%.
What is the Percentage of Population Employed in Health Diagnosing & Treating in Michigan?
Percentage of Population Employed in Health Diagnosing & Treating in Michigan is 6.6%.
What is the Percentage of Population Employed in Health Diagnosing & Treating in the United States?
Percentage of Population Employed in Health Diagnosing & Treating in the United States is 6.2%.