Zip Codes with the Highest Percentage of Population Employed in Health Diagnosing & Treating in Howell, MI
RELATED REPORTS & OPTIONS
Health Diagnosing & Treating
Howell
Compare Zip Codes
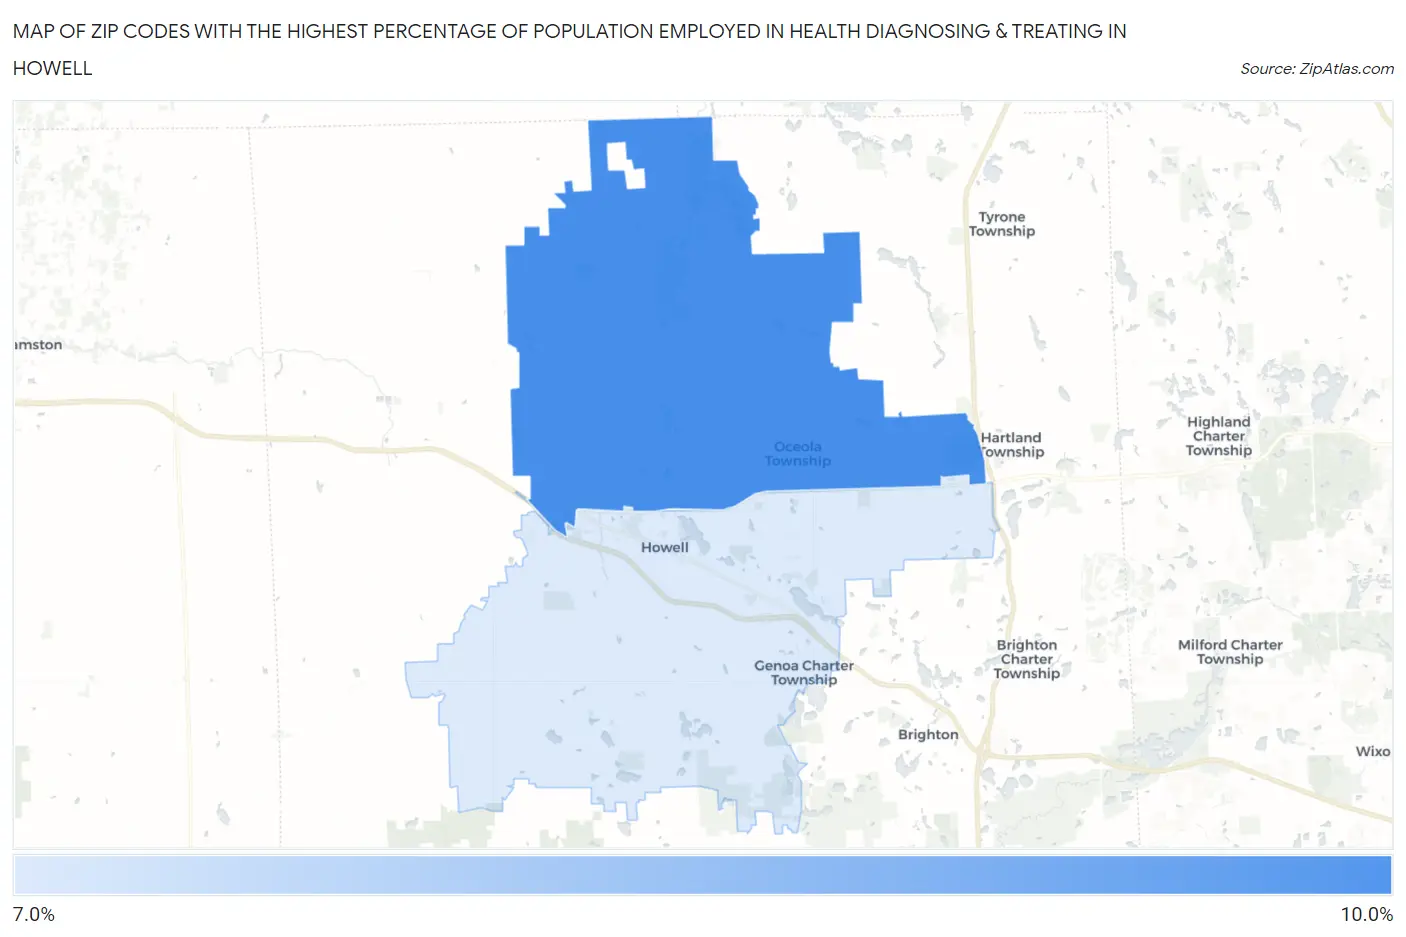
Map of Zip Codes with the Highest Percentage of Population Employed in Health Diagnosing & Treating in Howell
7.6%
8.2%
Zip Codes with the Highest Percentage of Population Employed in Health Diagnosing & Treating in Howell, MI
| Zip Code | % Employed | vs State | vs National | |
| 1. | 48855 | 8.2% | 6.6%(+1.60)#191 | 6.2%(+2.00)#6,896 |
| 2. | 48843 | 7.6% | 6.6%(+0.986)#248 | 6.2%(+1.39)#8,424 |
1
Common Questions
What are the Top Zip Codes with the Highest Percentage of Population Employed in Health Diagnosing & Treating in Howell, MI?
Top Zip Codes with the Highest Percentage of Population Employed in Health Diagnosing & Treating in Howell, MI are:
What zip code has the Highest Percentage of Population Employed in Health Diagnosing & Treating in Howell, MI?
48855 has the Highest Percentage of Population Employed in Health Diagnosing & Treating in Howell, MI with 8.2%.
What is the Percentage of Population Employed in Health Diagnosing & Treating in Howell, MI?
Percentage of Population Employed in Health Diagnosing & Treating in Howell is 7.9%.
What is the Percentage of Population Employed in Health Diagnosing & Treating in Michigan?
Percentage of Population Employed in Health Diagnosing & Treating in Michigan is 6.6%.
What is the Percentage of Population Employed in Health Diagnosing & Treating in the United States?
Percentage of Population Employed in Health Diagnosing & Treating in the United States is 6.2%.