Haring, MI Map & Demographics
Haring Map
Haring Overview
$21,799
PER CAPITA INCOME
$63,833
AVG FAMILY INCOME
$72,548
AVG HOUSEHOLD INCOME
0.23
INEQUALITY / GINI INDEX
325
TOTAL POPULATION
132
MALE POPULATION
193
FEMALE POPULATION
68.39
MALES / 100 FEMALES
146.21
FEMALES / 100 MALES
39.2
MEDIAN AGE
4.4
AVG FAMILY SIZE
4.0
AVG HOUSEHOLD SIZE
156
LABOR FORCE [ PEOPLE ]
59.5%
PERCENT IN LABOR FORCE
Income in Haring
Income Overview in Haring
Per Capita Income in Haring is $21,799, while median incomes of families and households are $63,833 and $72,548 respectively.
| Characteristic | Number | Measure |
| Per Capita Income | 325 | $21,799 |
| Median Family Income | 66 | $63,833 |
| Mean Family Income | 66 | $63,385 |
| Median Household Income | 81 | $72,548 |
| Mean Household Income | 81 | $81,819 |
| Income Deficit | 66 | $0 |
| Wage / Income Gap (%) | 325 | 0.00% |
| Wage / Income Gap ($) | 325 | 100.00¢ per $1 |
| Gini / Inequality Index | 325 | 0.23 |
Earnings by Sex in Haring
| Sex | Number | Average Earnings |
| Male | 88 (50.3%) | $0 |
| Female | 87 (49.7%) | $0 |
| Total | 175 (100.0%) | $0 |
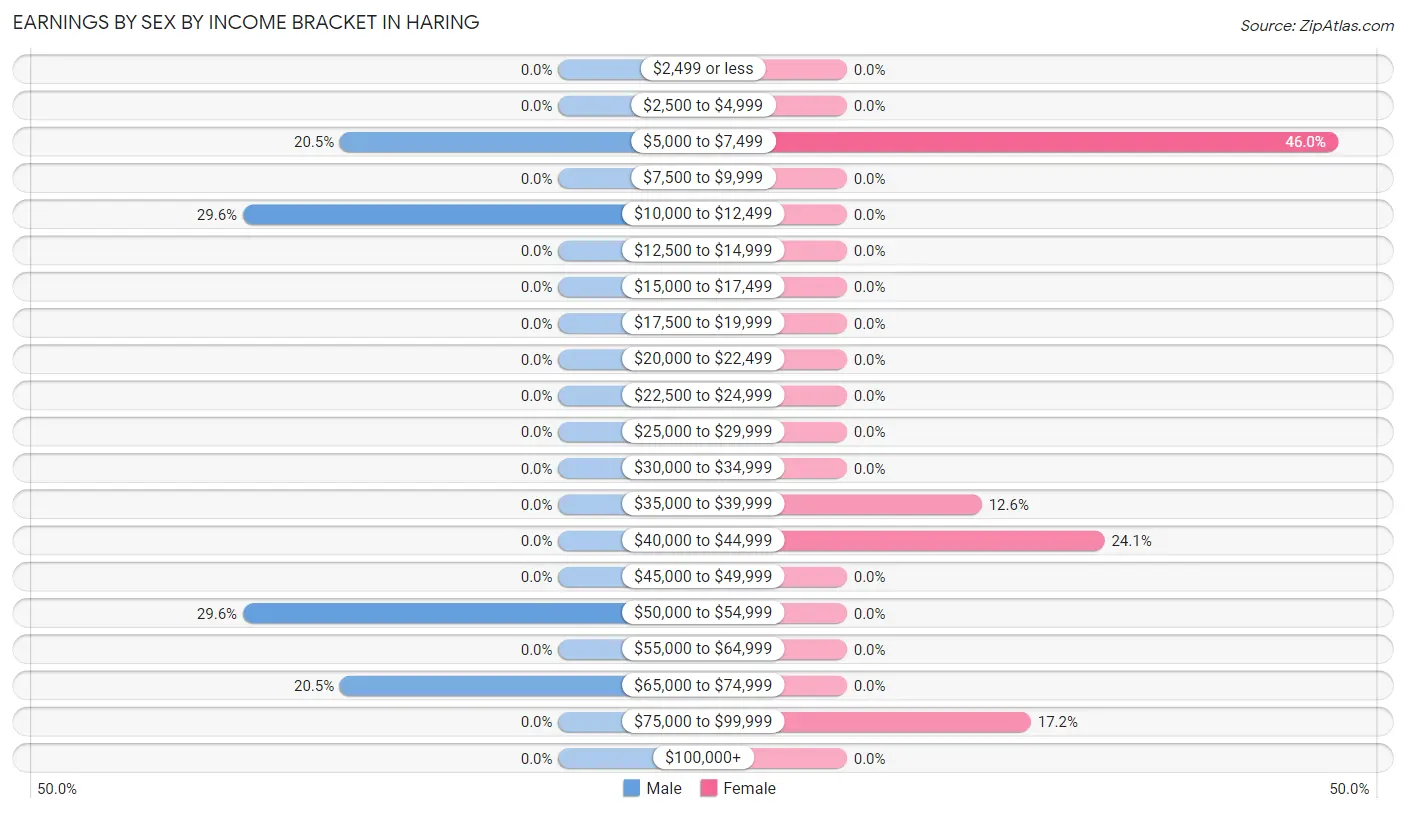
Earnings by Sex by Income Bracket in Haring
The most common earnings brackets in Haring are $10,000 to $12,499 for men (26 | 29.5%) and $5,000 to $7,499 for women (40 | 46.0%).
| Income | Male | Female |
| $2,499 or less | 0 (0.0%) | 0 (0.0%) |
| $2,500 to $4,999 | 0 (0.0%) | 0 (0.0%) |
| $5,000 to $7,499 | 18 (20.4%) | 40 (46.0%) |
| $7,500 to $9,999 | 0 (0.0%) | 0 (0.0%) |
| $10,000 to $12,499 | 26 (29.5%) | 0 (0.0%) |
| $12,500 to $14,999 | 0 (0.0%) | 0 (0.0%) |
| $15,000 to $17,499 | 0 (0.0%) | 0 (0.0%) |
| $17,500 to $19,999 | 0 (0.0%) | 0 (0.0%) |
| $20,000 to $22,499 | 0 (0.0%) | 0 (0.0%) |
| $22,500 to $24,999 | 0 (0.0%) | 0 (0.0%) |
| $25,000 to $29,999 | 0 (0.0%) | 0 (0.0%) |
| $30,000 to $34,999 | 0 (0.0%) | 0 (0.0%) |
| $35,000 to $39,999 | 0 (0.0%) | 11 (12.6%) |
| $40,000 to $44,999 | 0 (0.0%) | 21 (24.1%) |
| $45,000 to $49,999 | 0 (0.0%) | 0 (0.0%) |
| $50,000 to $54,999 | 26 (29.5%) | 0 (0.0%) |
| $55,000 to $64,999 | 0 (0.0%) | 0 (0.0%) |
| $65,000 to $74,999 | 18 (20.4%) | 0 (0.0%) |
| $75,000 to $99,999 | 0 (0.0%) | 15 (17.2%) |
| $100,000+ | 0 (0.0%) | 0 (0.0%) |
| Total | 88 (100.0%) | 87 (100.0%) |
Earnings by Sex by Educational Attainment in Haring
| Educational Attainment | Male Income | Female Income |
| Less than High School | - | - |
| High School Diploma | - | - |
| College or Associate's Degree | - | - |
| Bachelor's Degree | - | - |
| Graduate Degree | - | - |
| Total | - | - |
Family Income in Haring
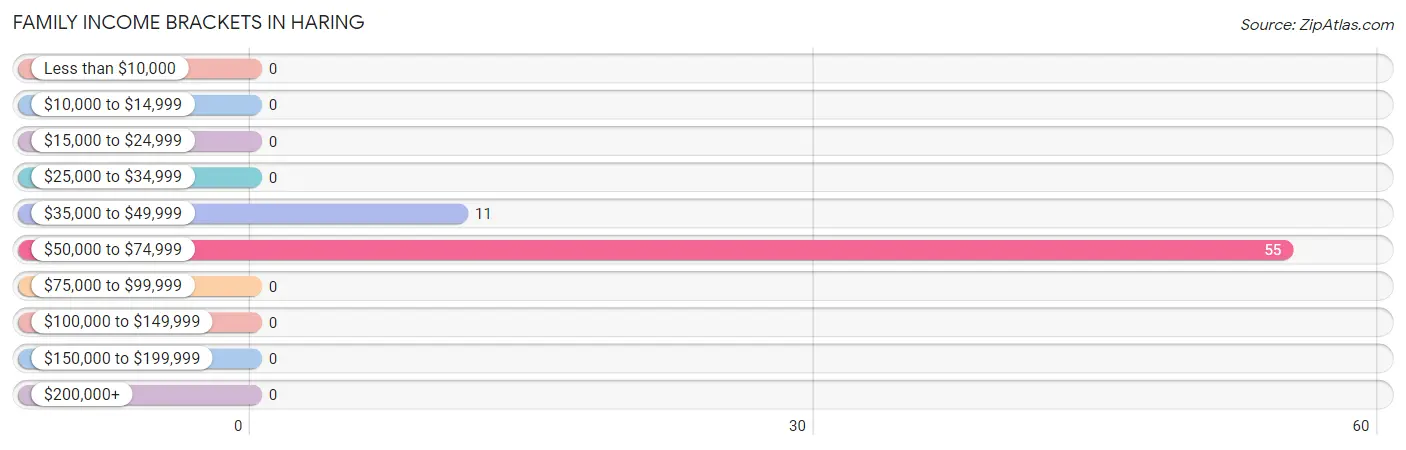
Family Income Brackets in Haring
According to the Haring family income data, there are 55 families falling into the $50,000 to $74,999 income range, which is the most common income bracket and makes up 83.3% of all families.
| Income Bracket | # Families | % Families |
| Less than $10,000 | 0 | 0.0% |
| $10,000 to $14,999 | 0 | 0.0% |
| $15,000 to $24,999 | 0 | 0.0% |
| $25,000 to $34,999 | 0 | 0.0% |
| $35,000 to $49,999 | 11 | 16.7% |
| $50,000 to $74,999 | 55 | 83.3% |
| $75,000 to $99,999 | 0 | 0.0% |
| $100,000 to $149,999 | 0 | 0.0% |
| $150,000 to $199,999 | 0 | 0.0% |
| $200,000+ | 0 | 0.0% |
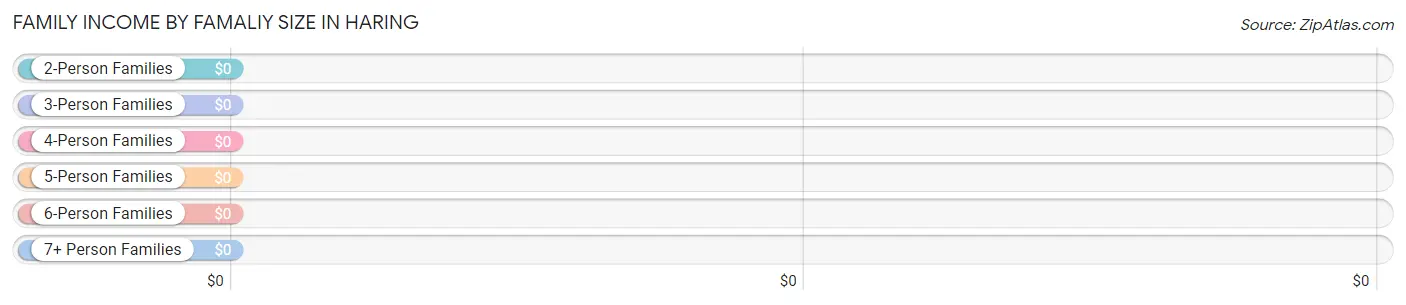
Family Income by Famaliy Size in Haring
| Income Bracket | # Families | Median Income |
| 2-Person Families | 11 (16.7%) | $0 |
| 3-Person Families | 14 (21.2%) | $0 |
| 4-Person Families | 26 (39.4%) | $0 |
| 5-Person Families | 0 (0.0%) | $0 |
| 6-Person Families | 0 (0.0%) | $0 |
| 7+ Person Families | 15 (22.7%) | $0 |
| Total | 66 (100.0%) | $63,833 |
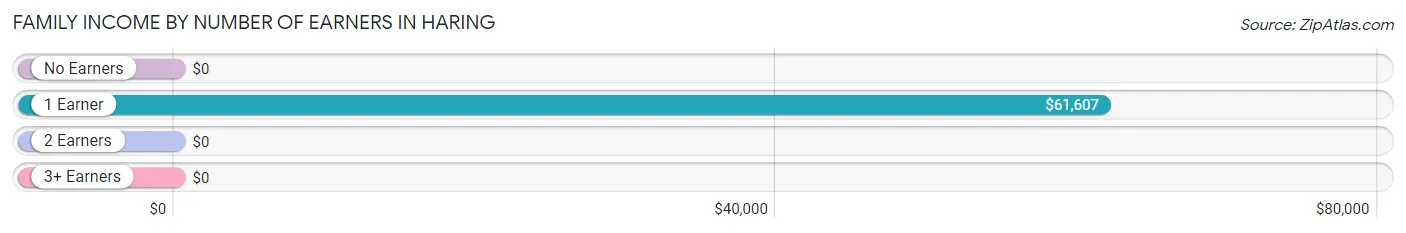
Family Income by Number of Earners in Haring
| Number of Earners | # Families | Median Income |
| No Earners | 0 (0.0%) | $0 |
| 1 Earner | 40 (60.6%) | $61,607 |
| 2 Earners | 0 (0.0%) | $0 |
| 3+ Earners | 26 (39.4%) | $0 |
| Total | 66 (100.0%) | $63,833 |
Household Income in Haring
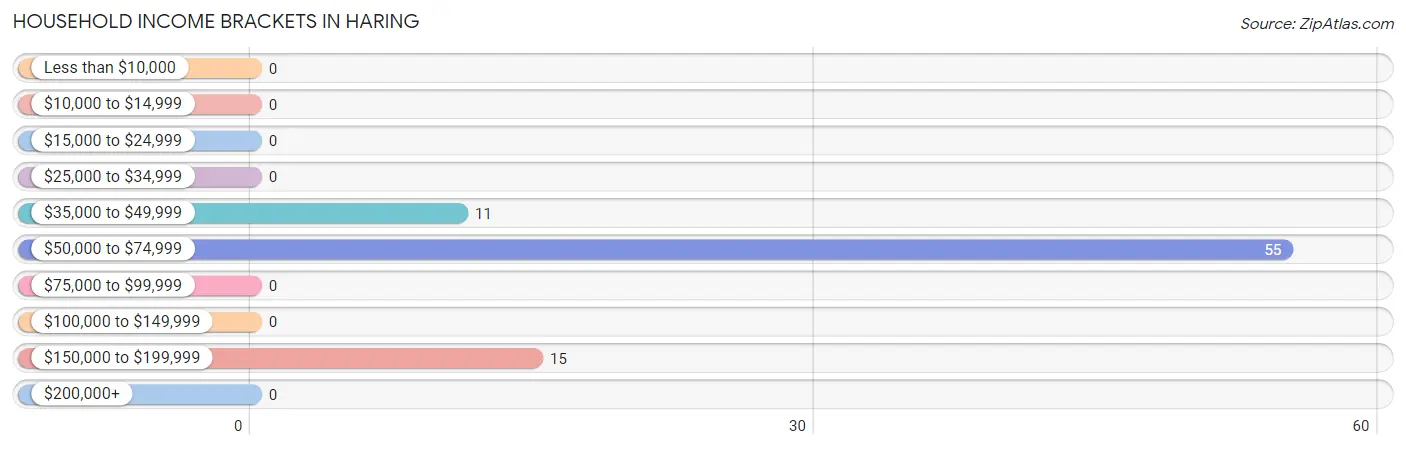
Household Income Brackets in Haring
With 55 households falling in the category, the $50,000 to $74,999 income range is the most frequent in Haring, accounting for 67.9% of all households.
| Income Bracket | # Households | % Households |
| Less than $10,000 | 0 | 0.0% |
| $10,000 to $14,999 | 0 | 0.0% |
| $15,000 to $24,999 | 0 | 0.0% |
| $25,000 to $34,999 | 0 | 0.0% |
| $35,000 to $49,999 | 11 | 13.6% |
| $50,000 to $74,999 | 55 | 67.9% |
| $75,000 to $99,999 | 0 | 0.0% |
| $100,000 to $149,999 | 0 | 0.0% |
| $150,000 to $199,999 | 15 | 18.5% |
| $200,000+ | 0 | 0.0% |
Household Income by Householder Age in Haring
The median household income in Haring is $72,548, with the highest median household income of $73,750 found in the 45 to 64 years age bracket for the primary householder. A total of 56 households (69.1%) fall into this category.
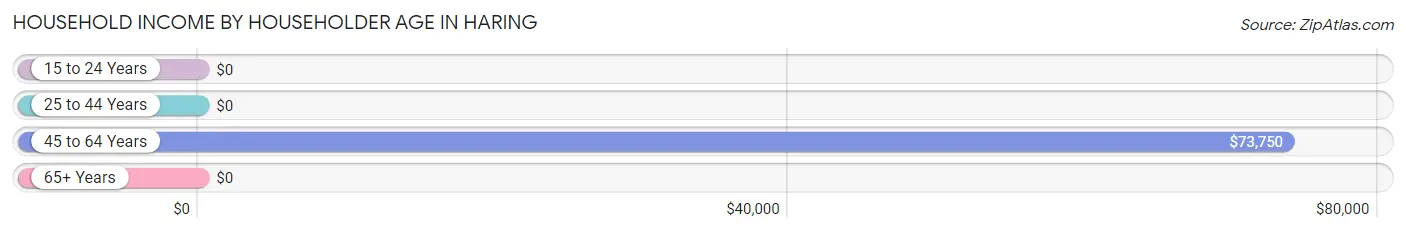
| Income Bracket | # Households | Median Income |
| 15 to 24 Years | 0 (0.0%) | $0 |
| 25 to 44 Years | 11 (13.6%) | $0 |
| 45 to 64 Years | 56 (69.1%) | $73,750 |
| 65+ Years | 14 (17.3%) | $0 |
| Total | 81 (100.0%) | $72,548 |
Poverty in Haring
Income Below Poverty by Sex and Age in Haring
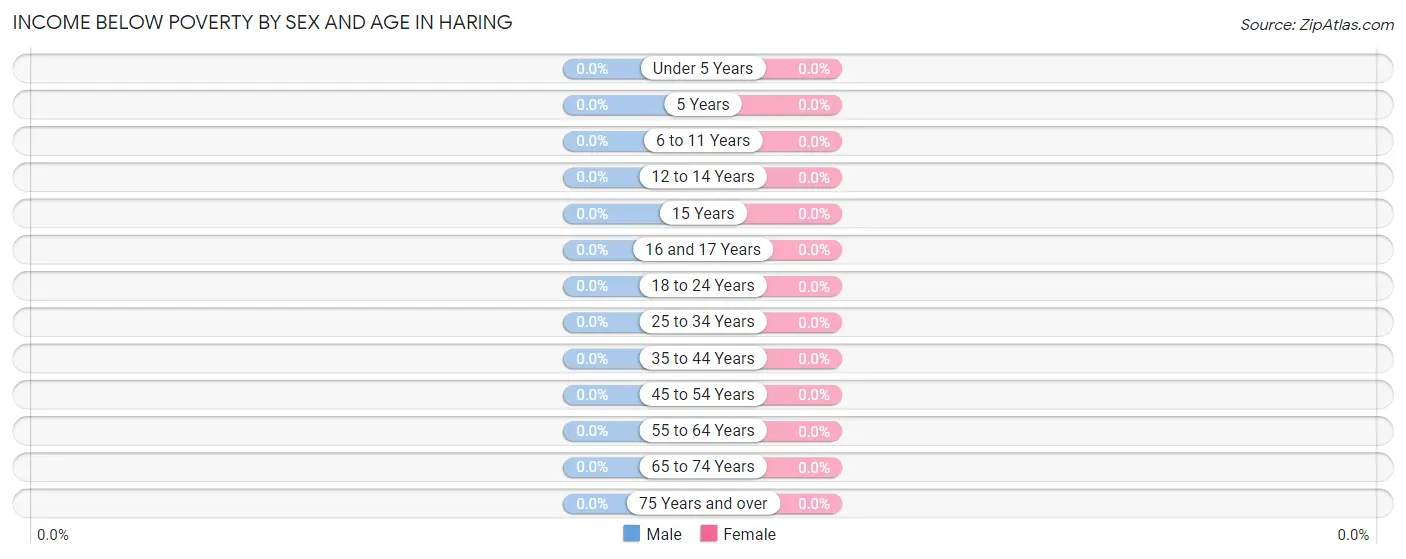
| Age Bracket | Male | Female |
| Under 5 Years | 0 (0.0%) | 0 (0.0%) |
| 5 Years | 0 (0.0%) | 0 (0.0%) |
| 6 to 11 Years | 0 (0.0%) | 0 (0.0%) |
| 12 to 14 Years | 0 (0.0%) | 0 (0.0%) |
| 15 Years | 0 (0.0%) | 0 (0.0%) |
| 16 and 17 Years | 0 (0.0%) | 0 (0.0%) |
| 18 to 24 Years | 0 (0.0%) | 0 (0.0%) |
| 25 to 34 Years | 0 (0.0%) | 0 (0.0%) |
| 35 to 44 Years | 0 (0.0%) | 0 (0.0%) |
| 45 to 54 Years | 0 (0.0%) | 0 (0.0%) |
| 55 to 64 Years | 0 (0.0%) | 0 (0.0%) |
| 65 to 74 Years | 0 (0.0%) | 0 (0.0%) |
| 75 Years and over | 0 (0.0%) | 0 (0.0%) |
| Total | 0 (0.0%) | 0 (0.0%) |
Income Above Poverty by Sex and Age in Haring
According to the poverty statistics in Haring, males aged 6 to 11 years and females aged under 5 years are the age groups that are most secure financially, with 100.0% of males and 100.0% of females in these age groups living above the poverty line.
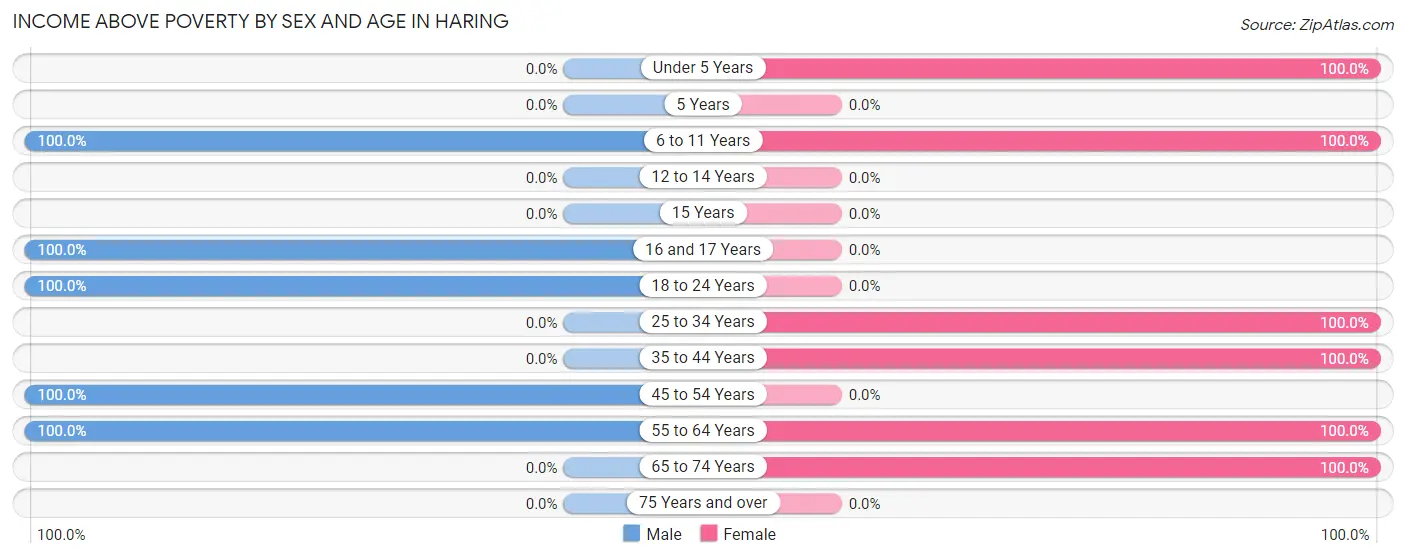
| Age Bracket | Male | Female |
| Under 5 Years | 0 (0.0%) | 14 (100.0%) |
| 5 Years | 0 (0.0%) | 0 (0.0%) |
| 6 to 11 Years | 10 (100.0%) | 39 (100.0%) |
| 12 to 14 Years | 0 (0.0%) | 0 (0.0%) |
| 15 Years | 0 (0.0%) | 0 (0.0%) |
| 16 and 17 Years | 19 (100.0%) | 0 (0.0%) |
| 18 to 24 Years | 44 (100.0%) | 0 (0.0%) |
| 25 to 34 Years | 0 (0.0%) | 22 (100.0%) |
| 35 to 44 Years | 0 (0.0%) | 72 (100.0%) |
| 45 to 54 Years | 44 (100.0%) | 0 (0.0%) |
| 55 to 64 Years | 15 (100.0%) | 32 (100.0%) |
| 65 to 74 Years | 0 (0.0%) | 14 (100.0%) |
| 75 Years and over | 0 (0.0%) | 0 (0.0%) |
| Total | 132 (100.0%) | 193 (100.0%) |
Income Below Poverty Among Married-Couple Families in Haring
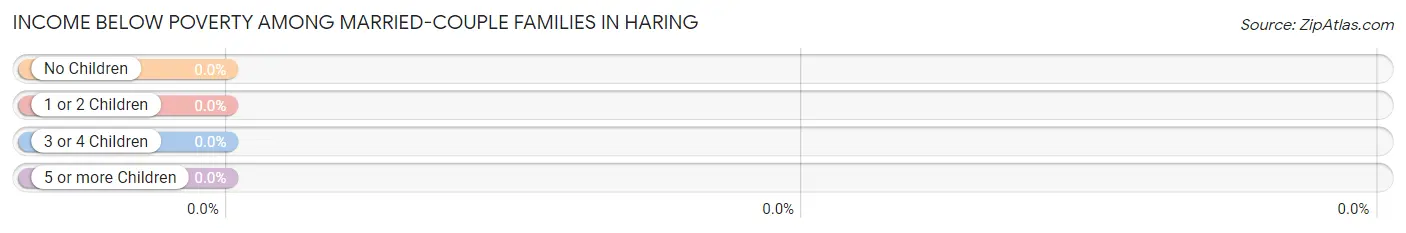
| Children | Above Poverty | Below Poverty |
| No Children | 26 (100.0%) | 0 (0.0%) |
| 1 or 2 Children | 0 (0.0%) | 0 (0.0%) |
| 3 or 4 Children | 15 (100.0%) | 0 (0.0%) |
| 5 or more Children | 0 (0.0%) | 0 (0.0%) |
| Total | 41 (100.0%) | 0 (0.0%) |
Income Below Poverty Among Single-Parent Households in Haring
| Children | Single Father | Single Mother |
| No Children | 0 (0.0%) | 0 (0.0%) |
| 1 or 2 Children | 0 (0.0%) | 0 (0.0%) |
| 3 or 4 Children | 0 (0.0%) | 0 (0.0%) |
| 5 or more Children | 0 (0.0%) | 0 (0.0%) |
| Total | 0 (0.0%) | 0 (0.0%) |
Income Below Poverty Among Married-Couple vs Single-Parent Households in Haring
| Children | Married-Couple Families | Single-Parent Households |
| No Children | 0 (0.0%) | 0 (0.0%) |
| 1 or 2 Children | 0 (0.0%) | 0 (0.0%) |
| 3 or 4 Children | 0 (0.0%) | 0 (0.0%) |
| 5 or more Children | 0 (0.0%) | 0 (0.0%) |
| Total | 0 (0.0%) | 0 (0.0%) |
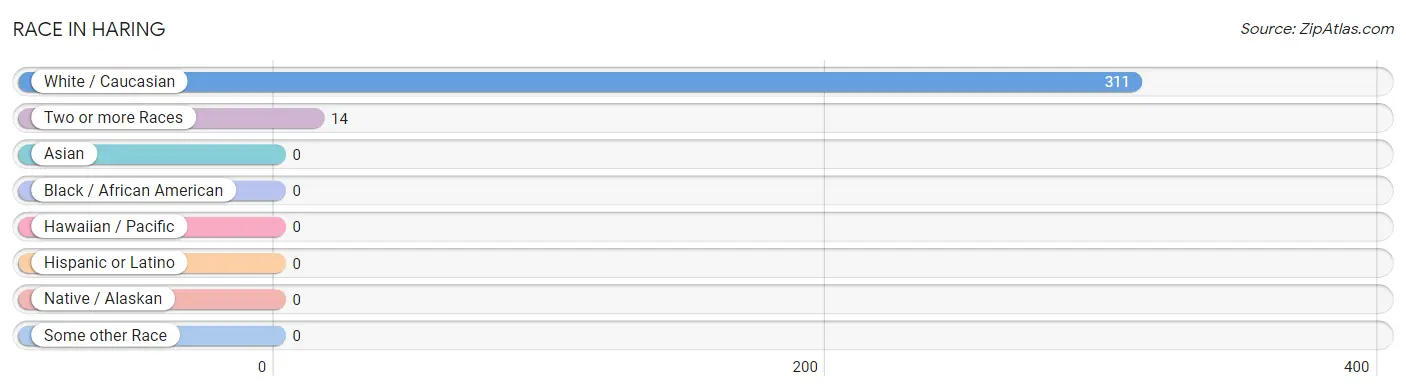
Race in Haring
The most populous races in Haring are White / Caucasian (311 | 95.7%), and Two or more Races (14 | 4.3%).
| Race | # Population | % Population |
| Asian | 0 | 0.0% |
| Black / African American | 0 | 0.0% |
| Hawaiian / Pacific | 0 | 0.0% |
| Hispanic or Latino | 0 | 0.0% |
| Native / Alaskan | 0 | 0.0% |
| White / Caucasian | 311 | 95.7% |
| Two or more Races | 14 | 4.3% |
| Some other Race | 0 | 0.0% |
| Total | 325 | 100.0% |
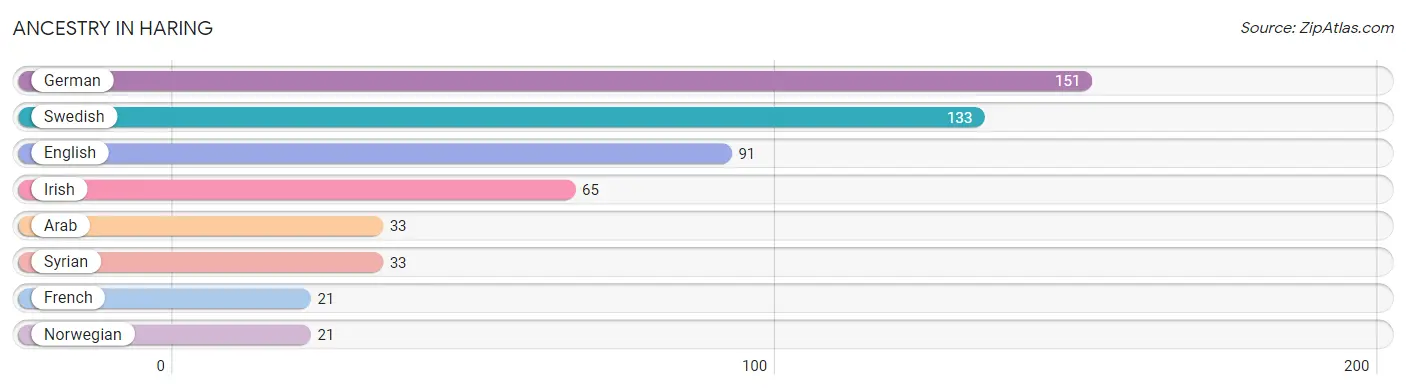
Ancestry in Haring
The most populous ancestries reported in Haring are German (151 | 46.5%), Swedish (133 | 40.9%), English (91 | 28.0%), Irish (65 | 20.0%), and Arab (33 | 10.2%), together accounting for 145.5% of all Haring residents.
| Ancestry | # Population | % Population |
| Arab | 33 | 10.2% |
| English | 91 | 28.0% |
| French | 21 | 6.5% |
| German | 151 | 46.5% |
| Irish | 65 | 20.0% |
| Norwegian | 21 | 6.5% |
| Swedish | 133 | 40.9% |
| Syrian | 33 | 10.2% | View All 8 Rows |
Immigrants in Haring

| Immigration Origin | # Population | % Population | View All 0 Rows |
Sex and Age in Haring
Sex and Age in Haring
The most populous age groups in Haring are 50 to 54 Years (44 | 33.3%) for men and 40 to 44 Years (40 | 20.7%) for women.
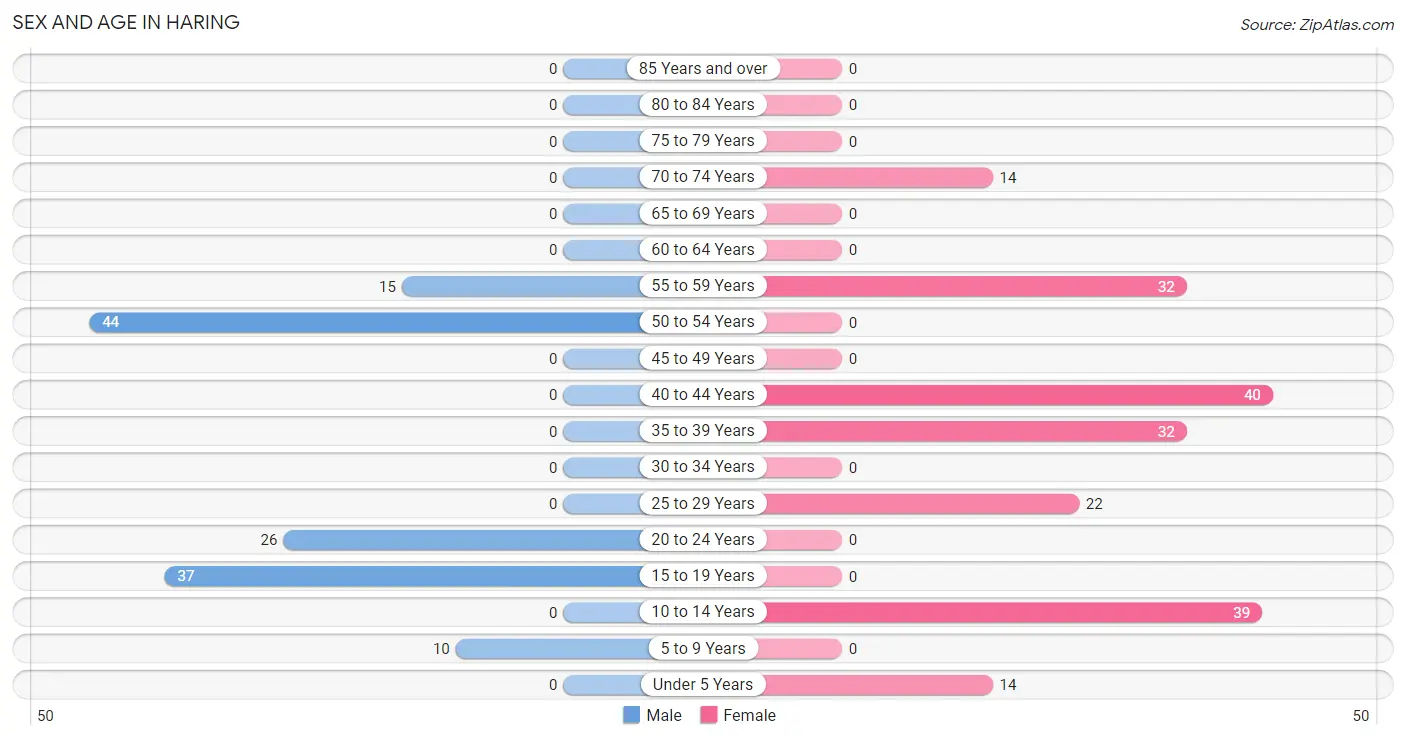
| Age Bracket | Male | Female |
| Under 5 Years | 0 (0.0%) | 14 (7.2%) |
| 5 to 9 Years | 10 (7.6%) | 0 (0.0%) |
| 10 to 14 Years | 0 (0.0%) | 39 (20.2%) |
| 15 to 19 Years | 37 (28.0%) | 0 (0.0%) |
| 20 to 24 Years | 26 (19.7%) | 0 (0.0%) |
| 25 to 29 Years | 0 (0.0%) | 22 (11.4%) |
| 30 to 34 Years | 0 (0.0%) | 0 (0.0%) |
| 35 to 39 Years | 0 (0.0%) | 32 (16.6%) |
| 40 to 44 Years | 0 (0.0%) | 40 (20.7%) |
| 45 to 49 Years | 0 (0.0%) | 0 (0.0%) |
| 50 to 54 Years | 44 (33.3%) | 0 (0.0%) |
| 55 to 59 Years | 15 (11.4%) | 32 (16.6%) |
| 60 to 64 Years | 0 (0.0%) | 0 (0.0%) |
| 65 to 69 Years | 0 (0.0%) | 0 (0.0%) |
| 70 to 74 Years | 0 (0.0%) | 14 (7.2%) |
| 75 to 79 Years | 0 (0.0%) | 0 (0.0%) |
| 80 to 84 Years | 0 (0.0%) | 0 (0.0%) |
| 85 Years and over | 0 (0.0%) | 0 (0.0%) |
| Total | 132 (100.0%) | 193 (100.0%) |
Families and Households in Haring
Median Family Size in Haring
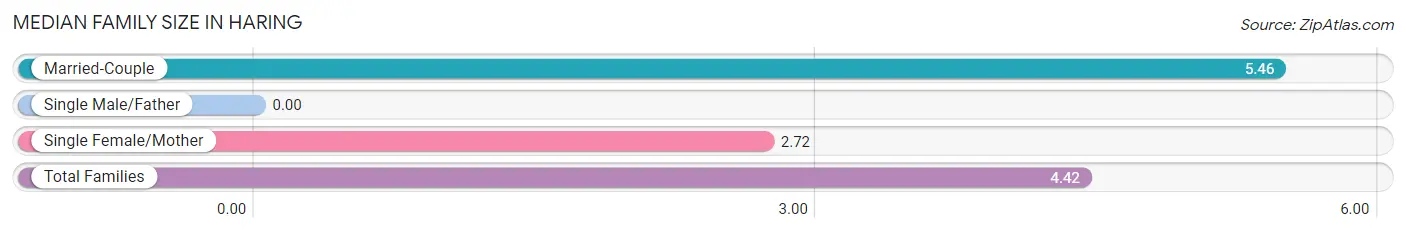
| Family Type | # Families | Family Size |
| Married-Couple | 41 (62.1%) | 5.46 |
| Single Male/Father | 0 (0.0%) | - |
| Single Female/Mother | 25 (37.9%) | 2.72 |
| Total Families | 66 (100.0%) | 4.42 |
Median Household Size in Haring
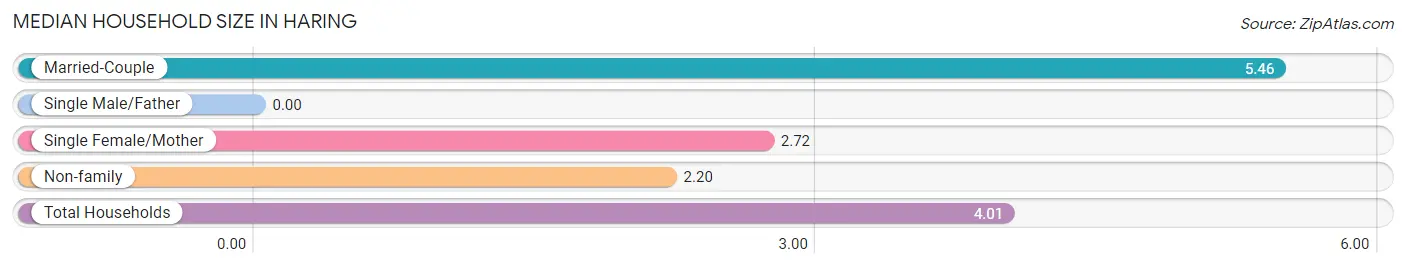
| Household Type | # Households | Household Size |
| Married-Couple | 41 (50.6%) | 5.46 |
| Single Male/Father | 0 (0.0%) | - |
| Single Female/Mother | 25 (30.9%) | 2.72 |
| Non-family | 15 (18.5%) | 2.20 |
| Total Households | 81 (100.0%) | 4.01 |
Household Size by Marriage Status in Haring
Out of a total of 81 households in Haring, 66 (81.5%) are family households, while 15 (18.5%) are nonfamily households. The most numerous type of family households are 4-person households, comprising 26, and the most common type of nonfamily households are 2-person households, comprising 15.
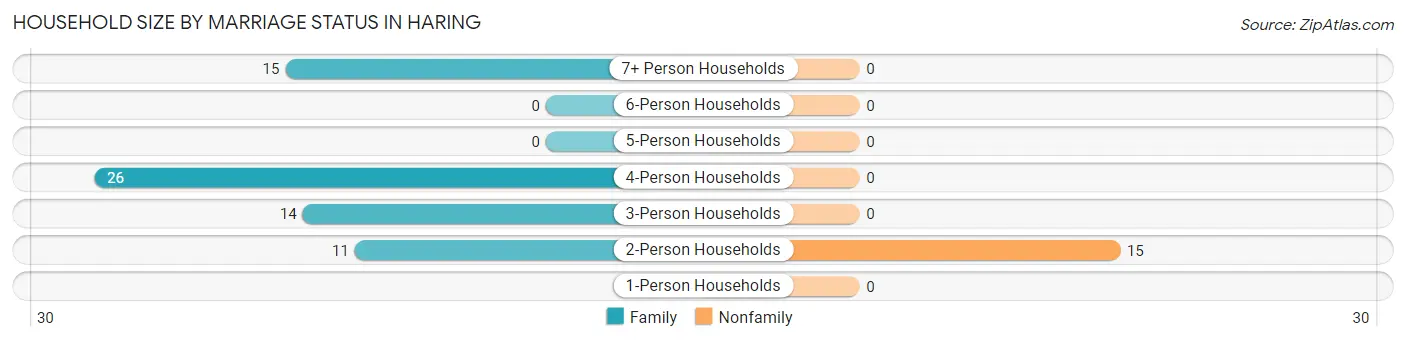
| Household Size | Family Households | Nonfamily Households |
| 1-Person Households | - | 0 (0.0%) |
| 2-Person Households | 11 (13.6%) | 15 (18.5%) |
| 3-Person Households | 14 (17.3%) | 0 (0.0%) |
| 4-Person Households | 26 (32.1%) | 0 (0.0%) |
| 5-Person Households | 0 (0.0%) | 0 (0.0%) |
| 6-Person Households | 0 (0.0%) | 0 (0.0%) |
| 7+ Person Households | 15 (18.5%) | 0 (0.0%) |
| Total | 66 (81.5%) | 15 (18.5%) |
Female Fertility in Haring
Fertility by Age in Haring
| Age Bracket | Women with Births | Births / 1,000 Women |
| 15 to 19 years | 0 (0.0%) | 0.0 |
| 20 to 34 years | 0 (0.0%) | 0.0 |
| 35 to 50 years | 0 (0.0%) | 0.0 |
| Total | 0 (0.0%) | 0.0 |
Fertility by Age by Marriage Status in Haring
| Age Bracket | Married | Unmarried |
| 15 to 19 years | 0 (0.0%) | 0 (0.0%) |
| 20 to 34 years | 0 (0.0%) | 0 (0.0%) |
| 35 to 50 years | 0 (0.0%) | 0 (0.0%) |
| Total | 0 (0.0%) | 0 (0.0%) |
Fertility by Education in Haring
| Educational Attainment | Women with Births | Births / 1,000 Women |
| Less than High School | 0 (0.0%) | 0.0 |
| High School Diploma | 0 (0.0%) | 0.0 |
| College or Associate's Degree | 0 (0.0%) | 0.0 |
| Bachelor's Degree | 0 (0.0%) | 0.0 |
| Graduate Degree | 0 (0.0%) | 0.0 |
| Total | 0 (0.0%) | 0.0 |
Fertility by Education by Marriage Status in Haring
| Educational Attainment | Married | Unmarried |
| Less than High School | 0 (0.0%) | 0 (0.0%) |
| High School Diploma | 0 (0.0%) | 0 (0.0%) |
| College or Associate's Degree | 0 (0.0%) | 0 (0.0%) |
| Bachelor's Degree | 0 (0.0%) | 0 (0.0%) |
| Graduate Degree | 0 (0.0%) | 0 (0.0%) |
| Total | 0 (0.0%) | 0 (0.0%) |
Employment Characteristics in Haring
Employment by Class of Employer in Haring
Among the 156 employed individuals in Haring, private company employees (135 | 86.5%), and self-employed (incorporated) (21 | 13.5%) make up the most common classes of employment.
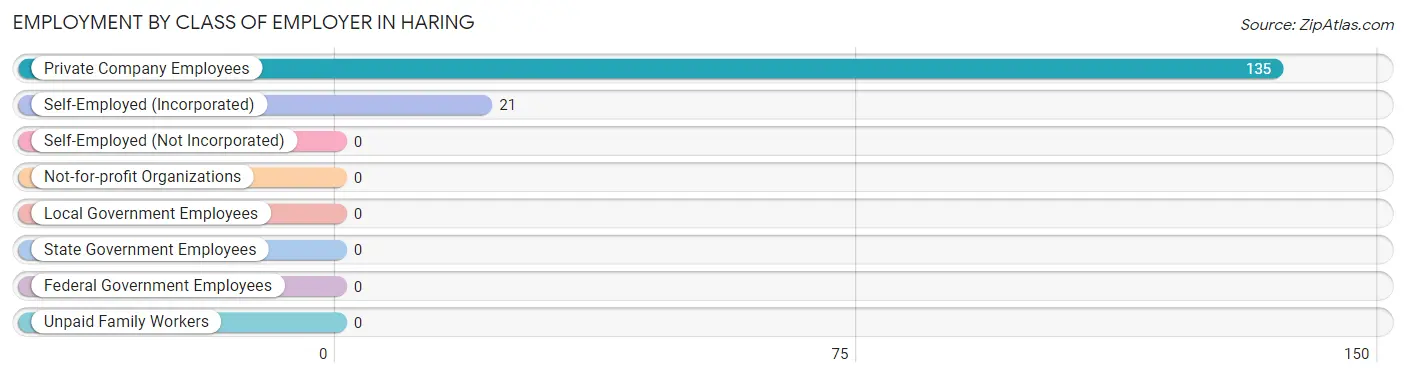
| Employer Class | # Employees | % Employees |
| Private Company Employees | 135 | 86.5% |
| Self-Employed (Incorporated) | 21 | 13.5% |
| Self-Employed (Not Incorporated) | 0 | 0.0% |
| Not-for-profit Organizations | 0 | 0.0% |
| Local Government Employees | 0 | 0.0% |
| State Government Employees | 0 | 0.0% |
| Federal Government Employees | 0 | 0.0% |
| Unpaid Family Workers | 0 | 0.0% |
| Total | 156 | 100.0% |
Employment Status by Age in Haring
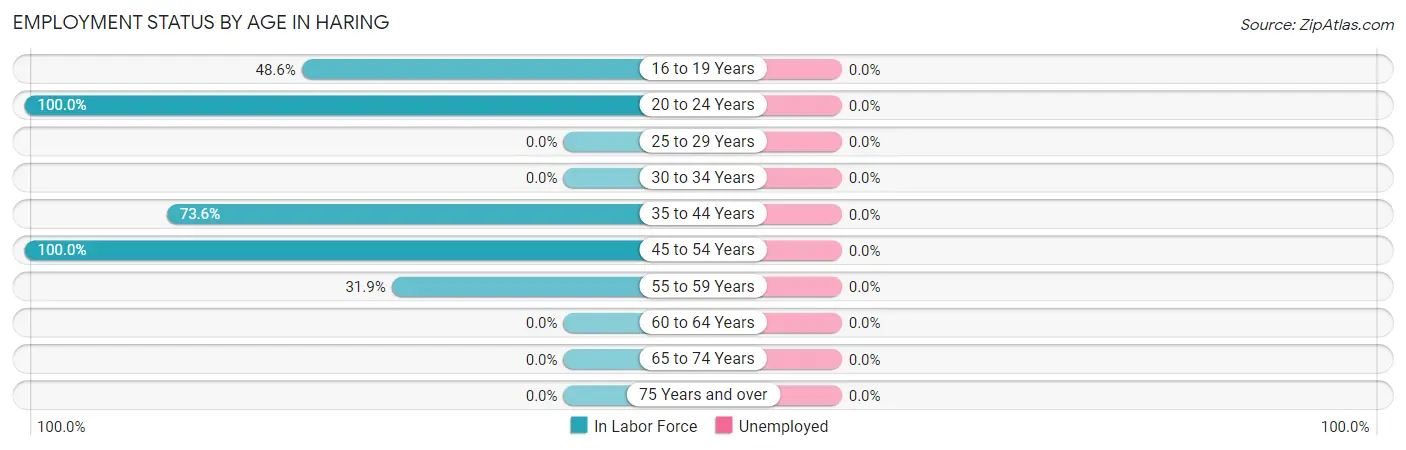
| Age Bracket | In Labor Force | Unemployed |
| 16 to 19 Years | 18 (48.6%) | 0 (0.0%) |
| 20 to 24 Years | 26 (100.0%) | 0 (0.0%) |
| 25 to 29 Years | 0 (0.0%) | 0 (0.0%) |
| 30 to 34 Years | 0 (0.0%) | 0 (0.0%) |
| 35 to 44 Years | 53 (73.6%) | 0 (0.0%) |
| 45 to 54 Years | 44 (100.0%) | 0 (0.0%) |
| 55 to 59 Years | 15 (31.9%) | 0 (0.0%) |
| 60 to 64 Years | 0 (0.0%) | 0 (0.0%) |
| 65 to 74 Years | 0 (0.0%) | 0 (0.0%) |
| 75 Years and over | 0 (0.0%) | 0 (0.0%) |
| Total | 156 (59.5%) | 0 (0.0%) |
Employment Status by Educational Attainment in Haring
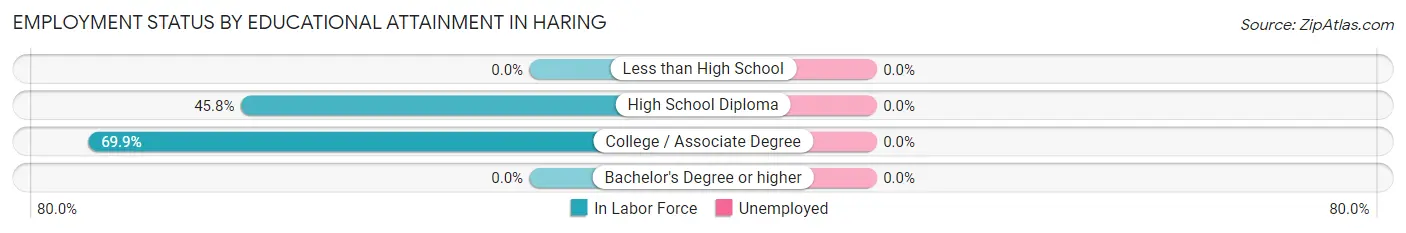
| Educational Attainment | In Labor Force | Unemployed |
| Less than High School | 0 (0.0%) | 0 (0.0%) |
| High School Diploma | 33 (45.8%) | 0 (0.0%) |
| College / Associate Degree | 79 (69.9%) | 0 (0.0%) |
| Bachelor's Degree or higher | 0 (0.0%) | 0 (0.0%) |
| Total | 112 (60.5%) | 0 (0.0%) |
Employment Occupations by Sex in Haring
Management, Business, Science and Arts Occupations
The most common Management, Business, Science and Arts occupations in Haring are Health Diagnosing & Treating (47 | 30.1%), Management (21 | 13.5%), and Health Technologists (21 | 13.5%).
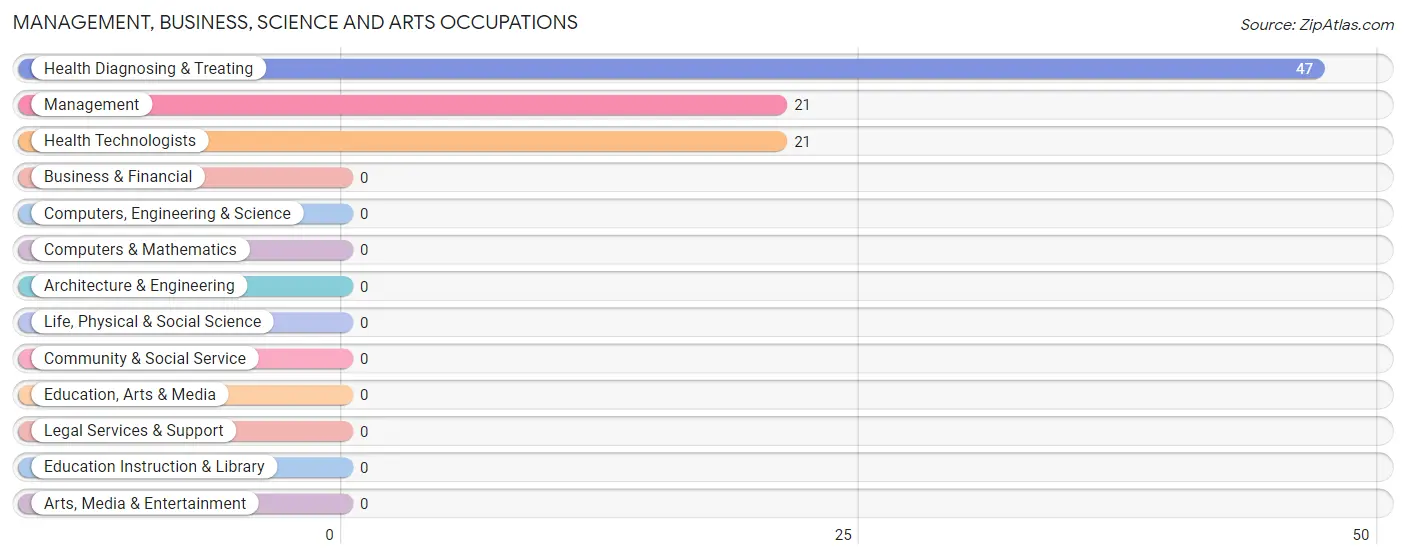
Management, Business, Science and Arts Occupations by Sex
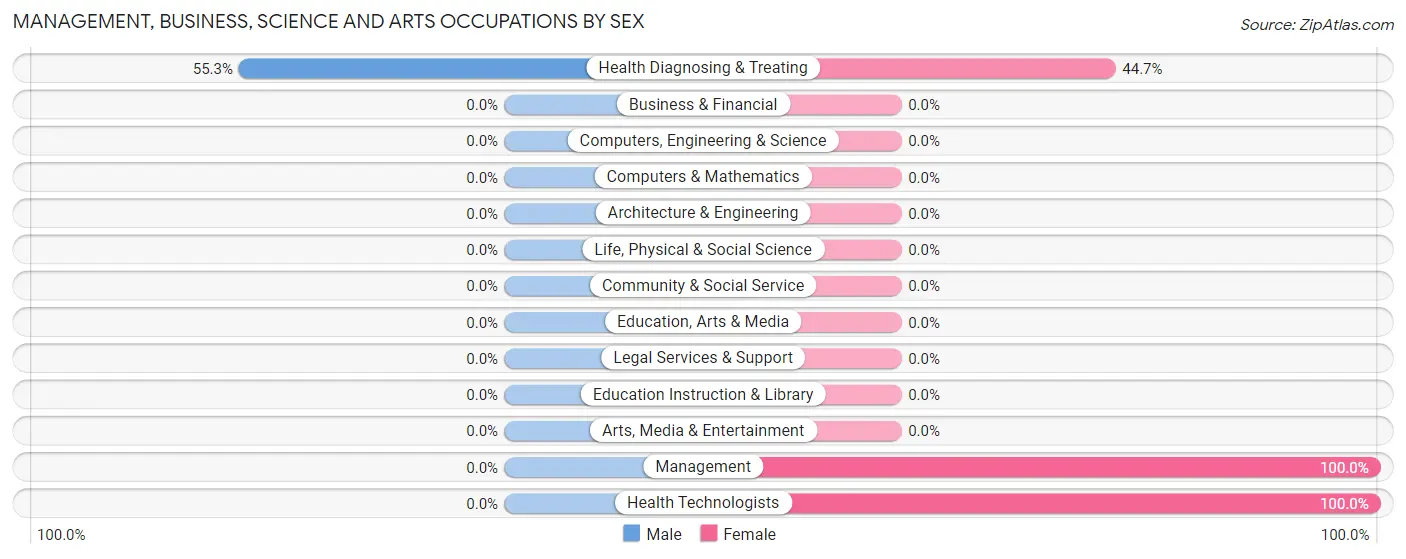
| Occupation | Male | Female |
| Management | 0 (0.0%) | 21 (100.0%) |
| Business & Financial | 0 (0.0%) | 0 (0.0%) |
| Computers, Engineering & Science | 0 (0.0%) | 0 (0.0%) |
| Computers & Mathematics | 0 (0.0%) | 0 (0.0%) |
| Architecture & Engineering | 0 (0.0%) | 0 (0.0%) |
| Life, Physical & Social Science | 0 (0.0%) | 0 (0.0%) |
| Community & Social Service | 0 (0.0%) | 0 (0.0%) |
| Education, Arts & Media | 0 (0.0%) | 0 (0.0%) |
| Legal Services & Support | 0 (0.0%) | 0 (0.0%) |
| Education Instruction & Library | 0 (0.0%) | 0 (0.0%) |
| Arts, Media & Entertainment | 0 (0.0%) | 0 (0.0%) |
| Health Diagnosing & Treating | 26 (55.3%) | 21 (44.7%) |
| Health Technologists | 0 (0.0%) | 21 (100.0%) |
| Total (Category) | 26 (38.2%) | 42 (61.8%) |
| Total (Overall) | 88 (56.4%) | 68 (43.6%) |
Services Occupations
Services Occupations by Sex
| Occupation | Male | Female |
| Healthcare Support | 0 (0.0%) | 0 (0.0%) |
| Security & Protection | 0 (0.0%) | 0 (0.0%) |
| Firefighting & Prevention | 0 (0.0%) | 0 (0.0%) |
| Law Enforcement | 0 (0.0%) | 0 (0.0%) |
| Food Preparation & Serving | 0 (0.0%) | 0 (0.0%) |
| Cleaning & Maintenance | 0 (0.0%) | 0 (0.0%) |
| Personal Care & Service | 0 (0.0%) | 0 (0.0%) |
| Total (Category) | 0 (0.0%) | 0 (0.0%) |
| Total (Overall) | 88 (56.4%) | 68 (43.6%) |
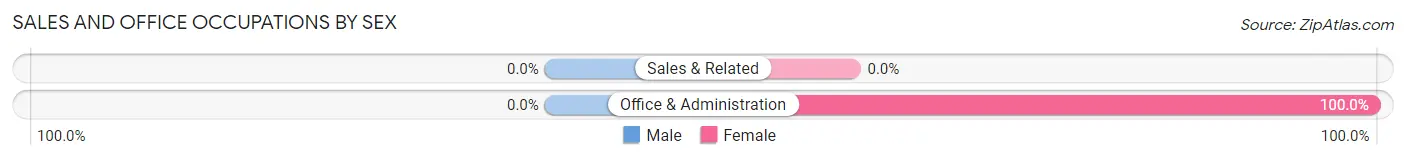
Sales and Office Occupations
The most common Sales and Office occupations in Haring are , and Office & Administration (11 | 7.0%).
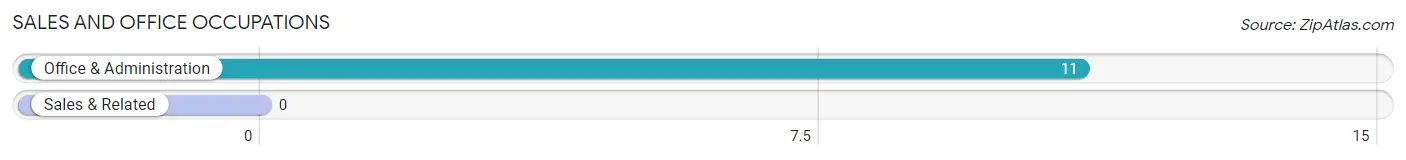
Sales and Office Occupations by Sex
| Occupation | Male | Female |
| Sales & Related | 0 (0.0%) | 0 (0.0%) |
| Office & Administration | 0 (0.0%) | 11 (100.0%) |
| Total (Category) | 0 (0.0%) | 11 (100.0%) |
| Total (Overall) | 88 (56.4%) | 68 (43.6%) |
Natural Resources, Construction and Maintenance Occupations
The most common Natural Resources, Construction and Maintenance occupations in Haring are , and Construction & Extraction (33 | 21.1%).
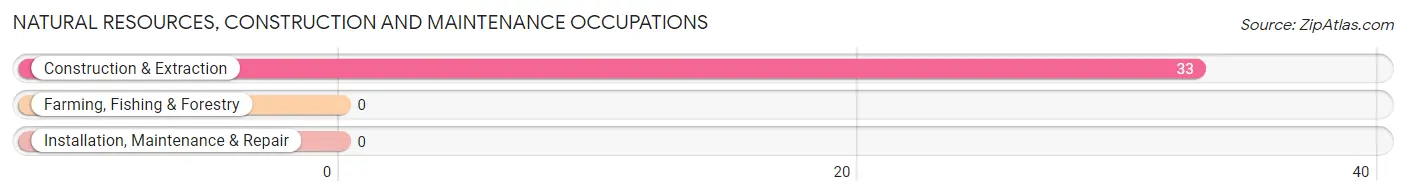
Natural Resources, Construction and Maintenance Occupations by Sex
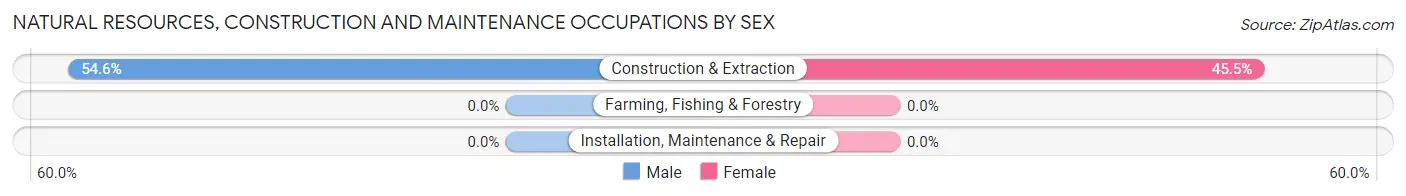
| Occupation | Male | Female |
| Farming, Fishing & Forestry | 0 (0.0%) | 0 (0.0%) |
| Construction & Extraction | 18 (54.5%) | 15 (45.5%) |
| Installation, Maintenance & Repair | 0 (0.0%) | 0 (0.0%) |
| Total (Category) | 18 (54.5%) | 15 (45.5%) |
| Total (Overall) | 88 (56.4%) | 68 (43.6%) |
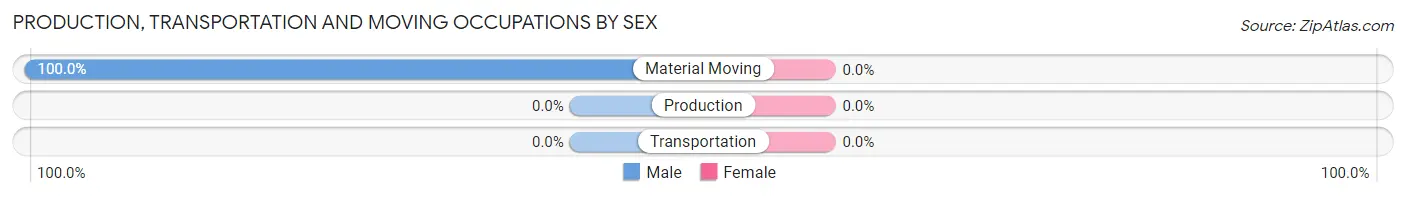
Production, Transportation and Moving Occupations
The most common Production, Transportation and Moving occupations in Haring are , and Material Moving (44 | 28.2%).
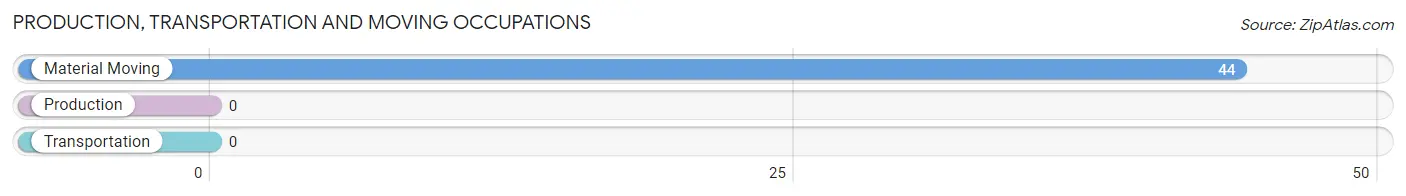
Production, Transportation and Moving Occupations by Sex
| Occupation | Male | Female |
| Production | 0 (0.0%) | 0 (0.0%) |
| Transportation | 0 (0.0%) | 0 (0.0%) |
| Material Moving | 44 (100.0%) | 0 (0.0%) |
| Total (Category) | 44 (100.0%) | 0 (0.0%) |
| Total (Overall) | 88 (56.4%) | 68 (43.6%) |
Employment Industries by Sex in Haring
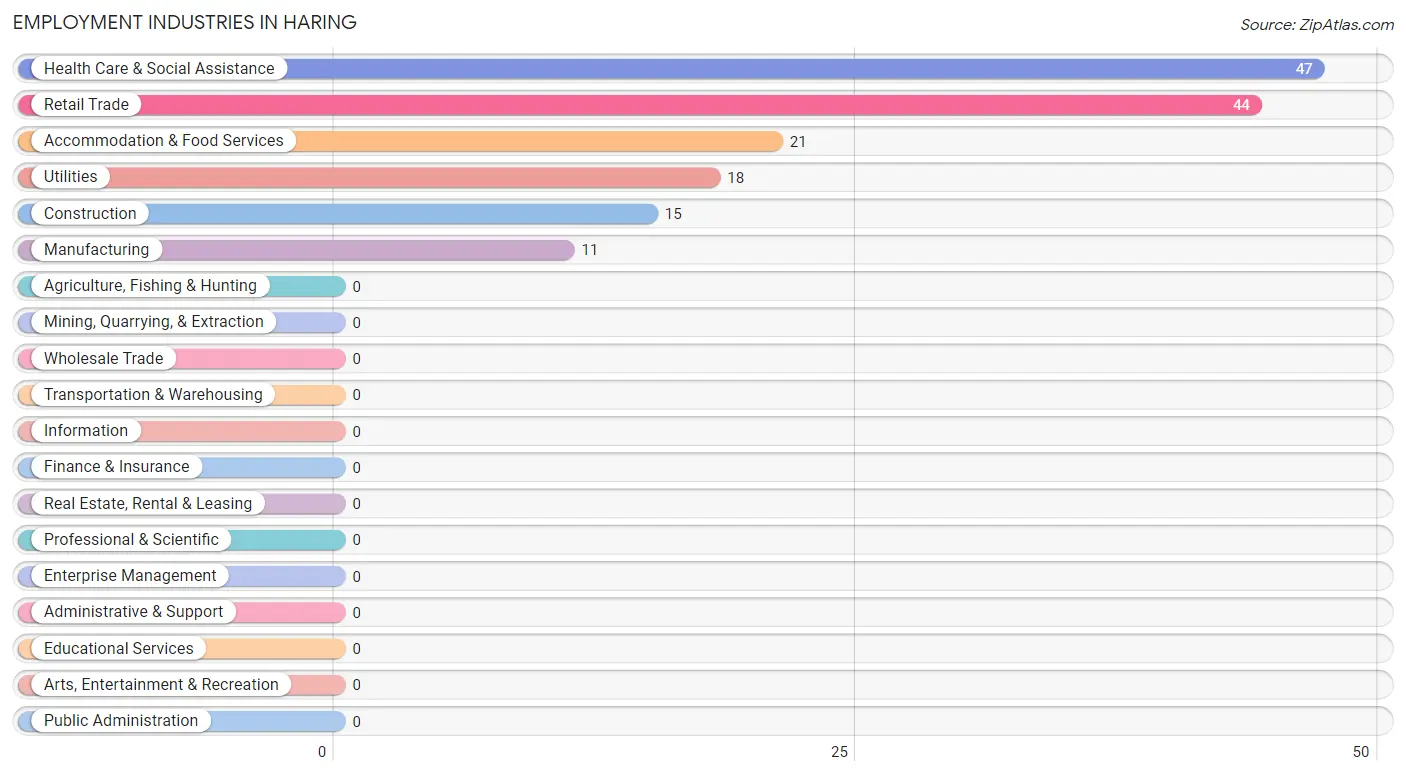
Employment Industries in Haring
The major employment industries in Haring include Health Care & Social Assistance (47 | 30.1%), Retail Trade (44 | 28.2%), Accommodation & Food Services (21 | 13.5%), Utilities (18 | 11.5%), and Construction (15 | 9.6%).
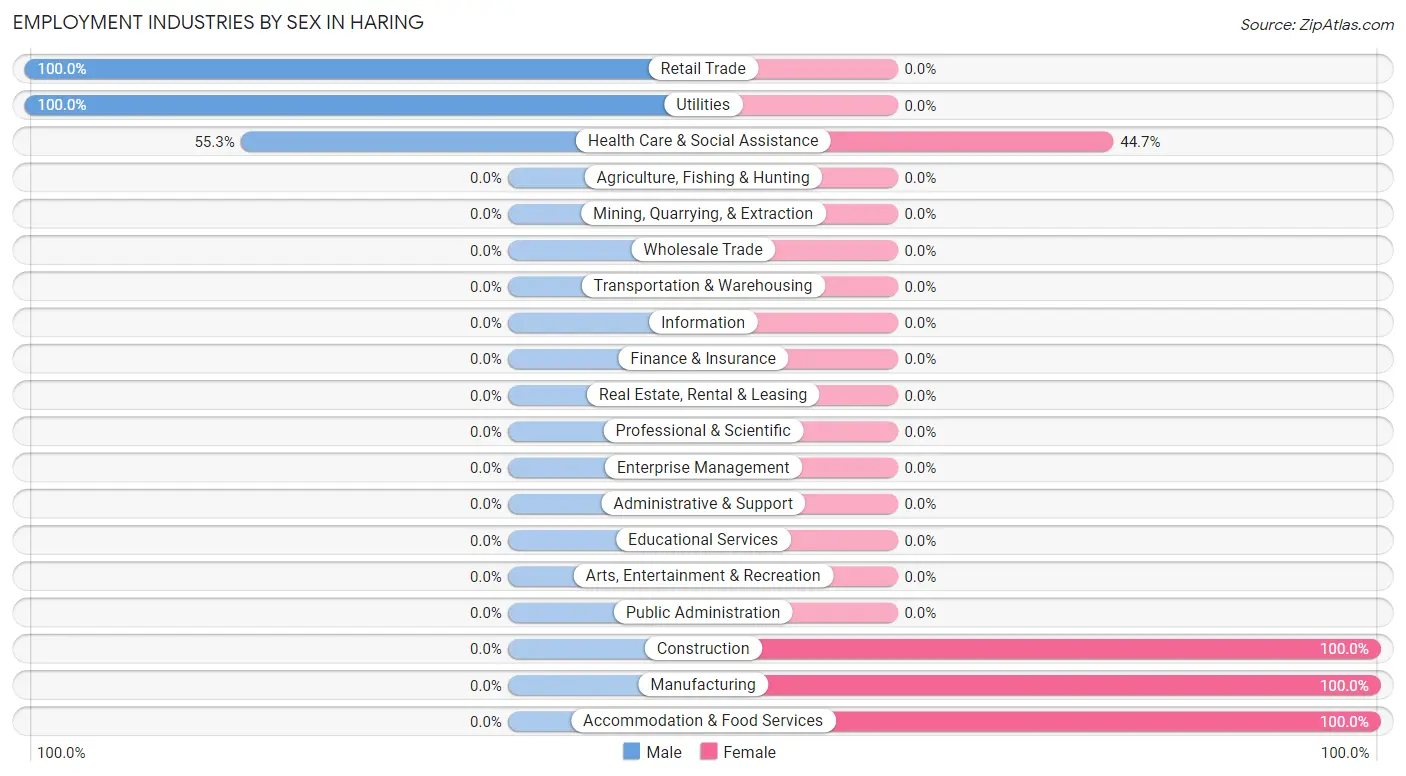
Employment Industries by Sex in Haring
The Haring industries that see more men than women are Retail Trade (100.0%), Utilities (100.0%), and Health Care & Social Assistance (55.3%), whereas the industries that tend to have a higher number of women are Construction (100.0%), Manufacturing (100.0%), and Accommodation & Food Services (100.0%).
| Industry | Male | Female |
| Agriculture, Fishing & Hunting | 0 (0.0%) | 0 (0.0%) |
| Mining, Quarrying, & Extraction | 0 (0.0%) | 0 (0.0%) |
| Construction | 0 (0.0%) | 15 (100.0%) |
| Manufacturing | 0 (0.0%) | 11 (100.0%) |
| Wholesale Trade | 0 (0.0%) | 0 (0.0%) |
| Retail Trade | 44 (100.0%) | 0 (0.0%) |
| Transportation & Warehousing | 0 (0.0%) | 0 (0.0%) |
| Utilities | 18 (100.0%) | 0 (0.0%) |
| Information | 0 (0.0%) | 0 (0.0%) |
| Finance & Insurance | 0 (0.0%) | 0 (0.0%) |
| Real Estate, Rental & Leasing | 0 (0.0%) | 0 (0.0%) |
| Professional & Scientific | 0 (0.0%) | 0 (0.0%) |
| Enterprise Management | 0 (0.0%) | 0 (0.0%) |
| Administrative & Support | 0 (0.0%) | 0 (0.0%) |
| Educational Services | 0 (0.0%) | 0 (0.0%) |
| Health Care & Social Assistance | 26 (55.3%) | 21 (44.7%) |
| Arts, Entertainment & Recreation | 0 (0.0%) | 0 (0.0%) |
| Accommodation & Food Services | 0 (0.0%) | 21 (100.0%) |
| Public Administration | 0 (0.0%) | 0 (0.0%) |
| Total | 88 (56.4%) | 68 (43.6%) |
Education in Haring
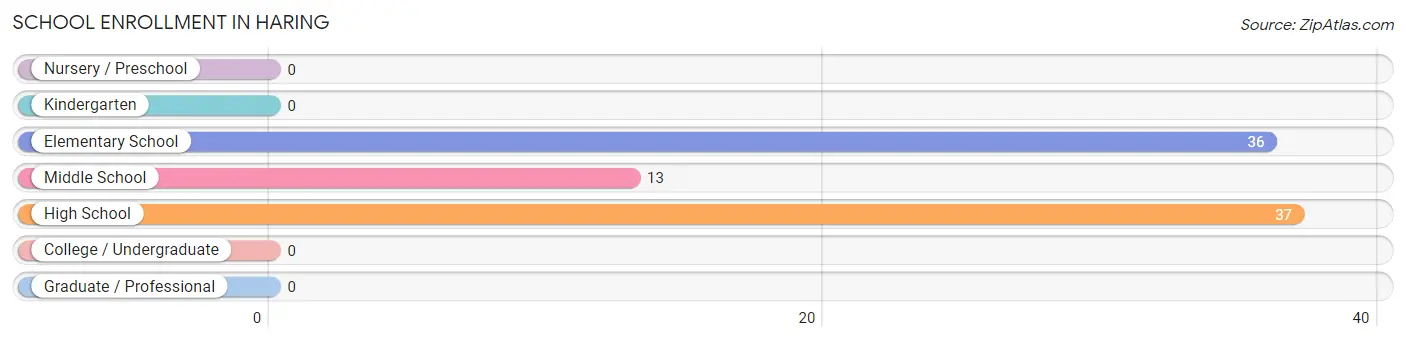
School Enrollment in Haring
The most common levels of schooling among the 86 students in Haring are high school (37 | 43.0%), elementary school (36 | 41.9%), and middle school (13 | 15.1%).
| School Level | # Students | % Students |
| Nursery / Preschool | 0 | 0.0% |
| Kindergarten | 0 | 0.0% |
| Elementary School | 36 | 41.9% |
| Middle School | 13 | 15.1% |
| High School | 37 | 43.0% |
| College / Undergraduate | 0 | 0.0% |
| Graduate / Professional | 0 | 0.0% |
| Total | 86 | 100.0% |
School Enrollment by Age by Funding Source in Haring
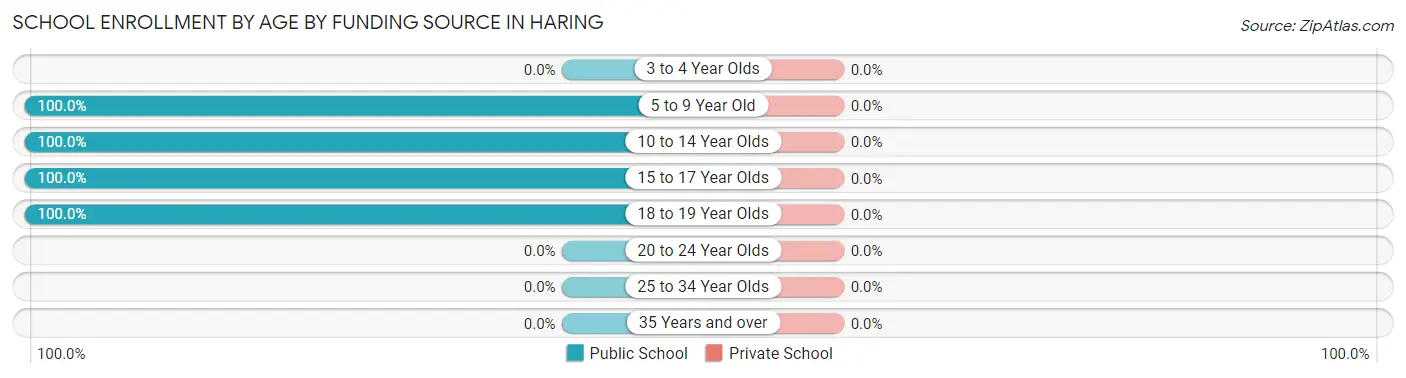
| Age Bracket | Public School | Private School |
| 3 to 4 Year Olds | 0 (0.0%) | 0 (0.0%) |
| 5 to 9 Year Old | 10 (100.0%) | 0 (0.0%) |
| 10 to 14 Year Olds | 39 (100.0%) | 0 (0.0%) |
| 15 to 17 Year Olds | 19 (100.0%) | 0 (0.0%) |
| 18 to 19 Year Olds | 18 (100.0%) | 0 (0.0%) |
| 20 to 24 Year Olds | 0 (0.0%) | 0 (0.0%) |
| 25 to 34 Year Olds | 0 (0.0%) | 0 (0.0%) |
| 35 Years and over | 0 (0.0%) | 0 (0.0%) |
| Total | 86 (100.0%) | 0 (0.0%) |
Educational Attainment by Field of Study in Haring
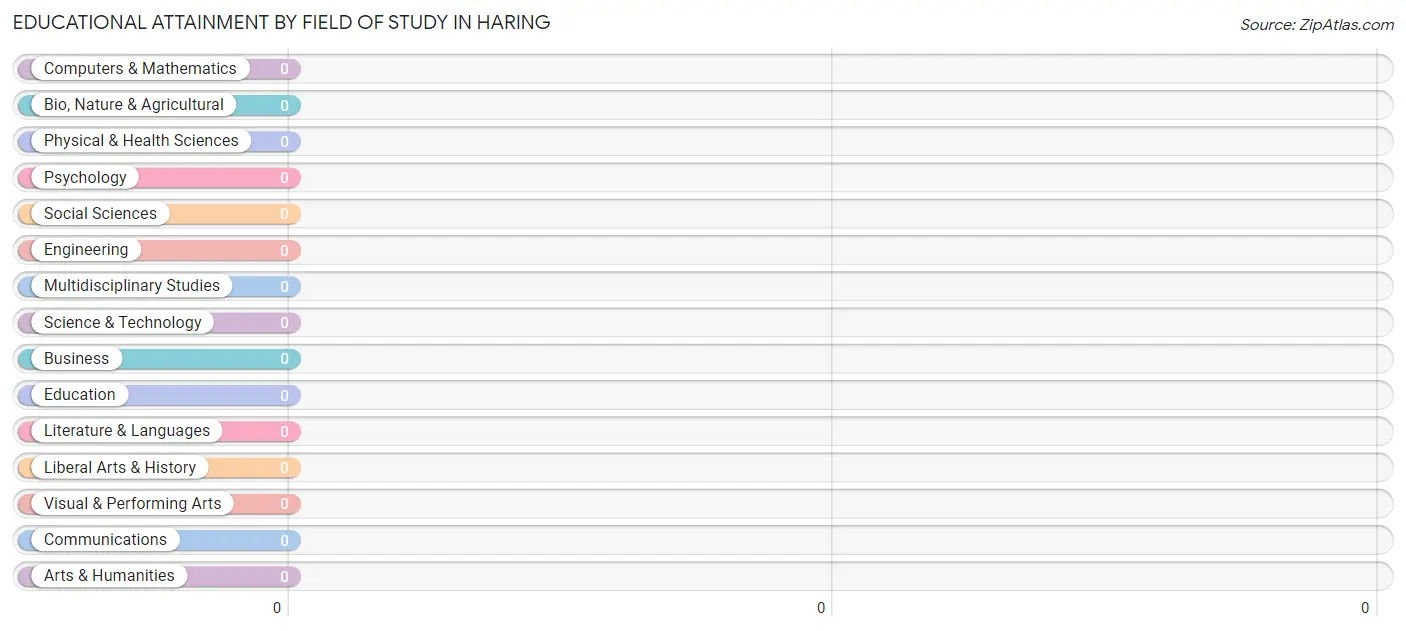
| Field of Study | # Graduates | % Graduates |
| Computers & Mathematics | 0 | 0.0% |
| Bio, Nature & Agricultural | 0 | 0.0% |
| Physical & Health Sciences | 0 | 0.0% |
| Psychology | 0 | 0.0% |
| Social Sciences | 0 | 0.0% |
| Engineering | 0 | 0.0% |
| Multidisciplinary Studies | 0 | 0.0% |
| Science & Technology | 0 | 0.0% |
| Business | 0 | 0.0% |
| Education | 0 | 0.0% |
| Literature & Languages | 0 | 0.0% |
| Liberal Arts & History | 0 | 0.0% |
| Visual & Performing Arts | 0 | 0.0% |
| Communications | 0 | 0.0% |
| Arts & Humanities | 0 | 0.0% |
| Total | 0 | 0.0% |
Transportation & Commute in Haring
Vehicle Availability by Sex in Haring
The most prevalent vehicle ownership categories in Haring are males with 3 vehicles (70, accounting for 79.5%) and females with 3 vehicles (21, making up 102.9%).
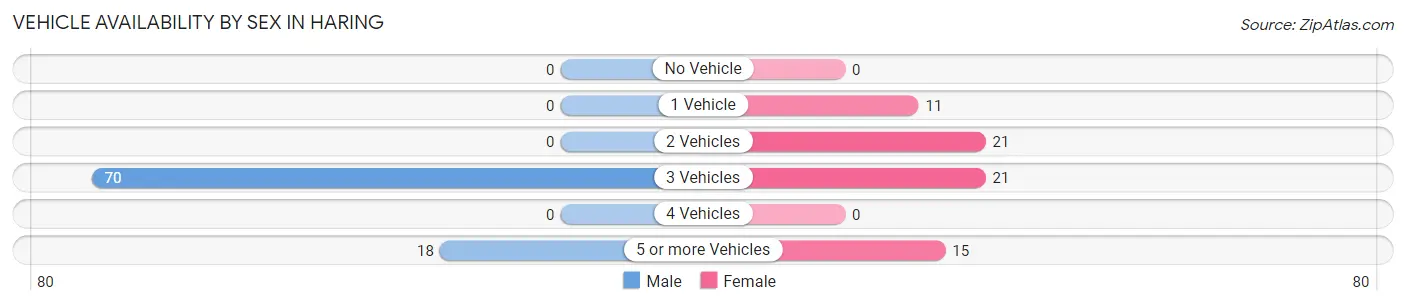
| Vehicles Available | Male | Female |
| No Vehicle | 0 (0.0%) | 0 (0.0%) |
| 1 Vehicle | 0 (0.0%) | 11 (16.2%) |
| 2 Vehicles | 0 (0.0%) | 21 (30.9%) |
| 3 Vehicles | 70 (79.5%) | 21 (30.9%) |
| 4 Vehicles | 0 (0.0%) | 0 (0.0%) |
| 5 or more Vehicles | 18 (20.4%) | 15 (22.1%) |
| Total | 88 (100.0%) | 68 (100.0%) |
Commute Time in Haring
The most frequently occuring commute durations in Haring are 5 to 9 minutes (76 commuters, 53.9%), 45 to 59 minutes (44 commuters, 31.2%), and 20 to 24 minutes (21 commuters, 14.9%).
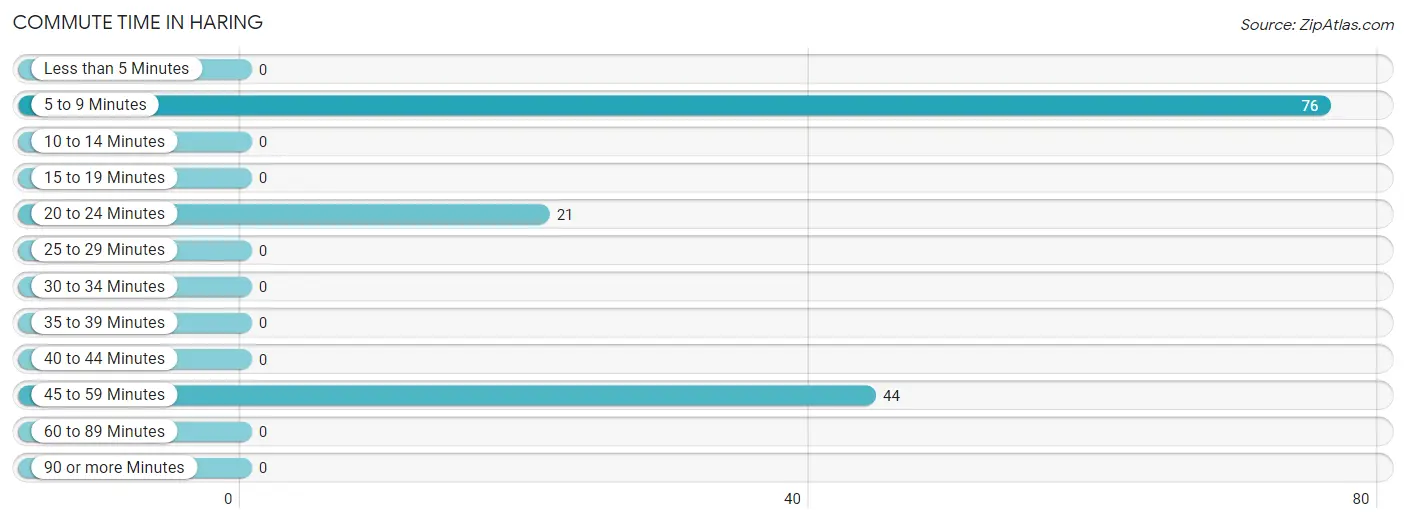
| Commute Time | # Commuters | % Commuters |
| Less than 5 Minutes | 0 | 0.0% |
| 5 to 9 Minutes | 76 | 53.9% |
| 10 to 14 Minutes | 0 | 0.0% |
| 15 to 19 Minutes | 0 | 0.0% |
| 20 to 24 Minutes | 21 | 14.9% |
| 25 to 29 Minutes | 0 | 0.0% |
| 30 to 34 Minutes | 0 | 0.0% |
| 35 to 39 Minutes | 0 | 0.0% |
| 40 to 44 Minutes | 0 | 0.0% |
| 45 to 59 Minutes | 44 | 31.2% |
| 60 to 89 Minutes | 0 | 0.0% |
| 90 or more Minutes | 0 | 0.0% |
Commute Time by Sex in Haring
The most common commute times in Haring are 5 to 9 minutes (44 commuters, 50.0%) for males and 5 to 9 minutes (32 commuters, 60.4%) for females.
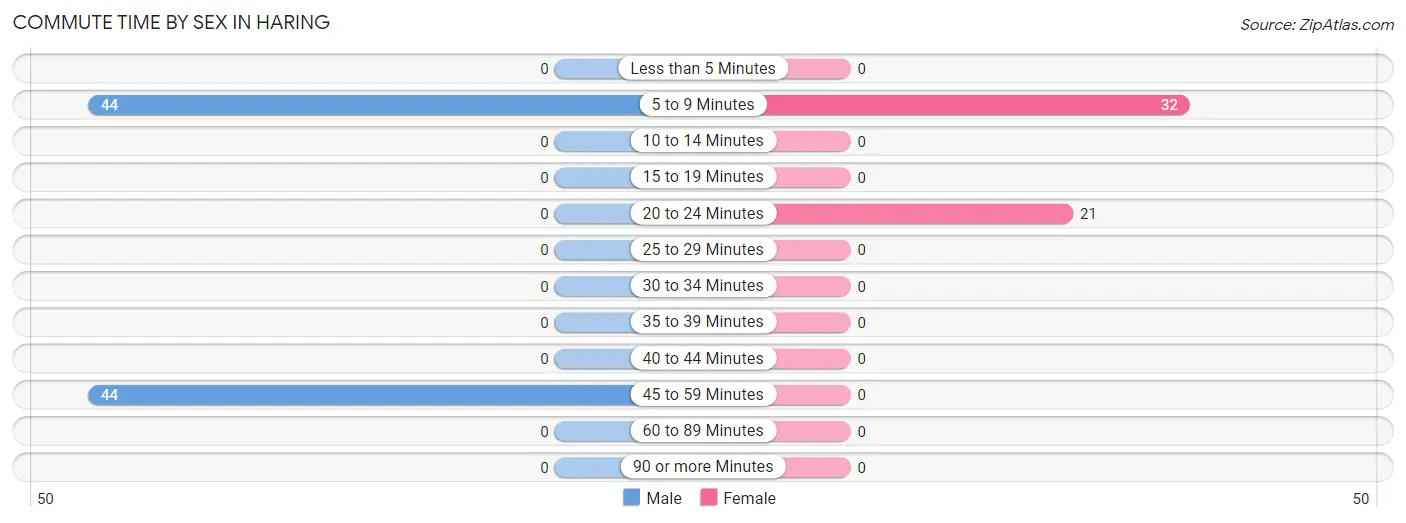
| Commute Time | Male | Female |
| Less than 5 Minutes | 0 (0.0%) | 0 (0.0%) |
| 5 to 9 Minutes | 44 (50.0%) | 32 (60.4%) |
| 10 to 14 Minutes | 0 (0.0%) | 0 (0.0%) |
| 15 to 19 Minutes | 0 (0.0%) | 0 (0.0%) |
| 20 to 24 Minutes | 0 (0.0%) | 21 (39.6%) |
| 25 to 29 Minutes | 0 (0.0%) | 0 (0.0%) |
| 30 to 34 Minutes | 0 (0.0%) | 0 (0.0%) |
| 35 to 39 Minutes | 0 (0.0%) | 0 (0.0%) |
| 40 to 44 Minutes | 0 (0.0%) | 0 (0.0%) |
| 45 to 59 Minutes | 44 (50.0%) | 0 (0.0%) |
| 60 to 89 Minutes | 0 (0.0%) | 0 (0.0%) |
| 90 or more Minutes | 0 (0.0%) | 0 (0.0%) |
Time of Departure to Work by Sex in Haring
The most frequent times of departure to work in Haring are 12:00 AM to 4:59 AM (44, 50.0%) for males and 6:30 AM to 6:59 AM (21, 39.6%) for females.
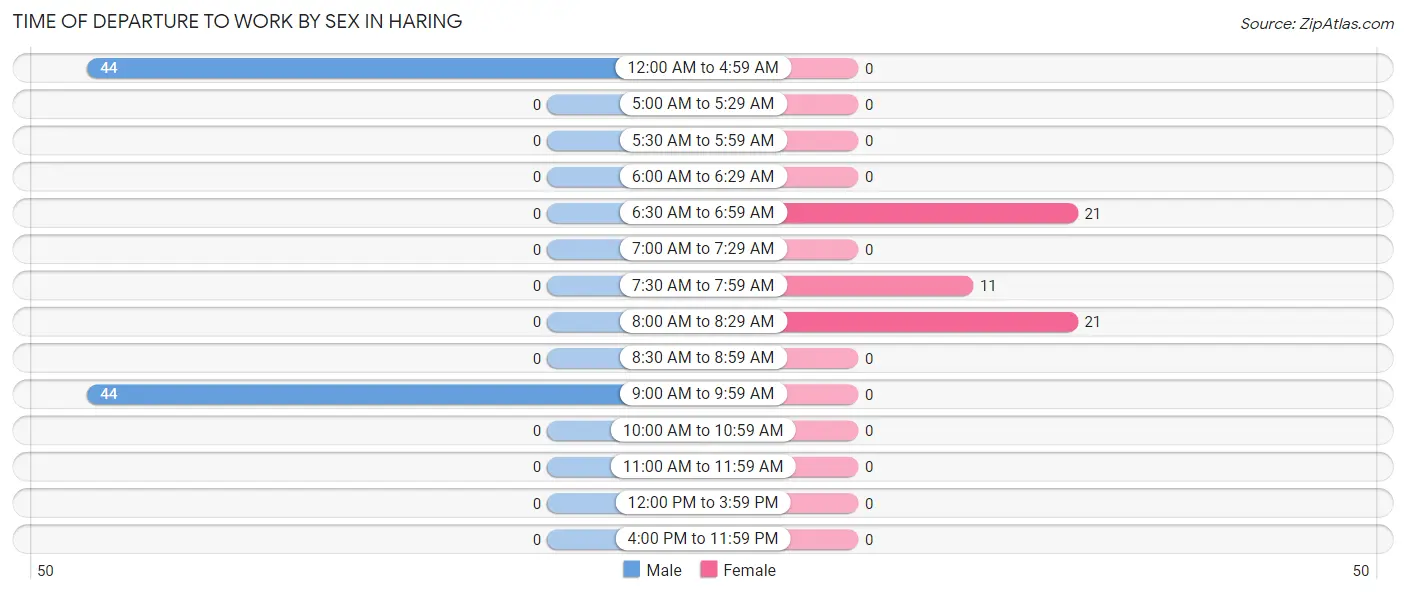
| Time of Departure | Male | Female |
| 12:00 AM to 4:59 AM | 44 (50.0%) | 0 (0.0%) |
| 5:00 AM to 5:29 AM | 0 (0.0%) | 0 (0.0%) |
| 5:30 AM to 5:59 AM | 0 (0.0%) | 0 (0.0%) |
| 6:00 AM to 6:29 AM | 0 (0.0%) | 0 (0.0%) |
| 6:30 AM to 6:59 AM | 0 (0.0%) | 21 (39.6%) |
| 7:00 AM to 7:29 AM | 0 (0.0%) | 0 (0.0%) |
| 7:30 AM to 7:59 AM | 0 (0.0%) | 11 (20.7%) |
| 8:00 AM to 8:29 AM | 0 (0.0%) | 21 (39.6%) |
| 8:30 AM to 8:59 AM | 0 (0.0%) | 0 (0.0%) |
| 9:00 AM to 9:59 AM | 44 (50.0%) | 0 (0.0%) |
| 10:00 AM to 10:59 AM | 0 (0.0%) | 0 (0.0%) |
| 11:00 AM to 11:59 AM | 0 (0.0%) | 0 (0.0%) |
| 12:00 PM to 3:59 PM | 0 (0.0%) | 0 (0.0%) |
| 4:00 PM to 11:59 PM | 0 (0.0%) | 0 (0.0%) |
| Total | 88 (100.0%) | 53 (100.0%) |
Housing Occupancy in Haring
Occupancy by Ownership in Haring
Of the total 81 dwellings in Haring, owner-occupied units account for 81 (100.0%), while renter-occupied units make up 0 (0.0%).
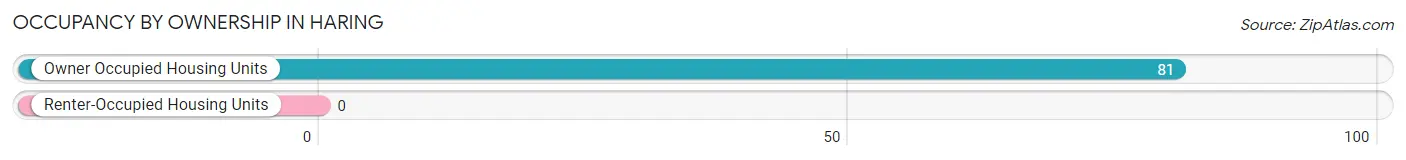
| Occupancy | # Housing Units | % Housing Units |
| Owner Occupied Housing Units | 81 | 100.0% |
| Renter-Occupied Housing Units | 0 | 0.0% |
| Total Occupied Housing Units | 81 | 100.0% |
Occupancy by Household Size in Haring
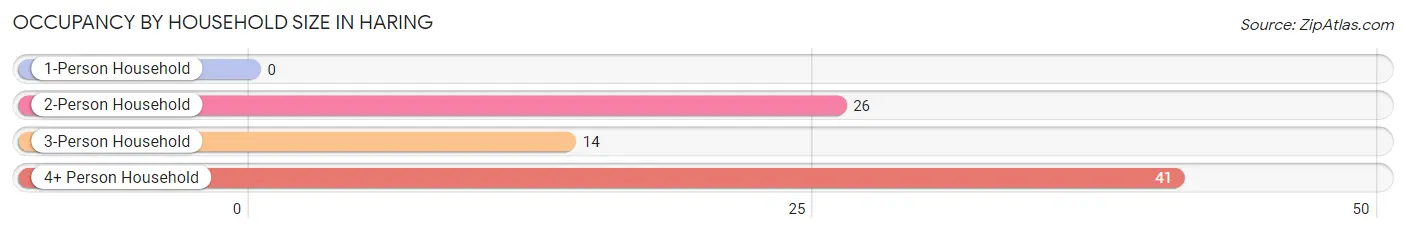
| Household Size | # Housing Units | % Housing Units |
| 1-Person Household | 0 | 0.0% |
| 2-Person Household | 26 | 32.1% |
| 3-Person Household | 14 | 17.3% |
| 4+ Person Household | 41 | 50.6% |
| Total Housing Units | 81 | 100.0% |
Occupancy by Ownership by Household Size in Haring
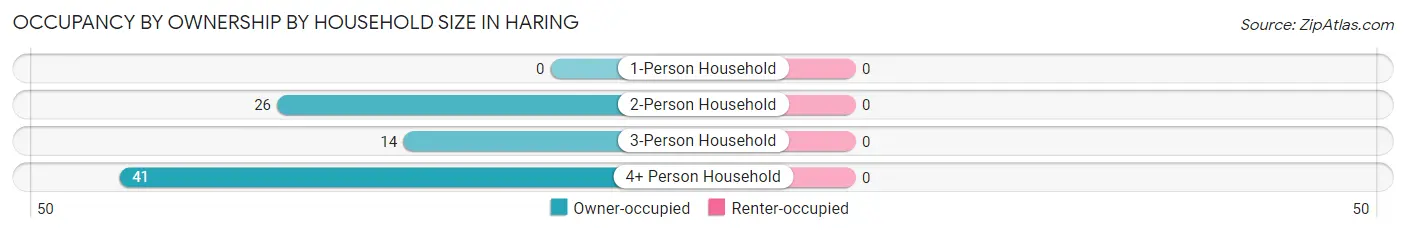
| Household Size | Owner-occupied | Renter-occupied |
| 1-Person Household | 0 (0.0%) | 0 (0.0%) |
| 2-Person Household | 26 (100.0%) | 0 (0.0%) |
| 3-Person Household | 14 (100.0%) | 0 (0.0%) |
| 4+ Person Household | 41 (100.0%) | 0 (0.0%) |
| Total Housing Units | 81 (100.0%) | 0 (0.0%) |
Occupancy by Educational Attainment in Haring
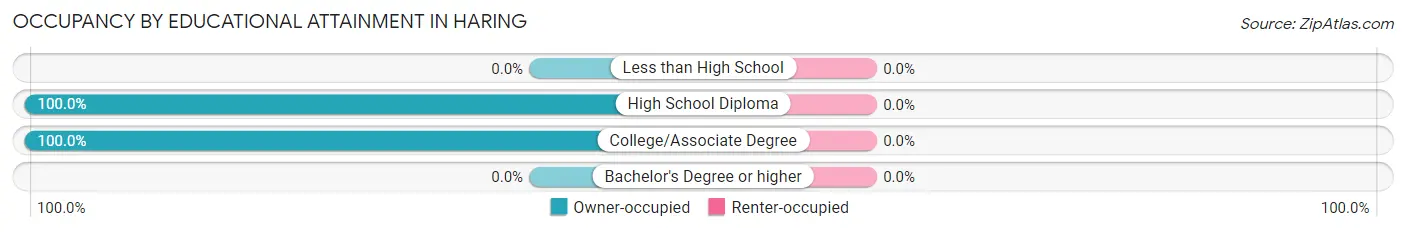
| Household Size | Owner-occupied | Renter-occupied |
| Less than High School | 0 (0.0%) | 0 (0.0%) |
| High School Diploma | 29 (100.0%) | 0 (0.0%) |
| College/Associate Degree | 52 (100.0%) | 0 (0.0%) |
| Bachelor's Degree or higher | 0 (0.0%) | 0 (0.0%) |
Occupancy by Age of Householder in Haring
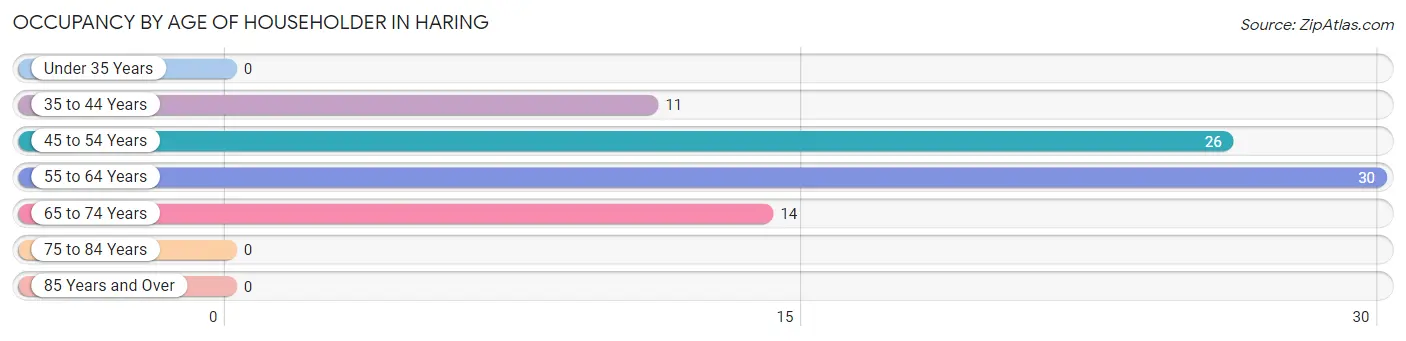
| Age Bracket | # Households | % Households |
| Under 35 Years | 0 | 0.0% |
| 35 to 44 Years | 11 | 13.6% |
| 45 to 54 Years | 26 | 32.1% |
| 55 to 64 Years | 30 | 37.0% |
| 65 to 74 Years | 14 | 17.3% |
| 75 to 84 Years | 0 | 0.0% |
| 85 Years and Over | 0 | 0.0% |
| Total | 81 | 100.0% |
Housing Finances in Haring
Median Income by Occupancy in Haring
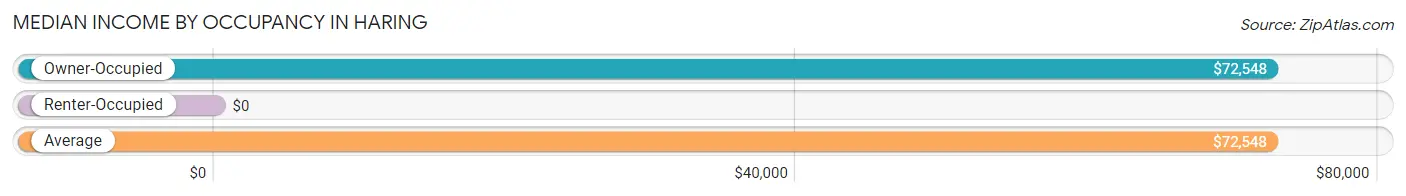
| Occupancy Type | # Households | Median Income |
| Owner-Occupied | 81 (100.0%) | $72,548 |
| Renter-Occupied | 0 (0.0%) | $0 |
| Average | 81 (100.0%) | $72,548 |
Occupancy by Householder Income Bracket in Haring
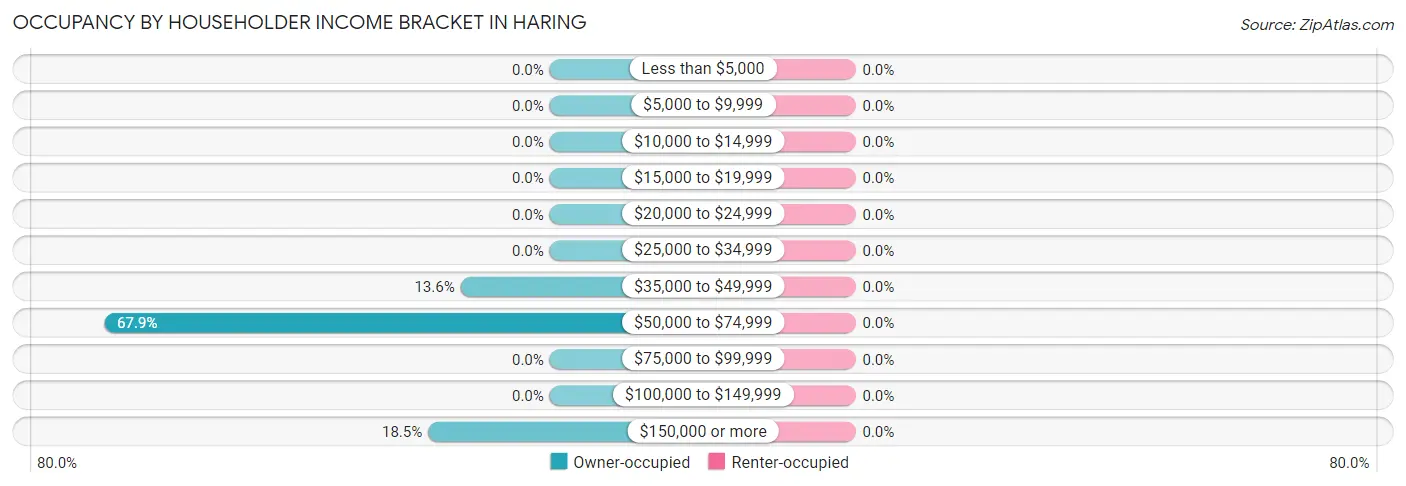
| Income Bracket | Owner-occupied | Renter-occupied |
| Less than $5,000 | 0 (0.0%) | 0 (0.0%) |
| $5,000 to $9,999 | 0 (0.0%) | 0 (0.0%) |
| $10,000 to $14,999 | 0 (0.0%) | 0 (0.0%) |
| $15,000 to $19,999 | 0 (0.0%) | 0 (0.0%) |
| $20,000 to $24,999 | 0 (0.0%) | 0 (0.0%) |
| $25,000 to $34,999 | 0 (0.0%) | 0 (0.0%) |
| $35,000 to $49,999 | 11 (13.6%) | 0 (0.0%) |
| $50,000 to $74,999 | 55 (67.9%) | 0 (0.0%) |
| $75,000 to $99,999 | 0 (0.0%) | 0 (0.0%) |
| $100,000 to $149,999 | 0 (0.0%) | 0 (0.0%) |
| $150,000 or more | 15 (18.5%) | 0 (0.0%) |
| Total | 81 (100.0%) | 0 (0.0%) |
Monthly Housing Cost Tiers in Haring
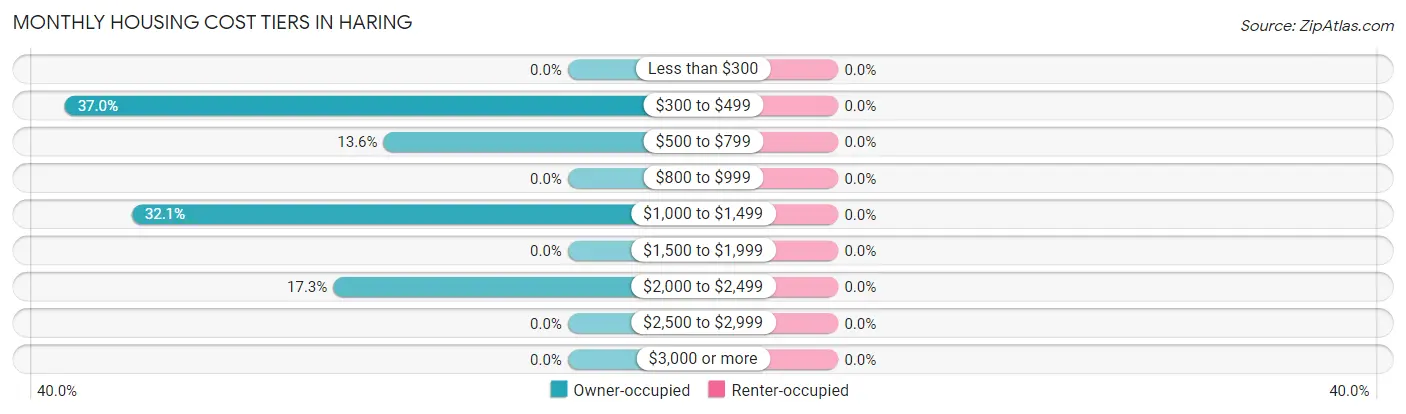
| Monthly Cost | Owner-occupied | Renter-occupied |
| Less than $300 | 0 (0.0%) | 0 (0.0%) |
| $300 to $499 | 30 (37.0%) | 0 (0.0%) |
| $500 to $799 | 11 (13.6%) | 0 (0.0%) |
| $800 to $999 | 0 (0.0%) | 0 (0.0%) |
| $1,000 to $1,499 | 26 (32.1%) | 0 (0.0%) |
| $1,500 to $1,999 | 0 (0.0%) | 0 (0.0%) |
| $2,000 to $2,499 | 14 (17.3%) | 0 (0.0%) |
| $2,500 to $2,999 | 0 (0.0%) | 0 (0.0%) |
| $3,000 or more | 0 (0.0%) | 0 (0.0%) |
| Total | 81 (100.0%) | 0 (0.0%) |
Physical Housing Characteristics in Haring
Housing Structures in Haring
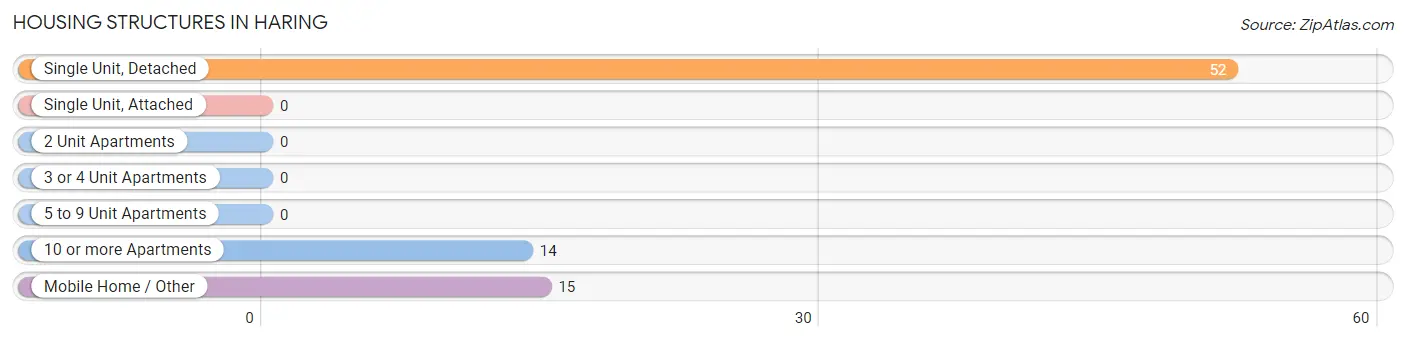
| Structure Type | # Housing Units | % Housing Units |
| Single Unit, Detached | 52 | 64.2% |
| Single Unit, Attached | 0 | 0.0% |
| 2 Unit Apartments | 0 | 0.0% |
| 3 or 4 Unit Apartments | 0 | 0.0% |
| 5 to 9 Unit Apartments | 0 | 0.0% |
| 10 or more Apartments | 14 | 17.3% |
| Mobile Home / Other | 15 | 18.5% |
| Total | 81 | 100.0% |
Housing Structures by Occupancy in Haring
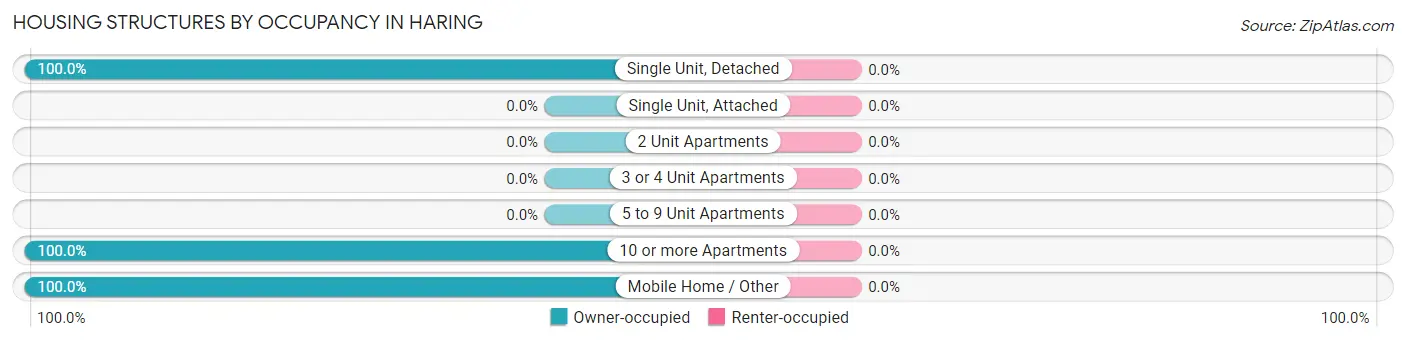
| Structure Type | Owner-occupied | Renter-occupied |
| Single Unit, Detached | 52 (100.0%) | 0 (0.0%) |
| Single Unit, Attached | 0 (0.0%) | 0 (0.0%) |
| 2 Unit Apartments | 0 (0.0%) | 0 (0.0%) |
| 3 or 4 Unit Apartments | 0 (0.0%) | 0 (0.0%) |
| 5 to 9 Unit Apartments | 0 (0.0%) | 0 (0.0%) |
| 10 or more Apartments | 14 (100.0%) | 0 (0.0%) |
| Mobile Home / Other | 15 (100.0%) | 0 (0.0%) |
| Total | 81 (100.0%) | 0 (0.0%) |
Housing Structures by Number of Rooms in Haring
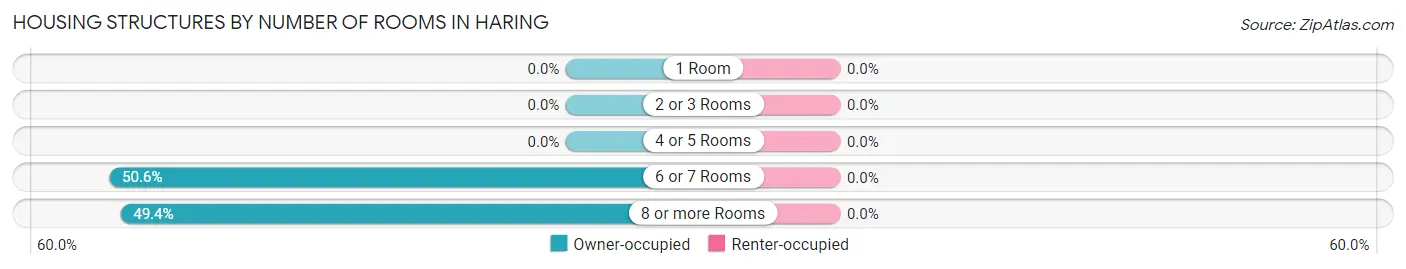
| Number of Rooms | Owner-occupied | Renter-occupied |
| 1 Room | 0 (0.0%) | 0 (0.0%) |
| 2 or 3 Rooms | 0 (0.0%) | 0 (0.0%) |
| 4 or 5 Rooms | 0 (0.0%) | 0 (0.0%) |
| 6 or 7 Rooms | 41 (50.6%) | 0 (0.0%) |
| 8 or more Rooms | 40 (49.4%) | 0 (0.0%) |
| Total | 81 (100.0%) | 0 (0.0%) |
Housing Structure by Heating Type in Haring
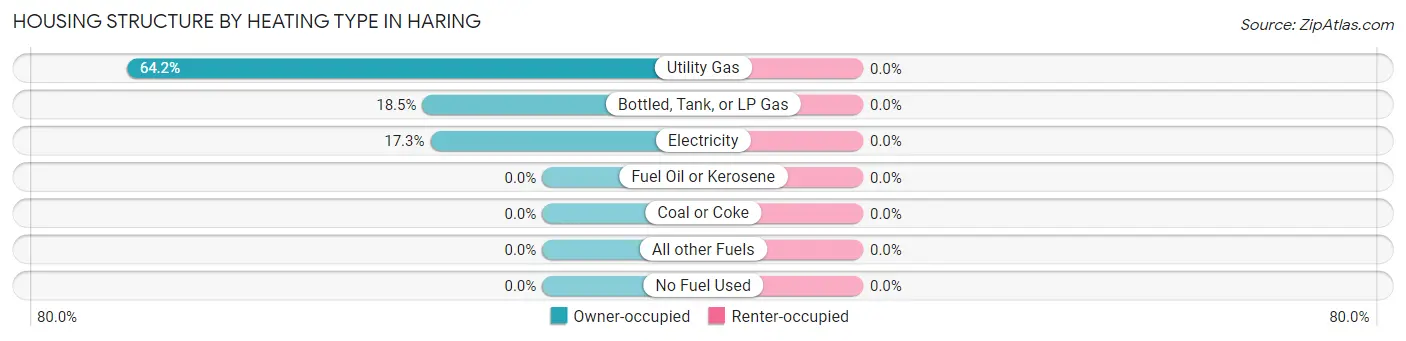
| Heating Type | Owner-occupied | Renter-occupied |
| Utility Gas | 52 (64.2%) | 0 (0.0%) |
| Bottled, Tank, or LP Gas | 15 (18.5%) | 0 (0.0%) |
| Electricity | 14 (17.3%) | 0 (0.0%) |
| Fuel Oil or Kerosene | 0 (0.0%) | 0 (0.0%) |
| Coal or Coke | 0 (0.0%) | 0 (0.0%) |
| All other Fuels | 0 (0.0%) | 0 (0.0%) |
| No Fuel Used | 0 (0.0%) | 0 (0.0%) |
| Total | 81 (100.0%) | 0 (0.0%) |
Household Vehicle Usage in Haring
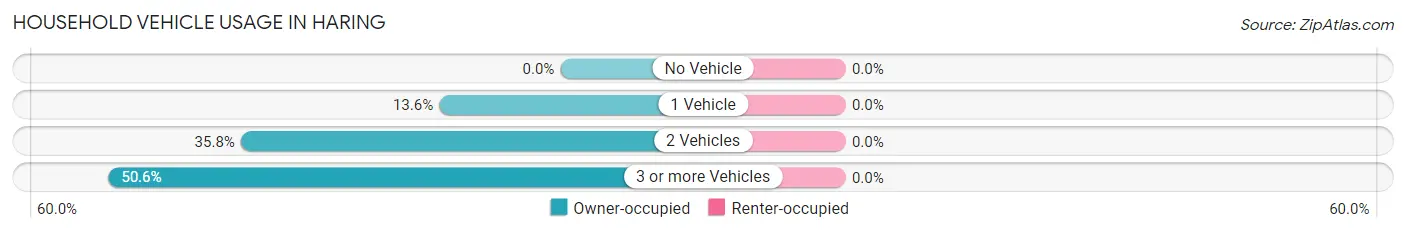
| Vehicles per Household | Owner-occupied | Renter-occupied |
| No Vehicle | 0 (0.0%) | 0 (0.0%) |
| 1 Vehicle | 11 (13.6%) | 0 (0.0%) |
| 2 Vehicles | 29 (35.8%) | 0 (0.0%) |
| 3 or more Vehicles | 41 (50.6%) | 0 (0.0%) |
| Total | 81 (100.0%) | 0 (0.0%) |
Real Estate & Mortgages in Haring
Real Estate and Mortgage Overview in Haring
| Characteristic | Without Mortgage | With Mortgage |
| Housing Units | 30 | 51 |
| Median Property Value | - | - |
| Median Household Income | - | - |
| Monthly Housing Costs | - | - |
| Real Estate Taxes | - | - |
Property Value by Mortgage Status in Haring
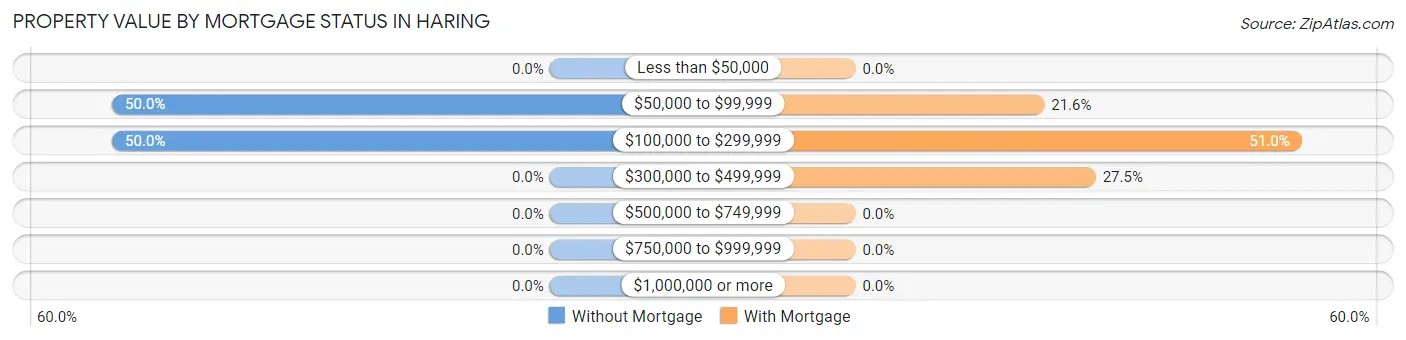
| Property Value | Without Mortgage | With Mortgage |
| Less than $50,000 | 0 (0.0%) | 0 (0.0%) |
| $50,000 to $99,999 | 15 (50.0%) | 11 (21.6%) |
| $100,000 to $299,999 | 15 (50.0%) | 26 (51.0%) |
| $300,000 to $499,999 | 0 (0.0%) | 14 (27.5%) |
| $500,000 to $749,999 | 0 (0.0%) | 0 (0.0%) |
| $750,000 to $999,999 | 0 (0.0%) | 0 (0.0%) |
| $1,000,000 or more | 0 (0.0%) | 0 (0.0%) |
| Total | 30 (100.0%) | 51 (100.0%) |
Household Income by Mortgage Status in Haring
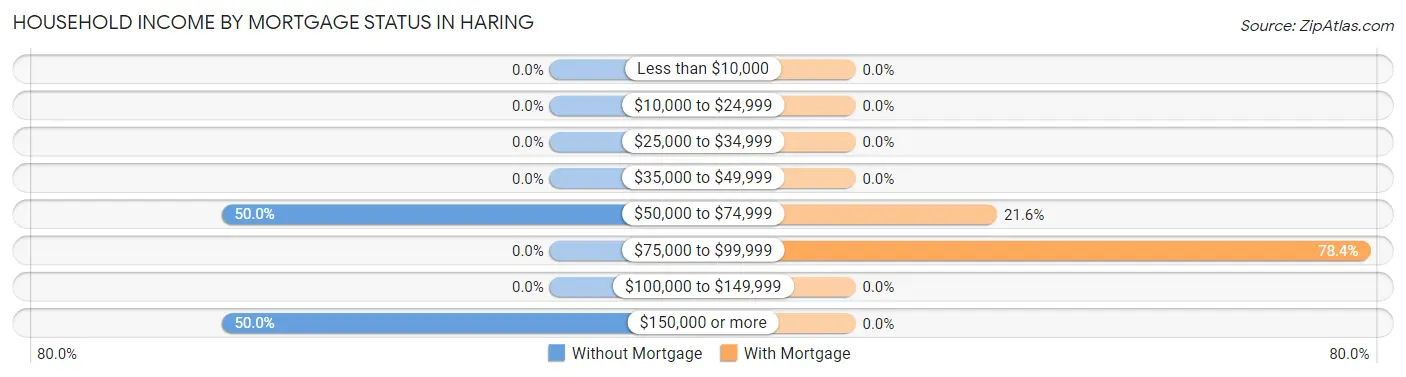
| Household Income | Without Mortgage | With Mortgage |
| Less than $10,000 | 0 (0.0%) | 0 (0.0%) |
| $10,000 to $24,999 | 0 (0.0%) | 0 (0.0%) |
| $25,000 to $34,999 | 0 (0.0%) | 0 (0.0%) |
| $35,000 to $49,999 | 0 (0.0%) | 0 (0.0%) |
| $50,000 to $74,999 | 15 (50.0%) | 11 (21.6%) |
| $75,000 to $99,999 | 0 (0.0%) | 40 (78.4%) |
| $100,000 to $149,999 | 0 (0.0%) | 0 (0.0%) |
| $150,000 or more | 15 (50.0%) | 0 (0.0%) |
| Total | 30 (100.0%) | 51 (100.0%) |
Property Value to Household Income Ratio in Haring
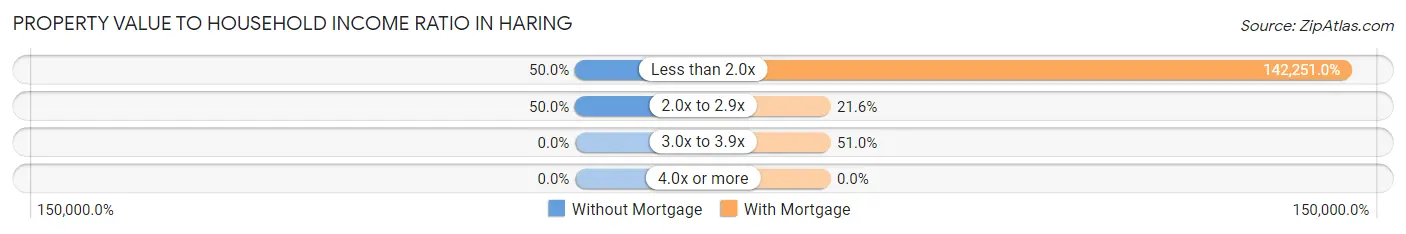
| Value-to-Income Ratio | Without Mortgage | With Mortgage |
| Less than 2.0x | 15 (50.0%) | 72,548 (142,251.0%) |
| 2.0x to 2.9x | 15 (50.0%) | 11 (21.6%) |
| 3.0x to 3.9x | 0 (0.0%) | 26 (51.0%) |
| 4.0x or more | 0 (0.0%) | 0 (0.0%) |
| Total | 30 (100.0%) | 51 (100.0%) |
Real Estate Taxes by Mortgage Status in Haring
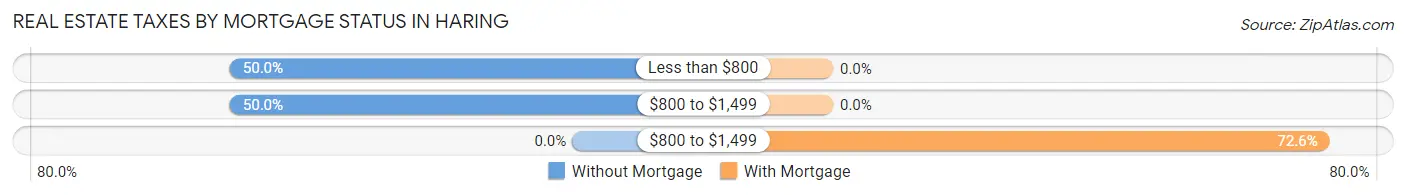
| Property Taxes | Without Mortgage | With Mortgage |
| Less than $800 | 15 (50.0%) | 0 (0.0%) |
| $800 to $1,499 | 15 (50.0%) | 0 (0.0%) |
| $800 to $1,499 | 0 (0.0%) | 37 (72.6%) |
| Total | 30 (100.0%) | 51 (100.0%) |
Health & Disability in Haring
Health Insurance Coverage by Age in Haring
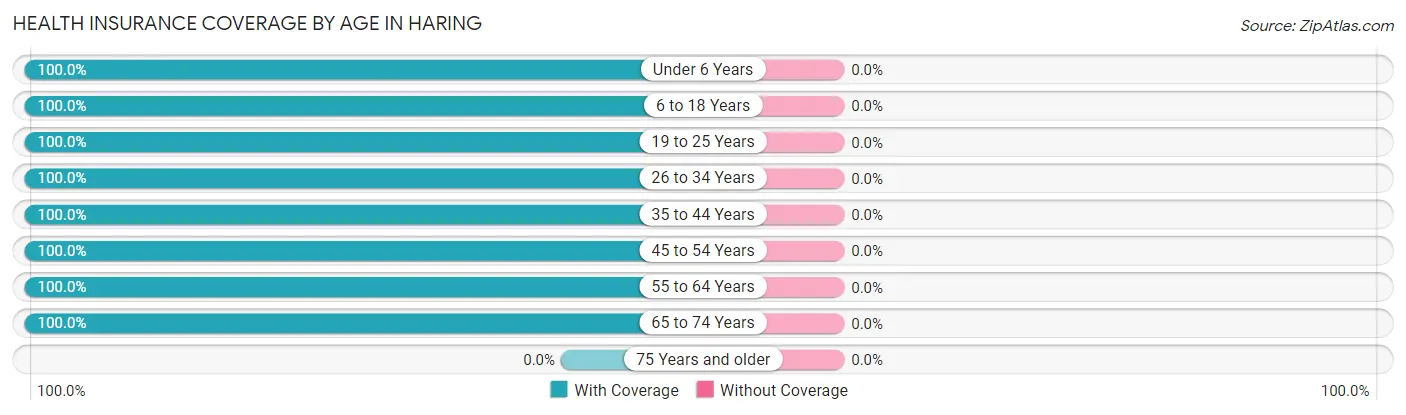
| Age Bracket | With Coverage | Without Coverage |
| Under 6 Years | 14 (100.0%) | 0 (0.0%) |
| 6 to 18 Years | 86 (100.0%) | 0 (0.0%) |
| 19 to 25 Years | 26 (100.0%) | 0 (0.0%) |
| 26 to 34 Years | 22 (100.0%) | 0 (0.0%) |
| 35 to 44 Years | 72 (100.0%) | 0 (0.0%) |
| 45 to 54 Years | 44 (100.0%) | 0 (0.0%) |
| 55 to 64 Years | 47 (100.0%) | 0 (0.0%) |
| 65 to 74 Years | 14 (100.0%) | 0 (0.0%) |
| 75 Years and older | 0 (0.0%) | 0 (0.0%) |
| Total | 325 (100.0%) | 0 (0.0%) |
Health Insurance Coverage by Citizenship Status in Haring
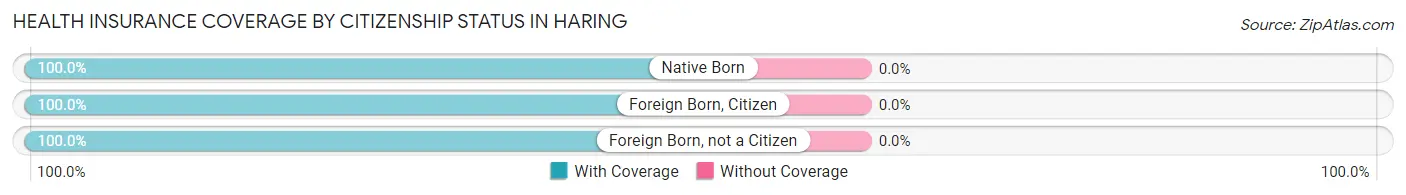
| Citizenship Status | With Coverage | Without Coverage |
| Native Born | 14 (100.0%) | 0 (0.0%) |
| Foreign Born, Citizen | 86 (100.0%) | 0 (0.0%) |
| Foreign Born, not a Citizen | 26 (100.0%) | 0 (0.0%) |
Health Insurance Coverage by Household Income in Haring
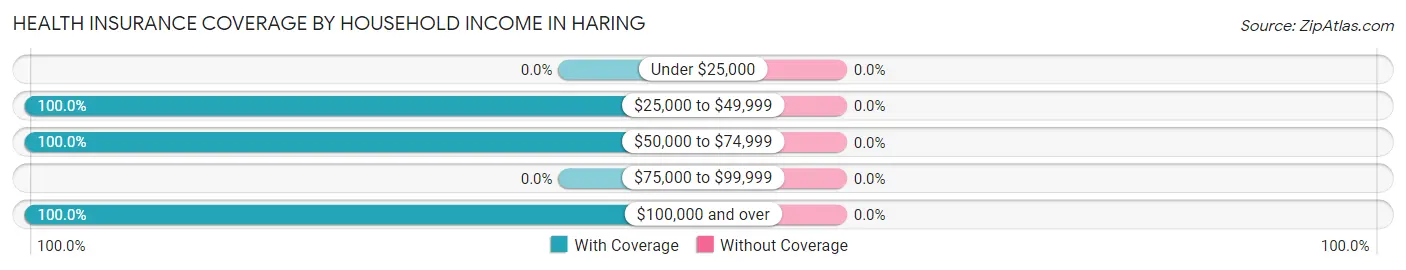
| Household Income | With Coverage | Without Coverage |
| Under $25,000 | 0 (0.0%) | 0 (0.0%) |
| $25,000 to $49,999 | 21 (100.0%) | 0 (0.0%) |
| $50,000 to $74,999 | 271 (100.0%) | 0 (0.0%) |
| $75,000 to $99,999 | 0 (0.0%) | 0 (0.0%) |
| $100,000 and over | 33 (100.0%) | 0 (0.0%) |
Public vs Private Health Insurance Coverage by Age in Haring
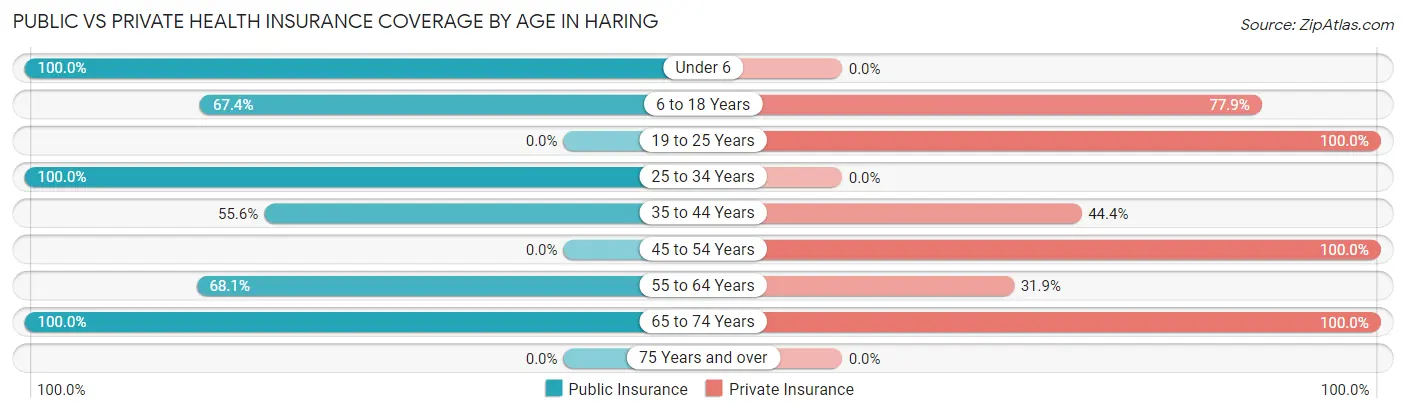
| Age Bracket | Public Insurance | Private Insurance |
| Under 6 | 14 (100.0%) | 0 (0.0%) |
| 6 to 18 Years | 58 (67.4%) | 67 (77.9%) |
| 19 to 25 Years | 0 (0.0%) | 26 (100.0%) |
| 25 to 34 Years | 22 (100.0%) | 0 (0.0%) |
| 35 to 44 Years | 40 (55.6%) | 32 (44.4%) |
| 45 to 54 Years | 0 (0.0%) | 44 (100.0%) |
| 55 to 64 Years | 32 (68.1%) | 15 (31.9%) |
| 65 to 74 Years | 14 (100.0%) | 14 (100.0%) |
| 75 Years and over | 0 (0.0%) | 0 (0.0%) |
| Total | 180 (55.4%) | 198 (60.9%) |
Disability Status by Sex by Age in Haring
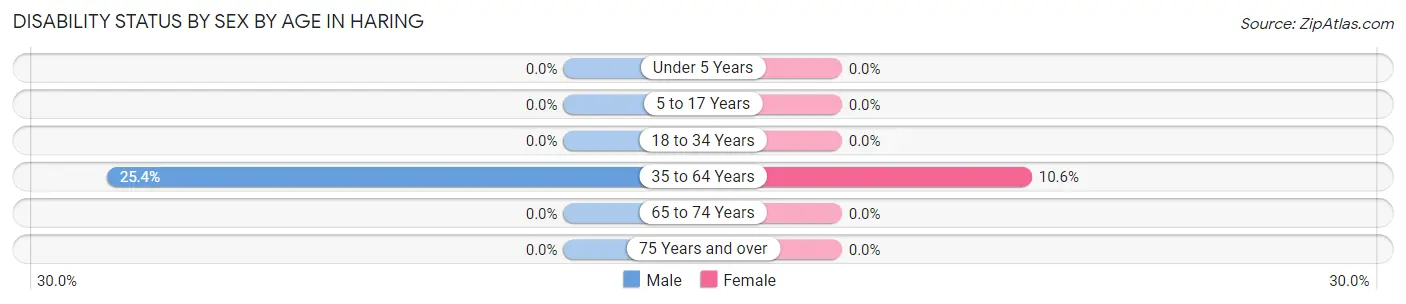
| Age Bracket | Male | Female |
| Under 5 Years | 0 (0.0%) | 0 (0.0%) |
| 5 to 17 Years | 0 (0.0%) | 0 (0.0%) |
| 18 to 34 Years | 0 (0.0%) | 0 (0.0%) |
| 35 to 64 Years | 15 (25.4%) | 11 (10.6%) |
| 65 to 74 Years | 0 (0.0%) | 0 (0.0%) |
| 75 Years and over | 0 (0.0%) | 0 (0.0%) |
Disability Class by Sex by Age in Haring
Disability Class: Hearing Difficulty
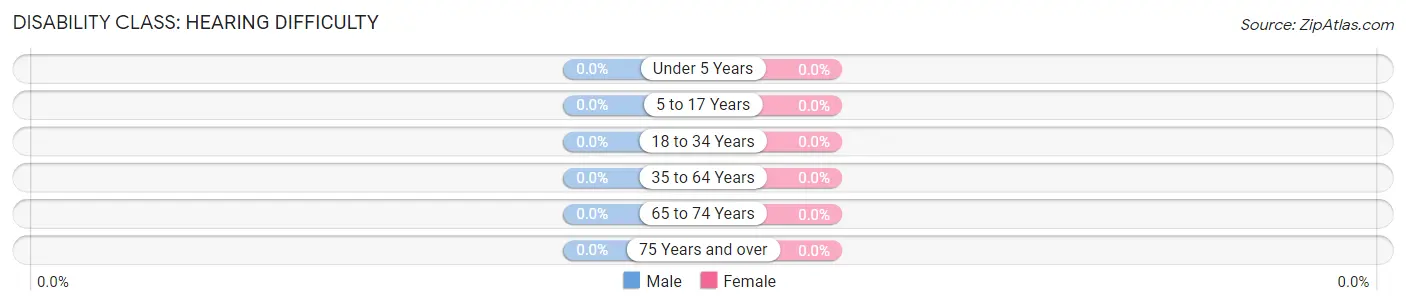
| Age Bracket | Male | Female |
| Under 5 Years | 0 (0.0%) | 0 (0.0%) |
| 5 to 17 Years | 0 (0.0%) | 0 (0.0%) |
| 18 to 34 Years | 0 (0.0%) | 0 (0.0%) |
| 35 to 64 Years | 0 (0.0%) | 0 (0.0%) |
| 65 to 74 Years | 0 (0.0%) | 0 (0.0%) |
| 75 Years and over | 0 (0.0%) | 0 (0.0%) |
Disability Class: Vision Difficulty

| Age Bracket | Male | Female |
| Under 5 Years | 0 (0.0%) | 0 (0.0%) |
| 5 to 17 Years | 0 (0.0%) | 0 (0.0%) |
| 18 to 34 Years | 0 (0.0%) | 0 (0.0%) |
| 35 to 64 Years | 0 (0.0%) | 0 (0.0%) |
| 65 to 74 Years | 0 (0.0%) | 0 (0.0%) |
| 75 Years and over | 0 (0.0%) | 0 (0.0%) |
Disability Class: Cognitive Difficulty
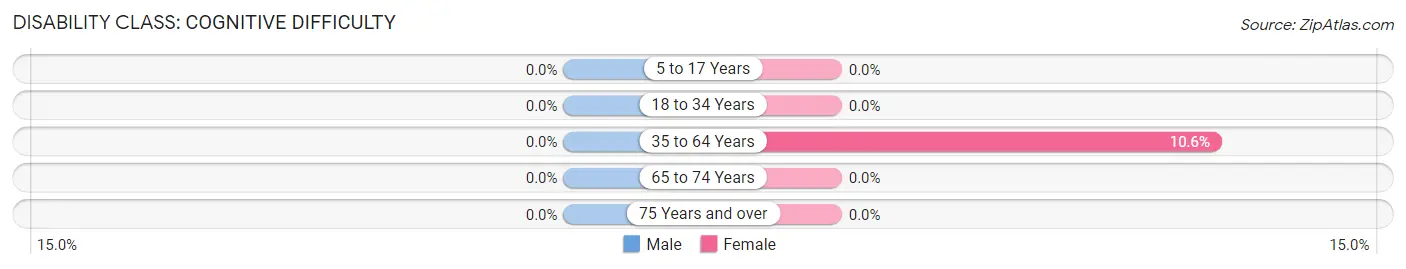
| Age Bracket | Male | Female |
| 5 to 17 Years | 0 (0.0%) | 0 (0.0%) |
| 18 to 34 Years | 0 (0.0%) | 0 (0.0%) |
| 35 to 64 Years | 0 (0.0%) | 11 (10.6%) |
| 65 to 74 Years | 0 (0.0%) | 0 (0.0%) |
| 75 Years and over | 0 (0.0%) | 0 (0.0%) |
Disability Class: Ambulatory Difficulty
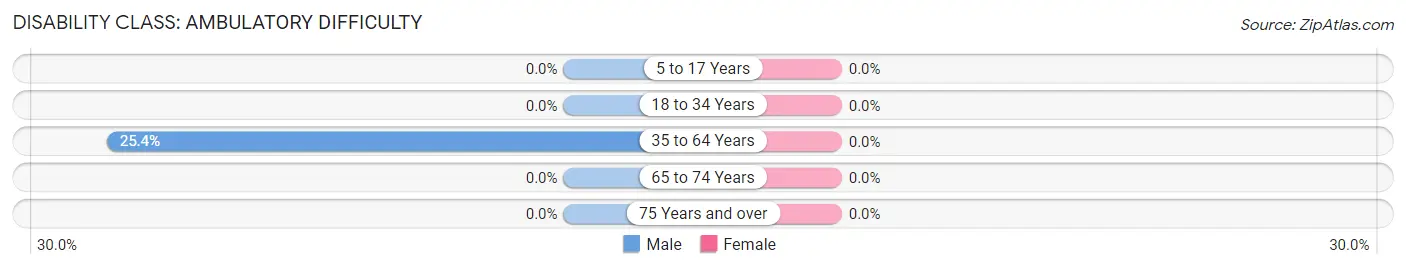
| Age Bracket | Male | Female |
| 5 to 17 Years | 0 (0.0%) | 0 (0.0%) |
| 18 to 34 Years | 0 (0.0%) | 0 (0.0%) |
| 35 to 64 Years | 15 (25.4%) | 0 (0.0%) |
| 65 to 74 Years | 0 (0.0%) | 0 (0.0%) |
| 75 Years and over | 0 (0.0%) | 0 (0.0%) |
Disability Class: Self-Care Difficulty
| Age Bracket | Male | Female |
| 5 to 17 Years | 0 (0.0%) | 0 (0.0%) |
| 18 to 34 Years | 0 (0.0%) | 0 (0.0%) |
| 35 to 64 Years | 0 (0.0%) | 0 (0.0%) |
| 65 to 74 Years | 0 (0.0%) | 0 (0.0%) |
| 75 Years and over | 0 (0.0%) | 0 (0.0%) |
Technology Access in Haring
Computing Device Access in Haring
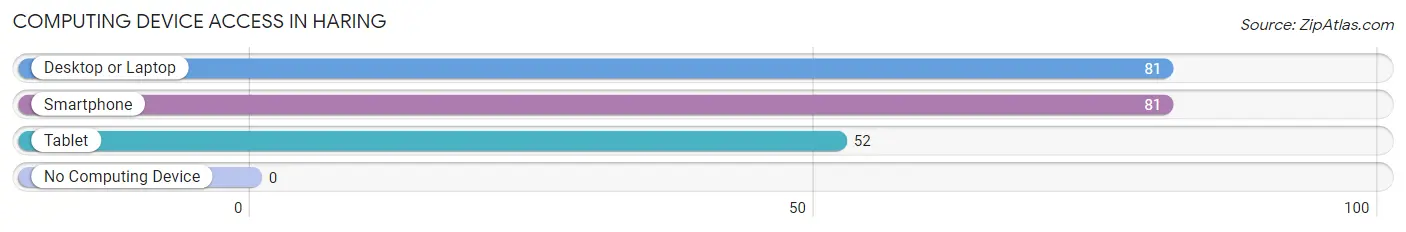
| Device Type | # Households | % Households |
| Desktop or Laptop | 81 | 100.0% |
| Smartphone | 81 | 100.0% |
| Tablet | 52 | 64.2% |
| No Computing Device | 0 | 0.0% |
| Total | 81 | 100.0% |
Internet Access in Haring
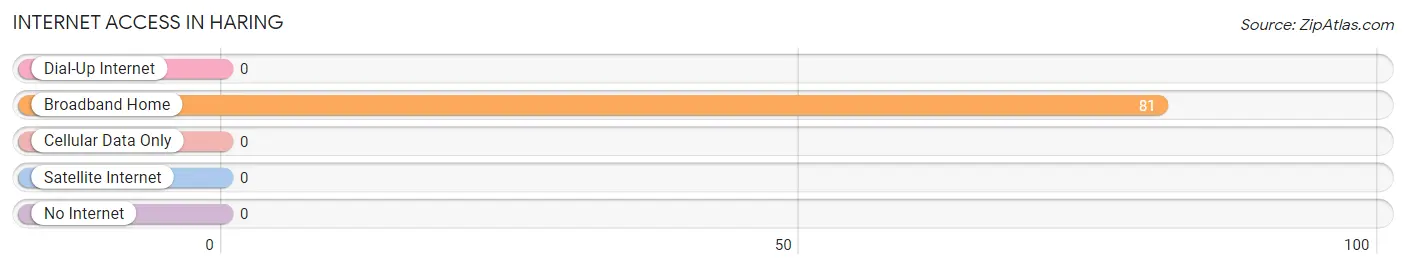
| Internet Type | # Households | % Households |
| Dial-Up Internet | 0 | 0.0% |
| Broadband Home | 81 | 100.0% |
| Cellular Data Only | 0 | 0.0% |
| Satellite Internet | 0 | 0.0% |
| No Internet | 0 | 0.0% |
| Total | 81 | 100.0% |
Haring Summary
Haring is a small town located in the western part of Michigan, in the United States. It is situated in the county of Oceana, and is part of the Grand Rapids-Muskegon-Holland Combined Statistical Area. The town has a population of approximately 1,500 people, and is known for its rural charm and small-town atmosphere.
Geography
Haring is located in the western part of Michigan, in the county of Oceana. It is situated on the banks of the Muskegon River, and is surrounded by rolling hills and farmland. The town is located approximately 25 miles from the city of Grand Rapids, and is part of the Grand Rapids-Muskegon-Holland Combined Statistical Area.
The town of Haring is situated on a flat plain, with an elevation of approximately 890 feet above sea level. The climate in the area is generally mild, with temperatures ranging from the mid-30s in the winter to the mid-80s in the summer. The town receives an average of 36 inches of precipitation per year, with most of it falling in the form of snow during the winter months.
Economy
The economy of Haring is largely based on agriculture and tourism. The town is home to several farms, which produce a variety of crops, including corn, soybeans, wheat, and hay. The town also has several small businesses, including a grocery store, a hardware store, and a few restaurants.
Tourism is also an important part of the local economy. The town is home to several parks and recreational areas, including the Muskegon River State Park, which offers camping, fishing, and hiking opportunities. The town also hosts several festivals and events throughout the year, including the annual Haring Days Festival, which celebrates the town’s history and culture.
Demographics
As of the 2010 census, the population of Haring was 1,500 people. The racial makeup of the town was 95.3% White, 0.7% African American, 0.7% Native American, 0.3% Asian, 0.3% from other races, and 2.7% from two or more races. Hispanic or Latino of any race were 1.3% of the population.
The median household income in Haring was $37,500, and the median family income was $45,000. The per capita income for the town was $18,000. About 11.7% of families and 14.3% of the population were below the poverty line, including 18.2% of those under age 18 and 8.3% of those age 65 or over.
Conclusion
Haring is a small town located in the western part of Michigan, in the United States. It is situated in the county of Oceana, and is part of the Grand Rapids-Muskegon-Holland Combined Statistical Area. The town has a population of approximately 1,500 people, and is known for its rural charm and small-town atmosphere. The economy of Haring is largely based on agriculture and tourism, and the town is home to several farms, businesses, and recreational areas. The racial makeup of the town is predominantly White, with a small percentage of African American, Native American, and Asian residents. The median household income in Haring is $37,500, and the per capita income is $18,000.
Common Questions
What is Per Capita Income in Haring?
Per Capita income in Haring is $21,799.
What is the Median Family Income in Haring?
Median Family Income in Haring is $63,833.
What is the Median Household income in Haring?
Median Household Income in Haring is $72,548.
What is Inequality or Gini Index in Haring?
Inequality or Gini Index in Haring is 0.23.
What is the Total Population of Haring?
Total Population of Haring is 325.
What is the Total Male Population of Haring?
Total Male Population of Haring is 132.
What is the Total Female Population of Haring?
Total Female Population of Haring is 193.
What is the Ratio of Males per 100 Females in Haring?
There are 68.39 Males per 100 Females in Haring.
What is the Ratio of Females per 100 Males in Haring?
There are 146.21 Females per 100 Males in Haring.
What is the Median Population Age in Haring?
Median Population Age in Haring is 39.2 Years.
What is the Average Family Size in Haring
Average Family Size in Haring is 4.4 People.
What is the Average Household Size in Haring
Average Household Size in Haring is 4.0 People.
How Large is the Labor Force in Haring?
There are 156 People in the Labor Forcein in Haring.
What is the Percentage of People in the Labor Force in Haring?
59.5% of People are in the Labor Force in Haring.