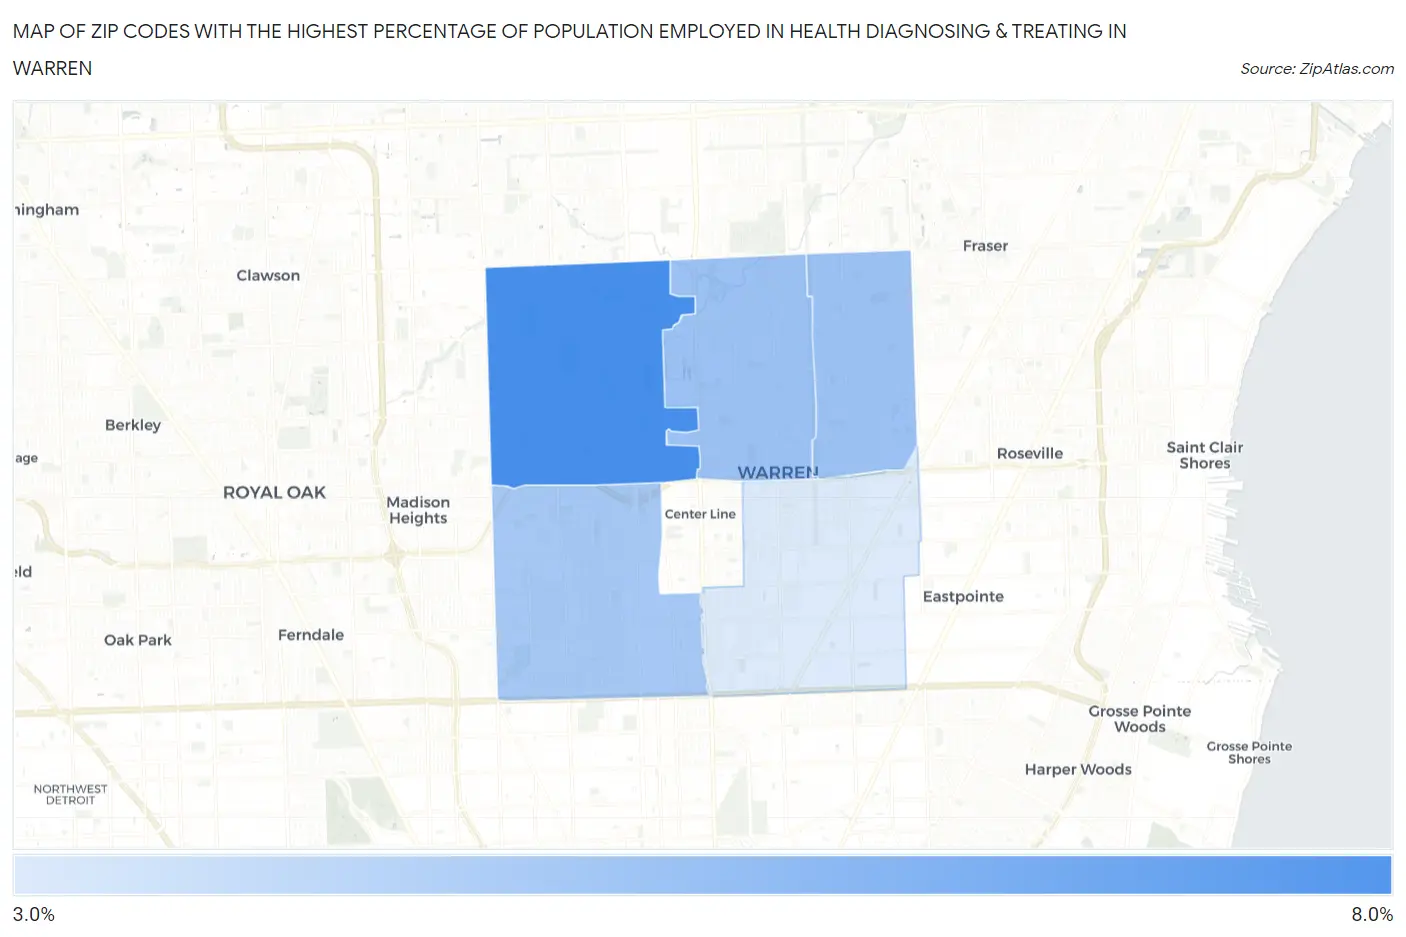
Zip Codes with the Highest Percentage of Population Employed in Health Diagnosing & Treating in Warren, MI
RELATED REPORTS & OPTIONS
Health Diagnosing & Treating
Warren
Compare Zip Codes
Map of Zip Codes with the Highest Percentage of Population Employed in Health Diagnosing & Treating in Warren
3.4%
7.6%
Zip Codes with the Highest Percentage of Population Employed in Health Diagnosing & Treating in Warren, MI
| Zip Code | % Employed | vs State | vs National | |
| 1. | 48092 | 7.6% | 6.6%(+0.946)#252 | 6.2%(+1.35)#8,536 |
| 2. | 48088 | 5.2% | 6.6%(-1.41)#558 | 6.2%(-1.01)#16,805 |
| 3. | 48093 | 5.2% | 6.6%(-1.45)#561 | 6.2%(-1.05)#16,959 |
| 4. | 48091 | 5.0% | 6.6%(-1.66)#588 | 6.2%(-1.26)#17,799 |
| 5. | 48089 | 3.4% | 6.6%(-3.21)#785 | 6.2%(-2.81)#23,097 |
1
Common Questions
What are the Top 3 Zip Codes with the Highest Percentage of Population Employed in Health Diagnosing & Treating in Warren, MI?
Top 3 Zip Codes with the Highest Percentage of Population Employed in Health Diagnosing & Treating in Warren, MI are:
What zip code has the Highest Percentage of Population Employed in Health Diagnosing & Treating in Warren, MI?
48092 has the Highest Percentage of Population Employed in Health Diagnosing & Treating in Warren, MI with 7.6%.
What is the Percentage of Population Employed in Health Diagnosing & Treating in Warren, MI?
Percentage of Population Employed in Health Diagnosing & Treating in Warren is 5.2%.
What is the Percentage of Population Employed in Health Diagnosing & Treating in Michigan?
Percentage of Population Employed in Health Diagnosing & Treating in Michigan is 6.6%.
What is the Percentage of Population Employed in Health Diagnosing & Treating in the United States?
Percentage of Population Employed in Health Diagnosing & Treating in the United States is 6.2%.