Byron Center, MI Map & Demographics
Byron Center Map
Byron Center Overview
$39,981
PER CAPITA INCOME
$111,122
AVG FAMILY INCOME
$102,376
AVG HOUSEHOLD INCOME
70.6%
WAGE / INCOME GAP [ % ]
29.4¢/ $1
WAGE / INCOME GAP [ $ ]
0.40
INEQUALITY / GINI INDEX
6,988
TOTAL POPULATION
3,511
MALE POPULATION
3,477
FEMALE POPULATION
100.98
MALES / 100 FEMALES
99.03
FEMALES / 100 MALES
41.2
MEDIAN AGE
3.3
AVG FAMILY SIZE
3.0
AVG HOUSEHOLD SIZE
3,418
LABOR FORCE [ PEOPLE ]
64.8%
PERCENT IN LABOR FORCE
2.2%
UNEMPLOYMENT RATE
Byron Center Zip Codes
Byron Center Area Codes
Income in Byron Center
Income Overview in Byron Center
Per Capita Income in Byron Center is $39,981, while median incomes of families and households are $111,122 and $102,376 respectively.
| Characteristic | Number | Measure |
| Per Capita Income | 6,988 | $39,981 |
| Median Family Income | 1,952 | $111,122 |
| Mean Family Income | 1,952 | $136,243 |
| Median Household Income | 2,284 | $102,376 |
| Mean Household Income | 2,284 | $121,227 |
| Income Deficit | 1,952 | $0 |
| Wage / Income Gap (%) | 6,988 | 70.60% |
| Wage / Income Gap ($) | 6,988 | 29.40¢ per $1 |
| Gini / Inequality Index | 6,988 | 0.40 |
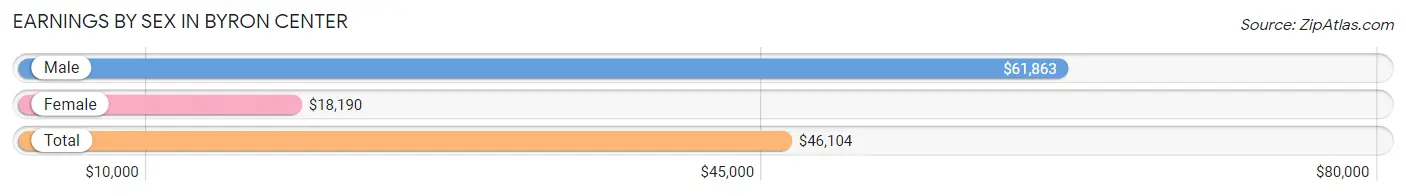
Earnings by Sex in Byron Center
Average Earnings in Byron Center are $46,104, $61,863 for men and $18,190 for women, a difference of 70.6%.
| Sex | Number | Average Earnings |
| Male | 2,187 (58.1%) | $61,863 |
| Female | 1,580 (41.9%) | $18,190 |
| Total | 3,767 (100.0%) | $46,104 |
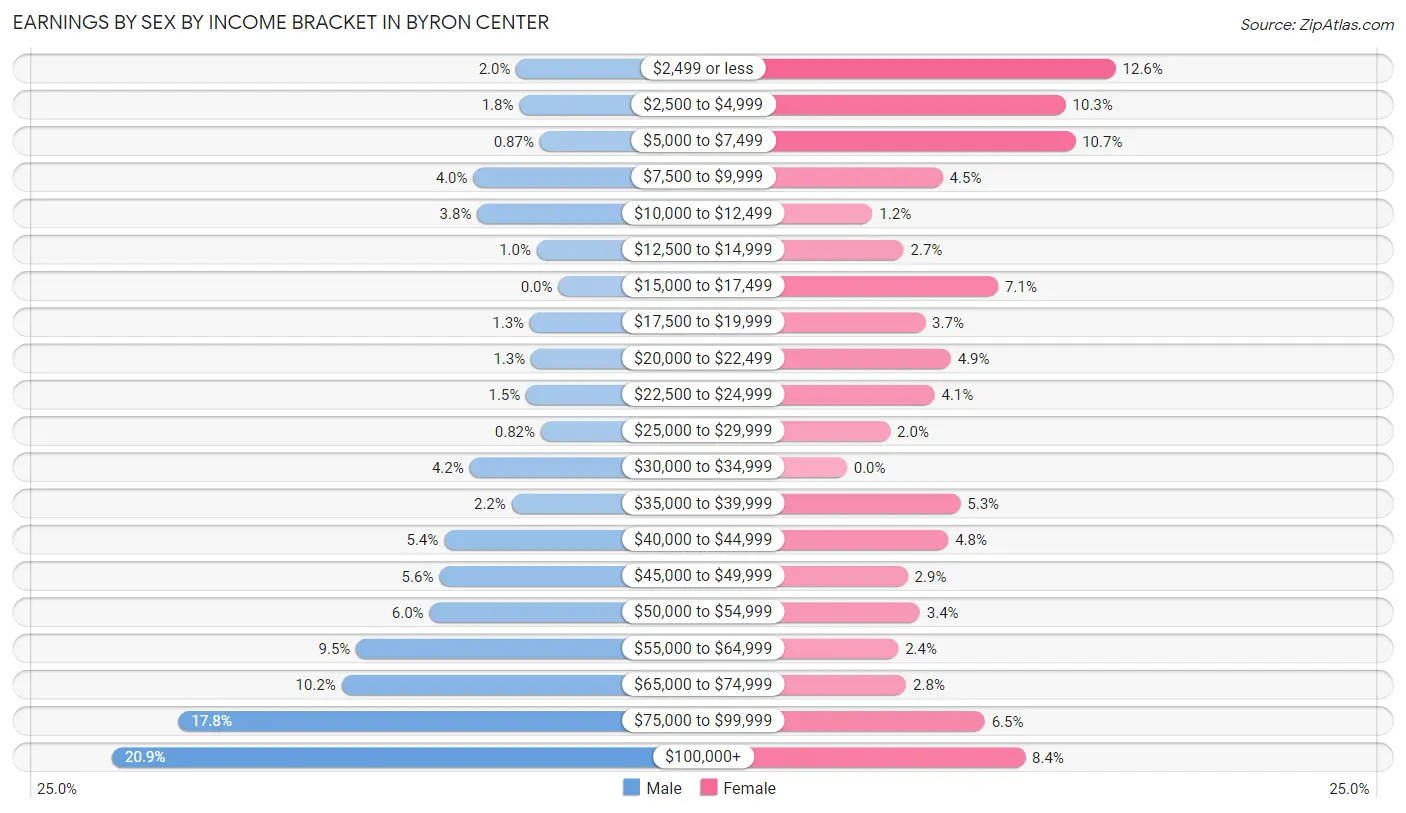
Earnings by Sex by Income Bracket in Byron Center
The most common earnings brackets in Byron Center are $100,000+ for men (457 | 20.9%) and $2,499 or less for women (199 | 12.6%).
| Income | Male | Female |
| $2,499 or less | 43 (2.0%) | 199 (12.6%) |
| $2,500 to $4,999 | 40 (1.8%) | 162 (10.2%) |
| $5,000 to $7,499 | 19 (0.9%) | 169 (10.7%) |
| $7,500 to $9,999 | 87 (4.0%) | 71 (4.5%) |
| $10,000 to $12,499 | 83 (3.8%) | 19 (1.2%) |
| $12,500 to $14,999 | 22 (1.0%) | 42 (2.7%) |
| $15,000 to $17,499 | 0 (0.0%) | 112 (7.1%) |
| $17,500 to $19,999 | 29 (1.3%) | 58 (3.7%) |
| $20,000 to $22,499 | 28 (1.3%) | 77 (4.9%) |
| $22,500 to $24,999 | 33 (1.5%) | 65 (4.1%) |
| $25,000 to $29,999 | 18 (0.8%) | 32 (2.0%) |
| $30,000 to $34,999 | 91 (4.2%) | 0 (0.0%) |
| $35,000 to $39,999 | 48 (2.2%) | 84 (5.3%) |
| $40,000 to $44,999 | 117 (5.3%) | 75 (4.8%) |
| $45,000 to $49,999 | 122 (5.6%) | 45 (2.9%) |
| $50,000 to $54,999 | 132 (6.0%) | 54 (3.4%) |
| $55,000 to $64,999 | 207 (9.5%) | 38 (2.4%) |
| $65,000 to $74,999 | 222 (10.2%) | 44 (2.8%) |
| $75,000 to $99,999 | 389 (17.8%) | 102 (6.5%) |
| $100,000+ | 457 (20.9%) | 132 (8.4%) |
| Total | 2,187 (100.0%) | 1,580 (100.0%) |
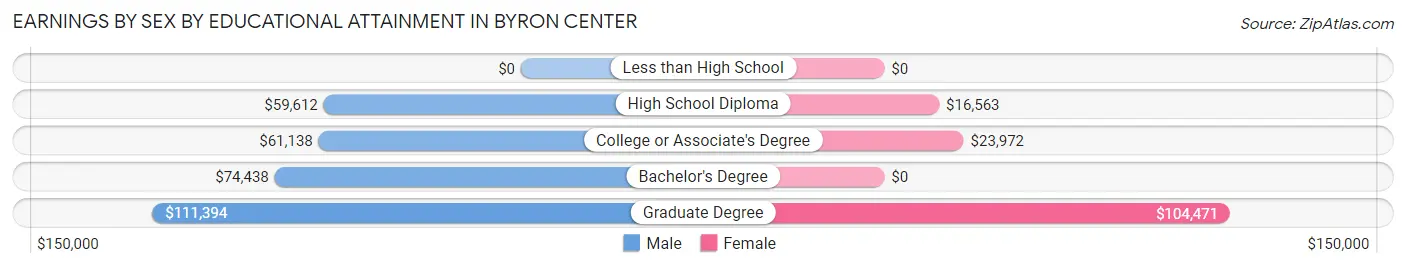
Earnings by Sex by Educational Attainment in Byron Center
Average earnings in Byron Center are $67,051 for men and $25,391 for women, a difference of 62.1%. Men with an educational attainment of graduate degree enjoy the highest average annual earnings of $111,394, while those with high school diploma education earn the least with $59,612. Women with an educational attainment of graduate degree earn the most with the average annual earnings of $104,471, while those with high school diploma education have the smallest earnings of $16,563.
| Educational Attainment | Male Income | Female Income |
| Less than High School | - | - |
| High School Diploma | $59,612 | $16,563 |
| College or Associate's Degree | $61,138 | $23,972 |
| Bachelor's Degree | $74,438 | $0 |
| Graduate Degree | $111,394 | $104,471 |
| Total | $67,051 | $25,391 |
Family Income in Byron Center
Family Income Brackets in Byron Center
According to the Byron Center family income data, there are 644 families falling into the $100,000 to $149,999 income range, which is the most common income bracket and makes up 33.0% of all families.
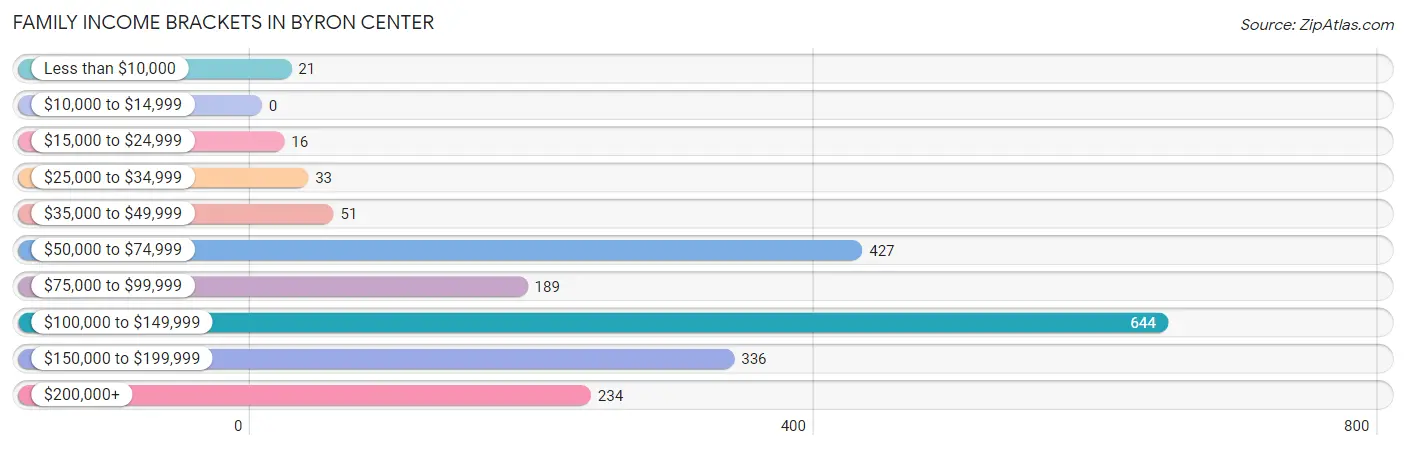
| Income Bracket | # Families | % Families |
| Less than $10,000 | 21 | 1.1% |
| $10,000 to $14,999 | 0 | 0.0% |
| $15,000 to $24,999 | 16 | 0.8% |
| $25,000 to $34,999 | 33 | 1.7% |
| $35,000 to $49,999 | 51 | 2.6% |
| $50,000 to $74,999 | 427 | 21.9% |
| $75,000 to $99,999 | 189 | 9.7% |
| $100,000 to $149,999 | 644 | 33.0% |
| $150,000 to $199,999 | 336 | 17.2% |
| $200,000+ | 234 | 12.0% |
Family Income by Famaliy Size in Byron Center
5-person families (402 | 20.6%) account for the highest median family income in Byron Center with $137,898 per family, while 3-person families (441 | 22.6%) have the highest median income of $45,880 per family member.
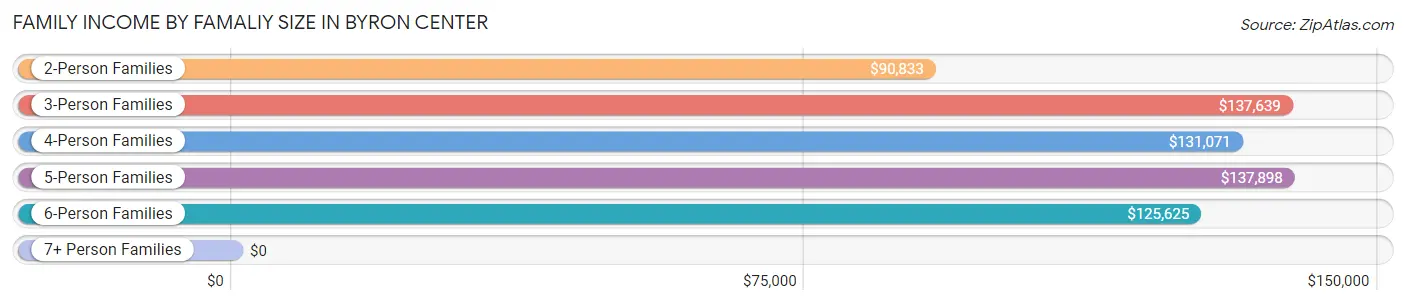
| Income Bracket | # Families | Median Income |
| 2-Person Families | 624 (32.0%) | $90,833 |
| 3-Person Families | 441 (22.6%) | $137,639 |
| 4-Person Families | 416 (21.3%) | $131,071 |
| 5-Person Families | 402 (20.6%) | $137,898 |
| 6-Person Families | 69 (3.5%) | $125,625 |
| 7+ Person Families | 0 (0.0%) | $0 |
| Total | 1,952 (100.0%) | $111,122 |
Family Income by Number of Earners in Byron Center
The median family income in Byron Center is $111,122, with families comprising 3+ earners (397) having the highest median family income of $144,280, while families with no earners (215) have the lowest median family income of $55,299, accounting for 20.3% and 11.0% of families, respectively.
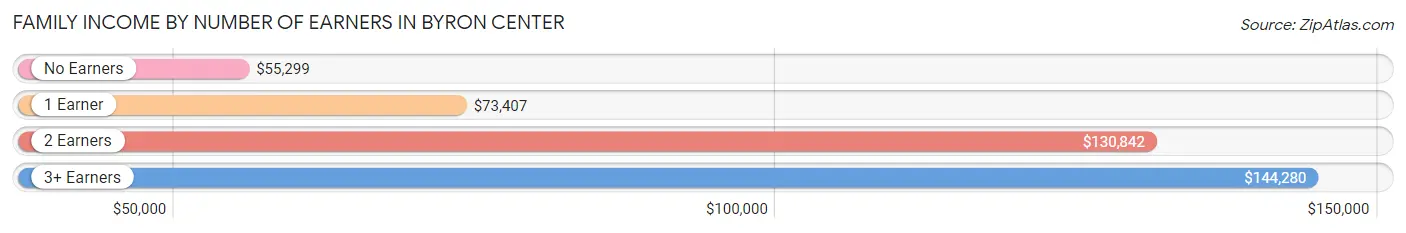
| Number of Earners | # Families | Median Income |
| No Earners | 215 (11.0%) | $55,299 |
| 1 Earner | 505 (25.9%) | $73,407 |
| 2 Earners | 835 (42.8%) | $130,842 |
| 3+ Earners | 397 (20.3%) | $144,280 |
| Total | 1,952 (100.0%) | $111,122 |
Household Income in Byron Center
Household Income Brackets in Byron Center
With 667 households falling in the category, the $100,000 to $149,999 income range is the most frequent in Byron Center, accounting for 29.2% of all households. In contrast, only 37 households (1.6%) fall into the less than $10,000 income bracket, making it the least populous group.
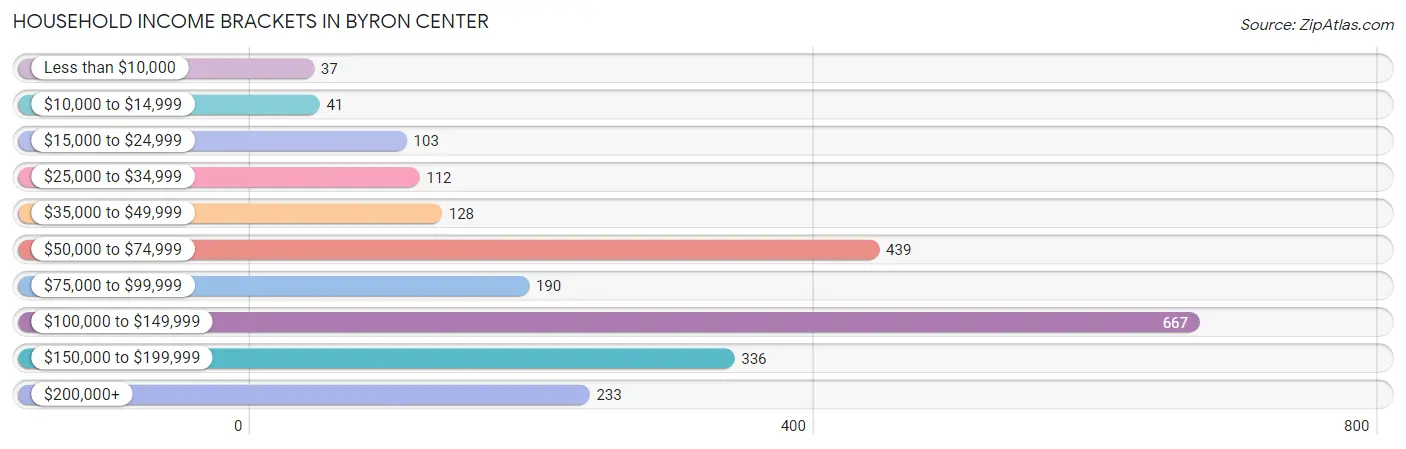
| Income Bracket | # Households | % Households |
| Less than $10,000 | 37 | 1.6% |
| $10,000 to $14,999 | 41 | 1.8% |
| $15,000 to $24,999 | 103 | 4.5% |
| $25,000 to $34,999 | 112 | 4.9% |
| $35,000 to $49,999 | 128 | 5.6% |
| $50,000 to $74,999 | 439 | 19.2% |
| $75,000 to $99,999 | 190 | 8.3% |
| $100,000 to $149,999 | 667 | 29.2% |
| $150,000 to $199,999 | 336 | 14.7% |
| $200,000+ | 233 | 10.2% |
Household Income by Householder Age in Byron Center
The median household income in Byron Center is $102,376, with the highest median household income of $127,250 found in the 45 to 64 years age bracket for the primary householder. A total of 800 households (35.0%) fall into this category. Meanwhile, the 15 to 24 years age bracket for the primary householder has the lowest median household income of $0, with 10 households (0.4%) in this group.
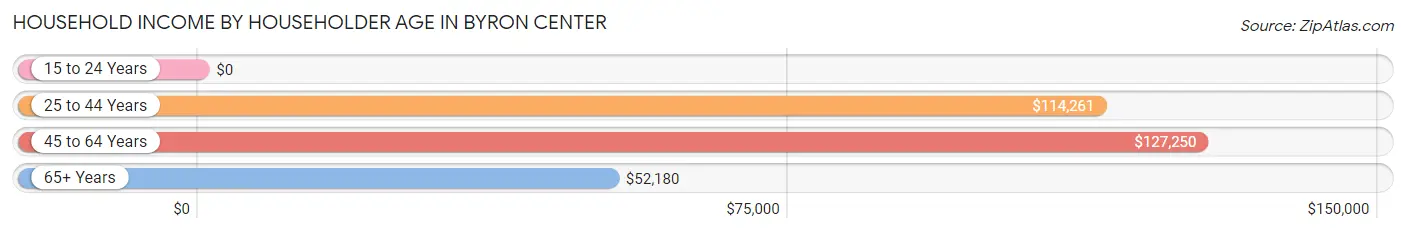
| Income Bracket | # Households | Median Income |
| 15 to 24 Years | 10 (0.4%) | $0 |
| 25 to 44 Years | 729 (31.9%) | $114,261 |
| 45 to 64 Years | 800 (35.0%) | $127,250 |
| 65+ Years | 745 (32.6%) | $52,180 |
| Total | 2,284 (100.0%) | $102,376 |
Poverty in Byron Center
Income Below Poverty by Sex and Age in Byron Center
With 1.1% poverty level for males and 3.1% for females among the residents of Byron Center, 65 to 74 year old males and 16 and 17 year old females are the most vulnerable to poverty, with 22 males (5.3%) and 28 females (9.3%) in their respective age groups living below the poverty level.
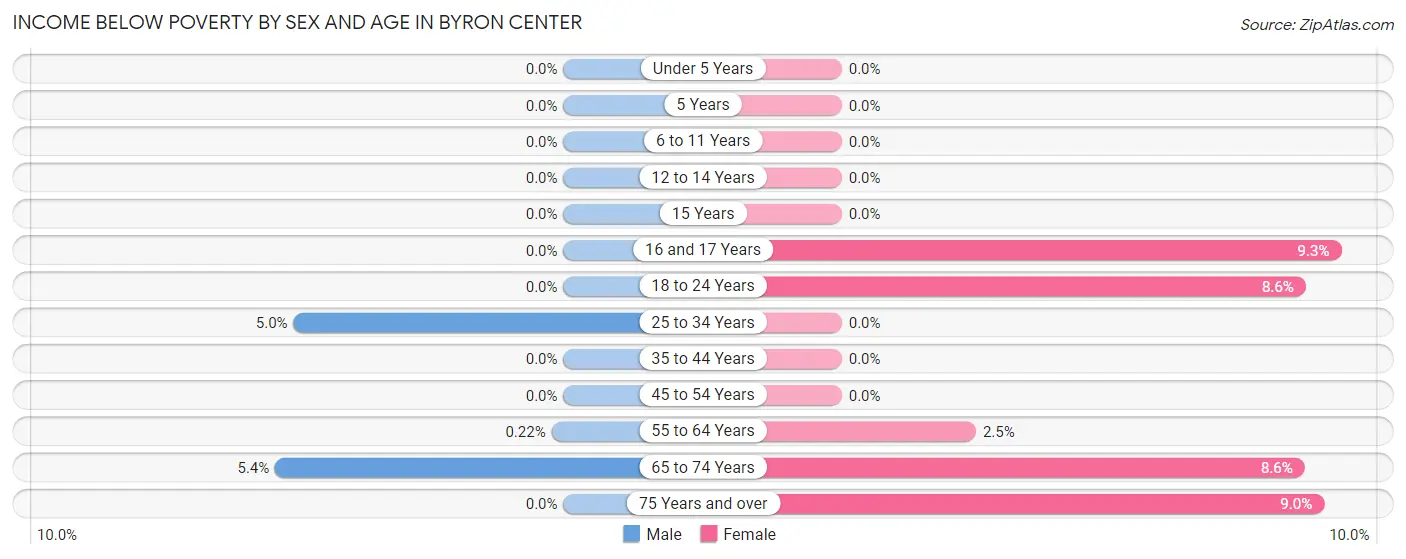
| Age Bracket | Male | Female |
| Under 5 Years | 0 (0.0%) | 0 (0.0%) |
| 5 Years | 0 (0.0%) | 0 (0.0%) |
| 6 to 11 Years | 0 (0.0%) | 0 (0.0%) |
| 12 to 14 Years | 0 (0.0%) | 0 (0.0%) |
| 15 Years | 0 (0.0%) | 0 (0.0%) |
| 16 and 17 Years | 0 (0.0%) | 28 (9.3%) |
| 18 to 24 Years | 0 (0.0%) | 13 (8.6%) |
| 25 to 34 Years | 17 (5.0%) | 0 (0.0%) |
| 35 to 44 Years | 0 (0.0%) | 0 (0.0%) |
| 45 to 54 Years | 0 (0.0%) | 0 (0.0%) |
| 55 to 64 Years | 1 (0.2%) | 9 (2.5%) |
| 65 to 74 Years | 22 (5.3%) | 39 (8.6%) |
| 75 Years and over | 0 (0.0%) | 17 (8.9%) |
| Total | 40 (1.1%) | 106 (3.1%) |
Income Above Poverty by Sex and Age in Byron Center
According to the poverty statistics in Byron Center, males aged under 5 years and females aged under 5 years are the age groups that are most secure financially, with 100.0% of males and 100.0% of females in these age groups living above the poverty line.
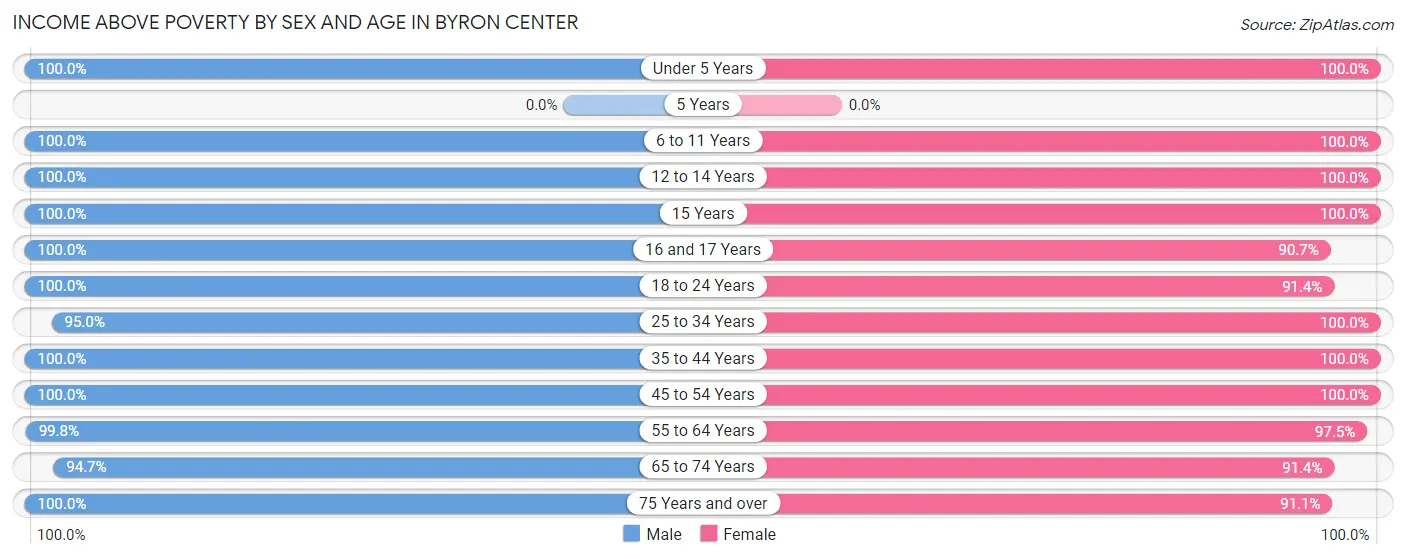
| Age Bracket | Male | Female |
| Under 5 Years | 163 (100.0%) | 298 (100.0%) |
| 5 Years | 0 (0.0%) | 0 (0.0%) |
| 6 to 11 Years | 393 (100.0%) | 217 (100.0%) |
| 12 to 14 Years | 269 (100.0%) | 213 (100.0%) |
| 15 Years | 46 (100.0%) | 98 (100.0%) |
| 16 and 17 Years | 91 (100.0%) | 274 (90.7%) |
| 18 to 24 Years | 214 (100.0%) | 138 (91.4%) |
| 25 to 34 Years | 322 (95.0%) | 204 (100.0%) |
| 35 to 44 Years | 453 (100.0%) | 604 (100.0%) |
| 45 to 54 Years | 463 (100.0%) | 369 (100.0%) |
| 55 to 64 Years | 455 (99.8%) | 352 (97.5%) |
| 65 to 74 Years | 389 (94.7%) | 415 (91.4%) |
| 75 Years and over | 213 (100.0%) | 173 (91.0%) |
| Total | 3,471 (98.9%) | 3,355 (96.9%) |
Income Below Poverty Among Married-Couple Families in Byron Center
The poverty statistics for married-couple families in Byron Center show that 1.1% or 21 of the total 1,845 families live below the poverty line. Families with no children have the highest poverty rate of 2.8%, comprising of 21 families. On the other hand, families with 1 or 2 children have the lowest poverty rate of 0.0%, which includes 0 families.
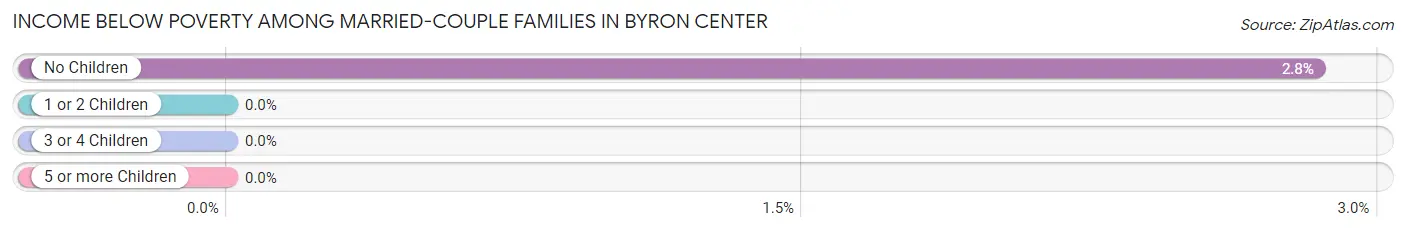
| Children | Above Poverty | Below Poverty |
| No Children | 719 (97.2%) | 21 (2.8%) |
| 1 or 2 Children | 835 (100.0%) | 0 (0.0%) |
| 3 or 4 Children | 270 (100.0%) | 0 (0.0%) |
| 5 or more Children | 0 (0.0%) | 0 (0.0%) |
| Total | 1,824 (98.9%) | 21 (1.1%) |
Income Below Poverty Among Single-Parent Households in Byron Center
| Children | Single Father | Single Mother |
| No Children | 0 (0.0%) | 0 (0.0%) |
| 1 or 2 Children | 0 (0.0%) | 0 (0.0%) |
| 3 or 4 Children | 0 (0.0%) | 0 (0.0%) |
| 5 or more Children | 0 (0.0%) | 0 (0.0%) |
| Total | 0 (0.0%) | 0 (0.0%) |
Income Below Poverty Among Married-Couple vs Single-Parent Households in Byron Center
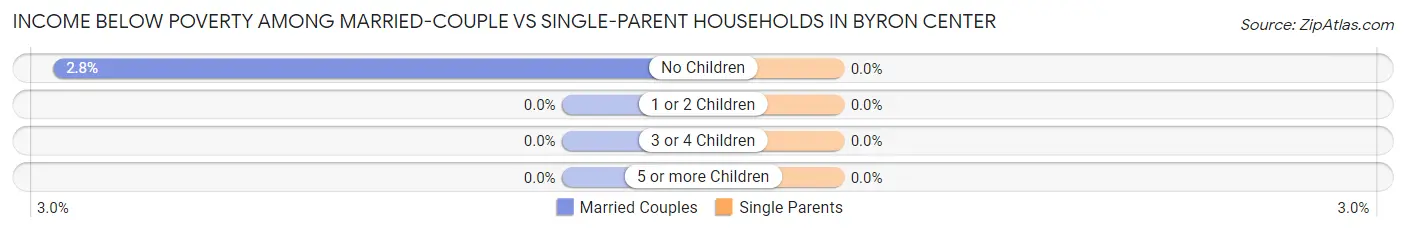
| Children | Married-Couple Families | Single-Parent Households |
| No Children | 21 (2.8%) | 0 (0.0%) |
| 1 or 2 Children | 0 (0.0%) | 0 (0.0%) |
| 3 or 4 Children | 0 (0.0%) | 0 (0.0%) |
| 5 or more Children | 0 (0.0%) | 0 (0.0%) |
| Total | 21 (1.1%) | 0 (0.0%) |
Race in Byron Center
The most populous races in Byron Center are White / Caucasian (6,495 | 92.9%), Asian (247 | 3.5%), and Two or more Races (226 | 3.2%).
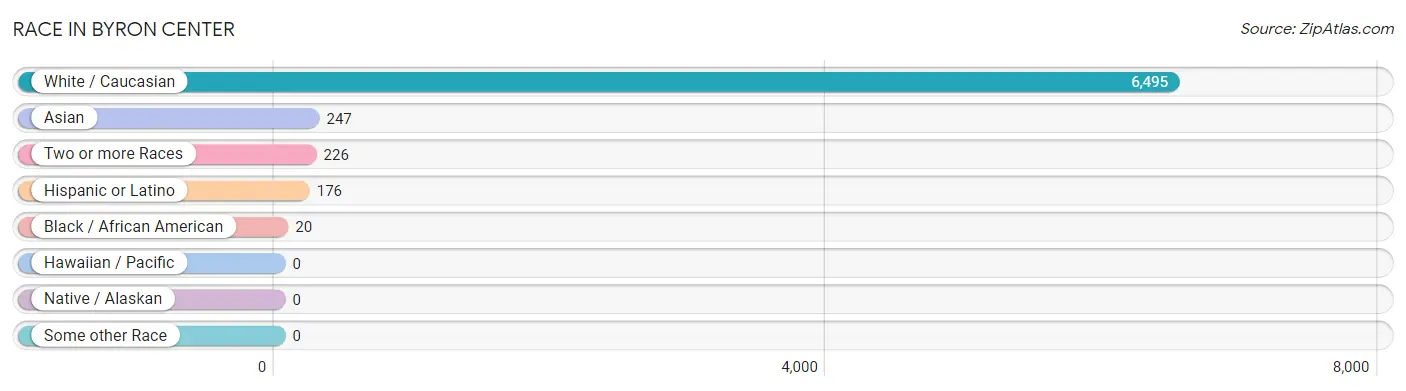
| Race | # Population | % Population |
| Asian | 247 | 3.5% |
| Black / African American | 20 | 0.3% |
| Hawaiian / Pacific | 0 | 0.0% |
| Hispanic or Latino | 176 | 2.5% |
| Native / Alaskan | 0 | 0.0% |
| White / Caucasian | 6,495 | 92.9% |
| Two or more Races | 226 | 3.2% |
| Some other Race | 0 | 0.0% |
| Total | 6,988 | 100.0% |
Ancestry in Byron Center
The most populous ancestries reported in Byron Center are Dutch (2,961 | 42.4%), German (1,528 | 21.9%), English (639 | 9.1%), Norwegian (305 | 4.4%), and Polish (280 | 4.0%), together accounting for 81.8% of all Byron Center residents.
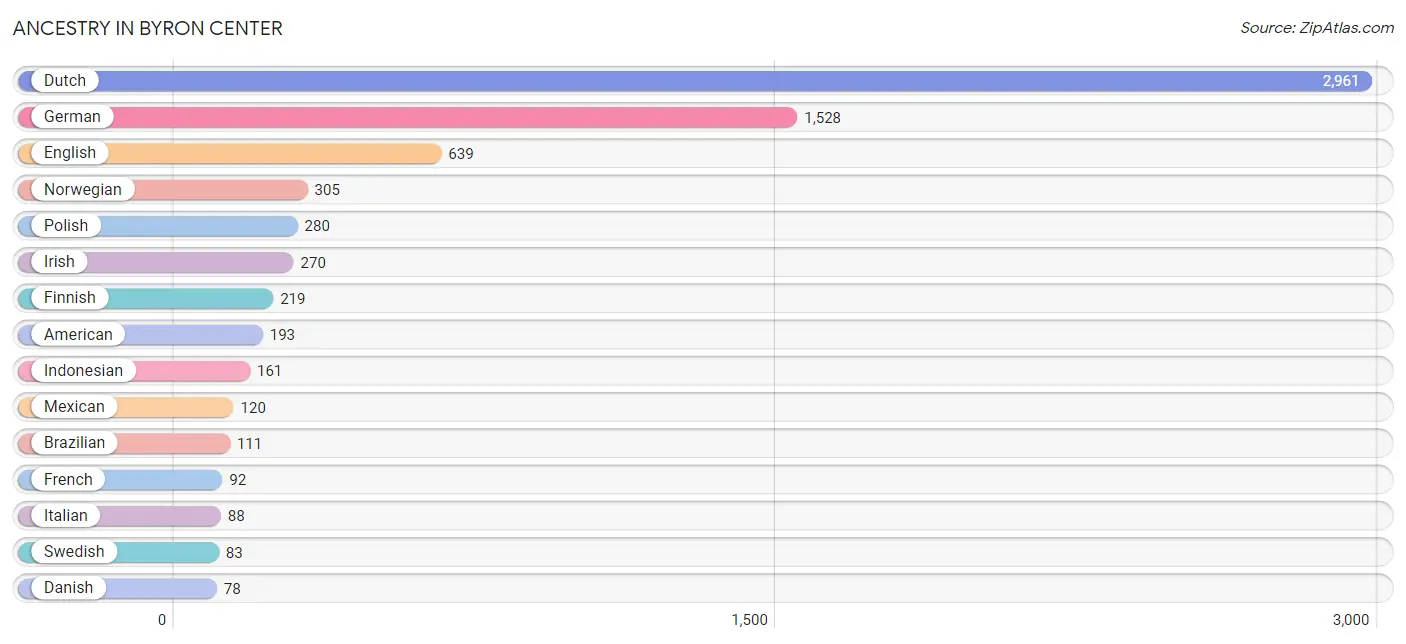
| Ancestry | # Population | % Population |
| American | 193 | 2.8% |
| Arab | 71 | 1.0% |
| Belgian | 20 | 0.3% |
| Bhutanese | 56 | 0.8% |
| Brazilian | 111 | 1.6% |
| British | 73 | 1.0% |
| Burmese | 25 | 0.4% |
| Cuban | 56 | 0.8% |
| Danish | 78 | 1.1% |
| Dutch | 2,961 | 42.4% |
| English | 639 | 9.1% |
| European | 67 | 1.0% |
| Finnish | 219 | 3.1% |
| French | 92 | 1.3% |
| French American Indian | 11 | 0.2% |
| German | 1,528 | 21.9% |
| Greek | 23 | 0.3% |
| Hungarian | 9 | 0.1% |
| Indian (Asian) | 33 | 0.5% |
| Indonesian | 161 | 2.3% |
| Irish | 270 | 3.9% |
| Italian | 88 | 1.3% |
| Lebanese | 12 | 0.2% |
| Lithuanian | 18 | 0.3% |
| Mexican | 120 | 1.7% |
| Norwegian | 305 | 4.4% |
| Palestinian | 42 | 0.6% |
| Pennsylvania German | 48 | 0.7% |
| Polish | 280 | 4.0% |
| Portuguese | 36 | 0.5% |
| Scotch-Irish | 13 | 0.2% |
| Scottish | 26 | 0.4% |
| Swedish | 83 | 1.2% |
| Syrian | 17 | 0.2% |
| Welsh | 41 | 0.6% | View All 35 Rows |
Immigrants in Byron Center
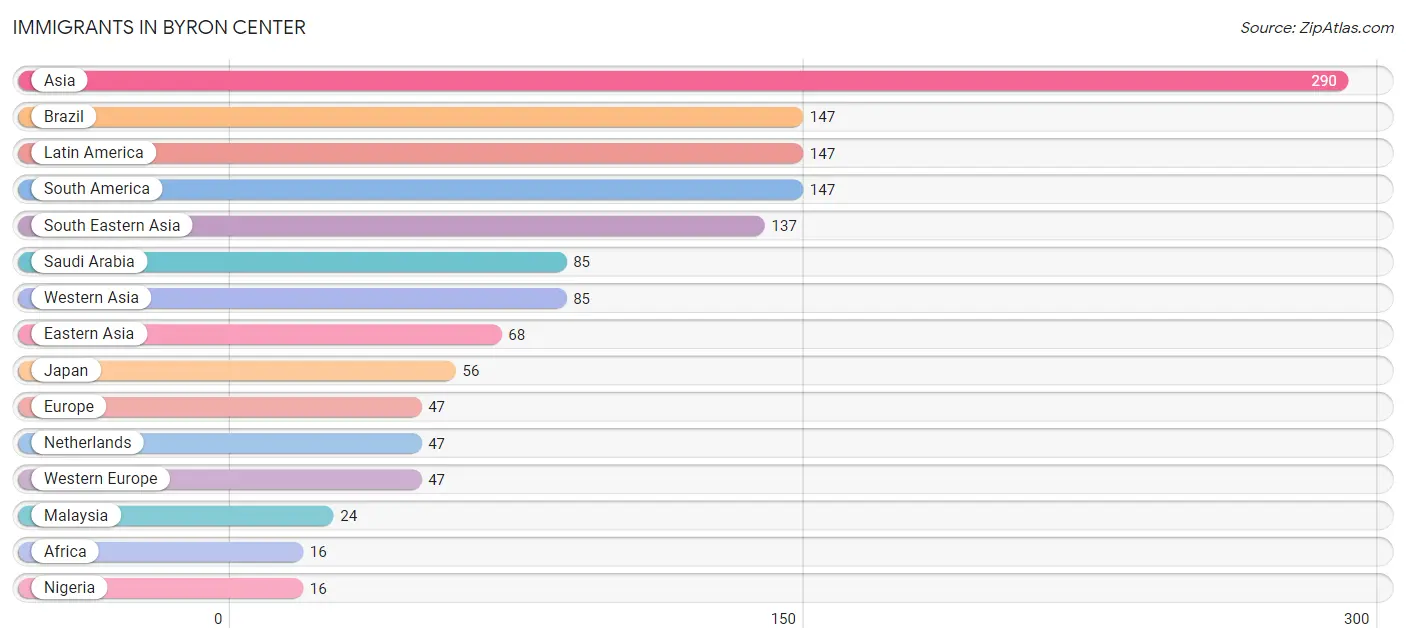
The most numerous immigrant groups reported in Byron Center came from Asia (290 | 4.2%), Brazil (147 | 2.1%), Latin America (147 | 2.1%), South America (147 | 2.1%), and South Eastern Asia (137 | 2.0%), together accounting for 12.4% of all Byron Center residents.
| Immigration Origin | # Population | % Population |
| Africa | 16 | 0.2% |
| Asia | 290 | 4.2% |
| Brazil | 147 | 2.1% |
| Eastern Asia | 68 | 1.0% |
| Europe | 47 | 0.7% |
| Japan | 56 | 0.8% |
| Korea | 12 | 0.2% |
| Latin America | 147 | 2.1% |
| Malaysia | 24 | 0.3% |
| Netherlands | 47 | 0.7% |
| Nigeria | 16 | 0.2% |
| Saudi Arabia | 85 | 1.2% |
| South America | 147 | 2.1% |
| South Eastern Asia | 137 | 2.0% |
| Western Africa | 16 | 0.2% |
| Western Asia | 85 | 1.2% |
| Western Europe | 47 | 0.7% | View All 17 Rows |
Sex and Age in Byron Center
Sex and Age in Byron Center
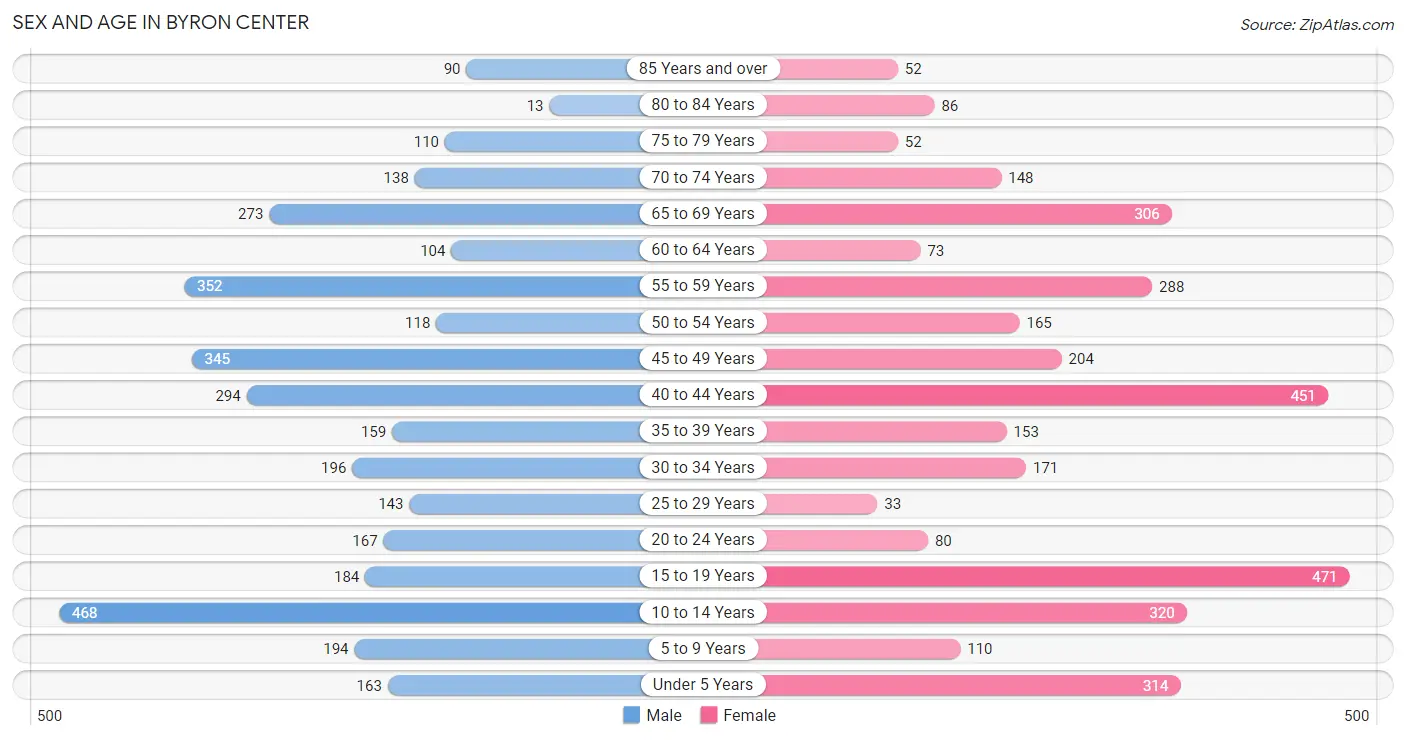
The most populous age groups in Byron Center are 10 to 14 Years (468 | 13.3%) for men and 15 to 19 Years (471 | 13.6%) for women.
| Age Bracket | Male | Female |
| Under 5 Years | 163 (4.6%) | 314 (9.0%) |
| 5 to 9 Years | 194 (5.5%) | 110 (3.2%) |
| 10 to 14 Years | 468 (13.3%) | 320 (9.2%) |
| 15 to 19 Years | 184 (5.2%) | 471 (13.6%) |
| 20 to 24 Years | 167 (4.8%) | 80 (2.3%) |
| 25 to 29 Years | 143 (4.1%) | 33 (0.9%) |
| 30 to 34 Years | 196 (5.6%) | 171 (4.9%) |
| 35 to 39 Years | 159 (4.5%) | 153 (4.4%) |
| 40 to 44 Years | 294 (8.4%) | 451 (13.0%) |
| 45 to 49 Years | 345 (9.8%) | 204 (5.9%) |
| 50 to 54 Years | 118 (3.4%) | 165 (4.8%) |
| 55 to 59 Years | 352 (10.0%) | 288 (8.3%) |
| 60 to 64 Years | 104 (3.0%) | 73 (2.1%) |
| 65 to 69 Years | 273 (7.8%) | 306 (8.8%) |
| 70 to 74 Years | 138 (3.9%) | 148 (4.3%) |
| 75 to 79 Years | 110 (3.1%) | 52 (1.5%) |
| 80 to 84 Years | 13 (0.4%) | 86 (2.5%) |
| 85 Years and over | 90 (2.6%) | 52 (1.5%) |
| Total | 3,511 (100.0%) | 3,477 (100.0%) |
Families and Households in Byron Center
Median Family Size in Byron Center
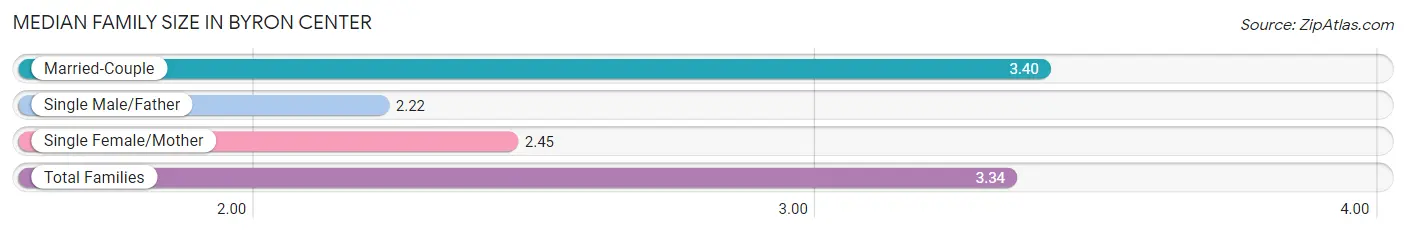
The median family size in Byron Center is 3.34 persons per family, with married-couple families (1,845 | 94.5%) accounting for the largest median family size of 3.4 persons per family. On the other hand, single male/father families (49 | 2.5%) represent the smallest median family size with 2.22 persons per family.
| Family Type | # Families | Family Size |
| Married-Couple | 1,845 (94.5%) | 3.40 |
| Single Male/Father | 49 (2.5%) | 2.22 |
| Single Female/Mother | 58 (3.0%) | 2.45 |
| Total Families | 1,952 (100.0%) | 3.34 |
Median Household Size in Byron Center
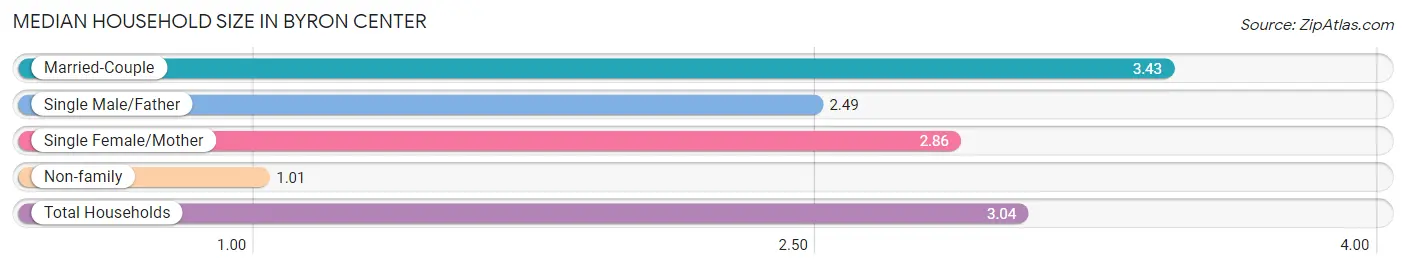
The median household size in Byron Center is 3.04 persons per household, with married-couple households (1,845 | 80.8%) accounting for the largest median household size of 3.43 persons per household. non-family households (332 | 14.5%) represent the smallest median household size with 1.01 persons per household.
| Household Type | # Households | Household Size |
| Married-Couple | 1,845 (80.8%) | 3.43 |
| Single Male/Father | 49 (2.1%) | 2.49 |
| Single Female/Mother | 58 (2.5%) | 2.86 |
| Non-family | 332 (14.5%) | 1.01 |
| Total Households | 2,284 (100.0%) | 3.04 |
Household Size by Marriage Status in Byron Center
Out of a total of 2,284 households in Byron Center, 1,952 (85.5%) are family households, while 332 (14.5%) are nonfamily households. The most numerous type of family households are 2-person households, comprising 614, and the most common type of nonfamily households are 1-person households, comprising 328.
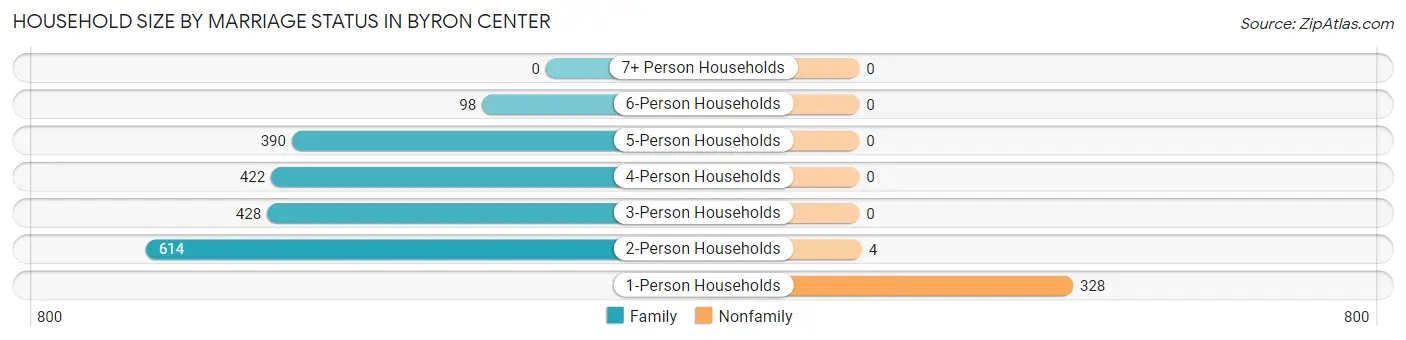
| Household Size | Family Households | Nonfamily Households |
| 1-Person Households | - | 328 (14.4%) |
| 2-Person Households | 614 (26.9%) | 4 (0.2%) |
| 3-Person Households | 428 (18.7%) | 0 (0.0%) |
| 4-Person Households | 422 (18.5%) | 0 (0.0%) |
| 5-Person Households | 390 (17.1%) | 0 (0.0%) |
| 6-Person Households | 98 (4.3%) | 0 (0.0%) |
| 7+ Person Households | 0 (0.0%) | 0 (0.0%) |
| Total | 1,952 (85.5%) | 332 (14.5%) |
Female Fertility in Byron Center
Fertility by Age in Byron Center
Average fertility rate in Byron Center is 84.0 births per 1,000 women. Women in the age bracket of 20 to 34 years have the highest fertility rate with 345.0 births per 1,000 women. Women in the age bracket of 20 to 34 years acount for 73.1% of all women with births.
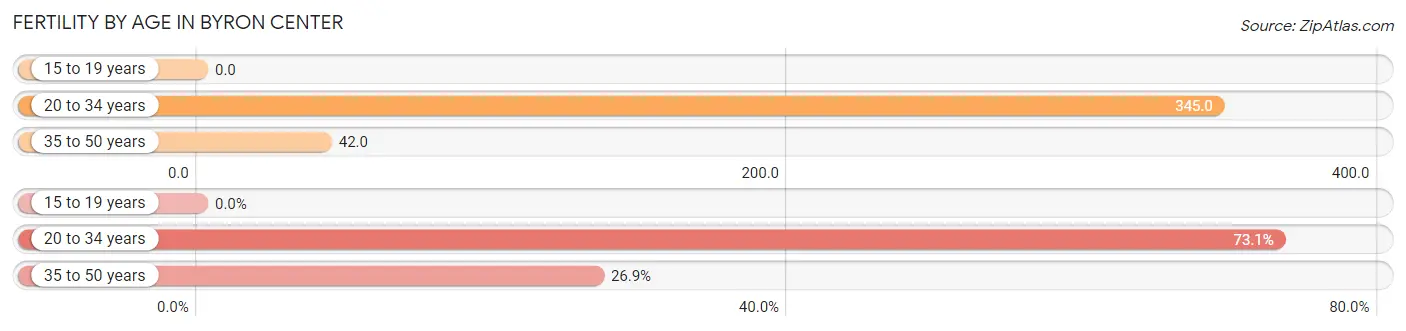
| Age Bracket | Women with Births | Births / 1,000 Women |
| 15 to 19 years | 0 (0.0%) | 0.0 |
| 20 to 34 years | 98 (73.1%) | 345.0 |
| 35 to 50 years | 36 (26.9%) | 42.0 |
| Total | 134 (100.0%) | 84.0 |
Fertility by Age by Marriage Status in Byron Center
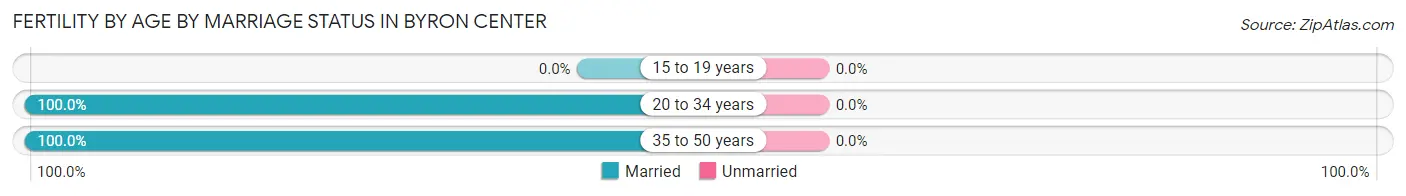
| Age Bracket | Married | Unmarried |
| 15 to 19 years | 0 (0.0%) | 0 (0.0%) |
| 20 to 34 years | 98 (100.0%) | 0 (0.0%) |
| 35 to 50 years | 36 (100.0%) | 0 (0.0%) |
| Total | 134 (100.0%) | 0 (0.0%) |
Fertility by Education in Byron Center
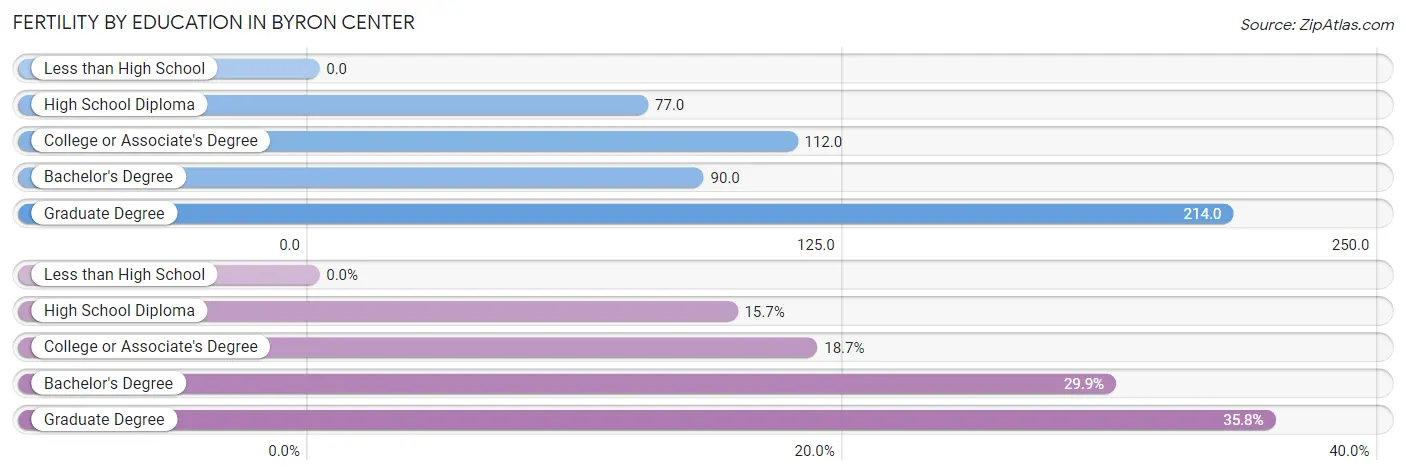
| Educational Attainment | Women with Births | Births / 1,000 Women |
| Less than High School | 0 (0.0%) | 0.0 |
| High School Diploma | 21 (15.7%) | 77.0 |
| College or Associate's Degree | 25 (18.7%) | 112.0 |
| Bachelor's Degree | 40 (29.8%) | 90.0 |
| Graduate Degree | 48 (35.8%) | 214.0 |
| Total | 134 (100.0%) | 84.0 |
Fertility by Education by Marriage Status in Byron Center
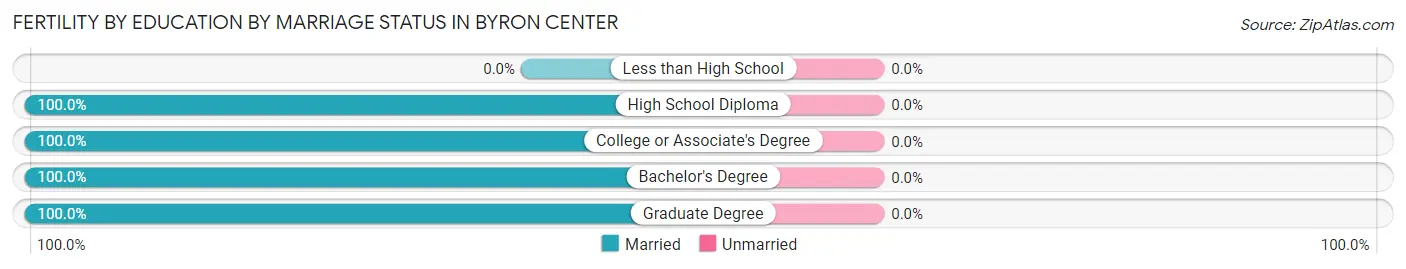
| Educational Attainment | Married | Unmarried |
| Less than High School | 0 (0.0%) | 0 (0.0%) |
| High School Diploma | 21 (100.0%) | 0 (0.0%) |
| College or Associate's Degree | 25 (100.0%) | 0 (0.0%) |
| Bachelor's Degree | 40 (100.0%) | 0 (0.0%) |
| Graduate Degree | 48 (100.0%) | 0 (0.0%) |
| Total | 134 (100.0%) | 0 (0.0%) |
Employment Characteristics in Byron Center
Employment by Class of Employer in Byron Center
Among the 3,342 employed individuals in Byron Center, private company employees (2,431 | 72.7%), not-for-profit organizations (342 | 10.2%), and local government employees (261 | 7.8%) make up the most common classes of employment.
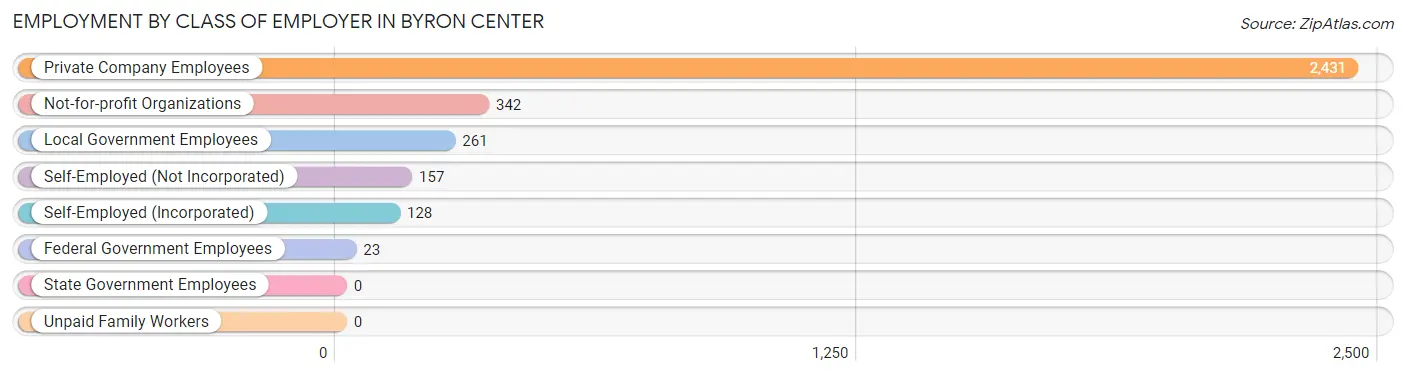
| Employer Class | # Employees | % Employees |
| Private Company Employees | 2,431 | 72.7% |
| Self-Employed (Incorporated) | 128 | 3.8% |
| Self-Employed (Not Incorporated) | 157 | 4.7% |
| Not-for-profit Organizations | 342 | 10.2% |
| Local Government Employees | 261 | 7.8% |
| State Government Employees | 0 | 0.0% |
| Federal Government Employees | 23 | 0.7% |
| Unpaid Family Workers | 0 | 0.0% |
| Total | 3,342 | 100.0% |
Employment Status by Age in Byron Center
According to the labor force statistics for Byron Center, out of the total population over 16 years of age (5,275), 64.8% or 3,418 individuals are in the labor force, with 2.2% or 75 of them unemployed. The age group with the highest labor force participation rate is 25 to 29 years, with 100.0% or 176 individuals in the labor force. Within the labor force, the 20 to 24 years age range has the highest percentage of unemployed individuals, with 17.9% or 42 of them being unemployed.
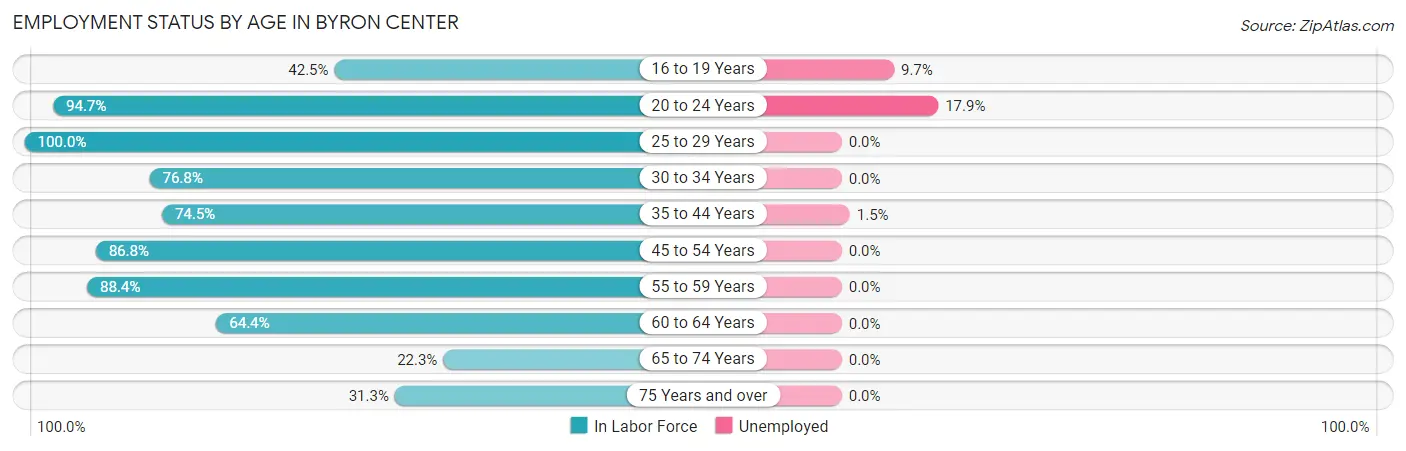
| Age Bracket | In Labor Force | Unemployed |
| 16 to 19 Years | 217 (42.5%) | 21 (9.7%) |
| 20 to 24 Years | 234 (94.7%) | 42 (17.9%) |
| 25 to 29 Years | 176 (100.0%) | 0 (0.0%) |
| 30 to 34 Years | 282 (76.8%) | 0 (0.0%) |
| 35 to 44 Years | 787 (74.5%) | 12 (1.5%) |
| 45 to 54 Years | 722 (86.8%) | 0 (0.0%) |
| 55 to 59 Years | 566 (88.4%) | 0 (0.0%) |
| 60 to 64 Years | 114 (64.4%) | 0 (0.0%) |
| 65 to 74 Years | 193 (22.3%) | 0 (0.0%) |
| 75 Years and over | 126 (31.3%) | 0 (0.0%) |
| Total | 3,418 (64.8%) | 75 (2.2%) |
Employment Status by Educational Attainment in Byron Center
According to labor force statistics for Byron Center, 81.5% of individuals (2,648) out of the total population between 25 and 64 years of age (3,249) are in the labor force, with 0.5% or 13 of them being unemployed. The group with the highest labor force participation rate are those with the educational attainment of college / associate degree, with 89.6% or 1,004 individuals in the labor force. Within the labor force, individuals with college / associate degree education have the highest percentage of unemployment, with 1.2% or 12 of them being unemployed.
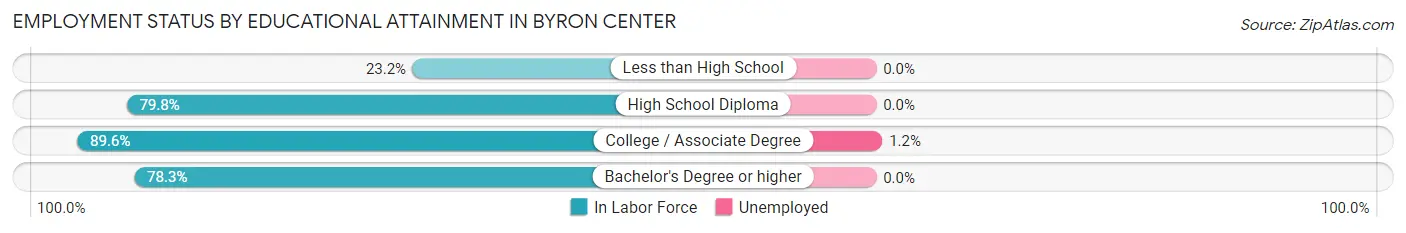
| Educational Attainment | In Labor Force | Unemployed |
| Less than High School | 13 (23.2%) | 0 (0.0%) |
| High School Diploma | 390 (79.8%) | 0 (0.0%) |
| College / Associate Degree | 1,004 (89.6%) | 13 (1.2%) |
| Bachelor's Degree or higher | 1,240 (78.3%) | 0 (0.0%) |
| Total | 2,648 (81.5%) | 16 (0.5%) |
Employment Occupations by Sex in Byron Center
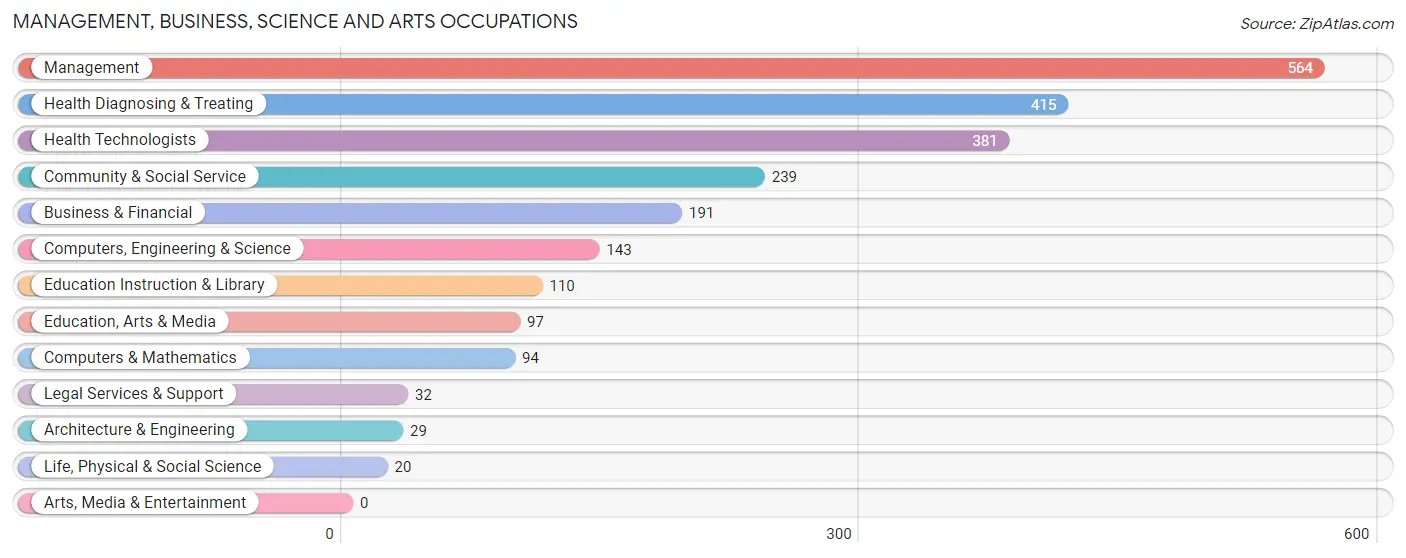
Management, Business, Science and Arts Occupations
The most common Management, Business, Science and Arts occupations in Byron Center are Management (564 | 16.9%), Health Diagnosing & Treating (415 | 12.4%), Health Technologists (381 | 11.4%), Community & Social Service (239 | 7.1%), and Business & Financial (191 | 5.7%).
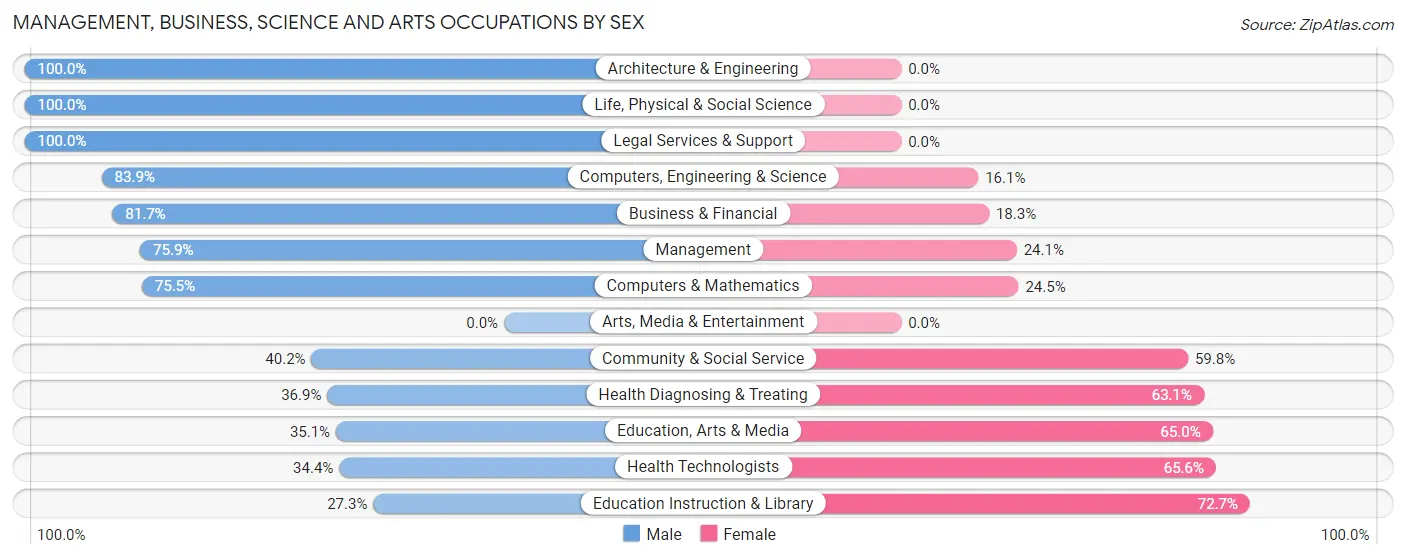
Management, Business, Science and Arts Occupations by Sex
Within the Management, Business, Science and Arts occupations in Byron Center, the most male-oriented occupations are Architecture & Engineering (100.0%), Life, Physical & Social Science (100.0%), and Legal Services & Support (100.0%), while the most female-oriented occupations are Education Instruction & Library (72.7%), Health Technologists (65.6%), and Education, Arts & Media (64.9%).
| Occupation | Male | Female |
| Management | 428 (75.9%) | 136 (24.1%) |
| Business & Financial | 156 (81.7%) | 35 (18.3%) |
| Computers, Engineering & Science | 120 (83.9%) | 23 (16.1%) |
| Computers & Mathematics | 71 (75.5%) | 23 (24.5%) |
| Architecture & Engineering | 29 (100.0%) | 0 (0.0%) |
| Life, Physical & Social Science | 20 (100.0%) | 0 (0.0%) |
| Community & Social Service | 96 (40.2%) | 143 (59.8%) |
| Education, Arts & Media | 34 (35.0%) | 63 (64.9%) |
| Legal Services & Support | 32 (100.0%) | 0 (0.0%) |
| Education Instruction & Library | 30 (27.3%) | 80 (72.7%) |
| Arts, Media & Entertainment | 0 (0.0%) | 0 (0.0%) |
| Health Diagnosing & Treating | 153 (36.9%) | 262 (63.1%) |
| Health Technologists | 131 (34.4%) | 250 (65.6%) |
| Total (Category) | 953 (61.4%) | 599 (38.6%) |
| Total (Overall) | 2,080 (62.2%) | 1,262 (37.8%) |
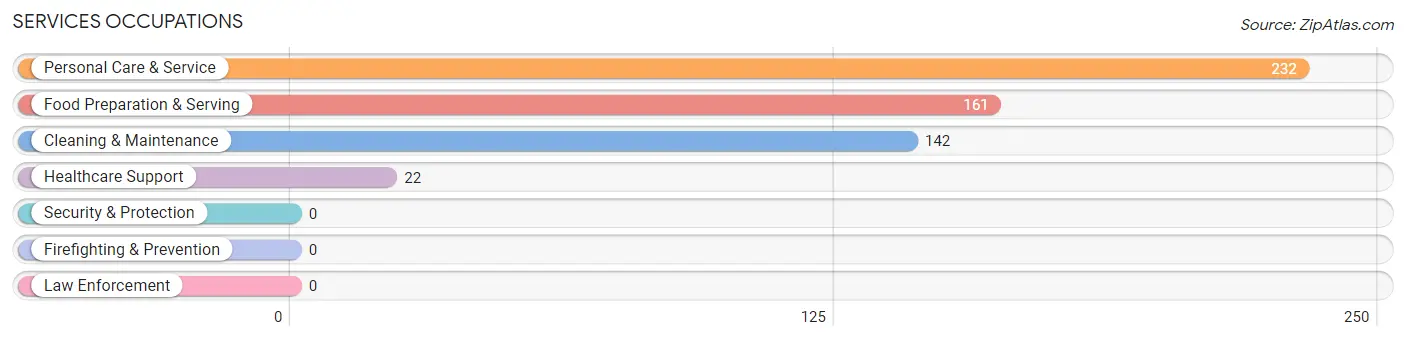
Services Occupations
The most common Services occupations in Byron Center are Personal Care & Service (232 | 6.9%), Food Preparation & Serving (161 | 4.8%), Cleaning & Maintenance (142 | 4.3%), and Healthcare Support (22 | 0.7%).
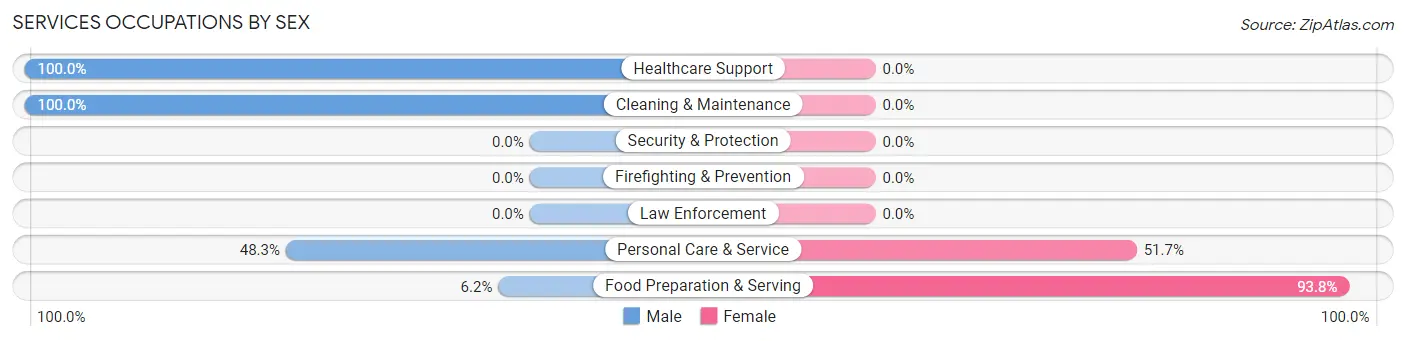
Services Occupations by Sex
Within the Services occupations in Byron Center, the most male-oriented occupations are Healthcare Support (100.0%), Cleaning & Maintenance (100.0%), and Personal Care & Service (48.3%), while the most female-oriented occupations are Food Preparation & Serving (93.8%), and Personal Care & Service (51.7%).
| Occupation | Male | Female |
| Healthcare Support | 22 (100.0%) | 0 (0.0%) |
| Security & Protection | 0 (0.0%) | 0 (0.0%) |
| Firefighting & Prevention | 0 (0.0%) | 0 (0.0%) |
| Law Enforcement | 0 (0.0%) | 0 (0.0%) |
| Food Preparation & Serving | 10 (6.2%) | 151 (93.8%) |
| Cleaning & Maintenance | 142 (100.0%) | 0 (0.0%) |
| Personal Care & Service | 112 (48.3%) | 120 (51.7%) |
| Total (Category) | 286 (51.3%) | 271 (48.6%) |
| Total (Overall) | 2,080 (62.2%) | 1,262 (37.8%) |
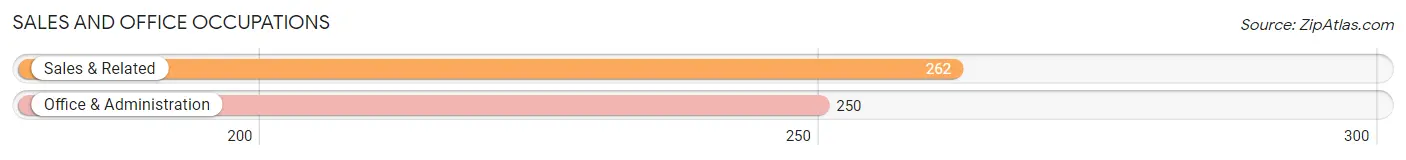
Sales and Office Occupations
The most common Sales and Office occupations in Byron Center are Sales & Related (262 | 7.8%), and Office & Administration (250 | 7.5%).
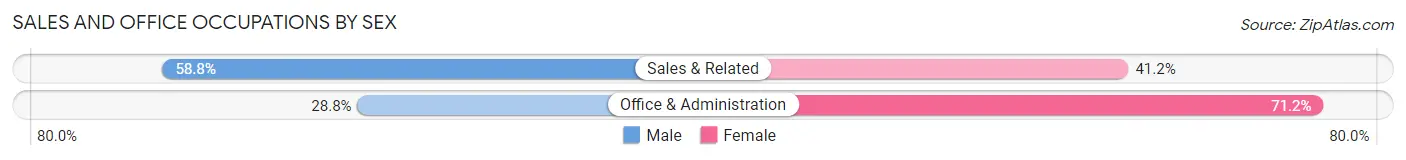
Sales and Office Occupations by Sex
| Occupation | Male | Female |
| Sales & Related | 154 (58.8%) | 108 (41.2%) |
| Office & Administration | 72 (28.8%) | 178 (71.2%) |
| Total (Category) | 226 (44.1%) | 286 (55.9%) |
| Total (Overall) | 2,080 (62.2%) | 1,262 (37.8%) |
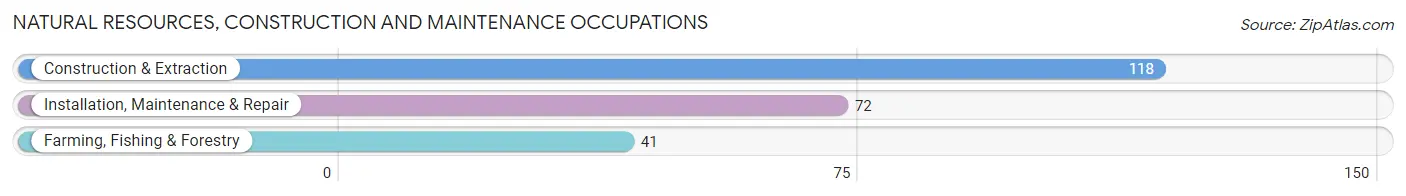
Natural Resources, Construction and Maintenance Occupations
The most common Natural Resources, Construction and Maintenance occupations in Byron Center are Construction & Extraction (118 | 3.5%), Installation, Maintenance & Repair (72 | 2.1%), and Farming, Fishing & Forestry (41 | 1.2%).
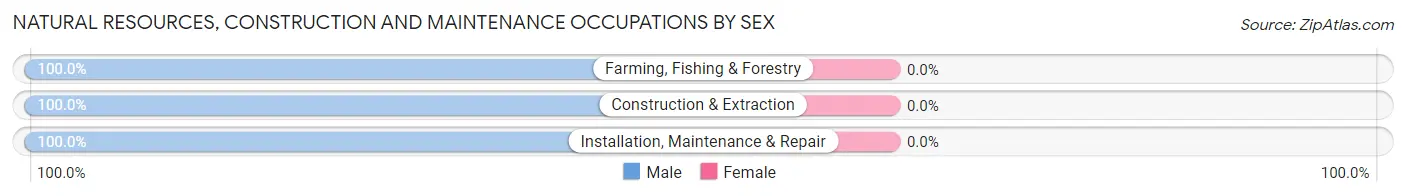
Natural Resources, Construction and Maintenance Occupations by Sex
| Occupation | Male | Female |
| Farming, Fishing & Forestry | 41 (100.0%) | 0 (0.0%) |
| Construction & Extraction | 118 (100.0%) | 0 (0.0%) |
| Installation, Maintenance & Repair | 72 (100.0%) | 0 (0.0%) |
| Total (Category) | 231 (100.0%) | 0 (0.0%) |
| Total (Overall) | 2,080 (62.2%) | 1,262 (37.8%) |
Production, Transportation and Moving Occupations
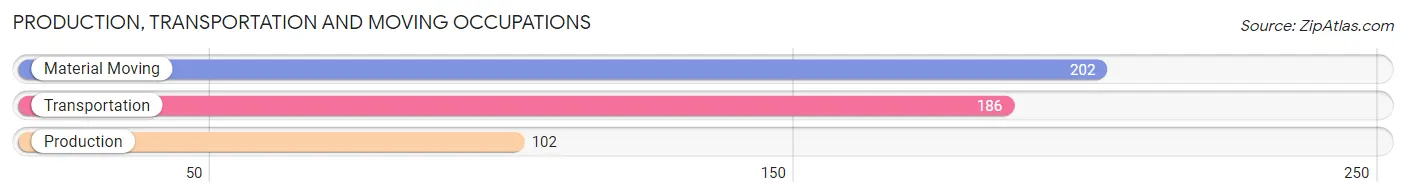
The most common Production, Transportation and Moving occupations in Byron Center are Material Moving (202 | 6.0%), Transportation (186 | 5.6%), and Production (102 | 3.0%).
Production, Transportation and Moving Occupations by Sex
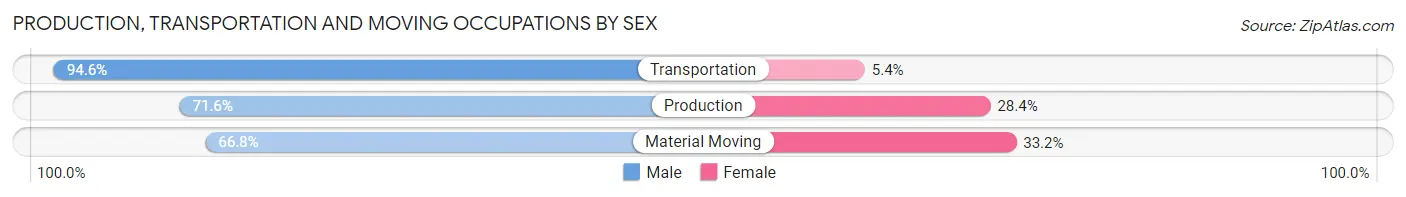
| Occupation | Male | Female |
| Production | 73 (71.6%) | 29 (28.4%) |
| Transportation | 176 (94.6%) | 10 (5.4%) |
| Material Moving | 135 (66.8%) | 67 (33.2%) |
| Total (Category) | 384 (78.4%) | 106 (21.6%) |
| Total (Overall) | 2,080 (62.2%) | 1,262 (37.8%) |
Employment Industries by Sex in Byron Center
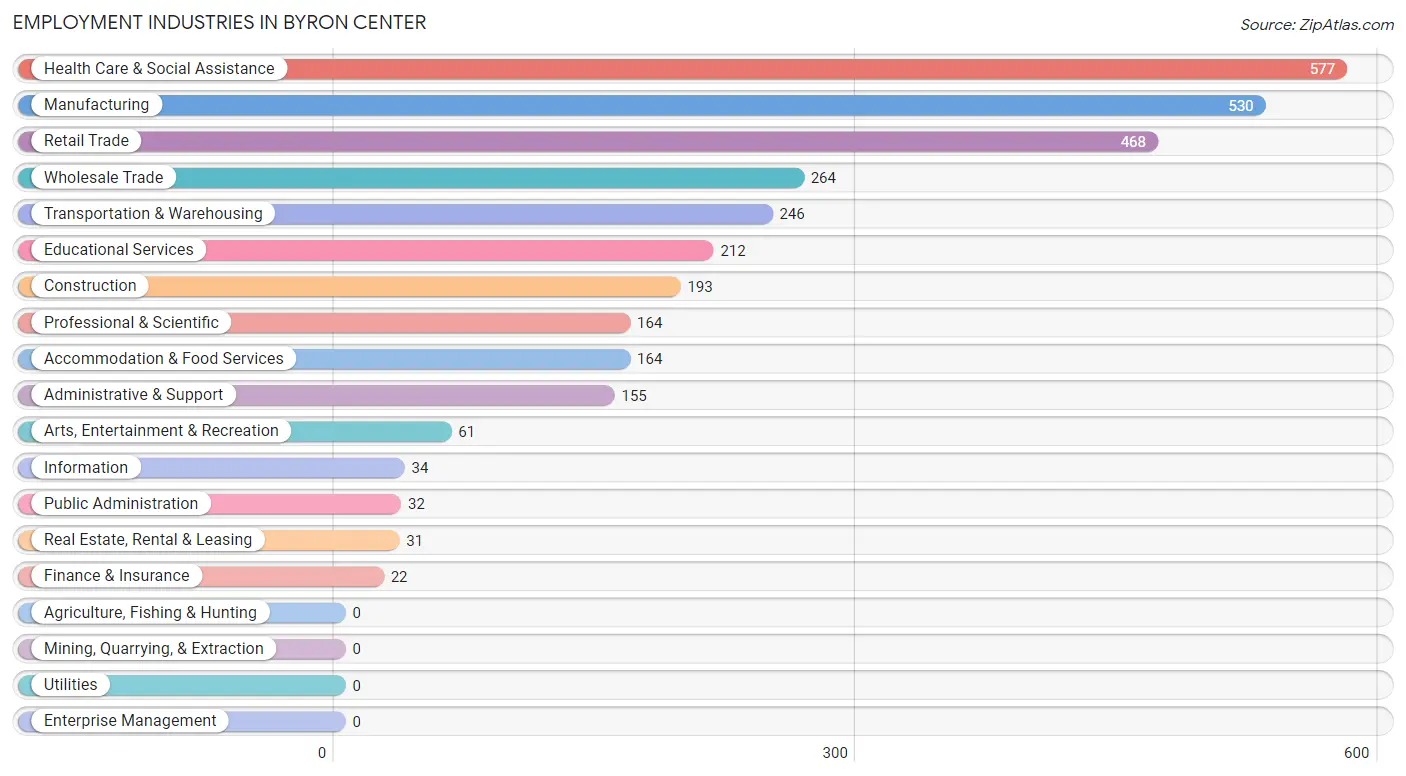
Employment Industries in Byron Center
The major employment industries in Byron Center include Health Care & Social Assistance (577 | 17.3%), Manufacturing (530 | 15.9%), Retail Trade (468 | 14.0%), Wholesale Trade (264 | 7.9%), and Transportation & Warehousing (246 | 7.4%).
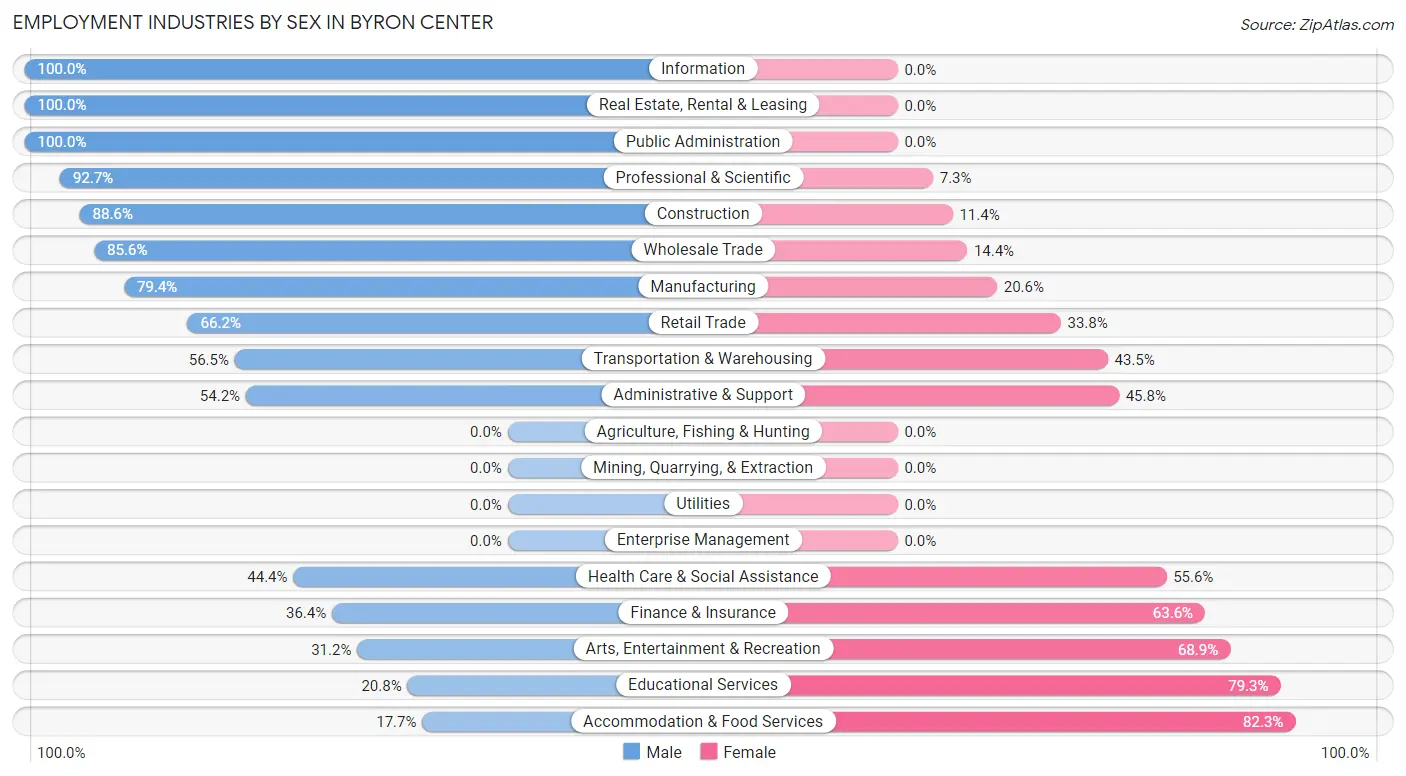
Employment Industries by Sex in Byron Center
The Byron Center industries that see more men than women are Information (100.0%), Real Estate, Rental & Leasing (100.0%), and Public Administration (100.0%), whereas the industries that tend to have a higher number of women are Accommodation & Food Services (82.3%), Educational Services (79.2%), and Arts, Entertainment & Recreation (68.9%).
| Industry | Male | Female |
| Agriculture, Fishing & Hunting | 0 (0.0%) | 0 (0.0%) |
| Mining, Quarrying, & Extraction | 0 (0.0%) | 0 (0.0%) |
| Construction | 171 (88.6%) | 22 (11.4%) |
| Manufacturing | 421 (79.4%) | 109 (20.6%) |
| Wholesale Trade | 226 (85.6%) | 38 (14.4%) |
| Retail Trade | 310 (66.2%) | 158 (33.8%) |
| Transportation & Warehousing | 139 (56.5%) | 107 (43.5%) |
| Utilities | 0 (0.0%) | 0 (0.0%) |
| Information | 34 (100.0%) | 0 (0.0%) |
| Finance & Insurance | 8 (36.4%) | 14 (63.6%) |
| Real Estate, Rental & Leasing | 31 (100.0%) | 0 (0.0%) |
| Professional & Scientific | 152 (92.7%) | 12 (7.3%) |
| Enterprise Management | 0 (0.0%) | 0 (0.0%) |
| Administrative & Support | 84 (54.2%) | 71 (45.8%) |
| Educational Services | 44 (20.7%) | 168 (79.2%) |
| Health Care & Social Assistance | 256 (44.4%) | 321 (55.6%) |
| Arts, Entertainment & Recreation | 19 (31.1%) | 42 (68.9%) |
| Accommodation & Food Services | 29 (17.7%) | 135 (82.3%) |
| Public Administration | 32 (100.0%) | 0 (0.0%) |
| Total | 2,080 (62.2%) | 1,262 (37.8%) |
Education in Byron Center
School Enrollment in Byron Center
The most common levels of schooling among the 2,045 students in Byron Center are middle school (663 | 32.4%), high school (657 | 32.1%), and elementary school (318 | 15.5%).
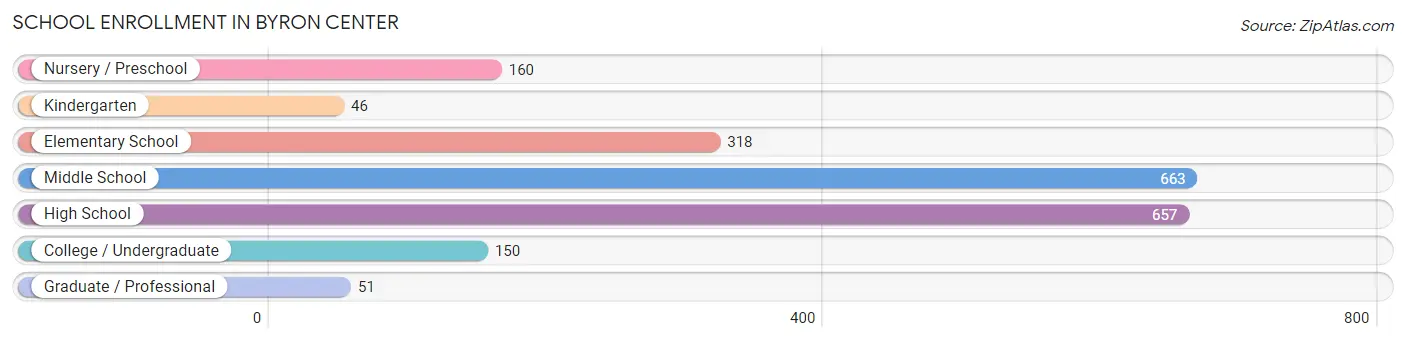
| School Level | # Students | % Students |
| Nursery / Preschool | 160 | 7.8% |
| Kindergarten | 46 | 2.2% |
| Elementary School | 318 | 15.5% |
| Middle School | 663 | 32.4% |
| High School | 657 | 32.1% |
| College / Undergraduate | 150 | 7.3% |
| Graduate / Professional | 51 | 2.5% |
| Total | 2,045 | 100.0% |
School Enrollment by Age by Funding Source in Byron Center
Out of a total of 2,045 students who are enrolled in schools in Byron Center, 681 (33.3%) attend a private institution, while the remaining 1,364 (66.7%) are enrolled in public schools. The age group of 20 to 24 year olds has the highest likelihood of being enrolled in private schools, with 50 (63.3% in the age bracket) enrolled. Conversely, the age group of 18 to 19 year olds has the lowest likelihood of being enrolled in a private school, with 108 (100.0% in the age bracket) attending a public institution.
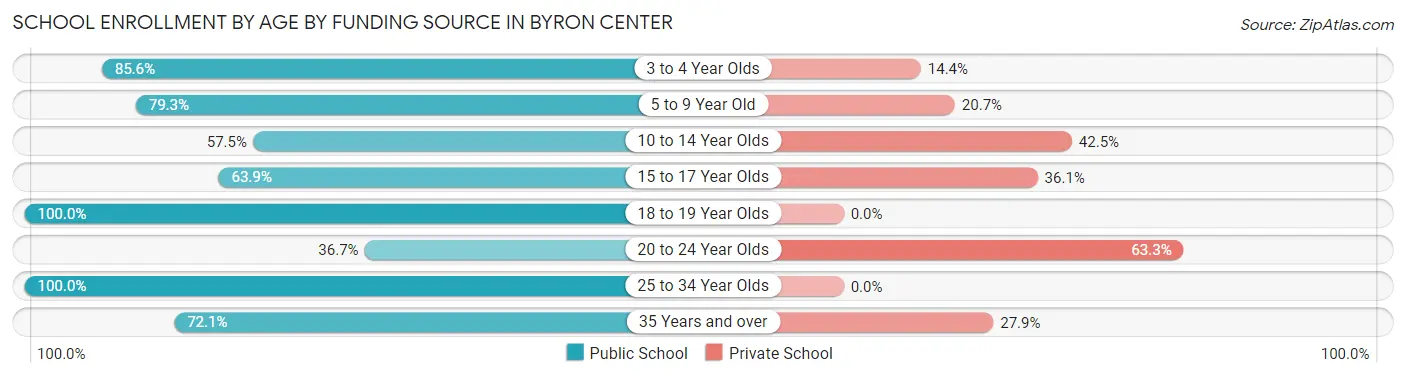
| Age Bracket | Public School | Private School |
| 3 to 4 Year Olds | 137 (85.6%) | 23 (14.4%) |
| 5 to 9 Year Old | 241 (79.3%) | 63 (20.7%) |
| 10 to 14 Year Olds | 453 (57.5%) | 335 (42.5%) |
| 15 to 17 Year Olds | 343 (63.9%) | 194 (36.1%) |
| 18 to 19 Year Olds | 108 (100.0%) | 0 (0.0%) |
| 20 to 24 Year Olds | 29 (36.7%) | 50 (63.3%) |
| 25 to 34 Year Olds | 8 (100.0%) | 0 (0.0%) |
| 35 Years and over | 44 (72.1%) | 17 (27.9%) |
| Total | 1,364 (66.7%) | 681 (33.3%) |
Educational Attainment by Field of Study in Byron Center
Business (414 | 19.7%), science & technology (339 | 16.1%), education (202 | 9.6%), arts & humanities (172 | 8.2%), and liberal arts & history (146 | 7.0%) are the most common fields of study among 2,102 individuals in Byron Center who have obtained a bachelor's degree or higher.
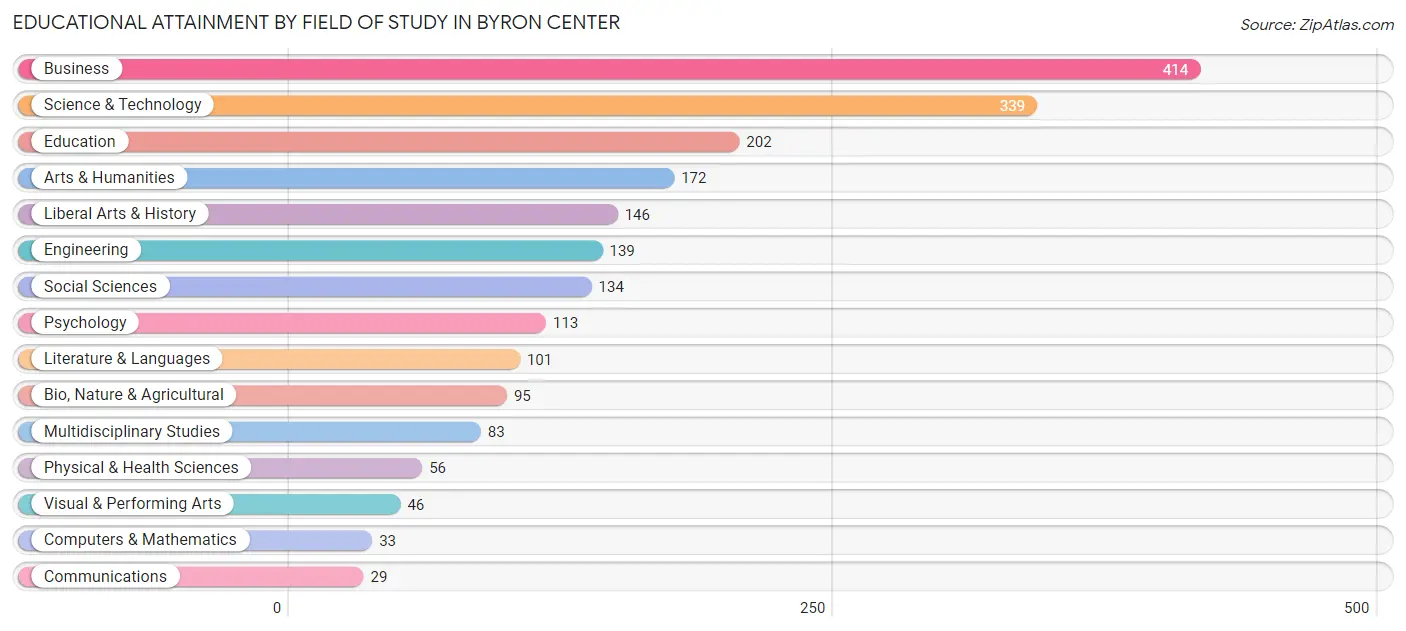
| Field of Study | # Graduates | % Graduates |
| Computers & Mathematics | 33 | 1.6% |
| Bio, Nature & Agricultural | 95 | 4.5% |
| Physical & Health Sciences | 56 | 2.7% |
| Psychology | 113 | 5.4% |
| Social Sciences | 134 | 6.4% |
| Engineering | 139 | 6.6% |
| Multidisciplinary Studies | 83 | 4.0% |
| Science & Technology | 339 | 16.1% |
| Business | 414 | 19.7% |
| Education | 202 | 9.6% |
| Literature & Languages | 101 | 4.8% |
| Liberal Arts & History | 146 | 7.0% |
| Visual & Performing Arts | 46 | 2.2% |
| Communications | 29 | 1.4% |
| Arts & Humanities | 172 | 8.2% |
| Total | 2,102 | 100.0% |
Transportation & Commute in Byron Center
Vehicle Availability by Sex in Byron Center
The most prevalent vehicle ownership categories in Byron Center are males with 2 vehicles (1,113, accounting for 54.0%) and females with 2 vehicles (677, making up 88.2%).
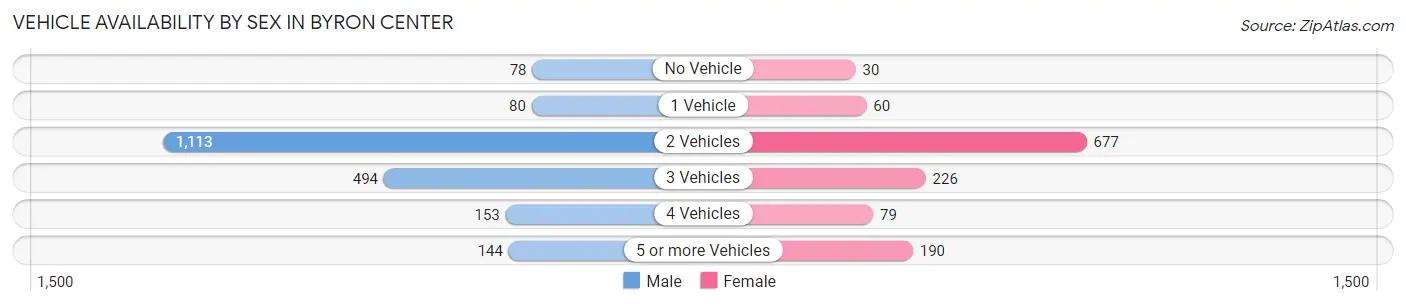
| Vehicles Available | Male | Female |
| No Vehicle | 78 (3.8%) | 30 (2.4%) |
| 1 Vehicle | 80 (3.9%) | 60 (4.8%) |
| 2 Vehicles | 1,113 (54.0%) | 677 (53.6%) |
| 3 Vehicles | 494 (24.0%) | 226 (17.9%) |
| 4 Vehicles | 153 (7.4%) | 79 (6.3%) |
| 5 or more Vehicles | 144 (7.0%) | 190 (15.1%) |
| Total | 2,062 (100.0%) | 1,262 (100.0%) |
Commute Time in Byron Center
The most frequently occuring commute durations in Byron Center are 20 to 24 minutes (849 commuters, 27.9%), 10 to 14 minutes (643 commuters, 21.1%), and 5 to 9 minutes (583 commuters, 19.1%).
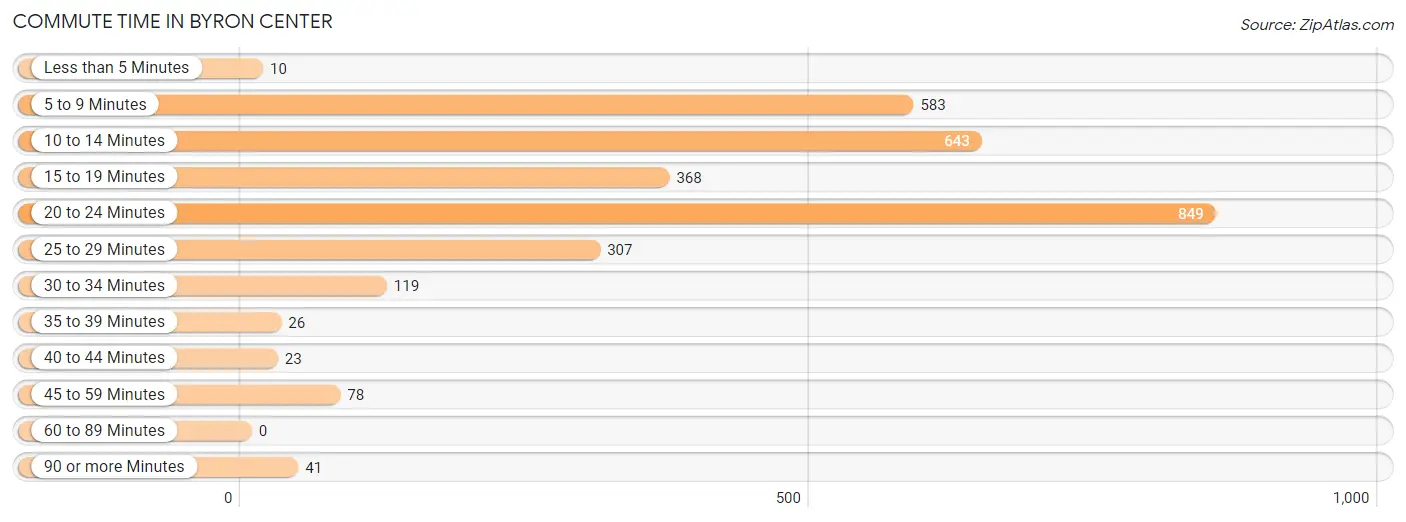
| Commute Time | # Commuters | % Commuters |
| Less than 5 Minutes | 10 | 0.3% |
| 5 to 9 Minutes | 583 | 19.1% |
| 10 to 14 Minutes | 643 | 21.1% |
| 15 to 19 Minutes | 368 | 12.1% |
| 20 to 24 Minutes | 849 | 27.9% |
| 25 to 29 Minutes | 307 | 10.1% |
| 30 to 34 Minutes | 119 | 3.9% |
| 35 to 39 Minutes | 26 | 0.9% |
| 40 to 44 Minutes | 23 | 0.7% |
| 45 to 59 Minutes | 78 | 2.6% |
| 60 to 89 Minutes | 0 | 0.0% |
| 90 or more Minutes | 41 | 1.3% |
Commute Time by Sex in Byron Center
The most common commute times in Byron Center are 20 to 24 minutes (582 commuters, 31.0%) for males and 5 to 9 minutes (338 commuters, 28.8%) for females.
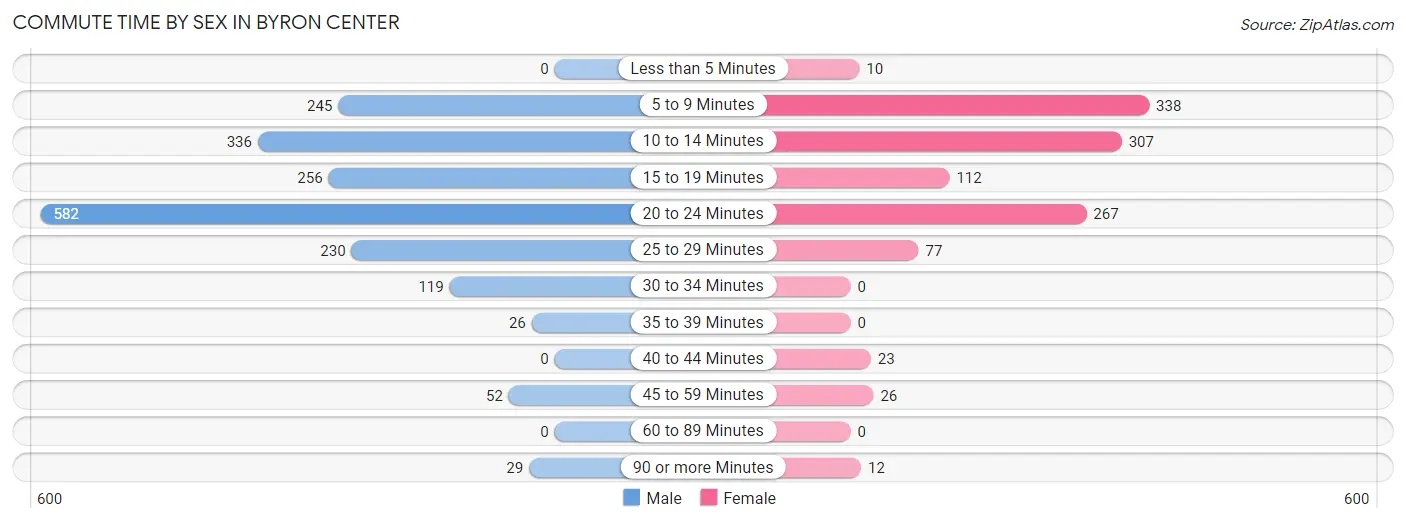
| Commute Time | Male | Female |
| Less than 5 Minutes | 0 (0.0%) | 10 (0.9%) |
| 5 to 9 Minutes | 245 (13.1%) | 338 (28.8%) |
| 10 to 14 Minutes | 336 (17.9%) | 307 (26.2%) |
| 15 to 19 Minutes | 256 (13.7%) | 112 (9.6%) |
| 20 to 24 Minutes | 582 (31.0%) | 267 (22.8%) |
| 25 to 29 Minutes | 230 (12.3%) | 77 (6.6%) |
| 30 to 34 Minutes | 119 (6.4%) | 0 (0.0%) |
| 35 to 39 Minutes | 26 (1.4%) | 0 (0.0%) |
| 40 to 44 Minutes | 0 (0.0%) | 23 (2.0%) |
| 45 to 59 Minutes | 52 (2.8%) | 26 (2.2%) |
| 60 to 89 Minutes | 0 (0.0%) | 0 (0.0%) |
| 90 or more Minutes | 29 (1.5%) | 12 (1.0%) |
Time of Departure to Work by Sex in Byron Center
The most frequent times of departure to work in Byron Center are 7:00 AM to 7:29 AM (326, 17.4%) for males and 8:00 AM to 8:29 AM (250, 21.3%) for females.
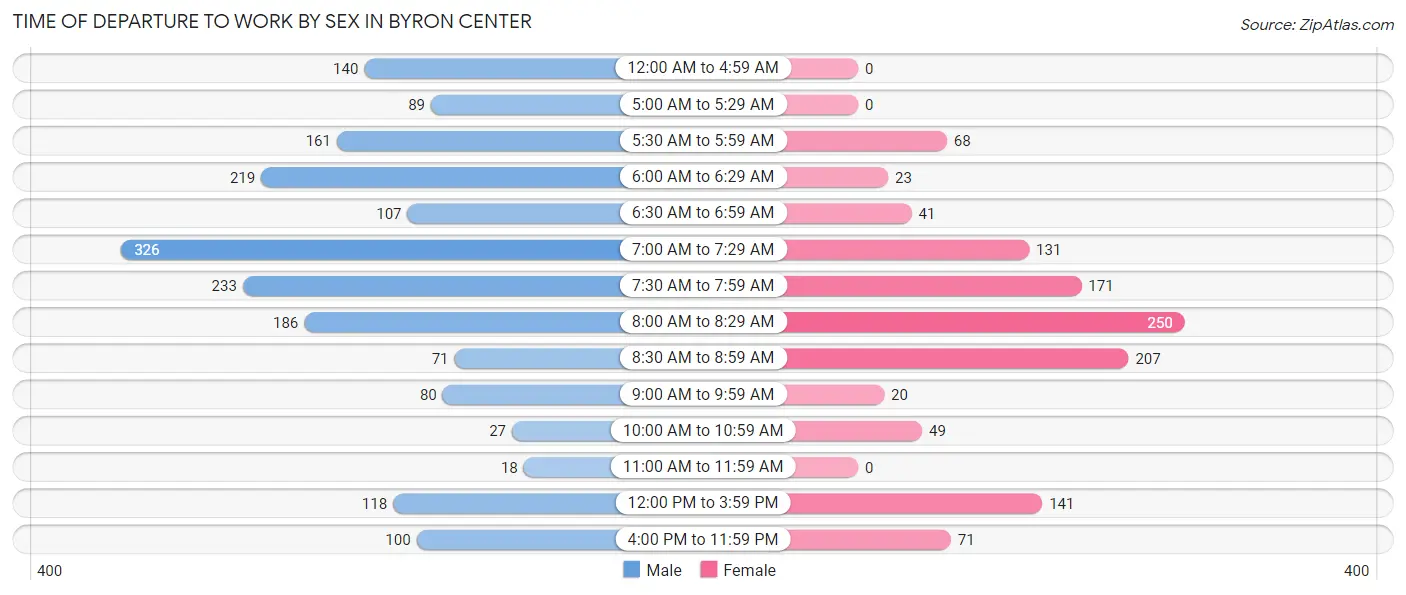
| Time of Departure | Male | Female |
| 12:00 AM to 4:59 AM | 140 (7.5%) | 0 (0.0%) |
| 5:00 AM to 5:29 AM | 89 (4.8%) | 0 (0.0%) |
| 5:30 AM to 5:59 AM | 161 (8.6%) | 68 (5.8%) |
| 6:00 AM to 6:29 AM | 219 (11.7%) | 23 (2.0%) |
| 6:30 AM to 6:59 AM | 107 (5.7%) | 41 (3.5%) |
| 7:00 AM to 7:29 AM | 326 (17.4%) | 131 (11.2%) |
| 7:30 AM to 7:59 AM | 233 (12.4%) | 171 (14.6%) |
| 8:00 AM to 8:29 AM | 186 (9.9%) | 250 (21.3%) |
| 8:30 AM to 8:59 AM | 71 (3.8%) | 207 (17.7%) |
| 9:00 AM to 9:59 AM | 80 (4.3%) | 20 (1.7%) |
| 10:00 AM to 10:59 AM | 27 (1.4%) | 49 (4.2%) |
| 11:00 AM to 11:59 AM | 18 (1.0%) | 0 (0.0%) |
| 12:00 PM to 3:59 PM | 118 (6.3%) | 141 (12.0%) |
| 4:00 PM to 11:59 PM | 100 (5.3%) | 71 (6.1%) |
| Total | 1,875 (100.0%) | 1,172 (100.0%) |
Housing Occupancy in Byron Center
Occupancy by Ownership in Byron Center
Of the total 2,284 dwellings in Byron Center, owner-occupied units account for 2,149 (94.1%), while renter-occupied units make up 135 (5.9%).
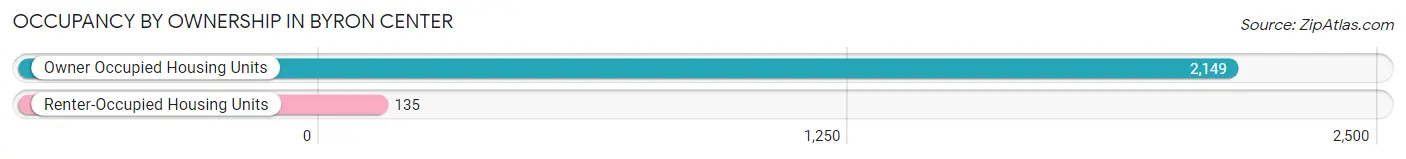
| Occupancy | # Housing Units | % Housing Units |
| Owner Occupied Housing Units | 2,149 | 94.1% |
| Renter-Occupied Housing Units | 135 | 5.9% |
| Total Occupied Housing Units | 2,284 | 100.0% |
Occupancy by Household Size in Byron Center
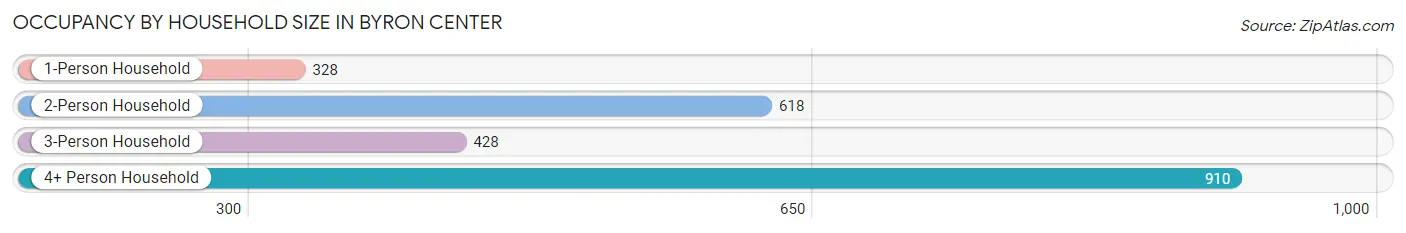
| Household Size | # Housing Units | % Housing Units |
| 1-Person Household | 328 | 14.4% |
| 2-Person Household | 618 | 27.1% |
| 3-Person Household | 428 | 18.7% |
| 4+ Person Household | 910 | 39.8% |
| Total Housing Units | 2,284 | 100.0% |
Occupancy by Ownership by Household Size in Byron Center
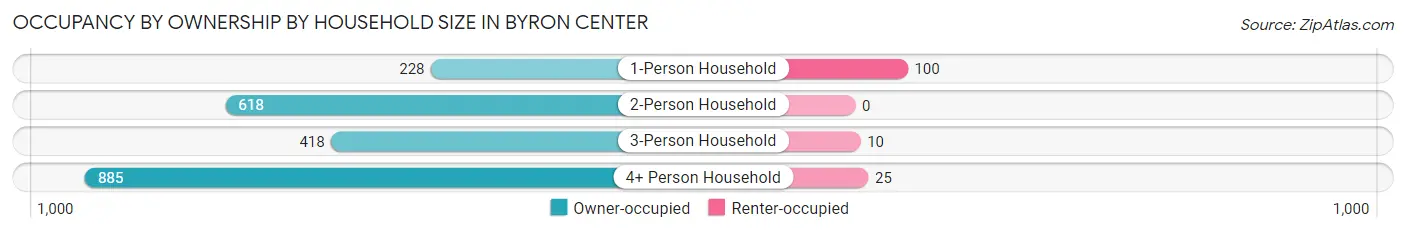
| Household Size | Owner-occupied | Renter-occupied |
| 1-Person Household | 228 (69.5%) | 100 (30.5%) |
| 2-Person Household | 618 (100.0%) | 0 (0.0%) |
| 3-Person Household | 418 (97.7%) | 10 (2.3%) |
| 4+ Person Household | 885 (97.3%) | 25 (2.8%) |
| Total Housing Units | 2,149 (94.1%) | 135 (5.9%) |
Occupancy by Educational Attainment in Byron Center
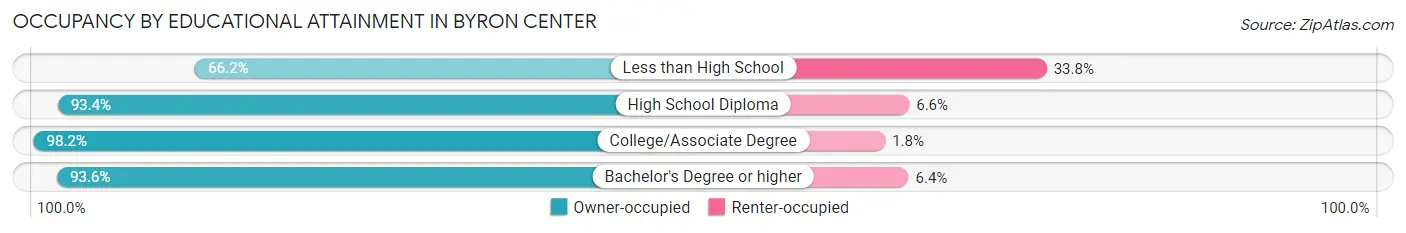
| Household Size | Owner-occupied | Renter-occupied |
| Less than High School | 45 (66.2%) | 23 (33.8%) |
| High School Diploma | 441 (93.4%) | 31 (6.6%) |
| College/Associate Degree | 659 (98.2%) | 12 (1.8%) |
| Bachelor's Degree or higher | 1,004 (93.6%) | 69 (6.4%) |
Occupancy by Age of Householder in Byron Center
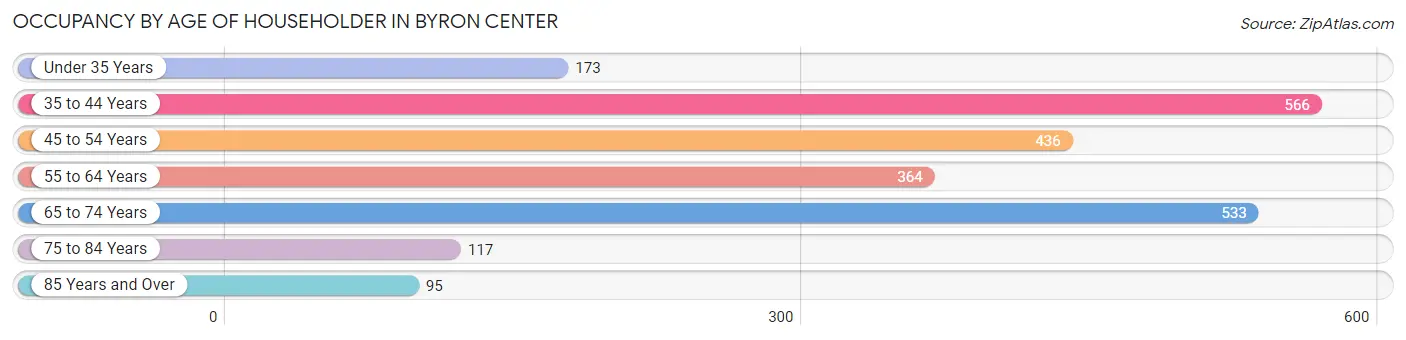
| Age Bracket | # Households | % Households |
| Under 35 Years | 173 | 7.6% |
| 35 to 44 Years | 566 | 24.8% |
| 45 to 54 Years | 436 | 19.1% |
| 55 to 64 Years | 364 | 15.9% |
| 65 to 74 Years | 533 | 23.3% |
| 75 to 84 Years | 117 | 5.1% |
| 85 Years and Over | 95 | 4.2% |
| Total | 2,284 | 100.0% |
Housing Finances in Byron Center
Median Income by Occupancy in Byron Center
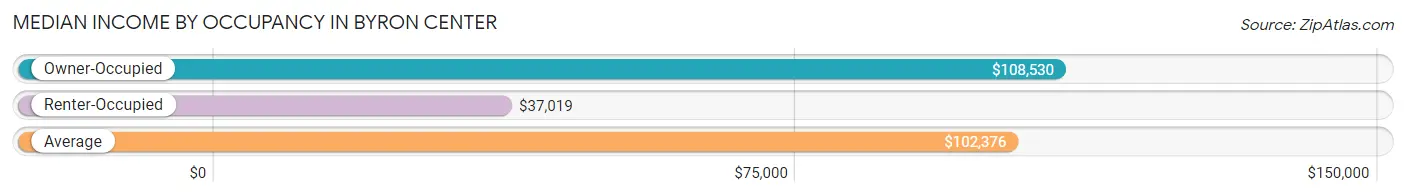
| Occupancy Type | # Households | Median Income |
| Owner-Occupied | 2,149 (94.1%) | $108,530 |
| Renter-Occupied | 135 (5.9%) | $37,019 |
| Average | 2,284 (100.0%) | $102,376 |
Occupancy by Householder Income Bracket in Byron Center
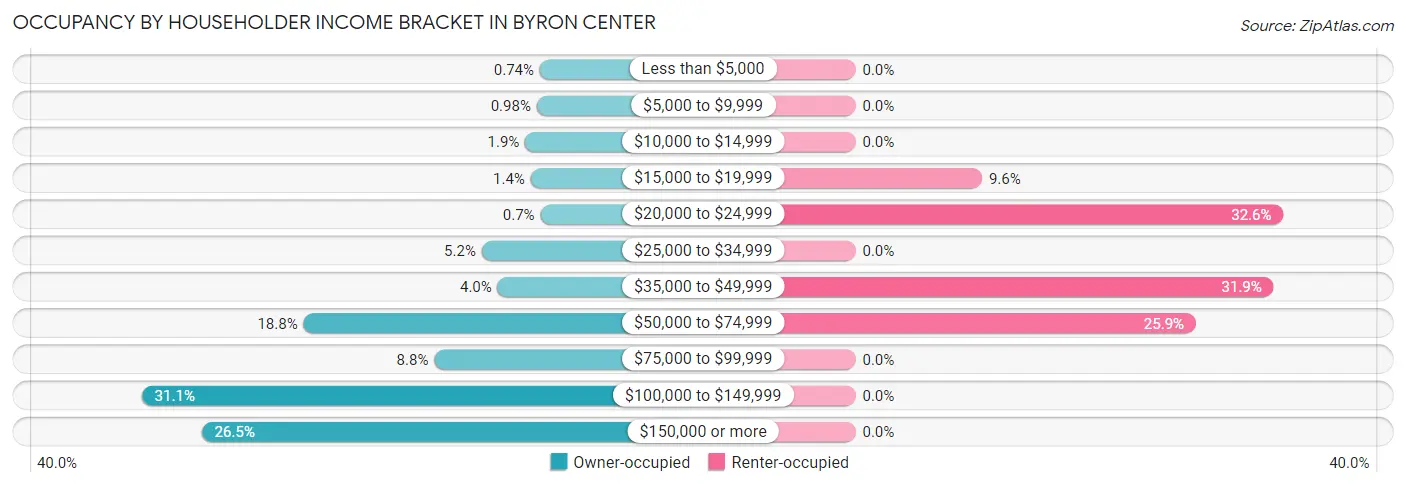
| Income Bracket | Owner-occupied | Renter-occupied |
| Less than $5,000 | 16 (0.7%) | 0 (0.0%) |
| $5,000 to $9,999 | 21 (1.0%) | 0 (0.0%) |
| $10,000 to $14,999 | 40 (1.9%) | 0 (0.0%) |
| $15,000 to $19,999 | 31 (1.4%) | 13 (9.6%) |
| $20,000 to $24,999 | 15 (0.7%) | 44 (32.6%) |
| $25,000 to $34,999 | 111 (5.2%) | 0 (0.0%) |
| $35,000 to $49,999 | 85 (4.0%) | 43 (31.9%) |
| $50,000 to $74,999 | 403 (18.8%) | 35 (25.9%) |
| $75,000 to $99,999 | 189 (8.8%) | 0 (0.0%) |
| $100,000 to $149,999 | 668 (31.1%) | 0 (0.0%) |
| $150,000 or more | 570 (26.5%) | 0 (0.0%) |
| Total | 2,149 (100.0%) | 135 (100.0%) |
Monthly Housing Cost Tiers in Byron Center
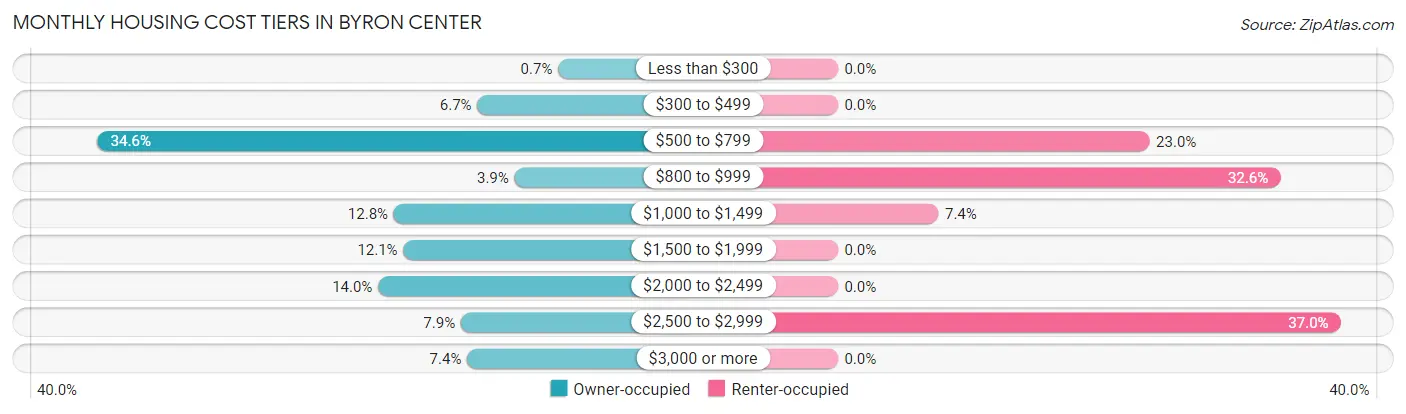
| Monthly Cost | Owner-occupied | Renter-occupied |
| Less than $300 | 15 (0.7%) | 0 (0.0%) |
| $300 to $499 | 143 (6.7%) | 0 (0.0%) |
| $500 to $799 | 744 (34.6%) | 31 (23.0%) |
| $800 to $999 | 84 (3.9%) | 44 (32.6%) |
| $1,000 to $1,499 | 275 (12.8%) | 10 (7.4%) |
| $1,500 to $1,999 | 260 (12.1%) | 0 (0.0%) |
| $2,000 to $2,499 | 300 (14.0%) | 0 (0.0%) |
| $2,500 to $2,999 | 169 (7.9%) | 50 (37.0%) |
| $3,000 or more | 159 (7.4%) | 0 (0.0%) |
| Total | 2,149 (100.0%) | 135 (100.0%) |
Physical Housing Characteristics in Byron Center
Housing Structures in Byron Center
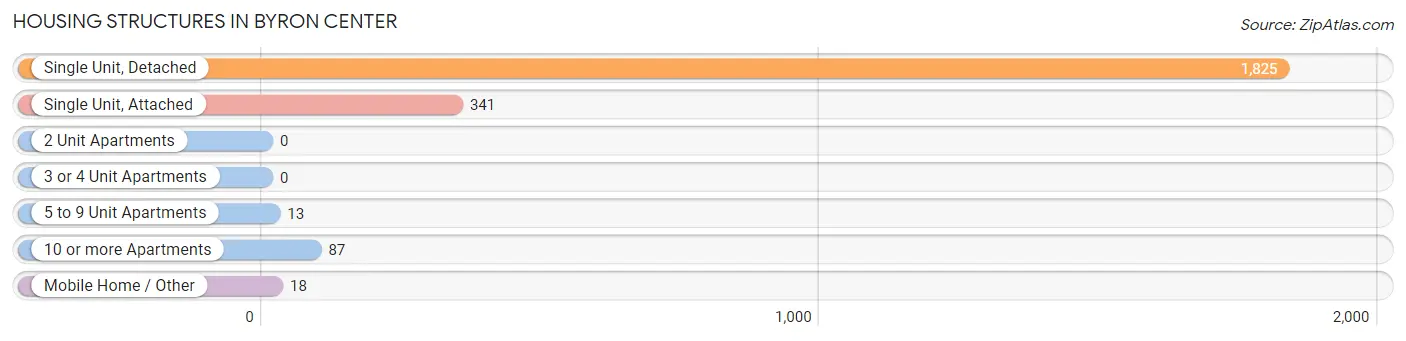
| Structure Type | # Housing Units | % Housing Units |
| Single Unit, Detached | 1,825 | 79.9% |
| Single Unit, Attached | 341 | 14.9% |
| 2 Unit Apartments | 0 | 0.0% |
| 3 or 4 Unit Apartments | 0 | 0.0% |
| 5 to 9 Unit Apartments | 13 | 0.6% |
| 10 or more Apartments | 87 | 3.8% |
| Mobile Home / Other | 18 | 0.8% |
| Total | 2,284 | 100.0% |
Housing Structures by Occupancy in Byron Center
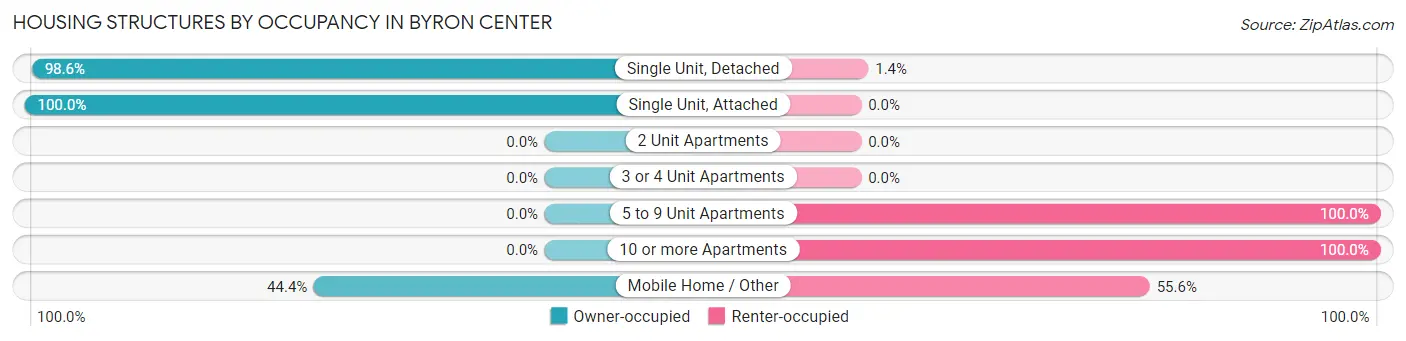
| Structure Type | Owner-occupied | Renter-occupied |
| Single Unit, Detached | 1,800 (98.6%) | 25 (1.4%) |
| Single Unit, Attached | 341 (100.0%) | 0 (0.0%) |
| 2 Unit Apartments | 0 (0.0%) | 0 (0.0%) |
| 3 or 4 Unit Apartments | 0 (0.0%) | 0 (0.0%) |
| 5 to 9 Unit Apartments | 0 (0.0%) | 13 (100.0%) |
| 10 or more Apartments | 0 (0.0%) | 87 (100.0%) |
| Mobile Home / Other | 8 (44.4%) | 10 (55.6%) |
| Total | 2,149 (94.1%) | 135 (5.9%) |
Housing Structures by Number of Rooms in Byron Center
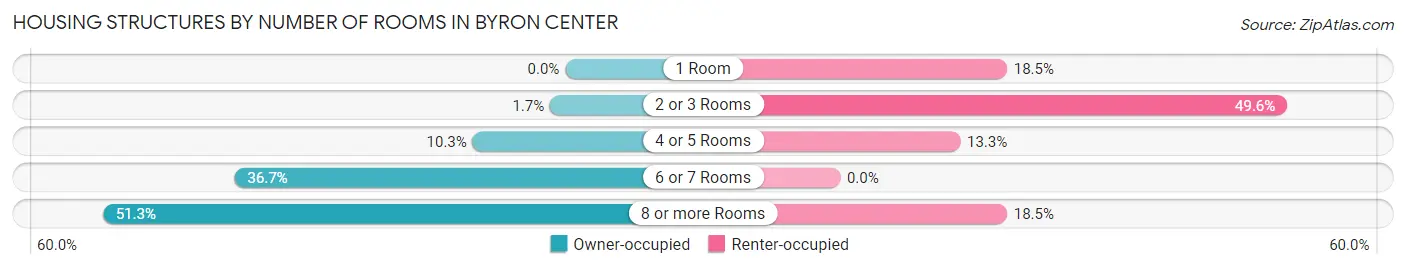
| Number of Rooms | Owner-occupied | Renter-occupied |
| 1 Room | 0 (0.0%) | 25 (18.5%) |
| 2 or 3 Rooms | 36 (1.7%) | 67 (49.6%) |
| 4 or 5 Rooms | 221 (10.3%) | 18 (13.3%) |
| 6 or 7 Rooms | 789 (36.7%) | 0 (0.0%) |
| 8 or more Rooms | 1,103 (51.3%) | 25 (18.5%) |
| Total | 2,149 (100.0%) | 135 (100.0%) |
Housing Structure by Heating Type in Byron Center
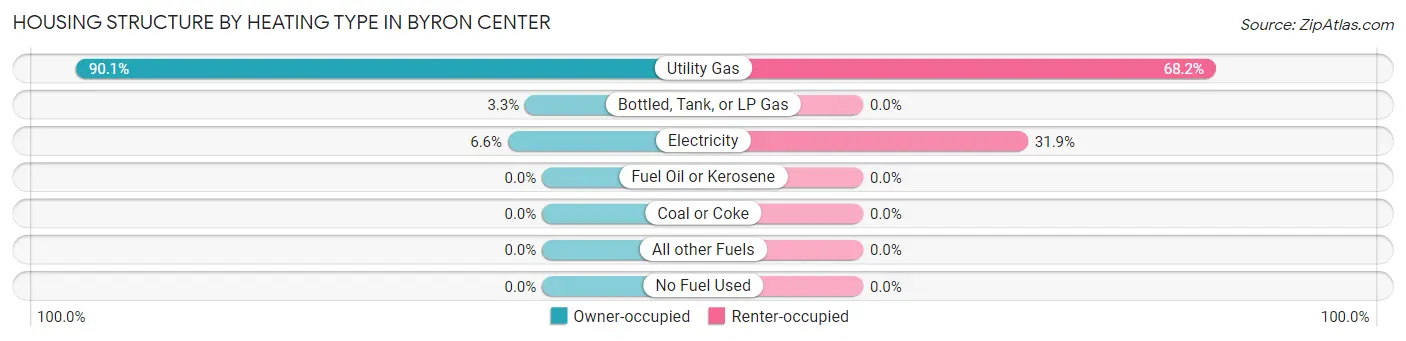
| Heating Type | Owner-occupied | Renter-occupied |
| Utility Gas | 1,936 (90.1%) | 92 (68.1%) |
| Bottled, Tank, or LP Gas | 71 (3.3%) | 0 (0.0%) |
| Electricity | 142 (6.6%) | 43 (31.9%) |
| Fuel Oil or Kerosene | 0 (0.0%) | 0 (0.0%) |
| Coal or Coke | 0 (0.0%) | 0 (0.0%) |
| All other Fuels | 0 (0.0%) | 0 (0.0%) |
| No Fuel Used | 0 (0.0%) | 0 (0.0%) |
| Total | 2,149 (100.0%) | 135 (100.0%) |
Household Vehicle Usage in Byron Center
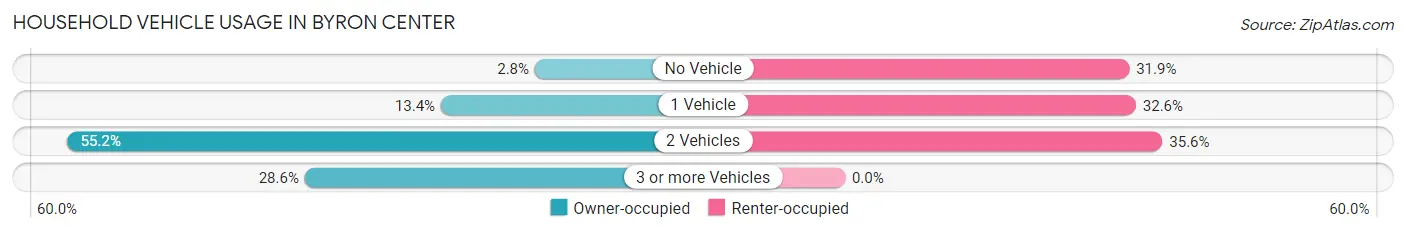
| Vehicles per Household | Owner-occupied | Renter-occupied |
| No Vehicle | 61 (2.8%) | 43 (31.9%) |
| 1 Vehicle | 287 (13.4%) | 44 (32.6%) |
| 2 Vehicles | 1,186 (55.2%) | 48 (35.6%) |
| 3 or more Vehicles | 615 (28.6%) | 0 (0.0%) |
| Total | 2,149 (100.0%) | 135 (100.0%) |
Real Estate & Mortgages in Byron Center
Real Estate and Mortgage Overview in Byron Center
| Characteristic | Without Mortgage | With Mortgage |
| Housing Units | 1,028 | 1,121 |
| Median Property Value | $289,900 | $370,700 |
| Median Household Income | $95,449 | $303 |
| Monthly Housing Costs | $629 | $159 |
| Real Estate Taxes | $3,195 | $4 |
Property Value by Mortgage Status in Byron Center
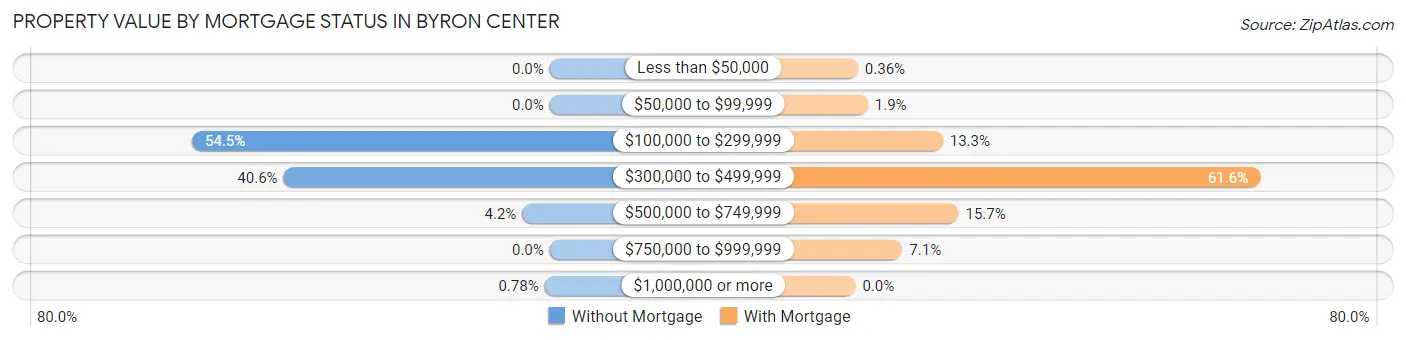
| Property Value | Without Mortgage | With Mortgage |
| Less than $50,000 | 0 (0.0%) | 4 (0.4%) |
| $50,000 to $99,999 | 0 (0.0%) | 21 (1.9%) |
| $100,000 to $299,999 | 560 (54.5%) | 149 (13.3%) |
| $300,000 to $499,999 | 417 (40.6%) | 691 (61.6%) |
| $500,000 to $749,999 | 43 (4.2%) | 176 (15.7%) |
| $750,000 to $999,999 | 0 (0.0%) | 80 (7.1%) |
| $1,000,000 or more | 8 (0.8%) | 0 (0.0%) |
| Total | 1,028 (100.0%) | 1,121 (100.0%) |
Household Income by Mortgage Status in Byron Center
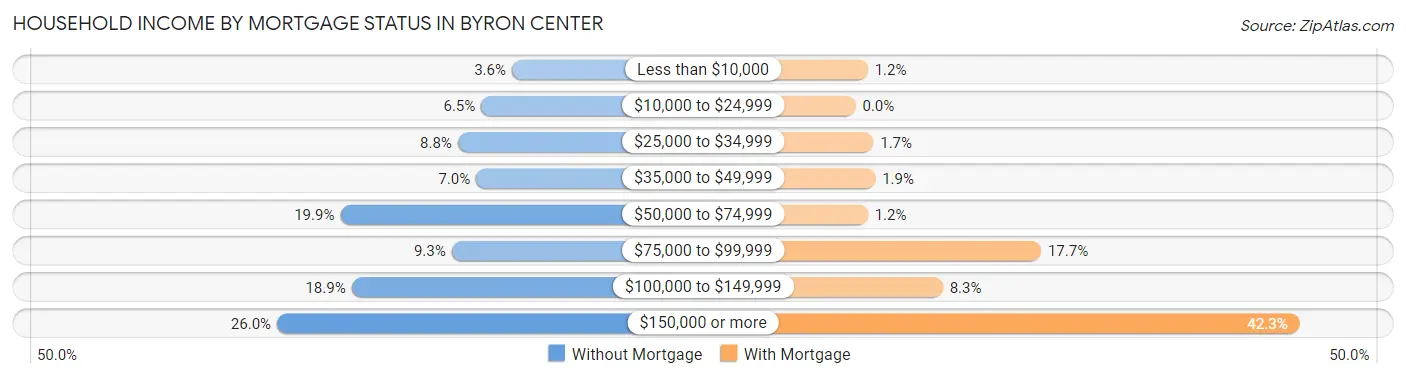
| Household Income | Without Mortgage | With Mortgage |
| Less than $10,000 | 37 (3.6%) | 13 (1.2%) |
| $10,000 to $24,999 | 67 (6.5%) | 0 (0.0%) |
| $25,000 to $34,999 | 90 (8.7%) | 19 (1.7%) |
| $35,000 to $49,999 | 72 (7.0%) | 21 (1.9%) |
| $50,000 to $74,999 | 205 (19.9%) | 13 (1.2%) |
| $75,000 to $99,999 | 96 (9.3%) | 198 (17.7%) |
| $100,000 to $149,999 | 194 (18.9%) | 93 (8.3%) |
| $150,000 or more | 267 (26.0%) | 474 (42.3%) |
| Total | 1,028 (100.0%) | 1,121 (100.0%) |
Property Value to Household Income Ratio in Byron Center
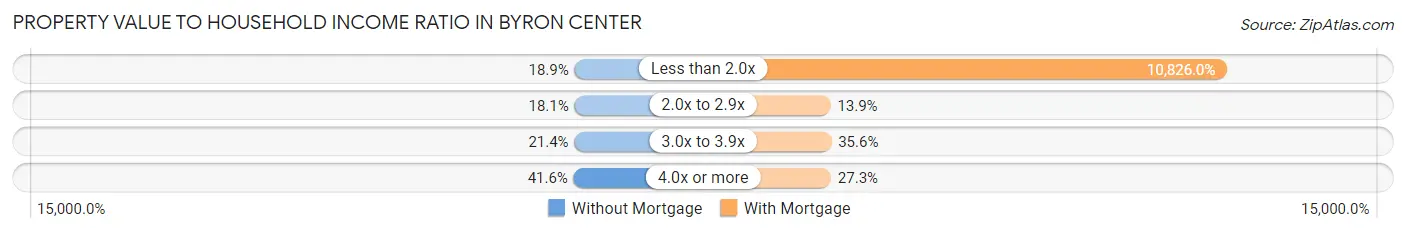
| Value-to-Income Ratio | Without Mortgage | With Mortgage |
| Less than 2.0x | 194 (18.9%) | 121,359 (10,826.0%) |
| 2.0x to 2.9x | 186 (18.1%) | 156 (13.9%) |
| 3.0x to 3.9x | 220 (21.4%) | 399 (35.6%) |
| 4.0x or more | 428 (41.6%) | 306 (27.3%) |
| Total | 1,028 (100.0%) | 1,121 (100.0%) |
Real Estate Taxes by Mortgage Status in Byron Center
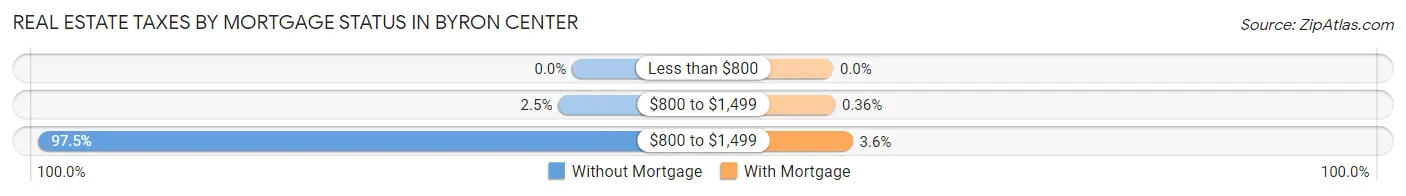
| Property Taxes | Without Mortgage | With Mortgage |
| Less than $800 | 0 (0.0%) | 0 (0.0%) |
| $800 to $1,499 | 26 (2.5%) | 4 (0.4%) |
| $800 to $1,499 | 1,002 (97.5%) | 40 (3.6%) |
| Total | 1,028 (100.0%) | 1,121 (100.0%) |
Health & Disability in Byron Center
Health Insurance Coverage by Age in Byron Center
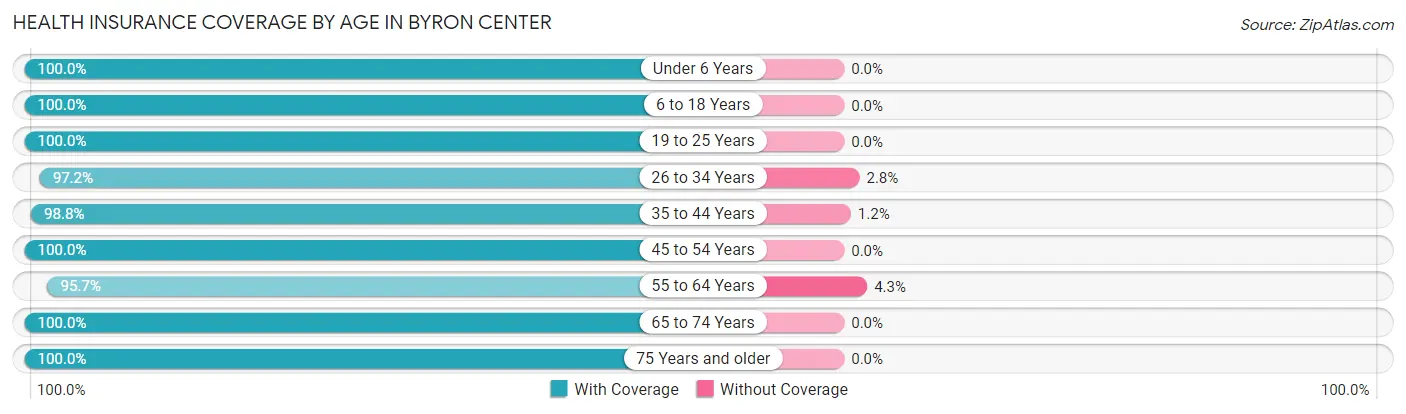
| Age Bracket | With Coverage | Without Coverage |
| Under 6 Years | 477 (100.0%) | 0 (0.0%) |
| 6 to 18 Years | 1,682 (100.0%) | 0 (0.0%) |
| 19 to 25 Years | 397 (100.0%) | 0 (0.0%) |
| 26 to 34 Years | 445 (97.2%) | 13 (2.8%) |
| 35 to 44 Years | 1,044 (98.8%) | 13 (1.2%) |
| 45 to 54 Years | 832 (100.0%) | 0 (0.0%) |
| 55 to 64 Years | 782 (95.7%) | 35 (4.3%) |
| 65 to 74 Years | 865 (100.0%) | 0 (0.0%) |
| 75 Years and older | 403 (100.0%) | 0 (0.0%) |
| Total | 6,927 (99.1%) | 61 (0.9%) |
Health Insurance Coverage by Citizenship Status in Byron Center
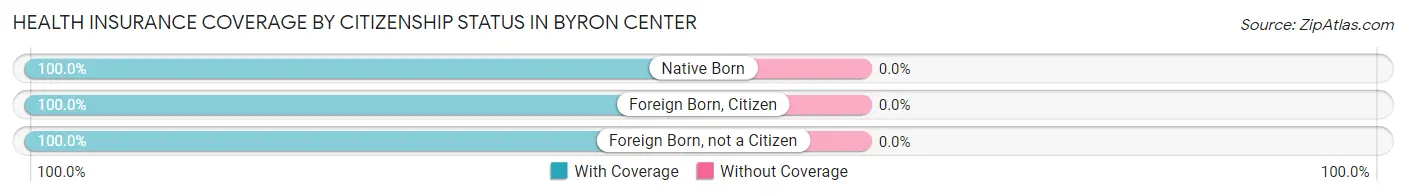
| Citizenship Status | With Coverage | Without Coverage |
| Native Born | 477 (100.0%) | 0 (0.0%) |
| Foreign Born, Citizen | 1,682 (100.0%) | 0 (0.0%) |
| Foreign Born, not a Citizen | 397 (100.0%) | 0 (0.0%) |
Health Insurance Coverage by Household Income in Byron Center
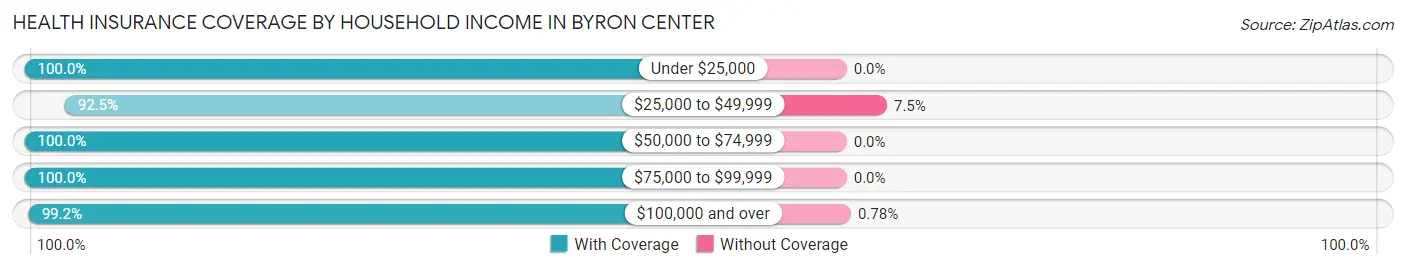
| Household Income | With Coverage | Without Coverage |
| Under $25,000 | 219 (100.0%) | 0 (0.0%) |
| $25,000 to $49,999 | 319 (92.5%) | 26 (7.5%) |
| $50,000 to $74,999 | 1,306 (100.0%) | 0 (0.0%) |
| $75,000 to $99,999 | 587 (100.0%) | 0 (0.0%) |
| $100,000 and over | 4,453 (99.2%) | 35 (0.8%) |
Public vs Private Health Insurance Coverage by Age in Byron Center
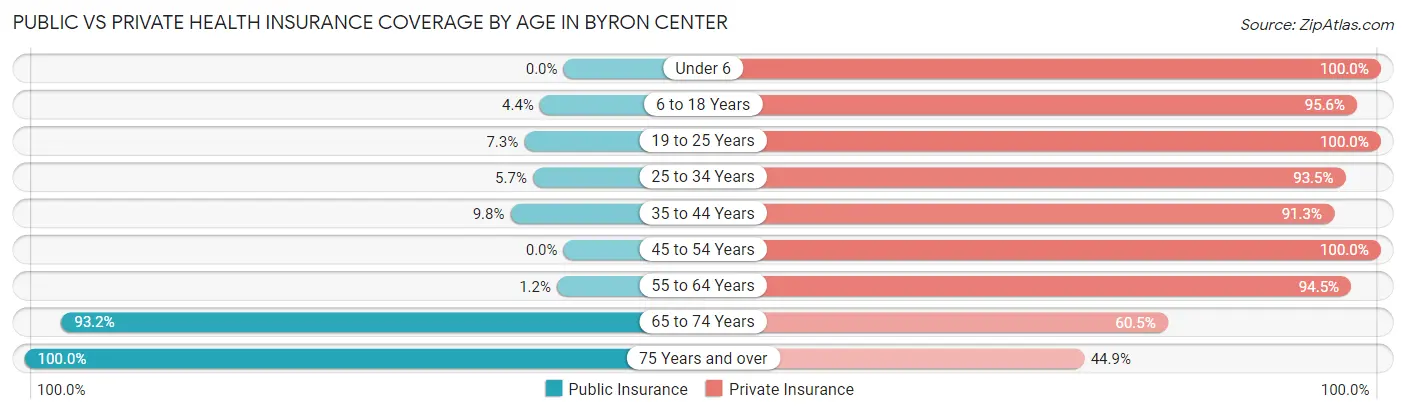
| Age Bracket | Public Insurance | Private Insurance |
| Under 6 | 0 (0.0%) | 477 (100.0%) |
| 6 to 18 Years | 74 (4.4%) | 1,608 (95.6%) |
| 19 to 25 Years | 29 (7.3%) | 397 (100.0%) |
| 25 to 34 Years | 26 (5.7%) | 428 (93.4%) |
| 35 to 44 Years | 104 (9.8%) | 965 (91.3%) |
| 45 to 54 Years | 0 (0.0%) | 832 (100.0%) |
| 55 to 64 Years | 10 (1.2%) | 772 (94.5%) |
| 65 to 74 Years | 806 (93.2%) | 523 (60.5%) |
| 75 Years and over | 403 (100.0%) | 181 (44.9%) |
| Total | 1,452 (20.8%) | 6,183 (88.5%) |
Disability Status by Sex by Age in Byron Center
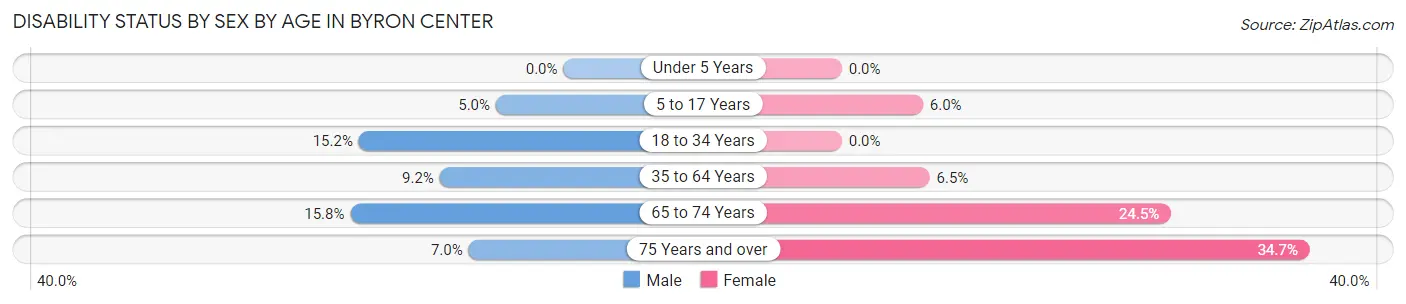
| Age Bracket | Male | Female |
| Under 5 Years | 0 (0.0%) | 0 (0.0%) |
| 5 to 17 Years | 40 (5.0%) | 50 (6.0%) |
| 18 to 34 Years | 84 (15.2%) | 0 (0.0%) |
| 35 to 64 Years | 126 (9.2%) | 87 (6.5%) |
| 65 to 74 Years | 65 (15.8%) | 111 (24.4%) |
| 75 Years and over | 15 (7.0%) | 66 (34.7%) |
Disability Class by Sex by Age in Byron Center
Disability Class: Hearing Difficulty
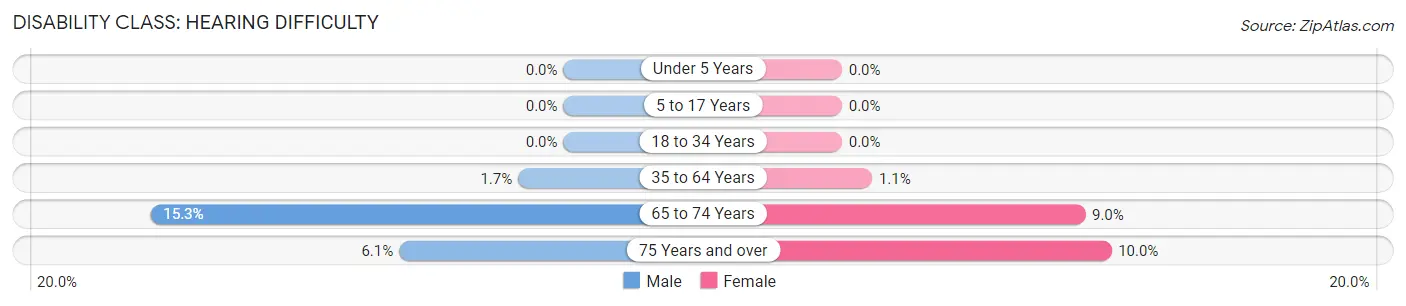
| Age Bracket | Male | Female |
| Under 5 Years | 0 (0.0%) | 0 (0.0%) |
| 5 to 17 Years | 0 (0.0%) | 0 (0.0%) |
| 18 to 34 Years | 0 (0.0%) | 0 (0.0%) |
| 35 to 64 Years | 23 (1.7%) | 15 (1.1%) |
| 65 to 74 Years | 63 (15.3%) | 41 (9.0%) |
| 75 Years and over | 13 (6.1%) | 19 (10.0%) |
Disability Class: Vision Difficulty
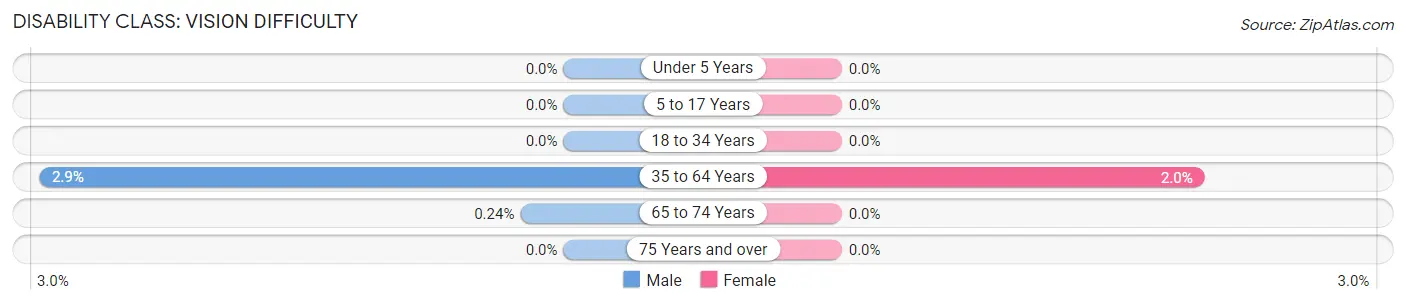
| Age Bracket | Male | Female |
| Under 5 Years | 0 (0.0%) | 0 (0.0%) |
| 5 to 17 Years | 0 (0.0%) | 0 (0.0%) |
| 18 to 34 Years | 0 (0.0%) | 0 (0.0%) |
| 35 to 64 Years | 40 (2.9%) | 27 (2.0%) |
| 65 to 74 Years | 1 (0.2%) | 0 (0.0%) |
| 75 Years and over | 0 (0.0%) | 0 (0.0%) |
Disability Class: Cognitive Difficulty
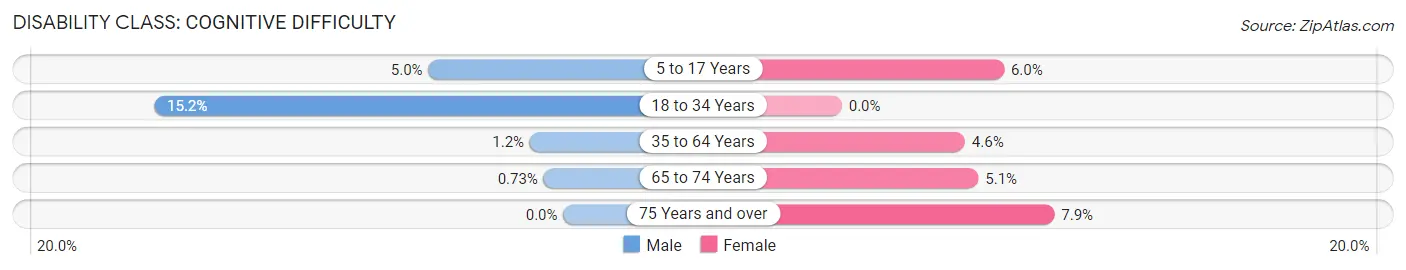
| Age Bracket | Male | Female |
| 5 to 17 Years | 40 (5.0%) | 50 (6.0%) |
| 18 to 34 Years | 84 (15.2%) | 0 (0.0%) |
| 35 to 64 Years | 17 (1.2%) | 61 (4.6%) |
| 65 to 74 Years | 3 (0.7%) | 23 (5.1%) |
| 75 Years and over | 0 (0.0%) | 15 (7.9%) |
Disability Class: Ambulatory Difficulty
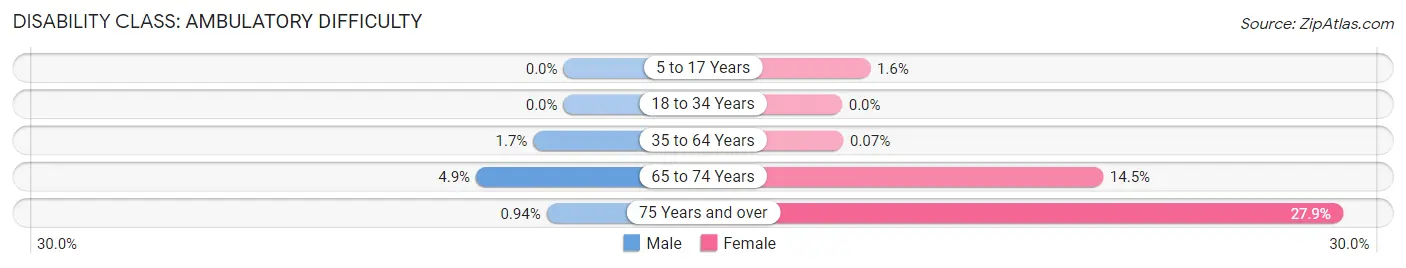
| Age Bracket | Male | Female |
| 5 to 17 Years | 0 (0.0%) | 13 (1.6%) |
| 18 to 34 Years | 0 (0.0%) | 0 (0.0%) |
| 35 to 64 Years | 23 (1.7%) | 1 (0.1%) |
| 65 to 74 Years | 20 (4.9%) | 66 (14.5%) |
| 75 Years and over | 2 (0.9%) | 53 (27.9%) |
Disability Class: Self-Care Difficulty
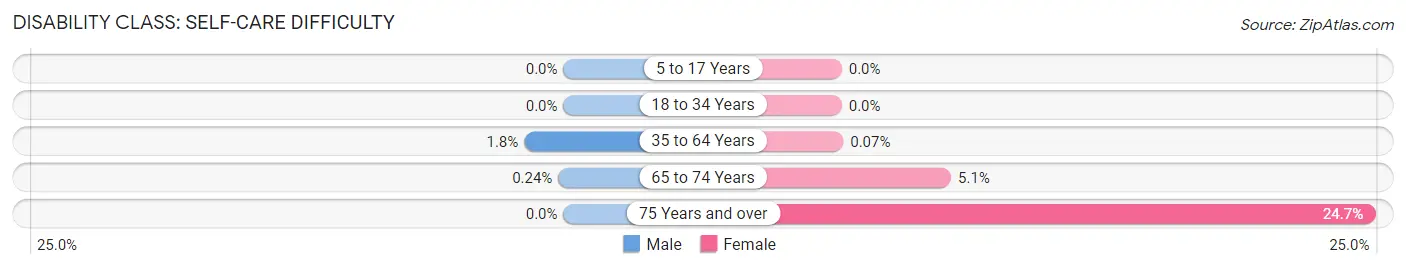
| Age Bracket | Male | Female |
| 5 to 17 Years | 0 (0.0%) | 0 (0.0%) |
| 18 to 34 Years | 0 (0.0%) | 0 (0.0%) |
| 35 to 64 Years | 25 (1.8%) | 1 (0.1%) |
| 65 to 74 Years | 1 (0.2%) | 23 (5.1%) |
| 75 Years and over | 0 (0.0%) | 47 (24.7%) |
Technology Access in Byron Center
Computing Device Access in Byron Center
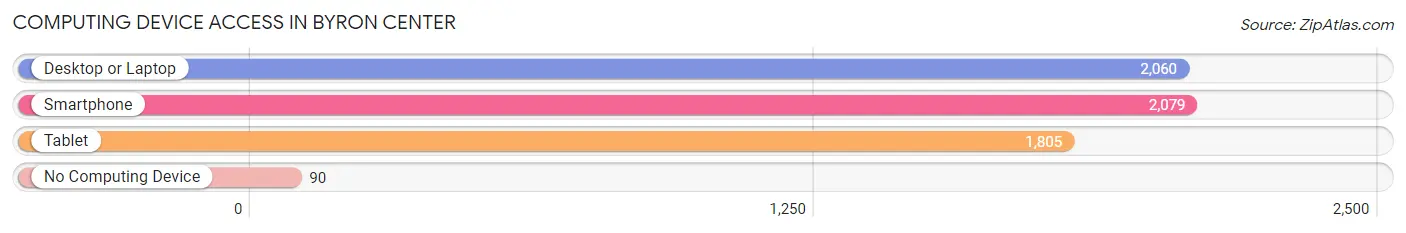
| Device Type | # Households | % Households |
| Desktop or Laptop | 2,060 | 90.2% |
| Smartphone | 2,079 | 91.0% |
| Tablet | 1,805 | 79.0% |
| No Computing Device | 90 | 3.9% |
| Total | 2,284 | 100.0% |
Internet Access in Byron Center
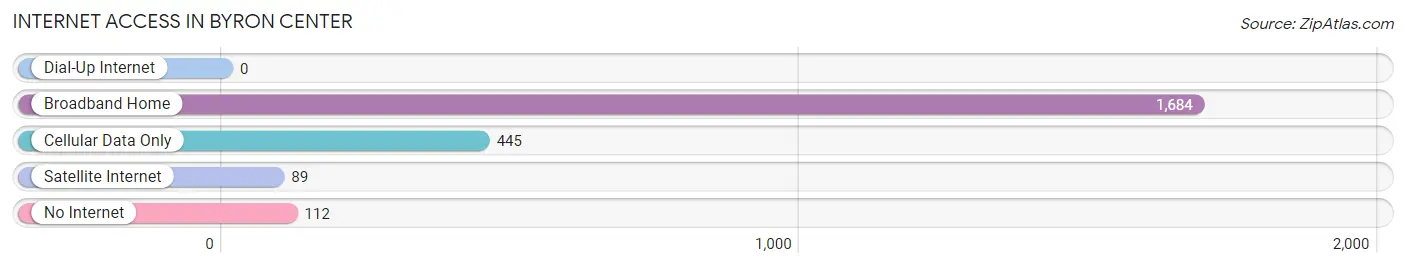
| Internet Type | # Households | % Households |
| Dial-Up Internet | 0 | 0.0% |
| Broadband Home | 1,684 | 73.7% |
| Cellular Data Only | 445 | 19.5% |
| Satellite Internet | 89 | 3.9% |
| No Internet | 112 | 4.9% |
| Total | 2,284 | 100.0% |
Byron Center Summary
Byron Center is a small unincorporated community located in Kent County, Michigan. It is situated in the southwestern corner of the county, just south of Grand Rapids. The community is bordered by the cities of Grandville, Wyoming, and Kentwood. The population of Byron Center was estimated to be 8,845 in 2019.
History
Byron Center was first settled in 1837 by a group of Dutch immigrants led by John Van Singel. The area was originally known as Singel’s Corners, but was later renamed after the poet Lord Byron. The first post office was established in 1845 and the village was officially incorporated in 1867.
Byron Center was a rural farming community for much of its history. In the late 19th century, the village was home to a number of small businesses, including a sawmill, a grist mill, a blacksmith shop, and a general store. In the early 20th century, the village began to grow as more people moved to the area. The village was home to a number of small businesses, including a grocery store, a hardware store, a bank, and a movie theater.
Geography
Byron Center is located in southwestern Kent County, Michigan. It is situated on the Grand River, just south of Grand Rapids. The village is bordered by the cities of Grandville, Wyoming, and Kentwood. The total area of the village is 4.2 square miles, with a population density of 2,093 people per square mile.
The village is located in a flat, low-lying area, with an elevation of 690 feet above sea level. The climate is humid continental, with hot summers and cold winters. The average annual temperature is 48°F, with an average high of 73°F in the summer and an average low of 24°F in the winter.
Economy
Byron Center is a small, rural community with a largely agricultural economy. The village is home to a number of small businesses, including a grocery store, a hardware store, a bank, and a movie theater. The village is also home to a number of manufacturing companies, including a furniture manufacturer, a plastics manufacturer, and a metal fabrication company.
The village is also home to a number of retail stores, including a Walmart Supercenter, a Meijer, and a number of smaller stores. The village is also home to a number of restaurants, including a McDonald’s, a Subway, and a number of local eateries.
Demographics
Byron Center is a small, rural community with a population of 8,845 in 2019. The population is largely white (94.3%), with a small percentage of African Americans (2.2%), Asians (1.3%), and Hispanics (1.2%). The median household income is $63,945, and the median home value is $212,400. The village is home to a number of churches, including a Catholic church, a Methodist church, and a Presbyterian church.
Common Questions
What is Per Capita Income in Byron Center?
Per Capita income in Byron Center is $39,981.
What is the Median Family Income in Byron Center?
Median Family Income in Byron Center is $111,122.
What is the Median Household income in Byron Center?
Median Household Income in Byron Center is $102,376.
What is Income or Wage Gap in Byron Center?
Income or Wage Gap in Byron Center is 70.6%.
Women in Byron Center earn 29.4 cents for every dollar earned by a man.
What is Inequality or Gini Index in Byron Center?
Inequality or Gini Index in Byron Center is 0.40.
What is the Total Population of Byron Center?
Total Population of Byron Center is 6,988.
What is the Total Male Population of Byron Center?
Total Male Population of Byron Center is 3,511.
What is the Total Female Population of Byron Center?
Total Female Population of Byron Center is 3,477.
What is the Ratio of Males per 100 Females in Byron Center?
There are 100.98 Males per 100 Females in Byron Center.
What is the Ratio of Females per 100 Males in Byron Center?
There are 99.03 Females per 100 Males in Byron Center.
What is the Median Population Age in Byron Center?
Median Population Age in Byron Center is 41.2 Years.
What is the Average Family Size in Byron Center
Average Family Size in Byron Center is 3.3 People.
What is the Average Household Size in Byron Center
Average Household Size in Byron Center is 3.0 People.
How Large is the Labor Force in Byron Center?
There are 3,418 People in the Labor Forcein in Byron Center.
What is the Percentage of People in the Labor Force in Byron Center?
64.8% of People are in the Labor Force in Byron Center.
What is the Unemployment Rate in Byron Center?
Unemployment Rate in Byron Center is 2.2%.