Grosse Pointe Farms, MI Map & Demographics
Grosse Pointe Farms Map
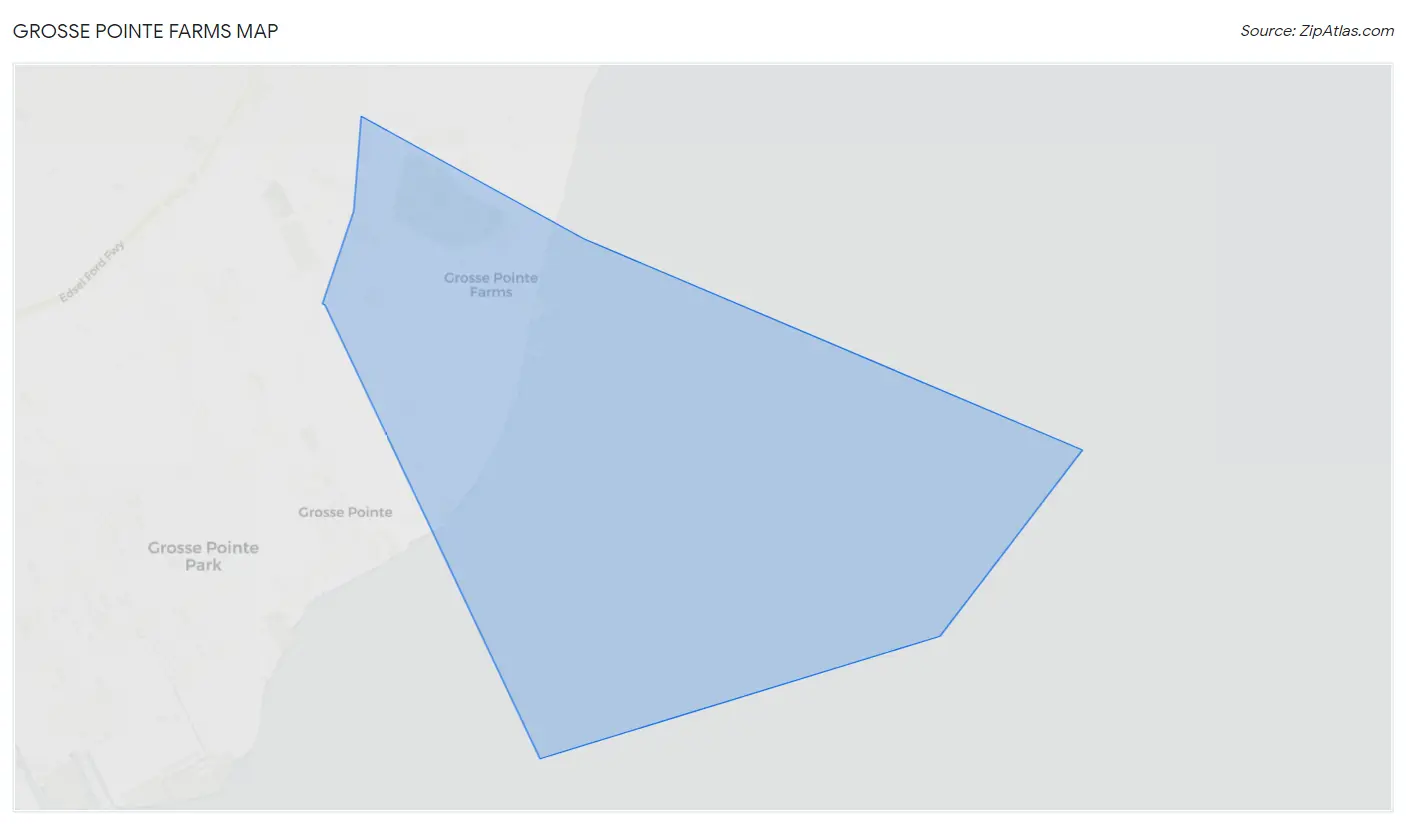
Grosse Pointe Farms Overview
$89,962
PER CAPITA INCOME
$179,504
AVG FAMILY INCOME
$156,465
AVG HOUSEHOLD INCOME
43.9%
WAGE / INCOME GAP [ % ]
56.1¢/ $1
WAGE / INCOME GAP [ $ ]
0.46
INEQUALITY / GINI INDEX
10,018
TOTAL POPULATION
5,041
MALE POPULATION
4,977
FEMALE POPULATION
101.29
MALES / 100 FEMALES
98.73
FEMALES / 100 MALES
51.4
MEDIAN AGE
2.9
AVG FAMILY SIZE
2.4
AVG HOUSEHOLD SIZE
5,285
LABOR FORCE [ PEOPLE ]
65.0%
PERCENT IN LABOR FORCE
2.7%
UNEMPLOYMENT RATE
Grosse Pointe Farms Area Codes
Income in Grosse Pointe Farms
Income Overview in Grosse Pointe Farms
Per Capita Income in Grosse Pointe Farms is $89,962, while median incomes of families and households are $179,504 and $156,465 respectively.
| Characteristic | Number | Measure |
| Per Capita Income | 10,018 | $89,962 |
| Median Family Income | 2,933 | $179,504 |
| Mean Family Income | 2,933 | $246,042 |
| Median Household Income | 4,186 | $156,465 |
| Mean Household Income | 4,186 | $212,215 |
| Income Deficit | 2,933 | $0 |
| Wage / Income Gap (%) | 10,018 | 43.88% |
| Wage / Income Gap ($) | 10,018 | 56.12¢ per $1 |
| Gini / Inequality Index | 10,018 | 0.46 |
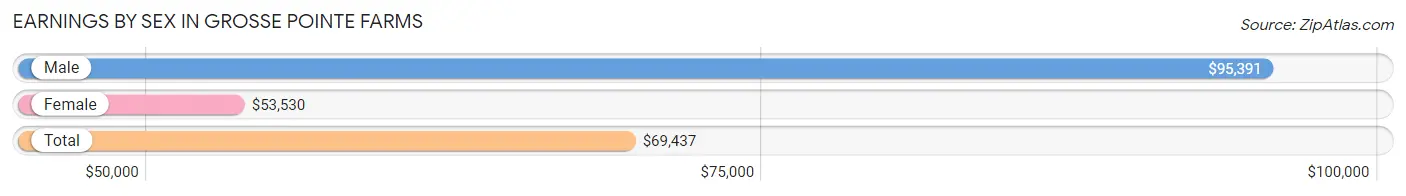
Earnings by Sex in Grosse Pointe Farms
Average Earnings in Grosse Pointe Farms are $69,437, $95,391 for men and $53,530 for women, a difference of 43.9%.
| Sex | Number | Average Earnings |
| Male | 3,002 (53.6%) | $95,391 |
| Female | 2,601 (46.4%) | $53,530 |
| Total | 5,603 (100.0%) | $69,437 |
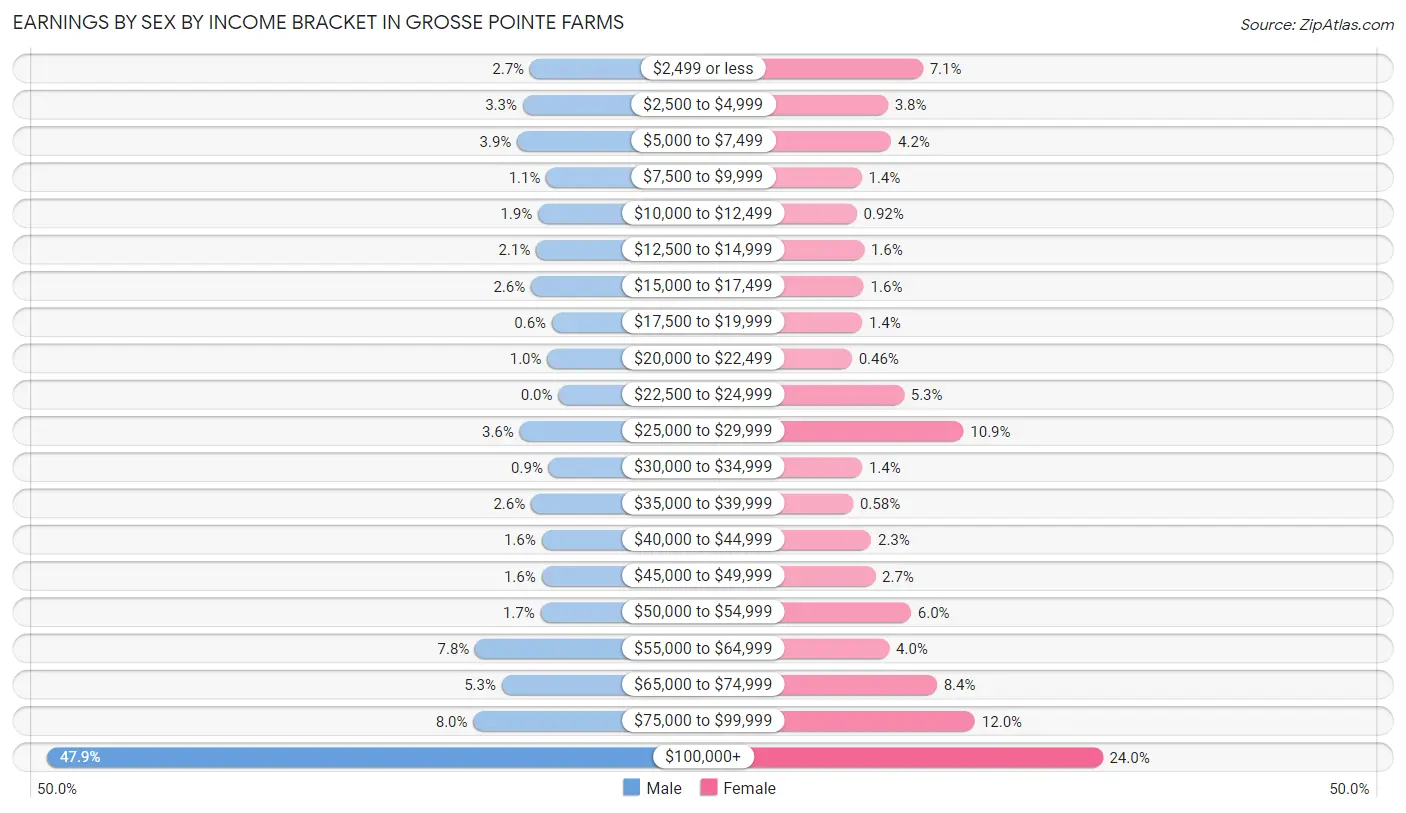
Earnings by Sex by Income Bracket in Grosse Pointe Farms
The most common earnings brackets in Grosse Pointe Farms are $100,000+ for men (1,438 | 47.9%) and $100,000+ for women (623 | 23.9%).
| Income | Male | Female |
| $2,499 or less | 80 (2.7%) | 185 (7.1%) |
| $2,500 to $4,999 | 100 (3.3%) | 100 (3.8%) |
| $5,000 to $7,499 | 116 (3.9%) | 108 (4.2%) |
| $7,500 to $9,999 | 34 (1.1%) | 36 (1.4%) |
| $10,000 to $12,499 | 57 (1.9%) | 24 (0.9%) |
| $12,500 to $14,999 | 62 (2.1%) | 42 (1.6%) |
| $15,000 to $17,499 | 77 (2.6%) | 41 (1.6%) |
| $17,500 to $19,999 | 18 (0.6%) | 37 (1.4%) |
| $20,000 to $22,499 | 31 (1.0%) | 12 (0.5%) |
| $22,500 to $24,999 | 0 (0.0%) | 139 (5.3%) |
| $25,000 to $29,999 | 109 (3.6%) | 284 (10.9%) |
| $30,000 to $34,999 | 27 (0.9%) | 37 (1.4%) |
| $35,000 to $39,999 | 77 (2.6%) | 15 (0.6%) |
| $40,000 to $44,999 | 47 (1.6%) | 59 (2.3%) |
| $45,000 to $49,999 | 47 (1.6%) | 69 (2.6%) |
| $50,000 to $54,999 | 50 (1.7%) | 156 (6.0%) |
| $55,000 to $64,999 | 234 (7.8%) | 103 (4.0%) |
| $65,000 to $74,999 | 159 (5.3%) | 219 (8.4%) |
| $75,000 to $99,999 | 239 (8.0%) | 312 (12.0%) |
| $100,000+ | 1,438 (47.9%) | 623 (23.9%) |
| Total | 3,002 (100.0%) | 2,601 (100.0%) |
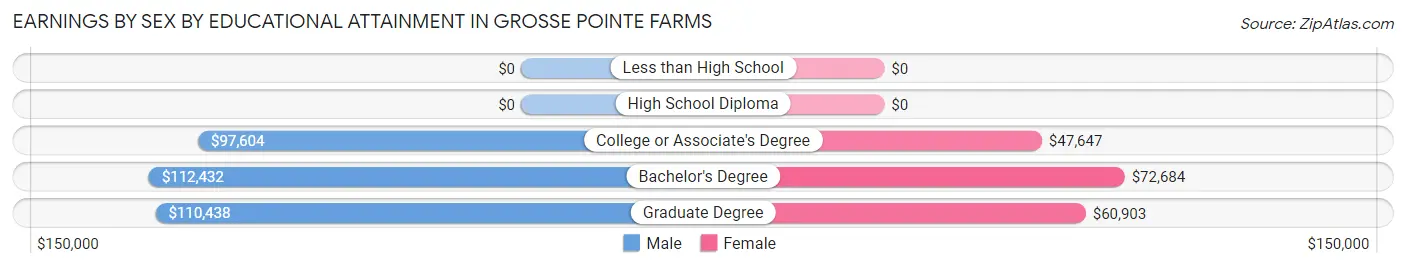
Earnings by Sex by Educational Attainment in Grosse Pointe Farms
Average earnings in Grosse Pointe Farms are $109,063 for men and $60,122 for women, a difference of 44.9%. Men with an educational attainment of bachelor's degree enjoy the highest average annual earnings of $112,432, while those with college or associate's degree education earn the least with $97,604. Women with an educational attainment of bachelor's degree earn the most with the average annual earnings of $72,684, while those with college or associate's degree education have the smallest earnings of $47,647.
| Educational Attainment | Male Income | Female Income |
| Less than High School | - | - |
| High School Diploma | - | - |
| College or Associate's Degree | $97,604 | $47,647 |
| Bachelor's Degree | $112,432 | $72,684 |
| Graduate Degree | $110,438 | $60,903 |
| Total | $109,063 | $60,122 |
Family Income in Grosse Pointe Farms
Family Income Brackets in Grosse Pointe Farms
According to the Grosse Pointe Farms family income data, there are 1,261 families falling into the $200,000+ income range, which is the most common income bracket and makes up 43.0% of all families.
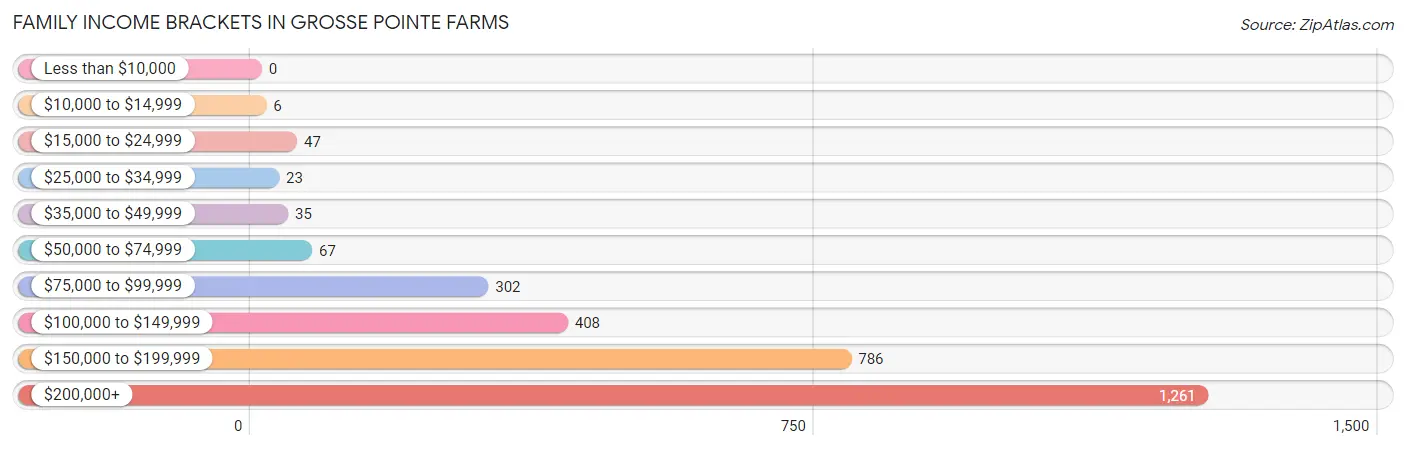
| Income Bracket | # Families | % Families |
| Less than $10,000 | 0 | 0.0% |
| $10,000 to $14,999 | 6 | 0.2% |
| $15,000 to $24,999 | 47 | 1.6% |
| $25,000 to $34,999 | 23 | 0.8% |
| $35,000 to $49,999 | 35 | 1.2% |
| $50,000 to $74,999 | 67 | 2.3% |
| $75,000 to $99,999 | 302 | 10.3% |
| $100,000 to $149,999 | 408 | 13.9% |
| $150,000 to $199,999 | 786 | 26.8% |
| $200,000+ | 1,261 | 43.0% |
Family Income by Famaliy Size in Grosse Pointe Farms
6-person families (45 | 1.5%) account for the highest median family income in Grosse Pointe Farms with $250,001 per family, while 2-person families (1,479 | 50.4%) have the highest median income of $87,812 per family member.
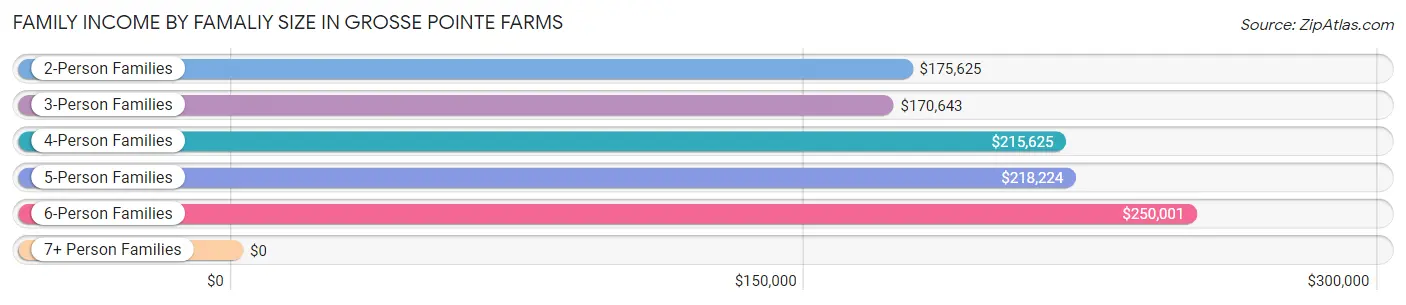
| Income Bracket | # Families | Median Income |
| 2-Person Families | 1,479 (50.4%) | $175,625 |
| 3-Person Families | 731 (24.9%) | $170,643 |
| 4-Person Families | 507 (17.3%) | $215,625 |
| 5-Person Families | 171 (5.8%) | $218,224 |
| 6-Person Families | 45 (1.5%) | $250,001 |
| 7+ Person Families | 0 (0.0%) | $0 |
| Total | 2,933 (100.0%) | $179,504 |
Family Income by Number of Earners in Grosse Pointe Farms
The median family income in Grosse Pointe Farms is $179,504, with families comprising 3+ earners (286) having the highest median family income of $250,001, while families with no earners (355) have the lowest median family income of $152,292, accounting for 9.8% and 12.1% of families, respectively.
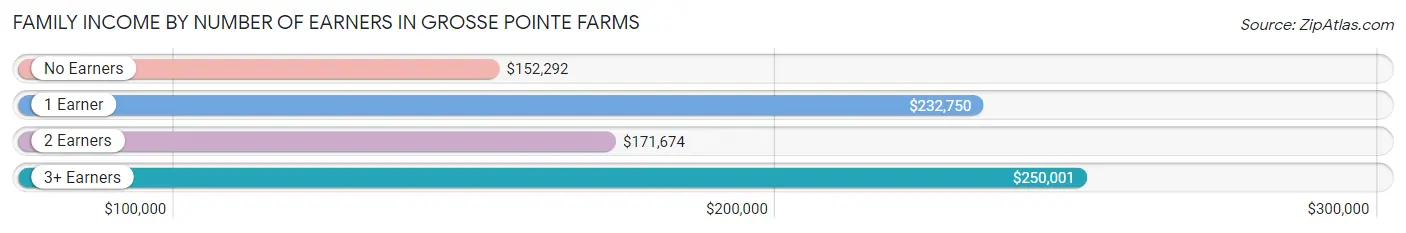
| Number of Earners | # Families | Median Income |
| No Earners | 355 (12.1%) | $152,292 |
| 1 Earner | 718 (24.5%) | $232,750 |
| 2 Earners | 1,574 (53.7%) | $171,674 |
| 3+ Earners | 286 (9.8%) | $250,001 |
| Total | 2,933 (100.0%) | $179,504 |
Household Income in Grosse Pointe Farms
Household Income Brackets in Grosse Pointe Farms
With 1,478 households falling in the category, the $200,000+ income range is the most frequent in Grosse Pointe Farms, accounting for 35.3% of all households. In contrast, only 29 households (0.7%) fall into the $10,000 to $14,999 income bracket, making it the least populous group.
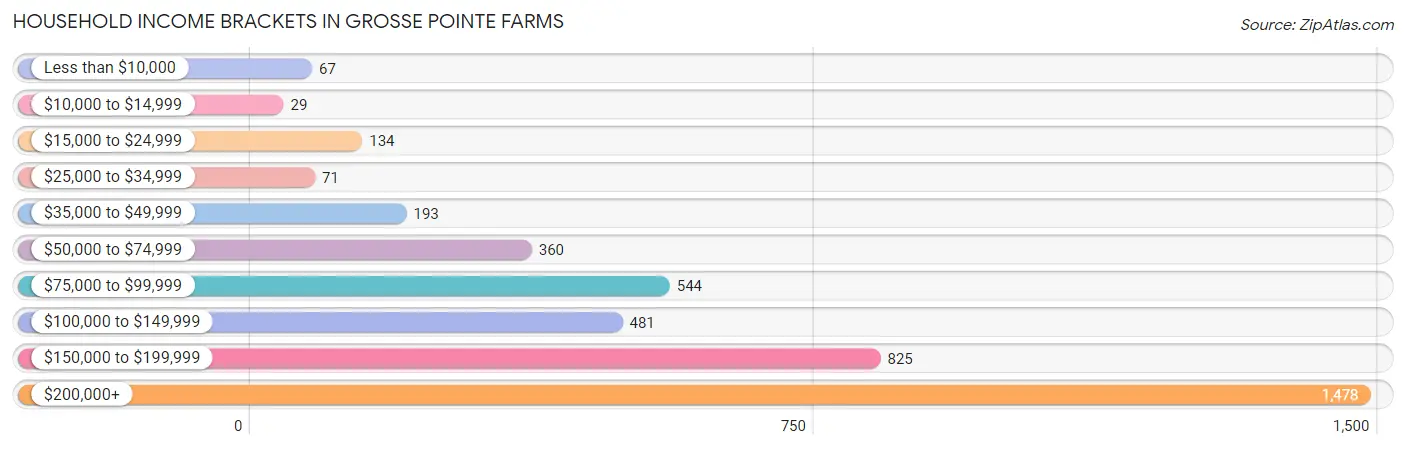
| Income Bracket | # Households | % Households |
| Less than $10,000 | 67 | 1.6% |
| $10,000 to $14,999 | 29 | 0.7% |
| $15,000 to $24,999 | 134 | 3.2% |
| $25,000 to $34,999 | 71 | 1.7% |
| $35,000 to $49,999 | 193 | 4.6% |
| $50,000 to $74,999 | 360 | 8.6% |
| $75,000 to $99,999 | 544 | 13.0% |
| $100,000 to $149,999 | 481 | 11.5% |
| $150,000 to $199,999 | 825 | 19.7% |
| $200,000+ | 1,478 | 35.3% |
Household Income by Householder Age in Grosse Pointe Farms
The median household income in Grosse Pointe Farms is $156,465, with the highest median household income of $172,341 found in the 45 to 64 years age bracket for the primary householder. A total of 1,699 households (40.6%) fall into this category.
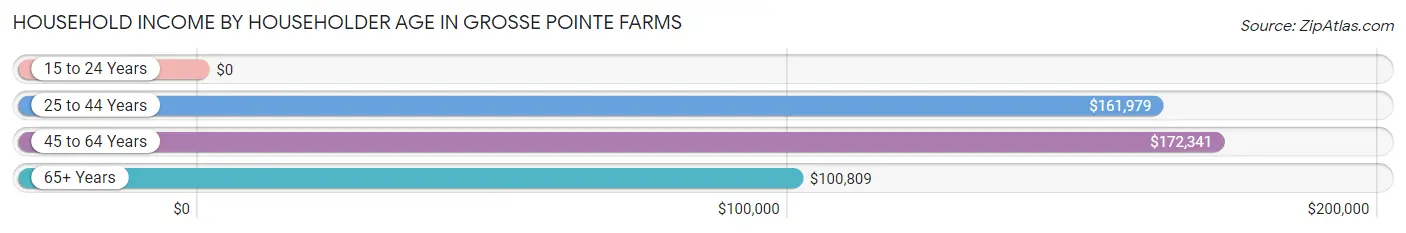
| Income Bracket | # Households | Median Income |
| 15 to 24 Years | 0 (0.0%) | $0 |
| 25 to 44 Years | 887 (21.2%) | $161,979 |
| 45 to 64 Years | 1,699 (40.6%) | $172,341 |
| 65+ Years | 1,600 (38.2%) | $100,809 |
| Total | 4,186 (100.0%) | $156,465 |
Poverty in Grosse Pointe Farms
Income Below Poverty by Sex and Age in Grosse Pointe Farms
With 1.9% poverty level for males and 3.8% for females among the residents of Grosse Pointe Farms, 16 and 17 year old males and under 5 year old females are the most vulnerable to poverty, with 9 males (13.9%) and 22 females (13.8%) in their respective age groups living below the poverty level.
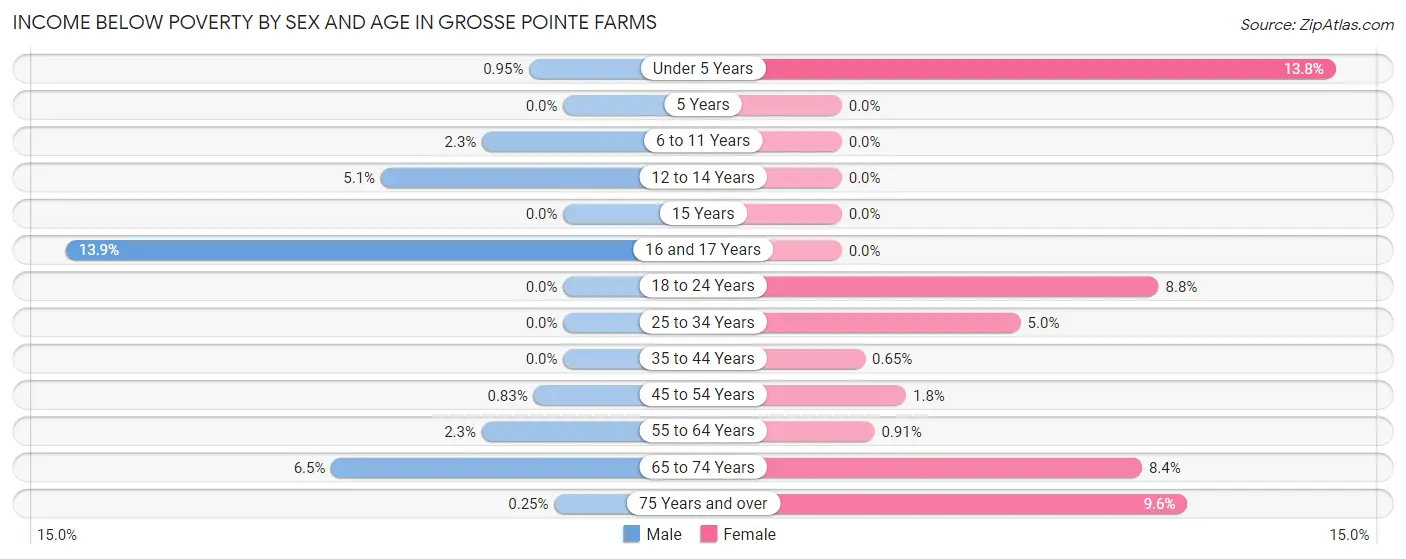
| Age Bracket | Male | Female |
| Under 5 Years | 5 (0.9%) | 22 (13.8%) |
| 5 Years | 0 (0.0%) | 0 (0.0%) |
| 6 to 11 Years | 5 (2.3%) | 0 (0.0%) |
| 12 to 14 Years | 9 (5.1%) | 0 (0.0%) |
| 15 Years | 0 (0.0%) | 0 (0.0%) |
| 16 and 17 Years | 9 (13.9%) | 0 (0.0%) |
| 18 to 24 Years | 0 (0.0%) | 15 (8.8%) |
| 25 to 34 Years | 0 (0.0%) | 11 (5.0%) |
| 35 to 44 Years | 0 (0.0%) | 5 (0.6%) |
| 45 to 54 Years | 5 (0.8%) | 9 (1.8%) |
| 55 to 64 Years | 21 (2.3%) | 10 (0.9%) |
| 65 to 74 Years | 42 (6.5%) | 54 (8.4%) |
| 75 Years and over | 1 (0.3%) | 65 (9.6%) |
| Total | 97 (1.9%) | 191 (3.8%) |
Income Above Poverty by Sex and Age in Grosse Pointe Farms
According to the poverty statistics in Grosse Pointe Farms, males aged 5 years and females aged 5 years are the age groups that are most secure financially, with 100.0% of males and 100.0% of females in these age groups living above the poverty line.
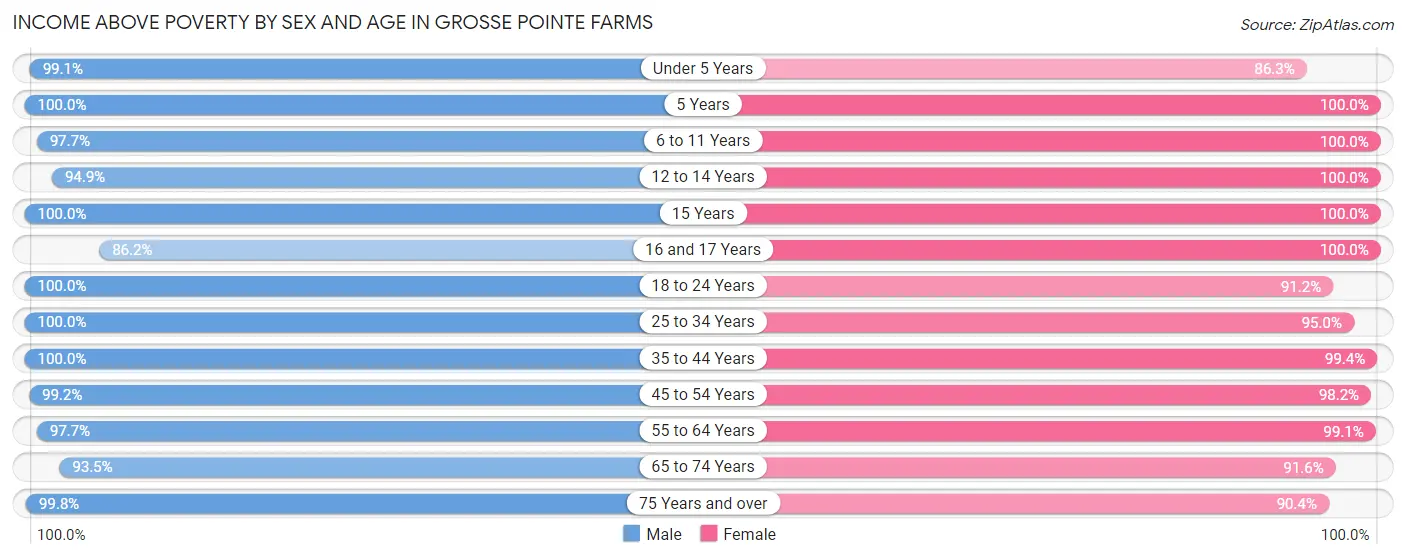
| Age Bracket | Male | Female |
| Under 5 Years | 523 (99.1%) | 138 (86.3%) |
| 5 Years | 86 (100.0%) | 30 (100.0%) |
| 6 to 11 Years | 216 (97.7%) | 426 (100.0%) |
| 12 to 14 Years | 168 (94.9%) | 118 (100.0%) |
| 15 Years | 112 (100.0%) | 29 (100.0%) |
| 16 and 17 Years | 56 (86.2%) | 118 (100.0%) |
| 18 to 24 Years | 249 (100.0%) | 155 (91.2%) |
| 25 to 34 Years | 325 (100.0%) | 210 (95.0%) |
| 35 to 44 Years | 682 (100.0%) | 770 (99.4%) |
| 45 to 54 Years | 594 (99.2%) | 495 (98.2%) |
| 55 to 64 Years | 905 (97.7%) | 1,083 (99.1%) |
| 65 to 74 Years | 608 (93.5%) | 592 (91.6%) |
| 75 Years and over | 398 (99.8%) | 611 (90.4%) |
| Total | 4,922 (98.1%) | 4,775 (96.2%) |
Income Below Poverty Among Married-Couple Families in Grosse Pointe Farms
The poverty statistics for married-couple families in Grosse Pointe Farms show that 1.5% or 40 of the total 2,720 families live below the poverty line. Families with 3 or 4 children have the highest poverty rate of 3.2%, comprising of 5 families. On the other hand, families with no children have the lowest poverty rate of 1.1%, which includes 18 families.
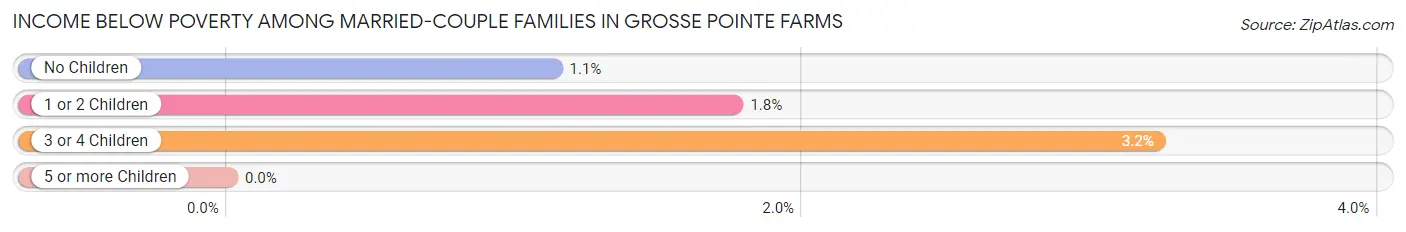
| Children | Above Poverty | Below Poverty |
| No Children | 1,581 (98.9%) | 18 (1.1%) |
| 1 or 2 Children | 949 (98.2%) | 17 (1.8%) |
| 3 or 4 Children | 150 (96.8%) | 5 (3.2%) |
| 5 or more Children | 0 (0.0%) | 0 (0.0%) |
| Total | 2,680 (98.5%) | 40 (1.5%) |
Income Below Poverty Among Single-Parent Households in Grosse Pointe Farms
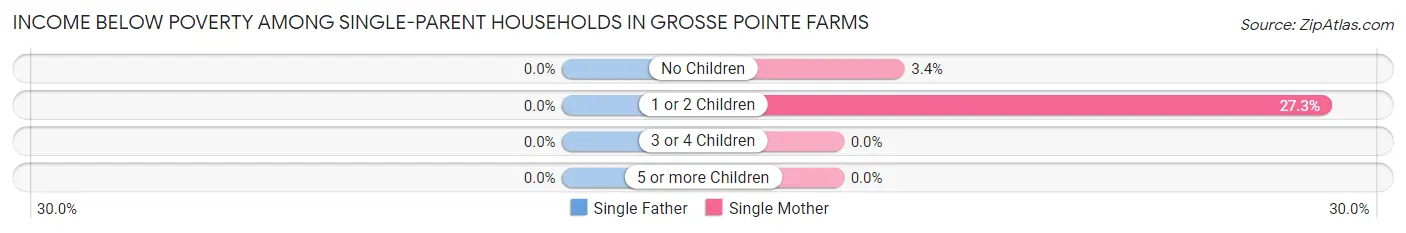
| Children | Single Father | Single Mother |
| No Children | 0 (0.0%) | 4 (3.4%) |
| 1 or 2 Children | 0 (0.0%) | 9 (27.3%) |
| 3 or 4 Children | 0 (0.0%) | 0 (0.0%) |
| 5 or more Children | 0 (0.0%) | 0 (0.0%) |
| Total | 0 (0.0%) | 13 (8.6%) |
Income Below Poverty Among Married-Couple vs Single-Parent Households in Grosse Pointe Farms
The poverty data for Grosse Pointe Farms shows that 40 of the married-couple family households (1.5%) and 13 of the single-parent households (6.1%) are living below the poverty level. Within the married-couple family households, those with 3 or 4 children have the highest poverty rate, with 5 households (3.2%) falling below the poverty line. Among the single-parent households, those with 1 or 2 children have the highest poverty rate, with 9 household (15.0%) living below poverty.
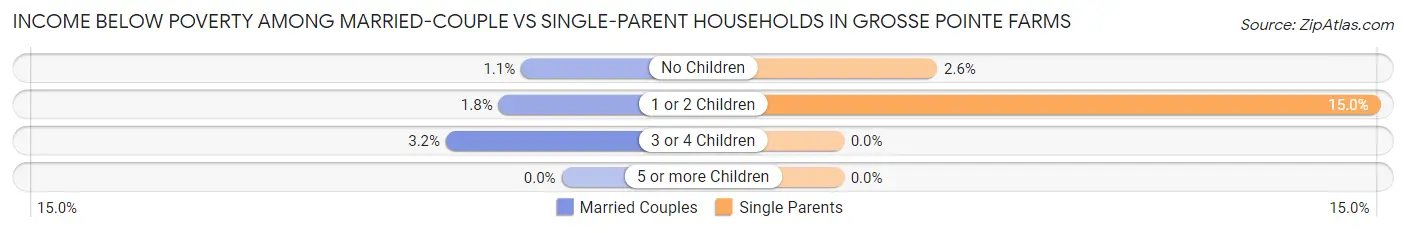
| Children | Married-Couple Families | Single-Parent Households |
| No Children | 18 (1.1%) | 4 (2.6%) |
| 1 or 2 Children | 17 (1.8%) | 9 (15.0%) |
| 3 or 4 Children | 5 (3.2%) | 0 (0.0%) |
| 5 or more Children | 0 (0.0%) | 0 (0.0%) |
| Total | 40 (1.5%) | 13 (6.1%) |
Race in Grosse Pointe Farms
The most populous races in Grosse Pointe Farms are White / Caucasian (9,042 | 90.3%), Two or more Races (670 | 6.7%), and Asian (198 | 2.0%).
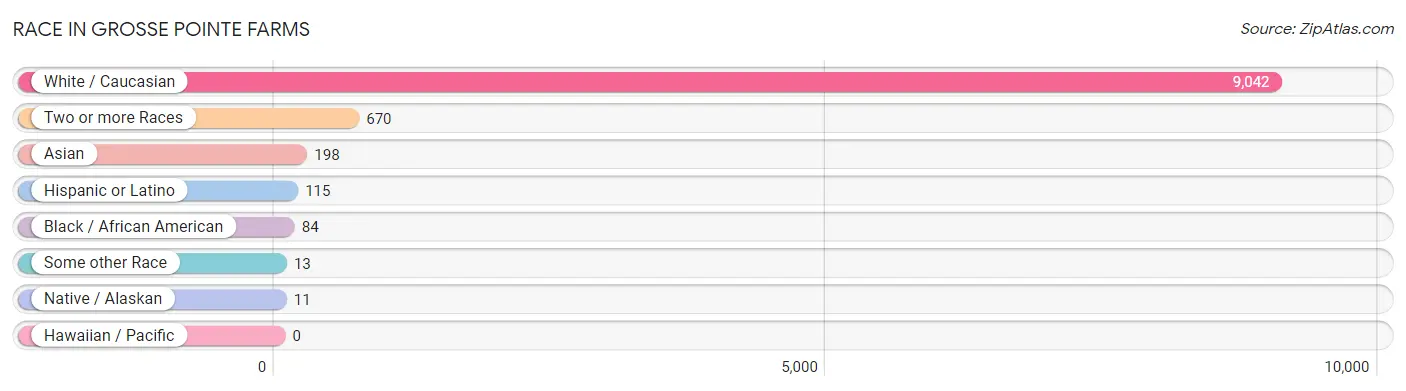
| Race | # Population | % Population |
| Asian | 198 | 2.0% |
| Black / African American | 84 | 0.8% |
| Hawaiian / Pacific | 0 | 0.0% |
| Hispanic or Latino | 115 | 1.1% |
| Native / Alaskan | 11 | 0.1% |
| White / Caucasian | 9,042 | 90.3% |
| Two or more Races | 670 | 6.7% |
| Some other Race | 13 | 0.1% |
| Total | 10,018 | 100.0% |
Ancestry in Grosse Pointe Farms
The most populous ancestries reported in Grosse Pointe Farms are German (2,609 | 26.0%), English (1,673 | 16.7%), Irish (1,439 | 14.4%), Italian (916 | 9.1%), and Polish (839 | 8.4%), together accounting for 74.6% of all Grosse Pointe Farms residents.
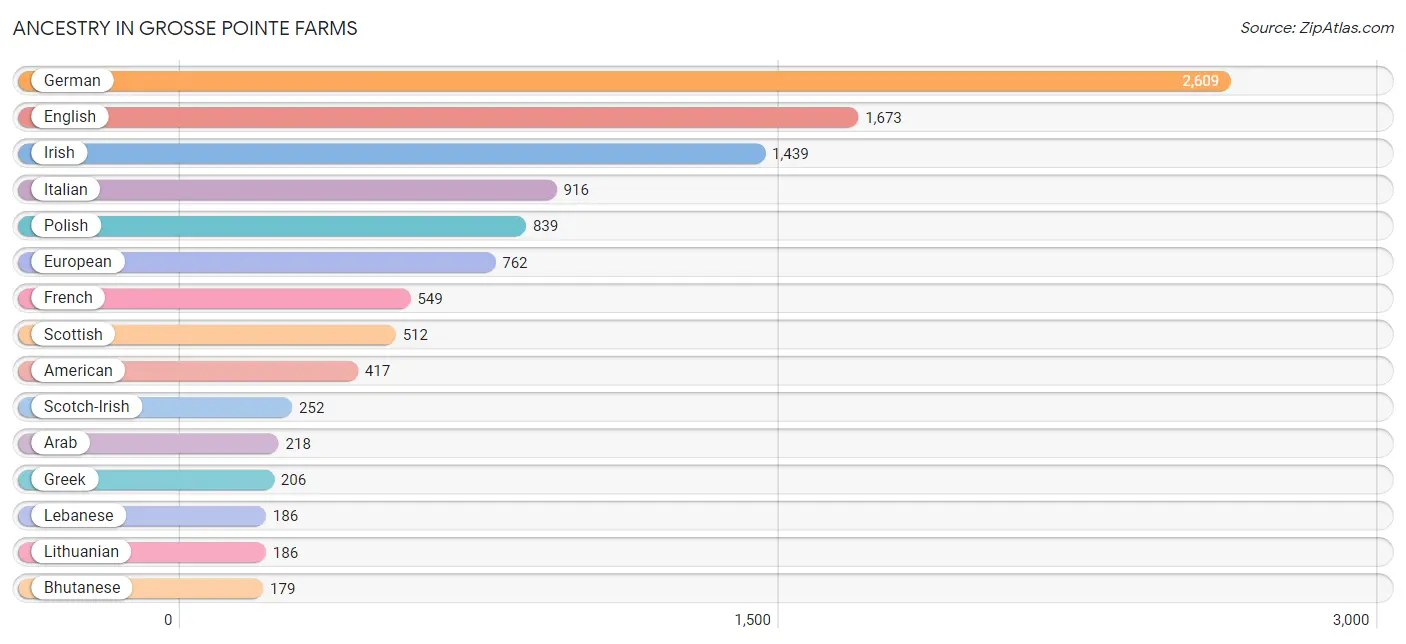
| Ancestry | # Population | % Population |
| African | 45 | 0.4% |
| American | 417 | 4.2% |
| Arab | 218 | 2.2% |
| Australian | 12 | 0.1% |
| Austrian | 21 | 0.2% |
| Belgian | 98 | 1.0% |
| Bhutanese | 179 | 1.8% |
| British | 52 | 0.5% |
| Bulgarian | 6 | 0.1% |
| Burmese | 54 | 0.5% |
| Canadian | 123 | 1.2% |
| Chilean | 16 | 0.2% |
| Colombian | 19 | 0.2% |
| Croatian | 113 | 1.1% |
| Czechoslovakian | 5 | 0.1% |
| Danish | 35 | 0.4% |
| Dutch | 147 | 1.5% |
| Eastern European | 126 | 1.3% |
| Egyptian | 17 | 0.2% |
| English | 1,673 | 16.7% |
| European | 762 | 7.6% |
| Finnish | 46 | 0.5% |
| French | 549 | 5.5% |
| French Canadian | 51 | 0.5% |
| German | 2,609 | 26.0% |
| Greek | 206 | 2.1% |
| Hungarian | 177 | 1.8% |
| Indian (Asian) | 4 | 0.0% |
| Irish | 1,439 | 14.4% |
| Iroquois | 8 | 0.1% |
| Italian | 916 | 9.1% |
| Jordanian | 7 | 0.1% |
| Korean | 21 | 0.2% |
| Lebanese | 186 | 1.9% |
| Lithuanian | 186 | 1.9% |
| Lumbee | 3 | 0.0% |
| Macedonian | 62 | 0.6% |
| Maltese | 18 | 0.2% |
| Mexican | 75 | 0.7% |
| Northern European | 72 | 0.7% |
| Norwegian | 95 | 0.9% |
| Polish | 839 | 8.4% |
| Portuguese | 5 | 0.1% |
| Puerto Rican | 5 | 0.1% |
| Romanian | 6 | 0.1% |
| Russian | 12 | 0.1% |
| Scandinavian | 10 | 0.1% |
| Scotch-Irish | 252 | 2.5% |
| Scottish | 512 | 5.1% |
| Slavic | 100 | 1.0% |
| Slovak | 70 | 0.7% |
| South American | 35 | 0.4% |
| Subsaharan African | 45 | 0.4% |
| Swedish | 129 | 1.3% |
| Swiss | 17 | 0.2% |
| Syrian | 21 | 0.2% |
| Thai | 30 | 0.3% |
| Ukrainian | 37 | 0.4% |
| Welsh | 103 | 1.0% | View All 59 Rows |
Immigrants in Grosse Pointe Farms
The most numerous immigrant groups reported in Grosse Pointe Farms came from Latin America (630 | 6.3%), South America (603 | 6.0%), Brazil (589 | 5.9%), Asia (147 | 1.5%), and Europe (129 | 1.3%), together accounting for 20.9% of all Grosse Pointe Farms residents.
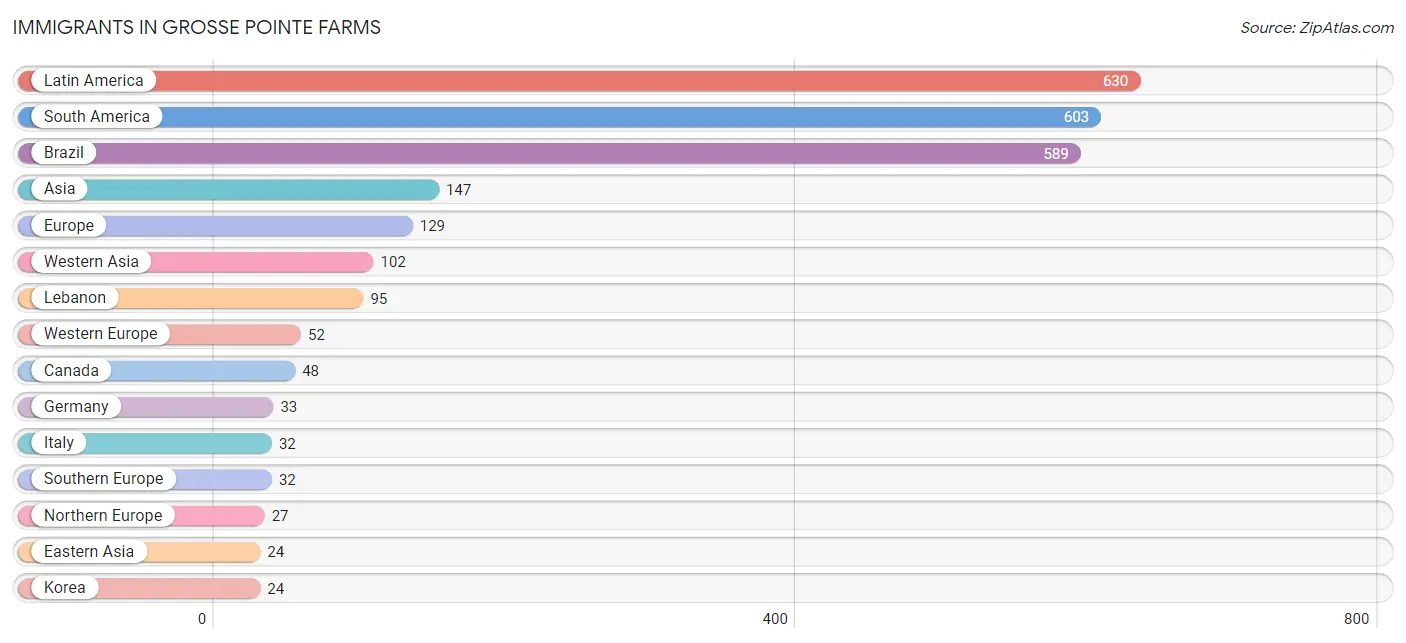
| Immigration Origin | # Population | % Population |
| Africa | 22 | 0.2% |
| Asia | 147 | 1.5% |
| Australia | 14 | 0.1% |
| Brazil | 589 | 5.9% |
| Bulgaria | 6 | 0.1% |
| Canada | 48 | 0.5% |
| Caribbean | 19 | 0.2% |
| Central America | 8 | 0.1% |
| Colombia | 14 | 0.1% |
| Eastern Africa | 5 | 0.1% |
| Eastern Asia | 24 | 0.2% |
| Eastern Europe | 18 | 0.2% |
| Egypt | 17 | 0.2% |
| England | 5 | 0.1% |
| Eritrea | 5 | 0.1% |
| Europe | 129 | 1.3% |
| France | 19 | 0.2% |
| Germany | 33 | 0.3% |
| India | 21 | 0.2% |
| Italy | 32 | 0.3% |
| Jordan | 7 | 0.1% |
| Korea | 24 | 0.2% |
| Latin America | 630 | 6.3% |
| Lebanon | 95 | 0.9% |
| Mexico | 8 | 0.1% |
| Northern Africa | 17 | 0.2% |
| Northern Europe | 27 | 0.3% |
| Oceania | 14 | 0.1% |
| Romania | 12 | 0.1% |
| South America | 603 | 6.0% |
| South Central Asia | 21 | 0.2% |
| Southern Europe | 32 | 0.3% |
| Trinidad and Tobago | 19 | 0.2% |
| Western Asia | 102 | 1.0% |
| Western Europe | 52 | 0.5% | View All 35 Rows |
Sex and Age in Grosse Pointe Farms
Sex and Age in Grosse Pointe Farms
The most populous age groups in Grosse Pointe Farms are 60 to 64 Years (602 | 11.9%) for men and 55 to 59 Years (759 | 15.2%) for women.
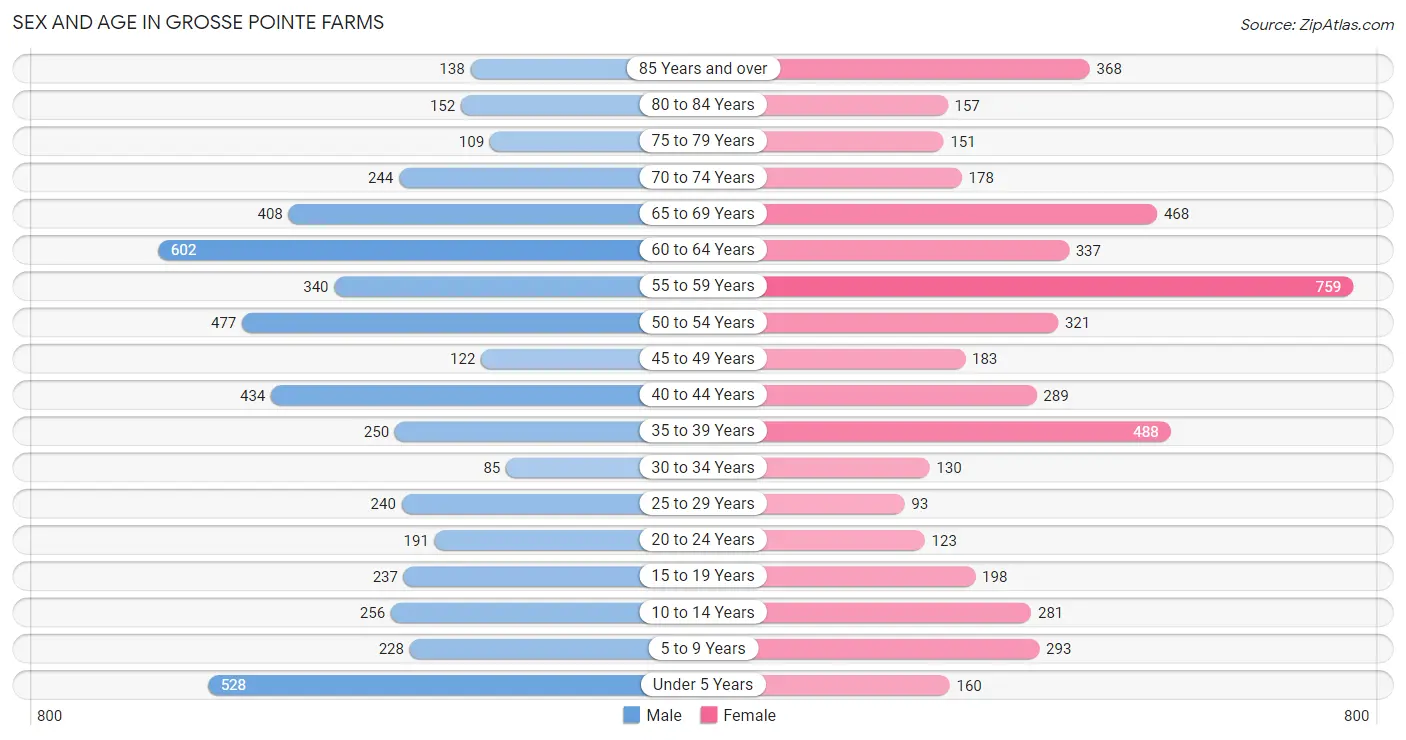
| Age Bracket | Male | Female |
| Under 5 Years | 528 (10.5%) | 160 (3.2%) |
| 5 to 9 Years | 228 (4.5%) | 293 (5.9%) |
| 10 to 14 Years | 256 (5.1%) | 281 (5.7%) |
| 15 to 19 Years | 237 (4.7%) | 198 (4.0%) |
| 20 to 24 Years | 191 (3.8%) | 123 (2.5%) |
| 25 to 29 Years | 240 (4.8%) | 93 (1.9%) |
| 30 to 34 Years | 85 (1.7%) | 130 (2.6%) |
| 35 to 39 Years | 250 (5.0%) | 488 (9.8%) |
| 40 to 44 Years | 434 (8.6%) | 289 (5.8%) |
| 45 to 49 Years | 122 (2.4%) | 183 (3.7%) |
| 50 to 54 Years | 477 (9.5%) | 321 (6.5%) |
| 55 to 59 Years | 340 (6.7%) | 759 (15.2%) |
| 60 to 64 Years | 602 (11.9%) | 337 (6.8%) |
| 65 to 69 Years | 408 (8.1%) | 468 (9.4%) |
| 70 to 74 Years | 244 (4.8%) | 178 (3.6%) |
| 75 to 79 Years | 109 (2.2%) | 151 (3.0%) |
| 80 to 84 Years | 152 (3.0%) | 157 (3.2%) |
| 85 Years and over | 138 (2.7%) | 368 (7.4%) |
| Total | 5,041 (100.0%) | 4,977 (100.0%) |
Families and Households in Grosse Pointe Farms
Median Family Size in Grosse Pointe Farms
The median family size in Grosse Pointe Farms is 2.92 persons per family, with married-couple families (2,720 | 92.7%) accounting for the largest median family size of 2.95 persons per family. On the other hand, single female/mother families (151 | 5.1%) represent the smallest median family size with 2.49 persons per family.
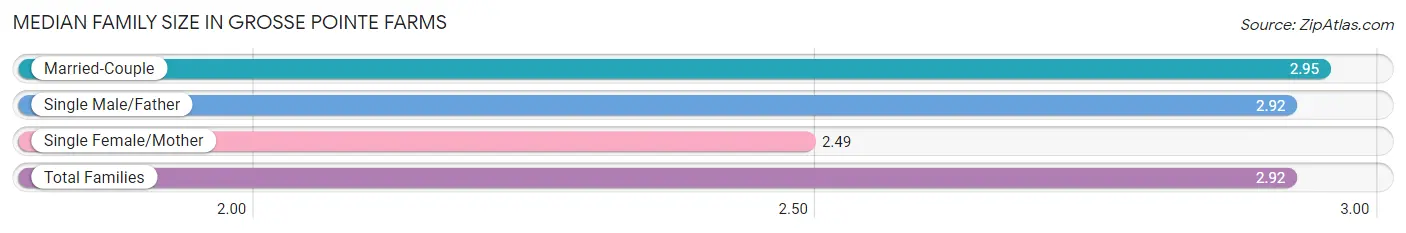
| Family Type | # Families | Family Size |
| Married-Couple | 2,720 (92.7%) | 2.95 |
| Single Male/Father | 62 (2.1%) | 2.92 |
| Single Female/Mother | 151 (5.1%) | 2.49 |
| Total Families | 2,933 (100.0%) | 2.92 |
Median Household Size in Grosse Pointe Farms
The median household size in Grosse Pointe Farms is 2.38 persons per household, with single male/father households (62 | 1.5%) accounting for the largest median household size of 3 persons per household. non-family households (1,253 | 29.9%) represent the smallest median household size with 1.12 persons per household.
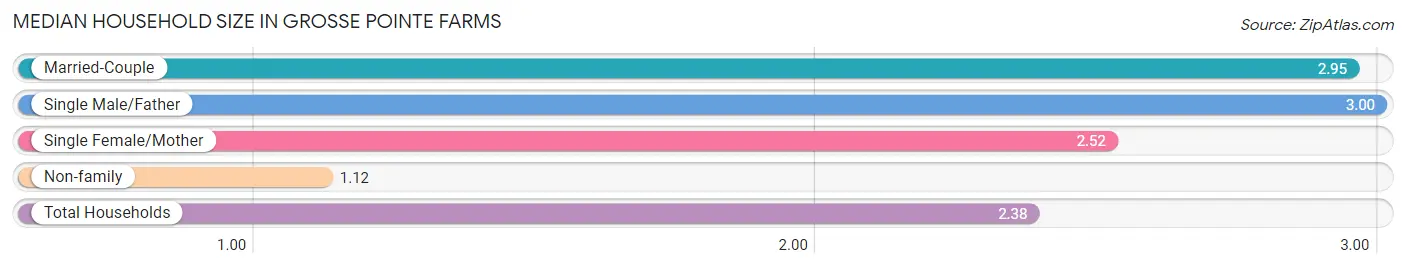
| Household Type | # Households | Household Size |
| Married-Couple | 2,720 (65.0%) | 2.95 |
| Single Male/Father | 62 (1.5%) | 3.00 |
| Single Female/Mother | 151 (3.6%) | 2.52 |
| Non-family | 1,253 (29.9%) | 1.12 |
| Total Households | 4,186 (100.0%) | 2.38 |
Household Size by Marriage Status in Grosse Pointe Farms
Out of a total of 4,186 households in Grosse Pointe Farms, 2,933 (70.1%) are family households, while 1,253 (29.9%) are nonfamily households. The most numerous type of family households are 2-person households, comprising 1,474, and the most common type of nonfamily households are 1-person households, comprising 1,131.
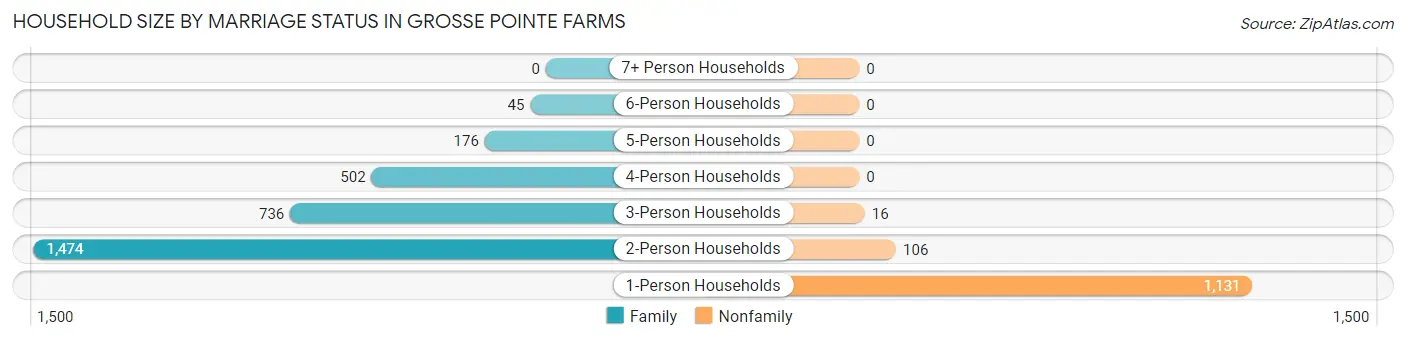
| Household Size | Family Households | Nonfamily Households |
| 1-Person Households | - | 1,131 (27.0%) |
| 2-Person Households | 1,474 (35.2%) | 106 (2.5%) |
| 3-Person Households | 736 (17.6%) | 16 (0.4%) |
| 4-Person Households | 502 (12.0%) | 0 (0.0%) |
| 5-Person Households | 176 (4.2%) | 0 (0.0%) |
| 6-Person Households | 45 (1.1%) | 0 (0.0%) |
| 7+ Person Households | 0 (0.0%) | 0 (0.0%) |
| Total | 2,933 (70.1%) | 1,253 (29.9%) |
Female Fertility in Grosse Pointe Farms
Fertility by Age in Grosse Pointe Farms
Average fertility rate in Grosse Pointe Farms is 28.0 births per 1,000 women. Women in the age bracket of 35 to 50 years have the highest fertility rate with 39.0 births per 1,000 women. Women in the age bracket of 35 to 50 years acount for 90.7% of all women with births.
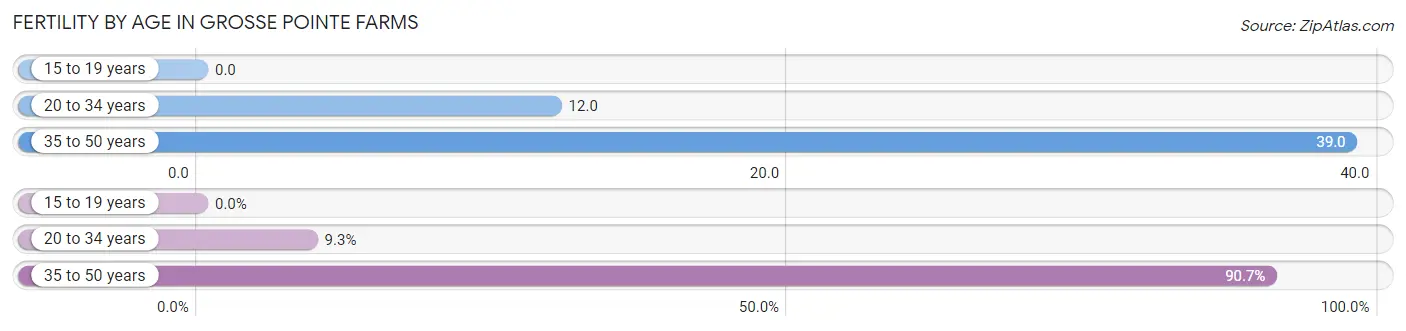
| Age Bracket | Women with Births | Births / 1,000 Women |
| 15 to 19 years | 0 (0.0%) | 0.0 |
| 20 to 34 years | 4 (9.3%) | 12.0 |
| 35 to 50 years | 39 (90.7%) | 39.0 |
| Total | 43 (100.0%) | 28.0 |
Fertility by Age by Marriage Status in Grosse Pointe Farms
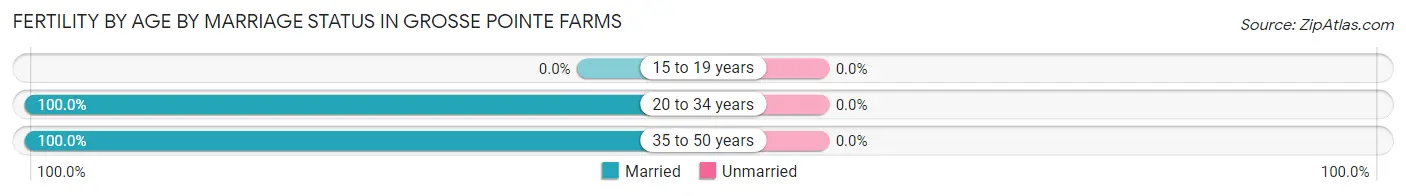
| Age Bracket | Married | Unmarried |
| 15 to 19 years | 0 (0.0%) | 0 (0.0%) |
| 20 to 34 years | 4 (100.0%) | 0 (0.0%) |
| 35 to 50 years | 39 (100.0%) | 0 (0.0%) |
| Total | 43 (100.0%) | 0 (0.0%) |
Fertility by Education in Grosse Pointe Farms
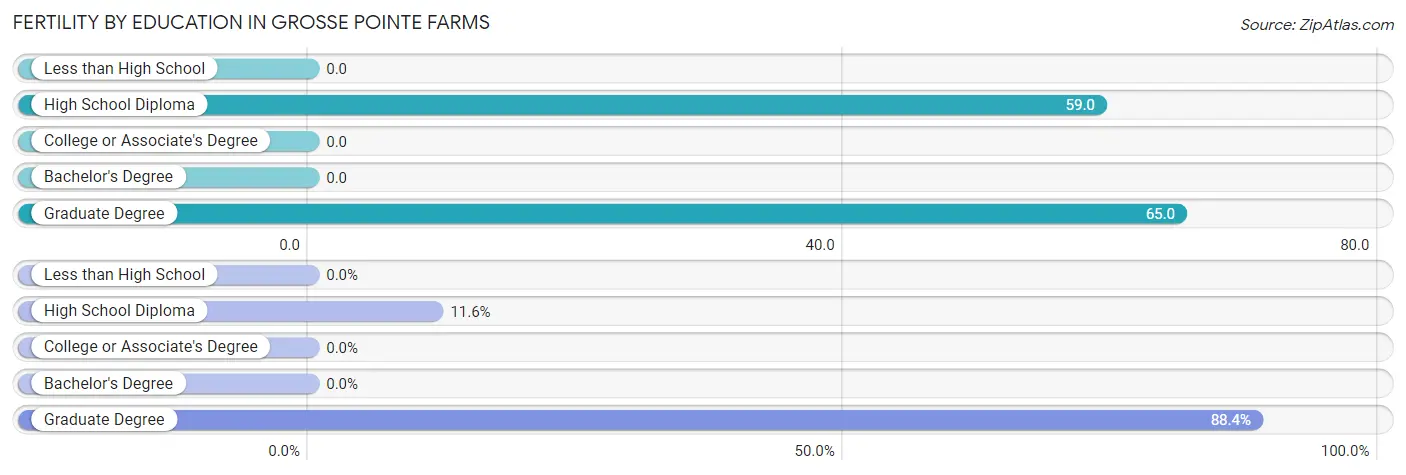
| Educational Attainment | Women with Births | Births / 1,000 Women |
| Less than High School | 0 (0.0%) | 0.0 |
| High School Diploma | 5 (11.6%) | 59.0 |
| College or Associate's Degree | 0 (0.0%) | 0.0 |
| Bachelor's Degree | 0 (0.0%) | 0.0 |
| Graduate Degree | 38 (88.4%) | 65.0 |
| Total | 43 (100.0%) | 28.0 |
Fertility by Education by Marriage Status in Grosse Pointe Farms
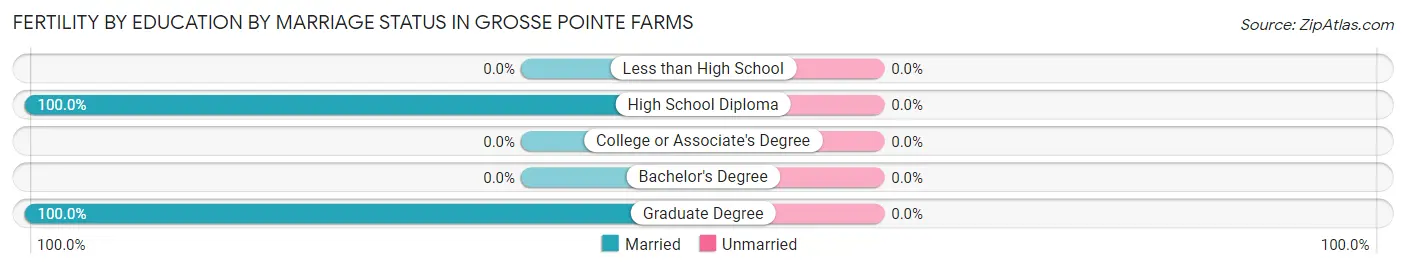
| Educational Attainment | Married | Unmarried |
| Less than High School | 0 (0.0%) | 0 (0.0%) |
| High School Diploma | 5 (100.0%) | 0 (0.0%) |
| College or Associate's Degree | 0 (0.0%) | 0 (0.0%) |
| Bachelor's Degree | 0 (0.0%) | 0 (0.0%) |
| Graduate Degree | 38 (100.0%) | 0 (0.0%) |
| Total | 43 (100.0%) | 0 (0.0%) |
Employment Characteristics in Grosse Pointe Farms
Employment by Class of Employer in Grosse Pointe Farms
Among the 5,041 employed individuals in Grosse Pointe Farms, private company employees (2,830 | 56.1%), not-for-profit organizations (522 | 10.4%), and self-employed (not incorporated) (511 | 10.1%) make up the most common classes of employment.
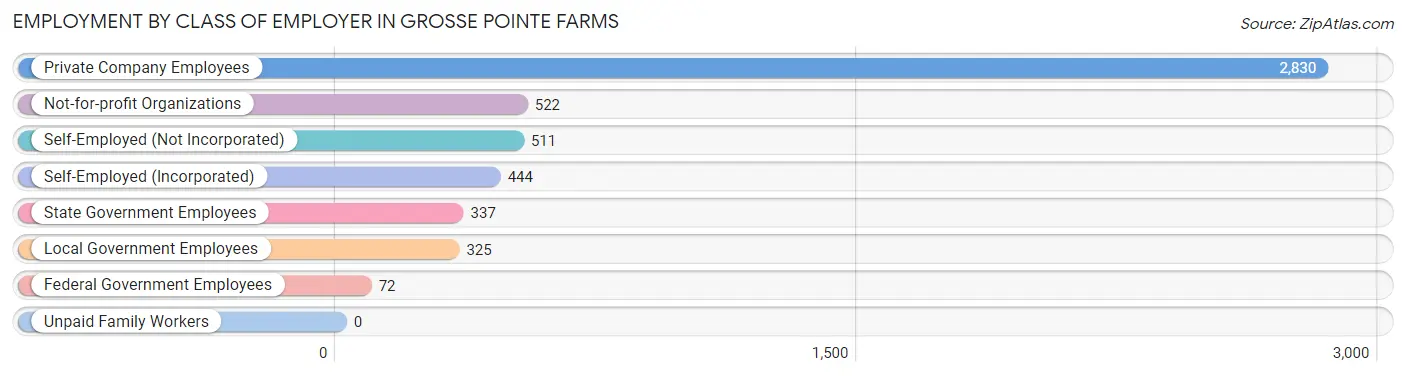
| Employer Class | # Employees | % Employees |
| Private Company Employees | 2,830 | 56.1% |
| Self-Employed (Incorporated) | 444 | 8.8% |
| Self-Employed (Not Incorporated) | 511 | 10.1% |
| Not-for-profit Organizations | 522 | 10.4% |
| Local Government Employees | 325 | 6.5% |
| State Government Employees | 337 | 6.7% |
| Federal Government Employees | 72 | 1.4% |
| Unpaid Family Workers | 0 | 0.0% |
| Total | 5,041 | 100.0% |
Employment Status by Age in Grosse Pointe Farms
According to the labor force statistics for Grosse Pointe Farms, out of the total population over 16 years of age (8,131), 65.0% or 5,285 individuals are in the labor force, with 2.7% or 143 of them unemployed. The age group with the highest labor force participation rate is 30 to 34 years, with 96.7% or 208 individuals in the labor force. Within the labor force, the 20 to 24 years age range has the highest percentage of unemployed individuals, with 13.4% or 29 of them being unemployed.
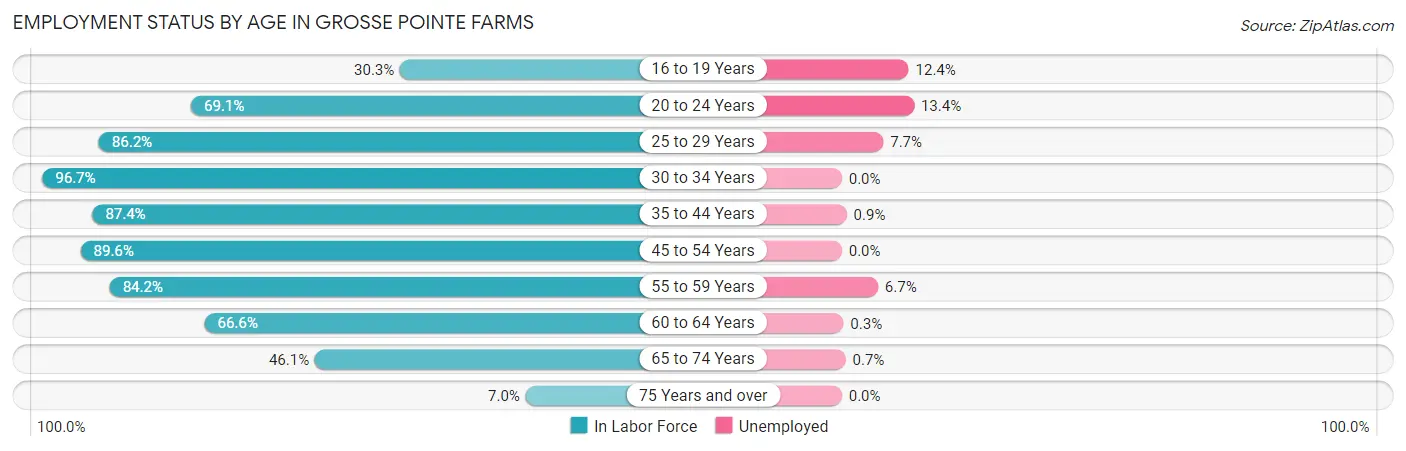
| Age Bracket | In Labor Force | Unemployed |
| 16 to 19 Years | 89 (30.3%) | 11 (12.4%) |
| 20 to 24 Years | 217 (69.1%) | 29 (13.4%) |
| 25 to 29 Years | 287 (86.2%) | 22 (7.7%) |
| 30 to 34 Years | 208 (96.7%) | 0 (0.0%) |
| 35 to 44 Years | 1,277 (87.4%) | 11 (0.9%) |
| 45 to 54 Years | 988 (89.6%) | 0 (0.0%) |
| 55 to 59 Years | 925 (84.2%) | 62 (6.7%) |
| 60 to 64 Years | 625 (66.6%) | 2 (0.3%) |
| 65 to 74 Years | 598 (46.1%) | 4 (0.7%) |
| 75 Years and over | 75 (7.0%) | 0 (0.0%) |
| Total | 5,285 (65.0%) | 143 (2.7%) |
Employment Status by Educational Attainment in Grosse Pointe Farms
According to labor force statistics for Grosse Pointe Farms, 83.7% of individuals (4,311) out of the total population between 25 and 64 years of age (5,150) are in the labor force, with 2.3% or 99 of them being unemployed. The group with the highest labor force participation rate are those with the educational attainment of bachelor's degree or higher, with 87.8% or 3,528 individuals in the labor force. Within the labor force, individuals with high school diploma education have the highest percentage of unemployment, with 17.6% or 42 of them being unemployed.
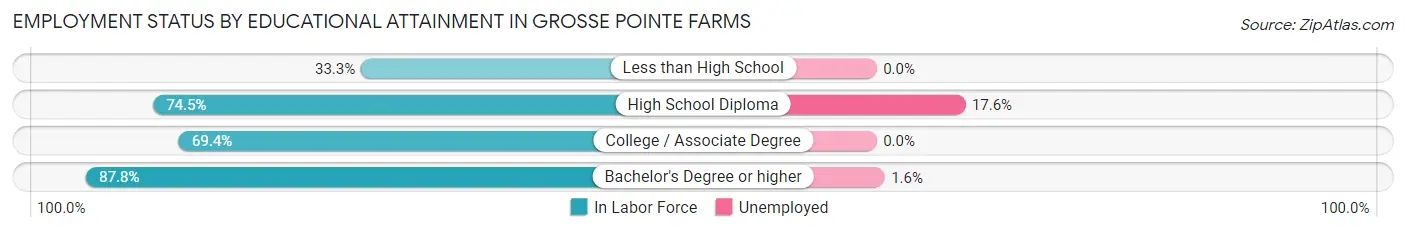
| Educational Attainment | In Labor Force | Unemployed |
| Less than High School | 18 (33.3%) | 0 (0.0%) |
| High School Diploma | 239 (74.5%) | 56 (17.6%) |
| College / Associate Degree | 525 (69.4%) | 0 (0.0%) |
| Bachelor's Degree or higher | 3,528 (87.8%) | 64 (1.6%) |
| Total | 4,311 (83.7%) | 118 (2.3%) |
Employment Occupations by Sex in Grosse Pointe Farms
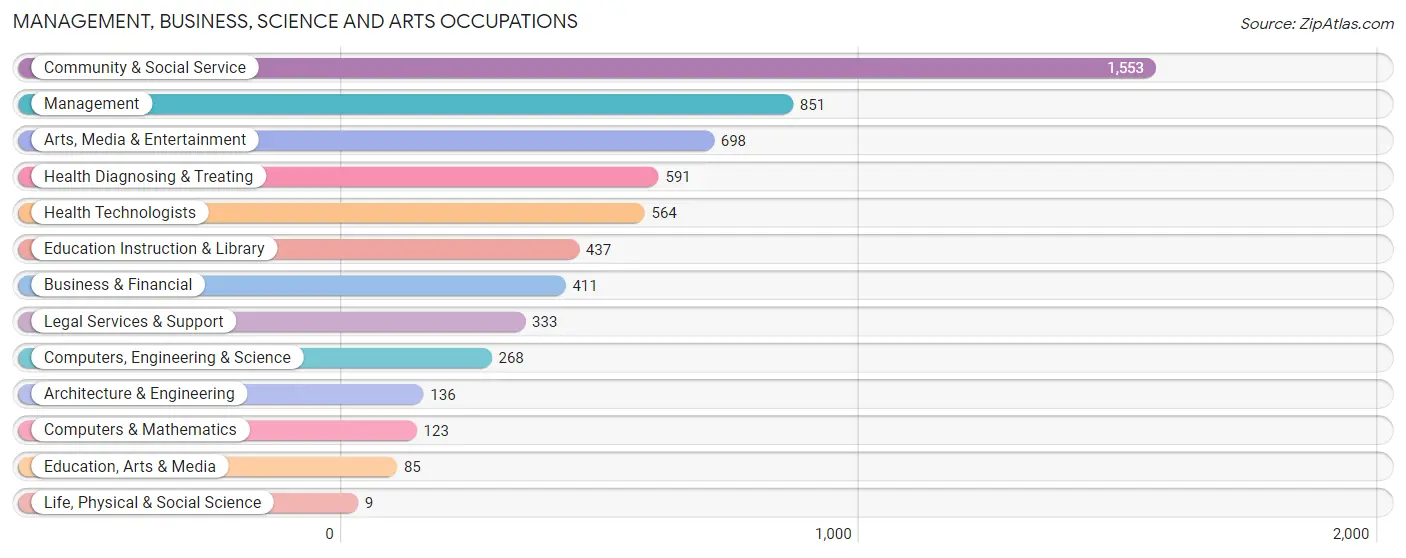
Management, Business, Science and Arts Occupations
The most common Management, Business, Science and Arts occupations in Grosse Pointe Farms are Community & Social Service (1,553 | 30.2%), Management (851 | 16.5%), Arts, Media & Entertainment (698 | 13.6%), Health Diagnosing & Treating (591 | 11.5%), and Health Technologists (564 | 11.0%).
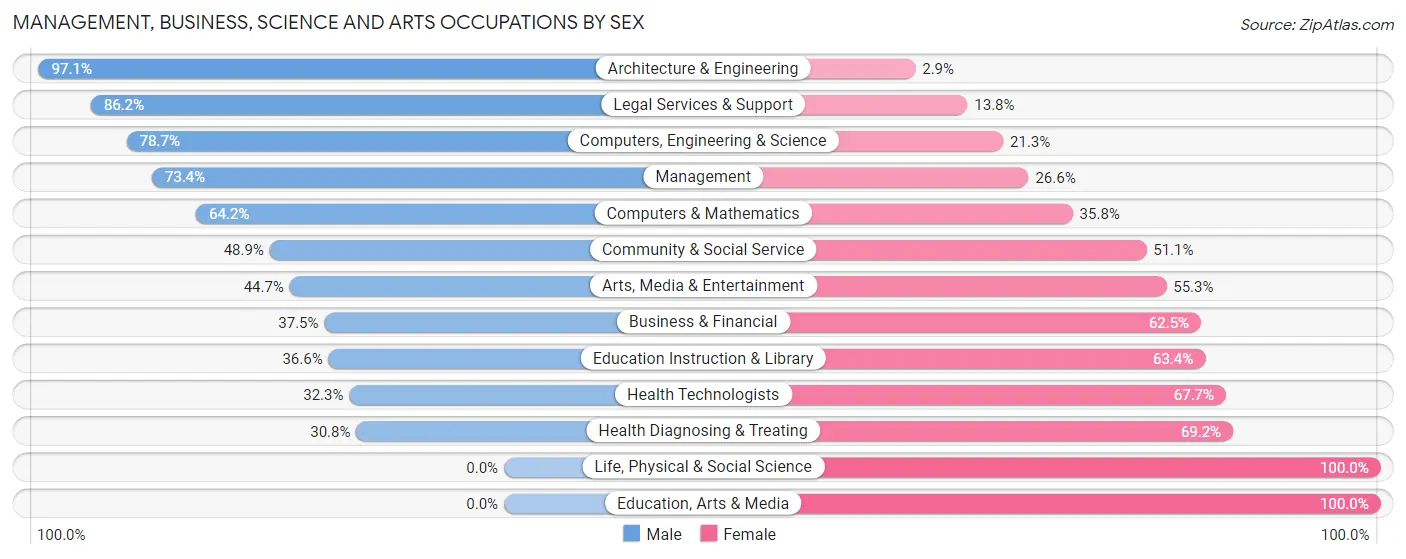
Management, Business, Science and Arts Occupations by Sex
Within the Management, Business, Science and Arts occupations in Grosse Pointe Farms, the most male-oriented occupations are Architecture & Engineering (97.1%), Legal Services & Support (86.2%), and Computers, Engineering & Science (78.7%), while the most female-oriented occupations are Life, Physical & Social Science (100.0%), Education, Arts & Media (100.0%), and Health Diagnosing & Treating (69.2%).
| Occupation | Male | Female |
| Management | 625 (73.4%) | 226 (26.6%) |
| Business & Financial | 154 (37.5%) | 257 (62.5%) |
| Computers, Engineering & Science | 211 (78.7%) | 57 (21.3%) |
| Computers & Mathematics | 79 (64.2%) | 44 (35.8%) |
| Architecture & Engineering | 132 (97.1%) | 4 (2.9%) |
| Life, Physical & Social Science | 0 (0.0%) | 9 (100.0%) |
| Community & Social Service | 759 (48.9%) | 794 (51.1%) |
| Education, Arts & Media | 0 (0.0%) | 85 (100.0%) |
| Legal Services & Support | 287 (86.2%) | 46 (13.8%) |
| Education Instruction & Library | 160 (36.6%) | 277 (63.4%) |
| Arts, Media & Entertainment | 312 (44.7%) | 386 (55.3%) |
| Health Diagnosing & Treating | 182 (30.8%) | 409 (69.2%) |
| Health Technologists | 182 (32.3%) | 382 (67.7%) |
| Total (Category) | 1,931 (52.6%) | 1,743 (47.4%) |
| Total (Overall) | 2,762 (53.6%) | 2,386 (46.4%) |
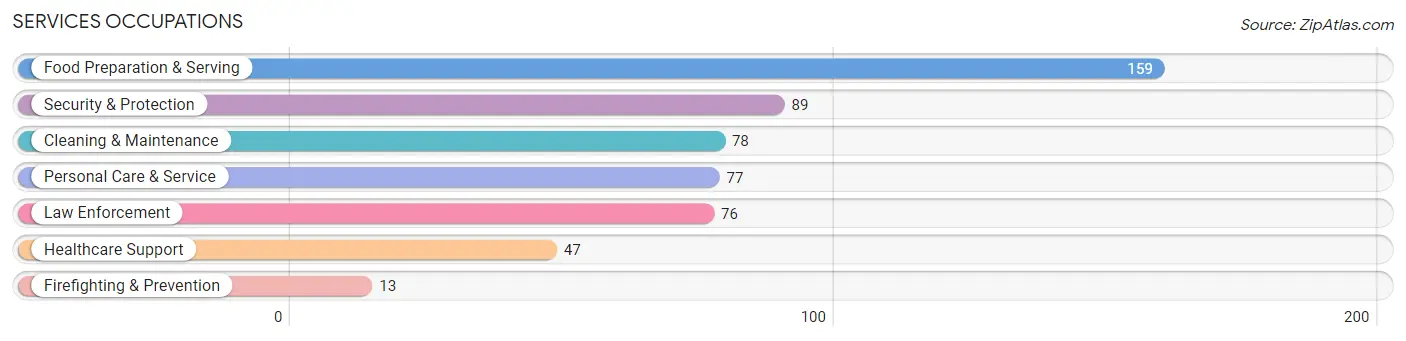
Services Occupations
The most common Services occupations in Grosse Pointe Farms are Food Preparation & Serving (159 | 3.1%), Security & Protection (89 | 1.7%), Cleaning & Maintenance (78 | 1.5%), Personal Care & Service (77 | 1.5%), and Law Enforcement (76 | 1.5%).
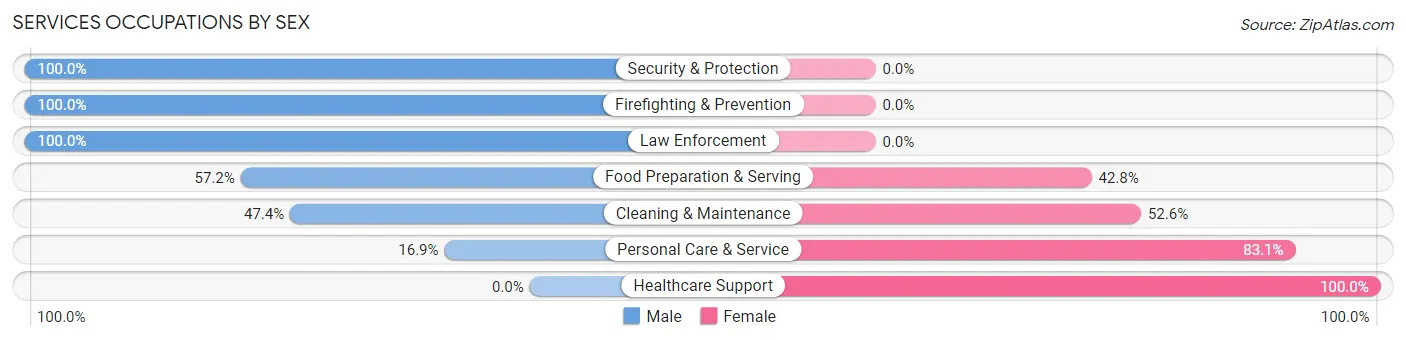
Services Occupations by Sex
Within the Services occupations in Grosse Pointe Farms, the most male-oriented occupations are Security & Protection (100.0%), Firefighting & Prevention (100.0%), and Law Enforcement (100.0%), while the most female-oriented occupations are Healthcare Support (100.0%), Personal Care & Service (83.1%), and Cleaning & Maintenance (52.6%).
| Occupation | Male | Female |
| Healthcare Support | 0 (0.0%) | 47 (100.0%) |
| Security & Protection | 89 (100.0%) | 0 (0.0%) |
| Firefighting & Prevention | 13 (100.0%) | 0 (0.0%) |
| Law Enforcement | 76 (100.0%) | 0 (0.0%) |
| Food Preparation & Serving | 91 (57.2%) | 68 (42.8%) |
| Cleaning & Maintenance | 37 (47.4%) | 41 (52.6%) |
| Personal Care & Service | 13 (16.9%) | 64 (83.1%) |
| Total (Category) | 230 (51.1%) | 220 (48.9%) |
| Total (Overall) | 2,762 (53.6%) | 2,386 (46.4%) |
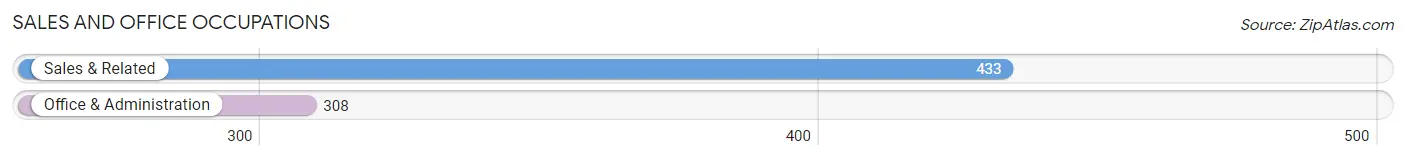
Sales and Office Occupations
The most common Sales and Office occupations in Grosse Pointe Farms are Sales & Related (433 | 8.4%), and Office & Administration (308 | 6.0%).
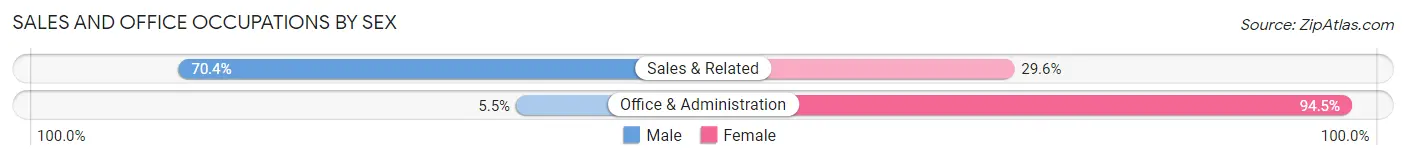
Sales and Office Occupations by Sex
| Occupation | Male | Female |
| Sales & Related | 305 (70.4%) | 128 (29.6%) |
| Office & Administration | 17 (5.5%) | 291 (94.5%) |
| Total (Category) | 322 (43.4%) | 419 (56.6%) |
| Total (Overall) | 2,762 (53.6%) | 2,386 (46.4%) |
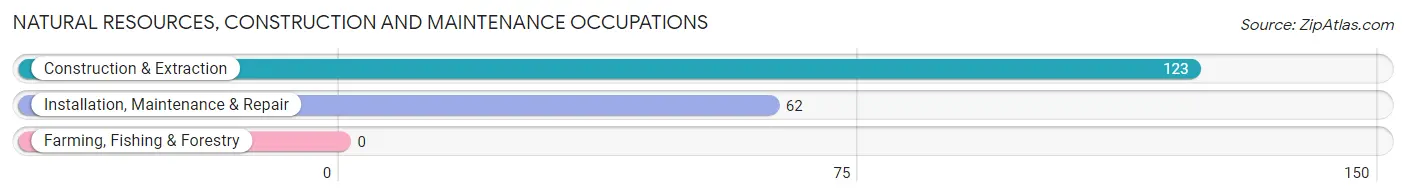
Natural Resources, Construction and Maintenance Occupations
The most common Natural Resources, Construction and Maintenance occupations in Grosse Pointe Farms are Construction & Extraction (123 | 2.4%), and Installation, Maintenance & Repair (62 | 1.2%).
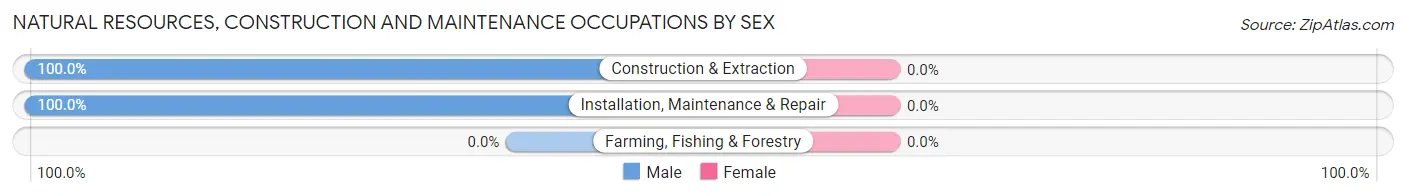
Natural Resources, Construction and Maintenance Occupations by Sex
| Occupation | Male | Female |
| Farming, Fishing & Forestry | 0 (0.0%) | 0 (0.0%) |
| Construction & Extraction | 123 (100.0%) | 0 (0.0%) |
| Installation, Maintenance & Repair | 62 (100.0%) | 0 (0.0%) |
| Total (Category) | 185 (100.0%) | 0 (0.0%) |
| Total (Overall) | 2,762 (53.6%) | 2,386 (46.4%) |
Production, Transportation and Moving Occupations
The most common Production, Transportation and Moving occupations in Grosse Pointe Farms are Production (83 | 1.6%), Transportation (10 | 0.2%), and Material Moving (5 | 0.1%).
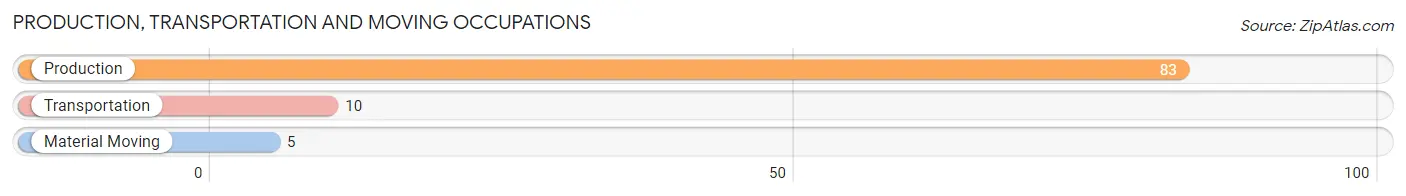
Production, Transportation and Moving Occupations by Sex
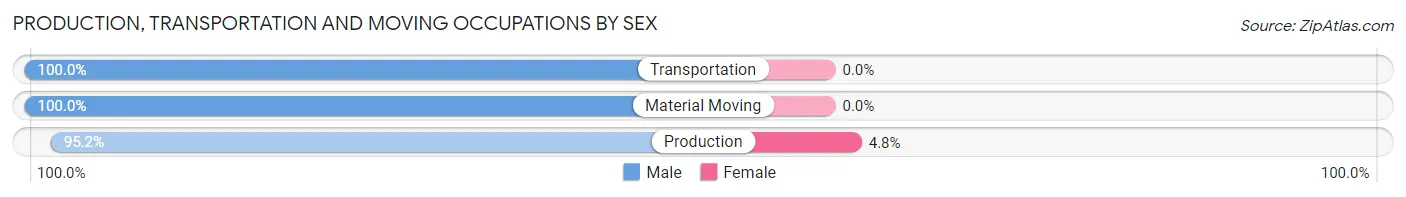
| Occupation | Male | Female |
| Production | 79 (95.2%) | 4 (4.8%) |
| Transportation | 10 (100.0%) | 0 (0.0%) |
| Material Moving | 5 (100.0%) | 0 (0.0%) |
| Total (Category) | 94 (95.9%) | 4 (4.1%) |
| Total (Overall) | 2,762 (53.6%) | 2,386 (46.4%) |
Employment Industries by Sex in Grosse Pointe Farms
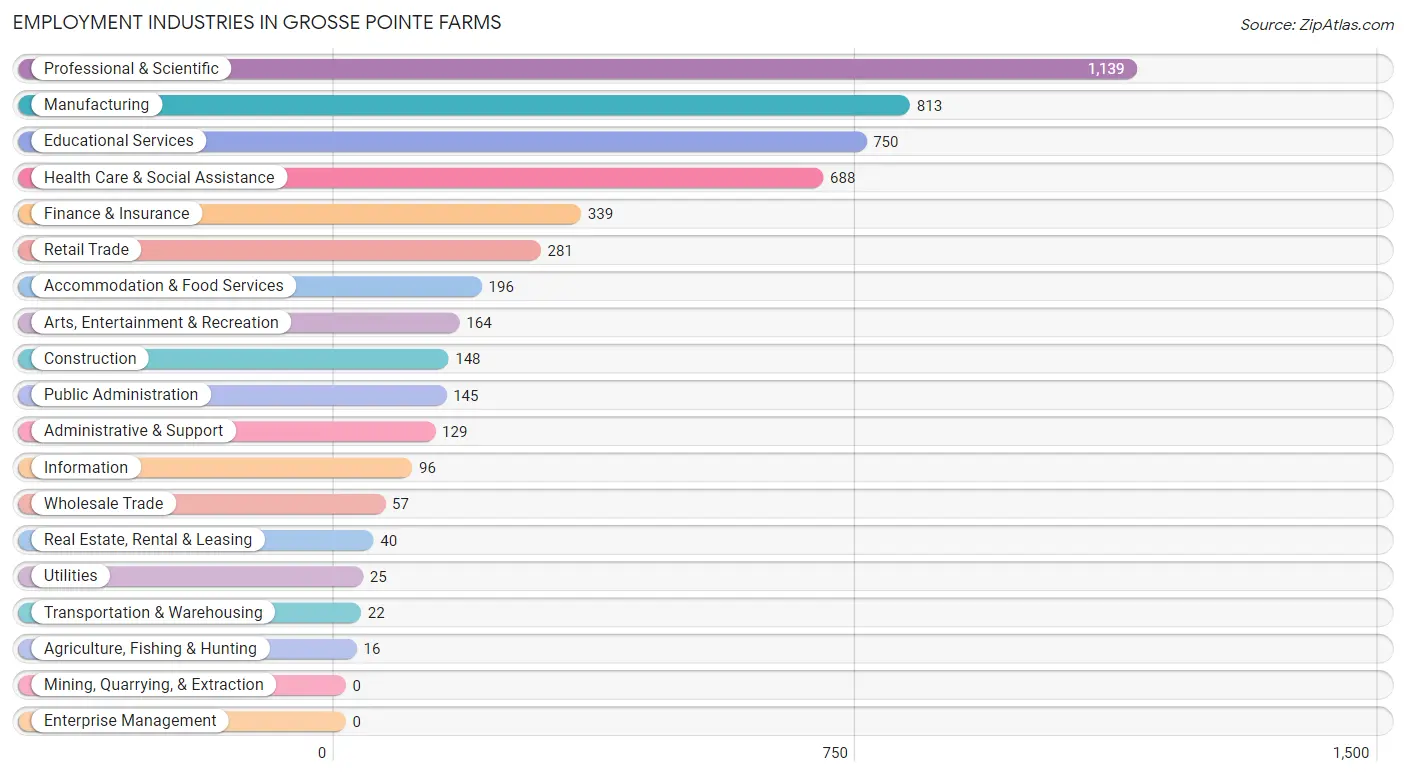
Employment Industries in Grosse Pointe Farms
The major employment industries in Grosse Pointe Farms include Professional & Scientific (1,139 | 22.1%), Manufacturing (813 | 15.8%), Educational Services (750 | 14.6%), Health Care & Social Assistance (688 | 13.4%), and Finance & Insurance (339 | 6.6%).
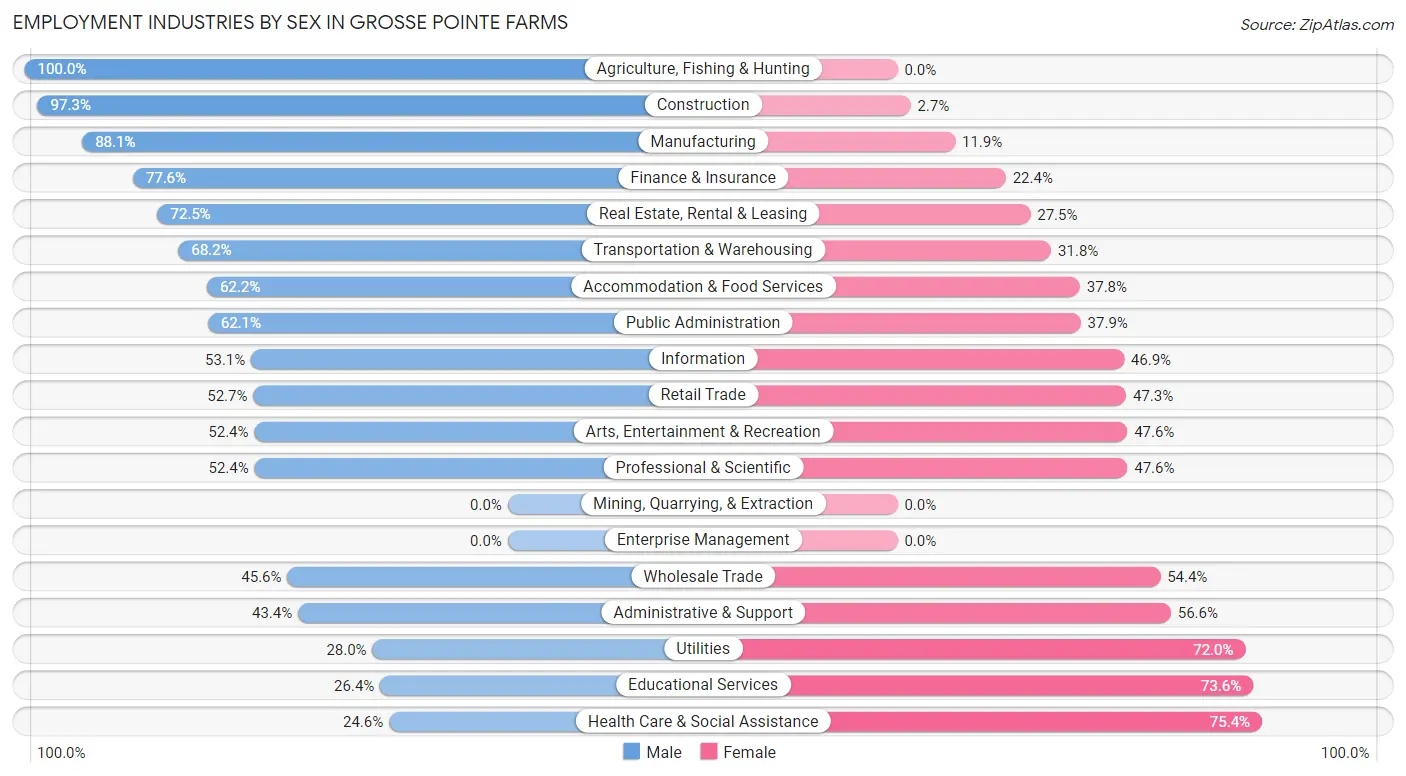
Employment Industries by Sex in Grosse Pointe Farms
The Grosse Pointe Farms industries that see more men than women are Agriculture, Fishing & Hunting (100.0%), Construction (97.3%), and Manufacturing (88.1%), whereas the industries that tend to have a higher number of women are Health Care & Social Assistance (75.4%), Educational Services (73.6%), and Utilities (72.0%).
| Industry | Male | Female |
| Agriculture, Fishing & Hunting | 16 (100.0%) | 0 (0.0%) |
| Mining, Quarrying, & Extraction | 0 (0.0%) | 0 (0.0%) |
| Construction | 144 (97.3%) | 4 (2.7%) |
| Manufacturing | 716 (88.1%) | 97 (11.9%) |
| Wholesale Trade | 26 (45.6%) | 31 (54.4%) |
| Retail Trade | 148 (52.7%) | 133 (47.3%) |
| Transportation & Warehousing | 15 (68.2%) | 7 (31.8%) |
| Utilities | 7 (28.0%) | 18 (72.0%) |
| Information | 51 (53.1%) | 45 (46.9%) |
| Finance & Insurance | 263 (77.6%) | 76 (22.4%) |
| Real Estate, Rental & Leasing | 29 (72.5%) | 11 (27.5%) |
| Professional & Scientific | 597 (52.4%) | 542 (47.6%) |
| Enterprise Management | 0 (0.0%) | 0 (0.0%) |
| Administrative & Support | 56 (43.4%) | 73 (56.6%) |
| Educational Services | 198 (26.4%) | 552 (73.6%) |
| Health Care & Social Assistance | 169 (24.6%) | 519 (75.4%) |
| Arts, Entertainment & Recreation | 86 (52.4%) | 78 (47.6%) |
| Accommodation & Food Services | 122 (62.2%) | 74 (37.8%) |
| Public Administration | 90 (62.1%) | 55 (37.9%) |
| Total | 2,762 (53.6%) | 2,386 (46.4%) |
Education in Grosse Pointe Farms
School Enrollment in Grosse Pointe Farms
The most common levels of schooling among the 2,431 students in Grosse Pointe Farms are nursery / preschool (518 | 21.3%), high school (450 | 18.5%), and elementary school (441 | 18.1%).
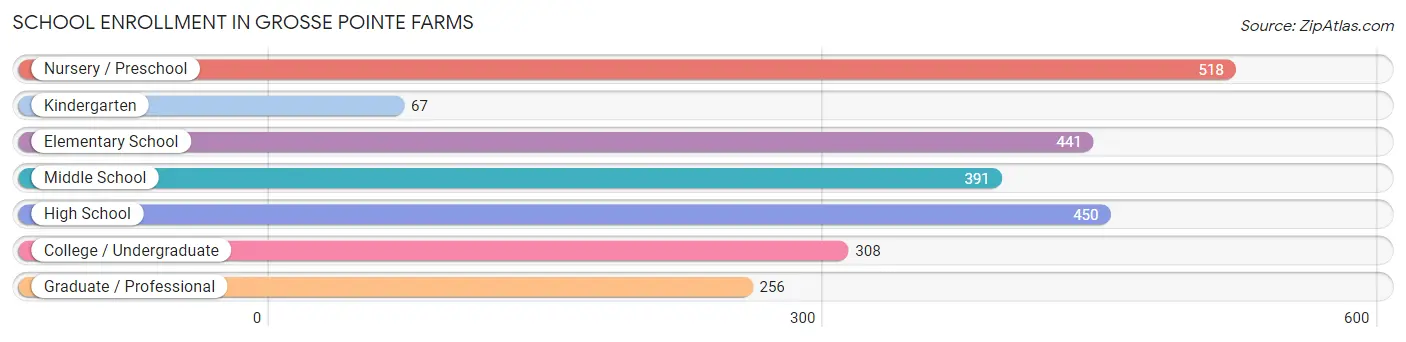
| School Level | # Students | % Students |
| Nursery / Preschool | 518 | 21.3% |
| Kindergarten | 67 | 2.8% |
| Elementary School | 441 | 18.1% |
| Middle School | 391 | 16.1% |
| High School | 450 | 18.5% |
| College / Undergraduate | 308 | 12.7% |
| Graduate / Professional | 256 | 10.5% |
| Total | 2,431 | 100.0% |
School Enrollment by Age by Funding Source in Grosse Pointe Farms
Out of a total of 2,431 students who are enrolled in schools in Grosse Pointe Farms, 654 (26.9%) attend a private institution, while the remaining 1,777 (73.1%) are enrolled in public schools. The age group of 3 to 4 year olds has the highest likelihood of being enrolled in private schools, with 340 (76.7% in the age bracket) enrolled. Conversely, the age group of 18 to 19 year olds has the lowest likelihood of being enrolled in a private school, with 109 (100.0% in the age bracket) attending a public institution.
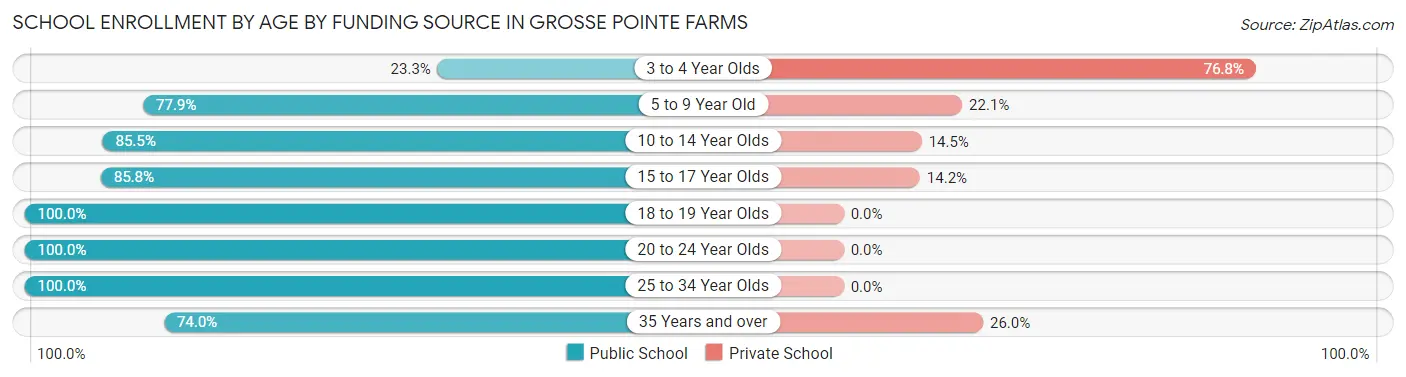
| Age Bracket | Public School | Private School |
| 3 to 4 Year Olds | 103 (23.3%) | 340 (76.7%) |
| 5 to 9 Year Old | 406 (77.9%) | 115 (22.1%) |
| 10 to 14 Year Olds | 459 (85.5%) | 78 (14.5%) |
| 15 to 17 Year Olds | 278 (85.8%) | 46 (14.2%) |
| 18 to 19 Year Olds | 109 (100.0%) | 0 (0.0%) |
| 20 to 24 Year Olds | 176 (100.0%) | 0 (0.0%) |
| 25 to 34 Year Olds | 36 (100.0%) | 0 (0.0%) |
| 35 Years and over | 211 (74.0%) | 74 (26.0%) |
| Total | 1,777 (73.1%) | 654 (26.9%) |
Educational Attainment by Field of Study in Grosse Pointe Farms
Business (1,026 | 15.9%), social sciences (960 | 14.9%), education (635 | 9.9%), visual & performing arts (522 | 8.1%), and communications (515 | 8.0%) are the most common fields of study among 6,444 individuals in Grosse Pointe Farms who have obtained a bachelor's degree or higher.
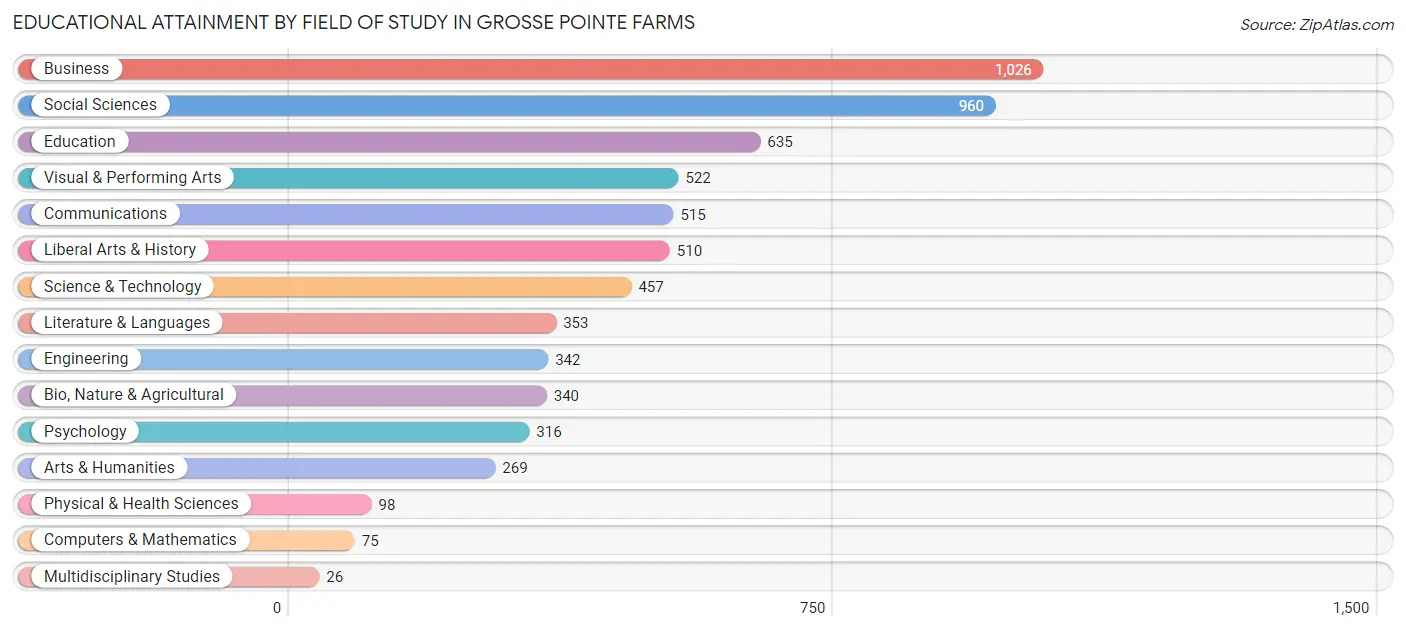
| Field of Study | # Graduates | % Graduates |
| Computers & Mathematics | 75 | 1.2% |
| Bio, Nature & Agricultural | 340 | 5.3% |
| Physical & Health Sciences | 98 | 1.5% |
| Psychology | 316 | 4.9% |
| Social Sciences | 960 | 14.9% |
| Engineering | 342 | 5.3% |
| Multidisciplinary Studies | 26 | 0.4% |
| Science & Technology | 457 | 7.1% |
| Business | 1,026 | 15.9% |
| Education | 635 | 9.9% |
| Literature & Languages | 353 | 5.5% |
| Liberal Arts & History | 510 | 7.9% |
| Visual & Performing Arts | 522 | 8.1% |
| Communications | 515 | 8.0% |
| Arts & Humanities | 269 | 4.2% |
| Total | 6,444 | 100.0% |
Transportation & Commute in Grosse Pointe Farms
Vehicle Availability by Sex in Grosse Pointe Farms
The most prevalent vehicle ownership categories in Grosse Pointe Farms are males with 2 vehicles (1,471, accounting for 53.9%) and females with 2 vehicles (1,160, making up 63.7%).
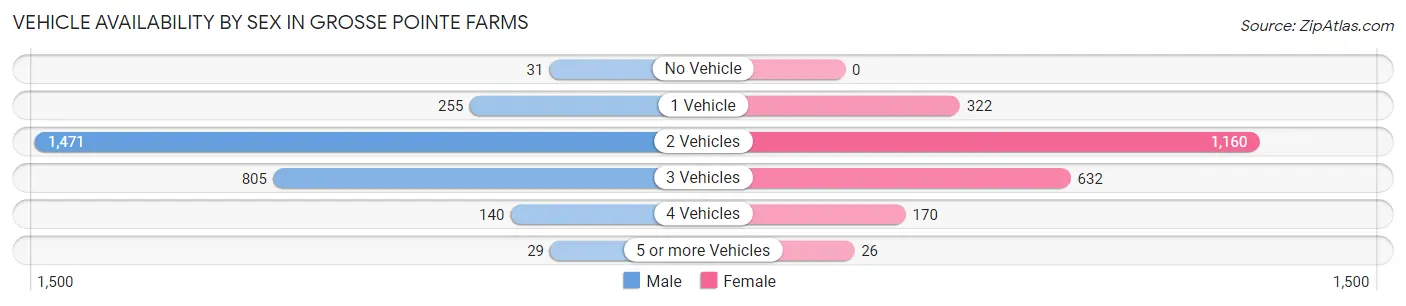
| Vehicles Available | Male | Female |
| No Vehicle | 31 (1.1%) | 0 (0.0%) |
| 1 Vehicle | 255 (9.3%) | 322 (13.9%) |
| 2 Vehicles | 1,471 (53.9%) | 1,160 (50.2%) |
| 3 Vehicles | 805 (29.5%) | 632 (27.4%) |
| 4 Vehicles | 140 (5.1%) | 170 (7.4%) |
| 5 or more Vehicles | 29 (1.1%) | 26 (1.1%) |
| Total | 2,731 (100.0%) | 2,310 (100.0%) |
Commute Time in Grosse Pointe Farms
The most frequently occuring commute durations in Grosse Pointe Farms are 20 to 24 minutes (835 commuters, 20.9%), 30 to 34 minutes (700 commuters, 17.5%), and 10 to 14 minutes (423 commuters, 10.6%).
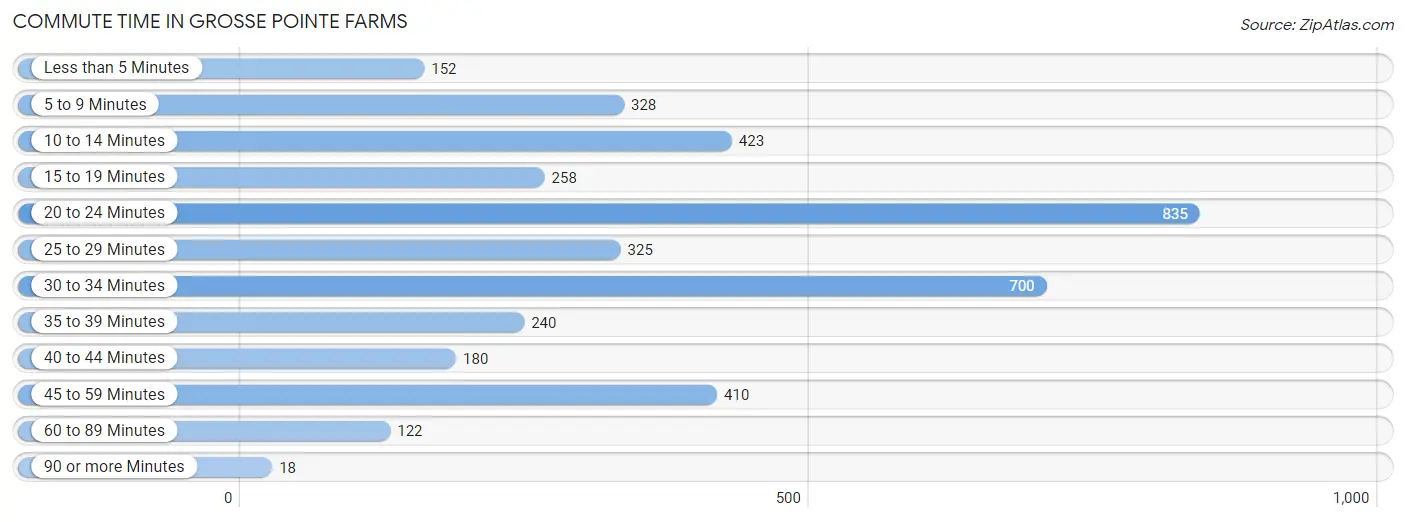
| Commute Time | # Commuters | % Commuters |
| Less than 5 Minutes | 152 | 3.8% |
| 5 to 9 Minutes | 328 | 8.2% |
| 10 to 14 Minutes | 423 | 10.6% |
| 15 to 19 Minutes | 258 | 6.5% |
| 20 to 24 Minutes | 835 | 20.9% |
| 25 to 29 Minutes | 325 | 8.1% |
| 30 to 34 Minutes | 700 | 17.5% |
| 35 to 39 Minutes | 240 | 6.0% |
| 40 to 44 Minutes | 180 | 4.5% |
| 45 to 59 Minutes | 410 | 10.3% |
| 60 to 89 Minutes | 122 | 3.1% |
| 90 or more Minutes | 18 | 0.4% |
Commute Time by Sex in Grosse Pointe Farms
The most common commute times in Grosse Pointe Farms are 20 to 24 minutes (506 commuters, 23.3%) for males and 30 to 34 minutes (380 commuters, 20.8%) for females.
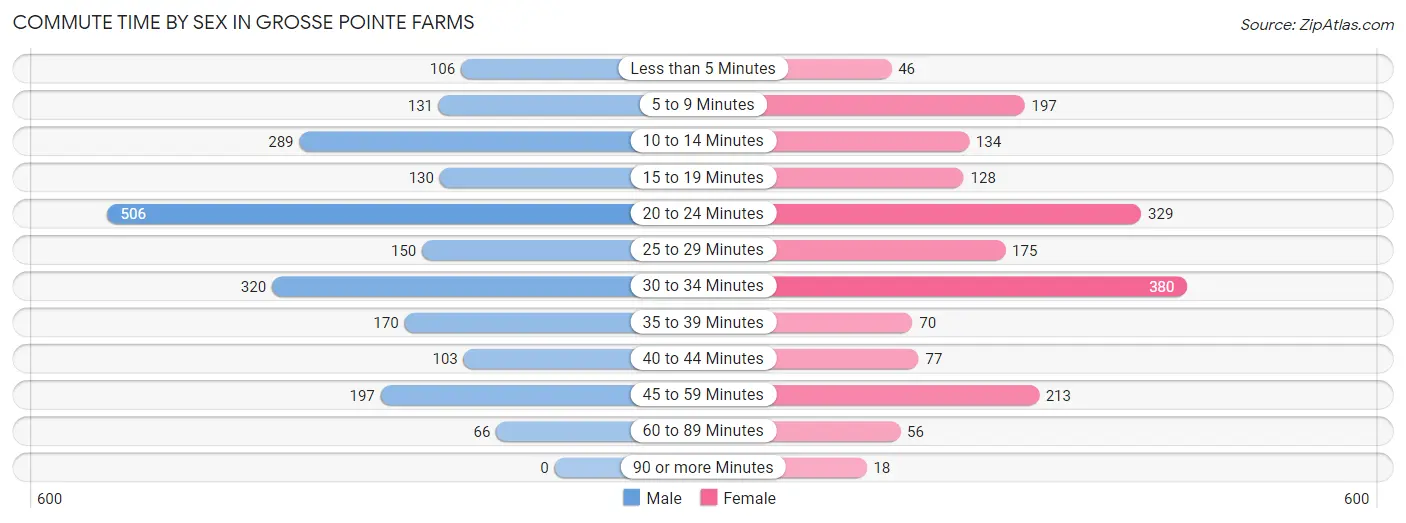
| Commute Time | Male | Female |
| Less than 5 Minutes | 106 (4.9%) | 46 (2.5%) |
| 5 to 9 Minutes | 131 (6.0%) | 197 (10.8%) |
| 10 to 14 Minutes | 289 (13.3%) | 134 (7.3%) |
| 15 to 19 Minutes | 130 (6.0%) | 128 (7.0%) |
| 20 to 24 Minutes | 506 (23.3%) | 329 (18.0%) |
| 25 to 29 Minutes | 150 (6.9%) | 175 (9.6%) |
| 30 to 34 Minutes | 320 (14.8%) | 380 (20.8%) |
| 35 to 39 Minutes | 170 (7.8%) | 70 (3.8%) |
| 40 to 44 Minutes | 103 (4.8%) | 77 (4.2%) |
| 45 to 59 Minutes | 197 (9.1%) | 213 (11.7%) |
| 60 to 89 Minutes | 66 (3.0%) | 56 (3.1%) |
| 90 or more Minutes | 0 (0.0%) | 18 (1.0%) |
Time of Departure to Work by Sex in Grosse Pointe Farms
The most frequent times of departure to work in Grosse Pointe Farms are 8:00 AM to 8:29 AM (450, 20.8%) for males and 8:30 AM to 8:59 AM (387, 21.2%) for females.
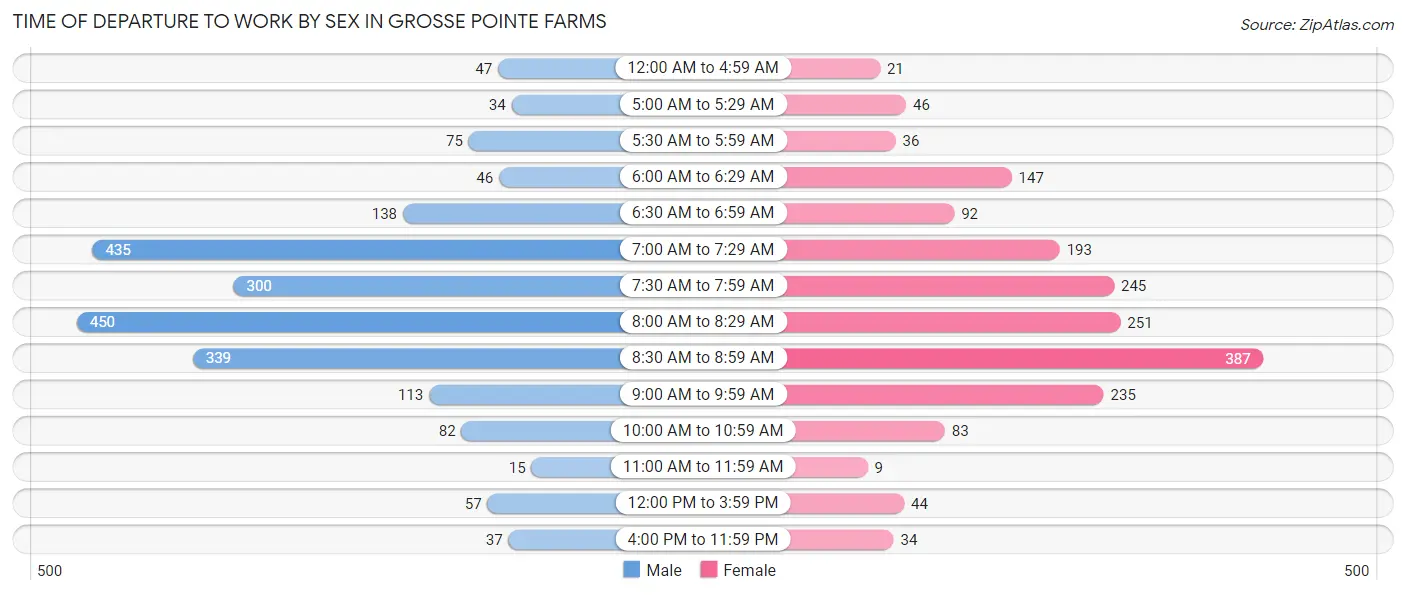
| Time of Departure | Male | Female |
| 12:00 AM to 4:59 AM | 47 (2.2%) | 21 (1.1%) |
| 5:00 AM to 5:29 AM | 34 (1.6%) | 46 (2.5%) |
| 5:30 AM to 5:59 AM | 75 (3.5%) | 36 (2.0%) |
| 6:00 AM to 6:29 AM | 46 (2.1%) | 147 (8.1%) |
| 6:30 AM to 6:59 AM | 138 (6.4%) | 92 (5.1%) |
| 7:00 AM to 7:29 AM | 435 (20.1%) | 193 (10.6%) |
| 7:30 AM to 7:59 AM | 300 (13.8%) | 245 (13.4%) |
| 8:00 AM to 8:29 AM | 450 (20.8%) | 251 (13.8%) |
| 8:30 AM to 8:59 AM | 339 (15.6%) | 387 (21.2%) |
| 9:00 AM to 9:59 AM | 113 (5.2%) | 235 (12.9%) |
| 10:00 AM to 10:59 AM | 82 (3.8%) | 83 (4.5%) |
| 11:00 AM to 11:59 AM | 15 (0.7%) | 9 (0.5%) |
| 12:00 PM to 3:59 PM | 57 (2.6%) | 44 (2.4%) |
| 4:00 PM to 11:59 PM | 37 (1.7%) | 34 (1.9%) |
| Total | 2,168 (100.0%) | 1,823 (100.0%) |
Housing Occupancy in Grosse Pointe Farms
Occupancy by Ownership in Grosse Pointe Farms
Of the total 4,186 dwellings in Grosse Pointe Farms, owner-occupied units account for 4,008 (95.8%), while renter-occupied units make up 178 (4.3%).
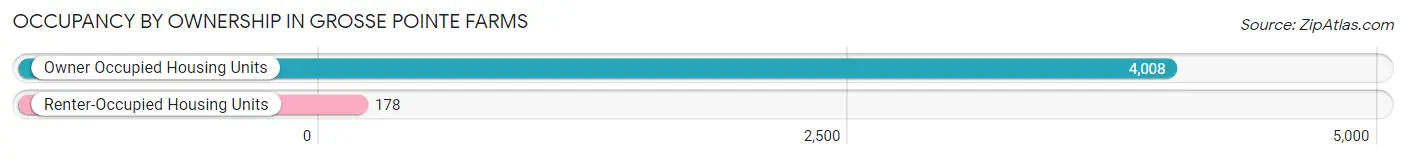
| Occupancy | # Housing Units | % Housing Units |
| Owner Occupied Housing Units | 4,008 | 95.8% |
| Renter-Occupied Housing Units | 178 | 4.3% |
| Total Occupied Housing Units | 4,186 | 100.0% |
Occupancy by Household Size in Grosse Pointe Farms
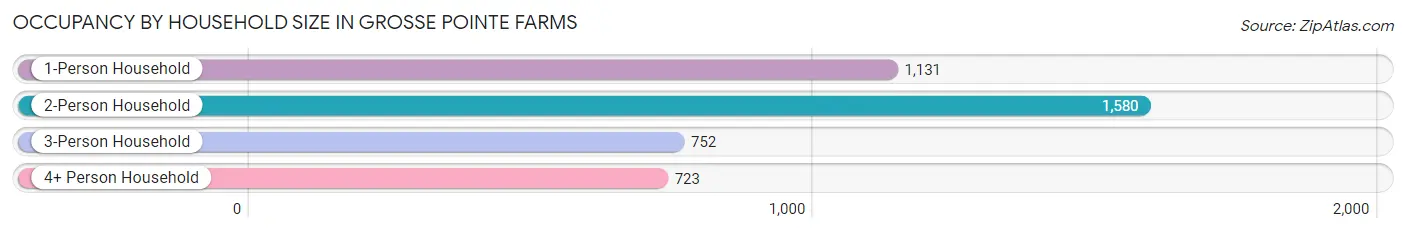
| Household Size | # Housing Units | % Housing Units |
| 1-Person Household | 1,131 | 27.0% |
| 2-Person Household | 1,580 | 37.7% |
| 3-Person Household | 752 | 18.0% |
| 4+ Person Household | 723 | 17.3% |
| Total Housing Units | 4,186 | 100.0% |
Occupancy by Ownership by Household Size in Grosse Pointe Farms
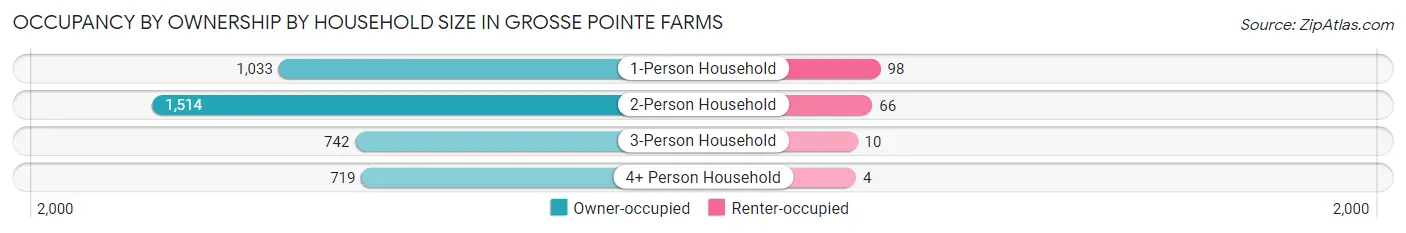
| Household Size | Owner-occupied | Renter-occupied |
| 1-Person Household | 1,033 (91.3%) | 98 (8.7%) |
| 2-Person Household | 1,514 (95.8%) | 66 (4.2%) |
| 3-Person Household | 742 (98.7%) | 10 (1.3%) |
| 4+ Person Household | 719 (99.5%) | 4 (0.5%) |
| Total Housing Units | 4,008 (95.8%) | 178 (4.3%) |
Occupancy by Educational Attainment in Grosse Pointe Farms
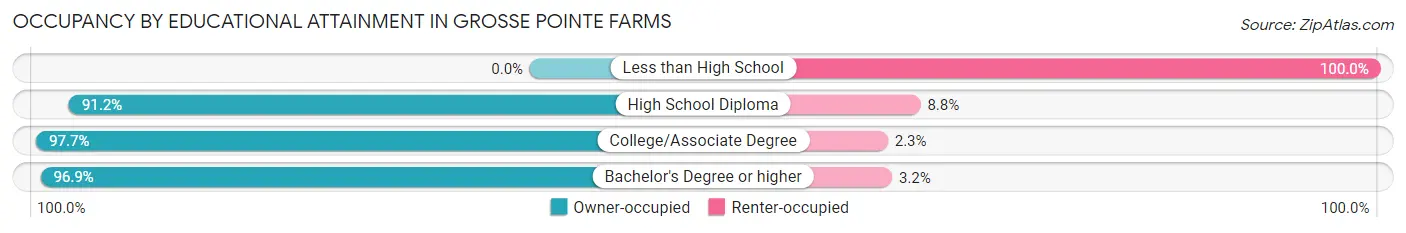
| Household Size | Owner-occupied | Renter-occupied |
| Less than High School | 0 (0.0%) | 42 (100.0%) |
| High School Diploma | 166 (91.2%) | 16 (8.8%) |
| College/Associate Degree | 553 (97.7%) | 13 (2.3%) |
| Bachelor's Degree or higher | 3,289 (96.9%) | 107 (3.2%) |
Occupancy by Age of Householder in Grosse Pointe Farms
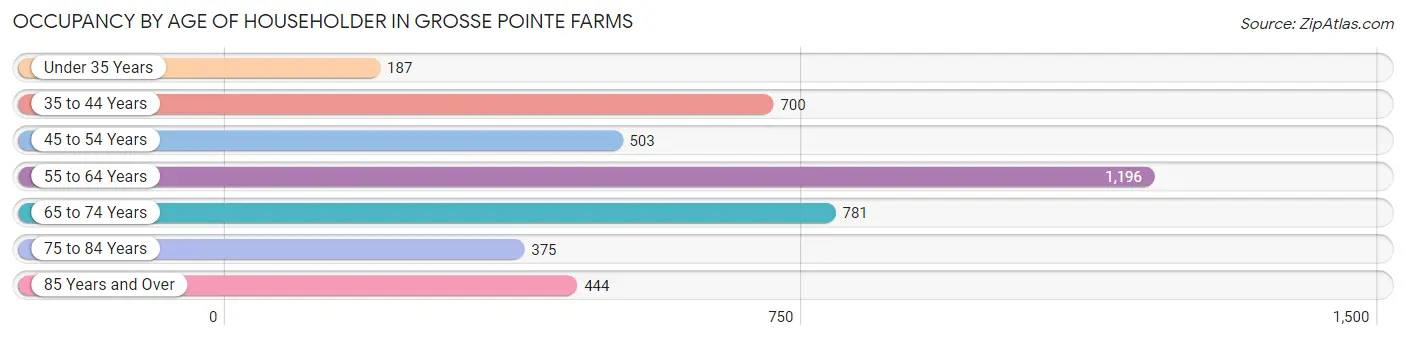
| Age Bracket | # Households | % Households |
| Under 35 Years | 187 | 4.5% |
| 35 to 44 Years | 700 | 16.7% |
| 45 to 54 Years | 503 | 12.0% |
| 55 to 64 Years | 1,196 | 28.6% |
| 65 to 74 Years | 781 | 18.7% |
| 75 to 84 Years | 375 | 9.0% |
| 85 Years and Over | 444 | 10.6% |
| Total | 4,186 | 100.0% |
Housing Finances in Grosse Pointe Farms
Median Income by Occupancy in Grosse Pointe Farms
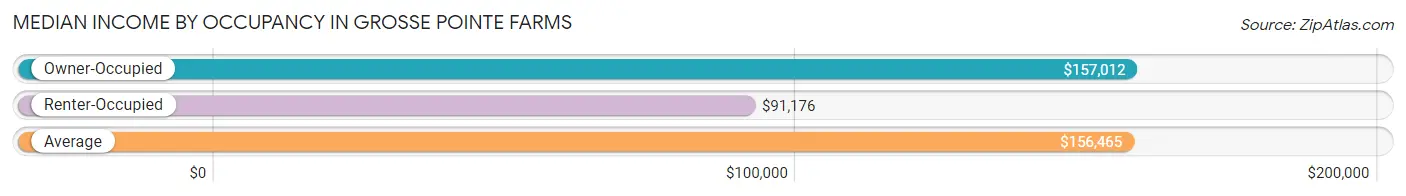
| Occupancy Type | # Households | Median Income |
| Owner-Occupied | 4,008 (95.8%) | $157,012 |
| Renter-Occupied | 178 (4.3%) | $91,176 |
| Average | 4,186 (100.0%) | $156,465 |
Occupancy by Householder Income Bracket in Grosse Pointe Farms
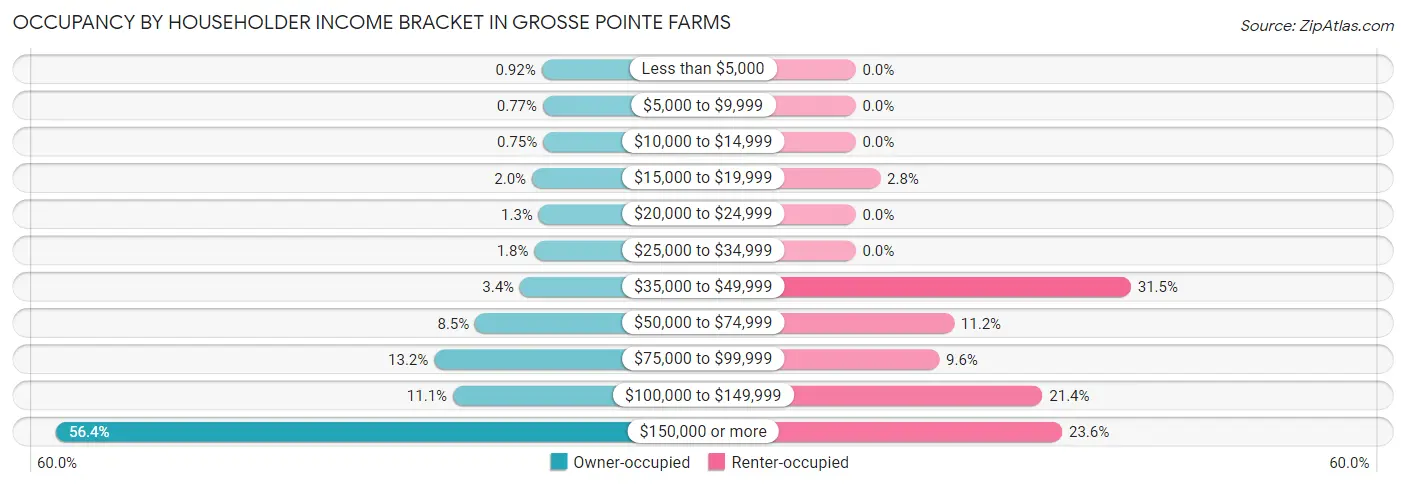
| Income Bracket | Owner-occupied | Renter-occupied |
| Less than $5,000 | 37 (0.9%) | 0 (0.0%) |
| $5,000 to $9,999 | 31 (0.8%) | 0 (0.0%) |
| $10,000 to $14,999 | 30 (0.7%) | 0 (0.0%) |
| $15,000 to $19,999 | 81 (2.0%) | 5 (2.8%) |
| $20,000 to $24,999 | 50 (1.3%) | 0 (0.0%) |
| $25,000 to $34,999 | 70 (1.8%) | 0 (0.0%) |
| $35,000 to $49,999 | 136 (3.4%) | 56 (31.5%) |
| $50,000 to $74,999 | 341 (8.5%) | 20 (11.2%) |
| $75,000 to $99,999 | 529 (13.2%) | 17 (9.6%) |
| $100,000 to $149,999 | 443 (11.1%) | 38 (21.3%) |
| $150,000 or more | 2,260 (56.4%) | 42 (23.6%) |
| Total | 4,008 (100.0%) | 178 (100.0%) |
Monthly Housing Cost Tiers in Grosse Pointe Farms
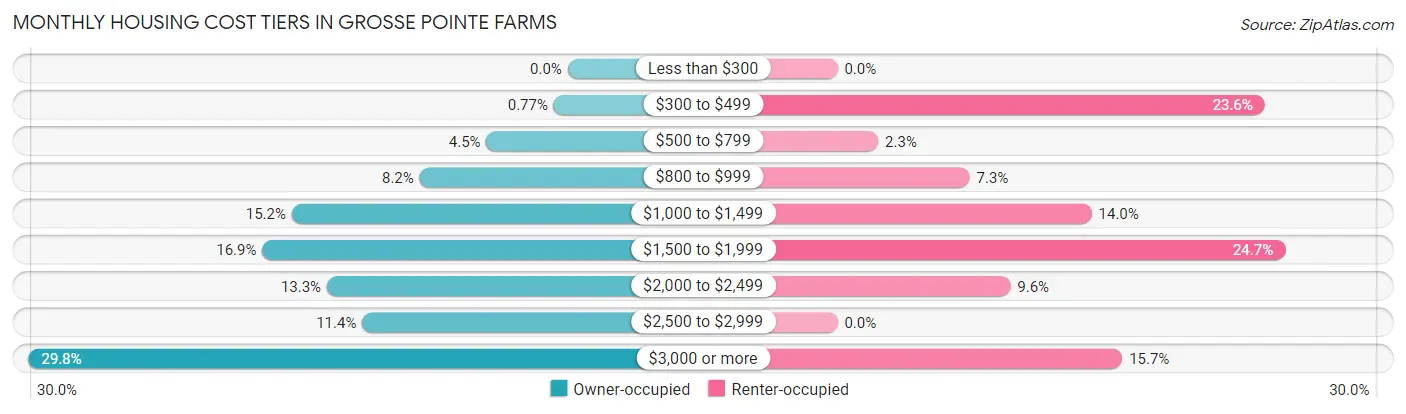
| Monthly Cost | Owner-occupied | Renter-occupied |
| Less than $300 | 0 (0.0%) | 0 (0.0%) |
| $300 to $499 | 31 (0.8%) | 42 (23.6%) |
| $500 to $799 | 180 (4.5%) | 4 (2.2%) |
| $800 to $999 | 328 (8.2%) | 13 (7.3%) |
| $1,000 to $1,499 | 611 (15.2%) | 25 (14.0%) |
| $1,500 to $1,999 | 676 (16.9%) | 44 (24.7%) |
| $2,000 to $2,499 | 533 (13.3%) | 17 (9.6%) |
| $2,500 to $2,999 | 455 (11.4%) | 0 (0.0%) |
| $3,000 or more | 1,194 (29.8%) | 28 (15.7%) |
| Total | 4,008 (100.0%) | 178 (100.0%) |
Physical Housing Characteristics in Grosse Pointe Farms
Housing Structures in Grosse Pointe Farms
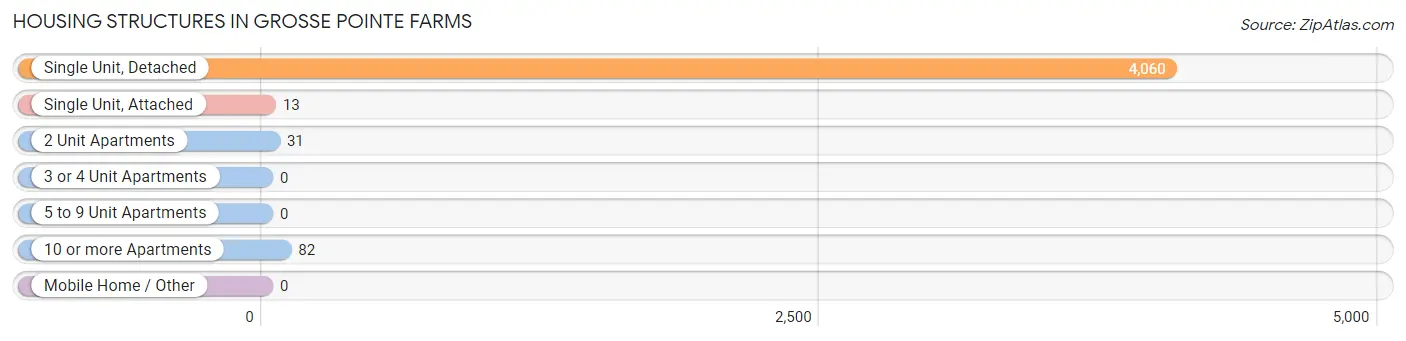
| Structure Type | # Housing Units | % Housing Units |
| Single Unit, Detached | 4,060 | 97.0% |
| Single Unit, Attached | 13 | 0.3% |
| 2 Unit Apartments | 31 | 0.7% |
| 3 or 4 Unit Apartments | 0 | 0.0% |
| 5 to 9 Unit Apartments | 0 | 0.0% |
| 10 or more Apartments | 82 | 2.0% |
| Mobile Home / Other | 0 | 0.0% |
| Total | 4,186 | 100.0% |
Housing Structures by Occupancy in Grosse Pointe Farms
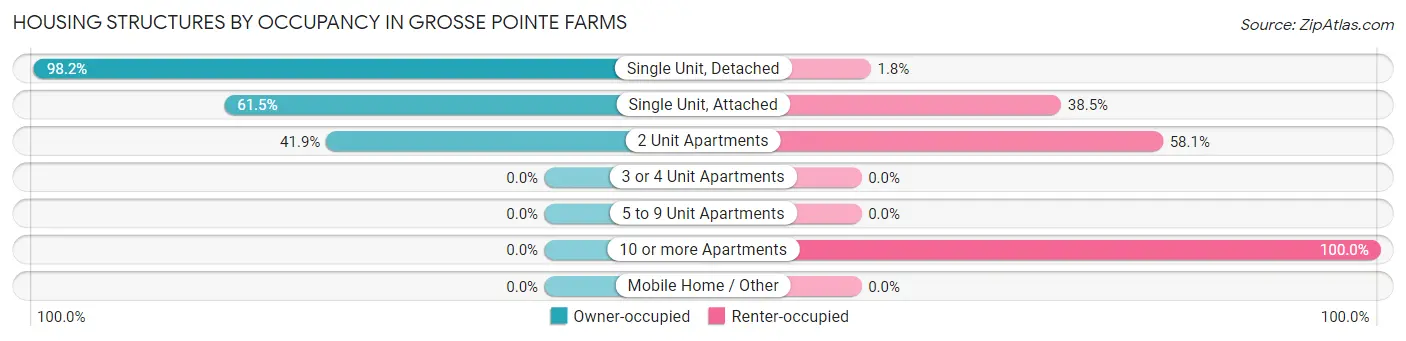
| Structure Type | Owner-occupied | Renter-occupied |
| Single Unit, Detached | 3,987 (98.2%) | 73 (1.8%) |
| Single Unit, Attached | 8 (61.5%) | 5 (38.5%) |
| 2 Unit Apartments | 13 (41.9%) | 18 (58.1%) |
| 3 or 4 Unit Apartments | 0 (0.0%) | 0 (0.0%) |
| 5 to 9 Unit Apartments | 0 (0.0%) | 0 (0.0%) |
| 10 or more Apartments | 0 (0.0%) | 82 (100.0%) |
| Mobile Home / Other | 0 (0.0%) | 0 (0.0%) |
| Total | 4,008 (95.8%) | 178 (4.3%) |
Housing Structures by Number of Rooms in Grosse Pointe Farms
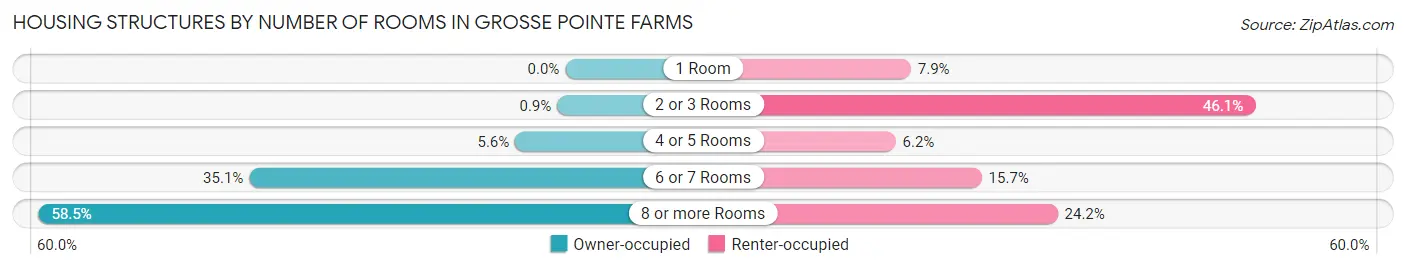
| Number of Rooms | Owner-occupied | Renter-occupied |
| 1 Room | 0 (0.0%) | 14 (7.9%) |
| 2 or 3 Rooms | 36 (0.9%) | 82 (46.1%) |
| 4 or 5 Rooms | 223 (5.6%) | 11 (6.2%) |
| 6 or 7 Rooms | 1,406 (35.1%) | 28 (15.7%) |
| 8 or more Rooms | 2,343 (58.5%) | 43 (24.2%) |
| Total | 4,008 (100.0%) | 178 (100.0%) |
Housing Structure by Heating Type in Grosse Pointe Farms
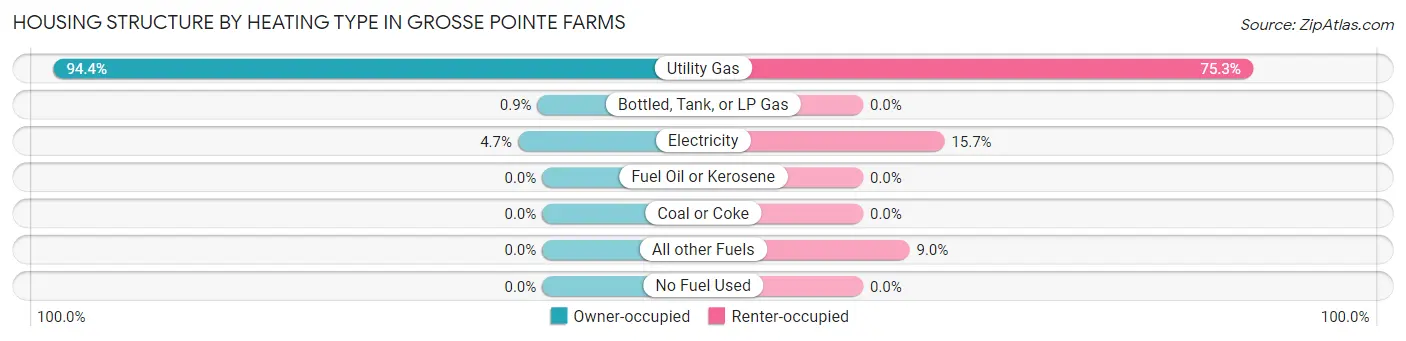
| Heating Type | Owner-occupied | Renter-occupied |
| Utility Gas | 3,784 (94.4%) | 134 (75.3%) |
| Bottled, Tank, or LP Gas | 36 (0.9%) | 0 (0.0%) |
| Electricity | 188 (4.7%) | 28 (15.7%) |
| Fuel Oil or Kerosene | 0 (0.0%) | 0 (0.0%) |
| Coal or Coke | 0 (0.0%) | 0 (0.0%) |
| All other Fuels | 0 (0.0%) | 16 (9.0%) |
| No Fuel Used | 0 (0.0%) | 0 (0.0%) |
| Total | 4,008 (100.0%) | 178 (100.0%) |
Household Vehicle Usage in Grosse Pointe Farms
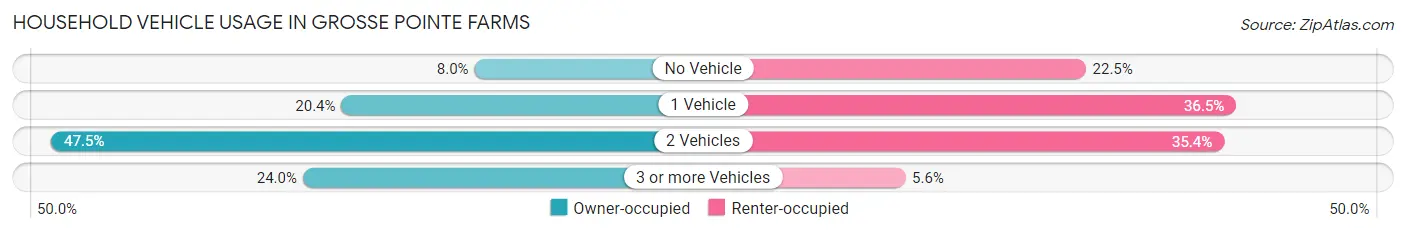
| Vehicles per Household | Owner-occupied | Renter-occupied |
| No Vehicle | 321 (8.0%) | 40 (22.5%) |
| 1 Vehicle | 819 (20.4%) | 65 (36.5%) |
| 2 Vehicles | 1,905 (47.5%) | 63 (35.4%) |
| 3 or more Vehicles | 963 (24.0%) | 10 (5.6%) |
| Total | 4,008 (100.0%) | 178 (100.0%) |
Real Estate & Mortgages in Grosse Pointe Farms
Real Estate and Mortgage Overview in Grosse Pointe Farms
| Characteristic | Without Mortgage | With Mortgage |
| Housing Units | 1,434 | 2,574 |
| Median Property Value | $393,800 | $416,700 |
| Median Household Income | $87,016 | $1,770 |
| Monthly Housing Costs | $1,238 | $1,049 |
| Real Estate Taxes | $6,771 | $4 |
Property Value by Mortgage Status in Grosse Pointe Farms
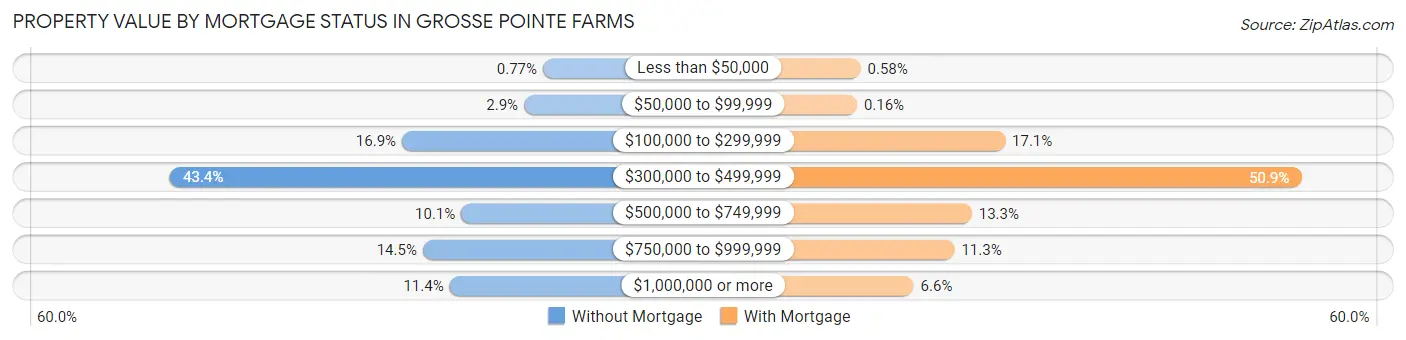
| Property Value | Without Mortgage | With Mortgage |
| Less than $50,000 | 11 (0.8%) | 15 (0.6%) |
| $50,000 to $99,999 | 42 (2.9%) | 4 (0.2%) |
| $100,000 to $299,999 | 242 (16.9%) | 440 (17.1%) |
| $300,000 to $499,999 | 622 (43.4%) | 1,311 (50.9%) |
| $500,000 to $749,999 | 145 (10.1%) | 342 (13.3%) |
| $750,000 to $999,999 | 208 (14.5%) | 291 (11.3%) |
| $1,000,000 or more | 164 (11.4%) | 171 (6.6%) |
| Total | 1,434 (100.0%) | 2,574 (100.0%) |
Household Income by Mortgage Status in Grosse Pointe Farms
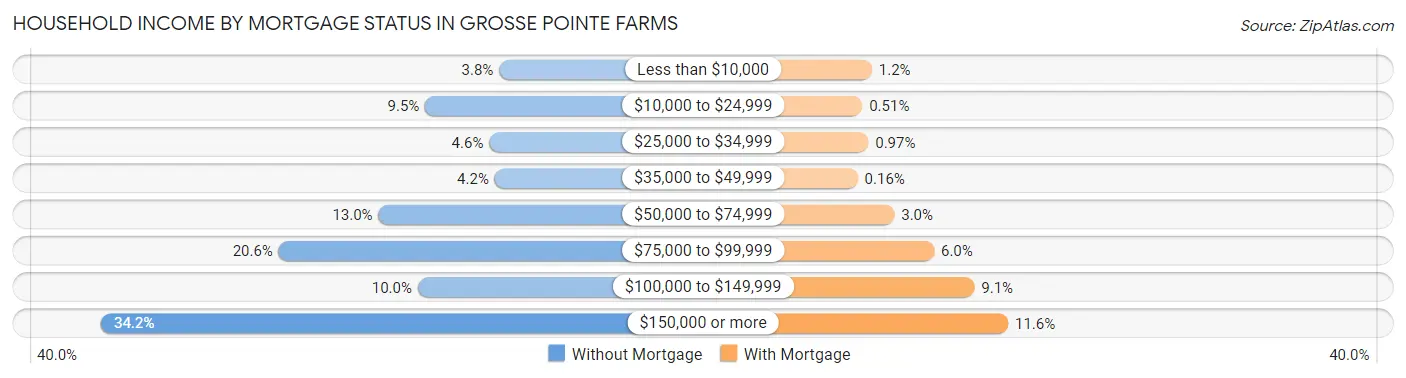
| Household Income | Without Mortgage | With Mortgage |
| Less than $10,000 | 55 (3.8%) | 32 (1.2%) |
| $10,000 to $24,999 | 136 (9.5%) | 13 (0.5%) |
| $25,000 to $34,999 | 66 (4.6%) | 25 (1.0%) |
| $35,000 to $49,999 | 60 (4.2%) | 4 (0.2%) |
| $50,000 to $74,999 | 187 (13.0%) | 76 (2.9%) |
| $75,000 to $99,999 | 296 (20.6%) | 154 (6.0%) |
| $100,000 to $149,999 | 144 (10.0%) | 233 (9.0%) |
| $150,000 or more | 490 (34.2%) | 299 (11.6%) |
| Total | 1,434 (100.0%) | 2,574 (100.0%) |
Property Value to Household Income Ratio in Grosse Pointe Farms
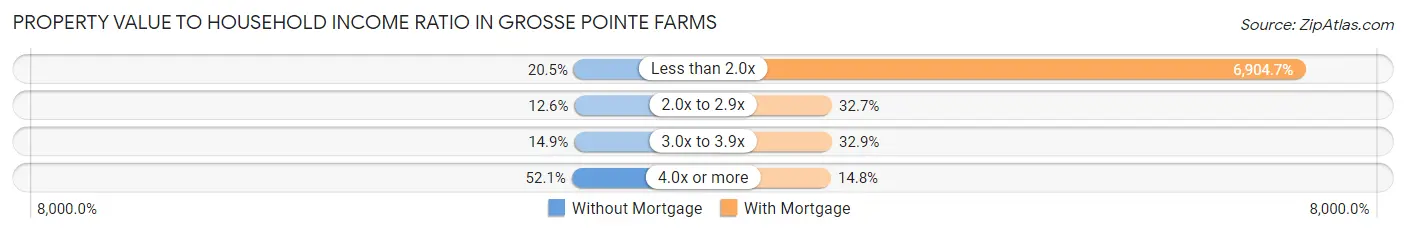
| Value-to-Income Ratio | Without Mortgage | With Mortgage |
| Less than 2.0x | 294 (20.5%) | 177,727 (6,904.7%) |
| 2.0x to 2.9x | 180 (12.6%) | 842 (32.7%) |
| 3.0x to 3.9x | 213 (14.8%) | 846 (32.9%) |
| 4.0x or more | 747 (52.1%) | 382 (14.8%) |
| Total | 1,434 (100.0%) | 2,574 (100.0%) |
Real Estate Taxes by Mortgage Status in Grosse Pointe Farms
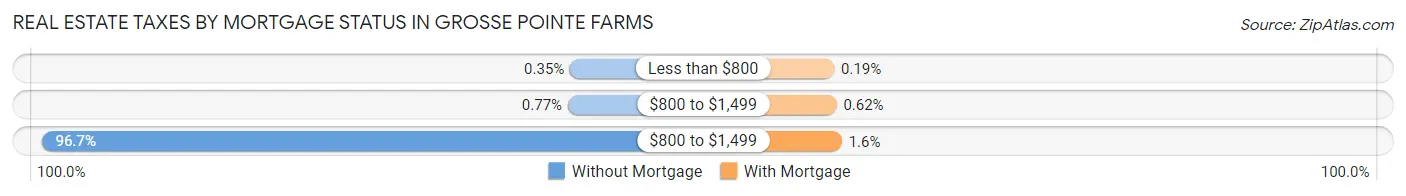
| Property Taxes | Without Mortgage | With Mortgage |
| Less than $800 | 5 (0.4%) | 5 (0.2%) |
| $800 to $1,499 | 11 (0.8%) | 16 (0.6%) |
| $800 to $1,499 | 1,387 (96.7%) | 41 (1.6%) |
| Total | 1,434 (100.0%) | 2,574 (100.0%) |
Health & Disability in Grosse Pointe Farms
Health Insurance Coverage by Age in Grosse Pointe Farms
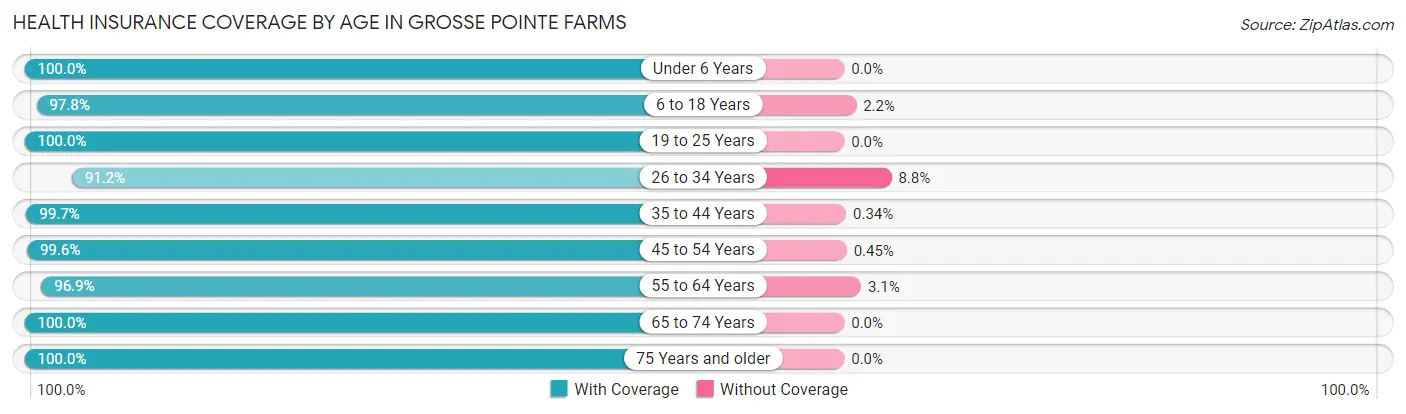
| Age Bracket | With Coverage | Without Coverage |
| Under 6 Years | 804 (100.0%) | 0 (0.0%) |
| 6 to 18 Years | 1,324 (97.8%) | 30 (2.2%) |
| 19 to 25 Years | 468 (100.0%) | 0 (0.0%) |
| 26 to 34 Years | 373 (91.2%) | 36 (8.8%) |
| 35 to 44 Years | 1,452 (99.7%) | 5 (0.3%) |
| 45 to 54 Years | 1,098 (99.6%) | 5 (0.4%) |
| 55 to 64 Years | 1,956 (96.9%) | 63 (3.1%) |
| 65 to 74 Years | 1,296 (100.0%) | 0 (0.0%) |
| 75 Years and older | 1,075 (100.0%) | 0 (0.0%) |
| Total | 9,846 (98.6%) | 139 (1.4%) |
Health Insurance Coverage by Citizenship Status in Grosse Pointe Farms
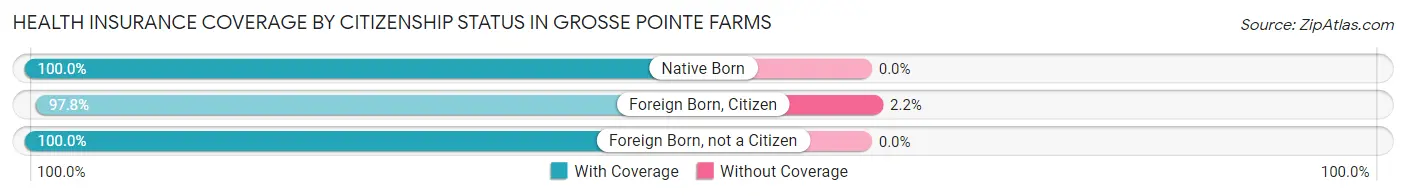
| Citizenship Status | With Coverage | Without Coverage |
| Native Born | 804 (100.0%) | 0 (0.0%) |
| Foreign Born, Citizen | 1,324 (97.8%) | 30 (2.2%) |
| Foreign Born, not a Citizen | 468 (100.0%) | 0 (0.0%) |
Health Insurance Coverage by Household Income in Grosse Pointe Farms
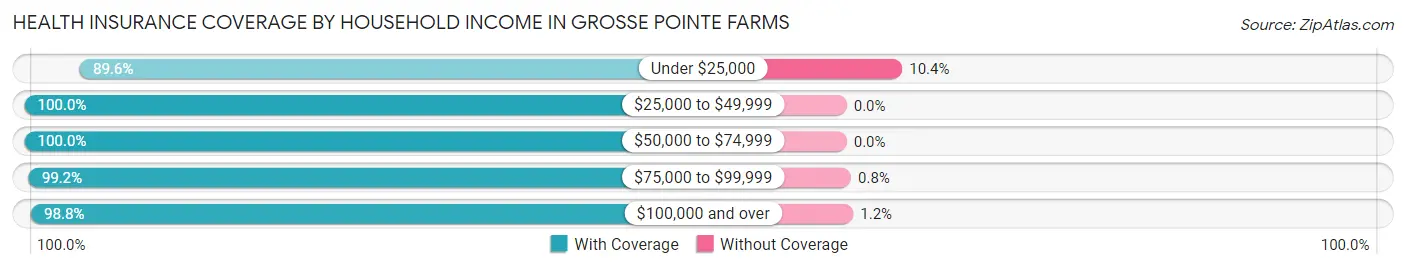
| Household Income | With Coverage | Without Coverage |
| Under $25,000 | 310 (89.6%) | 36 (10.4%) |
| $25,000 to $49,999 | 356 (100.0%) | 0 (0.0%) |
| $50,000 to $74,999 | 531 (100.0%) | 0 (0.0%) |
| $75,000 to $99,999 | 995 (99.2%) | 8 (0.8%) |
| $100,000 and over | 7,651 (98.8%) | 95 (1.2%) |
Public vs Private Health Insurance Coverage by Age in Grosse Pointe Farms
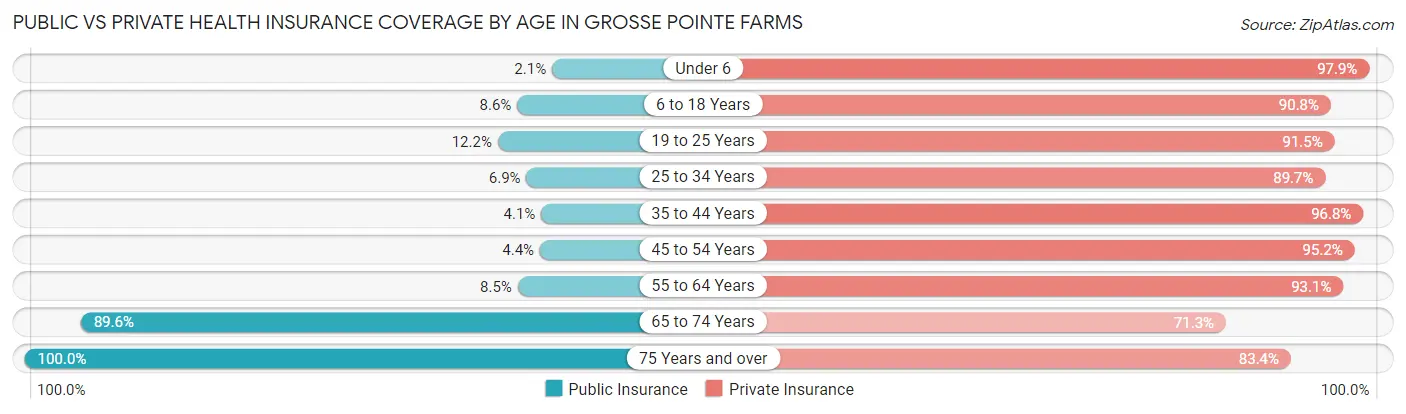
| Age Bracket | Public Insurance | Private Insurance |
| Under 6 | 17 (2.1%) | 787 (97.9%) |
| 6 to 18 Years | 116 (8.6%) | 1,229 (90.8%) |
| 19 to 25 Years | 57 (12.2%) | 428 (91.4%) |
| 25 to 34 Years | 28 (6.9%) | 367 (89.7%) |
| 35 to 44 Years | 60 (4.1%) | 1,410 (96.8%) |
| 45 to 54 Years | 48 (4.3%) | 1,050 (95.2%) |
| 55 to 64 Years | 171 (8.5%) | 1,879 (93.1%) |
| 65 to 74 Years | 1,161 (89.6%) | 924 (71.3%) |
| 75 Years and over | 1,075 (100.0%) | 896 (83.4%) |
| Total | 2,733 (27.4%) | 8,970 (89.8%) |
Disability Status by Sex by Age in Grosse Pointe Farms
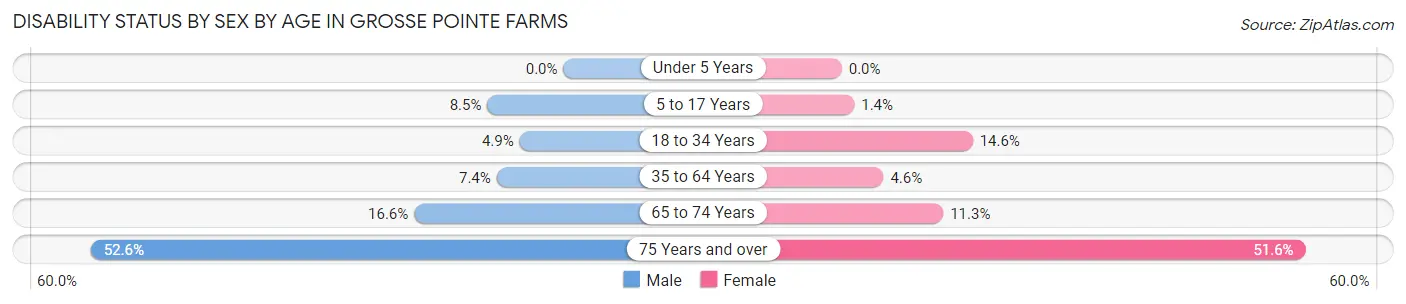
| Age Bracket | Male | Female |
| Under 5 Years | 0 (0.0%) | 0 (0.0%) |
| 5 to 17 Years | 56 (8.5%) | 10 (1.4%) |
| 18 to 34 Years | 28 (4.9%) | 57 (14.6%) |
| 35 to 64 Years | 164 (7.4%) | 110 (4.6%) |
| 65 to 74 Years | 108 (16.6%) | 73 (11.3%) |
| 75 Years and over | 210 (52.6%) | 349 (51.6%) |
Disability Class by Sex by Age in Grosse Pointe Farms
Disability Class: Hearing Difficulty
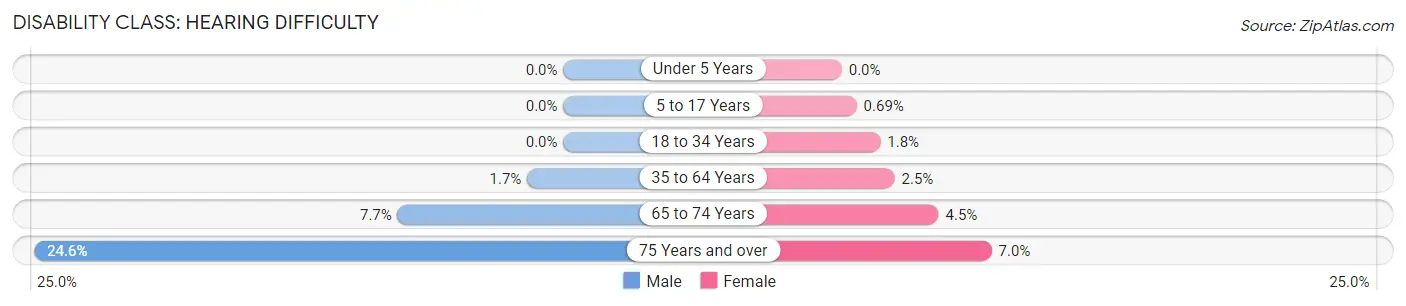
| Age Bracket | Male | Female |
| Under 5 Years | 0 (0.0%) | 0 (0.0%) |
| 5 to 17 Years | 0 (0.0%) | 5 (0.7%) |
| 18 to 34 Years | 0 (0.0%) | 7 (1.8%) |
| 35 to 64 Years | 37 (1.7%) | 58 (2.5%) |
| 65 to 74 Years | 50 (7.7%) | 29 (4.5%) |
| 75 Years and over | 98 (24.6%) | 47 (7.0%) |
Disability Class: Vision Difficulty
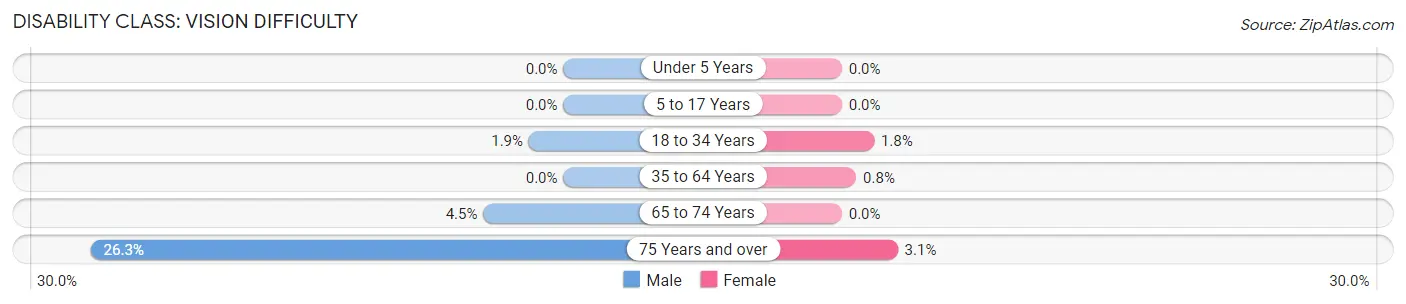
| Age Bracket | Male | Female |
| Under 5 Years | 0 (0.0%) | 0 (0.0%) |
| 5 to 17 Years | 0 (0.0%) | 0 (0.0%) |
| 18 to 34 Years | 11 (1.9%) | 7 (1.8%) |
| 35 to 64 Years | 0 (0.0%) | 19 (0.8%) |
| 65 to 74 Years | 29 (4.5%) | 0 (0.0%) |
| 75 Years and over | 105 (26.3%) | 21 (3.1%) |
Disability Class: Cognitive Difficulty
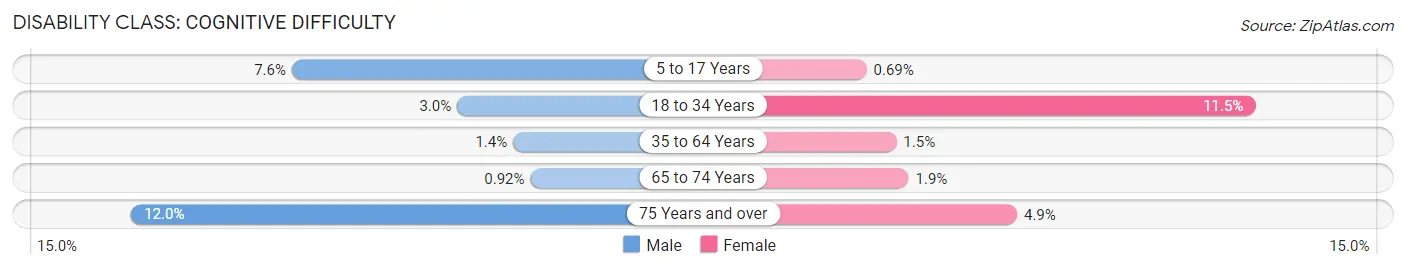
| Age Bracket | Male | Female |
| 5 to 17 Years | 50 (7.6%) | 5 (0.7%) |
| 18 to 34 Years | 17 (3.0%) | 45 (11.5%) |
| 35 to 64 Years | 31 (1.4%) | 36 (1.5%) |
| 65 to 74 Years | 6 (0.9%) | 12 (1.9%) |
| 75 Years and over | 48 (12.0%) | 33 (4.9%) |
Disability Class: Ambulatory Difficulty
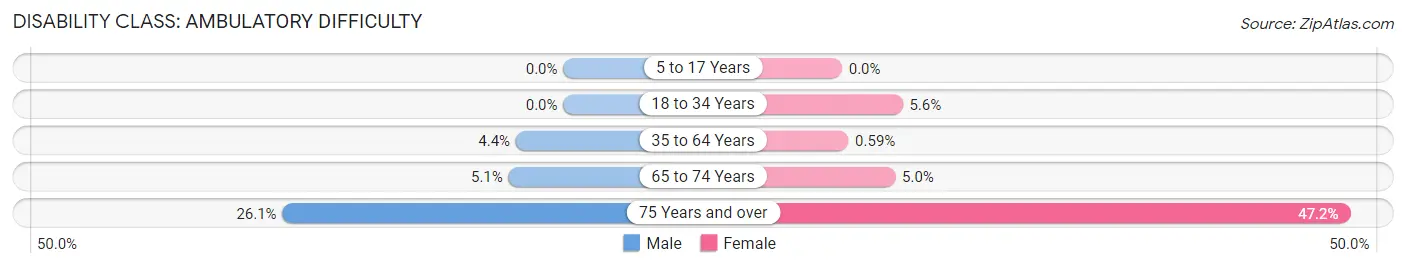
| Age Bracket | Male | Female |
| 5 to 17 Years | 0 (0.0%) | 0 (0.0%) |
| 18 to 34 Years | 0 (0.0%) | 22 (5.6%) |
| 35 to 64 Years | 97 (4.4%) | 14 (0.6%) |
| 65 to 74 Years | 33 (5.1%) | 32 (5.0%) |
| 75 Years and over | 104 (26.1%) | 319 (47.2%) |
Disability Class: Self-Care Difficulty
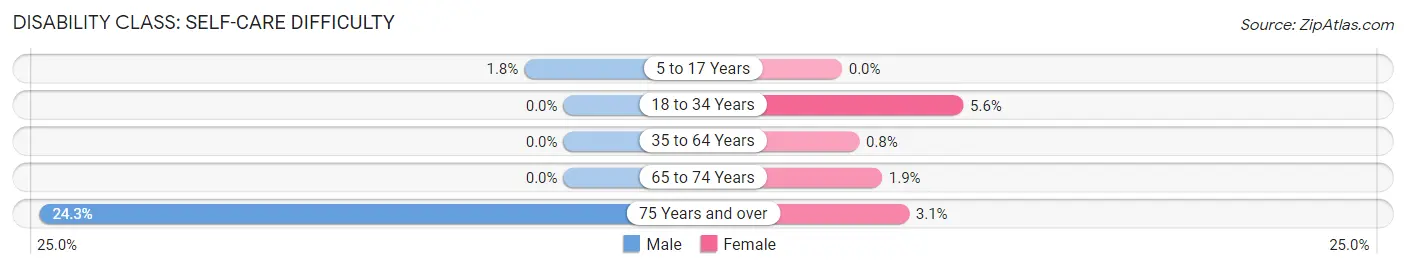
| Age Bracket | Male | Female |
| 5 to 17 Years | 12 (1.8%) | 0 (0.0%) |
| 18 to 34 Years | 0 (0.0%) | 22 (5.6%) |
| 35 to 64 Years | 0 (0.0%) | 19 (0.8%) |
| 65 to 74 Years | 0 (0.0%) | 12 (1.9%) |
| 75 Years and over | 97 (24.3%) | 21 (3.1%) |
Technology Access in Grosse Pointe Farms
Computing Device Access in Grosse Pointe Farms
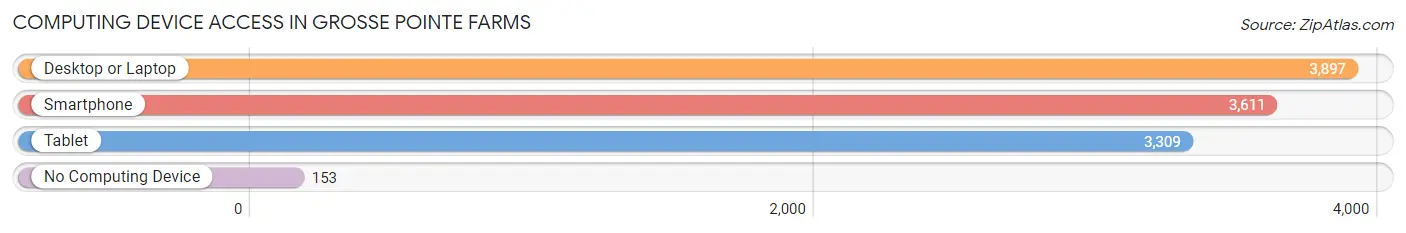
| Device Type | # Households | % Households |
| Desktop or Laptop | 3,897 | 93.1% |
| Smartphone | 3,611 | 86.3% |
| Tablet | 3,309 | 79.0% |
| No Computing Device | 153 | 3.7% |
| Total | 4,186 | 100.0% |
Internet Access in Grosse Pointe Farms
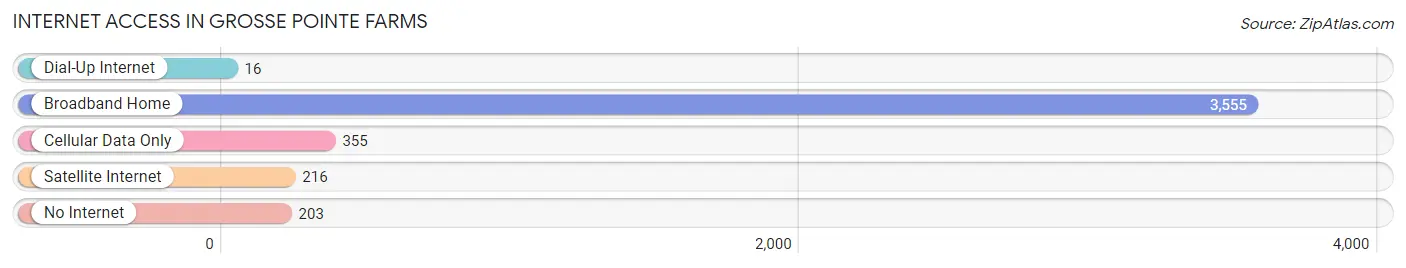
| Internet Type | # Households | % Households |
| Dial-Up Internet | 16 | 0.4% |
| Broadband Home | 3,555 | 84.9% |
| Cellular Data Only | 355 | 8.5% |
| Satellite Internet | 216 | 5.2% |
| No Internet | 203 | 4.9% |
| Total | 4,186 | 100.0% |
Grosse Pointe Farms Summary
Grosse Pointe Farms is a city located in Wayne County, Michigan. It is a suburb of Detroit and is part of the Metro Detroit area. The city is bordered by Grosse Pointe Woods to the north, Grosse Pointe Park to the east, Detroit to the south, and Lake St. Clair to the west. As of the 2010 census, the city had a population of 9,479.
History
Grosse Pointe Farms was first settled in the early 19th century by French-Canadian fur traders. The area was originally part of the larger Grosse Pointe Township, which was established in 1818. In 1893, the area was incorporated as a village and was later incorporated as a city in 1934.
The city was originally a farming community, but it quickly developed into a wealthy suburb of Detroit. The city was home to many prominent families, including the Ford family, who owned a large estate in the city.
Geography
Grosse Pointe Farms is located at 42°25'25" North, 82°51'45" West (42.423, -82.862). The city has a total area of 4.2 square miles, all of which is land.
The city is located on the western shore of Lake St. Clair, which is part of the Great Lakes system. The city is bordered by Grosse Pointe Woods to the north, Grosse Pointe Park to the east, Detroit to the south, and Lake St. Clair to the west.
Economy
Grosse Pointe Farms is a wealthy suburb of Detroit and is home to many affluent families. The city has a strong economy, with many residents employed in professional and managerial positions. The city is also home to several large businesses, including the Ford Motor Company, which has a large estate in the city.
Demographics
As of the 2010 census, there were 9,479 people, 3,845 households, and 2,845 families residing in the city. The population density was 2,269.2 people per square mile. The racial makeup of the city was 92.2% White, 4.2% African American, 0.3% Native American, 1.7% Asian, 0.1% Pacific Islander, 0.5% from other races, and 1.1% from two or more races. Hispanic or Latino of any race were 2.2% of the population.
The median income for a household in the city was $117,945, and the median income for a family was $139,945. The per capita income for the city was $64,945. About 2.2% of families and 3.2% of the population were below the poverty line, including 3.7% of those under age 18 and 2.2% of those age 65 or over.
Conclusion
Grosse Pointe Farms is a wealthy suburb of Detroit located on the western shore of Lake St. Clair. The city has a long history, dating back to the early 19th century when it was first settled by French-Canadian fur traders. The city has a strong economy, with many residents employed in professional and managerial positions. As of the 2010 census, the city had a population of 9,479, with a median household income of $117,945.
Common Questions
What is Per Capita Income in Grosse Pointe Farms?
Per Capita income in Grosse Pointe Farms is $89,962.
What is the Median Family Income in Grosse Pointe Farms?
Median Family Income in Grosse Pointe Farms is $179,504.
What is the Median Household income in Grosse Pointe Farms?
Median Household Income in Grosse Pointe Farms is $156,465.
What is Income or Wage Gap in Grosse Pointe Farms?
Income or Wage Gap in Grosse Pointe Farms is 43.9%.
Women in Grosse Pointe Farms earn 56.1 cents for every dollar earned by a man.
What is Inequality or Gini Index in Grosse Pointe Farms?
Inequality or Gini Index in Grosse Pointe Farms is 0.46.
What is the Total Population of Grosse Pointe Farms?
Total Population of Grosse Pointe Farms is 10,018.
What is the Total Male Population of Grosse Pointe Farms?
Total Male Population of Grosse Pointe Farms is 5,041.
What is the Total Female Population of Grosse Pointe Farms?
Total Female Population of Grosse Pointe Farms is 4,977.
What is the Ratio of Males per 100 Females in Grosse Pointe Farms?
There are 101.29 Males per 100 Females in Grosse Pointe Farms.
What is the Ratio of Females per 100 Males in Grosse Pointe Farms?
There are 98.73 Females per 100 Males in Grosse Pointe Farms.
What is the Median Population Age in Grosse Pointe Farms?
Median Population Age in Grosse Pointe Farms is 51.4 Years.
What is the Average Family Size in Grosse Pointe Farms
Average Family Size in Grosse Pointe Farms is 2.9 People.
What is the Average Household Size in Grosse Pointe Farms
Average Household Size in Grosse Pointe Farms is 2.4 People.
How Large is the Labor Force in Grosse Pointe Farms?
There are 5,285 People in the Labor Forcein in Grosse Pointe Farms.
What is the Percentage of People in the Labor Force in Grosse Pointe Farms?
65.0% of People are in the Labor Force in Grosse Pointe Farms.
What is the Unemployment Rate in Grosse Pointe Farms?
Unemployment Rate in Grosse Pointe Farms is 2.7%.